Embed Size (px)
Citation preview

1
Paris, April 27, 2016
First quarter 2016 results123
Total’s Board of Directors met on April 26, 2016, to review the Group’s first quarter accounts. Commenting on the results, Chairman and CEO Patrick Pouyanné said: “Despite a 37% fall in the Brent price to 34 $/b since the first quarter 2015, the Group’s adjusted net income was $1.6 billion. Operating cash flow before working capital changes was $3.7 billion, a decrease limited to 20% due to the resilience of our integrated model. The Upstream portfolio benefited from the lowest technical costs among the majors. In line with the objectives announced in February, the segment is growing strongly with a 4% production increase driven by the ramp-up of nine projects brought on stream in 2015 and the start-up of Laggan-Tormore and Vega Pleyade this quarter. The Downstream achieved a solid result in line with our annual objectives. Refining & Chemicals improved its results compared to 2015 despite the decrease in refining margins to 35 $/t, thanks to a record high utilization rate of 94% and favorable petrochemicals margins. All teams continue to pursue their cost reduction efforts. The organic investment of $4.6 billion during the first quarter is in line with the objective of limiting Capex to less than $19 billion in 2016. Operating costs are decreasing as planned with the objective of achieving $900 million in savings during the year. Finally, the Group completed this quarter the sale of $900 million of assets including the FUKA gas pipeline network in the North Sea and announced the sale of a 20% interest in Kharyaga in Russia. As a result, Total is maintaining the strength of its balance sheet with a gearing of 30% at the end of March.”
1 Definitions on page 2. 2 Group share. 3 The ex-dividend date will be September 27, 2016, and the payment date will be set for October 14, 2016.
1Q16 1Q15Changevs 1Q15
Adjusted net income1
- in billions of dollars (B$) 1.6 2.6 -37%
- in dollars per share 0.68 1.13 -40%
Operating cash flow
before working capital changes1 (B$)3.7 4.6 -20%
Net income2 of 1.6 B$ in 1Q16
Net-debt-to-equity ratio of 30.2% at March 31, 2016
Hydrocarbon production of 2,479 kboe/d in the first quarter 2016
1Q16 interim dividend of 0.61 €/share payable in October 20163
New
s Rel
ease
Com
mun
iqué
de
Pres
se
2, place Jean Millier Arche Nord Coupole/Regnault 92 400 Courbevoie France Mike SANGSTER
Nicolas FUMEX Patrick GUENKEL Romain RICHEMONT
Tel. : + 44 (0)207 719 7962 Fax : + 44 (0)207 719 7959 Robert HAMMOND (U.S.) Tel. : +1 713-483-5070 Fax : +1 713-483-5629 TOTAL S.A. Capital : 6 196 891 032,50 € 542 051 180 R.C.S. Nanterre total.com

2
Key figures456789
* 1Q15 data as republished in 2Q15 following the reclassification in the statement of income of certain taxes related to the participation in the ADCO concession. ** Average €-$ exchange rate: 1.1020 in the first quarter 2016. Highlights since the beginning of the first quarter 201610
Started production from Laggan-Tormore in the United Kingdom with production capacity of 90 thousand barrels of oil equivalent per day (kboe/d)
Started production from Vega Pleyade in Argentina with production capacity of 70 kboe/d
Signed long-term LNG sale and purchase agreements of around 1.5 million tons per year with Pertamina in Indonesia and ENN in China
Finalized the sale of the FUKA gas pipeline network in the North Sea and announced the sale of a 20% interest and transfer of operatorship of the Kharyaga field in Russia to Zarubezhneft
Acquired the main network of service stations in the Dominican Republic and finalized the sale of the marketing and distribution activities in Turkey
Announced a new proposed organizational structure to become the responsible energy major
4 Adjusted results are defined as income using replacement cost, adjusted for special items, excluding the impact of changes for fair value; adjustment items are on page 9. 5 Tax on adjusted net operating income / (adjusted net operating income - income from equity affiliates - dividends received from investments + tax on adjusted net operating income). 6 Including acquisitions and increases in non-current loans. 7 Net investments = gross investments - divestments - repayment of non-current loans - other operations with non-controlling interests. 8 Organic investments = net investments excluding acquisitions, asset sales, and other operations with non-controlling interests. 9 Operating cash flow before working capital changes, previously referred to as adjusted cash flow from operations, is defined as cash flow from operating activities before changes in working capital at replacement cost. The inventory valuation effect is explained on page 12. 10 Certain transactions referred to in the highlights are subject to approval by authorities or to other conditions as per the agreements.
In millions of dollars, except effective tax rate,earnings per share and number of shares
1Q16 4Q15 1Q151Q16
vs 1Q15
Sales 32,841 37,749 42,313 -22%
Adjusted operating income from business segments* 1,770 2,093 3,311 -47%
Adjusted net operating income from business segments 1,878 2,285 2,780 -32%
Upstream 498 748 1,359 -63%
Refining & Chemicals 1,128 1,007 1,100 +3%
Marketing & Services 252 530 321 -21%
Contribution of equity affiliates to adjusted net income 499 610 634 -21%
Group effective tax rate5* 22.9% 20.0% 38.5%
Adjusted net income 1,636 2,075 2,602 -37%
Adjusted fully-diluted earnings per share (dollars) 0.68 0.88 1.13 -40%
Adjusted fully-diluted earnings per share (euros)** 0.62 0.80 1.00 -38%
Fully-diluted weighted-average shares (millions) 2,350 2,329 2,285 +3%
Net income (Group share) 1,606 (1,626) 2,663 -40%
Investments6 4,908 6,594 8,809 -44%
Divestments 985 2,297 2,984 -67%
Net investments7 3,923 4,289 5,825 -33%
Organic investments8 4,615 6,365 6,069 -24%
Operating cash flow
before working capital changes9 3,708 4,365 4,635 -20%
Cash flow from operations 1,881 4,838 4,387 -57%

3
Analysis of business segments Upstream
> Environment – liquids and gas price realizations*
* Consolidated subsidiaries, excluding fixed margins.
> Production
Hydrocarbon production was 2,479 thousand barrels of oil equivalent per day (kboe/d) in the first quarter 2016, an increase of 4% compared to the first quarter 2015, due to the following: +4% due to new project start ups and ramp ups, notably Termokarstovoye, Laggan-Tormore, Surmont,
Lianzi, Gladstone LNG and Moho Phase 1b; -3% due to shutdowns in Yemen and the security situation in Nigeria; and +3% due to the price effect, a lower level of maintenance and good field performance, partially offset by
natural decline. Compared to the fourth quarter 2015, production increased by more than 5%.
> Results
* 1Q15 data as republished in 2Q15 following the reclassification in the statement of income of certain taxes related to the participation in the ADCO concession. Detail of adjustment items shown in the business segment information annex to financial statements. ** Tax on adjusted net operating income / (adjusted net operating income - income from equity affiliates - dividends received from investments + tax on adjusted net operating income).
1Q16 4Q15 1Q151Q16
vs 1Q15
Brent ($/b) 33.9 43.8 53.9 -37%
Average liquids price ($/b) 31.0 38.1 49.5 -37%
Average gas price ($/Mbtu) 3.46 4.45 5.38 -36%
Average hydrocarbon price ($/boe) 26.4 33.1 41.8 -37%
Hydrocarbon production 1Q16 4Q15 1Q151Q16
vs 1Q15
Combined production (kboe/d) 2,479 2,352 2,395 +4%
Liquids (kb/d) 1,286 1,251 1,240 +4%
Gas (Mcf/d) 6,441 5,993 6,312 +2%
In millions of dollars, except effective tax rate 1Q16 4Q15 1Q151Q16
vs 1Q15
Adjusted operating income* 142 405 1,531 -91%
Effective tax rate** -7.0% 55.1% 48.6%
Adjusted net operating income* 498 748 1,359 -63%
including income from equity affiliates 269 415 503 -47%
Investments 4,237 5,293 8,151 -48%
Divestments 915 1,402 1,162 -21%
Organic investments 4,146 5,108 5,511 -25%
Operating cash flow before working capital changes
1,831 2,514 2,919 -37%
Cash flow from operations 2,113 2,624 3,525 -40%
4
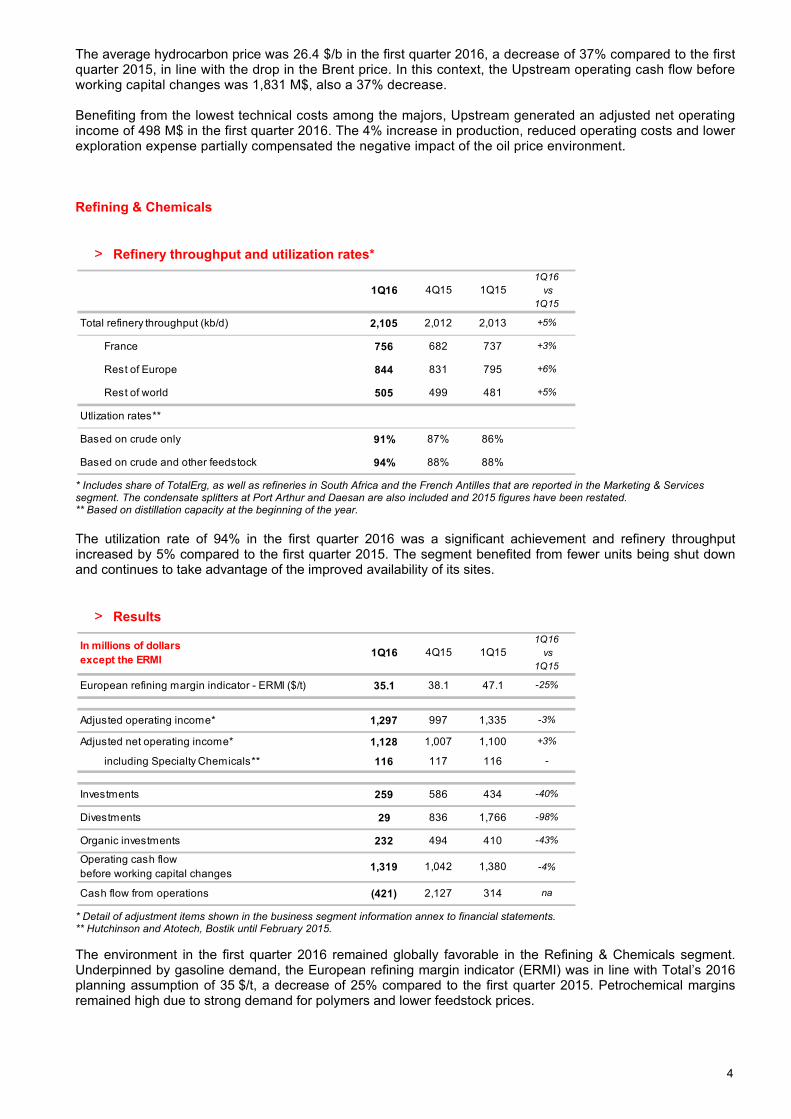
The average hydrocarbon price was 26.4 $/b in the first quarter 2016, a decrease of 37% compared to the first quarter 2015, in line with the drop in the Brent price. In this context, the Upstream operating cash flow before working capital changes was 1,831 M$, also a 37% decrease. Benefiting from the lowest technical costs among the majors, Upstream generated an adjusted net operating income of 498 M$ in the first quarter 2016. The 4% increase in production, reduced operating costs and lower exploration expense partially compensated the negative impact of the oil price environment. Refining & Chemicals
> Refinery throughput and utilization rates*
* Includes share of TotalErg, as well as refineries in South Africa and the French Antilles that are reported in the Marketing & Services segment. The condensate splitters at Port Arthur and Daesan are also included and 2015 figures have been restated. ** Based on distillation capacity at the beginning of the year. The utilization rate of 94% in the first quarter 2016 was a significant achievement and refinery throughput increased by 5% compared to the first quarter 2015. The segment benefited from fewer units being shut down and continues to take advantage of the improved availability of its sites.
> Results
* Detail of adjustment items shown in the business segment information annex to financial statements. ** Hutchinson and Atotech, Bostik until February 2015. The environment in the first quarter 2016 remained globally favorable in the Refining & Chemicals segment. Underpinned by gasoline demand, the European refining margin indicator (ERMI) was in line with Total’s 2016 planning assumption of 35 $/t, a decrease of 25% compared to the first quarter 2015. Petrochemical margins remained high due to strong demand for polymers and lower feedstock prices.
1Q16 4Q15 1Q151Q16
vs 1Q15
Total refinery throughput (kb/d) 2,105 2,012 2,013 +5%
France 756 682 737 +3%
Rest of Europe 844 831 795 +6%
Rest of world 505 499 481 +5%
Utlization rates**
Based on crude only 91% 87% 86%
Based on crude and other feedstock 94% 88% 88%
In millions of dollarsexcept the ERMI
1Q16 4Q15 1Q151Q16
vs 1Q15
European refining margin indicator - ERMI ($/t) 35.1 38.1 47.1 -25%
Adjusted operating income* 1,297 997 1,335 -3%
Adjusted net operating income* 1,128 1,007 1,100 +3%
including Specialty Chemicals** 116 117 116 -
Investments 259 586 434 -40%
Divestments 29 836 1,766 -98%
Organic investments 232 494 410 -43%
Operating cash flow before working capital changes
1,319 1,042 1,380 -4%
Cash flow from operations (421) 2,127 314 na

5
Despite the decline in refining margins, adjusted net operating income from the Refining & Chemicals segment was 1,128 M$ in the first quarter 2016 due in particular to higher throughput and excellent operational performance. Marketing & Services
> Petroleum product sales
* Excludes trading and bulk refining sales, includes share of TotalErg. ** 1Q15 volumes restated. Petroleum product sales decreased by 4% in the first quarter 2016 compared to the first quarter 2015, mainly due to the sale of Totalgaz and the French Antilles refinery, which represented 2% of product sales in the second quarter 2015, as well as lower heating fuel sales in Europe.
> Results
* Detail of adjustment items shown in the business segment information annex to financial statements. Adjusted net operating income from the Marketing & Services segment was 252 M$, impacted by the items mentioned above, with portfolio changes accounting for -40 M$.
Sales in kb/d* 1Q16 4Q15 1Q15**1Q16
vs 1Q15
Total Marketing & Services sales 1,757 1,797 1,824 -4%
Europe 1,062 1,065 1,106 -4%
Rest of world 695 732 718 -3%
In millions of dollars 1Q16 4Q15 1Q151Q16
vs 1Q15
Sales 15,433 18,326 19,620 -21%
Adjusted operating income* 331 691 445 -26%
Adjusted net operating income* 252 530 321 -21%
including New Energies (37) 277 (42) na
Investments 390 689 215 +81%
Divestments 37 56 52 -29%
Organic investments 220 736 143 +54%
Operating cash flow before working capital changes
362 598 418 -13%
Cash flow from operations 240 289 644 -63%

6
Group results
> Net operating income from business segments
Adjusted net operating income from the business segments was 1,878 M$ in the first quarter 2016, a decrease of 32% compared to the first quarter 2015, mainly due to unfavorable economic conditions in the Upstream. Adjusted net operating income in the Downstream was 1,380 M$, stable compared to the first quarter 2015 due to good operational performance, which offset lower refining margins and the impact of divestments in the Marketing & Services segment. The effective tax rate11 for the business segments was 24.3% in the first quarter 2016 compared to 37.3% in the first quarter 2015, mainly due to the lower tax rate in the Upstream, related to the lower oil price.
> Net income (Group share)
Adjusted net income was 1,636 M$ in the first quarter 2016 compared to 2,602 M$ in the first quarter 2015, a decrease of 37%. Adjusted net income excludes the after-tax inventory effect, special items and the impact of changes in fair value12. Adjustment items13 had a negative impact on net income (Group share) of 30 M$ in the first quarter 2016. This includes a negative 183 M$ inventory effect and a positive 150 M$ mainly relating to the gain on the sale of the FUKA gas pipeline network in the North Sea. The number of fully-diluted shares was 2,351 million on March 31, 2016, compared to 2,286 million on March 31, 2015.
Divestments – acquisitions
Asset sales were 885 M$ in the first quarter 2016, essentially comprised of the sale of the FUKA gas pipeline network in the North Sea. Acquisitions were 193 M$, mainly comprised of the acquisition of a service station network in the Dominican Republic.
Cash flow
In the first quarter 2016, the Group’s net cash flow14 was negative 215 M$ compared to negative 1,190 M$ in the first quarter 2015, despite the drop in the Brent price from 54 $/b to 34 $/b. Operating cash flow before working capital changes was 3,708 M$, a decrease of 20% compared to the first quarter 2015. Net investments were 3,923 M$, a decrease of 33% compared to the first quarter 2015.
Return on equity
Return on equity from April 1, 2015 to March 31, 2016 was 10.2%15.
11 Tax on adjusted net operating income / (adjusted net operating income - income from equity affiliates - dividends received from investments + tax on adjusted net operating income). 12 Details shown on page 12. 13 Details shown on page 9 and in the annex to the accounts. 14 Net cash flow = operating cash flow before working capital changes - net investments (including other transactions with non-controlling interests). 15 Details shown on page 11.

7
Summary and outlook The results of the first quarter 2016 encourage Total to pursue its strategy to maximize the generation of cash flow by taking full advantage of its asset portfolio and market opportunities. With its operational excellence and integrated model, the Group is implementing an ambitious program to lower costs and investments and to start up projects that deliver production growth. In the Upstream, production in the second quarter will continue to benefit from the recent start ups but will be impacted by normal levels of seasonal maintenance. Production is expected to increase by 4% in 2016, with the start-up of Angola LNG and Incahuasi expected by mid-year and Kashagan by year-end. Refining and petrochemical margins remained strong at the beginning of the second quarter and Downstream is on track to achieve its objective of generating around 7 B$ of cash flow in 2016. Partial maintenance is planned at Antwerp and Lindsey as part of their modernization projects, as well as on the coker at Port Arthur. Total is continuing its efforts to reduce its cash breakeven, and is targeting a level of organic investments of less than 19 B$ in 2016.
To listen to CFO Patrick de La Chevardière’s conference call with financial analysts today at 14:00 (London time) please log on to total.com or call +44 (0)203 427 1913 in Europe or +1 646 254 3365 in the United States (code: 1642494). For a replay, please consult the website or call +44 (0)203 427 0598 in Europe or +1 347 366 9565 in the United States (code: 1642494).

8
Operating information by segment Upstream*
* The regional reporting has been changed to reflect the Company’s internal organization. Historical data is available at total.com.
** Sales, Group share, excluding trading; 2015 data restated to reflect volume estimates for Bontang LNG in Indonesia based on the 2015 SEC coefficient.
Combined liquids and gasproduction by region (kboe/d)
1Q16 4Q15 1Q151Q16
vs 1Q15
Europe and Central Asia 788 681 653 +21%
Africa 630 638 647 -3%
Middle East and North Africa 531 503 580 -8%
Americas 258 255 254 +2%
Asia Pacific 271 275 261 +4%
Total production 2,479 2,352 2,395 +4%
including equity affiliates 620 544 573 +8%
Liquids production by region (kb/d) 1Q16 4Q15 1Q151Q16
vs 1Q15
Europe and Central Asia 251 227 203 +23%
Africa 518 526 528 -2%
Middle East and North Africa 380 361 380 -
Americas 104 100 91 +14%
Asia Pacific 33 37 37 -9%
Total production 1,286 1,251 1,240 +4%
including equity affiliates 240 220 207 +16%
Gas production by region (Mcf/d) 1Q16 4Q15 1Q151Q16
vs 1Q15
Europe and Central Asia 2,814 2,435 2,424 +16%
Africa 564 545 589 -4%
Middle East and North Africa 837 780 1,097 -24%
Americas 860 869 904 -5%
Asia Pacific 1,366 1,364 1,298 +5%
Total production 6,441 5,993 6,312 +2%
including equity affiliates 2,039 1,739 1,963 +4%
Liquefied natural gas 1Q16 4Q15 1Q151Q16
vs 1Q15
LNG sales** (Mt) 2.64 2.48 2.82 -6%

9
Downstream (Refining & Chemicals and Marketing & Services)
* Includes share of TotalErg.
** 1Q15 volumes restated.
Adjustment items
Adjustments to operating income
Adjustment to net income (Group share)
Petroleum product sales by region (kb/d)* 1Q16 4Q15 1Q15**1Q16
vs 1Q15
Europe 2,288 2,298 2,059 +11%
Africa 501 547 670 -25%
Americas 531 489 581 -9%
Rest of world 771 620 657 +17%
Total consolidated sales 4,091 3,954 3,967 +3%
Including bulk sales 699 688 628 +11%
Including trading 1,635 1,469 1,515 +8%
In millions of dollars 1Q16 4Q15 1Q15
Special items affecting operating income (464) (5,677) (1,377)
Restructuring charges (11) (48) -
Impairments - (4,933) (1,046)
Other (453) (696) (331)
Pre-tax inventory effect: FIFO vs. replacement cost (282) (464) 228
Effect of changes in fair value 3 - 4
Total adjustments affecting operating income (743) (6,141) (1,145)
In millions of dollars 1Q16 4Q15 1Q15
Special items affecting net income (Group share) 150 (3,386) (95)
Gain (loss) on asset sales 358 579 1,002
Restructuring charges (2) (29) (31)
Impairments - (3,443) (1,109)
Other (206) (493) 43
After-tax inventory effect: FIFO vs. replacement cost (183) (315) 154
Effect of changes in fair value 3 - 2
Total adjustments affecting net income (30) (3,701) 61

10
2016 Sensitivities*
* Sensitivities are revised once per year upon publication of the previous year’s fourth quarter results. Sensitivities are estimates based on assumptions about the Group’s portfolio in 2016. Actual results could vary significantly from estimates based on the application of these sensitivities. The impact of the $-€ sensitivity on adjusted net operating income is attributable 85% to Refining & Chemicals. Investments - Divestments
Net-debt-to-equity ratio
Scenario Change
Estimated impact on adjusted
net operating income
Estimated impact on cash flow
Dollar 1.0 $/€ +0.1 $ per € -0.15 B$ -0.1 B$
Brent 50 $/b -10 $/b -2 B$ -2 B$
European refining margin indicator (ERMI) 35 $/t -10 $/t -0.5 B$ -0.6 B$
In millions of dollars 1Q16 4Q15 1Q151Q16
vs 1Q15
Organic investments 4,615 6,365 6,069 -24%
capitalized exploration 228 232 399 -43%
increase in non-current loans 572 553 793 -28%
repayment of non-current loans (100) (196) (245) -59%
Acquisitions 193 33 2,495 -92%
Asset sales 885 2,101 2,739 -68%
Other transactions with non-controlling interests - 8 - na
Net investments 3,923 4,289 5,825 -33%
In millions of dollars 3/31/2016 12/31/2015 3/31/2015
Current borrowings 10,858 12,488 13,604
Net current financial assets (3,231) (6,019) (2,262)
Net financial assets classified as held for sale 83 141 (27)
Non-current financial debt 43,138 44,464 41,827
Hedging instruments of non-current debt (1,236) (1,219) (1,275)
Cash and cash equivalents (20,570) (23,269) (25,051)
Net debt 29,042 26,586 26,816
Shareholders’ equity - Group share 96,443 92,494 95,096
Estimated dividend payable (3,250) (1,545) (2,988)
Non-controlling interests 2,960 2,915 3,024
Adjusted shareholders' equity 96,153 93,864 95,132
Net-debt-to-equity ratio 30.2% 28.3% 28.2%

11
Return on equity
Return on average capital employed
Twelve months ended March 31, 2016
Full-year 2015
* At replacement cost (excluding after-tax inventory effect).
In millions of dollars
Adjusted net income
Average adjusted shareholders' equity
Return on equity (ROE) 10.2% 11.5%
April 1, 2015 to March 31, 2016
January 1, 2015 to December 31, 2015
9,742 10,698
95,643 92,854
In millions of dollars UpstreamRefining & Chemicals
Marketing & Services
Group
Adjusted net operating income 3,913 4,917 1,630 10,460
Capital employed at 3/31/2015* 103,167 12,534 7,928 123,218
Capital employed at 3/31/2016* 106,517 12,505 8,800 127,754
ROACE 3.7% 39.3% 19.5% 8.3%
In millions of dollars UpstreamRefining & Chemicals
Marketing & Services
Group
Adjusted net operating income 4,774 4,889 1,699 11,400
Capital employed at 12/31/2014* 100,497 13,451 8,825 120,526
Capital employed at 12/31/2015* 105,580 10,407 8,415 121,143
ROACE 4.6% 41.0% 19.7% 9.4%

12
This press release presents the results for the first quarter 2016 from the consolidated financial statements of TOTAL S.A. as of March 31, 2016. The notes to these consolidated financial statements (unaudited) are available on the TOTAL website total.com. This document may contain forward-looking information on the Group (including objectives and trends), as well as forward-looking statements within the meaning of the Private Securities Litigation Reform Act of 1995, notably with respect to the financial condition, results of operations, business, strategy and plans of TOTAL. These data do not represent forecasts within the meaning of European Regulation No. 809/2004. Such forward-looking information and statements included in this document are based on a number of economic data and assumptions made in a given economic, competitive and regulatory environment. They may prove to be inaccurate in the future, and are subject to a number of risk factors that could lead to a significant difference between actual results and those anticipated, including currency fluctuations, the price of petroleum products, the ability to realize cost reductions and operating efficiencies without unduly disrupting business operations, environmental regulatory considerations and general economic and business conditions. Certain financial information is based on estimates particularly in the assessment of the recoverable value of assets and potential impairments of assets relating thereto. Neither TOTAL nor any of its subsidiaries assumes any obligation to update publicly any forward-looking information or statement, objectives or trends contained in this document whether as a result of new information, future events or otherwise. Further information on factors, risks and uncertainties that could affect the Company’s financial results or the Group’s activities is provided in the most recent Registration Document, the French language version of which is filed by the Company with the French Autorité des Marchés Financiers and annual report on Form 20-F filed with the United States Securities and Exchange Commission (“SEC”). Financial information by business segment is reported in accordance with the internal reporting system and shows internal segment information that is used to manage and measure the performance of TOTAL. Performance indicators excluding the adjustment items, such as adjusted operating income, adjusted net operating income, and adjusted net income are meant to facilitate the analysis of the financial performance and the comparison of income between periods. These adjustment items include: (i) Special items Due to their unusual nature or particular significance, certain transactions qualified as "special items" are excluded from the business segment figures. In general, special items relate to transactions that are significant, infrequent or unusual. However, in certain instances, transactions such as restructuring costs or asset disposals, which are not considered to be representative of the normal course of business, may be qualified as special items although they may have occurred within prior years or are likely to occur again within the coming years. (ii) Inventory valuation effect The adjusted results of the Refining & Chemicals and Marketing & Services segments are presented according to the replacement cost method. This method is used to assess the segments’ performance and facilitate the comparability of the segments’ performance with those of its competitors. In the replacement cost method, which approximates the LIFO (Last-In, First-Out) method, the variation of inventory values in the statement of income is, depending on the nature of the inventory, determined using either the month-end price differentials between one period and another or the average prices of the period rather than the historical value. The inventory valuation effect is the difference between the results according to the FIFO (First-In, First-Out) and the replacement cost. (iii) Effect of changes in fair value The effect of changes in fair value presented as an adjustment item reflects, for some transactions, differences between internal measures of performance used by TOTAL’s management and the accounting for these transactions under IFRS. IFRS requires that trading inventories be recorded at their fair value using period-end spot prices. In order to best reflect the management of economic exposure through derivative transactions, internal indicators used to measure performance include valuations of trading inventories based on forward prices. Furthermore, TOTAL, in its trading activities, enters into storage contracts, whose future effects are recorded at fair value in Group’s internal economic performance. IFRS precludes recognition of this fair value effect. The adjusted results (adjusted operating income, adjusted net operating income, adjusted net income) are defined as replacement cost results, adjusted for special items, excluding the effect of changes in fair value. Euro amounts presented herein represent dollar amounts converted at the average euro-dollar (€-$) exchange rate for the applicable period and are not the result of financial statements prepared in euros. Cautionary Note to U.S. Investors – The SEC permits oil and gas companies, in their filings with the SEC, to separately disclose proved, probable and possible reserves that a company has determined in accordance with SEC rules. We may use certain terms in this press release, such as “potential reserves” or “resources”, that the SEC’s guidelines strictly prohibit us from including in filings with the SEC. U.S. investors are urged to consider closely the disclosure in our Form 20-F, File N° 1-10888, available from us at 2, place Jean Millier – Arche Nord Coupole/Regnault - 92078 Paris-La Défense Cedex, France, or at our website total.com. You can also obtain this form from the SEC by calling 1-800-SEC-0330 or on the SEC’s website sec.gov.

Main indicators
Chart updated around the middle of the month following the end of each quarter
$/€ European refining
margin ERMI* ($/t)** Brent ($/b) Average liquids price*** ($/b) Average gas price ($/Mbtu)***
First quarter 2016 1.10 35.1 33.9 31.0 3.46
Fourth quarter 2015 1.10 38.1 43.8 38.1 4.45
Third quarter 2015 1.11 54.8 50.5 44.0 4.47
Second quarter 2015 1.11 54.1 61.9 58.2 4.67
First quarter 2015 1.13 47.1 53.9 49.5 5.38
* European Refining Margin Indicator (ERMI) is an indicator intended to represent the margin after variable costs for a hypothetical complex refinery located around Rotterdam in Northern Europe that processes a mix of crude oil and other inputs commonly supplied to this region to produce and market the main refined products at prevailing prices in this region. The indicator margin may not be representative of the actual margins achieved by Total in any period because of Total’s particular refinery configurations, product mix effects or other company-specific operating conditions.
** 1 $/t = 0.136 $/b
*** consolidated subsidiaries, excluding fixed margin contracts, including hydrocarbon production overlifting / underlifting position valued at market price. Disclaimer: data is based on Total’s reporting, is not audited and is subject to change.

Total financial statements First quarter 2016 consolidated accounts, IFRS

CONSOLIDATED STATEMENT OF INCOME
TOTAL
(M$) (a)
1st quarter2016
4th quarter2015
1st quarter2015
Sales 32,841 37,749 42,313Excise taxes (5,319) (5,457) (5,350)
Revenues from sales 27,522 32,292 36,963
Purchases, net of inventory variation (17,639) (21,874) (24,204)Other operating expenses (6,136) (6,248) (6,272)
Exploration costs (194) (727) (637)
Depreciation, depletion and impairment of tangible assets and mineral interests (2,680) (7,672) (3,872)Other income 500 833 1,621Other expense (70) (298) (442)
Financial interest on debt (274) (241) (262)Financial income from marketable securities & cash equivalents 10 25 31
Cost of net debt (264) (216) (231)
Other financial income 191 300 142Other financial expense (155) (171) (166)
Equity in net income (loss) of affiliates 498 600 590
Income taxes 48 1,381 (984)
Consolidated net income 1,621 (1,800) 2,508
Group share 1,606 (1,626) 2,663Non-controlling interests 15 (174) (155)
Earnings per share ($) 0.67 (0.72) 1.16
Fully-diluted earnings per share ($) 0.67 (0.71) 1.16 (a) Except for per share amounts.
(unaudited)

CONSOLIDATED STATEMENT OF COMPREHENSIVE INCOME
TOTAL
(M$)1st quarter
20164th quarter
20151st quarter
2015
Consolidated net income 1,621 (1,800) 2,508
Other comprehensive income
Actuarial gains and losses (81) 358 (95)
Tax effect 32 (140) (36)
Currency translation adjustment generated by the parent company 3,641 (2,171) (8,192)
Items not potentially reclassifiable to profit and loss 3,592 (1,953) (8,323)
Currency translation adjustment (1,944) 604 3,748Available for sale financial assets (10) 16 8Cash flow hedge 98 4 (130)Share of other comprehensive income of equity affiliates, net amount (1) (95) 1,042Other 3 - 3Tax effect (24) (7) 37Items potentially reclassifiable to profit and loss (1,878) 522 4,708Total other comprehensive income (net amount) 1,714 (1,431) (3,615)
Comprehensive income 3,335 (3,231) (1,107)
Group share 3,308 (3,033) (916)Non-controlling interests 27 (198) (191)
(unaudited)

CONSOLIDATED BALANCE SHEET
TOTAL
(M$)
March 31, 2016
(unaudited)
December 31, 2015
(unaudited)
March 31, 2015
(unaudited)
ASSETS
Non-current assetsIntangible assets, net 14,512 14,549 16,236Property, plant and equipment, net 111,636 109,518 105,806Equity affiliates : investments and loans 20,411 19,384 19,552Other investments 1,413 1,241 1,325Hedging instruments of non-current financial debt 1,236 1,219 1,275Deferred income taxes 3,955 3,982 3,435Other non-current assets 4,329 4,355 4,093
Total non-current assets 157,492 154,248 151,722
Current assetsInventories, net 13,887 13,116 15,393Accounts receivable, net 12,220 10,629 15,458Other current assets 15,827 15,843 14,576Current financial assets 3,439 6,190 2,464Cash and cash equivalents 20,570 23,269 25,051Assets classified as held for sale 724 1,189 3,257
Total current assets 66,667 70,236 76,199
Total assets 224,159 224,484 227,921
LIABILITIES & SHAREHOLDERS' EQUITY
Shareholders' equityCommon shares 7,709 7,670 7,519Paid-in surplus and retained earnings 103,766 101,528 102,755Currency translation adjustment (10,447) (12,119) (10,830)Treasury shares (4,585) (4,585) (4,348)
Total shareholders' equity - Group share 96,443 92,494 95,096
Non-controlling interests 2,960 2,915 3,024
Total shareholders' equity 99,403 95,409 98,120
Non-current liabilitiesDeferred income taxes 11,766 12,360 13,557Employee benefits 3,984 3,774 4,483Provisions and other non-current liabilities 17,607 17,502 17,050Non-current financial debt 43,138 44,464 41,827
Total non-current liabilities 76,495 78,100 76,917
Current liabilitiesAccounts payable 20,887 20,928 22,043Other creditors and accrued liabilities 15,938 16,884 15,750Current borrowings 10,858 12,488 13,604Other current financial liabilities 208 171 202Liabilities directly associated with the assets classified as held for sale 370 504 1,285
Total current liabilities 48,261 50,975 52,884
Total liabilities & shareholders' equity 224,159 224,484 227,921
(unaudited)

CONSOLIDATED STATEMENT OF CASH FLOW
TOTAL
(M$)
1st quarter2016
4th quarter2015
1st quarter2015
CASH FLOW FROM OPERATING ACTIVITIES
Consolidated net income 1,621 (1,800) 2,508Depreciation, depletion, amortization and impairment 2,735 8,278 4,424Non-current liabilities, valuation allowances and deferred taxes (268) (1,862) (446)Impact of coverage of pension benefit plans - - -(Gains) losses on disposals of assets (367) (665) (1,357)Undistributed affiliates' equity earnings (236) 39 (68)(Increase) decrease in working capital (1,545) 937 (476)Other changes, net (59) (89) (198)Cash flow from operating activities 1,881 4,838 4,387
CASH FLOW USED IN INVESTING ACTIVITIES
Intangible assets and property, plant and equipment additions (4,146) (5,919) (7,956)Acquisitions of subsidiaries, net of cash acquired (133) (42) (7)Investments in equity affiliates and other securities (57) (80) (53)Increase in non-current loans (572) (553) (793)Total expenditures (4,908) (6,594) (8,809)Proceeds from disposals of intangible assets and property, plant and equipment 792 1,437 959Proceeds from disposals of subsidiaries, net of cash sold - 58 1,758Proceeds from disposals of non-current investments 93 606 22Repayment of non-current loans 100 196 245Total divestments 985 2,297 2,984Cash flow used in investing activities (3,923) (4,297) (5,825)
CASH FLOW USED IN FINANCING ACTIVITIES
Issuance (repayment) of shares: - Parent company shareholders - 31 12 - Treasury shares - - -Dividends paid: - Parent company shareholders (954) (592) (1,566) - Non-controlling interests (3) (3) (2)Issuance of perpetual subordinated notes - - 5,616Payments on perpetual subordinated notes (133) - -Other transactions with non-controlling interests - 8 -Net issuance (repayment) of non-current debt 154 2,039 136Increase (decrease) in current borrowings (3,027) (531) 423Increase (decrease) in current financial assets and liabilities 2,746 (3,320) (1,022)Cash flow used in financing activities (1,217) (2,368) 3,597Net increase (decrease) in cash and cash equivalents (3,259) (1,827) 2,159Effect of exchange rates 560 (762) (2,289)Cash and cash equivalents at the beginning of the period 23,269 25,858 25,181Cash and cash equivalents at the end of the period 20,570 23,269 25,051
(unaudited)

CONSOLIDATED STATEMENT OF CHANGES IN SHAREHOLDERS' EQUITY
TOTAL
(unaudited)
(M$) Number Amount Number Amount
As of January 1, 2015 2,385,267,525 7,518 94,646 (7,480) (109,361,413) (4,354) 90,330 3,201 93,531
Net income of the first quarter 2015 - - 2,663 - - - 2,663 (155) 2,508
Other comprehensive Income - - (229) (3,350) - - (3,579) (36) (3,615)
Comprehensive Income - - 2,434 (3,350) - - (916) (191) (1,107)
Dividend - - - - - - - (2) (2)
Issuance of common shares 288,256 1 11 - - - 12 - 12
Purchase of treasury shares - - - - - - - - -
Sale of treasury shares (1) - - (6) - 102,560 6 - - -
Share-based payments - - 50 - - - 50 - 50
Share cancellation - - - - - - - - -
Issuance of perpetual subordinated notes - - 5,616 - - - 5,616 - 5,616
Payments on perpetual subordinated notes - - (16) - - - (16) - (16)
Other operations with non-controlling interests - - (15) - - - (15) 15 -
Other items - - 35 - - - 35 1 36
As of March 31, 2015 2,385,555,781 7,519 102,755 (10,830) (109,258,853) (4,348) 95,096 3,024 98,120
Net income from April 1 to December 31, 2015 - - 2,424 - - - 2,424 (146) 2,278
Other comprehensive Income - - 414 (1,289) - - (875) (45) (920)
Comprehensive Income - - 2,838 (1,289) - - 1,549 (191) 1,358
Dividend - - (6,303) - - - (6,303) (98) (6,401)
Issuance of common shares 54,502,102 151 2,148 - - - 2,299 - 2,299
Purchase of treasury shares - - - - (4,711,935) (237) (237) - (237)
Sale of treasury shares (1) - - - - 3,030 - - - -
Share-based payments - - 51 - - - 51 - 51
Share cancellation - - - - - - - - -
Issuance of perpetual subordinated notes - - - - - - - - -
Payments on perpetual subordinated notes - - (98) - - - (98) - (98)
Other operations with non-controlling interests - - 38 - - - 38 49 87
Other items - - 99 - - - 99 131 230
As of December 31, 2015 2,440,057,883 7,670 101,528 (12,119) (113,967,758) (4,585) 92,494 2,915 95,409
Net income of the first quarter 2016 - - 1,606 - - - 1,606 15 1,621
Other comprehensive Income - - 30 1,672 - - 1,702 12 1,714
Comprehensive Income - - 1,636 1,672 - - 3,308 27 3,335
Dividend - - - - - - - (3) (3)
Issuance of common shares 13,972,093 39 573 - - - 612 - 612
Purchase of treasury shares - - - - - - - - -
Sale of treasury shares (1) - - - - 1,230 - - - -
Share-based payments - - 25 - - - 25 - 25
Share cancellation - - - - - - - - -
Issuance of perpetual subordinated notes - - - - - - - - -
Payments on perpetual subordinated notes - - (33) - - - (33) - (33)
Other operations with non-controlling interests - - (11) - - - (11) 11 -
Other items - - 48 - - - 48 10 58
As of March 31, 2016 2,454,029,976 7,709 103,766 (10,447) (113,966,528) (4,585) 96,443 2,960 99,403
(1) Treasury shares related to the restricted stock grants.
Total shareholders'
equity
Shareholders' equity -
Group share
Common shares issued Treasury sharesPaid-in surplus and
retained earnings
Currency translation adjustment
Non-controlling interests

BUSINESS SEGMENT INFORMATIONTOTAL
(unaudited)
1st quarter 2016(M$)
UpstreamRefining & Chemicals
Marketing & Services
Corporate Intercompany Total
Non-Group sales 3,466 13,938 15,433 4 - 32,841
Intersegment sales 3,262 4,148 132 70 (7,612) -
Excise taxes - (961) (4,358) - - (5,319)
Revenues from sales 6,728 17,125 11,207 74 (7,612) 27,522
Operating expenses (4,798) (15,782) (10,781) (220) 7,612 (23,969)
Depreciation, depletion and impairment of tangible assets and mineral interests (2,247) (253) (172) (8) - (2,680)
Operating income (317) 1,090 254 (154) - 873
Equity in net income (loss) of affiliates and other items 670 177 14 103 - 964
Tax on net operating income 313 (276) (80) 37 - (6)
Net operating income 666 991 188 (14) - 1,831
Net cost of net debt (210)
Non-controlling interests (15)
Net income 1,606
1st quarter 2016 (adjustments) (a)
(M$)Upstream
Refining & Chemicals
Marketing & Services
Corporate Intercompany Total
Non-Group sales (126) - - - - (126)
Intersegment sales - - - - - -
Excise taxes - - - - - -
Revenues from sales (126) - - - - (126)
Operating expenses (333) (207) (77) - - (617)
Depreciation, depletion and impairment of tangible assets and mineral interests - - - - - -
Operating income (b) (459) (207) (77) - - (743)
Equity in net income (loss) of affiliates and other items 329 - (17) - - 312
Tax on net operating income 298 70 30 - - 398
Net operating income (b) 168 (137) (64) - - (33)
Net cost of net debt (6)
Non-controlling interests 9
Net income (30)
On operating income - (205) (77) -
On net operating income - (133) (50) -
15 (346) (110) 37
1st quarter 2016 (adjusted)
(M$) (a) UpstreamRefining & Chemicals
Marketing & Services
Corporate Intercompany Total
Non-Group sales 3,592 13,938 15,433 4 - 32,967
Intersegment sales 3,262 4,148 132 70 (7,612) -
Excise taxes - (961) (4,358) - - (5,319)
Revenues from sales 6,854 17,125 11,207 74 (7,612) 27,648
Operating expenses (4,465) (15,575) (10,704) (220) 7,612 (23,352)
Depreciation, depletion and impairment of tangible assets and mineral interests (2,247) (253) (172) (8) - (2,680)
Adjusted operating income 142 1,297 331 (154) - 1,616
Equity in net income (loss) of affiliates and other items 341 177 31 103 - 652
Tax on net operating income 15 (346) (110) 37 - (404)
Adjusted net operating income 498 1,128 252 (14) - 1,864
Net cost of net debt (204)
Non-controlling interests (24)
Adjusted net income 1,636
Adjusted fully-diluted earnings per share ($) 0.68
(a) Except for earnings per share.
1st quarter 2016(M$)
UpstreamRefining & Chemicals
Marketing & Services
Corporate Intercompany Total
Total expenditures 4,237 259 390 22 - 4,908
Total divestments 915 29 37 4 - 985
Cash flow from operating activities 2,113 (421) 240 (51) - 1,881
(a) Adjustments include special items, inventory valuation effect and the effect of changes in fair value.
(b) Of which inventory valuation effect

BUSINESS SEGMENT INFORMATIONTOTAL
(unaudited)
4th quarter 2015(M$)
UpstreamRefining & Chemicals
Marketing & Services
Corporate Intercompany Total
Non-Group sales 3,457 15,969 18,326 (3) - 37,749
Intersegment sales 4,342 5,532 215 59 (10,148) -
Excise taxes - (1,073) (4,384) - - (5,457)
Revenues from sales 7,799 20,428 14,157 56 (10,148) 32,292
Operating expenses (5,716) (19,606) (13,445) (230) 10,148 (28,849)
Depreciation, depletion and impairment of tangible assets and mineral interests (7,189) (293) (183) (7) - (7,672)
Operating income (5,106) 529 529 (181) - (4,229)
Equity in net income (loss) of affiliates and other items 571 759 (97) 31 - 1,264
Tax on net operating income 1,328 (74) (135) 218 - 1,337
Net operating income (3,207) 1,214 297 68 - (1,628)
Net cost of net debt (172)
Non-controlling interests 174
Net income (1,626)
4th quarter 2015 (adjustments) (a)
(M$)Upstream
Refining & Chemicals
Marketing & Services
Corporate Intercompany Total
Non-Group sales (205) - - - - (205)
Intersegment sales - - - - - -
Excise taxes - - - - - -
Revenues from sales (205) - - - - (205)
Operating expenses (413) (429) (161) - - (1,003)
Depreciation, depletion and impairment of tangible assets and mineral interests (4,893) (39) (1) - - (4,933)
Operating income (b) (5,511) (468) (162) - - (6,141)
Equity in net income (loss) of affiliates and other items (58) 596 (116) (19) - 403
Tax on net operating income 1,614 79 45 7 - 1,745
Net operating income (b) (3,955) 207 (233) (12) - (3,993)
Net cost of net debt (11)
Non-controlling interests 303
Net income (3,701)
On operating income - (359) (105) -
On net operating income - (247) (68) -
(286) (153) (180) 211
4th quarter 2015 (adjusted)
(M$) (a) UpstreamRefining & Chemicals
Marketing & Services
Corporate Intercompany Total
Non-Group sales 3,662 15,969 18,326 (3) - 37,954
Intersegment sales 4,342 5,532 215 59 (10,148) -
Excise taxes - (1,073) (4,384) - - (5,457)
Revenues from sales 8,004 20,428 14,157 56 (10,148) 32,497
Operating expenses (5,303) (19,177) (13,284) (230) 10,148 (27,846)
Depreciation, depletion and impairment of tangible assets and mineral interests (2,296) (254) (182) (7) - (2,739)
Adjusted operating income 405 997 691 (181) - 1,912
Equity in net income (loss) of affiliates and other items 629 163 19 50 - 861
Tax on net operating income (286) (153) (180) 211 - (408)
Adjusted net operating income 748 1,007 530 80 - 2,365
Net cost of net debt (161)
Non-controlling interests (129)
Adjusted net income 2,075
Adjusted fully-diluted earnings per share ($) 0.88
(a) Except for earnings per share.
4th quarter 2015(M$)
UpstreamRefining & Chemicals
Marketing & Services
Corporate Intercompany Total
Total expenditures 5,293 586 689 26 - 6,594
Total divestments 1,402 836 56 3 - 2,297
Cash flow from operating activities 2,624 2,127 289 (202) - 4,838
(a) Adjustments include special items, inventory valuation effect and the effect of changes in fair value.
(b) Of which inventory valuation effect

BUSINESS SEGMENT INFORMATIONTOTAL
(unaudited)
1st quarter 2015(M$)
UpstreamRefining & Chemicals
Marketing & Services
Corporate Intercompany Total
Non-Group sales 5,225 17,464 19,620 4 - 42,313
Intersegment sales 4,384 6,967 272 52 (11,675) -
Excise taxes - (933) (4,417) - - (5,350)
Revenues from sales 9,609 23,498 15,475 56 (11,675) 36,963
Operating expenses (5,969) (21,717) (14,863) (239) 11,675 (31,113)
Depreciation, depletion and impairment of tangible assets and mineral interests (3,441) (252) (174) (5) - (3,872)
Operating income 199 1,529 438 (188) - 1,978
Equity in net income (loss) of affiliates and other items 769 762 (80) 294 - 1,745
Tax on net operating income (368) (446) (131) (82) - (1,027)
Net operating income 600 1,845 227 24 - 2,696
Net cost of net debt (188)
Non-controlling interests 155
Net income 2,663
1st quarter 2015 (adjustments) (a)
(M$)Upstream
Refining & Chemicals
Marketing & Services
Corporate Intercompany Total
Non-Group sales (146) - - - - (146)
Intersegment sales - - - - - -
Excise taxes - - - - - -
Revenues from sales (146) - - - - (146)
Operating expenses (140) 194 (7) - - 47
Depreciation, depletion and impairment of tangible assets and mineral interests (1,046) - - - - (1,046)
Operating income (b) (1,332) 194 (7) - - (1,145)
Equity in net income (loss) of affiliates and other items 136 661 (89) - - 708
Tax on net operating income 437 (110) 2 - - 329
Net operating income (b) (759) 745 (94) - - (108)
Net cost of net debt -
Non-controlling interests 169
Net income 61
On operating income - 235 (7) -
On net operating income - 150 (5) -
(805) (336) (133) (82)
1st quarter 2015 (adjusted)
(M$) (a) UpstreamRefining & Chemicals
Marketing & Services
Corporate Intercompany Total
Non-Group sales 5,371 17,464 19,620 4 - 42,459
Intersegment sales 4,384 6,967 272 52 (11,675) -
Excise taxes - (933) (4,417) - - (5,350)
Revenues from sales 9,755 23,498 15,475 56 (11,675) 37,109
Operating expenses (5,829) (21,911) (14,856) (239) 11,675 (31,160)
Depreciation, depletion and impairment of tangible assets and mineral interests (2,395) (252) (174) (5) - (2,826)
Adjusted operating income 1,531 1,335 445 (188) - 3,123
Equity in net income (loss) of affiliates and other items 633 101 9 294 - 1,037
Tax on net operating income (805) (336) (133) (82) - (1,356)
Adjusted net operating income 1,359 1,100 321 24 - 2,804
Net cost of net debt (188)
Non-controlling interests (14)
Adjusted net income 2,602
Adjusted fully-diluted earnings per share ($) 1.13
(a) Except for earnings per share.
1st quarter 2015(M$)
UpstreamRefining & Chemicals
Marketing & Services
Corporate Intercompany Total
Total expenditures 8,151 434 215 9 - 8,809
Total divestments 1,162 1,766 52 4 - 2,984
Cash flow from operating activities 3,525 314 644 (96) - 4,387
(a) Adjustments include special items, inventory valuation effect and the effect of changes in fair value.
(b) Of which inventory valuation effect

Reconciliation of the information by business segment with consolidated financial statements
TOTAL
1st quarter 2016(M$)
Adjusted Adjustments (a) Consolidated statement of income
Sales 32,967 (126) 32,841Excise taxes (5,319) - (5,319)
Revenues from sales 27,648 (126) 27,522
Purchases, net of inventory variation (17,357) (282) (17,639)Other operating expenses (5,801) (335) (6,136)Exploration costs (194) - (194)Depreciation, depletion and impairment of tangible assets and mineral interests (2,680) - (2,680)
Other income 171 329 500Other expense (54) (16) (70)
Financial interest on debt (268) (6) (274)Financial income from marketable securities & cash equivalents 10 - 10
Cost of net debt (258) (6) (264)
Other financial income 191 - 191Other financial expense (155) - (155)
Equity in net income (loss) of affiliates 499 (1) 498
Income taxes (350) 398 48Consolidated net income 1,660 (39) 1,621Group share 1,636 (30) 1,606Non-controlling interests 24 (9) 15
(a) Adjustments include special items, inventory valuation effect and the effect of changes in fair value.
1st quarter 2015(M$)
Adjusted Adjustments (a) Consolidated statement of income
Sales 42,459 (146) 42,313Excise taxes (5,350) - (5,350)
Revenues from sales 37,109 (146) 36,963
Purchases, net of inventory variation (24,432) 228 (24,204)Other operating expenses (6,176) (96) (6,272)Exploration costs (552) (85) (637)Depreciation, depletion and impairment of tangible assets and mineral interests (2,826) (1,046) (3,872)
Other income 526 1,095 1,621Other expense (99) (343) (442)
Financial interest on debt (262) - (262)Financial income from marketable securities & cash equivalents 31 - 31
Cost of net debt (231) - (231)
Other financial income 142 - 142Other financial expense (166) - (166)
Equity in net income (loss) of affiliates 634 (44) 590
Income taxes (1,313) 329 (984)Consolidated net income 2,616 (108) 2,508Group share 2,602 61 2,663Non-controlling interests 14 (169) (155)
(a) Adjustments include special items, inventory valuation effect and the effect of changes in fair value.
(unaudited)


![[Article] La Coupole Christiane Wagner](https://img.pdfslide.net/doc/110x75/62adb76dbdfabb20707a7d89/article-la-coupole-christiane-wagner.jpg)