Embed Size (px)
Citation preview
Utah State UniversityDigitalCommons@USU
All Graduate Theses and Dissertations Graduate Studies
5-1967
Newspaper advertising, Retail Pricing Practices,and Gross Retail Margins for Turkeys in SelectedUtah and Other U. S. Markets for Various Years andSeasonsGerry R. Flake
Follow this and additional works at: https://digitalcommons.usu.edu/etd
This Thesis is brought to you for free and open access by the GraduateStudies at DigitalCommons@USU. It has been accepted for inclusion in AllGraduate Theses and Dissertations by an authorized administrator ofDigitalCommons@USU. For more information, please [email protected].
Recommended CitationFlake, Gerry R., "Newspaper advertising, Retail Pricing Practices, and Gross Retail Margins for Turkeys in Selected Utah and Other U.S. Markets for Various Years and Seasons" (1967). All Graduate Theses and Dissertations. 1682.https://digitalcommons.usu.edu/etd/1682
NEWSPAPER ADVERTISING, RETAIL PRICING PRACTICES, AND GROSS
RETAIL MARGINS FOR TURKEYS IN SELECTED UTAH AND OTHER
Approved:
Major Professor
U. S. MARKETS FOR VARIOUS YEARS AND SEASONS
by
Gerry R.· Flake
A thesis submitted in partial fulfillment of the requirements for the degree
of
MASTER OF SCIENCE
in
Agricultural Economics
Head-of Department
DeAlt "Of Graduate Studies
UTAH STATE UNIVERSITY Logan, Utah
1967
ACKNOWLEDGMENTS
Sincere appreciation is given to Dr. Roice H. Anderson, thesis
director and major professor, for his helpful suggestions and assistance
in organizing and reviewing the project and the manuscript for this
thesis.
Thanks is extended to Dr. Lynn H. Davis, Dr. Rondo A. Christensen,
and Dr. H. Bruce Bylund, members of my advisory committee.
Special appreciation is expressed to my wife, Janet, for her
encouragement, patience, and willing assistance.
Gerry R. Flake
TABLE OF CONTENTS
INTRODUCTION
OBJECTIVES .
REVIEW OF LITERATURE
SOURCES OF DATA AND METHOD OF PROCEDURE
NEWSPAPER ADVERTISING PRACTICES FOR TURKEY .
Incidence of Turkey Advertising
Turkey as the meat feature
Turkey entries as feature, sub-feature, or liner .
Product-Differentiating Characteristics of Turkey Advertising
Sex identification of advertised entry
Turkey entry as fresh or frozen
Use of grades in advertised entries
Brand name in turkey advertising .
Indication of turkey size in advertising .
Use of additional descriptive terms
Simultaneous Turkey Advertising by Food Retailing Organizations
Space Devoted to Advertising Turkey
RETAIL PRICING PRACTICES FOR TURKEY
Wholesale Price for Turkey
Regular Retail Price for Turkey
Advertised Special Price for Turkey
"Odd-Cent" Pricing of Turkey
Page
1
3
4
6
8
8
12
15
17
17
19
20
21
25
25
28
29
31
31
33
35
38
TABLE OF CONTENTS (Continued)
Price Differences for Fresh and Frozen Turkey
Identical Pricing of Turkey
Volume of Sales at Regular and Special Prices
Comparison of Turkey, Chicken, and Beef Sales
GROSS RETAIL MARGINS FOR TURKEY
Retail Margins at Advertised Prices
Retail Margins at Regular Retail Prices
SUMMARY
Newspaper Advertising Practices for Turkey
Retail Pricing Practices for Turkey
Gross Retail Margins for Turkey
CONCLUSIONS
LITERATURE CITED
APPENDIX
VITA
Page
38
39
40
41
43
43
48
50
50
52
53
55
56
57
60
LIST OF TABLES
Table Page
1. Total newspaper food ads and ads offering turkey, selected Utah and other U. S. markets for various years and seasons
2. Total pre-holiday food ads and proportion offering turkey compared with the relative U. S. supply of turkey, three
10
Utah markets, 1955 to 1966 11
3. Total newspaper food ads offering turkey, number of turkey entries, and entries per ad, selected Utah and other U. S. markets for various years and seasons . 13
4. Total newspaper food ads offering turkey, number featuring turkey and percent featuring turkey, selected Utah and other U. S. markets for various years and seasons
5. Proportion of turkey entries classified as feature, sub~
feature, or liner, selected Utah and other U. S. markets
14
for various years and seasons . 16
6. Proportion of turkey entries advertised as tom, hen, or turkey, selected Utah and other U. S. markets for various years and seasons . 18
7. Proportion of turkey entries advertised as fresh or frozen, selected Utah and other U. S. markets for various years and seasons . 20
8. Proportion of turkey entries advertised as Grade A or Grades Band C, selected Utah and other U. S. markets for various years and seasons . 22
9. Use of brand name in turkey advertising, selected Utah and U. S. markets . 23
10. Proportion of turkey entries indicating or not indicating size, selected Utah and other U. S. markets for various years and seasons . 26
11. Proportion of turkey entries advertised with various descriptive terms, selected Utah and other U. S. markets for various years and seasons . 27
Table
12. Proportion of retail stores advertising turkey simultaneously the week prior to given holiday, selected Utah and other U. S. markets for various years and seasons.
13. Proportion of advertising space devoted to turkey, selected Utah and other u. S. markets for various years and seasons
14. New York wholesale prices for Grade A hen and tom turkeys, Thanksgiving, 1955 to 1966
15. Regular retail prices for Grade A hen and tom turkeys, Salt Lake City, pre-holiday period, 1960 to 1966
16. Modal advertised prices for Grade A hen and tom turkeys, Utah markets for various years and seasons
17. Modal advertised prices for Grade A hen and tom turkeys, 15 selected U. S. markets for various years and seasons
18. Average prices for fresh and frozen turkey, eight Uo S. markets, holiday seasons, 1965-1966
19. Proportion of turkey sales at regular and advertised retail prices by two Salt Lake City food chains, various seasons, 1966 .
20. Relative importance of turkey, chicken, and beef sales, two Salt Lake City food chains, by 4-week periods, 1966
21. Retail margins for Grade A hen and tom turkeys based on advertised retail prices, Utah markets for various seasons, 1955-1966
22. Retail margins for Grade A hen and tom turkeys based on advertised retail prices, selected U. S. markets, holiday seasons, 1965-1966
23. R~tail margins for Grade A hen and tom turkeys based on advertised and regular retail prices, Utah markets, pre-holiday period, 1960 to 1966
Page
29
30
33
34
36
37
39
41
42
44
46
48
LIST OF FIGURES
Figure Page
1. Comparison of per capita consumption and deflated farm price of turkeys, 1955-1966 • 2
2. Average wholesale prices and mode and range of advertised retail prices for Grade A hen turkeys, Thanksgiving season, Salt Lake City, 1955-1966 45
3. Average wholesale prices and mode and range of advertised retail prices for Grade A hen turkeys, selected Uo S. markets, Thanksgiving, 1966 47
4. Supply of turkey in the United States, year-to~year changes and 3-year moving average, 1955-1966 . 59
ABSTRACT
Newspaper Advertising, Retail Pricing Practices, and Gross
Retail Margins for Turkeys in Selected Utah and Other
U. S. Markets for Various Years and Seasons
by
Gerry R. Flake, Master of Science
Utah State University, 1967
Major Professor: Dr. Roice H. Anderson Department: Agricultural Economics
Newspaper advertising and retail pricing practices for turkeys were
ascertained and gross retail margins established for three Utah markets,
1955 to 1966, and for 12 other selected U. S. markets, 1965 and 1966.
Turkey was extensively used as an advertised special item,
particularly in holiday seasons. Food retailing organizations advertised
turkey at low prices and margins at Thanksgiving and Christmas when
consumer demand for turkey is traditionally strong. Prior to these
holidays, food retailing organizations in a market simultaneously
advertised turkey at identical prices and with little product differentia=
tion thus limiting the effectiveness of turkey as an advertised item to
gain competitive advantage for a food retailer.
(67 pages)
INTRODUCTION
Most turkeys purchased for family consumption are obtained through
retail stores. Retailers are multi-product handlers and the advertising
and pricing attention they give a product influences producers, processors 9
and consumers of that product. Should retailers use a product frequently
as an advertised special, their margins on that product will be low and
consumers will become accustomed to purchasing the product only when it is
advertised. Relatively low prices to consumers will affect the quanti.ty
which can be sold which in turn will affect producers and processors of
the product. Newspaper advertising by food retailing organizations
constitutes an open presentation of retail advertising and pricing
practices. A study of these practices for turkey serves as a barometer 9
assists in understanding retailer strategies, and provides a decision
making guide to producers and processors.
Approximately 90 percent of the turkeys produced in Utah are exported
from the State each year. Utah producers and processors are concerned
with national advertising and pricing practices which in turn influence
Utah prices.
Per capita consumption of turkey in the United States has increased
rapidly in the past decade. In 1966, it reached an all=time high of 7.8
pounds, a 56 percent increase over 1955 (Figure 1). As per capita con
sumption has been rising, prices have been steadily falling. The deflated
farm turkey price in the United States dropped from 52 cents per pound in
1955 to 39 cents in 1966.

. ,
Per capita consumption
8.0
I Deflated price
2
Deflated ricS5
50
45
40
Figure 1. Comparison of per capita consumption and deflated fann pri.ce of turkeys, 1955-1966
Per capita expenditure for turkeys at farm prices did not: change
greatly in this period because the decrease in price largely offset the
increase in consumption. It appears that the demand for turkey has not
changed but merely greater quantities are being purchased at lower pri.ces.
This study seeks to examine retail pricing and advertising practices
for turkey over a period of time and among markets.
OBJECTIVES
The objectives of this study were:
1. To ascertain incidence, ~pace devoted, and product-differenti
ating characteristics of turkey advertising in newspapers for three
seasonal periods in: (a) three Utah markets from 1955 to 1966, and
(b) 12 other selected U. S. markets for 1965 and 1966.
2. To study retail pricing practices for turkeys including price
levels and variations from 1955 to 1966 in the Utah markets and for 1965
and 1966 in 15 selected U, S. markets.
3. To compare newspaper advertised prices with wholesale and regular
retail prices for turkeys and calculate gross margins among markets and
time periods.
REVIEW OF LITERATURE
Some research has been done on retail advertising and pricing
practices for turkey which was helpful in providing a background for
this analysis.
A University of Wisconsin study, based on retail price quotations
obtained from newspaper advertising in seven midwest cities, stated that
no trend existed to indicate consistently higher or lower turkey prices
in anyone city. Advertised prices tended to have less variation at
Thanksgiving and Christmas than during other periods of the year. This
study indicated that turkey was used at particular times throughout the
year as an advertised special with low mark-up (5).
Anderson and Bailey concluded in a study regarding merchandising of
turkeys through retail stores in Utah that the retail mark-up for turkey
was relatively lower than for other meats throughout the year. A tendency
to use turkey as a price leader resulted in an even lower retail price
mark-up in the holiday season than at other times of the year (1).
A study of consumer purchases of turkey by Michigan State University
concluded that prices and quantities of turkey purchased per capita
generally had an inverse relationship with each other (4).
The National Connnission on Food Marketing indicated that meat usually
has about a 25 percent retail mark-up and turkey mark-up at times is as
low as 5 percent. Turkey was often used as a special item with low mark-
up (3).
The National Connnission on Food Marketing reported that accounting
data from a large national supermarket chain indicated about two-thirds
of the chain's turkey sales were made in the last two months of the
year (2).
5
A study at Purdue University concluded that the production of turkeys
and the price of broilers were the two most important single factors
affecting turkey prices from year to year (6).
These studies demonstrated some of the research work that has been
done in retail advertising and pricing of turkeys. The previous research
provided a useful background of material in setting up and accomplishi.ng
the objectives of this study.
SOURCES OF DATA AND METHOD OF PROCEDURE
This study dealt only with retail practices for turkey by food
marketing organizations advertised through newspapers.
The advertised special price, incidence, and space devoted to turkey
advertising were obtained from reading, recording, and analyzing data
from newspaper advertisements of food retailing organizations. Food ads
appearing in the Salt Lake Tribune, Ogden Standard Examiner, and Logan
Herald Jou!nal from 1955 through 1966 were examined to obtain turkey
pricing and advertising information in three Utah cities. A major news
paper was selected and read for each of 12 additional markets in the
United States. Turkey pricing and advertising information in these markets
was obtained for November and December, 1965 and 1966. A tally count of
all food ads was kept but for only those where turkey appeared was the
detailed information recorded.
The Urner-Barry price quotation for New York City is widely accepted
as the standard wholesale price throughout the country. Transfer costs,
differing from market to market, account for the major price variations
among markets. Urner-Barry quotations adjusted for transfer costs were
used as the wholesale price base in calculating marketing margins in this
study.
Regular retail prices were obtained for Utah markets from a weekly
retail price guide.
Data on volume of turkey sales in 1966 were obtained from the Salt Lake
City districts of two food chains.
Supply data for turkey were obtained from United States Department
of Agriculture reports for a l2-year period, 1955-1966.
7
Since turkey marketing by retail stores is highly seasonal, three
within-year periods were used in the analysis. Throughout the study they
are labeled: pre-holiday (January through October), Thanksgiving (all of
November), and Christmas (all of December).
Various graphical and tabular methods of presenting data have been
utilized in this study.
NEWSPAPER ADVERTISING PRACTICES FOR TURKEY
Each link in the marketing chain has an influence or relationship
with every other activity in producing and selling a product. The retail
food store is the end of the marketing channel. The only reports
available on advertising and pricing practices of food retailing organiza
tions are private sources and those published in the advertising of daily
newspapers by individual supermarkets and food chains. Just as wholesale
and retail pricing variations exist, so do variations in the amount of
advertising attention given to a product in different markets and over
time.
Newspaper advertising practices for turkey were obtained by reading
food ads in daily newspapers. The importance of turkey advertising was
measured by the frequency of appearance in the food ad or incidence of
advertising, and the space devoted to it.
Incidence of Turkey Advertising
Upon examination of the basic data, it was apparent that turkey was
advertised in definite seasonality patterns. Because turkey is a tradition
al meat for Thanksgiving and Christmas, much greater advertising emphasis
was given to it prior to these holidays. Since some retailers began
advertising turkey for Thanksgiving and Christmas early in November and
December, all of November was used as Thanksgiving advertising and all of
December as Christmas advertising.
Newspapers were available to collect advertising and pricing data
for Salt Lake City, Ogden, and Logan over a 12-year period. Data were
available in the other selected U. S. markets only for November and
December, 1965 and 1966.
9
Most of the tables in this section have a similar format. Data are
presented for the 1955-1966 period for three Utah markets for three
within-year time periods followed in the same table by a presentation of
Thanksgiving and Christmas advertising data for the two years, 1965 and
1966, for 15 selected U. S. markets. Salt Lake City, Ogden, and Logan
were included as three of the fifteen selected U. S. markets for compari
son with these markets and also to compare the shorter, more recent with
the longer time period. Each year and market was analyzed independently,
when differences were not significant, years or markets were combined for
presentation of the data.
The newspaper ad reader kept a count of all food ads in the various
markets but when turkey appeared, detailed information was recorded for
analysis. In this study, 19,959 food ads were tabulated and 13.5 percent
or 2,690 of them offered turkey. About two-thirds of the ads offering
turkey were obtained from the three Utah markets for the 12-year period
and one-third from the other 12 markets for the 2 - year holiday period.
In the 15 markets combined, 30 percent of all newspaper food ads at
Thanksgiving listed turkey as one of the advertised items. About one
fourth of the Christmas ads included turkey (Table 1).
For the Utah markets over the 12-year period, only 6 percent of the
pre-holiday ads offered turkey compared with 40 percent at Thanksgiving
and 23 percent at Christmas. Incidence of advertising was particularly
high in Salt Lake City for Thanksgiving where 50 percent of all ads
included turkey. Even though the turkey industry has encouraged retailers
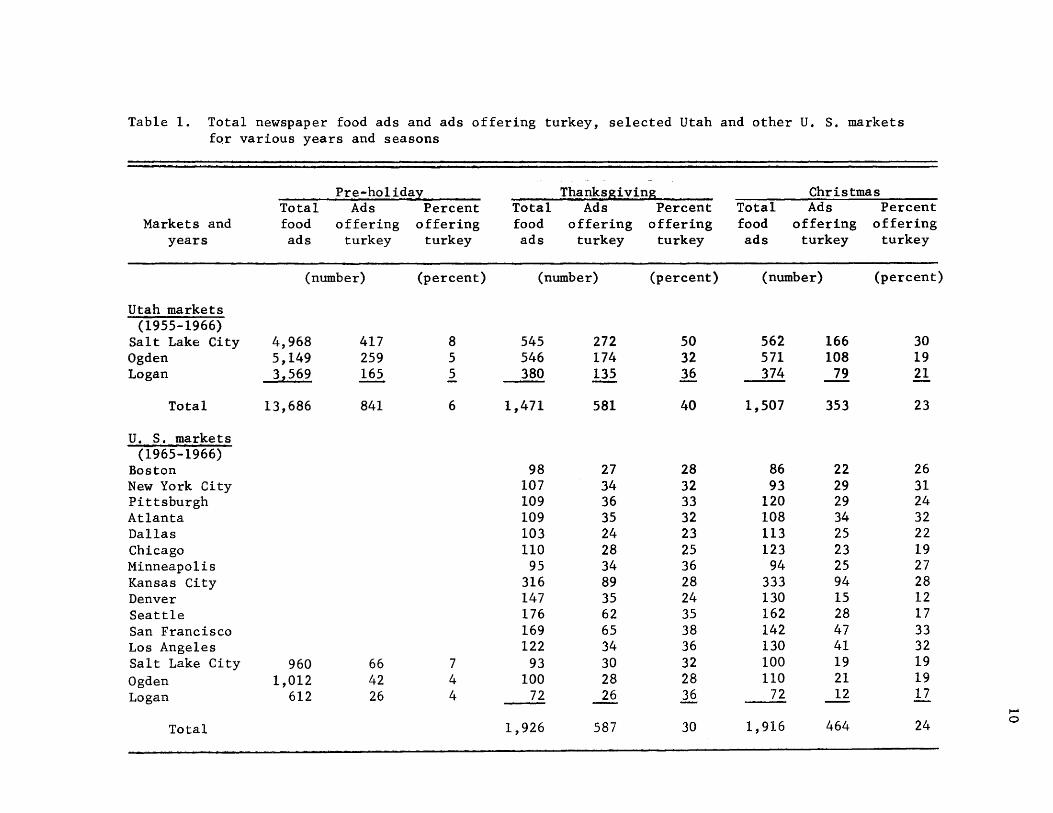
Table 1. Total newspaper food ads and ads offering turkey, selected Utah and other U. S. markets for various years and seasons
Pre-ho1ida~ Thanksgiving Christmas Total Ads Percent Total Ads Percent Total Ads Percent
Markets and food offering offering food offering offering food offering offering years ads turkey turkey ads turkey turkey ads turkey turkey
(number) (percent) (number) (percent) (number) (percent)
Utah markets (1955-1966)
Salt Lake City 4,968 417 8 545 272 50 562 166 30 Ogden 5,149 259 5 546 174 32 571 108 19 Logan 3,569 165 5 380 135 36 374 79 21
Total 13,686 841 6 1,471 581 40 1,507 353 23
U. S. markets (1965-1966)
Boston 98 27 28 86 22 26 New York City 107 34 32 93 29 31 Pittsburgh 109 36 33 120 29 24 Atlanta 109 35 32 108 34 32 Dallas 103 24 23 113 25 22 Chicago 110 28 25 123 23 19 Minneapolis 95 34 36 94 25 27 Kansas City 316 89 28 333 94 28 Denver 147 35 24 130 15 12 Seattle 176 62 35 162 28 17 San Francisco 169 65 38 142 47 33 Los Angeles 122 34 36 130 41 32 Salt Lake City 960 66 7 93 30 32 100 19 19 Ogden 1,012 42 4 100 28 28 110 21 19 Logan 612 26 4 72 26 36 72 12 17
t--'
Total 1,926 587 30 1,916 464 24 0
11
to advertise and sell turkey through the year, turkey is still advertised
and marketed on a highly seasonal basis.
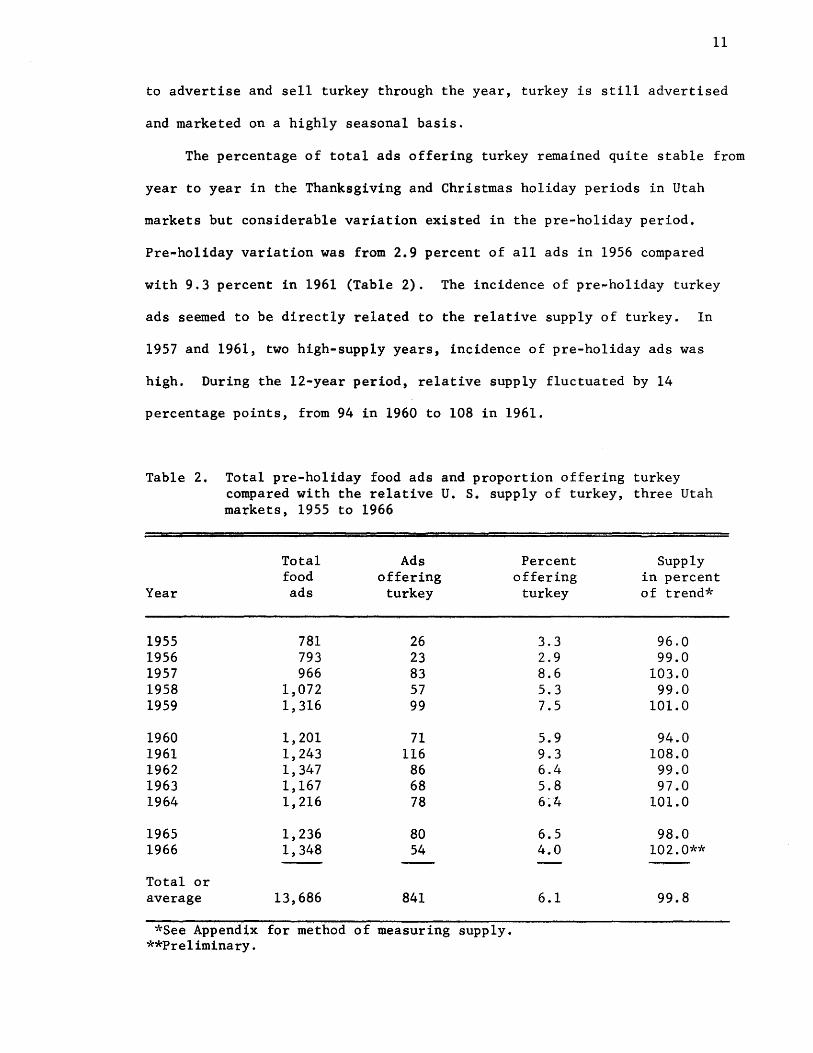
The percentage of total ads offering turkey remained quite stable from
year to year in the Thanksgiving and Christmas holiday periods in Utah
markets but considerable variation existed in the pre-holiday period.
Pre-holiday variation was from 2.9 percent of all ads in 1956 compared
with 9.3 percent in 1961 (Table 2). The incidence of pre-holiday turkey
ads seemed to be directly related to the relative supply of turkey. In
1957 and 1961, two high-supply years, incidence of pre-holiday ads was
high. During the 12-year period, relative supply fluctuated by 14
percentage points, from 94 in 1960 to 108 in 1961.
Table 2. Total pre-holiday food ads and proportion offering turkey compared with the relative U. S. supply of turkey, three Utah markets, 1955 to 1966
Year
1955 1956 1957 1958 1959
1960 1961 1962 1963 1964
1965 1966
Total or average
Total food ads
781 793 966
1,072 1,316
1,201 1,243 1,347 1,167 1,216
1,236 1,348
13,686
Ads offering
turkey
26 23 83 57 99
71 116
86 68 78
80 54
841
*See Appendix for method of measuring supply. **Pre1iminary.
Percent offering
turkey
3.3 2.9 8.6 5.3 7.5
5.9 9.3 6.4 5.8 6:4
6.5 4.0
6.1
Supply in percent of trend*
96.0 99.0
103.0 99.0
101.0
94.0 108.0
99.0 97.0
101.0
98.0 102. O*~\'
99.8
12
Total food ads in the three markets changed from year to year as the
number of retail organizations in the Utah cities changed. The number of
food ads per year increased until 1959 but has remained fairly constant
since that time.
Often when turkey appeared on the newspaper ad, there was more than
one turkey item offered due to differentiating characteristics such as
grade, sex, brand name, or price. Each different listing of turkey on an
ad is referred to in this study as an "entry."
There was an average of two entries per ad at Thanksgiving and
Christmas as compared to one entry per ad during the pre-holiday period
in the Utah markets indicating a greater degree of product differentia
tion for turkey in the holiday seasons (Table 3).
Of the 15 U. S. markets compared, only two had less than an average
of two entries per ad at Thanksgiving compared with seven markets which
averaged less than two entries per ad at Christmas. Los Angeles had 2.8
and 2.6 entries per ad at Thanksgiving and Christmas respectively. Since
each turkey item had distinct characteristics, entries were used in
presenting results in most of the pricing and advertising analyses.
Turkey as the meat feature
If turkey was the most prominent item in the meat section of the ad,
it was considered the featured meat item. In the 15 selected U. S.
markets at Thanksgiving, 90 percent of the ads offering turkey used it as
the featured meat. The emphasis on turkey as an ad feature decreased to
70 percent at Christmas (Table 4). Ads featuring turkey for Thanksgivi.ng
ranged from 97 percent in Atlanta and Los Angeles to 77 percent in Denver.
The variation at Christmas was 89 percent in Seattle, 50 percent in Logan,
and 54 percent in New York City.
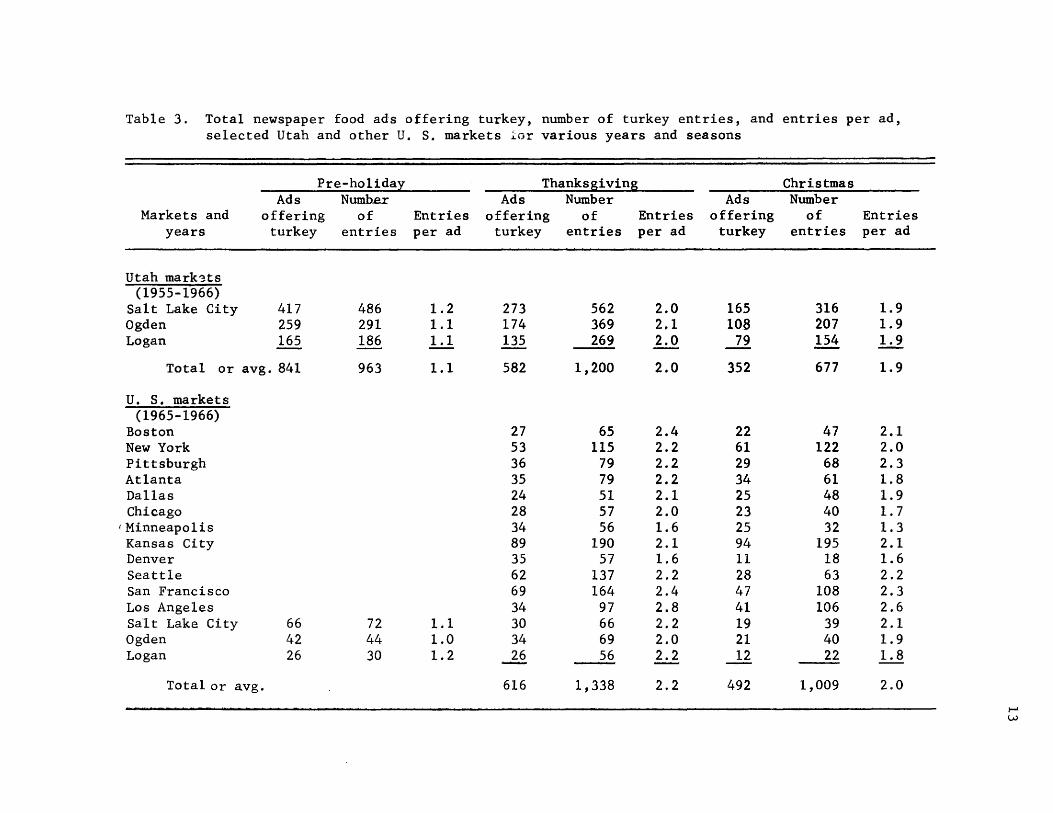
Table 3. Total newspaper food ads offering turkey, number of turkey entries, and entries per ad, selected Utah and other U. S. markets ior various years and seasons
Pre-ho1idal Thanksgiving Christmas Ads Numher Ads Number Ads Number
Markets and offering of Entries offering of Entries offering of Entries years turkey entries per ad turkey entries per ad turkey entries per ad
Utah mark~ts (1955-1966)
Salt Lake City 417 486 1.2 273 562 2.0 165 316 1.9 Ogden 259 291 1.1 174 369 2.1 108 207 1.9 Logan 165 186 1.1 135 269 2.0 ..l!l. 154 1.9
Total or avg. 841 963 1.1 582 1,200 2.0 352 677 1.9
u. S. markets (1965-1966)
Boston 27 65 2.4 22 47 2.1 New York 53 115 2.2 61 122 2.0 Pittsburgh 36 79 2.2 29 68 2.3 Atlanta 35 79 2.2 34 61 1.8 Dallas 24 51 2.1 25 48 1.9 Chicago 28 57 2.0 23 40 1.7
; Minneapolis 34 56 1.6 25 32 1.3 Kansas City 89 190 2.1 94 195 2.1 Denver 35 57 1.6 11 18 1.6 Seattle 62 137 2.2 28 63 2.2 San Francisco 69 164 2.4 47 108 2.3 Los Angeles 34 97 2.8 41 106 2.6 Salt Lake City 66 72 1.1 30 66 2.2 19 39 2.1 Ogden 42 44 1.0 34 69 2.0 21 40 1.9 Logan 26 30 1.2 26 56 2.2 12 22 1.8
Total or avg. 616 1,338 2.2 492 1,009 2.0
I-" W
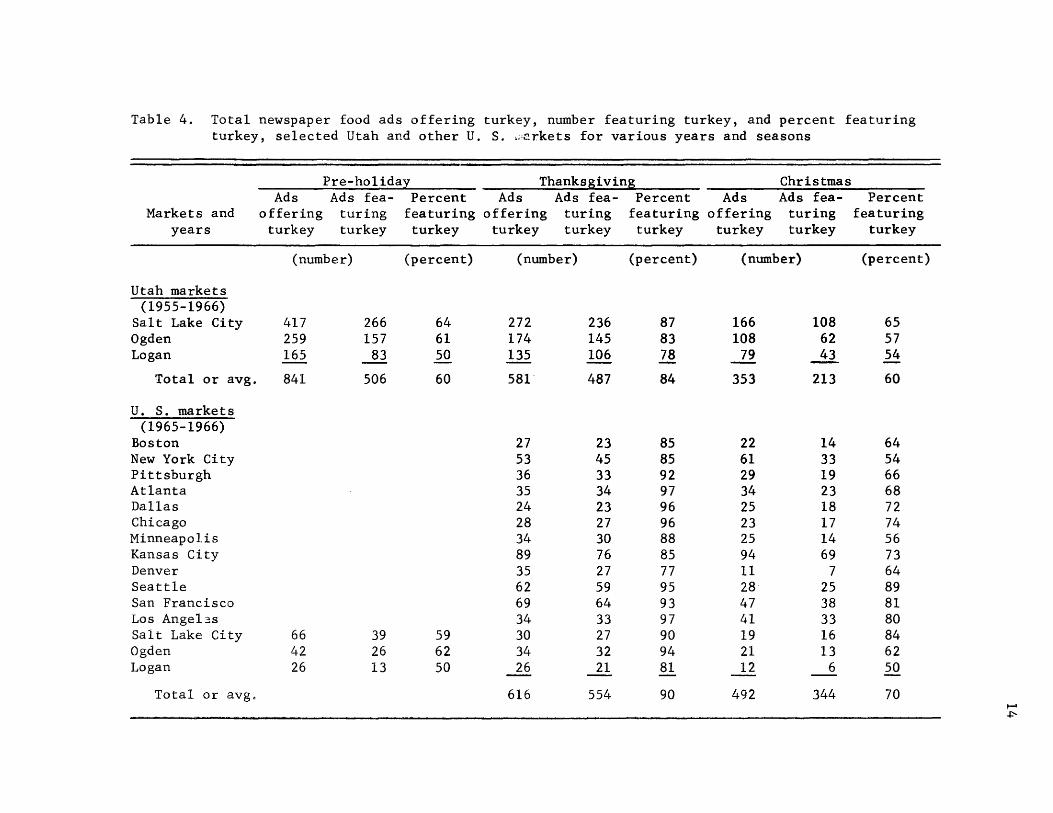
Table 4. Total newspaper food ads offering turkey, number featuring turkey, and percent featuring turkey, selected Utah and other U. S. ~erkets for various years and seasons
Pre-holiday Thanks8ivin~ Christmas Ads Ads fea- Percent Ads Ads fea- Percent Ads Ads fea- Percent
Markets and offering turing featuring offering turing featuring offering turing featuring years turkey turkey turkey turkey turkey turkey turkey turkey turkey
(number) (percent) (number) (percent) (number) (percent)
Utah markets (1955-1966)
Salt Lake City 417 266 64 272 236 87 166 108 65 Ogden 259 157 61 174 145 83 108 62 57 Logan 165 83 50 135 106 78 79 ~ 54
Total or avg. 841 506 60 581" 487 84 353 213 60
U. S. markets (1965-1966)
Boston 27 23 85 22 14 64 New York City 53 45 85 61 33 54 Pittsburgh 36 33 92 29 19 66 Atlanta 35 34 97 34 23 68 Dallas 24 23 96 25 18 72 Chicago 28 27 96 23 17 74 Minneapolis 34 30 88 25 14 56 Kansas City 89 76 85 94 69 73 Denver 35 27 77 11 7 64 Seattle 62 59 95 28 25 89 San Francisco 69 64 93 47 38 81 Los Ange13s 34 33 97 41 33 80 Salt Lake City 66 39 59 30 27 90 19 16 84 Ogden 42 26 62 34 32 94 21 13 62 Logan 26 13 50 26 21 81 12 6 50
Total or avg. 616 554 90 492 344 70 I-' .po.
15
Over the l2-year period at Thanksgiving in Utah markets, 84 percent
of the ads offering turkey us~d it as the featured meat. Sixty percent
of the pre-holiday and the Christmas ads used it as a feature.
Turkey entries as feature, subfeature, or liner
All turkey entries on the newspaper ads were classified as feature,
sub-feature, or liner items. The item was considered a feature if it had
been given greatest emphasis of any item in the meat section of the ad.
A sub-feature item was usually in large print and was given greater
emphasis than a liner item but less than the feature item.
In 15 selected U. S. markets, the percentage of turkey entries used
as a feature decreased from 42 percent at Thanksgiving to 34 percent at
Christmas. Thanksgiving turkey entries as the feature ranged from 61 per-
cent in Salt Lake City to 34 percent in Los Angeles and at Christmas from
42 percent in Minneapolis to 27 percent in New York City and Logan.
In Utah markets, 55 percent of the turkey entries were featured in
pre-holiday and 52 percent at Thanksgiving but decreased to 39 percent at
Christmas. Turkey entries were featured more frequently in Salt Lake City
than in Ogden or Logan (Table 5).
Thanksgiving turkey entries as a sub-feature averaged 31 percent for
the 15 markets and ranged from 59 percent in Los Angeles to 4 percent in
Logan. At Christmas, 37 percent of the entries were sub-feature varying
from 56 percent in Los Angeles to 7 percent in Chicago.
Turkey entries were used less frequently as liner items than as
feature or sub-feature items in the 15 markets. Twenty-six percent at
Thanksgiving and 29 percent at Christmas were liner items.
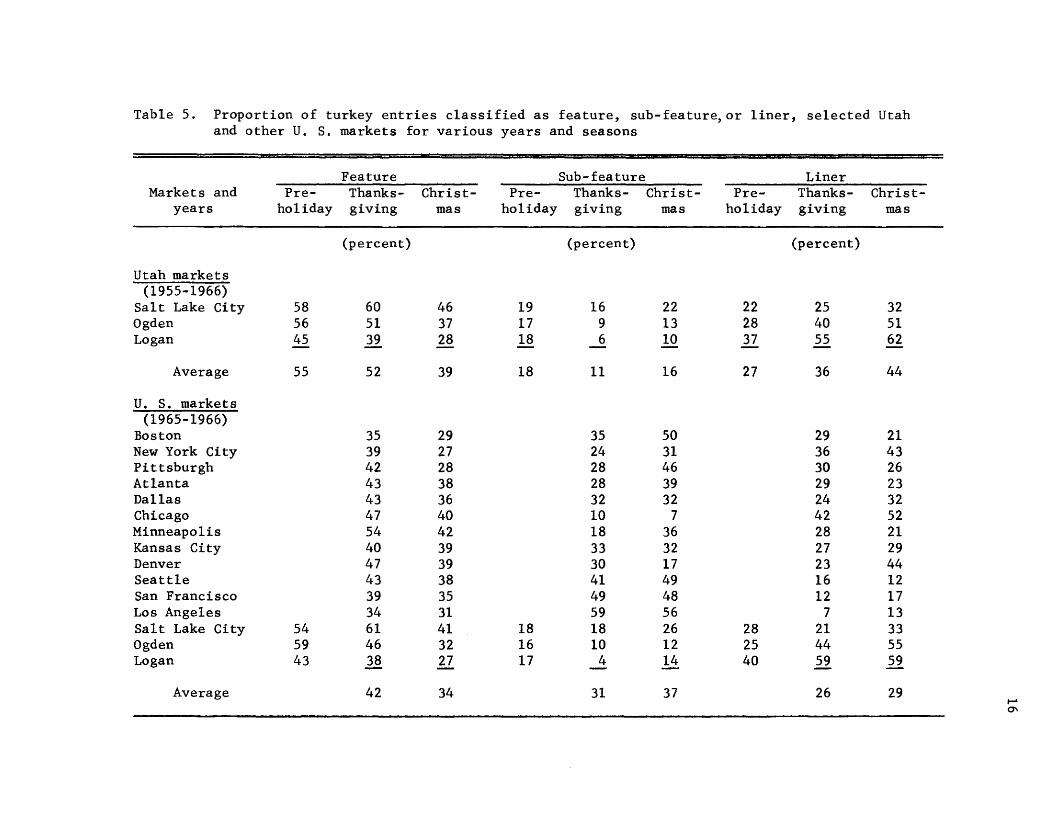
Table 5. Proportion of turkey entries classified as feature, sub-feature, or liner, selected Utah and other U. S. markets for various years and seasons
Feature Sub-feature Liner Markets and Pre- Thanks- Christ- Pre- Thanks- Christ- Pre- Thanks- Christ-
years holiday giving mas holiday giving mas holiday giving mas
(percent) (percent) (percent)
Utah markets (1955-1966)
Salt Lake City 58 60 46 19 16 22 22 25 32 Ogden 56 51 37 17 9 13 28 40 51 Logan 45 39 28 18 6 10 37 55 62
Average 55 52 39 18 11 16 27 36 44
U. S. markets (1965-1966)
Boston 35 29 35 50 29 21 New York City 39 27 24 31 36 43 Pittsburgh 42 28 28 46 30 26 Atlanta 43 38 28 39 29 23 Dallas 43 36 32 32 24 32 Chicago 47 40 10 7 42 52 Minneapolis 54 42 18 36 28 21 Kansas City 40 39 33 32 27 29 Denver 47 39 30 17 23 44 Seattle 43 38 41 49 16 12 San Francisco 39 35 49 48 12 17 Los Angeles 34 31 59 56 7 13 Salt Lake City 54 61 41 18 18 26 28 21 33 Ogden 59 46 32 16 10 12 25 44 55 Logan 43 l§. 27 17 4 14 40 59 59
Average 42 34 31 37 26 29 I-' 0\
17
In Utah markets, a greater percentage of the entries were liner than
were sub-feature items. At Thanksgiving, 36 percent were liner items and
11 percent sub-feature. At Christmas, 44 percent were liner and 16 per-
cent sub-feature.
Product-Differentiating Characteristics of Turkey Advertising
Food retailing organizations differentiate an advertised product
through grade, brand name, indication of product preparation, use of
additional descriptive terms, etc. This section presents some product
characteristics used in advertising turkey in three Utah cities for 1955
to 1966 and in selected U. S. markets for Thanksgiving and Christmas in
1965 and 1966.
Sex identification of advertised entry
When the whole turkey was advertised, it was specified as hen, tom,
or turkey. During the pre-holiday period, there was a large percentage
of turkey entries advertised without sex identification, while at
Thanksgiving and Christmas, the practice was to identify the sex. Hens
were designated more frequently than toms in the pre-holiday period which
probably means that hens were offered for sale more frequently during this
period. A reversal occurred at Thanksgiving and Christmas when toms were
designated more frequently indicating a strong demand for large birds for
the festive occasions (Table 6).
On an average for all selected U. S. markets, only about 2 percent
of the ads failed to designate turkey sex at Thanksgiving and Christmas.
In nine of the fifteen markets, 100 percent of the Thanksgiving ads
designated sex of turkey. In Boston and Salt Lake City, sex was not
designated in 8 percent of the ads.
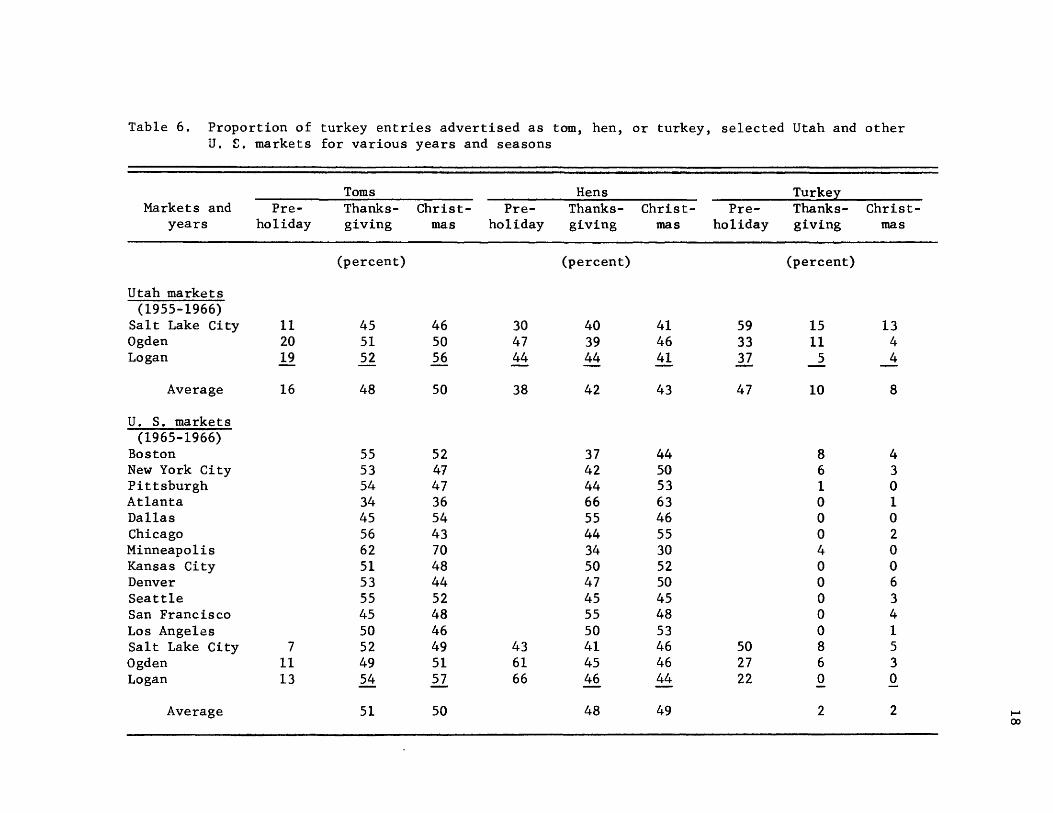
Table 6. Proportion of turkey entries advertised as tom, hen, or turkey, selected Utah and other U. ~. markets for various years and seasons
Toms Hens Turkex Markets and Pre- Thanks- Christ- Pre- Thanks- Christ- Pre- Thanks- Christ-
years holiday giving mas holiday giving mas holiday giving mas
(percent) (percent) (percent)
Utah markets (1955-1966)
Salt Lake City 11 45 46 30 40 41 59 15 13 Ogden 20 51 50 47 39 46 33 11 4 Logan 19 52 56 44 44 41 37 5 4
Average 16 48 50 38 42 43 47 10 8
U. S. markets (1965-1966)
Boston 55 52 37 44 8 4 New York City 53 47 42 50 6 3 Pittsburgh 54 47 44 53 1 0 Atlanta 34 36 66 63 0 1 Dallas 45 54 55 46 0 0 Chicago 56 43 44 55 0 2 Minneapolis 62 70 34 30 4 0 Kansas City 51 48 50 52 0 0 Denver 53 44 47 50 0 6 Seattle 55 52 45 45 0 3 San Francisco 45 48 55 48 0 4 Los Angeles 50 46 50 53 0 1 Salt Lake City 7 52 49 43 41 46 50 8 5 Ogden 11 49 51 61 45 46 27 6 3 Logan 13 54 57 66 46 44 22 0 0
Average 51 50 48 49 2 2 ..... 00
19
In Utah markets for the l2-year period, more than 90 percent of the
Thanksgiving and Christmas entries specified sex, whereas only about 50
percent of the pre-holiday entries had sex identified. In many of the
pre-holiday ads, only one sex was offered so the sex identification was
omitted from the ad. For the three within-year periods, the advertised
entry was listed without indicating sex more often in Salt Lake City than
in Ogden or Logan.
When Beltsville turkeys were advertised, the practice was to make no
sex designation. Thirteen percent of all turkey entries in the Utah
markets in the pre-holiday period were of the Beltsville variety. Very
few Beltsville turkeys were advertised in holiday seasons since the
larger turkeys were more popular for large group holiday dinners.
Turkey entry as fresh or frozen
Product differentiation can also be obtained through advertising
turkey as either fresh or frozen. With few exceptions, advertised turkey
items were identified as fresh or frozen. Frozen was used more frequently
than fresh to describe the turkey entry.
In the pre-holiday period, Utah markets had an average of 81 percent
of the turkey identified as frozen. Frozen turkey was advertised more
frequently in Logan than in Salt Lake City and Ogden.
In the 15 markets, more than 90 percent of Thanksgiving and Christmas
turkey entries specified the product as frozen. In six of the markets,
every entry was identified as frozen (Table 7).
Boston, Chicago, Los Angeles, San Francisco, Seattle, Salt Lake City,
Ogden, and Logan advertised fresh and frozen turkey for both holiday
seasons in 1965-1966. A comparison of turkey entries in these eight
cities indicated 15 percent of the Thanksgiving entries and 18 percent
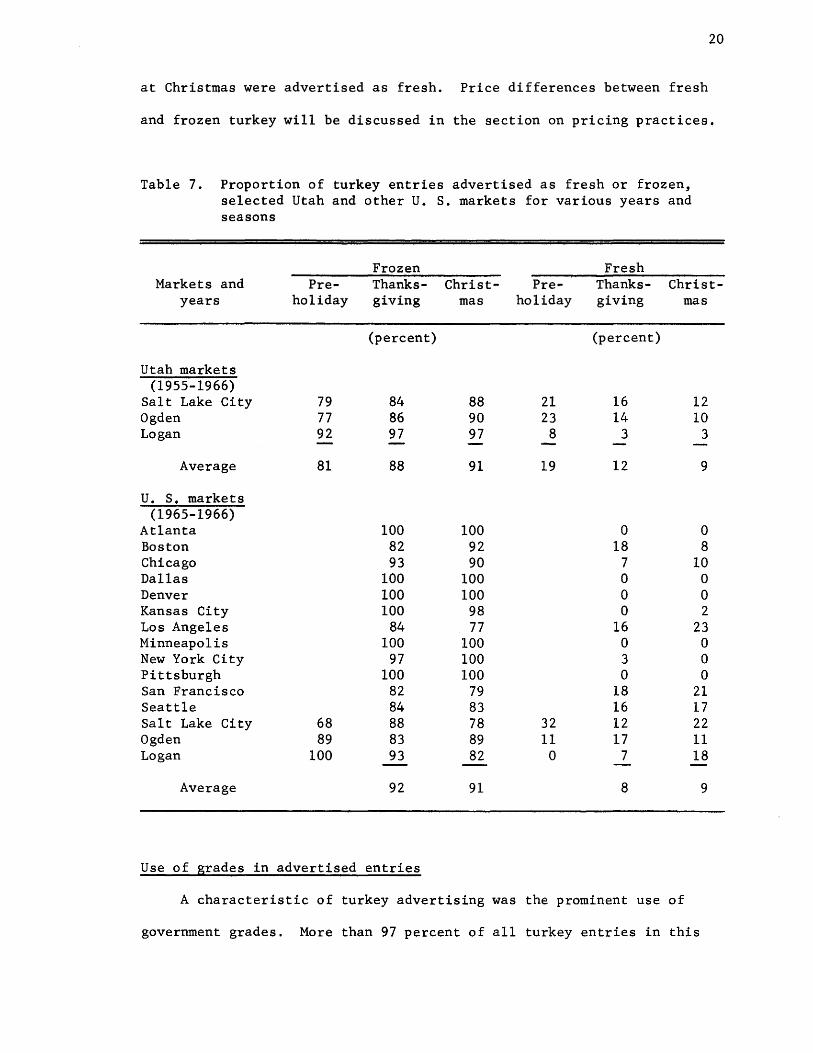
20
at Christmas were advertised as fresh. Price differences between fresh
and frozen turkey will be discussed in the section on pricing practices.
Table 7. Proportion of turkey entries advertised as fresh or frozen, selected Utah and other U. S. markets for various years and seasons
Frozen Fresh Markets and Pre- Thanks- Christ- Pre- Thanks- Christ-
years holiday giving mas holiday giving mas
(percent) (percent)
Utah markets (1955-1966)
Salt Lake City 79 84 88 21 16 12 Ogden 77 86 90 23 14 10 Logan 92 97 97 8 3 3
Average 81 88 91 19 12 9
U. S. markets (1965-1966)
Atlanta 100 100 a a Boston 82 92 18 8 Chicago 93 90 7 10 Dallas 100 100 a a Denver 100 100 a a Kansas City 100 98 a 2 Los Angeles 84 77 16 23 Minneapolis 100 100 a a New York City 97 100 3 a Pittsburgh 100 100 a a San Francisco 82 79 18 21 Seattle 84 83 16 17 Salt Lake City 68 88 78 32 12 22 Ogden 89 83 89 11 17 11 Logan 100 93 82 a 7 18
Average 92 91 8 9
Use of grades in advertised entries
A characteristic of turkey advertising was the prominent use of
government grades. More than 97 percent of all turkey entries in this
21
study indicated grade.
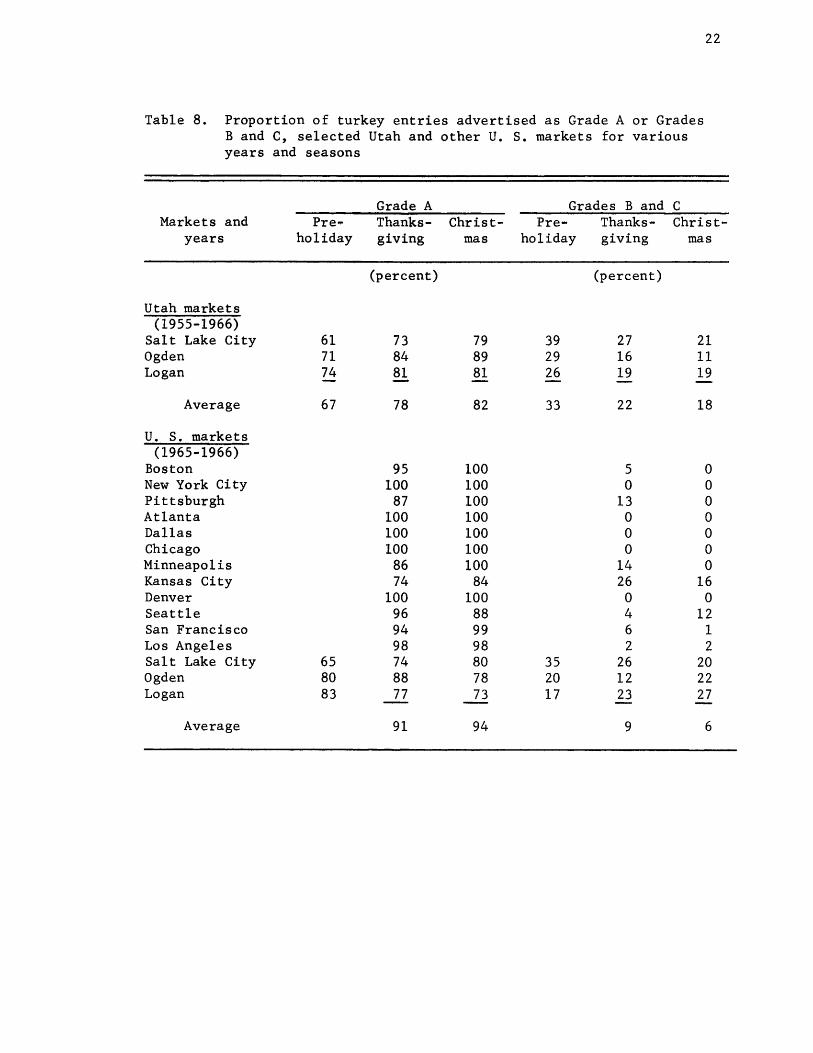
The three federal grades for turkey are A, B, and C. In the 15
selected markets, more than 90 percent of the Thanksgiving and the
Christmas turkey entries were identified as Grade A. At Thanksgiving the
incidence of Grade A ranged from 100 percent of the entries in five markets
to 74 percent in Kansas City and Salt Lake City. At Christmas Grade A
ranged from 100 percent of the entries in eight markets to 73 percent in
Logan and 78 percent in Ogden. Five markets at Thanksgiving and eight at
Christmas advertised only Grade A turkeys (Table 8).
One-third of the pre-holiday turkey entries over the l2-year period
in Utah were Band C grades. The higher percentage of Band C grades
could be that Utah is a producing area and processors could find local
merchants who would move turkeys of the lower grades. Salt Lake City had
a higher percentage of Band C grade turkeys in all three within-year
periods than Ogden or Logan.
Brand name in turkey advertising
The brand name is another product-differentiating characteristic
used in turkey advertising. To facilitate analysis in this study, brand
names were aggregated into four categories: retail store brands (A & P,
Krogers, Albertsons, etc.), Norbest brand (a national turkey marketing
cooperative with headquarters in Salt Lake City), national meat packer
brands (Armour, Swift, etc.), and local grower and processor brands. All
others were classified as "no brand."
In 15 U. S. markets, brand name was omitted in 39 percent of the
entries. Over the l2-year period in Utah markets, brand name was not
given for 50 percent of the turkey entries in the pre-holiday period and
for 39 percent at holiday seasons (Table 9).
22
Table 8. Proportion of turkey entries advertised as Grade A or Grades Band C, selected Utah and other U. S. markets for various years and seasons
Grade A Grades Band C Markets and Pre'!" Thanks- Christ- Pre- Thanks- Christ-
years holiday giving mas holiday giving mas
(percent) (percent)
Utah markets (1955-1966)
Salt Lake City 61 73 79 39 27 21 Ogden 71 84 89 29 16 11 Logan 74 81 81 26 19 19
Average 67 78 82 33 22 18
U. S. markets (1965-1966)
Boston 95 100 5 a New York City 100 100 a a Pittsburgh 87 100 13 a Atlanta 100 100 a a Dallas 100 100 a a Chicago 100 100 a a Minneapolis 86 100 14 a Kansas City 74 84 26 16 Denver 100 100 a a Seattle 96 88 4 12 San Francisco 94 99 6 1 Los Angeles 98 98 2 2 Salt Lake City 65 74 80 35 26 20 Ogden 80 88 78 20 12 22 Logan 83 77 73 17 23 27
Average 91 94 9 6
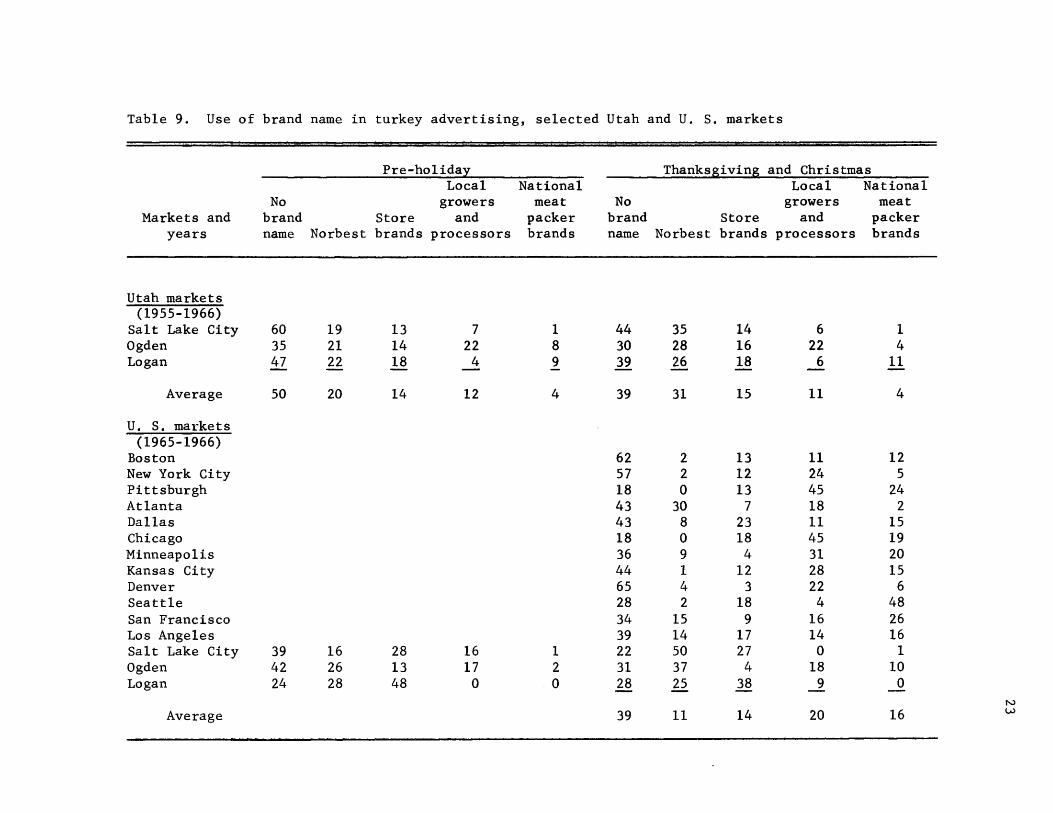
Table 9. Use of brand name in turkey advertising, selected Utah and U. S. markets
Pre-ho1idal Thankssivins and Christmas Local National Local National
No growers meat No growers meat Markets and brand Store and packer brand Store and packer
years name Norbest brands processors brands name Norbest brands processors brands
Utah markets (1955-1966)
Salt Lake City 60 19 13 7 1 44 35 14 6 1 Ogden 35 21 14 22 8 30 28 16 22 4 Logan 47 22 18 4 9 39 26 18 6 11
Average 50 20 14 12 4 39 31 15 11 4
U. S. markets (1965-1966)
Boston 62 2 13 11 12 New York City 57 2 12 24 5 Pittsburgh 18 0 13 45 24 Atlanta 43 30 7 18 2 Dallas 43 8 23 11 15 Chicago 18 0 18 45 19 Minneapolis 36 9 4 31 20 Kansas City 44 1 12 28 15 Denver 65 4 3 22 6 Seattle 28 2 18 4 48 San Francisco 34 15 9 16 26 Los Angeles 39 14 17 14 16 Salt Lake City 39 16 28 16 1 22 50 27 0 1 Ogden 42 26 13 17 2 31 37 4 18 10 Logan 24 28 48 0 0 28 25 38 9 0
N
Average 39 11 14 20 16 w
Retail store brands were used in 14 percent of the entries in all
15 markets. This ranged from 3 percent in Denver to 27 percent in
24
Salt Lake City and 38 percent in Logan. Store brands accounted for 14
percent of the pre-holiday entries in Utah markets and 15 percent in the
holiday seasons.
The Norbest brand was specified in 11 percent of the entries in the
selected U. S. markets. This ranged from none in Pittsburgh and Chicago
to 30 percent in Atlanta, 37 percent in Ogden, and 50 percent in Salt Lake
City. In holiday seasons, Norbest brand was specified in 31 percent of
the Utah entries over the l2-year period compared with 11 percent in all
selected U. S. markets in 1965-1966. In Salt Lake City, the use of this
brand name averaged 35 percent in the l2-year period and 50 percent in
1956-1966 indicating an increase in recent years. In the pre-holiday
period, Norbest was identified in 20 percent of the Utah entries.
National meat packer brands of turkey were advertised in 16 percent
of the entries in the 15 markets. The use of these brands was most
prominent in Seattle with 48 percent compared to none in Logan and 1 percent
in Salt Lake City. Four percent of the holiday entries in Utah markets
over the l2-year period were national meat packer brands, which was much
lower than the 16 percent average in the 15 markets.
Twenty percent of the brand names in the selected markets were of
local growers and processors. This ranged from 45 percent in Chicago and
Pittsburgh to none in Salt Lake City and 4 percent in Seattle. In Utah,
the use of the local grower or processor brand name was much higher in
Ogden than in Salt Lake City or Logan over the l2-year period. This could
be the result of an aggressive local processor in the Ogden area who has
been successful in marketing turkey close to home.
25
In Utah markets, the use of store brands, local grower and processor
brands, and national meat packer brands was similar in pre-holiday and
holiday seasons.
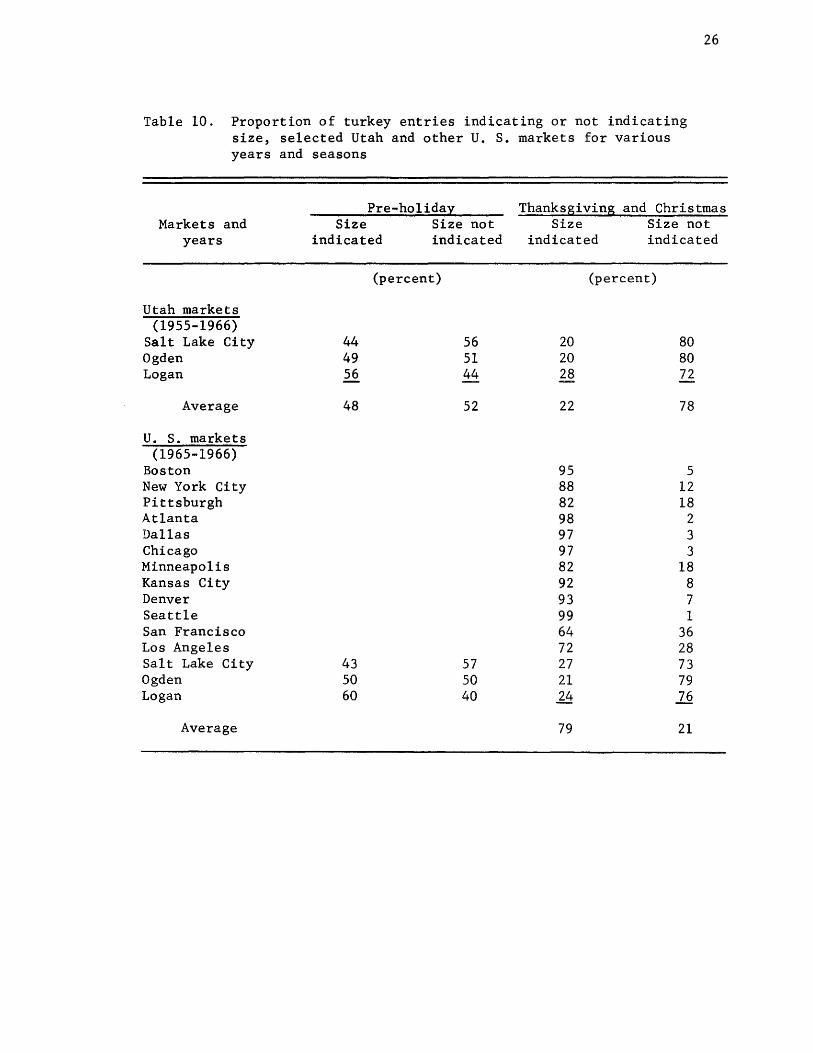
Indication of turkey size in advertising
Although always advertised and sold on a per pound basis, the size
range of turkeys was frequently included in the ad. In 15 selected
U. S. markets, 79 percent of the entries indicated turkey size. In direct
contrast, 78 percent of the entries in Utah did not specify turkey size
(Table 10).
The advertising of size in turkey ads was qUite prevalent except in
the Utah markets. In the Utah markets during the pre-holiday period,
48 percent specified turkey size compared to 22 percent in holiday seasons.
Use of additional descriptive terms
Retailers used additional descriptive terms to differentiate turkey.
Oven-ready, tender, plump, and Beltsville--a turkey variety--were the four
most frequently used terms. In the 15 markets, 13 percent of the entries
specified over-ready compared to 7 percent tender and 6 percent plump.
Beltsville was a descriptive term used more in the pre-holiday period
than in holiday seasons. Thirteen percent of the entries in the Utah
markets for the pre-holiday period were described as Beltsville compared
to 2 percent in the holiday seasons (Table 11).
In the 15 markets, 73 percent of the ad entries did not use additional
descriptive terms. This ranged from 94 percent in Dallas to 40 percent in
Boston. In the pre-holiday period, 55 percent of the Utah entries did
not have additional descriptive terms.
26
Table 10. Proportion of turkey entries indicating or not indicating size, selected Utah and other U. S. markets for various years and seasons
Markets and years
Utah markets (1955-1966)
Salt Lake City Ogden Logan
Average
U. S. markets (1965-1966)
Boston New York City Pittsburgh Atlanta Dallas Chicago Minneapolis Kansas City Denver Seattle San Francisco Los Angeles Salt Lake City Ogden Logan
Average
Pre-holiday Size
indicated Size not indicated
(percent)
44 49 56
48
43 50 60
56 51 44
52
57 50 40
Thanksgiving and Christmas Size Size not
indicated indicated
20 20 28
22
95 88 82 98 97 97 82 92 93 99 64 72 27 21 24
79
(percent)
80 80 72
78
5 12 18
2 3 3
18 8 7 1
36 28 73 79 76
21
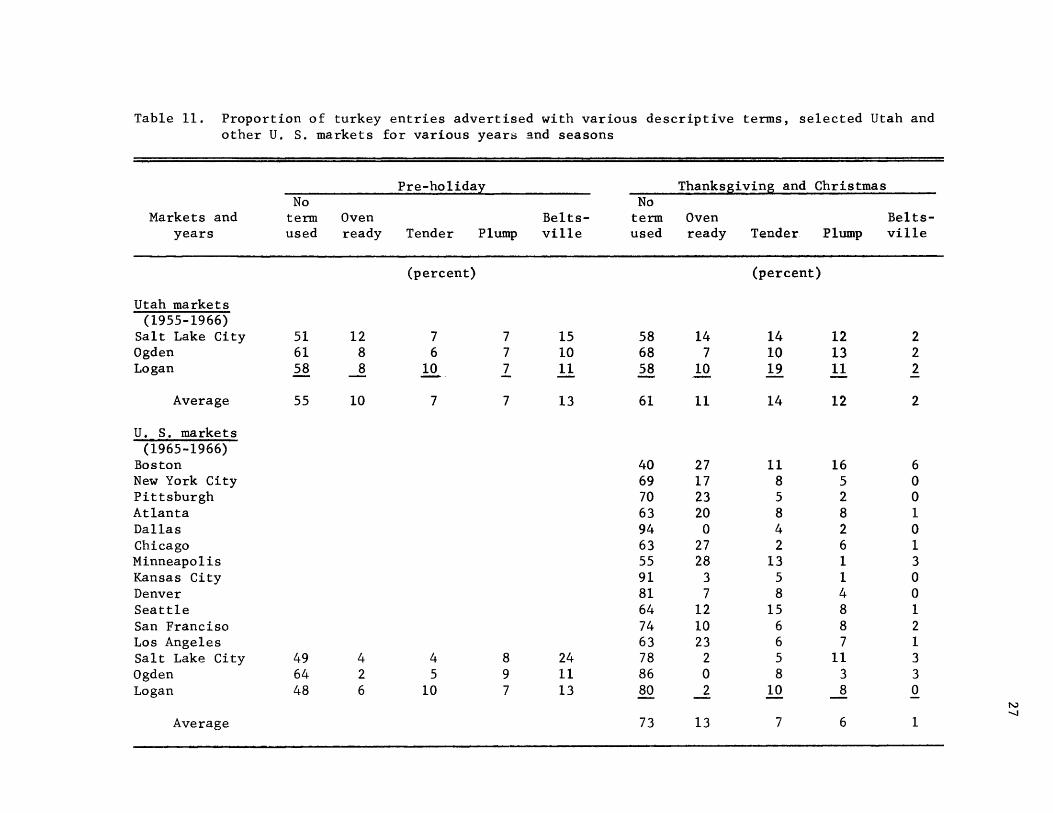
Table 11. Proportion of turkey entries advertised with various descriptive terms, selected Utah and other U. S. markets for various years and seasons
Pre-holiday Thanksgiving and Christmas No No
Markets and term Oven Be1ts- term Oven Be1ts-years used ready Tender Plump ville used ready Te.nder Plump ville
(percent) (percent)
Utah markets (1955-1966)
Salt Lake City 51 12 7 7 15 58 14 14 12 2 Ogden 61 8 6 7 10 68 7 10 13 2 Logan 58 8 ~ 7 11 58 10 19 11 2
Average 55 10 7 7 13 61 11 14 12 2
u. S. markets (1965-1966)
Boston 40 27 11 16 6 New York City 69 17 8 5 0 Pittsburgh 70 23 5 2 0 Atlanta 63 20 8 8 1 Dallas 94 0 4 2 0 Chicago 63 27 2 6 1 Minneapolis 55 28 13 1 3 Kansas City 91 3 5 1 0 Denver 81 7 8 4 0 Seattle 64 12 15 8 1 San Franciso 74 10 6 8 2 Los Angeles 63 23 6 7 1 Salt Lake City 49 4 4 8 24 78 2 5 11 3 Ogden 64 2 5 9 11 86 0 8 3 3 Logan 48 6 10 7 13 80 2 10 8 0
f-.J -.....J
Average 73 13 7 6 1
Meaty, barbeque, fryer, broad brested, and local were other terms
infrequently used.
Simultaneous Turkey Advertising by Food Retailing Organizations
28
Items are selected and advertised at special prices for the purpose
of attracting customers to shop that particular store or food chain.
Before Thanksgiving and Christmas and at times in the pre-holiday period,
turkey was used as an advertised special. If several food retailing
organizations in a market simultaneously chose to use turkey as an
advertised special, it would lose some impact in attracting customers.
Simultaneous advertising refers to the number of retailing organiza-
tions advertising turkey the week prior to each holiday. In the pre-
holiday period, the only concentration of simultaneous advertising was in
the week prior to Easter.
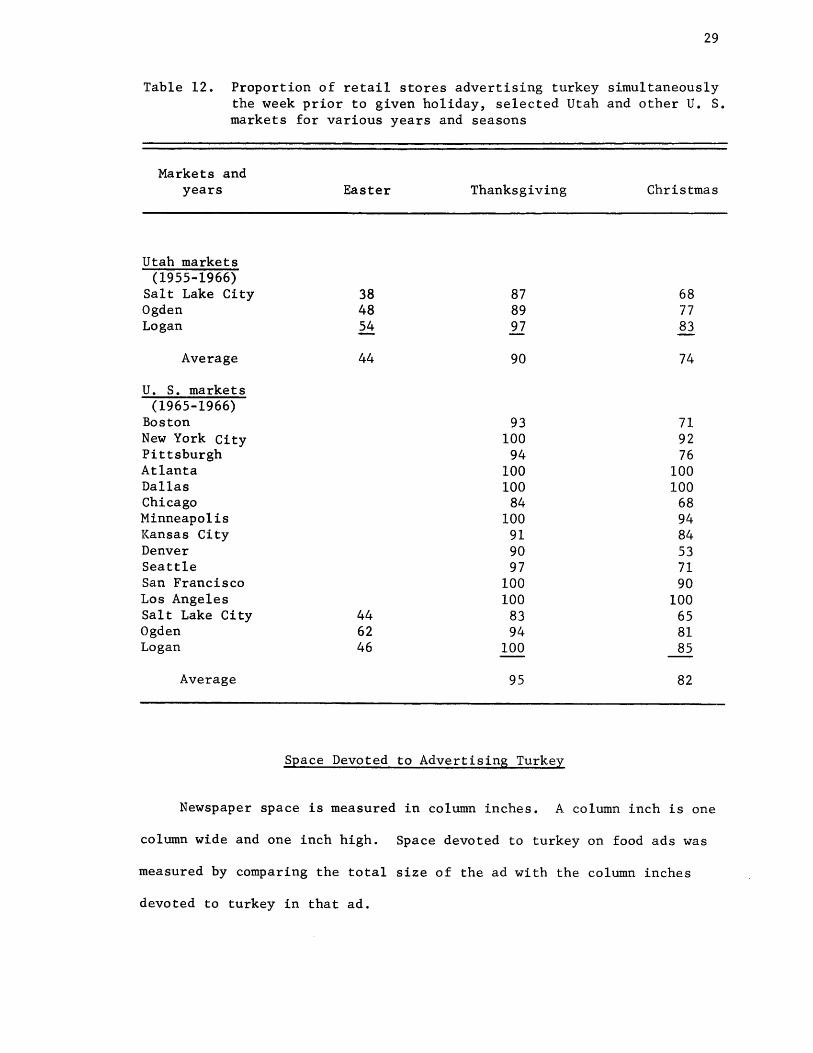
In 15 selected U. S. markets at Thanksgiving, 95 percent of the
stores advertised turkey simultaneously. This ranged from 100 percent in
seven markets to 83 percent in Salt Lake City and 83 percent in Chicago.
At Christmas, the percentage decreased to 82 percent for all markets and
varied from 100 percent in three markets, 53 percent in Denver, and 65
percent in Salt Lake City (Table 12).
In Utah markets over the l2-year period, 90 percent of the stores
advertised turkey simultaneously at Thanksgiving compared with 74 percent
at Christmas and 44 percent at Easter. In all three within-year periods,
the percent of simultaneous advertising was lower in Salt Lake City than
in Ogden or Logan.
29
Table 12. Proportion of retail stores advertising turkey simultaneously the week prior to given holiday, selected Utah and other U. S. markets for various years and seasons
Markets and years
Utah markets (1955-1966)
Salt Lake City Ogden Logan
Average
U. S. markets (1965-1966)
Boston New York City Pittsburgh Atlanta Dallas Chicago Minneapolis Kansas City Denver Seattle San Francisco Los Angeles Salt Lake City Ogden Logan
Average
Easter Thanksgiving Christmas
38 87 68 48 89 77 54 97 83
44 90 74
93 71. 100 92
94 76 100 100 100 100
84 68 100 94
91 84 90 53 97 71
100 90 100 100
44 83 65 62 94 81 46 100 85
95 82
Space Devoted to Advertising Turkey
Newspaper space is measured in column inches. A column inch is one
column wide and one inch high. Space devoted to turkey on food ads was
measured by comparing the total size of the ad with the column inches
devoted to turkey in that ad.
30
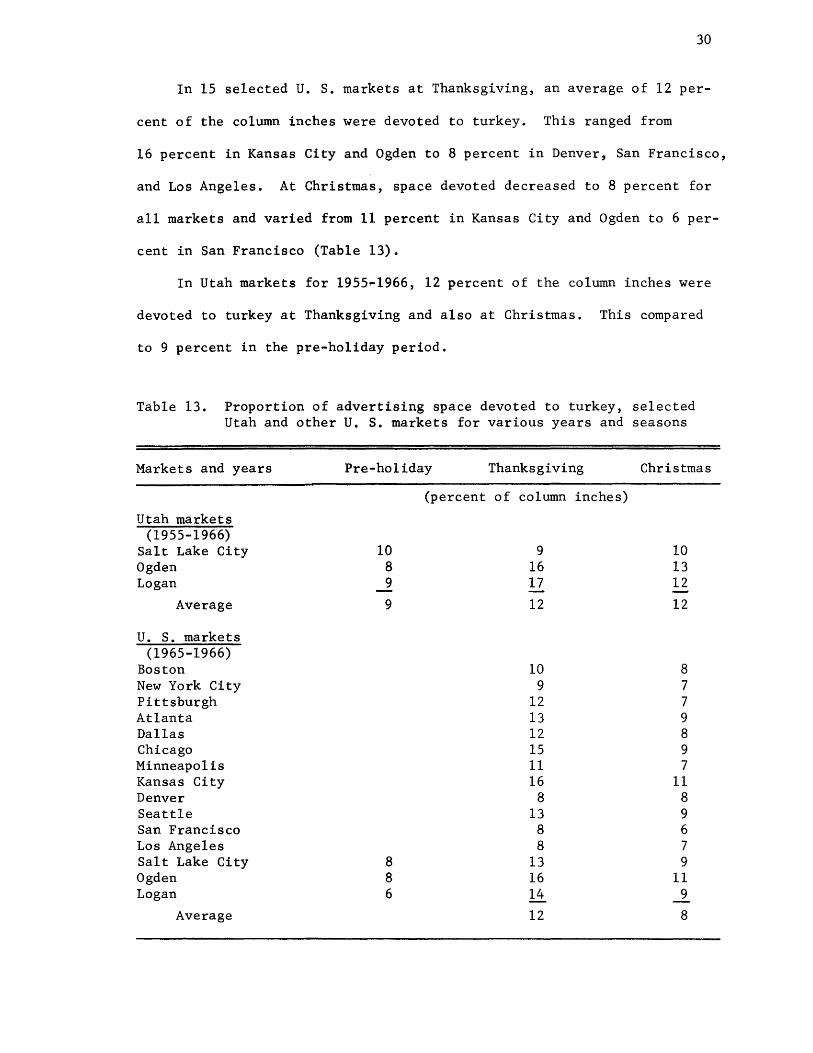
In 15 selected U. S. markets at Thanksgiving, an average of 12 per-
cent of the column inches were devoted to turkey. This ranged from
16 percent in Kansas City and Ogden to 8 percent in Denver, San Francisco,
and Los Angeles. At Christmas, space devoted decreased to 8 percent for
all markets and varied from 11 percent in Kansas City and Ogden to 6 per-
cent in San Francisco (Table 13).
In Utah markets for 1955~1966, 12 percent of the column inches were
devoted to turkey at Thanksgiving and also at Christmas. This compared
to 9 percent in the pre-holiday period.
Table 13. Proportion of advertising space devoted to turkey, selected Utah and other U. S. markets for various years and seasons
Markets and years
Utah markets (1955-1966)
Salt Lake City Ogden Logan
Average
U. S. markets (1965-1966)
Boston New York City Pittsburgh Atlanta Dallas Chicago Minneapolis Kansas City Denver Seattle San Francisco Los Angeles Salt Lake City Ogden Logan
Average
Pre-holiday Thanksgiving
(percent of column inches)
10 8 9
9
8 8 6
9 16 17
12
10 9
12 13 12 15 11 16
8 13
8 8
13 16 14
12
Christmas
10 13 12
12
8 7 7 9 8 9 7
11 8 9 6 7 9
11 9
8
RETAIL PRICING PRACTICES FOR TURKEY
According to the economic law of demand, the quantity of any product
taken by consumers varies inversely with the price of that product. Thus
pricing and mark-up practices of both wholesalers and retailers with
respect to turkey have an influence on the size of the industry. The
pricing decisions at the retail level as well as the advertising attention
given turkey is important to producers and processors. Just as variations
exist in the amount of retail advertising attention given turkey, so do
wholesale and retail pricing variations exist in different markets and
over time.
This section contains a discussion of wholesale, retail, and adver
tised special prices. It is concerned with marketing margins, identical
pricing of turkey, price differences for fresh or frozen turkey, and
seasonality of turkey sales by two major Salt Lake City food chains.
Wholesale Price for Turkey
The Urner-Barry price quotation for the New York market provides a
guide for the wholesale pricing of turkeys in the United States. This
quotation was used in this study because of its preference by the turkey
industry. It is realized that a price quotation is used by the trade as
a point from which negotiations are made by buyers and sellers and that
actual transactions do not always correspond to the quotation.
According to the management of Norbest Turkey Growers, Inc., a
producers' cooperative with headquarters in Salt Lake City, the prices
at which their turkey sales take place fluctuates both above and below
32
the Urner-Barry quotation. Rarely do the deviations exceed one-half cent
per pound either above or below.
In a Wisconsin study, comparing the acceptance of the Urner-Barry
report with daily United States Department of Agriculture quotations,
most of the processors interviewed preferred the Urner-Barry report. On
days when there was a difference, turkey processors were inclined to accept
the Urner-Barry quotation (5).
The use of this quotation to represent wholesale price makes no
allowance for deviations above or below the quotation, but from all
indications it is representative of the level of turkey prices in the
various markets and time periods studied. Daily price quotations for
hens and toms were averaged into a weekly quotation for each sex. For
weeks when turkey was offered at advertised special prices, each entry
was matched with the wholesale quotation for that week in order to es
tablish a marketing margin.
The Urner-Barry quotations, adjusted for transfer costs from New York,
were used to establish the prices paid by retailers in the various years
and markets. The wholesale price among the 15 markets varied from the
New York quotation to levels as much as 2 cents per pound below the
New York price.
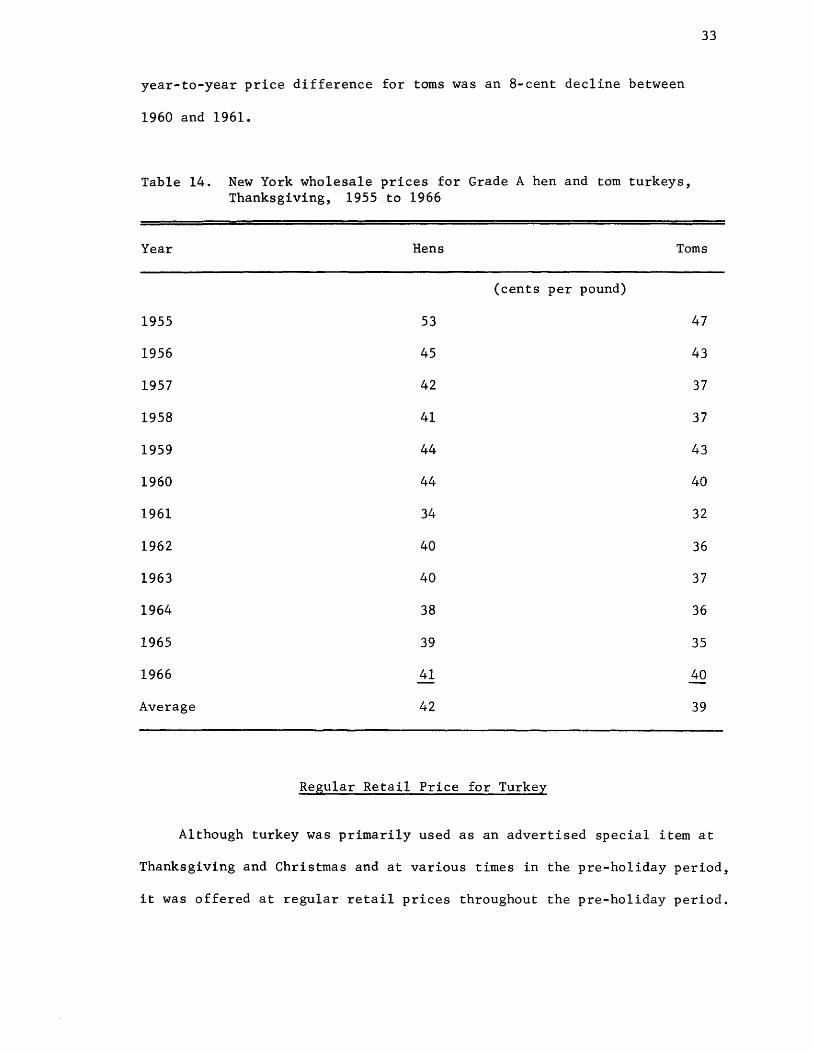
At Thanksgiving, wholesale price levels for hens in the New York
market ranged from 53 cents per pound in 1955 to 34 cents in 1961
(Table 14). The greatest difference in prices between years was a 10-cent
per pound decline for hens from 1960 to 1961. Between the same years,
supply in percent of trend increased 14 percentage points. Price levels
for toms varied from 47 cents in 1955 to 32 cents in 1961. The greatest
33
year-to-year price difference for toms was an 8-cent decline between
1960 and 1961.
Table 14. New York wholesale prices for Grade A hen and tom turkeys, Thanksgiving, 1955 to 1966
Year Hens Toms
(cents per pound)
1955 53 47
1956 45 43
1957 42 37
1958 41 37
1959 44 43
1960 44 40
1961 34 32
1962 40 36
1963 40 37
1964 38 36
1965 39 35
1966 41 40
Average 42 39
Regular Retail Price for Turkey
Although turkey was primarily used as an advertised special item at
Thanksgiving and Christmas and at various times in the pre-holiday period,
it was offered at regular retail prices throughout the pre-holiday period.
34
The only regular retail price data available for this study were for the
Salt Lake City market for 1960 to 1966. Retail prices for several
competing retailing groups were obtained from a weekly retail price guide.
No regular retail prices were reported at Thanksgiving and Christmas
since turkey was offered extensively in these periods as an advertised
special item. During these holiday periods, turkey was usually available
in stores at the special price even in weeks or parts of the week when the
newspaper ad was not in effect.
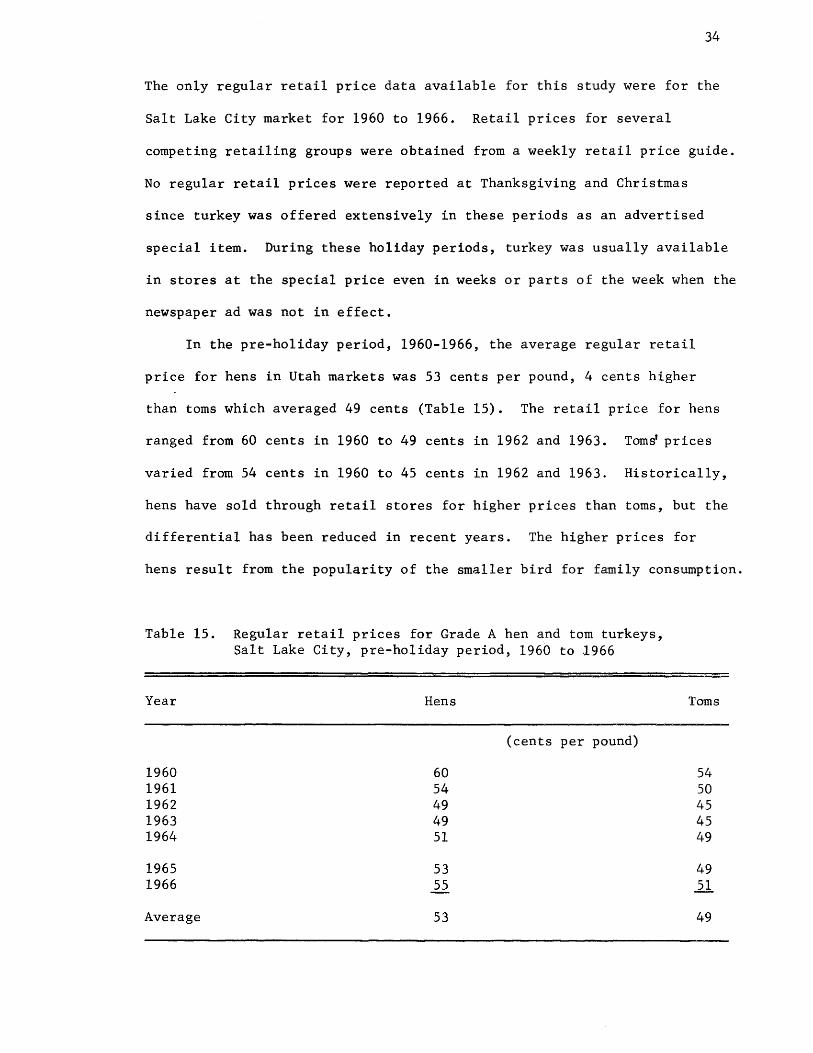
In the pre-holiday period, 1960-1966, the average regular retail
price for hens in Utah markets was 53 cents per pound, 4 cents higher
than toms which averaged 49 cents (Table 15). The retail price for hens
ranged from 60 cents in 1960 to 49 cents in 1962 and 1963. Torng prices
varied from 54 cents in 1960 to 45 cents in 1962 and 1963. Historically,
hens have sold through retail stores for higher prices than toms, but the
differential has been reduced in recent years. The higher prices for
hens result from the popularity of the smaller bird for family consumption.
Table 15. Regular retail prices for Grade A hen and torn turkeys, Salt Lake City, pre-holiday period, 1960 to 1966
Year Hens
(cents per pound)
1960 60 1961 54 1962 49 1963 49 1964 51
1965 53 1966 55
Average 53
Toms
54 50 45 45 49
49 21
49
35
Advertised Special Price for Turkey
Because of the traditional nature of turkey as a festive food,
virtually all stores advertised turkey at special prices at Thanksgiving
and Christmas. It was also used as an advertised special in the pre
holiday period. The advertised special prices were obtained for this
study from newspapers in the various markets.
The most representative measure of central tendency in expressing
advertised price levels and the one used in this study was the mode.
The mode was used because of the skewed distribution of the advertised
price variations. For most years or markets in this study, the mode
included 50 to 80 percent of all observations. There was a tendency for
a large percentage of variation in prices to all occur above or all fall
below the mode. Only rarely were the observed prices distributed in a
normal manner. An illustration of advertised retail price and wholesale
price levels dispersion will be shown in the margins section of this study.
Following World War II there was a practice to advertise hen turkeys
at prices as much as 10 cents per pound higher than toms. With the
increasing institutional use of large size toms, the difference in hen and
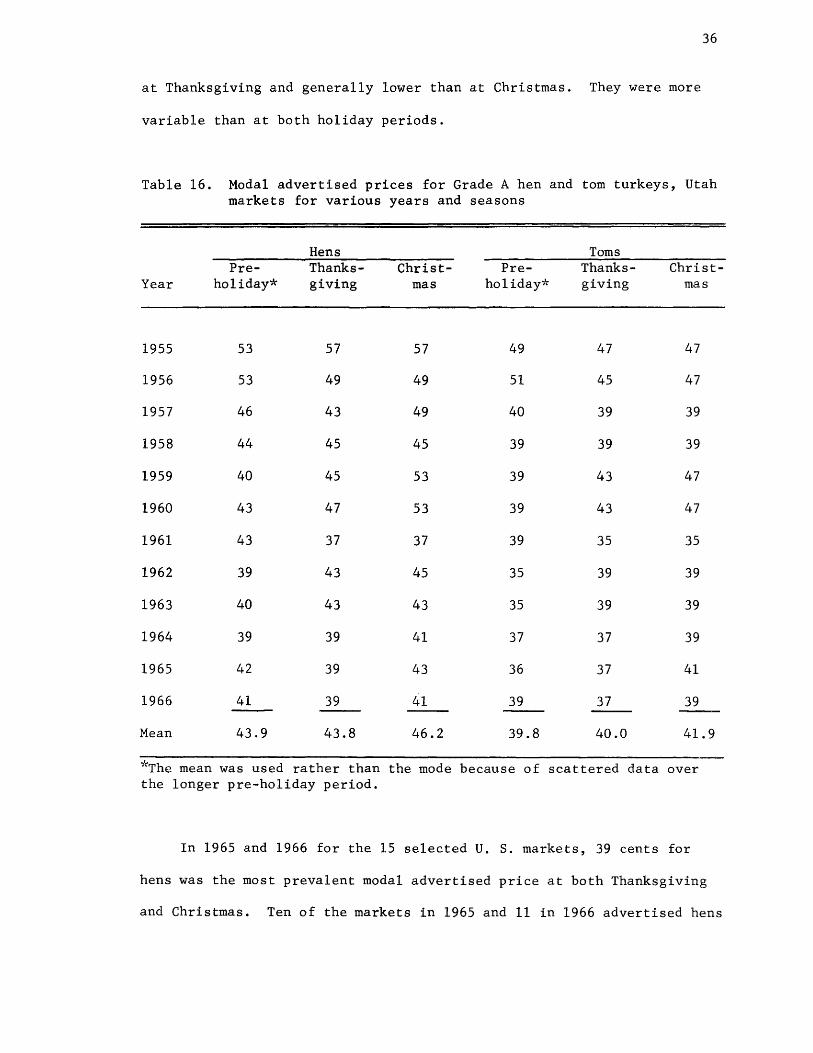
tom prices has narrowed. In 1964, 1965, and 1966, the modal advertised
price for hens was only 2 cents higher than for toms at Thanksgiving and
Christmas (Table 16).
Over the l2-year period in Utah markets, the advertised hen prices
ranged from 57 to 37 cents and tom prices varied from 51 to 35 cents. In
1961, the largest relative supply year for turkeys, modal prices reached
their lowest level--37 cents for hens and 35 cents for toms. Advertised
special prices in the pre-holiday season were at about the same level as
36
at Thanksgiving and generally lower than at Christmas. They were more
variable than at both holiday periods.
Table 16. Modal advertised prices for Grade A hen and tom turkeys, Utah markets for various years and seasons
Year
1955
1956
1957
1958
1959
1960
1961
1962
1963
1964
1965
1966
Mean
Preho1iday*
53
53
46
44
40
43
43
39
40
39
42
41
43.9
Hens Thanksgiving
57
49
43
45
45
47
37
43
43
39
39
39
43.8
"i'c'The mean was used rather than the longer pre-holiday period.
Christmas
57
49
49
45
53
53
37
45
43
41
43
41
46.2
the mode
Preho1idaY"i'c'
49
51
40
39
39
39
39
35
35
37
36
39
39.8
because of
Toms Thanksgiving
47
45
39
39
43
43
35
39
39
37
37
37 ---40.0
scattered data
Christmas
47
47
39
39
47
47
35
39
39
39
41
39
41.9
over
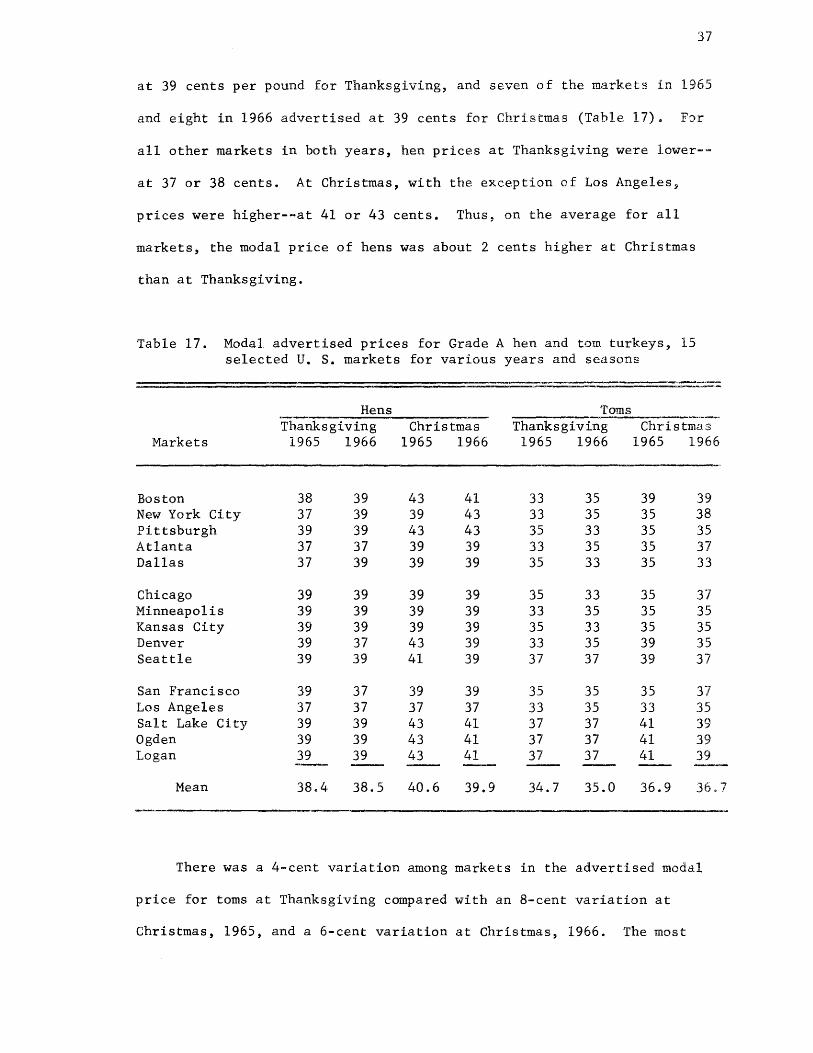
In 1965 and 1966 for the 15 selected U. S. markets, 39 cents for
hens was the most prevalent modal advertised price at both Thanksgiving
and Christmas. Ten of the markets in 1965 and 11 in 1966 advertised hens
37
at 39 cents per pound for Thanksgiving, and seven of the markets in 1965
and eight in 1966 advertised at 39 cents for Christmas (Table 17). For
all other markets in both years, hen prices at Thanksgiving were lower-=
at 37 or 38 cents. At Christmas, with the exception of Los Angeles~
prices were higher--at 41 or 43 cents. Thus, on the average for all
markets, the modal price of hens was about 2 cents higher at Christmas
than at Thanksgiving.
Table 17. Modal advertised prices for Grade A hen and tom turkeys, 15 selected U. S. markets for various years and seasons
Hens Toms
Markets Thanksgiving
1965 1966 Christmas
1965 1966 Thanksgiving
1965 1966 Christmas
1965 1966
Boston 38 39 43 41 33 35 39 39 New York City 37 39 39 43 33 35 35 38 Pittsburgh 39 39 43 43 35 33 35 35 Atlanta 37 37 39 39 33 35 35 37 Dallas 37 39 39 39 35 33 35 33
Chicago 39 39 39 39 35 33 35 37 Minneapolis 39 39 39 39 33 35 35 35 Kansas City 39 39 39 39 35 33 35 35 Denver 39 37 43 39 33 35 39 35 Seattle 39 39 41 39 37 37 39 37
San Francisco 39 37 39 39 35 35 35 37 Los Angeles 37 37 37 37 33 35 33 35 Salt Lake City 39 39 43 41 37 37 41 39 Ogden 39 39 43 41 37 37 41 39 Logan 39 39 43 41 37 37 41 39
Mean 38.4 38.5 40.6 39.9 34.7 35.0 36.9 36.7
There was a 4-cent variation among markets in the advertised modal
price for toms at Thanksgiving compared with an 8-cent variation at
Christmas, 1965, and a 6-cent variation at Christmas, 1966. The most
38
frequent modal price for toms was 33 or 35 cents for both holidays in
both years, but on the average, prices at Christmas were about 2 cents
higher than at Thanksgiving. Among markets, there was a greater variation
in the modal advertised price for toms than for hens. Tom prices were
also more variable at Christmas than at Thanksgi.ving.
"Odd-Cent" Pricing of Turkey
When advertising turkey, "odd-cent" pricing was used almost exclusi.ve·=
ly in all years and markets observed. In 15 markets, 94 percent of all
advertised turkey prices were "odd-cent" priced. In Utah. markets for the
pre-holiday period, 99 percent of the entries were "odd-cent1i pri.ced
compared with 97 percent at Thanksgiving and 94 at Christmas. The Boston
price for hens at Thanksgiving, 1965, and the New York City price for
toms at Christmas, 1966, of 38 cents were the only "even-cent" modal
prices in the 15 markets for both holiday seasons.
Price Differences for Fresh and Frozen Turkey
With few exceptions, turkey was advertised as fresh or frozen. In
most markets where both fresh and frozen were offered~ fresh was adver~
tised at higher prices. Eight of the markets studied advertised fresh
turkey at both Thanksgiving and Christmas, 1965-1966.
Price premiums for fresh over frozen hens ranged from 10 cents in
Boston, Chicago, and Seattle to no difference in Salt Lake City, and for
toms the premium ranged from 11 cents in Boston to no di.fference in
Salt Lake City. Salt Lake City was the only city where fresh and frozen
turkey was advertised at the same price (Table 18).
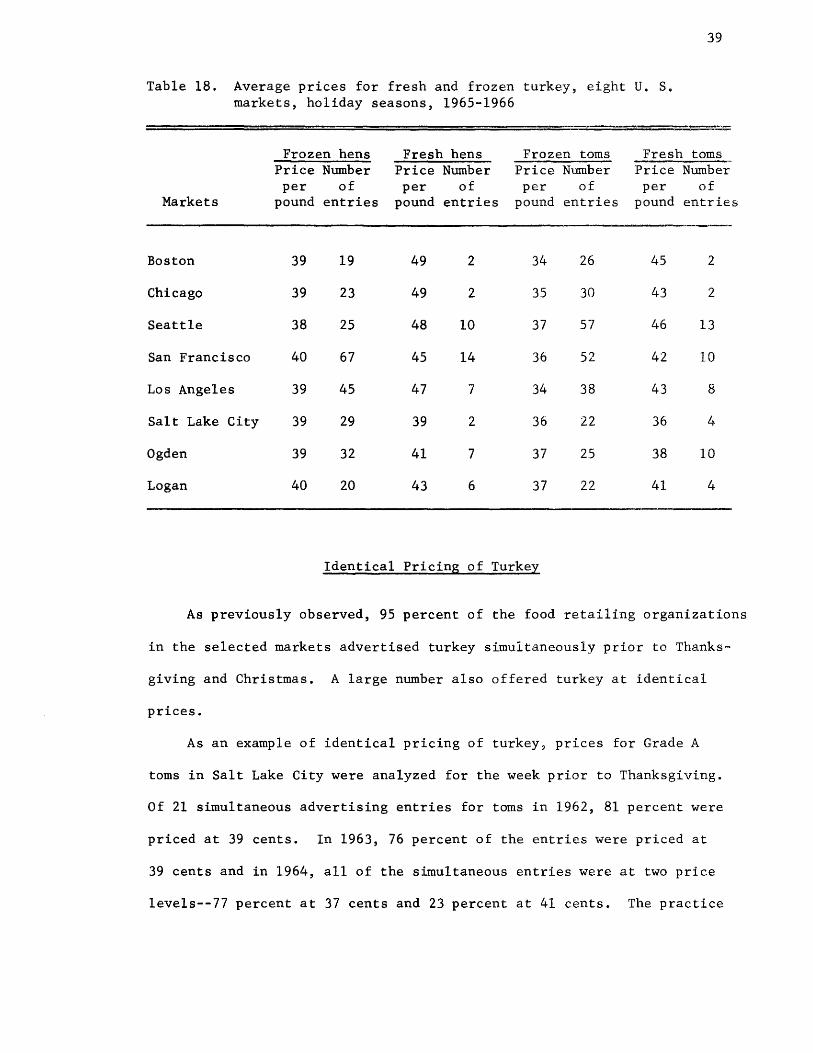
Table 18. Average prices for fresh and frozen turkey, eight U. S. markets, holiday seasons, 1965-1966
39
Frozen hens Fresh hens Frozen toms Fresh toms Price Number Price Number Price Number Price Number per of per of per of per of
Markets pound entries pound entries pound entries pound entries
Boston 39 19 49 2 34 26 45 2
Chicago 39 23 49 2 35 30 43 2
Seattle 38 25 48 10 37 57 46 13
San Francisco 40 67 45 14 36 52 42 10
Los Angeles 39 45 47 7 34 38 43 8
Salt Lake City 39 29 39 2 36 22 36 4
Ogden 39 32 41 7 37 25 38 10
Logan 40 20 43 6 37 22 41 4
Identical Pricing of Turkey
As previously observed, 95 percent of the food retailing organizations
in the selected markets advertised turkey simultaneously prior to Thanks~
giving and Christmas. A large number also offered turkey at identical
prices.
As an example of identical pricing of turkey, prices for Grade A
toms in Salt Lake City were analyzed for the week prior to Thanksgiving.
Of 21 simultaneous advertising entries for toms in 1962, 81 percent were
priced at 39 cents. In 1963, 76 percent of the entries were priced at
39 cents and in 1964, all of the simultaneous entries were at two price
levels--77 percent at 37 cents and 23 percent at 41 cents. The practice
40
of simultaneous advertising at identical prices was similar for hens in
Salt Lake City and for both hens and toms in the other markets.
Turkey used as an advertised special loses much of its effectiveness
when advertised simultaneously by all retail stores in a market. It
loses even more effectiveness when also advertised at identical prices.
Volume of Sales at Regular and Special Prices
This study has dealt with incidence of advertising and level of
advertised prices as obtained from newspaper ads. The question naturally
arises as to what proportion of sales are made at regular as compared
with advertised prices. Weekly sales data were available from two
Salt Lake City chain organizations for turkey, chicken, and beef for the
year 1966. The turkey sales were matched against the weeks when these
chains advertised turkey at retail to ascertain the proportion of turkey
sold at regular and advertised prices. Weekly sales of turkey, chicken,
and beef were compared to deterntine the relative importance of each i.n
the various time periods.
The two chains had turkey available to the consumer in the pre=
holiday season either at regular or special prices. Turkey was available
only at regular or special prices. Turkey was available only at special
prices for Thanksgiving and Christmas.
For the year 1966, Food Chain A sold 86 percent of all turkey at
advertised special prices compared to 14 percent at regular prices. Of
the amount sold by Food Chain B, 89 percent was at advertised special
prices compared to 11 percent at regular prices (Table 19).
Twenty-five percent of 1966 turkey sales by Food Chain A were made
in the pre-holiday period as compared to 20 percent for Food Chain B.
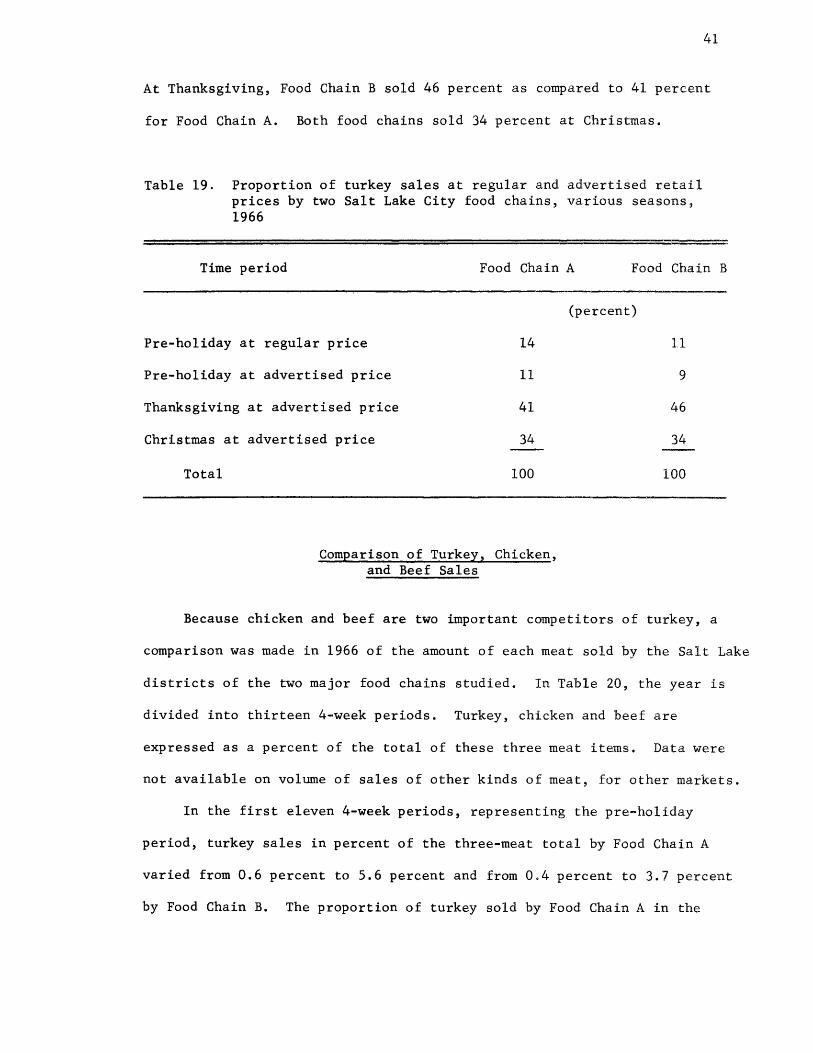
41
At Thanksgiving, Food Chain B sold 46 percent as compared to 41 percent
for Food Chain A. Both food chains sold 34 percent at Christmas.
Table 19. Proportion of turkey sales at regular and advertised retail prices by two Salt Lake City food chains, various seasons, 1966
Time period Food Chain A Food Chain B
Pre-holiday at regular price 14
Pre-holiday at advertised price 11
Thanksgiving at advertised price 41
Christmas at advertised price 34
Total 100
Comparison of Turkey, Chicken, and Beef Sales
(percent)
11
9
46
34
100
Because chicken and beef are two important competitors of turkey, a
comparison was made in 1966 of the amount of each meat sold by the Salt Lake
districts of the two major food chains studied. In Table 20, the year is
divided into thirteen 4-week periods. Turkey, chicken and beef are
expressed as a percent of the total of these three meat items. Data were
not available on volume of sales of other kinds of meat, for other markets.
In the first eleven 4-week periods, representing the pre-holiday
period, turkey sales in percent of the three-meat total by Food Chain A
varied from 0.6 percent to 5.6 percent and from 0.4 percent to 3.7 percent
by Food Chain B. The proportion of turkey sold by Food Chain A in the
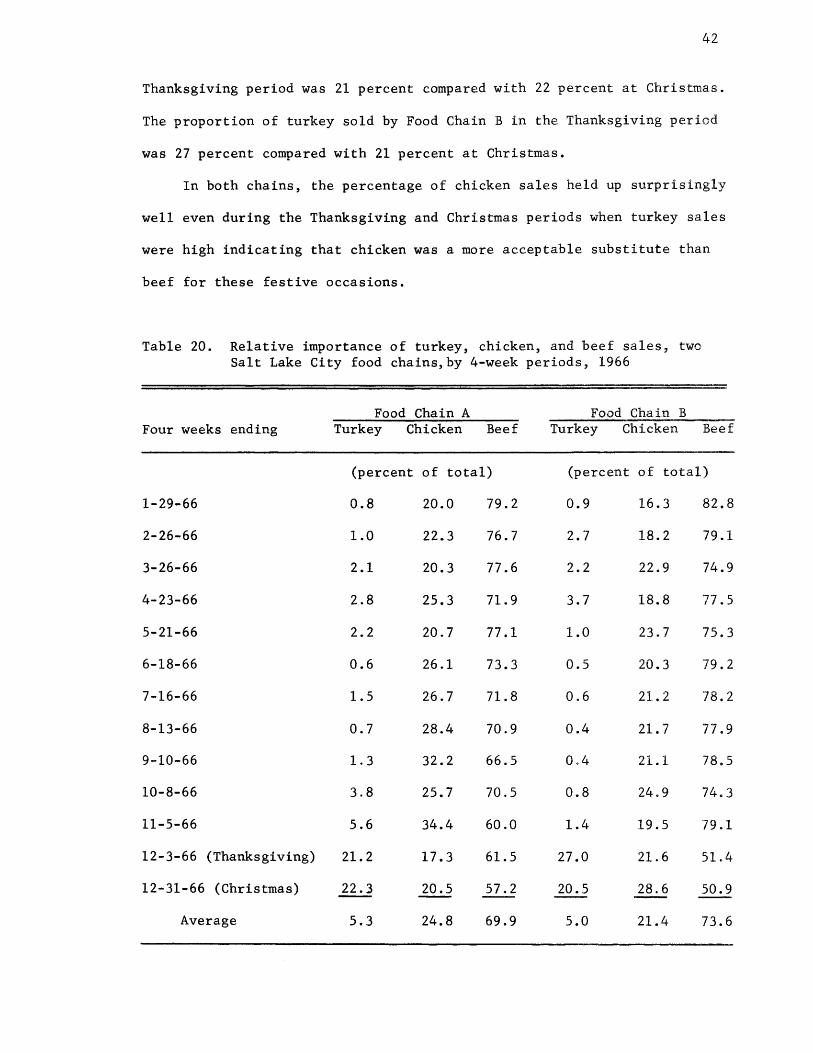
42
Thanksgiving period was 21 percent compared with 22 percent at Christmas.
The proportion of turkey sold by Food Chain B in the Thanksgiving period
was 27 percent compared with 21 percent at Christmas.
In both chains, the percentage of chicken sales held up surprisingly
well even during the Thanksgiving and Christmas periods when turkey sales
were high indicating that chicken was a more acceptable substitute than
beef for these festive occasions.
Table 20. Relative importance of turkey, chicken, and beef sales, two Salt Lake City food chains,by 4-week periods, 1966
=
Food Chain A Food Chai.n B Four weeks ending Turkey Chicken Beef Turkey Chicken Beef
(percent of total) (percent of total)
1-29-66 0.8 20.0 79.2 0.9 16.3 82.8
2-26-66 1.0 22.3 76.7 2.7 18.2 79.1
3-26-66 2.1 20.3 77.6 2.2 22.9 74.9
4-23-66 2.8 25.3 71.9 3.7 18.8 77.5
5-21-66 2.2 20.7 77.1 1.0 23.7 75.3
6-18-66 0.6 26.1 73.3 0.5 20.3 79.2
7-16-66 1.5 26.7 71.8 0.6 21..2 78.2
8-13-66 0.7 28.4 70.9 0.4 21.7 77.9
9-10-66 1.3 32.2 66.5 004 21.1 7805
10-8-66 3.8 25.7 70.5 0.8 24.9 7403
11-5-66 5.6 34.4 60.0 1.4 19.5 79.1
12-3-66 (Thanksgiving) 21.2 17.3 61.5 27.0 21.6 51.4
12-31-66 (Christmas) 22.3 20.5 57.2 20.5 28.6 50.9
Average 5.3 24.8 69.9 5.0 21.4 73.6
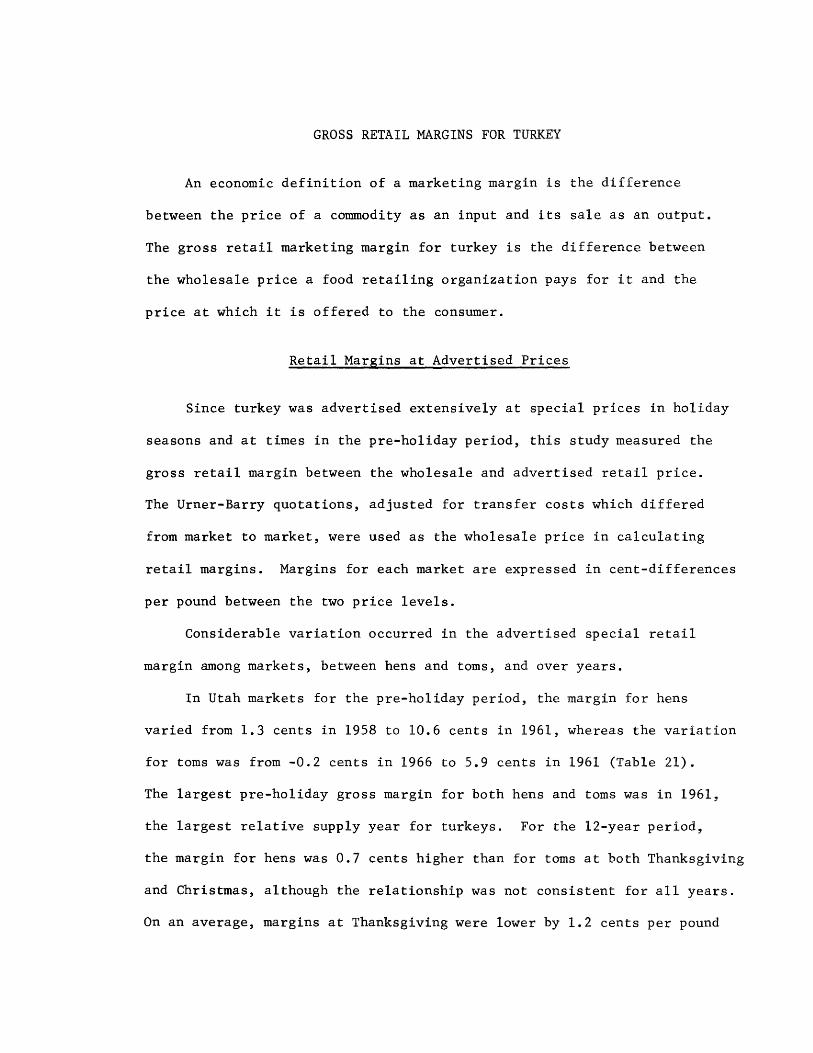
GROSS RETAIL MARGINS FOR TURKEY
An economic definition of a marketing margin is the difference
between the price of a commodity as an input and its sale as an output.
The gross retail marketing margin for turkey is the difference between
the wholesale price a food retailing organization pays for it and the
price at which it is offered to the consumer.
Retail Margins at Advertised Prices
Since turkey was advertised extensively at special prices in holiday
seasons and at times in the pre-holiday period, this study measured the
gross retail margin between the wholesale and advertised retail price.
The Urner-Barry quotations, adjusted for transfer costs which differed
from market to market, were used as the wholesale price in calculating
retail margins. Margins for each market are expressed in cent-differences
per pound between the two price levels.
Considerable variation occurred in the advertised special retail
margin among markets, between hens and toms, and over years.
In Utah markets for the pre-holiday period, the margin for hens
varied from 1.3 cents in 1958 to 10.6 cents in 1961, whereas the variation
for toms was from -0.2 cents in 1966 to 5.9 cents in 1961 (Table 21).
The largest pre-holiday gross margin for both hens and toms was in 1961,
the largest relative supply year for turkeys. For the l2-year period,
the margin for hens was 0.7 cents higher than for toms at both Thanksgiving
and Christmas, although the relationship was not consistent for all years.
On an average, margins at Thanksgiving were lower by 1.2 cents per pound
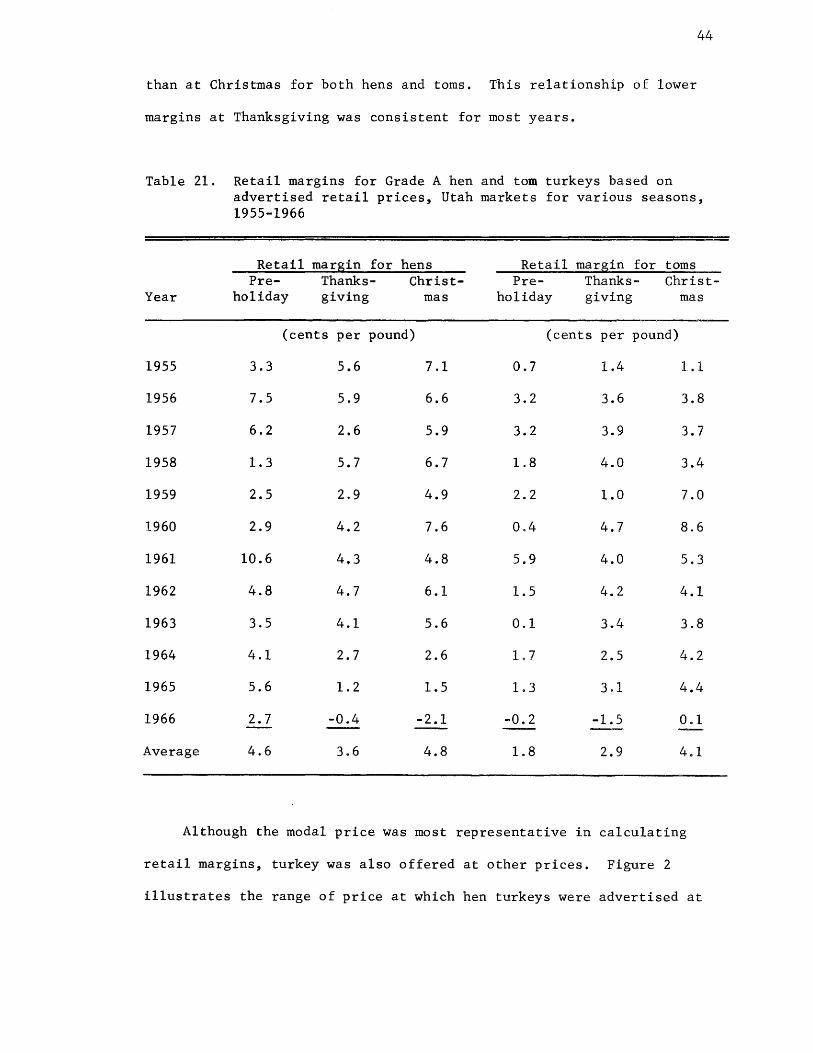
44
than at Christmas for both hens and toms. This relationship of lower
margins at Thanksgiving was consistent for most years.
Table 21. Retail margins for Grade A hen and tom turkeys based on advertised retail prices, Utah markets for various seasons, 1955-1966
Retail margin for hens Retail margin for toms Pre- Thanks- Christ- Pre- Thanks- Christ-
Year holiday giving mas holiday giving mas
(cents per pound) (cents per pound)
1955 3.3 5.6 7.1 0.7 1.4 1..1
1956 7.5 5.9 6.6 3.2 3.6 3.8
1957 6.2 2.6 5.9 3.2 3.9 3.7
1958 1.3 5.7 6.7 1.8 4.0 3.4
1959 2.5 2.9 4.9 2.2 1.0 7.0
1960 2.9 4.2 7.6 0.4 4.7 8.6
1961 10.6 4.3 4.8 5.9 4.0 5.3
1962 4.8 4.7 6.1 1.5 4.2 4.1
1963 3.5 4.1 5.6 0.1 3.4 3.8
1964 4.1 2.7 2.6 1.7 2.5 4.2
1965 5.6 1.2 1.5 1.3 3.1 4.4
1966 2.7 -0.4 -2.1 -0.2 -1.5 0.1
Average 4.6 3.6 4.8 1.8 2.9 4.1
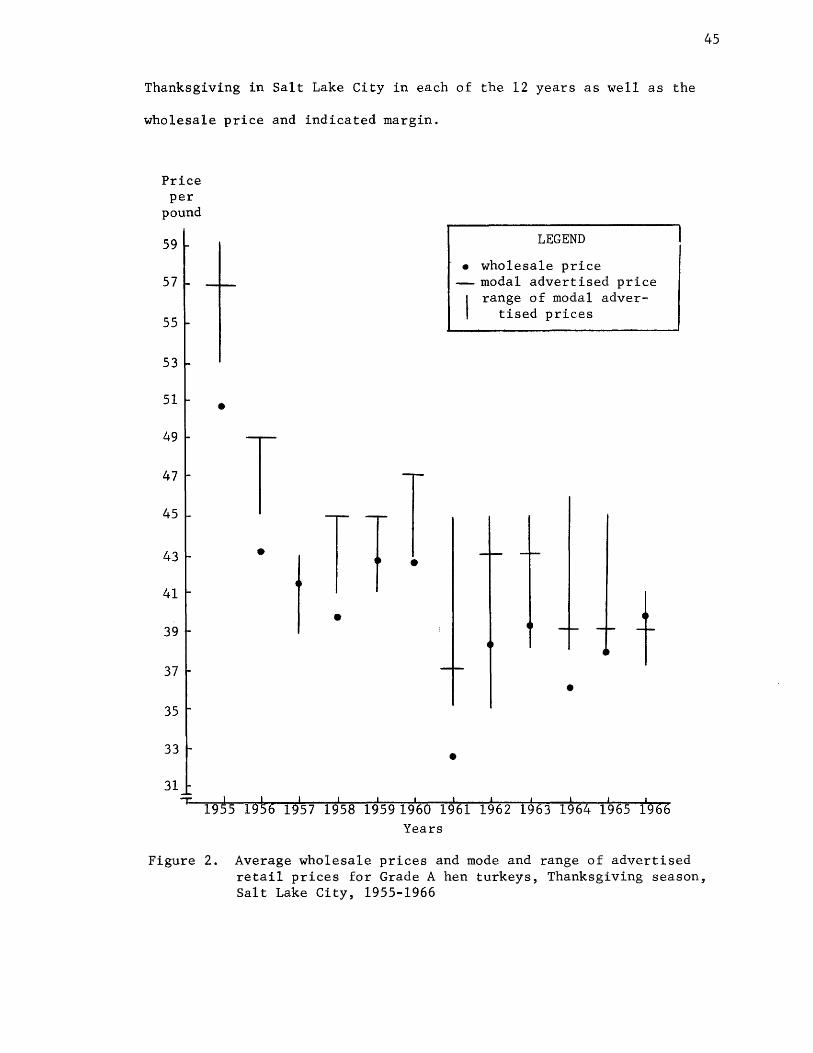
Although the modal price was most representative in calculating
retail margins, turkey was also offered at other prices. Figure 2
illustrates the range of price at which hen turkeys were advertised at
Thanksgiving in Salt Lake City in each of the 12 years as well as the
wholesale price and indicated margin.
Price per
pound
59
57
55
53
51 • 49
T 47
45
43 • 41
39
37
35
33
31
TT j •
•
LEGEND
• wholesale price -- modal advertised price
range of modal advertised prices
t •
• -r ) , I I I I I I , , • I
1955 1956 1957 1958 1959 1960 1961 1962 1963 1964 1965 1966 Years
45
Figure 2. Average wholesale prices and mode and range of advertised retail prices for Grade A hen turkeys, Thanksgiving season, Salt Lake City, 1955-1966
46
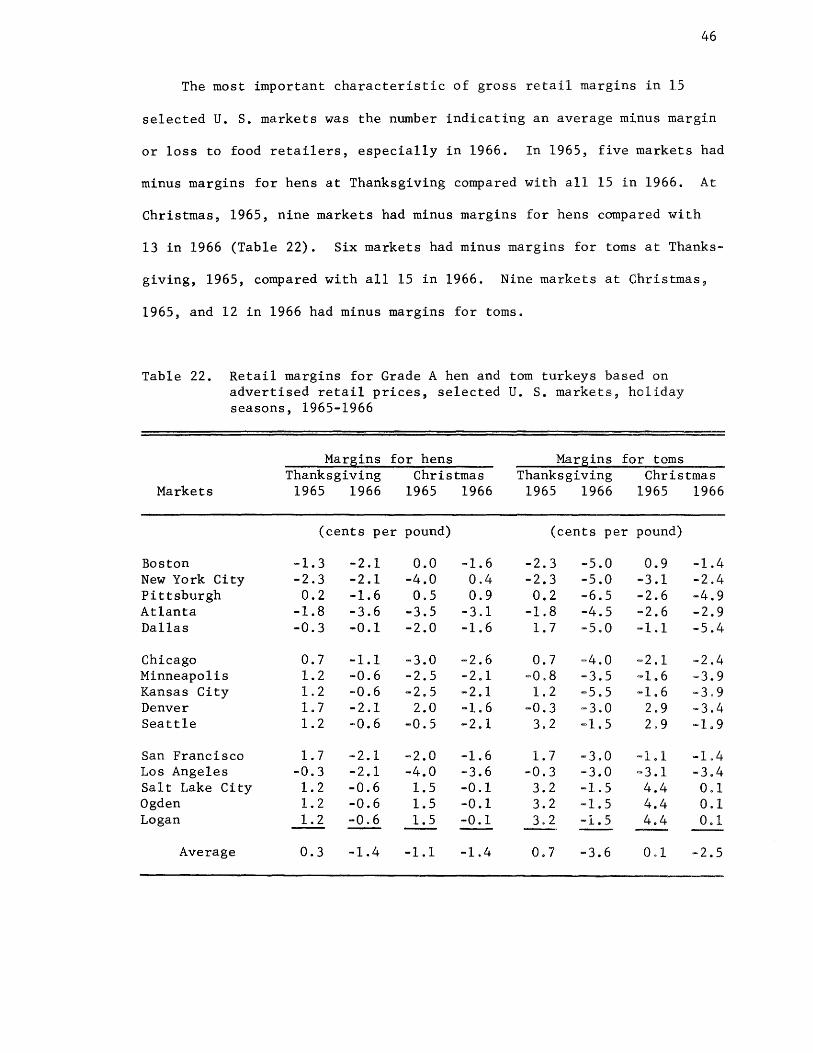
The most important characteristic of gross retail margins in 15
selected U. S. markets was the number indicating an average minus margi.n
or loss to food retailers, especially in 1966. In 1965, five markets had
minus margins for hens at Thanksgiving compared with all 15 in 1966. At
Christmas, 1965, nine markets had minus margins for hens compared wi.th
13 in 1966 (Table 22). Six markets had minus margins for toms at Thanks-
giving, 1965, compared with all 15 in 1966. Nine markets at Christmas,
1965, and 12 in 1966 had minus margins for toms.
Table 22. Retail margins for Grade A hen and torn turkeys based on advertised retail prices, selected U. s. markets, holiday seasons, 1965-1966
Mar~ins for hens Mar~ins for toms Thanksgiving Christmas Thanksgiving Christmas
Markets 1965 1966 1965 1966 1965 1966 1965 1966
(cents per pound) (cents per pound)
Boston -1.3 -2.1 0.0 -1.6 -2.3 ~5.0 0.9 -1.4 New York City -2.3 -2.1 -4.0 0.4 -2.3 -5.0 -3.1 -2.4 Pittsburgh 0.2 -1.6 0.5 0.9 0.2 -6.5 -2.6 -4.9 Atlanta -1.8 -3.6 -3.5 -3.1 -1.8 -4.5 -2.6 -2.9 Dallas -0.3 -0.1 -2.0 -1.6 1.7 -5.0 -1.1 -5.4
Chicago 0.7 -1.1 -3.0 -2.6 0.7 =4.0 =2.1 -2.4 Minneapolis 1.2 -0.6 -2.5 -2.1 =0.8 -3.5 -1.6 =3.9 Kansas City 1.2 -0.6 -2.5 - 2.1 1.2 ~5.5 -1.6 =309 Denver 1.7 -2.1 2.0 -1.6 -0.3 -3.0 2.9 =3.4 Seattle 1.2 -0.6 -0.5 -2.1 3.2 =1.5 2,9 =1.9
San Francisco 1.7 -2.1 -2.0 -1.6 1.7 -3.0 -1.1 -1.4 Los Angeles -0.3 -2~1 -4.0 -3.6 -0.3 -3.0 ~3.1 -3.4 Salt Lake City 1.2 -0.6 1.5 -0.1 3.2 =1.5 4.4 0.1 Ogden 1.2 -0.6 1.5 -0.1 3.2 -1.5 4.4 0.1 Logan 1.2 -0.6 1.5 -0.1 3.2 -1.5 4.4 0.1
Average 0.3 -1.4 -1.1 -1.4 0.7 =3.6 0,1 -2.5
47
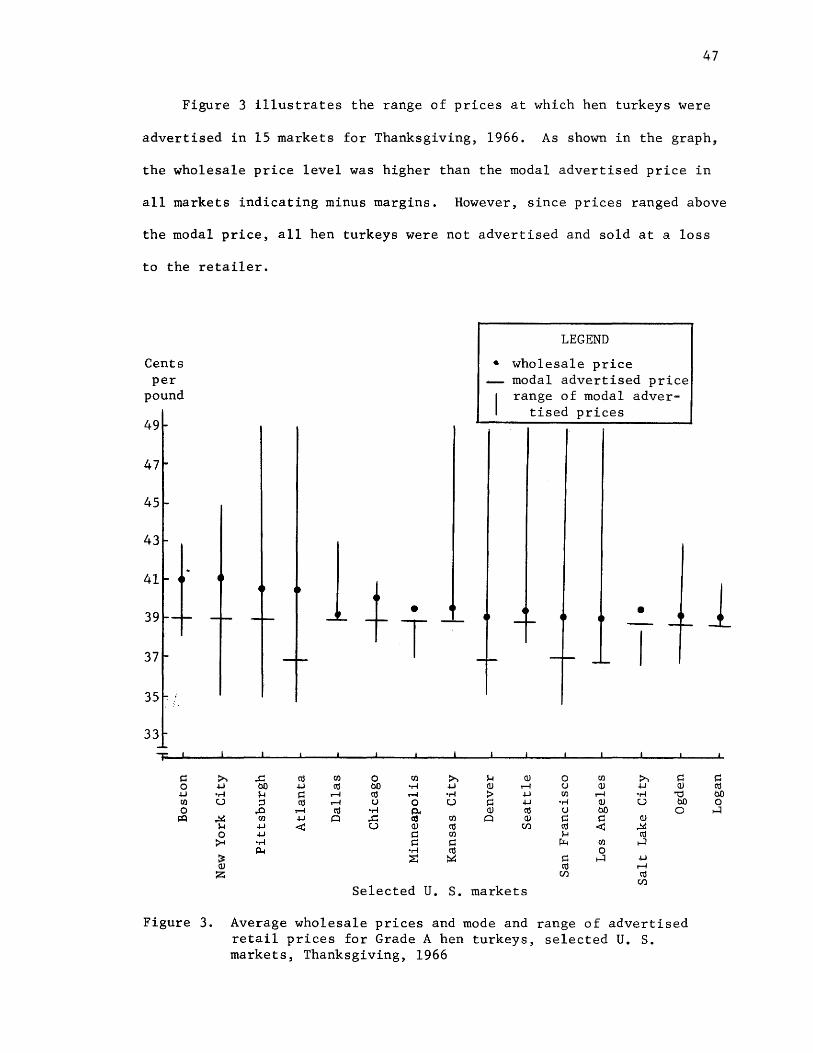
Figure 3 illustrates the range of prices at which hen turkeys were
advertised in 15 markets for Thanksgiving, 1966. As shown in the graph,
the wholesale price level was higher than the modal advertised price in
all markets indicating minus margins. However, since prices ranged above
the modal price, all hen turkeys were not advertised and sold at a loss
to the retailer.
Cents per
pound
45
43
41
39
37
35
33
T
f;:: 0 -4.J CJ)
0 j:Q
>-. ..c -4.J bO -,.-4 ~ U :,::)
,.c ~ CJ)
~ -4.J 0 -4.J ~ -,.-4
~ ~ OJ Z
ttl CJ) 0 CJ)
-4.J ttl bO -,.-4 f;:: ,-I ttl ,-I
ttl ,-I C) 0 ,-I ttl -,.-4 p,. -4.J ~ ..c CIS ~ U OJ
f;:: f;::
-,.-4
~
Selected
>-. -4.J -,.-4
u CJ)
ttl CJ)
f;:: ttl ~
U. S.
LEGEND
• wholesale price
~ OJ :> f;:: OJ ~
modal advertised price range of modal adver
tised prices
•
OJ 0 CJ) >-. f;:: ,-I C) OJ -4.J OJ -4.J CJ) ,-I -,.-4 '"d -4.J -,.-4 OJ U bO ttl C) bO 0 OJ f;:: f;:: OJ
Cf.l ttl ~ ~ $-.l ttl ~ CJ) H
0 ~ H -4.J ttl ,-I
Cf.l ttl Cf.l
markets
Figure 3. Average wholesale prices and mode and range of advertised retail prices for Grade A hen turkeys, selected U. S. markets, Thanksgiving, 1966
1
f;:: ttl bO 0 H
48
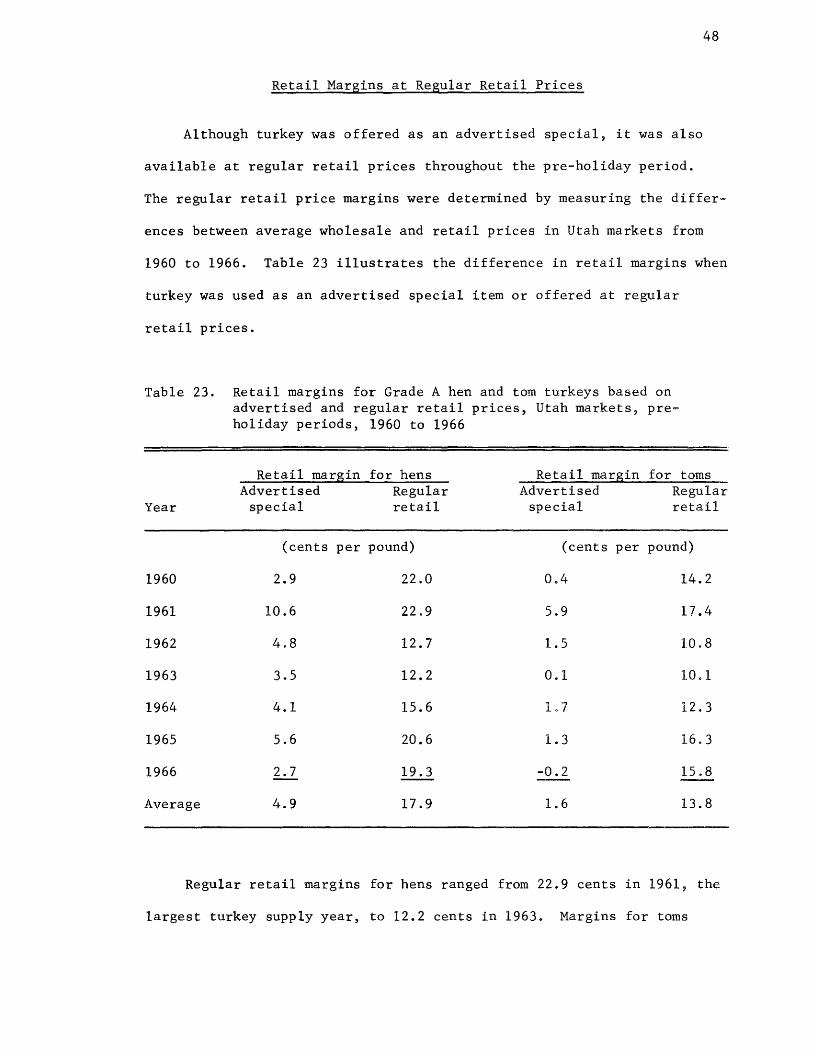
Retail Margins at Regular Retail Prices
Although turkey was offered as an advertised special, it was also
available at regular retail prices throughout the pre-holiday period.
The regular retail price margins were determined by measuring the differ-
ences between average wholesale and retail prices in Utah markets from
1960 to 1966. Table 23 illustrates the difference in retail margins when
turkey was used as an advertised special item or offered at regular
retail prices.
Table 23. Retail margins for Grade A hen and tom turkeys based on advertised and regular retail prices, Utah markets, pre= holiday periods, 1960 to 1966
Retail margin for hens Retail margin for toms Advertised Regular Advertised Regular
Year special retail special retail
(cents per pound) (cents per pound)
1960 2.9 22.0 0.4 14.2
1961 10.6 22.9 5.9 17.4
1962 4.8 12.7 1.5 10.8
1963 3.5 12.2 0.1 10.1
1964 4.1 15.6 107 12.3
1965 5.6 20.6 1.3 16.3
1966 2.7 19.3 -0.2 15.8
Average 4.9 17.9 1.6 13.8
Regular retail margins for hens ranged from 22.9 cents in 1961, the
largest turkey supply year, to 12.2 cents in 1963. Margins for toms
49
ranged from 17.4 cents in 1961 to 10.1 cents in 1963. There was an
average of 13 cents greater margin for hens and 12.2 cents for toms when
offered at regular retail prices rather than as advertised specials.
Retail margins are commonly calculated as a percentage of selling
price and referred to as mark-up. The retail mark-up for turkey in
Salt Lake City in recent years averaged about 8 or 9 percent when priced
as an advertised item and about 30 percent when sold at regular retail
prices. These can be compared with average retail mark-ups of about
18 percent for grocery departments, 24 percent for meat departments, and
30 percent for produce departments.
SUMMARY
Newspaper Advertising Practices for Turkey
1. Because turkey is a traditional meat for Thanksgiving and
Christmas, much greater advertising emphasis was given it prior to these
holidays than in the pre-holiday period. Approximately 30 percent of all
ads at Thanksgiving and 25 percent at Christmas offered turkey compared
with 6 percent in the pre-holiday period.
2. About 90 percent of the ads offering turkey at Thanksgiving used
it as the featured meat item compared with 70 percent at Christmas and
60 percent in the pre-holiday period.
3. There was an average of two turkey entries per ad at Thanksgiving
and Christmas compared with one entry per ad in the pre-holiday period
indicating a greater degree of product selection of turkey in the holiday
seasons.
4. Food retailing organizations attempted to differentiate adver
tised turkey through grade, brand name, indication of product preparation,
etc.
a. During the pre-holiday period, turkey entries were often
advertised without sex identification while at Thanksgiving and
Christmas the practice was to identify the sex. More than 95 per
cent of the entries in holiday seasons were designated hen or tom
compared with 50 percent in pre-holiday.
b. Nearly every advertised turkey item was specified as
fresh or frozen. Ninety percent of the entries at Thanksgiving
and Christmas and 80 percent pre-holiday were advertised as
frozen. All others were designated fresh.
c. Only 3 percent of the entries failed to mention grade.
In U. S. markets, 90 percent were Grade A in holiday seasons
and in Utah markets, 80 percent. One-third of pre-holiday
Utah entries were graded below A.
d. Brand names were omitted in about 40 percent of holiday
advertising and in 50 percent of pre-holiday turkey entries.
The Norbest brand was specified in 11 percent of the turkey
entries in the 15 markets ranging from none in two of the
cities to 50 percent in Salt Lake City. Other brand names
were classified as store, local grower and processor, and
national meat packer brands.
e. In 15 U. S. markets, the size range of turkeys was
included in more than three-fourths of the ads. In direct
contrast, more than three-fourths of Utah entries at holiday
time did not specify turkey size.
f. About three-fourths of the turkey entries did not
contain additional descriptive terms but of those containing
additional terms, oven-ready, tender, and plump were most
frequently used. In the pre-holiday period, 13 percent of all
turkey entries in Utah markets were specified as Beltsville-~
a small turkey variety--compared with 2 percent in holiday
periods.
51
5. Nearly all stores advertising in the selected newspaper of each
market had turkey in their ads the week prior to Thanksgiving and
Christmas. At Thanksgiving, 90 percent, and at Christmas, about 80
52
percent of the stores advertised turkey simultaneously. In the pre
holiday period, the most important concentration of simultaneous turkey
advertising was at Easter when 44 percent of the stores advertised turkey.
6. At Thanksgiving, 12 percent of the column inches on ads offering
turkey were devoted to turkey. This decreased to 8 percent at Christmas.
Nine percent of the column inches in pre-holiday ads of Utah markets
were devoted to turkey.
Retail Pricing Practices for Turkey
1. Average New York City wholesale price levels for hens from 1955
to 1966 varied from 53 to 34 cents per pound and for toms from 47 to
32 cents. Prices were lowest in 1961, the year of largest relative U. S.
supply.
2. Turkey was offered from January to October at regular retail
prices. In Salt Lake City from 1960 to 1966, regular retail prices
varied from 60 to 49 cents for hens and 54 to 45 cents for toms. No
regular retail prices were reported at Thanksgiving and Christmas since
turkey was offered extensively in these periods as an advertised special
item.
3. In the 15 U. S. markets at Thanksgiving, the modal advertised
price for hens was 37 to 39 cents per pound in 1965 and 1966. The most
frequent modal price for toms was 33 or 35 cents at Thanksgiving. Prices
of both hens and toms were about 2 cents higher at Christmas than Thanks
giving in most markets. In the l2-year period for Utah markets, modal
prices for hens varied from 57 to 37 cents and for toms from 47 to 35
cents. Lowest prices for hens and toms occurred in 1961, the year of
largest relative U. S. supply. Advertised special prices in pre-holiday
53
seasons of each year were at about the same level as at Thanksgiving and
generally lower than at Christmas.
4. Following World War II, hen turkeys were advertised at prices
as much as 10 cents per pound higher than toms. This difference has
gradually narrowed to 2 cents in the last three years.
5. "Odd-cent" pricing of turkey was a practice used almost exclusive
ly in all years and markets for both regular and special prices.
6. In all markets except Salt Lake City where both fresh and frozen
turkey was offered, fresh was advertised at higher prices. Differences
as much as 10 to 12 cents were observed in some markets.
7. Most food retailing organizations advertising turkey simultaneously
prior to Thanksgiving and Christmas also offered turkey at identical prices.
Seventy to eighty percent of the simultaneous entries were offered at
identical prices.
8. Sales data obtained from two Salt Lake City food chains in 1966
indicated more than 85 percent of their 1966 turkey sales were made at
advertised special prices. More than 70 percent of sales were made at
Thanksgiving and Christmas.
Gross Retail Margins for Turkey
1. The most important characteristic of retail margins at advertised
prices for turkey was the low retail margin or mark-up. Retail mark~up
for turkey in Salt Lake City in recent years averaged about 8 or 9 per
cent. Retail margins expressed in cent-differences averaged about 3 or
4 cents per pound in Utah markets from 1955 to 1966. All 15 u. S. markets
at Thanksgiving, 1966, had minus margins for hen and tom turkeys. Several
markets in holiday seasons, 1965, and most markets at Christmas, 1966, had
minus margins.
54
2. Retail margins at advertised prices were slightly higher for
toms than for hens and were usually greater at Christmas than at Thanks
giving for both hen and tom turkeys.
3. There was about 12 or 13 cents greater margin for turkey when
offered at regular retail rather than at advertised special prices.
Retail mark-ups in Salt Lake City at regular prices were about 30 percent
in recent years.
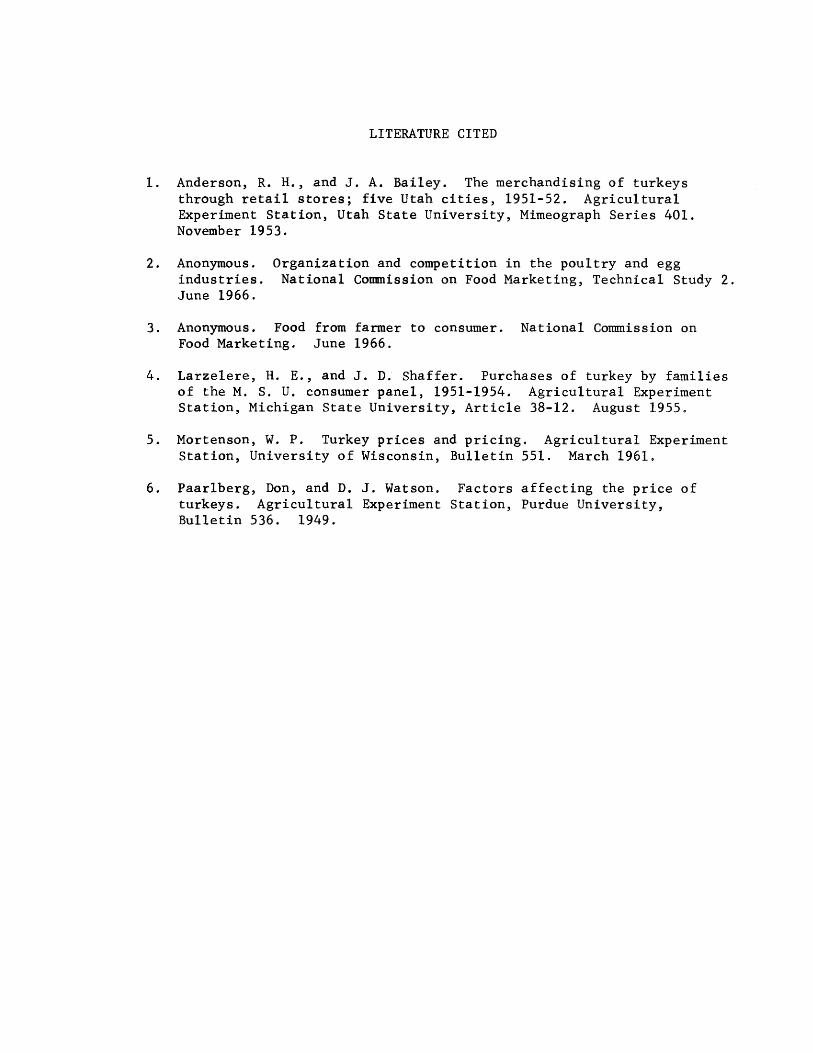
LITERATURE CITED
1. Anderson, R. H., and J. A. Bailey. The merchandising of turkeys through retail stores; five Utah cities, 1951-52. Agricultural Experiment Station, Utah State University, Mimeograph Series 401. November 1953.
2. Anonymous. industries. June 1966.
Organization and competition in the poultry and egg National Commission on Food Marketing, Technical Study 2.
3. Anonymous. Food from farmer to consumer. National Commission on Food Marketing. June 1966.
4. Larzelere, H. E., and J. D. Shaffer. Purchases of turkey by families of the M. S. U. consumer panel, 1951-1954. Agricultural Experiment Station, Michigan State University, Article 38-12. August 1955.
5. Mortenson, W. P. Turkey prices and pr1c1ng. Agricultural Experiment Station, University of Wisconsin, Bulletin 551. March 1961.
6. Paar1berg, Don, and D. J. Watson. Factors affecting the price of turkeys. Agricultural Experiment Station, Purdue University, Bulletin 536. 1949.

APPENDIX
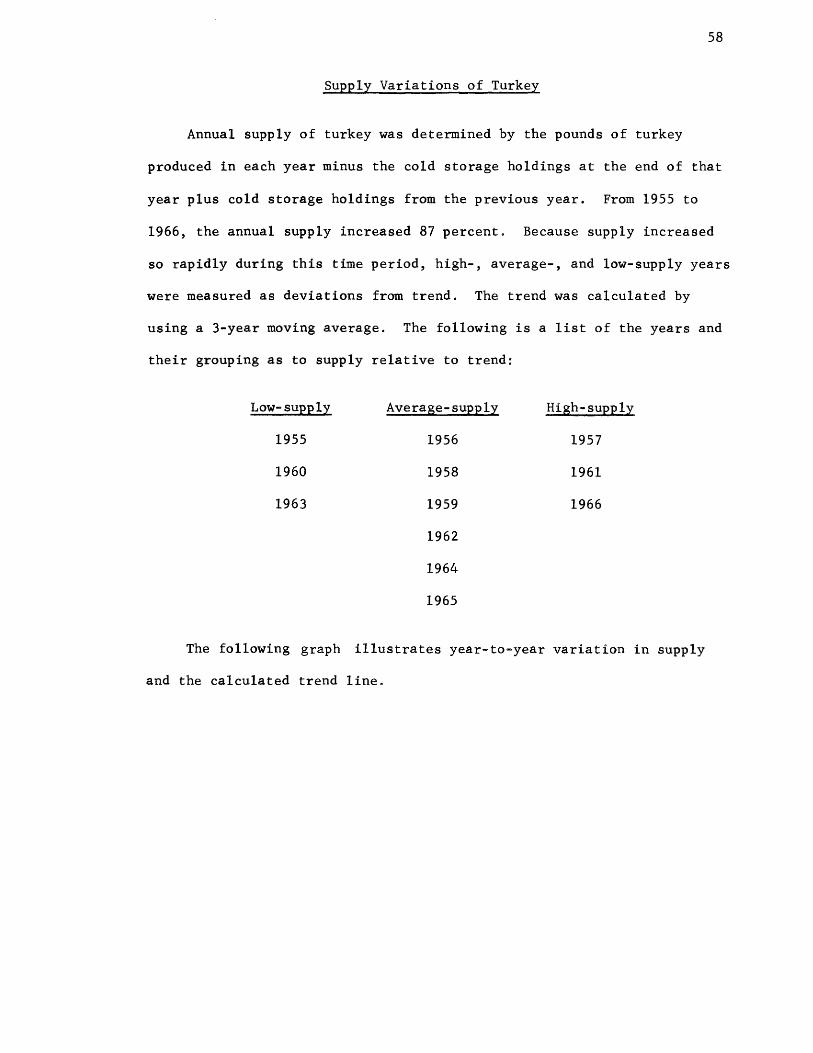
58
Supply Variations of Turkey
Annual supply of turkey was determined by the pounds of turkey
produced in each year minus the cold storage holdings at the end of that
year plus cold storage holdings from the previous year. From 1955 to
1966, the annual supply increased 87 percent. Because supply increased
so rapidly during this time period, high-, average-, and low-supply years
were measured as deviations from trend. The trend was calculated by
using a 3-year moving average. The following is a list of the years and
their grouping as to supply relative to trend:
Low-supply Average-supply High-supply
1955 1956 1957
1960 1958 1961
1963 1959 1966
1962
1964
1965
The following graph illustrates year-to-year variation in supply
and the calculated trend line.
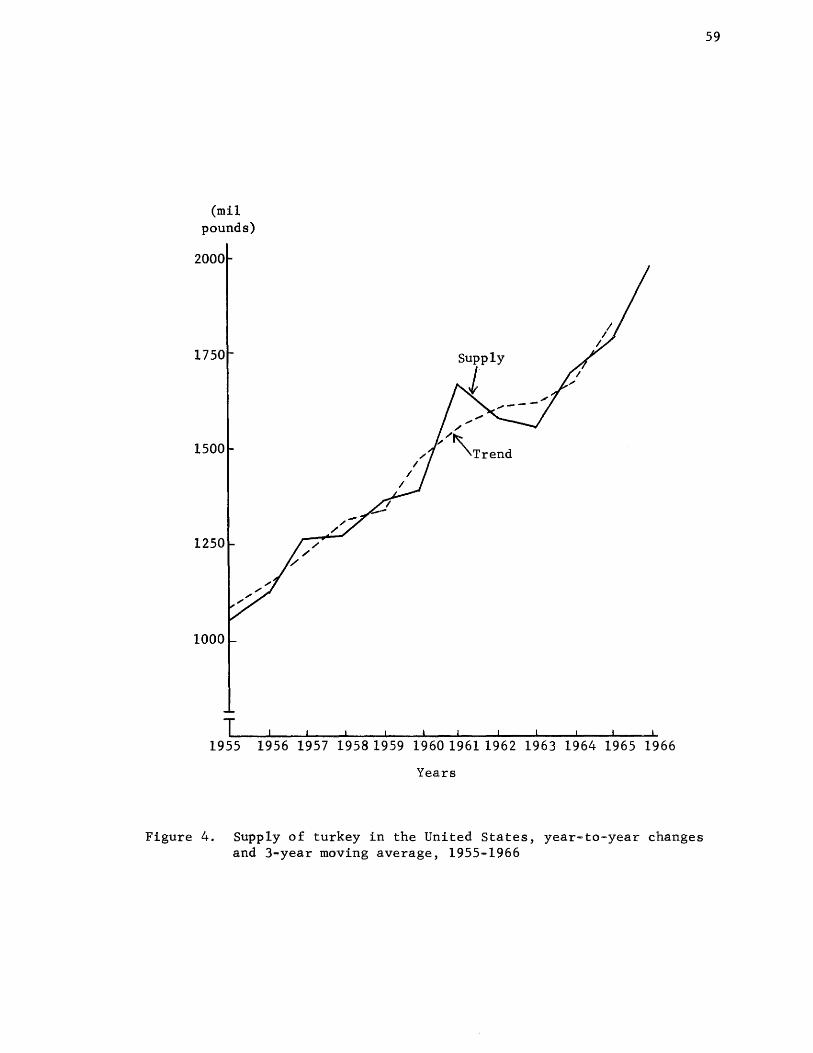
(mil pounds)
2000
1750
1500
1250
1000
T 1955
I , I r I , I I , , ,
1956 1957 1958 1959 1960 19611962 1963 1964 1965 1966
Years
Figure 4. Supply of turkey in the United States, year~to-year changes and 3-year moving average, 1955-1966
59
VITA
Gerry R. Flake
Candidate for the Degree of
Master of Science
Thesis: Newspaper Advertising, Retail Pricing Practices, and Gross Retail Margins for Turkeys in Selected Utah and Other U. S. Markets for Various Years and Seasons
Major Field: Agricultural Economics
Biographical Information:
Personal Data: Born at Snowflake, Arizona, June 12, 1942, son of Bruce M. and Irene S. Flake; married Janet Hamilton June 30, 1967.
Education: Attended elementary school in Snowflake, Arizona; graduated from Snowflake Union High School in 1960; received the Bachelor of Science degree from Arizona State University, with a major in agricultural economics, in 1966; completed requirements for the Master of Science degree, specializing in agricultural marketing, at Utah State University in 1967.
Professional Experience: June, 1966 to October, 1967, graduate research assistant at Utah State University.


![DENA BANK WELCOMES YOU AT ANALYST MEET€¦ · RETAIL LENDING 22 [`cr] [`cr] Dec 11 Dec 12 Y-o-Y Growth % Direct Retail 4,765 6,202 30.17 Total Retail 6,614 7,666 15.90 % of Gross](https://img.pdfslide.net/doc/110x75/5f52c99b6146220f5120e25e/dena-bank-welcomes-you-at-analyst-meet-retail-lending-22-cr-cr-dec-11-dec.jpg)