Embed Size (px)
Citation preview
7/28/2019 NFIB Report
http://slidepdf.com/reader/full/nfib-report 1/23
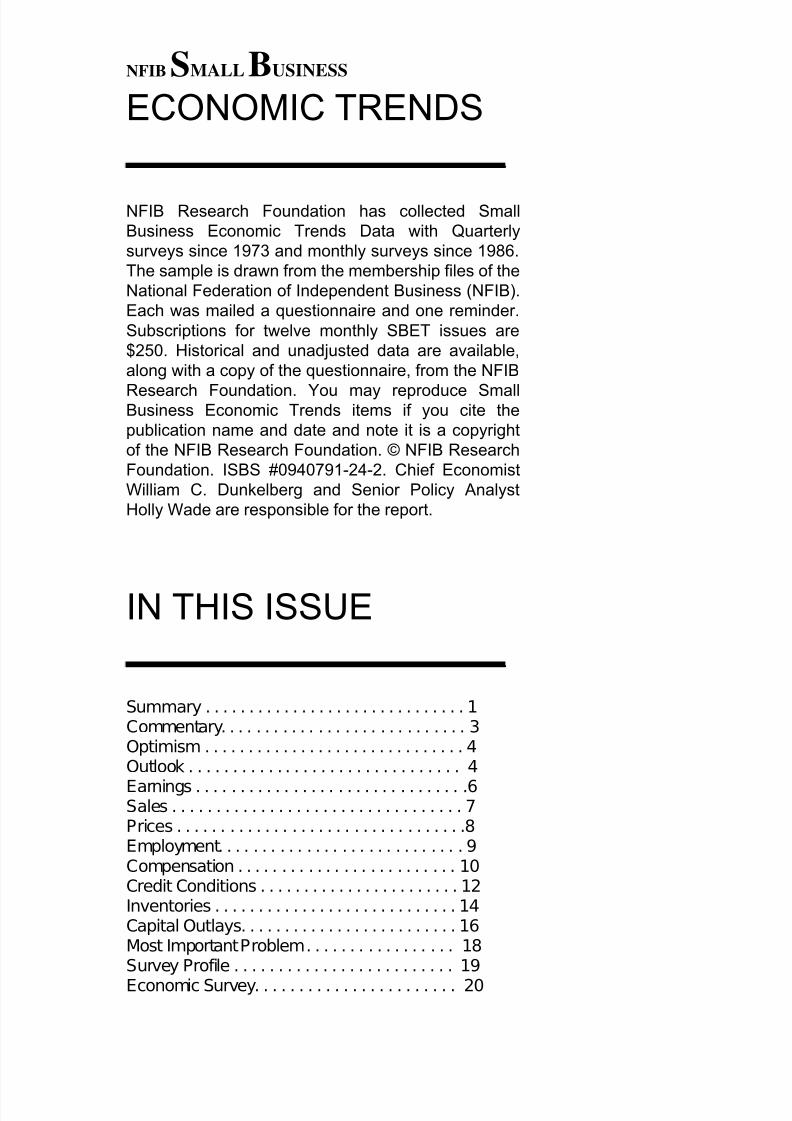
SMALL BUSINESS OPTIMISM INDEX COMPONENTS
Index Component
Seasonally
Adjusted Level
Change from
Last Month
Contribution to
Index Change
Plans to Increase Employment 7% 2 - 20%
Plans to Make Capital Outlays 23% 0 0%
Plans to Increase Inventories - 1% - 4 40%
Expect Economy to Improve - 4% 1 - 10%
Expect Real Sales Higher 5% - 3 30%
Current Inventory - 2% - 3 30%
Current Job Openings 19% 0 0%
Expected Credit Conditions - 7% - 1 10%
Now a Good Time to Expand 7% - 1 10%
Earnings Trends - 23% -1 10%
Total Change - 10 100%
(Column 1 is the current reading; column 2 is the change from the prior month; column 3 the percent of the total change
accounted for by each component; * is under 1 percent and not a meaningful calculation)
Based on a Survey of Small and Independent Business Owners
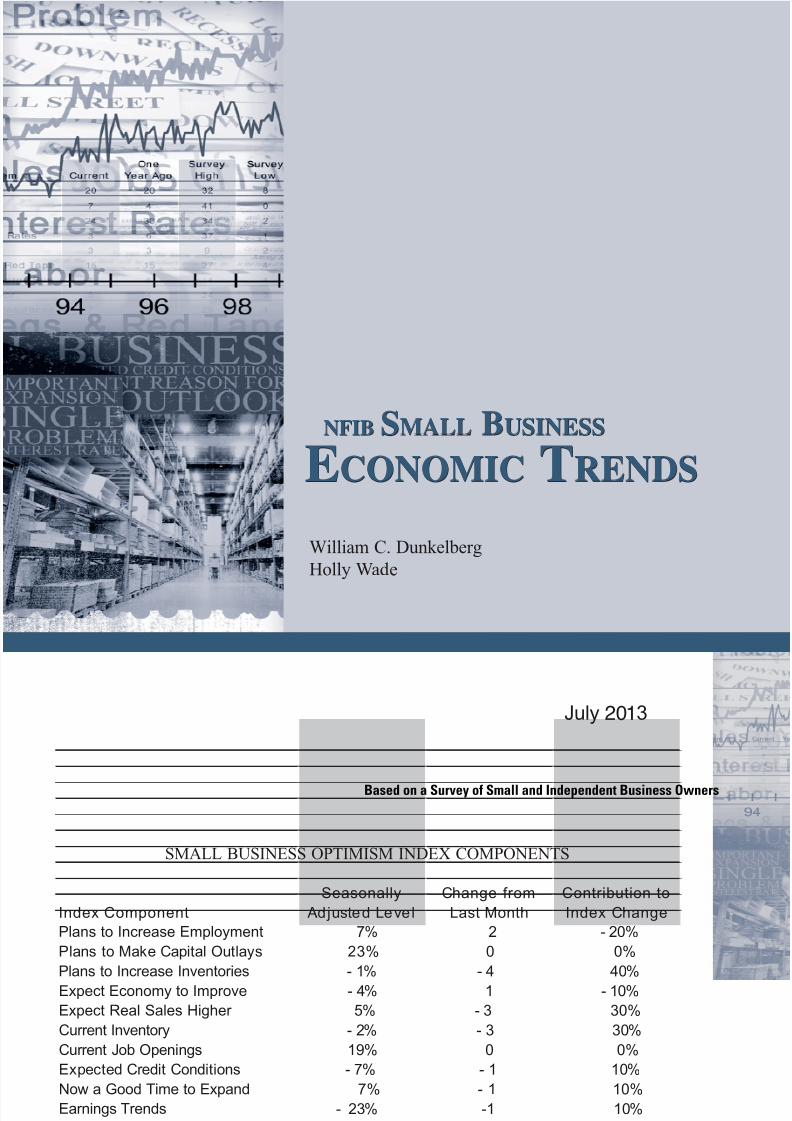
NFIB SMALL BUSINESS
ECONOMIC TRENDS
NFIB SMALL BUSINESS
ECONOMIC TRENDS
William C. Dunkelberg
Holly Wad H
July 2013
7/28/2019 NFIB Report
http://slidepdf.com/reader/full/nfib-report 2/23
NFIB SMALL BUSINESS
ECONOMIC TRENDS
_____________________
NFIB Research Foundation has collected SmallBusiness Economic Trends Data with Quarterlysurveys since 1973 and monthly surveys since 1986.The sample is drawn from the membership files of theNational Federation of Independent Business (NFIB).Each was mailed a questionnaire and one reminder.Subscriptions for twelve monthly SBET issues are$250. Historical and unadjusted data are available,along with a copy of the questionnaire, from the NFIB
Research Foundation. You may reproduce SmallBusiness Economic Trends items if you cite thepublication name and date and note it is a copyrightof the NFIB Research Foundation. © NFIB ResearchFoundation. ISBS #0940791-24-2. Chief EconomistWilliam C. Dunkelberg and Senior Policy AnalystHolly Wade are responsible for the report.
IN THIS ISSUE
_____________________
Summary . . . . . . . . . . . . . . . . . . . . . . . . . . . . . . 1 Commentary. . . . . . . . . . . . . . . . . . . . . . . . . . . . 3 Optimism . . . . . . . . . . . . . . . . . . . . . . . . . . . . . . 4 Outlook . . . . . . . . . . . . . . . . . . . . . . . . . . . . . . . 4
Earnings . . . . . . . . . . . . . . . . . . . . . . . . . . . . . . .6 Sales . . . . . . . . . . . . . . . . . . . . . . . . . . . . . . . . . 7 Prices . . . . . . . . . . . . . . . . . . . . . . . . . . . . . . . . .8 Employment. . . . . . . . . . . . . . . . . . . . . . . . . . . . 9 Compensation . . . . . . . . . . . . . . . . . . . . . . . . . 10 Credit Conditions . . . . . . . . . . . . . . . . . . . . . . . 12 Inventories . . . . . . . . . . . . . . . . . . . . . . . . . . . . 14 Capital Outlays. . . . . . . . . . . . . . . . . . . . . . . . . 16 Most Important Problem . . . . . . . . . . . . . . . . . 18 Survey Profile . . . . . . . . . . . . . . . . . . . . . . . . . 19
Economic Survey. . . . . . . . . . . . . . . . . . . . . . . 20
7/28/2019 NFIB Report
http://slidepdf.com/reader/full/nfib-report 3/23
1
| N F I B S m a
l l B u s i n e s s
E c o n o
m i c T r e n
d s
M o n t h l y R e p o r t
SUMMARY
OPTIMISM INDEX
The Index dropped 0.9 points in June, ending the hope that a revival in
sentiment have started. Six of the ten Index components fell, two rose and
two were unchanged. The inventory picture deteriorated and was the main
contributor to the decline in the Index. More owners were less satisfied
with current inventory holdings and plans to increase in the future also
deteriorated. So, after two months of solid gains, the Index gave up. No
surprise, there was no reason to be more optimistic and lots to worry about.
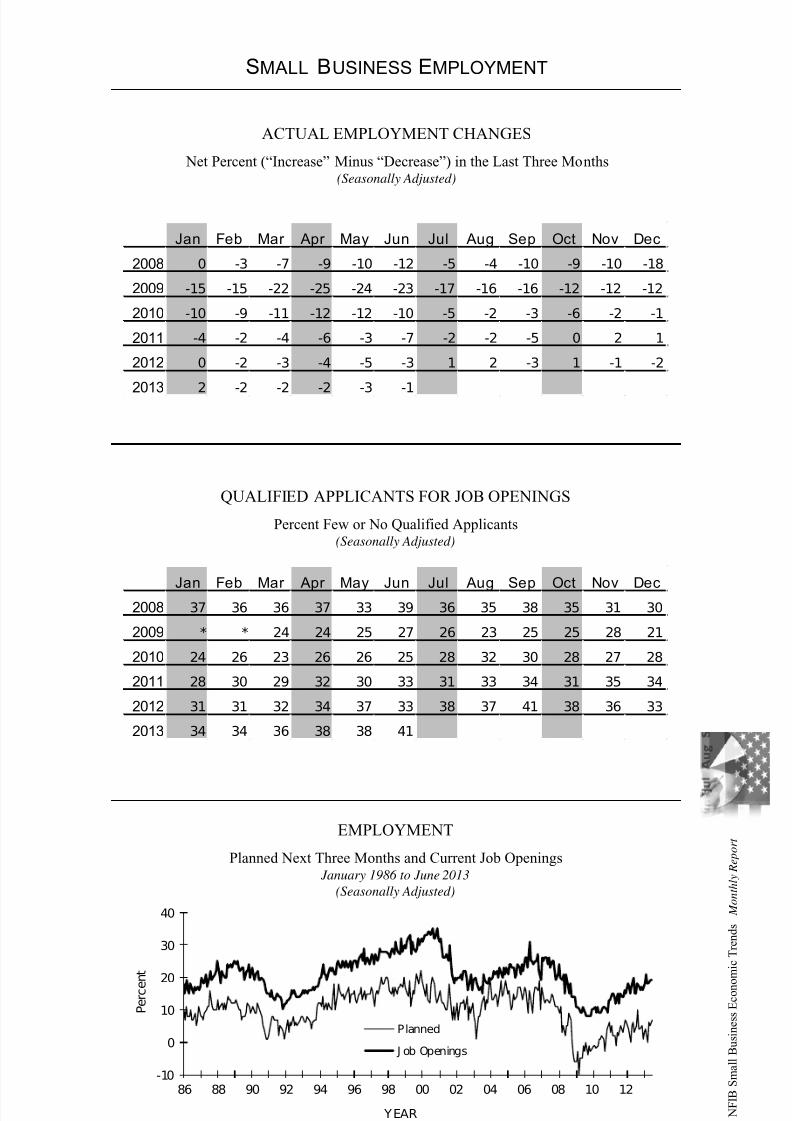
LABOR MARKETS
Eleven (11) percent of the owners (up 2 points) reported adding an average
of 3.6 workers per firm over the past few months. Offsetting that, 12
percent reduced employment (unchanged) an average of 4.3 workers
(seasonally adjusted), producing a seasonally adjusted gain of negative0.09 workers per firm overall. Fifty-three (53) percent of the owners hired
or tried to hire in the last three months and 41 percent reported few or no
qualified applicants for open positions. A net 14 percent reported raising
compensation, 2 points below May, which was the highest reading since
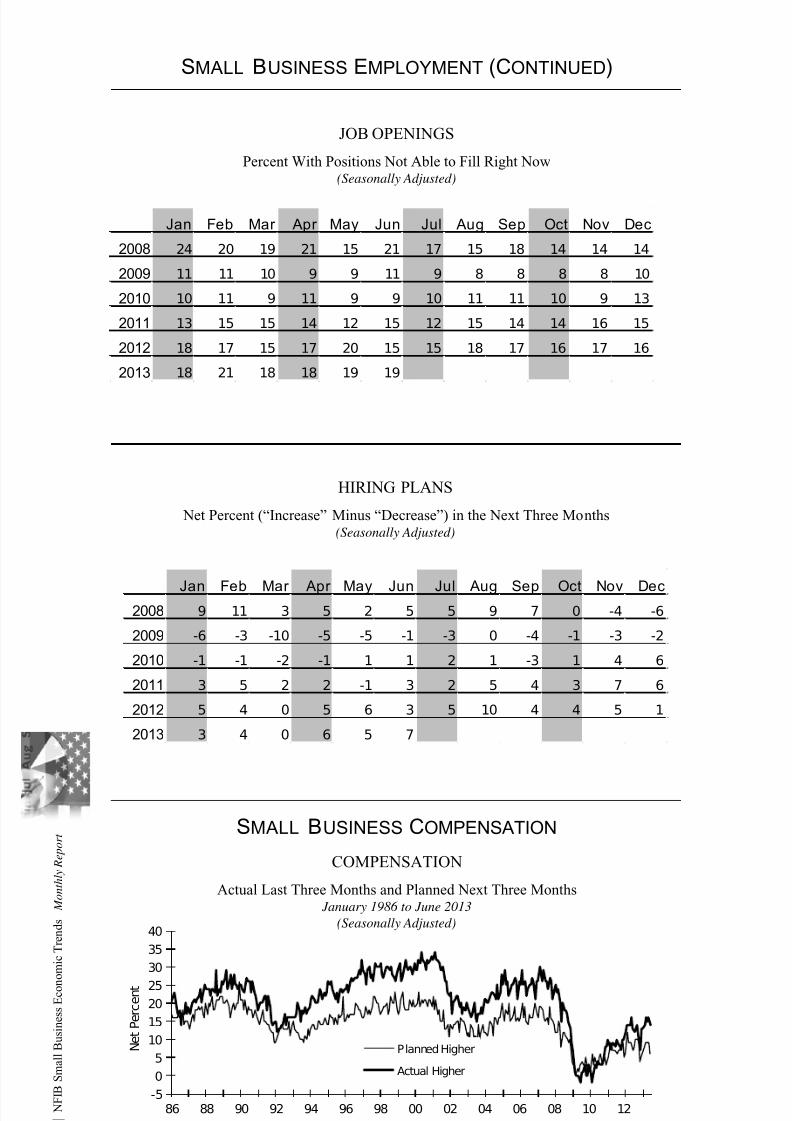
September 2008. Nineteen (19) percent of all owners reported job openings
they could not fill in the current period (unchanged). Twelve (12) percent
reported using temporary workers, little changed over the past 10 years.
Job creation plans rose 2 points to a net 7 percent planning to increase total
employment, better, but still a weak reading. Overall, the labor indicatorsheld up pretty well, suggesting no improvement of any consequence, just
more of the same.
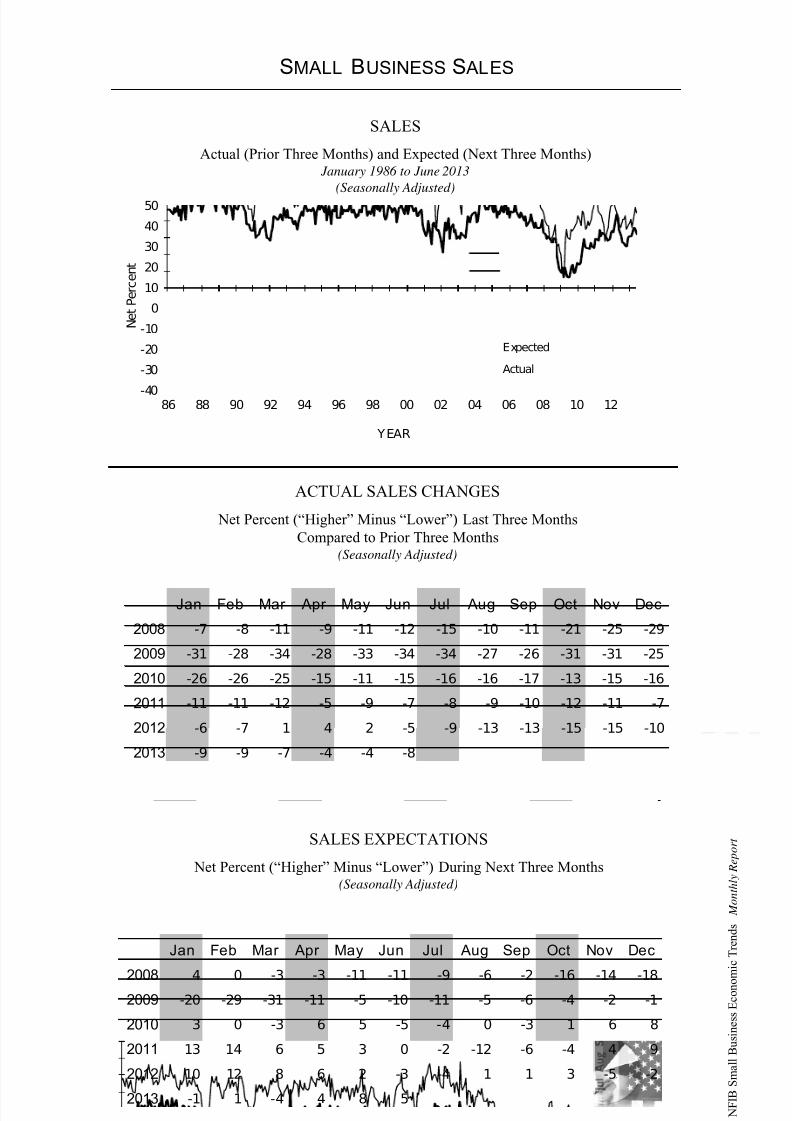
INVENTORIES AND SALES
The net percent of all owners (seasonally adjusted) reporting higher
nominal sales in the past 3 months compared to the prior 3 months gave up
4 points, falling to a negative 8 percent. Eighteen (18) percent still cite
weak sales as their top business problem, historically high, but far better
than the record 34 percent reading last reached in March 2010. The net percent of owners expecting higher real sales volumes lost 3 points, falling
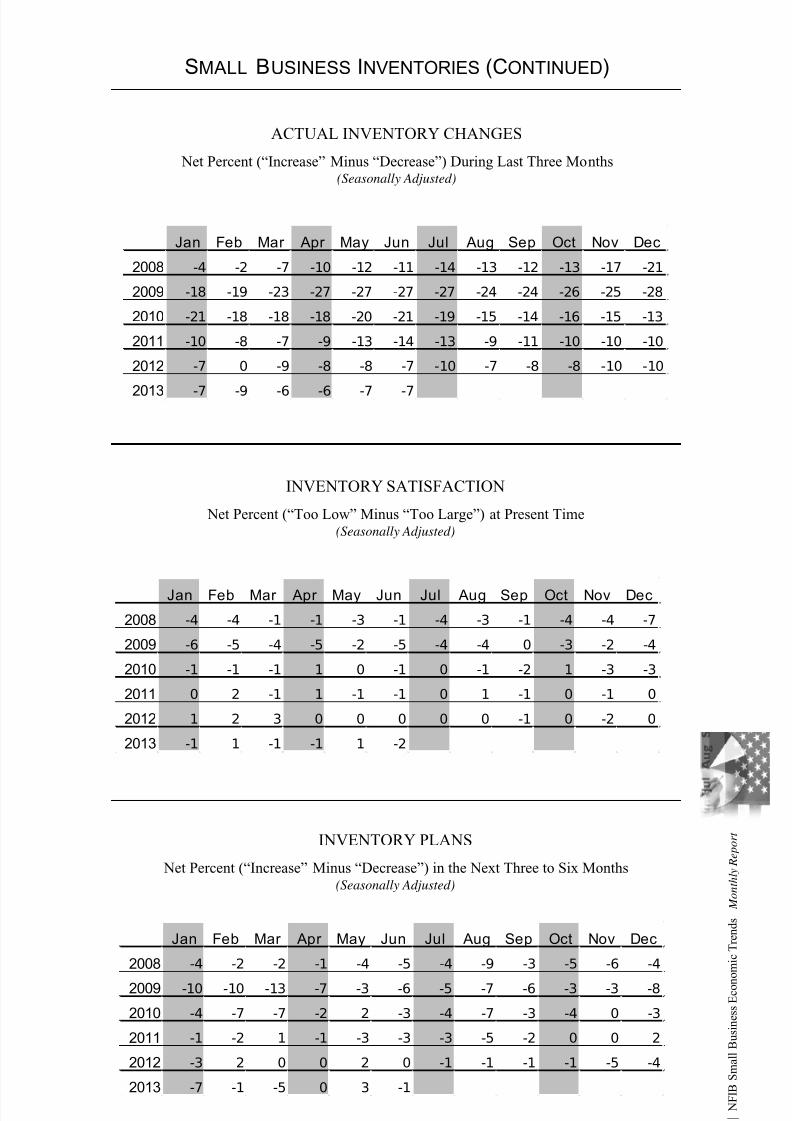
to 5 percent of all owners (seasonally adjusted). The pace of inventory
reduction continued, with a net negative 7 percent of all owners reporting
growth in inventories (seasonally adjusted), unchanged from May.
For all firms, a net negative 2 percent (down 3 points) reported stocks too
low, a sharp deterioration from May and consistent with weak spending
which produces a buildup in stocks. This produced a sharp decline in the
net percent of owners planning to add to inventories, falling 4 points to anegative 1 percent of all firms (seasonally adjusted). Apparently the
optimism of the past few months did not come to fruition, producing a
sharp reversal in the outlook for inventory spending.
This survey was conducted in June 2013. A sample of 3,938 small-business owners/members was drawn.
Six hundred sixty-two (662) usable responses were received – a response rate of 17 percent.
7/28/2019 NFIB Report
http://slidepdf.com/reader/full/nfib-report 4/23
2
| N F I B S m a
l l B u s i n e s s
E c o n o m
i c T r e n
d s
M o n t h l y R e p o r t
CAPITAL SPENDING
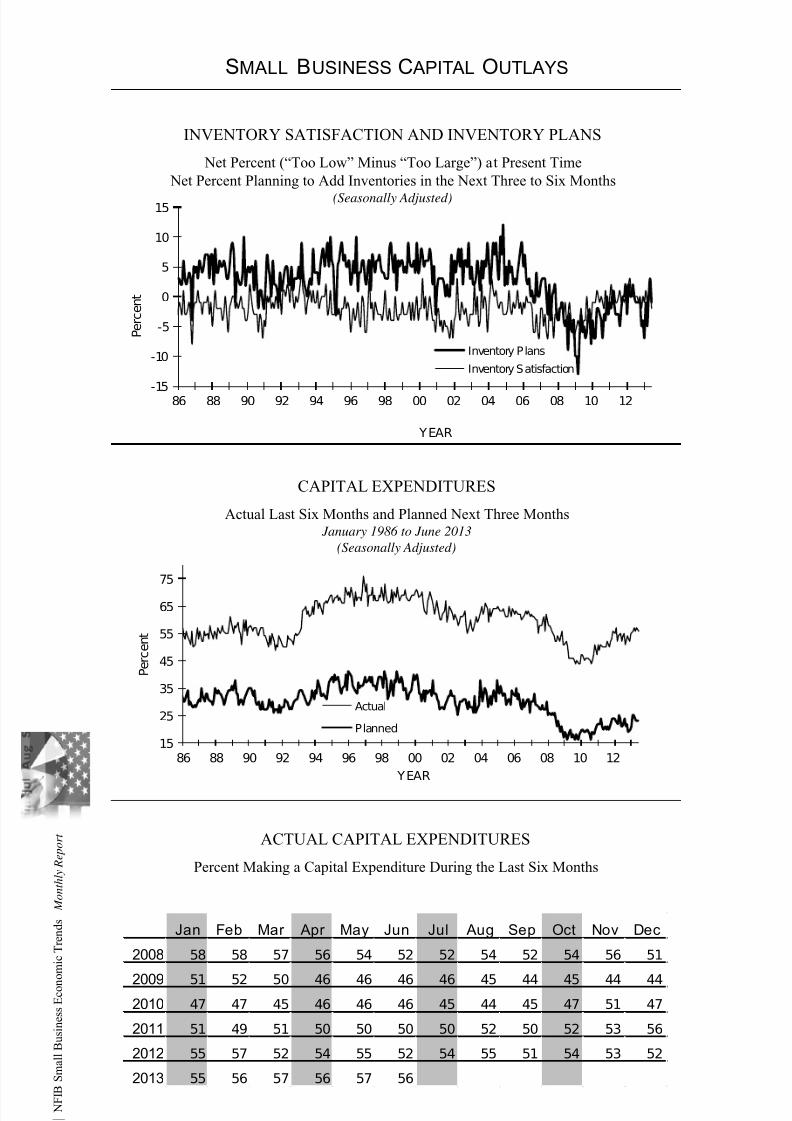
The frequency of reported capital outlays over the past six months fell 1
point to 56 percent, 9 points below the average spending rate through 2007.
Spending overall remains in “replacement mode”, no exuberance inspending, consistent with a dim view of the future for the economy. The
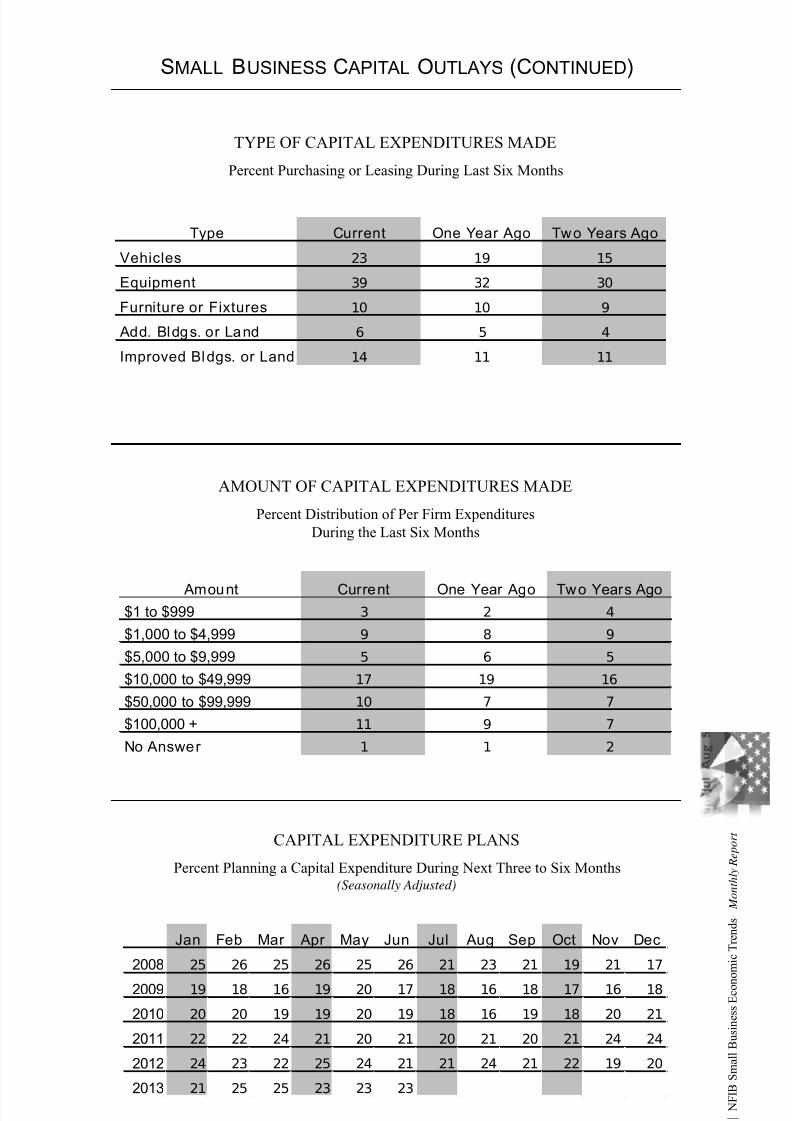
percent of owners planning capital outlays in the next 3 to 6 months was
unchanged at 23 percent. Seven percent characterized the current period as
a good time to expand facilities (down 1 point), a very weak number
compared to an average value of 16 percent pre-recession. The net percent
of owners expecting better business conditions in 6 months was a net
negative 4 percent, a 1 point improvement. A net 5 percent of all owners
expect improved real sales volumes, down 3 points. Eighteen (18) percent
reported “poor sales” as their top business problem, up 2 points, Reported sales trends deteriorated 4 points to a negative 8 percent. These are not
solid numbers and certainly not supportive of a surge in capital spending
this year.
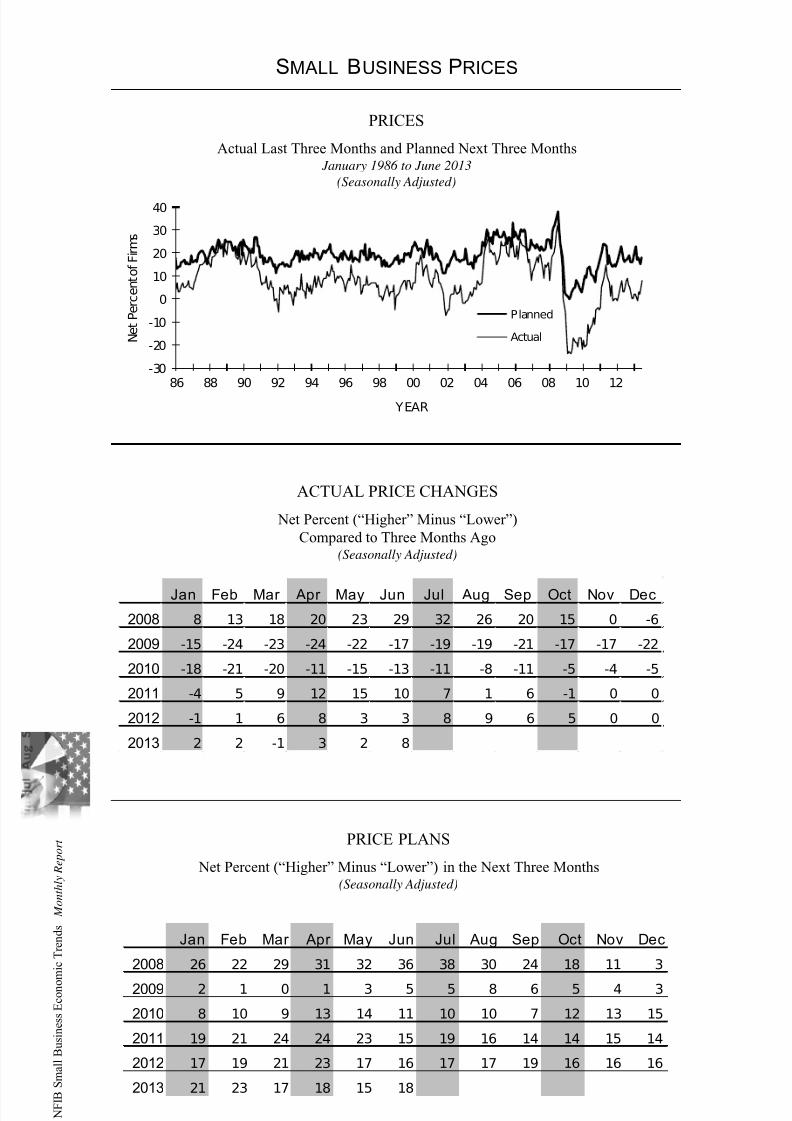
INFLATION
Twelve (12) percent of the NFIB owners reported reducing their average
selling prices in the past 3 months (down 4 points), and 19 percent reported
price increases (unchanged). Seasonally adjusted, a net 18 percent plan
price hikes, up 3 points. Overall, the net percent of owners raising prices
moved back into the post-1983 range, with modest pressure on prices.
There’s no “deflation” on Main Street however and, of course, not much
inflationary pressure either.
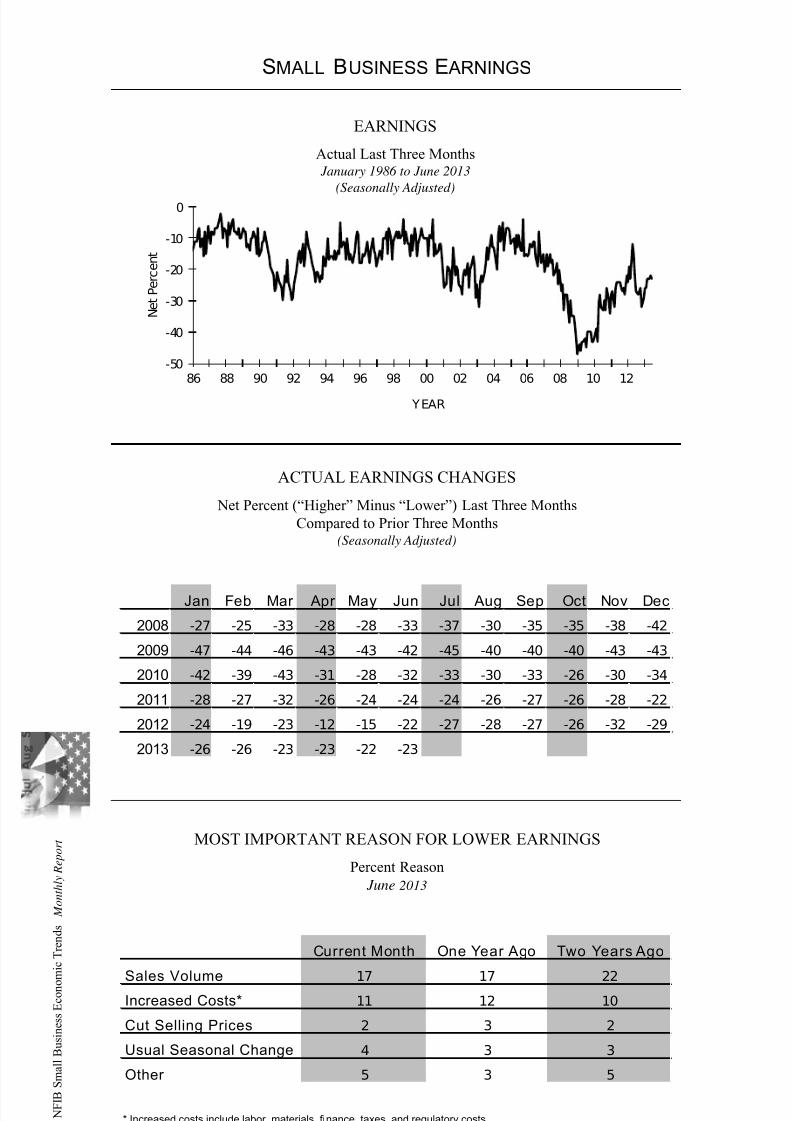
EARNINGS AND WAGES
Reports of positive earnings trends deteriorated 1 point in June to a
negative 23 percent, a poor reading. Four percent reported reduced worker
compensation and 19 percent reported raising compensation, yielding a
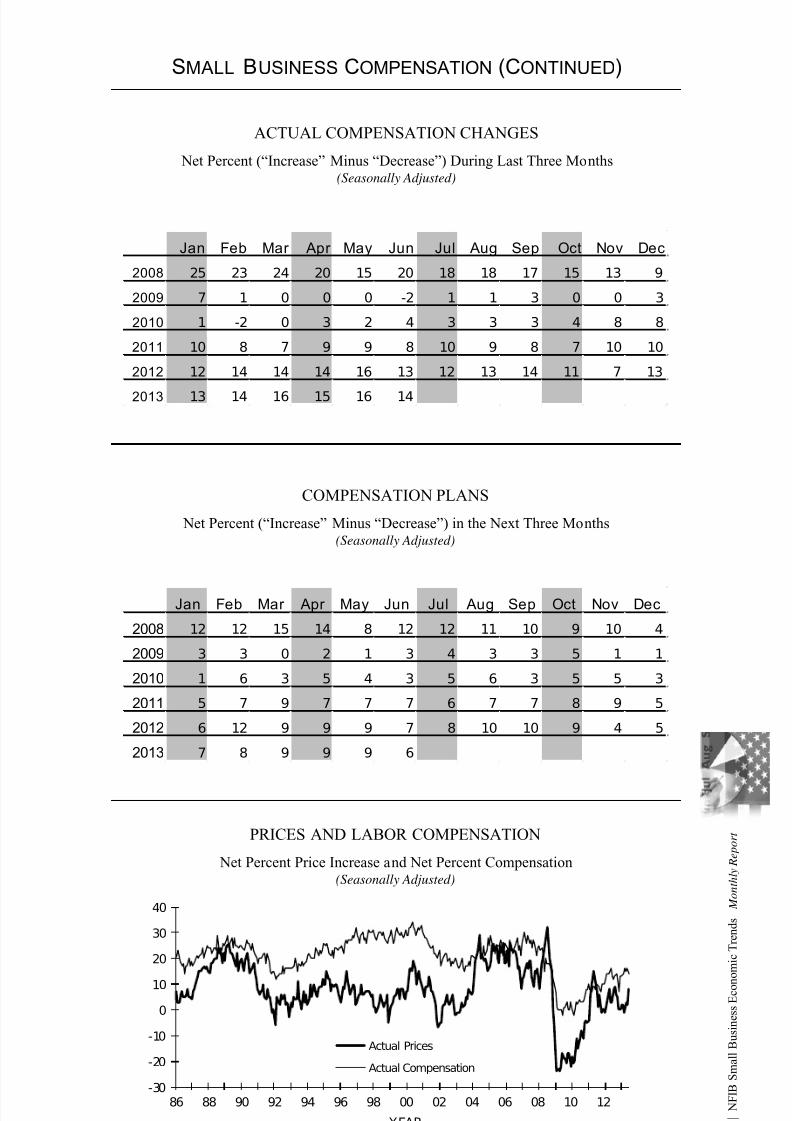
seasonally adjusted net 14 percent reporting higher worker compensation
(down 2 points). A net seasonally adjusted 6 percent plan to raisecompensation in the coming months, down 3 points. Overall, the
compensation picture weakened some, but remained at the higher end of
experience in this recovery even if historically weak.
CREDIT MARKETS
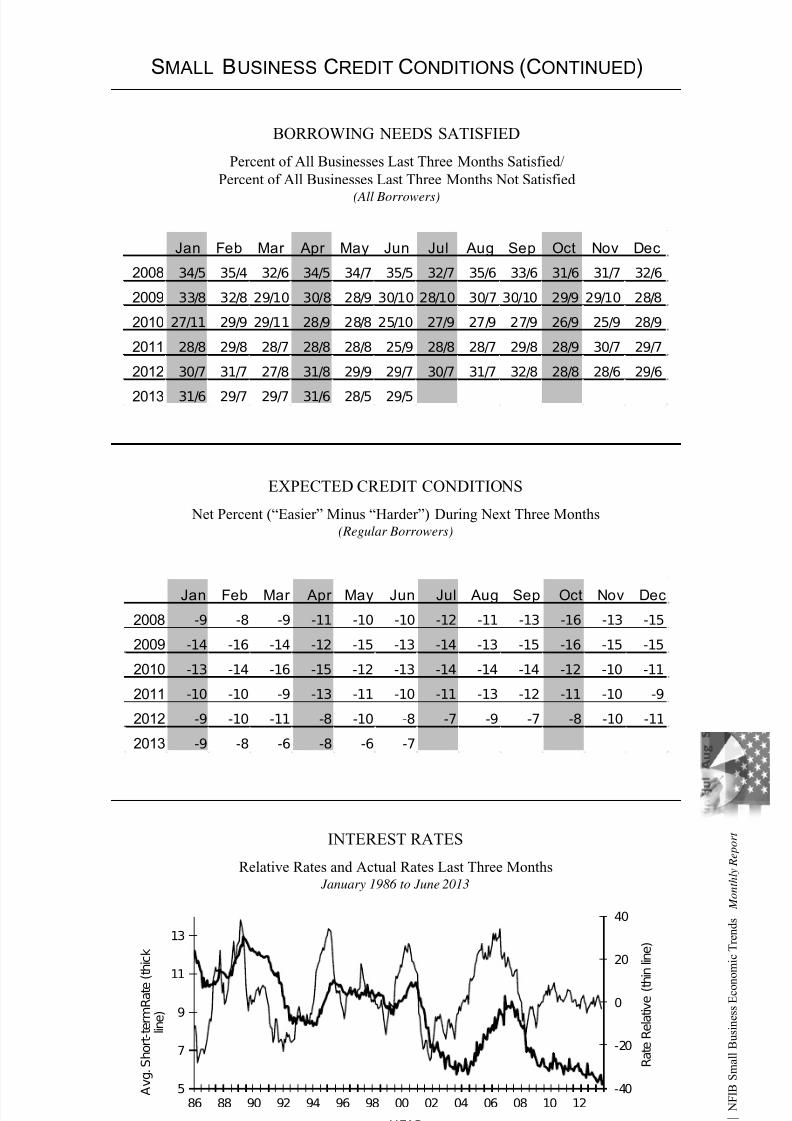
Five percent of the owners reported that all their credit needs were not met,
unchanged and the lowest reading since February 2008. Twenty-nine (29)
percent reported all credit needs met, and 53 percent explicitly said they
did not want a loan. Only 2 percent reported that financing was their top business problem compared to 20 percent citing taxes, 18 percent citing
weak sales and 20 percent citing regulations and red tape. Twenty-nine
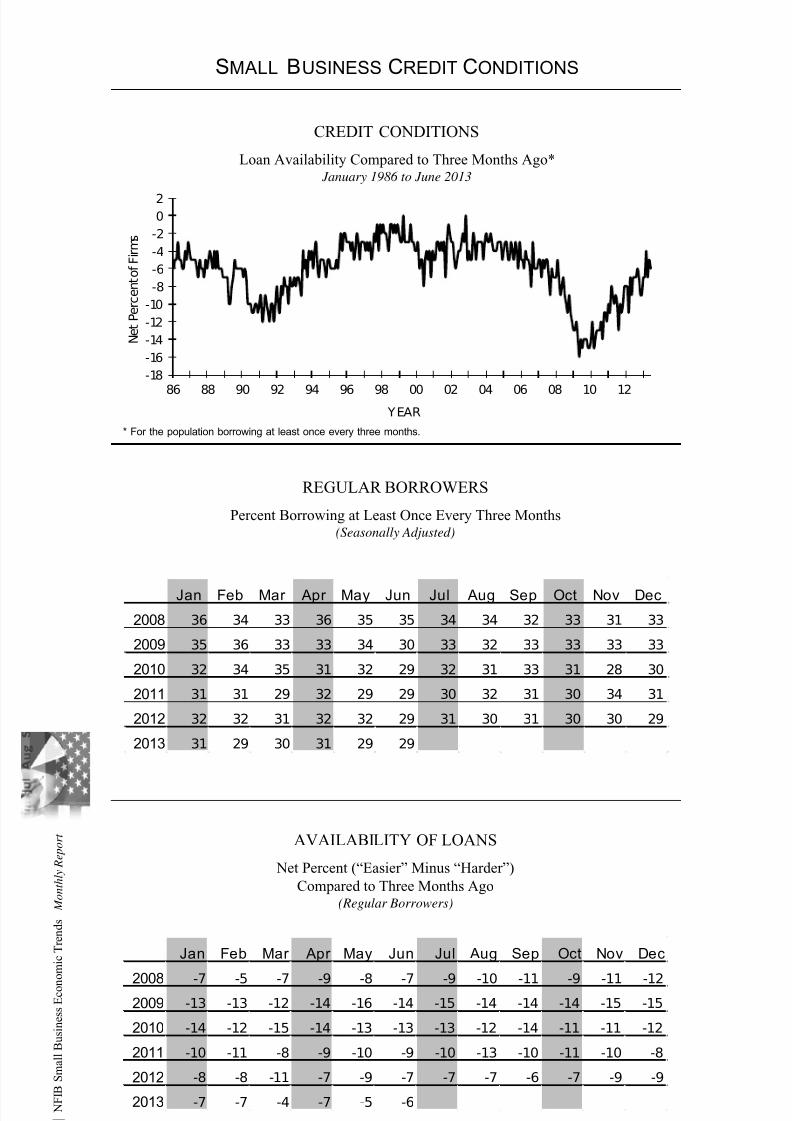
(29) percent of all owners reported borrowing on a regular basis,
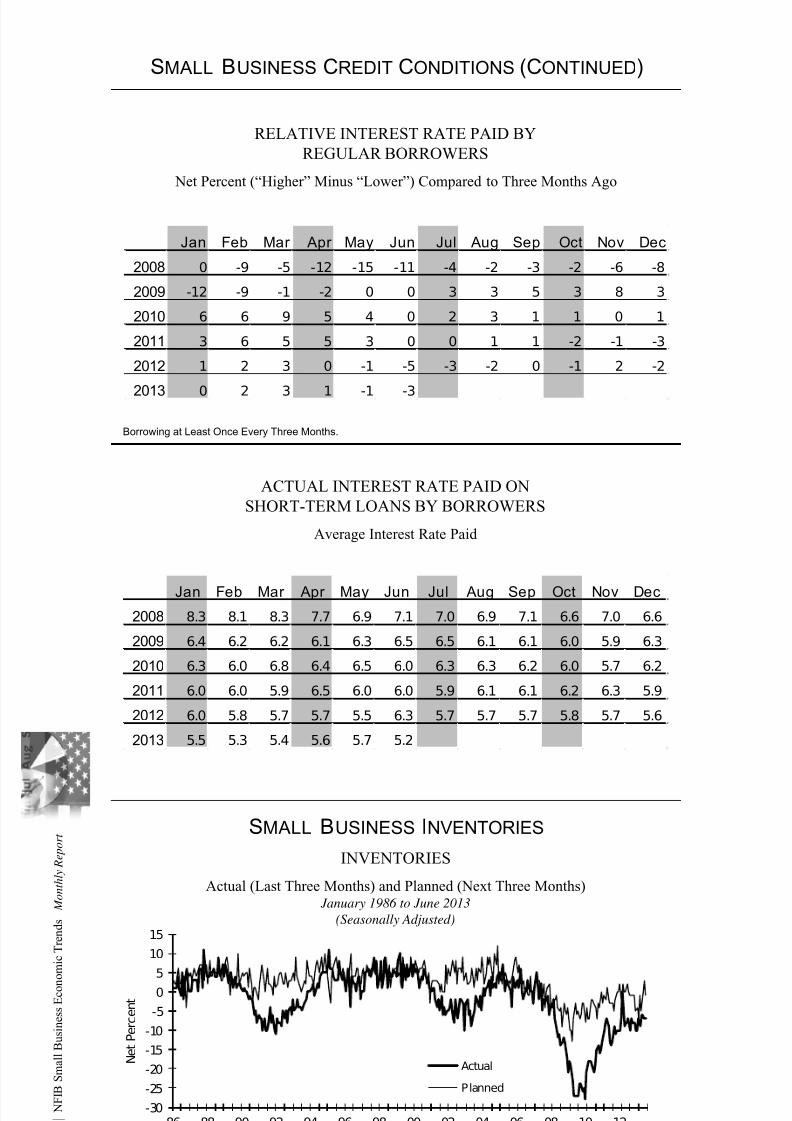
unchanged. A net 6 percent reported loans “harder to get” compared to
their last attempt (asked of regular borrowers only), 1 point worse than last
month. The average rate paid on short maturity loans was 5.2 percent, a
substantial drop from the average for the past year. The net percent of
owners expecting credit conditions to ease in the coming months was a
seasonally adjusted negative 7 percent.
7/28/2019 NFIB Report
http://slidepdf.com/reader/full/nfib-report 5/23
3
| N F I B S m a
l l B u s i n e s s
E c o n o
m i c T r e n
d s
M o n t h l y R e p o r t
COMMENTARY
The revision of first quarter GDP growth to an anemic 1.8 percent at an
annual rate confirms that the economy is growing at a very slow pace, not
enough to produce many new jobs. The largest contributor to the negative
revision was consumer spending, in particular to spending on services,
which account for about 70 percent of consumer spending. This sector is
very labor intensive and a revival of spending there would certainly
improve job creation. Housing is getting better but running into some
supply side constraints. Nearly half the builders complain that they are
having trouble assembling work crews to build new houses while new
home sales are pressing against supply. House prices are rising at double
digit rates.
In the meantime, uncertainty reigns supreme, who knows what labor will
cost or when or what firm size will have to comply with which rules – Health and Human Services is still writing them. The President’s delay for
compliance among those with 50 employees or more is a political move,
fearing the bad press that might occur prior to elections from the chaos
produced by mandatory compliance. It is clear that the government is not
prepared to implement this. Really, a group of people, most with little or
no private sector experience, decided to restructure 15 percent of the Gross
Domestic Product (GDP). This is what we expected, a rolling disaster –
exemptions, special deals, delays, confusion, contradictory regulations.
It’s a bad situation in Washington, scandals, no budget deals, no dealingwith the big problems, our own government agencies taking advantage of
us, Congressional law being suspended by the President, a flood of
executive orders, the threat of higher energy costs (the attack on coal). Not
a good time to bet on the future by hiring lots of workers with uncertain
cost. The NFIB June survey confirms that.
The economy remains “bifurcated”, with the big firms producing most of
the GDP growth with little help from small business. That balance is
shifting, but unfortunately because larger firms are losing ground, not because small business is growing faster. Housing and energy are helping,
and that does involve a lot of small businesses but the rout in housing was
so severe that there are now supply constraints developing in new home
construction due to lost capacity that cannot be easily reconstituted. Home
prices are now increasing at double digit rates. Consumer net worth is
allegedly doing well due to stock prices and house prices rising. But the
quantity of items held, real wealth (houses, cars, fractions of a company
owned), is not increasing that fast, just the prices. Been there, done that.
7/28/2019 NFIB Report
http://slidepdf.com/reader/full/nfib-report 6/23
4
| N F I B S m a
l l B u s i n e s s
E c o n o m
i c T r e n
d s
M o n t h l y R e p o r t
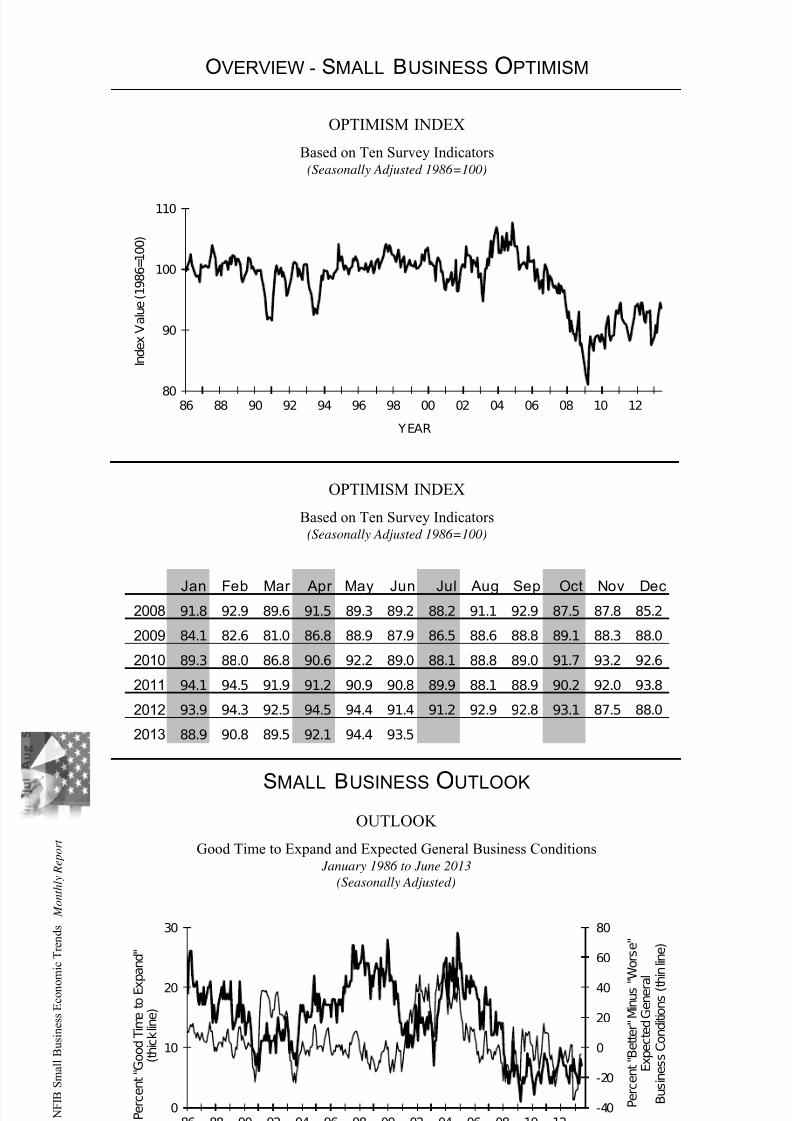
OVERVIEW - SMALL BUSINESS OPTIMISM
OPTIMISM INDEX
Based on Ten Survey Indicators (Seasonally Adjusted 1986=100)
Jan Feb Mar Apr May Jun Jul Aug Sep Oct Nov Dec2008 91.8 92.9 89.6 91.5 89.3 89.2 88.2 91.1 92.9 87.5 87.8 85.2
2009 84.1 82.6 81.0 86.8 88.9 87.9 86.5 88.6 88.8 89.1 88.3 88.0
2010 89.3 88.0 86.8 90.6 92.2 89.0 88.1 88.8 89.0 91.7 93.2 92.6
2011 94.1 94.5 91.9 91.2 90.9 90.8 89.9 88.1 88.9 90.2 92.0 93.8
2012 93.9 94.3 92.5 94.5 94.4 91.4 91.2 92.9 92.8 93.1 87.5 88.0
2013 88.9 90.8 89.5 92.1 94.4 93.5
OPTIMISM INDEX
Based on Ten Survey Indicators (Seasonally Adjusted 1986=100)
OUTLOOK
Good Time to Expand and Expected General Business Conditions January 1986 to June 2013
(Seasonally Adjusted)
SMALL BUSINESS OUTLOOK
80
90
100
110
86 88 90 92 94 96 98 00 02 04 06 08 10 12
I n d e x V a l u e ( 1 9 8 6 = 1 0 0 )
YEAR
-40
-20
0
20
40
60
80
0
10
20
30
86 88 90 92 94 96 98 00 02 04 06 08 10 12 P e r c e n t " G o o d T i m e t o E x p a n d "
( t h i c k l i n e )
P e r c e n t " B e t t e r " M i n u s " W o r s e "
E x p e c t e d G e n e r a
l
B u s i n e s s C o n d i t i o n s ( t h
i n l i n e )
YEAR
7/28/2019 NFIB Report
http://slidepdf.com/reader/full/nfib-report 7/23
5
| N F I B S m a
l l B u s i n e s s
E c o n o
m i c T r e n
d s
M o n t h l y R e p o r t
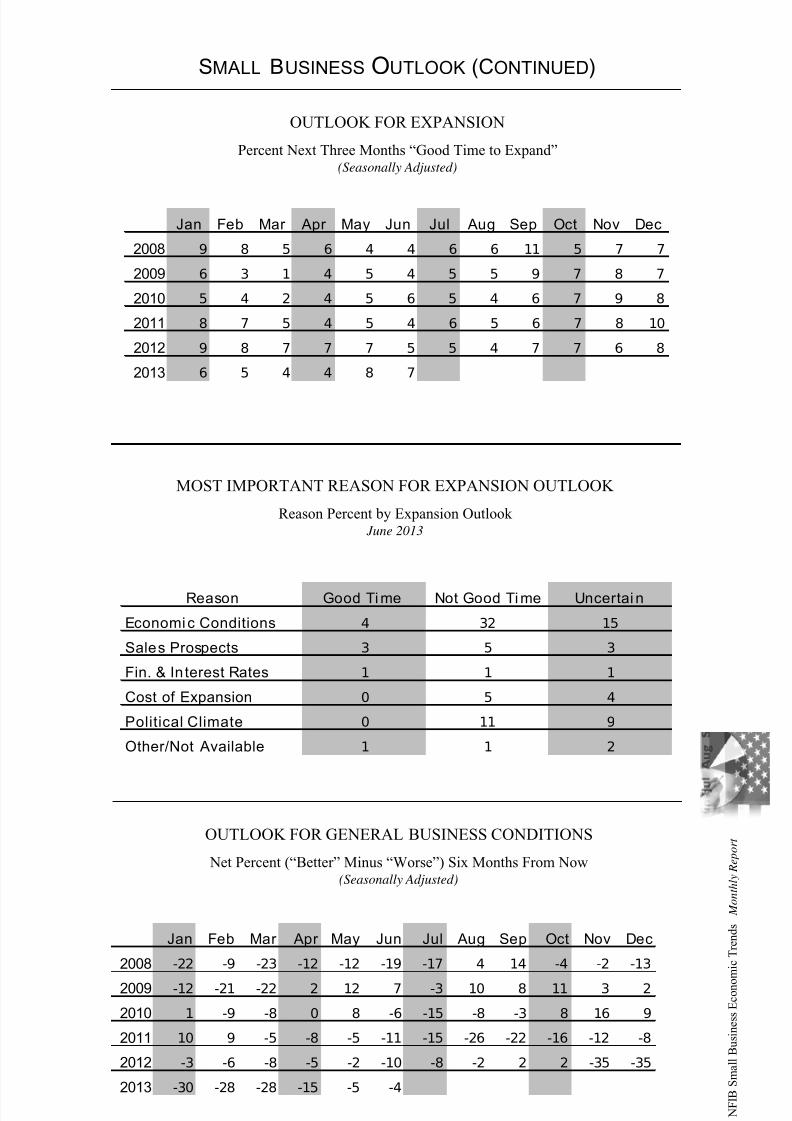
SMALL BUSINESS OUTLOOK (CONTINUED)
Jan Feb Mar Apr May Jun Jul Aug Sep Oct Nov Dec
2008 9 8 5 6 4 4 6 6 11 5 7 7
2009 6 3 1 4 5 4 5 5 9 7 8 7
2010 5 4 2 4 5 6 5 4 6 7 9 8
2011 8 7 5 4 5 4 6 5 6 7 8 10
2012 9 8 7 7 7 5 5 4 7 7 6 8
2013 6 5 4 4 8 7
OUTLOOK FOR EXPANSION
Percent Next Three Months “Good Time to Expand” (Seasonally Adjusted)
MOST IMPORTANT REASON FOR EXPANSION OUTLOOK
Reason Percent by Expansion Outlook June 2013
Reason Good Ti me Not Good Ti me Uncertai n
Economic Conditions 4 32 15
Sales Prospects 3 5 3
Fin. & Interest Rates 1 1 1
Cost of Expansion 0 5 4
Political Climate 0 11 9
Other/Not Available 1 1 2
OUTLOOK FOR GENERAL BUSINESS CONDITIONS
Net Percent (“Better” Minus “Worse”) Six Months From Now(Seasonally Adjusted)
Jan Feb Mar Apr May Jun Jul Aug Sep Oct Nov Dec
2008 -22 -9 -23 -12 -12 -19 -17 4 14 -4 -2 -13
2009 -12 -21 -22 2 12 7 -3 10 8 11 3 2
2010 1 -9 -8 0 8 -6 -15 -8 -3 8 16 9
2011 10 9 -5 -8 -5 -11 -15 -26 -22 -16 -12 -8
2012 -3 -6 -8 -5 -2 -10 -8 -2 2 2 -35 -35
2013 -30 -28 -28 -15 -5 -4
7/28/2019 NFIB Report
http://slidepdf.com/reader/full/nfib-report 8/23
6
| N F I B S m a
l l B u s i n e s s
E c o n o m
i c T r e n
d s
M o n t h l y R e p o r t
SMALL BUSINESS E ARNINGS
EARNINGS
Actual Last Three Months January 1986 to June 2013
(Seasonally Adjusted)
ACTUAL EARNINGS CHANGES
Net Percent (“Higher” Minus “Lower”) Last Three Months
Compared to Prior Three Months(Seasonally Adjusted)
MOST IMPORTANT REASON FOR LOWER EARNINGS
Percent Reason
June 2013
Current Month One Year Ago Two Years Ago
Sales Volume 17 17 22Increased Costs* 11 12 10
Cut Selling Prices 2 3 2
Usual Seasonal Change 4 3 3
Other 5 3 5
Jan Feb Mar Apr May Jun Jul Aug Sep Oct Nov Dec
2008 -27 -25 -33 -28 -28 -33 -37 -30 -35 -35 -38 -42
2009 -47 -44 -46 -43 -43 -42 -45 -40 -40 -40 -43 -43
2010 -42 -39 -43 -31 -28 -32 -33 -30 -33 -26 -30 -34
2011 -28 -27 -32 -26 -24 -24 -24 -26 -27 -26 -28 -22
2012 -24 -19 -23 -12 -15 -22 -27 -28 -27 -26 -32 -29
2013 -26 -26 -23 -23 -22 -23
* Increased costs include labor, materials, finance, taxes, and regulatory costs.
-50
-40
-30
-20
-10
0
86 88 90 92 94 96 98 00 02 04 06 08 10 12
N e t P e r c e n t
YEAR
7/28/2019 NFIB Report
http://slidepdf.com/reader/full/nfib-report 9/23
7
| N F I B S m a
l l B u s i n e s s
E c o n o
m i c T r e n
d s
M o n t h l y R e p o r t
SMALL BUSINESS S ALES
SALES EXPECTATIONS
Net Percent (“Higher” Minus “Lower”) During Next Three Months(Seasonally Adjusted)
ACTUAL SALES CHANGES
Net Percent (“Higher” Minus “Lower”) Last Three Months
Compared to Prior Three Months(Seasonally Adjusted)
SALES
Actual (Prior Three Months) and Expected (Next Three Months) January 1986 to June 2013
(Seasonally Adjusted)
Jan Feb Mar Apr May Jun Jul Aug Sep Oct Nov Dec
2008 -7 -8 -11 -9 -11 -12 -15 -10 -11 -21 -25 -29
2009 -31 -28 -34 -28 -33 -34 -34 -27 -26 -31 -31 -25
2010 -26 -26 -25 -15 -11 -15 -16 -16 -17 -13 -15 -16
2011 -11 -11 -12 -5 -9 -7 -8 -9 -10 -12 -11 -7
2012 -6 -7 1 4 2 -5 -9 -13 -13 -15 -15 -10
2013 -9 -9 -7 -4 -4 -8
Jan Feb Mar Apr May Jun Jul Aug Sep Oct Nov Dec
2008 4 0 -3 -3 -11 -11 -9 -6 -2 -16 -14 -182009 -20 -29 -31 -11 -5 -10 -11 -5 -6 -4 -2 -1
2010 3 0 -3 6 5 -5 -4 0 -3 1 6 8
2011 13 14 6 5 3 0 -2 -12 -6 -4 4 9
2012 10 12 8 6 2 -3 -4 1 1 3 -5 -2
2013 -1 1 -4 4 8 5
-40
-30
-20
-10
0
10
20
30
40
50
86 88 90 92 94 96 98 00 02 04 06 08 10 12
Expected
Actual
N e t P e r c e n t
YEAR
7/28/2019 NFIB Report
http://slidepdf.com/reader/full/nfib-report 10/23
8
| N F I B S m a
l l B u s i n e s s
E c o n o m
i c T r e n
d s
M o n t h l y R e p o r t
SMALL BUSINESS PRICES
PRICE PLANS
Net Percent (“Higher” Minus “Lower”) in the Next Three Months(Seasonally Adjusted)
ACTUAL PRICE CHANGES
Net Percent (“Higher” Minus “Lower”)
Compared to Three Months Ago(Seasonally Adjusted)
PRICES
Actual Last Three Months and Planned Next Three Months January 1986 to June 2013
(Seasonally Adjusted)
Jan Feb Mar Apr May Jun Jul Aug Sep Oct Nov Dec
2008 8 13 18 20 23 29 32 26 20 15 0 -6
2009 -15 -24 -23 -24 -22 -17 -19 -19 -21 -17 -17 -22
2010 -18 -21 -20 -11 -15 -13 -11 -8 -11 -5 -4 -5
2011 -4 5 9 12 15 10 7 1 6 -1 0 0
2012 -1 1 6 8 3 3 8 9 6 5 0 0
2013 2 2 -1 3 2 8
Jan Feb Mar Apr May Jun Jul Aug Sep Oct Nov Dec
2008 26 22 29 31 32 36 38 30 24 18 11 3
2009 2 1 0 1 3 5 5 8 6 5 4 3
2010 8 10 9 13 14 11 10 10 7 12 13 15
2011 19 21 24 24 23 15 19 16 14 14 15 14
2012 17 19 21 23 17 16 17 17 19 16 16 16
2013 21 23 17 18 15 18
-30
-20
-10
0
10
20
30
40
86 88 90 92 94 96 98 00 02 04 06 08 10 12
Planned
Actual N e t P e r c e n t o f F i r m s
YEAR
7/28/2019 NFIB Report
http://slidepdf.com/reader/full/nfib-report 11/23
9
| N F I B S m a
l l B u s i n e s s
E c o n o
m i c T r e n
d s
M o n t h l y R e p o r t
SMALL BUSINESS EMPLOYMENT
Jan Feb Mar Apr May Jun Jul Aug Sep Oct Nov Dec
2008 0 -3 -7 -9 -10 -12 -5 -4 -10 -9 -10 -18
2009 -15 -15 -22 -25 -24 -23 -17 -16 -16 -12 -12 -12
2010 -10 -9 -11 -12 -12 -10 -5 -2 -3 -6 -2 -1
2011 -4 -2 -4 -6 -3 -7 -2 -2 -5 0 2 1
2012 0 -2 -3 -4 -5 -3 1 2 -3 1 -1 -2
2013 2 -2 -2 -2 -3 -1
ACTUAL EMPLOYMENT CHANGES
Net Percent (“Increase” Minus “Decrease”) in the Last Three Months(Seasonally Adjusted)
QUALIFIED APPLICANTS FOR JOB OPENINGS
Percent Few or No Qualified Applicants(Seasonally Adjusted)
EMPLOYMENT
Planned Next Three Months and Current Job Openings January 1986 to June 2013
(Seasonally Adjusted)
-10
0
10
20
30
40
86 88 90 92 94 96 98 00 02 04 06 08 10 12
Planned
J ob Openings
YEAR
P e r c e n t
Jan Feb Mar Apr May Jun Jul Aug Sep Oct Nov Dec2008 37 36 36 37 33 39 36 35 38 35 31 30
2009 * * 24 24 25 27 26 23 25 25 28 21
2010 24 26 23 26 26 25 28 32 30 28 27 28
2011 28 30 29 32 30 33 31 33 34 31 35 34
2012 31 31 32 34 37 33 38 37 41 38 36 33
2013 34 34 36 38 38 41
7/28/2019 NFIB Report
http://slidepdf.com/reader/full/nfib-report 12/23
1 0
| N F I B S m a
l l B u s i n e s s
E c o n
o m
i c T r e n
d s
M o n t h l y R e p o r t
SMALL BUSINESS EMPLOYMENT (CONTINUED)
JOB OPENINGS
Percent With Positions Not Able to Fill Right Now(Seasonally Adjusted)
HIRING PLANS
Net Percent (“Increase” Minus “Decrease”) in the Next Three Months(Seasonally Adjusted)
Jan Feb Mar Apr May Jun Jul Aug Sep Oct Nov Dec2008 9 11 3 5 2 5 5 9 7 0 -4 -6
2009 -6 -3 -10 -5 -5 -1 -3 0 -4 -1 -3 -2
2010 -1 -1 -2 -1 1 1 2 1 -3 1 4 6
2011 3 5 2 2 -1 3 2 5 4 3 7 6
2012 5 4 0 5 6 3 5 10 4 4 5 1
2013 3 4 0 6 5 7
SMALL BUSINESS COMPENSATION
COMPENSATION
Actual Last Three Months and Planned Next Three Months January 1986 to June 2013
(Seasonally Adjusted)
-5
0
5
10
15
20
25
30
35
40
86 88 90 92 94 96 98 00 02 04 06 08 10 12
N e t P e r c e n t
YEAR
Planned Higher
Actual Higher
Jan Feb Mar Apr May Jun Jul Aug Sep Oct Nov Dec
2008 24 20 19 21 15 21 17 15 18 14 14 14
2009 11 11 10 9 9 11 9 8 8 8 8 10
2010 10 11 9 11 9 9 10 11 11 10 9 13
2011 13 15 15 14 12 15 12 15 14 14 16 15
2012 18 17 15 17 20 15 15 18 17 16 17 16
2013 18 21 18 18 19 19
7/28/2019 NFIB Report
http://slidepdf.com/reader/full/nfib-report 13/23
1 1
| N F I B S m a
l l B u s i n e s s
E c o n
o m
i c T r e n
d s
M o n t h l y R e p o r t
SMALL BUSINESS COMPENSATION (CONTINUED)
ACTUAL COMPENSATION CHANGES
Net Percent (“Increase” Minus “Decrease”) During Last Three Months(Seasonally Adjusted)
Jan Feb Mar Apr May Jun Jul Aug Sep Oct Nov Dec
2008 25 23 24 20 15 20 18 18 17 15 13 9
2009 7 1 0 0 0 -2 1 1 3 0 0 3
2010 1 -2 0 3 2 4 3 3 3 4 8 8
2011 10 8 7 9 9 8 10 9 8 7 10 10
2012 12 14 14 14 16 13 12 13 14 11 7 13
2013 13 14 16 15 16 14
Jan Feb Mar Apr May Jun Jul Aug Sep Oct Nov Dec
2008 12 12 15 14 8 12 12 11 10 9 10 4
2009 3 3 0 2 1 3 4 3 3 5 1 1
2010 1 6 3 5 4 3 5 6 3 5 5 3
2011 5 7 9 7 7 7 6 7 7 8 9 5
2012 6 12 9 9 9 7 8 10 10 9 4 5
2013 7 8 9 9 9 6
COMPENSATION PLANS
Net Percent (“Increase” Minus “Decrease”) in the Next Three Months(Seasonally Adjusted)
PRICES AND LABOR COMPENSATION
Net Percent Price Increase and Net Percent Compensation (Seasonally Adjusted)
-30
-20
-10
0
10
20
30
40
86 88 90 92 94 96 98 00 02 04 06 08 10 12
Actual Prices
Actual Compensation
YEAR
7/28/2019 NFIB Report
http://slidepdf.com/reader/full/nfib-report 14/23
1 2
| N F I B S m a
l l B u s i n e s s
E c o n
o m
i c T r e n
d s
M o n t h l y R e p o r t
SMALL BUSINESS CREDIT CONDITIONS
CREDIT CONDITIONS
Loan Availability Compared to Three Months Ago* January 1986 to June 2013
* For the population borrowing at least once every three months.
REGULAR BORROWERS
Percent Borrowing at Least Once Every Three Months(Seasonally Adjusted)
Jan Feb Mar Apr May Jun Jul Aug Sep Oct Nov Dec
2008 36 34 33 36 35 35 34 34 32 33 31 33
2009 35 36 33 33 34 30 33 32 33 33 33 33
2010 32 34 35 31 32 29 32 31 33 31 28 30
2011 31 31 29 32 29 29 30 32 31 30 34 31
2012 32 32 31 32 32 29 31 30 31 30 30 29
2013 31 29 30 31 29 29
AVAILABILITY OF LOANS
Net Percent (“Easier” Minus “Harder”)
Compared to Three Months Ago(Regular Borrowers)
Jan Feb Mar Apr May Jun Jul Aug Sep Oct Nov Dec
2008 -7 -5 -7 -9 -8 -7 -9 -10 -11 -9 -11 -122009 -13 -13 -12 -14 -16 -14 -15 -14 -14 -14 -15 -15
2010 -14 -12 -15 -14 -13 -13 -13 -12 -14 -11 -11 -12
2011 -10 -11 -8 -9 -10 -9 -10 -13 -10 -11 -10 -8
2012 -8 -8 -11 -7 -9 -7 -7 -7 -6 -7 -9 -9
2013 -7 -7 -4 -7 -5 -6
-18
-16
-14
-12
-10
-8
-6
-4
-2
02
86 88 90 92 94 96 98 00 02 04 06 08 10 12
N e t P e r c e n t o f F i r m s
YEAR
7/28/2019 NFIB Report
http://slidepdf.com/reader/full/nfib-report 15/23
1 3
| N F I B S m a
l l B u s i n e s s
E c o n
o m
i c T r e n
d s
M o n t h l y R e p o r t
SMALL BUSINESS CREDIT CONDITIONS (CONTINUED)
Jan Feb Mar Apr May Jun Jul Aug Sep Oct Nov Dec
2008 34/5 35/4 32/6 34/5 34/7 35/5 32/7 35/6 33/6 31/6 31/7 32/6
2009 33/8 32/8 29/10 30/8 28/9 30/10 28/10 30/7 30/10 29/9 29/10 28/8
2010 27/11 29/9 29/11 28/9 28/8 25/10 27/9 27/9 27/9 26/9 25/9 28/9
2011 28/8 29/8 28/7 28/8 28/8 25/9 28/8 28/7 29/8 28/9 30/7 29/7
2012 30/7 31/7 27/8 31/8 29/9 29/7 30/7 31/7 32/8 28/8 28/6 29/6
2013 31/6 29/7 29/7 31/6 28/5 29/5
BORROWING NEEDS SATISFIED
Percent of All Businesses Last Three Months Satisfied/
Percent of All Businesses Last Three Months Not Satisfied
(All Borrowers)
Jan Feb Mar Apr May Jun Jul Aug Sep Oct Nov Dec
2008 -9 -8 -9 -11 -10 -10 -12 -11 -13 -16 -13 -15
2009 -14 -16 -14 -12 -15 -13 -14 -13 -15 -16 -15 -15
2010 -13 -14 -16 -15 -12 -13 -14 -14 -14 -12 -10 -11
2011 -10 -10 -9 -13 -11 -10 -11 -13 -12 -11 -10 -9
2012 -9 -10 -11 -8 -10 -8 -7 -9 -7 -8 -10 -11
2013 -9 -8 -6 -8 -6 -7
EXPECTED CREDIT CONDITIONS
Net Percent (“Easier” Minus “Harder”) During Next Three Months(Regular Borrowers)
INTEREST RATES
Relative Rates and Actual Rates Last Three Months January 1986 to June 2013
-40
-20
0
20
40
5
7
9
11
13
86 88 90 92 94 96 98 00 02 04 06 08 10 12
YEAR
A v g . S
h o r t - t e r m R a t e ( t h i c k
l i n e )
R a t e R e l a t i v e ( t h
i n l i n e )
7/28/2019 NFIB Report
http://slidepdf.com/reader/full/nfib-report 16/23
1 4
| N F I B S m a
l l B u s i n e s s
E c o n
o m
i c T r e n
d s
M o n t h l y R e p o r t
SMALL BUSINESS CREDIT CONDITIONS (CONTINUED)
Jan Feb Mar Apr May Jun Jul Aug Sep Oct Nov Dec
2008 0 -9 -5 -12 -15 -11 -4 -2 -3 -2 -6 -8
2009 -12 -9 -1 -2 0 0 3 3 5 3 8 3
2010 6 6 9 5 4 0 2 3 1 1 0 1
2011 3 6 5 5 3 0 0 1 1 -2 -1 -3
2012 1 2 3 0 -1 -5 -3 -2 0 -1 2 -2
2013 0 2 3 1 -1 -3
RELATIVE INTEREST RATE PAID BY
REGULAR BORROWERS
Net Percent (“Higher” Minus “Lower”) Compared to Three Months Ago
Borrowing at Least Once Every Three Months.
ACTUAL INTEREST RATE PAID ON
SHORT-TERM LOANS BY BORROWERS
Average Interest Rate Paid
Jan Feb Mar Apr May Jun Jul Aug Sep Oct Nov Dec
2008 8.3 8.1 8.3 7.7 6.9 7.1 7.0 6.9 7.1 6.6 7.0 6.6
2009 6.4 6.2 6.2 6.1 6.3 6.5 6.5 6.1 6.1 6.0 5.9 6.3
2010 6.3 6.0 6.8 6.4 6.5 6.0 6.3 6.3 6.2 6.0 5.7 6.2
2011 6.0 6.0 5.9 6.5 6.0 6.0 5.9 6.1 6.1 6.2 6.3 5.9
2012 6.0 5.8 5.7 5.7 5.5 6.3 5.7 5.7 5.7 5.8 5.7 5.6
2013 5.5 5.3 5.4 5.6 5.7 5.2
SMALL BUSINESS INVENTORIES
INVENTORIES
Actual (Last Three Months) and Planned (Next Three Months) January 1986 to June 2013
(Seasonally Adjusted)
-30
-25
-20
-15
-10
-5
0
5
10
15
86 88 90 92 94 96 98 00 02 04 06 08 10 12
Actual
Planned
N e t P e r c e n t
YEAR
7/28/2019 NFIB Report
http://slidepdf.com/reader/full/nfib-report 17/23
1 5
| N F I B S m a
l l B u s i n e s s
E c o n
o m
i c T r e n
d s
M o n t h l y R e p o r t
SMALL BUSINESS INVENTORIES (CONTINUED)
ACTUAL INVENTORY CHANGES
Net Percent (“Increase” Minus “Decrease”) During Last Three Months(Seasonally Adjusted)
Jan Feb Mar Apr May Jun Jul Aug Sep Oct Nov Dec
2008 -4 -2 -7 -10 -12 -11 -14 -13 -12 -13 -17 -21
2009 -18 -19 -23 -27 -27 -27 -27 -24 -24 -26 -25 -28
2010 -21 -18 -18 -18 -20 -21 -19 -15 -14 -16 -15 -13
2011 -10 -8 -7 -9 -13 -14 -13 -9 -11 -10 -10 -10
2012 -7 0 -9 -8 -8 -7 -10 -7 -8 -8 -10 -10
2013 -7 -9 -6 -6 -7 -7
INVENTORY SATISFACTION
Net Percent (“Too Low” Minus “Too Large”) at Present Time(Seasonally Adjusted)
Jan Feb Mar Apr May Jun Jul Aug Sep Oct Nov Dec
2008 -4 -4 -1 -1 -3 -1 -4 -3 -1 -4 -4 -7
2009 -6 -5 -4 -5 -2 -5 -4 -4 0 -3 -2 -4
2010 -1 -1 -1 1 0 -1 0 -1 -2 1 -3 -3
2011 0 2 -1 1 -1 -1 0 1 -1 0 -1 0
2012 1 2 3 0 0 0 0 0 -1 0 -2 0
2013 -1 1 -1 -1 1 -2
INVENTORY PLANS
Net Percent (“Increase” Minus “Decrease”) in the Next Three to Six Months(Seasonally Adjusted)
Jan Feb Mar Apr May Jun Jul Aug Sep Oct Nov Dec
2008 -4 -2 -2 -1 -4 -5 -4 -9 -3 -5 -6 -4
2009 -10 -10 -13 -7 -3 -6 -5 -7 -6 -3 -3 -8
2010 -4 -7 -7 -2 2 -3 -4 -7 -3 -4 0 -3
2011 -1 -2 1 -1 -3 -3 -3 -5 -2 0 0 2
2012 -3 2 0 0 2 0 -1 -1 -1 -1 -5 -4
2013 -7 -1 -5 0 3 -1
7/28/2019 NFIB Report
http://slidepdf.com/reader/full/nfib-report 18/23
1 6
| N F I B S m a
l l B u s i n e s s
E c o n
o m
i c T r e n
d s
M o n t h l y R e p o r t
SMALL BUSINESS C APITAL OUTLAYS
CAPITAL EXPENDITURES
Actual Last Six Months and Planned Next Three Months January 1986 to June 2013
(Seasonally Adjusted)
ACTUAL CAPITAL EXPENDITURES
Percent Making a Capital Expenditure During the Last Six Months
Jan Feb Mar Apr May Jun Jul Aug Sep Oct Nov Dec
2008 58 58 57 56 54 52 52 54 52 54 56 51
2009 51 52 50 46 46 46 46 45 44 45 44 44
2010 47 47 45 46 46 46 45 44 45 47 51 47
2011 51 49 51 50 50 50 50 52 50 52 53 56
2012 55 57 52 54 55 52 54 55 51 54 53 52
2013 55 56 57 56 57 56
INVENTORY SATISFACTION AND INVENTORY PLANS
Net Percent (“Too Low” Minus “Too Large”) at Present Time
Net Percent Planning to Add Inventories in the Next Three to Six Months
(Seasonally Adjusted)
-15
-10
-5
0
5
10
15
86 88 90 92 94 96 98 00 02 04 06 08 10 12
Inventory Plans
Inventory Satisfaction
P e r c e n t
YEAR
15
25
35
45
55
65
75
86 88 90 92 94 96 98 00 02 04 06 08 10 12
P e r c e n t
YEAR
Actual
Planned
7/28/2019 NFIB Report
http://slidepdf.com/reader/full/nfib-report 19/23
1 7
| N F I B S m a
l l B u s i n e s s
E c o n
o m
i c T r e n
d s
M o n t h l y R e p o r t
SMALL BUSINESS C APITAL OUTLAYS (CONTINUED)
AMOUNT OF CAPITAL EXPENDITURES MADE
Percent Distribution of Per Firm Expenditures
During the Last Six Months
Amount Current One Year Ago Two Years Ago$1 to $999 3 2 4
$1,000 to $4,999 9 8 9
$5,000 to $9,999 5 6 5
$10,000 to $49,999 17 19 16
$50,000 to $99,999 10 7 7
$100,000 + 11 9 7
No Answer 1 1 2
CAPITAL EXPENDITURE PLANS
Percent Planning a Capital Expenditure During Next Three to Six Months (Seasonally Adjusted)
Jan Feb Mar Apr May Jun Jul Aug Sep Oct Nov Dec
2008 25 26 25 26 25 26 21 23 21 19 21 17
2009 19 18 16 19 20 17 18 16 18 17 16 18
2010 20 20 19 19 20 19 18 16 19 18 20 21
2011 22 22 24 21 20 21 20 21 20 21 24 24
2012 24 23 22 25 24 21 21 24 21 22 19 20
2013 21 25 25 23 23 23
TYPE OF CAPITAL EXPENDITURES MADE
Percent Purchasing or Leasing During Last Six Months
Type Current One Year Ago Two Years Ago
Vehicles 23 19 15
Equipment 39 32 30
Furniture or Fixtures 10 10 9
Add. Bldgs. or Land 6 5 4
Improved Bldgs. or Land 14 11 11
7/28/2019 NFIB Report
http://slidepdf.com/reader/full/nfib-report 20/23
1 8
| N F I B S m a
l l B u s i n e s s
E c o n
o m
i c T r e n
d s
M o n t h l y R e p o r t
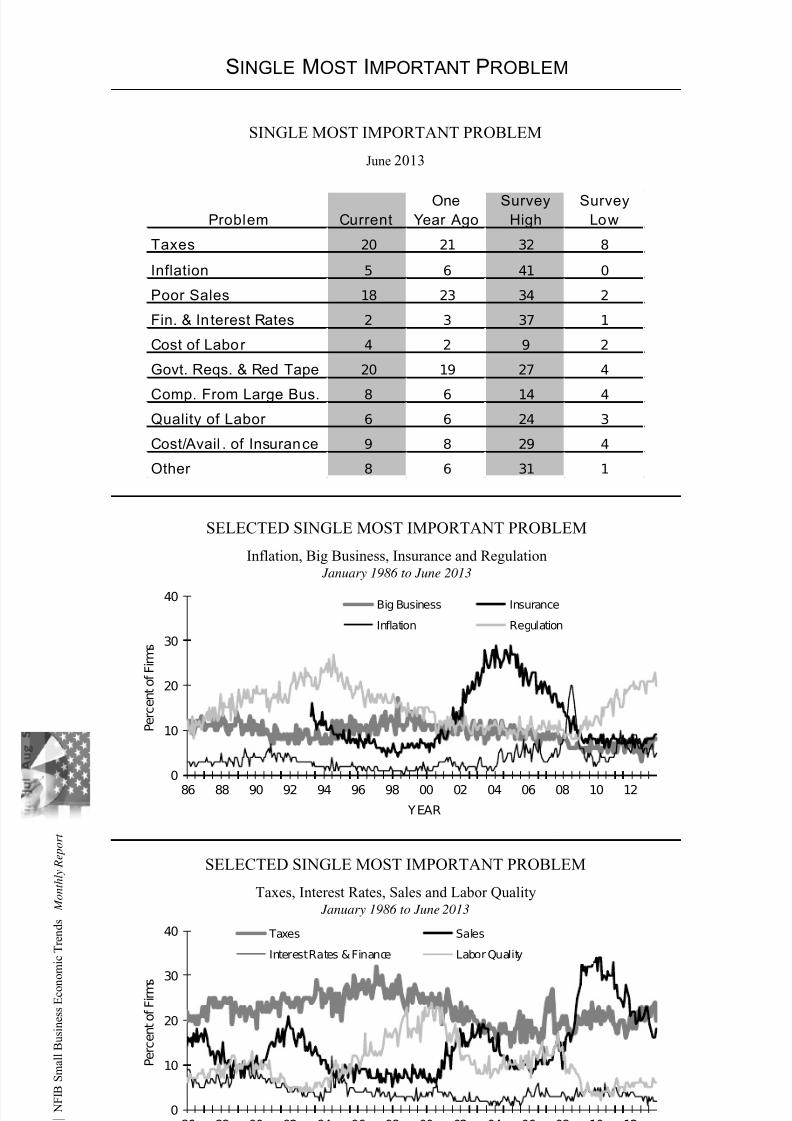
SINGLE MOST IMPORTANT PROBLEM
SINGLE MOST IMPORTANT PROBLEM
June 2013
Problem CurrentOne
Year AgoSurvey
HighSurvey
Low
Taxes 20 21 32 8
Inflation 5 6 41 0
Poor Sales 18 23 34 2
Fin. & Interest Rates 2 3 37 1
Cost of Labor 4 2 9 2
Govt. Reqs. & Red Tape 20 19 27 4
Comp. From Large Bus. 8 6 14 4
Quality of Labor 6 6 24 3
Cost/Avail . of Insurance 9 8 29 4
Other 8 6 31 1
SELECTED SINGLE MOST IMPORTANT PROBLEM
Inflation, Big Business, Insurance and Regulation January 1986 to June 2013
0
10
20
30
40
86 88 90 92 94 96 98 00 02 04 06 08 10 12
Big Business Insurance
Inflation Regulation
P e r c e n t o f F i r m s
YEAR
SELECTED SINGLE MOST IMPORTANT PROBLEM
Taxes, Interest Rates, Sales and Labor Quality January 1986 to June 2013
0
10
20
30
40
86 88 90 92 94 96 98 00 02 04 06 08 10 12
Taxes Sales
Interest Rates & Finance Labor Quality
P e r c e n t o f F i r m s
YEAR
7/28/2019 NFIB Report
http://slidepdf.com/reader/full/nfib-report 21/23
1 9
| N F I B S m a
l l B u s i n e s s
E c o n
o m
i c T r e n
d s
M o n t h l y R e p o r t
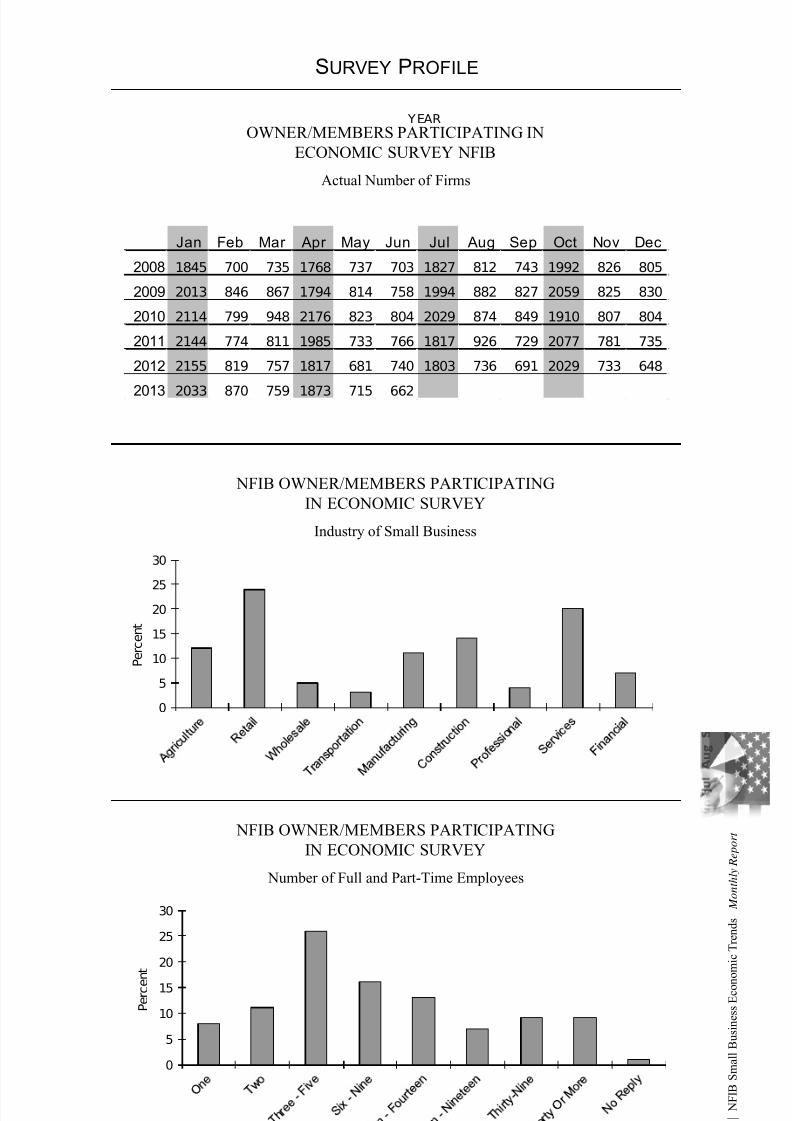
SURVEY PROFILE
OWNER/MEMBERS PARTICIPATING IN
ECONOMIC SURVEY NFIB
Actual Number of Firms
NFIB OWNER/MEMBERS PARTICIPATING
IN ECONOMIC SURVEY
Industry of Small Business
Jan Feb Mar Apr May Jun Jul Aug Sep Oct Nov Dec
2008 1845 700 735 1768 737 703 1827 812 743 1992 826 805
2009 2013 846 867 1794 814 758 1994 882 827 2059 825 830
2010 2114 799 948 2176 823 804 2029 874 849 1910 807 804
2011 2144 774 811 1985 733 766 1817 926 729 2077 781 735
2012 2155 819 757 1817 681 740 1803 736 691 2029 733 648
2013 2033 870 759 1873 715 662
NFIB OWNER/MEMBERS PARTICIPATING
IN ECONOMIC SURVEY
Number of Full and Part-Time Employees
0
5
10
15
20
25
30
P e r c e n t
0
5
10
15
20
25
30
P e r c e n t
7/28/2019 NFIB Report
http://slidepdf.com/reader/full/nfib-report 22/23
2 0
| N F I B S m a
l l B u s i n e s s
E c o n
o m
i c T r e n
d s
M o n t h l y R e p o r t
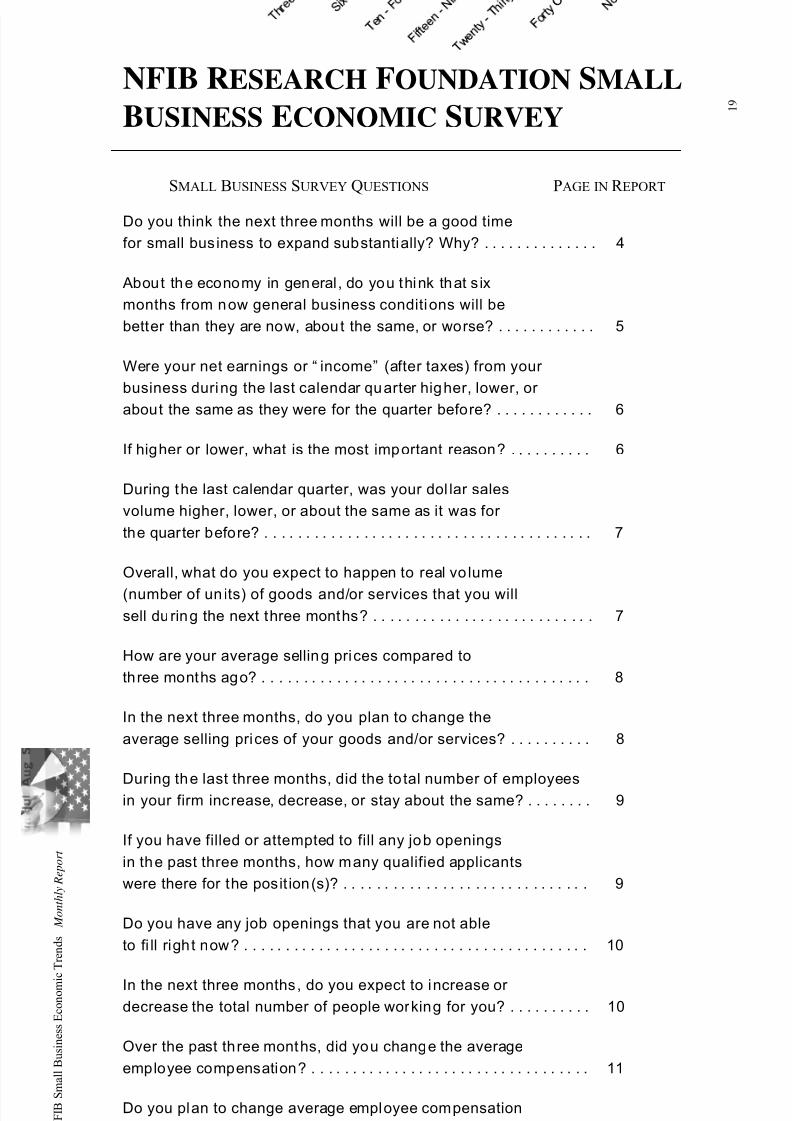
NFIB RESEARCH FOUNDATION SMALL
BUSINESS ECONOMIC SURVEY
SMALL BUSINESS SURVEY QUESTIONS PAGE IN R EPORT
Do you think the next three months will be a good time
for small business to expand substantially? Why? . . . . . . . . . . . . . . 4
About the economy in general, do you think that s ix
months from now general business conditions will be
better than they are now, about the same, or worse? . . . . . . . . . . . . 5
Were your net earnings or “ income” (after taxes) from your
business during the last calendar quarter higher, lower, or
about the same as they were for the quarter before? . . . . . . . . . . . . 6
If higher or lower, what is the most important reason? . . . . . . . . . . 6
During the last calendar quarter, was your dol lar sales
volume higher, lower, or about the same as it was for
the quarter before? . . . . . . . . . . . . . . . . . . . . . . . . . . . . . . . . . . . . . . . . 7
Overall, what do you expect to happen to real vo lume
(number of un its) of goods and/or services that you will
sell during the next three months? . . . . . . . . . . . . . . . . . . . . . . . . . . . 7
How are your average selling prices compared to
three months ago? . . . . . . . . . . . . . . . . . . . . . . . . . . . . . . . . . . . . . . . . 8
In the next three months, do you plan to change the
average selling prices of your goods and/or services? . . . . . . . . . . 8
During the last three months, did the to tal number of employees
in your firm increase, decrease, or stay about the same? . . . . . . . . 9
If you have filled or attempted to fill any job openings
in the past three months, how many qualified applicants
were there for the posit ion(s)? . . . . . . . . . . . . . . . . . . . . . . . . . . . . . . 9
Do you have any job openings that you are not able
to fi ll right now? . . . . . . . . . . . . . . . . . . . . . . . . . . . . . . . . . . . . . . . . . . 10
In the next three months, do you expect to increase or
decrease the total number of people working for you? . . . . . . . . . . 10
Over the past three months, did you change the average
employee compensation? . . . . . . . . . . . . . . . . . . . . . . . . . . . . . . . . . . 11
Do you plan to change average employee compensation
during the next three months? . . . . . . . . . . . . . . . . . . . . . . . . . . . . . . 11
7/28/2019 NFIB Report
http://slidepdf.com/reader/full/nfib-report 23/23
N F I B S m a
l l B u s i n e s s
E c o n
o m
i c T r e n
d s
M o n t h l y R e p o r t
SMALL BUSINESS SURVEY QUESTIONS PAGE IN R EPORT
Are…loans easier or harder to get than they were
three months ago? . . . . . . . . . . . . . . . . . . . . . . . . . . . . . . . . . . . . . . . 12
During the last three months, was your firm able to
satisfy its borrow ing needs? . . . . . . . . . . . . . . . . . . . . . . . . . . . . . . . 13
Do you expect to find it easier or harder to obtain your
required financing during the next three months? . . . . . . . . . . . . . 13
If you bor row money regularly (at least once every three
months) as part of your bus iness activity, how does the
rate of interest payable on your most recent loan compare
with that paid three months ago? . . . . . . . . . . . . . . . . . . . . . . . . . . . 14
If you borrowed within the last three months for business
purposes, and the loan maturi ty (pay back period) was 1
year or less, what interest rate did you pay? . . . . . . . . . . . . . . . . . . 14
During the last three months, did you increase or decrease
your inventories? . . . . . . . . . . . . . . . . . . . . . . . . . . . . . . . . . . . . . . . . . 15
At the present t ime, do you feel your inventories are toolarge, about right , or inadequate? . . . . . . . . . . . . . . . . . . . . . . . . . . 15
Looking ahead to the next three months to six months,
do you expect, on balance, to add to your inventories,
keep them about the same, or decrease them? . . . . . . . . . . . . . . . 15
During the last six months, has your fi rm made any capital
expenditures to improve or purchase equipment, buildings,
or land? . . . . . . . . . . . . . . . . . . . . . . . . . . . . . . . . . . . . . . . . . . . . . . . 16
If [your fi rm made any capital expenditu res], what wasthe total cost of all these projects? . . . . . . . . . . . . . . . . . . . . . . . . 17
Looking ahead to the next three to six months, do you
expect to make any capital expenditures for p lant
and/or physical equipment? . . . . . . . . . . . . . . . . . . . . . . . . . . . . . . 17
What is the single most important prob lem facing your
business today? . . . . . . . . . . . . . . . . . . . . . . . . . . . . . . . . . . . . . . . . 18
Please classify your major business activity, using one
of the categories of example below . . . . . . . . . . . . . . . . . . . . . . . . 19
How many employees do you have full and part-time,
including yourself? . . . . . . . . . . . . . . . . . . . . . . . . . . . . . . . . . . . . . 19


![NFIB 2-2015 Committee Presentation [Compatibility Mode]](https://img.pdfslide.net/doc/110x75/55cf9264550346f57b9603a0/nfib-2-2015-committee-presentation-compatibility-mode.jpg)