Embed Size (px)
Citation preview

NFO : Axis Dynamic Equity Fund (An Open - ended Equity Scheme)
1
2
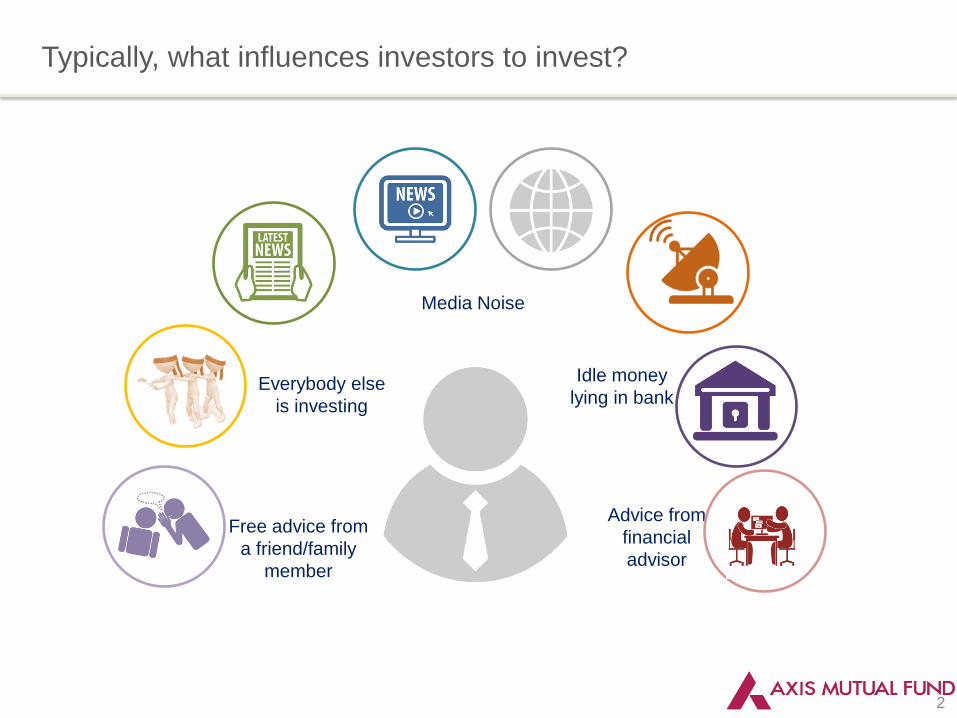
Typically, what influences investors to invest?
Media Noise
Free advice from
a friend/family
member
Everybody else
is investing
Idle money
lying in bank
Advice from
financial
advisor
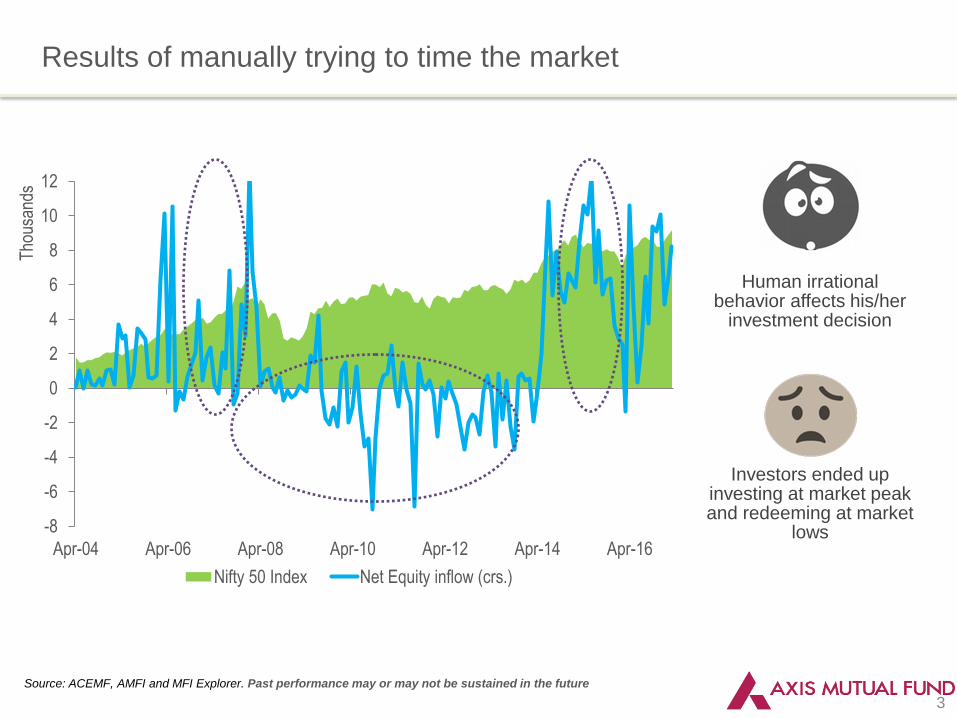
Results of manually trying to time the market
Source: ACEMF, AMFI and MFI Explorer. Past performance may or may not be sustained in the future
3
-8
-6
-4
-2
0
2
4
6
8
10
12
Apr-04 Apr-06 Apr-08 Apr-10 Apr-12 Apr-14 Apr-16
Tho
usan
ds
Nifty 50 Index Net Equity inflow (crs.)
Human irrational behavior affects his/her
investment decision
Investors ended up investing at market peak and redeeming at market
lows
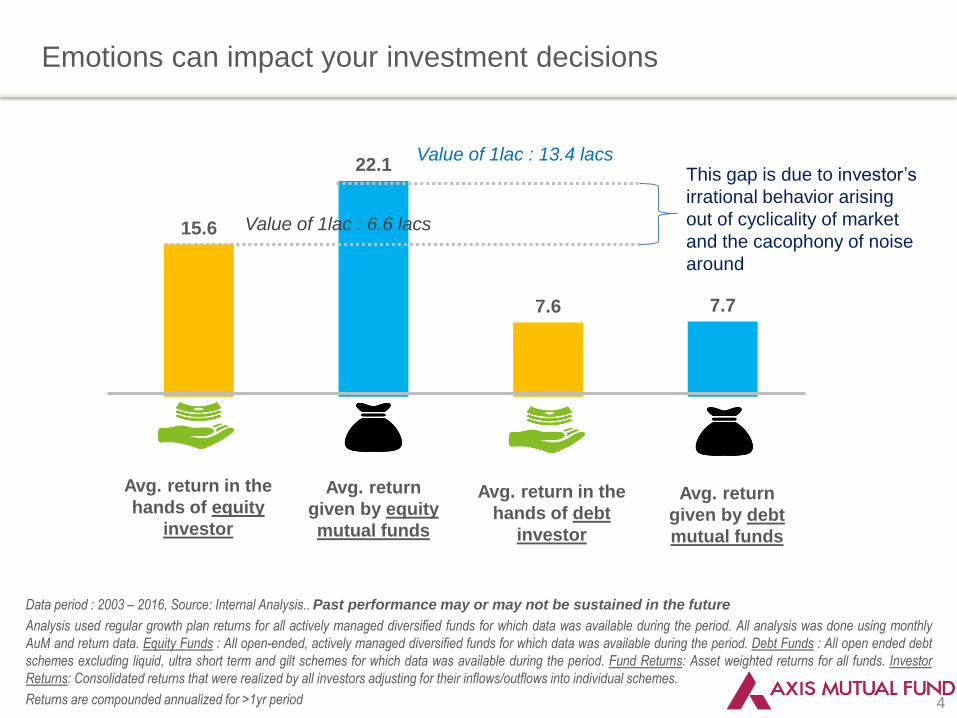
15.6
22.1
7.6 7.7
Emotions can impact your investment decisions
Data period : 2003 – 2016, Source: Internal Analysis.. Past performance may or may not be sustained in the future
Analysis used regular growth plan returns for all actively managed diversified funds for which data was available during the period. All analysis was done using monthly
AuM and return data. Equity Funds : All open-ended, actively managed diversified funds for which data was available during the period. Debt Funds : All open ended debt
schemes excluding liquid, ultra short term and gilt schemes for which data was available during the period. Fund Returns: Asset weighted returns for all funds. Investor
Returns: Consolidated returns that were realized by all investors adjusting for their inflows/outflows into individual schemes.
Returns are compounded annualized for >1yr period 4
Value of 1lac : 13.4 lacs
Value of 1lac : 6.6 lacs
Avg. return in the
hands of equity
investor
Avg. return
given by equity
mutual funds
This gap is due to investor’s
irrational behavior arising
out of cyclicality of market
and the cacophony of noise
around
Avg. return in the
hands of debt
investor
Avg. return
given by debt
mutual funds
5
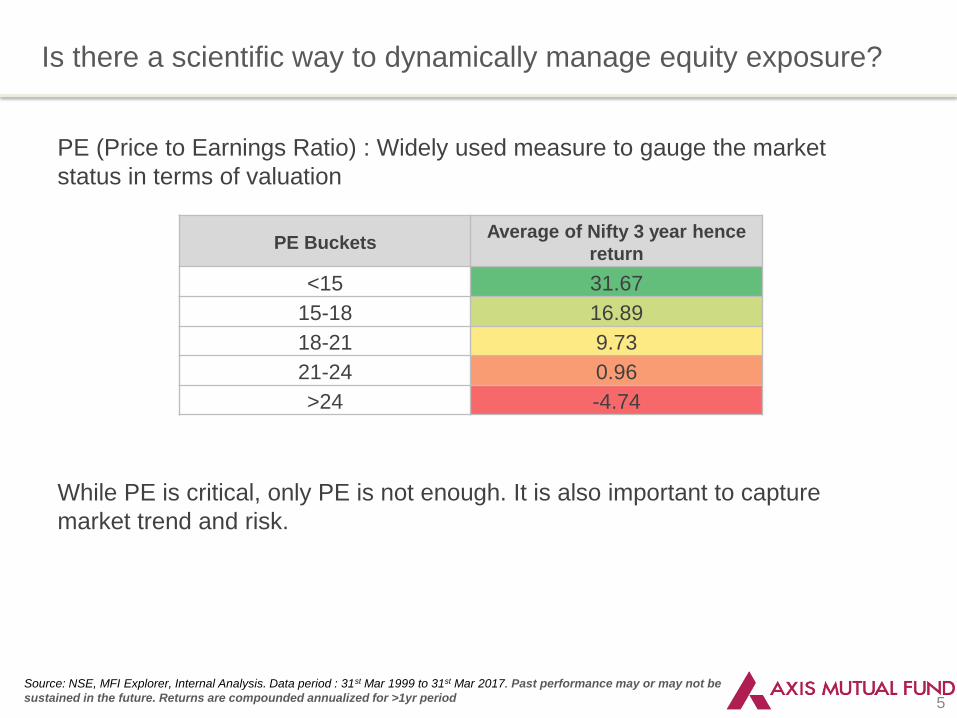
Is there a scientific way to dynamically manage equity exposure?
Source: NSE, MFI Explorer, Internal Analysis. Data period : 31st Mar 1999 to 31st Mar 2017. Past performance may or may not be
sustained in the future. Returns are compounded annualized for >1yr period
PE Buckets Average of Nifty 3 year hence
return
<15 31.67
15-18 16.89
18-21 9.73
21-24 0.96
>24 -4.74
PE (Price to Earnings Ratio) : Widely used measure to gauge the market
status in terms of valuation
While PE is critical, only PE is not enough. It is also important to capture
market trend and risk.
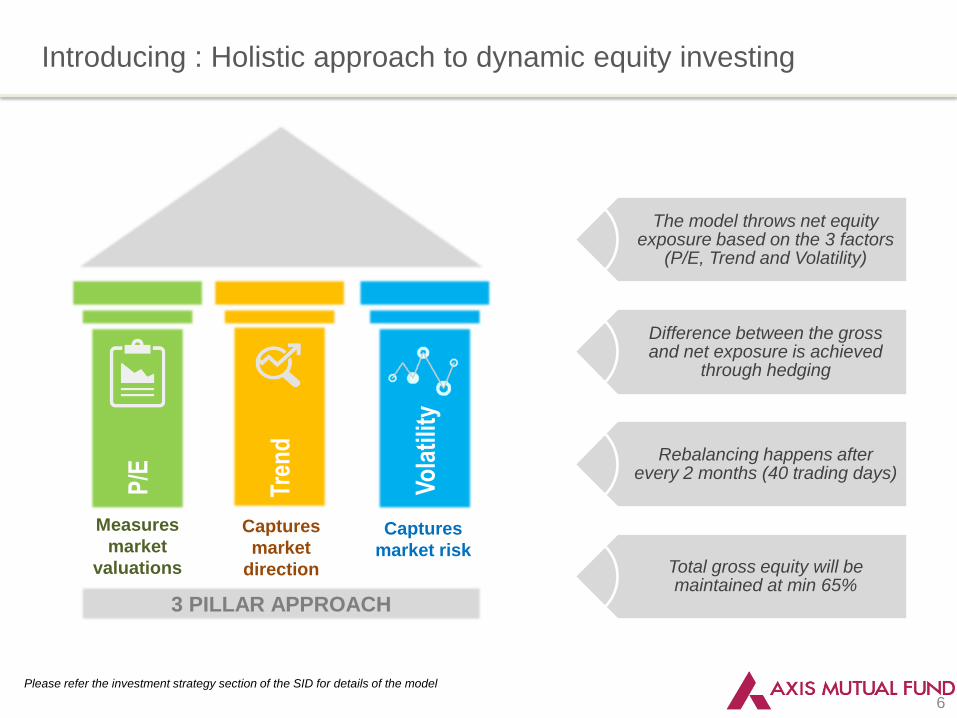
The model throws net equity exposure based on the 3 factors
(P/E, Trend and Volatility)
Difference between the gross and net exposure is achieved
through hedging
Rebalancing happens after every 2 months (40 trading days)
Total gross equity will be maintained at min 65%
6
Introducing : Holistic approach to dynamic equity investing
Measures
market
valuations
Captures
market risk
Captures
market
direction
P/E
Vo
lati
lity
Tren
d
3 PILLAR APPROACH
Please refer the investment strategy section of the SID for details of the model
7
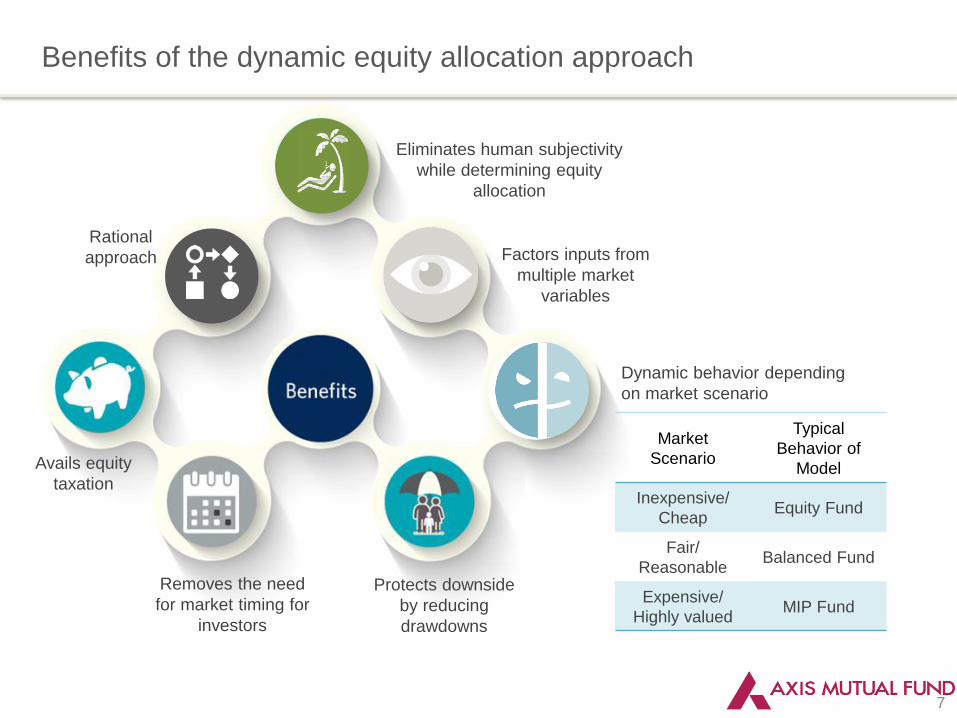
Benefits of the dynamic equity allocation approach
Eliminates human subjectivity
while determining equity
allocation
Protects downside
by reducing
drawdowns
Removes the need
for market timing for
investors
Rational
approach
Avails equity
taxation
Dynamic behavior depending
on market scenario
Factors inputs from
multiple market
variables
Market
Scenario
Typical
Behavior of
Model
Inexpensive/
Cheap Equity Fund
Fair/
Reasonable Balanced Fund
Expensive/
Highly valued MIP Fund
8
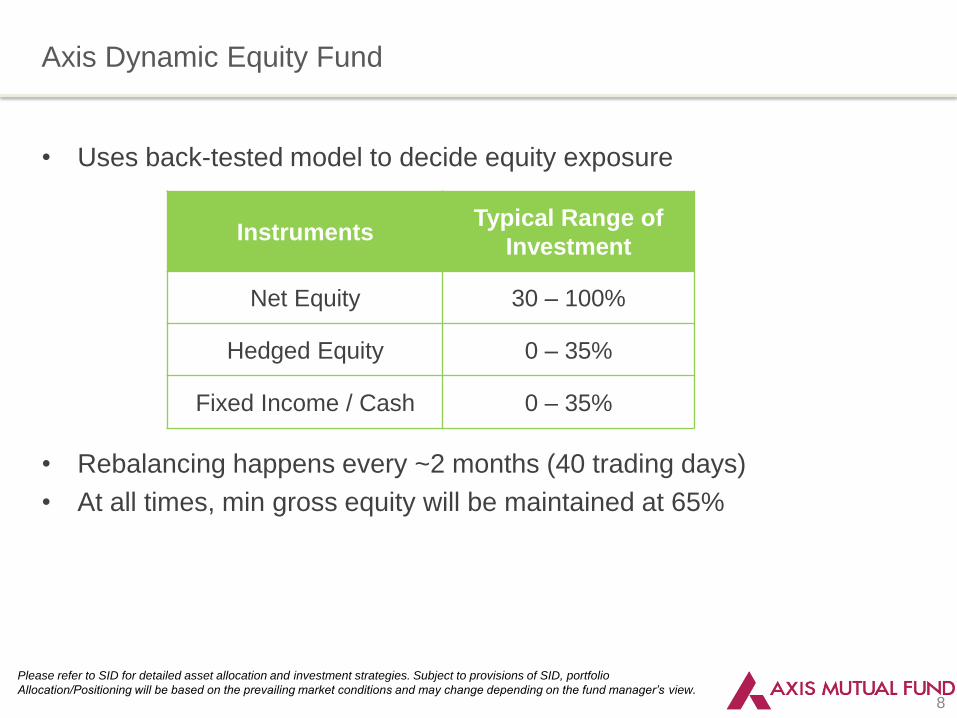
Axis Dynamic Equity Fund
Please refer to SID for detailed asset allocation and investment strategies. Subject to provisions of SID, portfolio
Allocation/Positioning will be based on the prevailing market conditions and may change depending on the fund manager’s view.
• Uses back-tested model to decide equity exposure
• Rebalancing happens every ~2 months (40 trading days)
• At all times, min gross equity will be maintained at 65%
Instruments Typical Range of
Investment
Net Equity 30 – 100%
Hedged Equity 0 – 35%
Fixed Income / Cash 0 – 35%
9
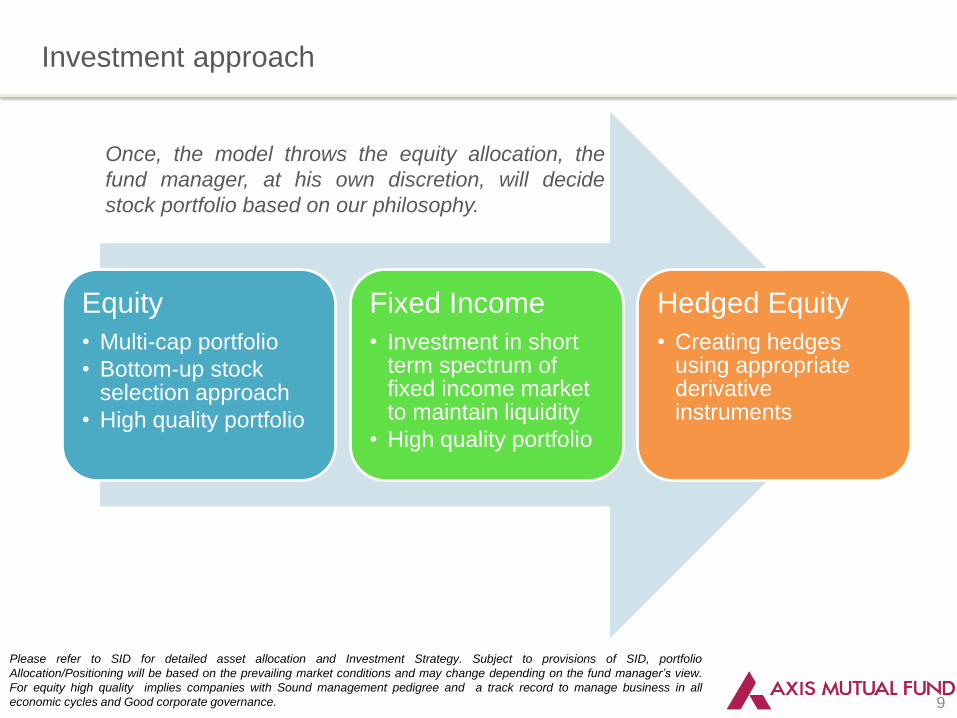
Investment approach
Please refer to SID for detailed asset allocation and Investment Strategy. Subject to provisions of SID, portfolio
Allocation/Positioning will be based on the prevailing market conditions and may change depending on the fund manager’s view.
For equity high quality implies companies with Sound management pedigree and a track record to manage business in all
economic cycles and Good corporate governance.
Equity
• Multi-cap portfolio
• Bottom-up stock selection approach
• High quality portfolio
Fixed Income
• Investment in short term spectrum of fixed income market to maintain liquidity
• High quality portfolio
Hedged Equity
• Creating hedges using appropriate derivative instruments
Once, the model throws the equity allocation, the
fund manager, at his own discretion, will decide
stock portfolio based on our philosophy.
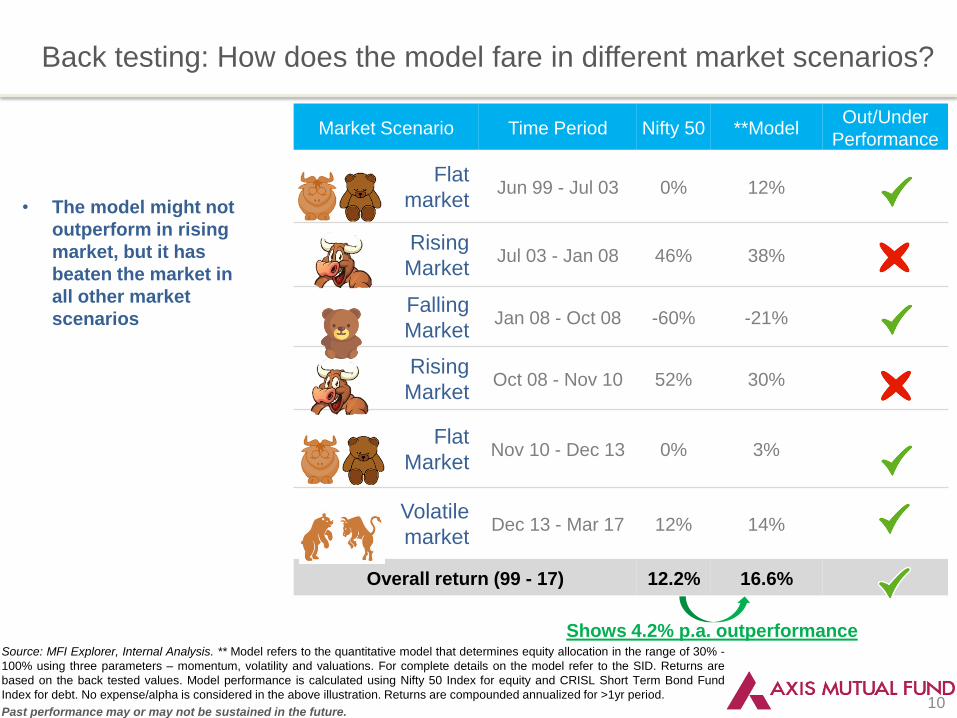
Market Scenario Time Period Nifty 50 **Model Out/Under
Performance
Flat
market Jun 99 - Jul 03 0% 12%
Rising
Market Jul 03 - Jan 08 46% 38%
Falling
Market Jan 08 - Oct 08 -60% -21%
Rising
Market Oct 08 - Nov 10 52% 30%
Flat
Market Nov 10 - Dec 13 0% 3%
Volatile
market Dec 13 - Mar 17 12% 14%
Overall return (99 - 17) 12.2% 16.6%
10
Back testing: How does the model fare in different market scenarios?
Source: MFI Explorer, Internal Analysis. ** Model refers to the quantitative model that determines equity allocation in the range of 30% -
100% using three parameters – momentum, volatility and valuations. For complete details on the model refer to the SID. Returns are
based on the back tested values. Model performance is calculated using Nifty 50 Index for equity and CRISL Short Term Bond Fund
Index for debt. No expense/alpha is considered in the above illustration. Returns are compounded annualized for >1yr period.
Past performance may or may not be sustained in the future.
• The model might not
outperform in rising
market, but it has
beaten the market in
all other market
scenarios
Shows 4.2% p.a. outperformance
11
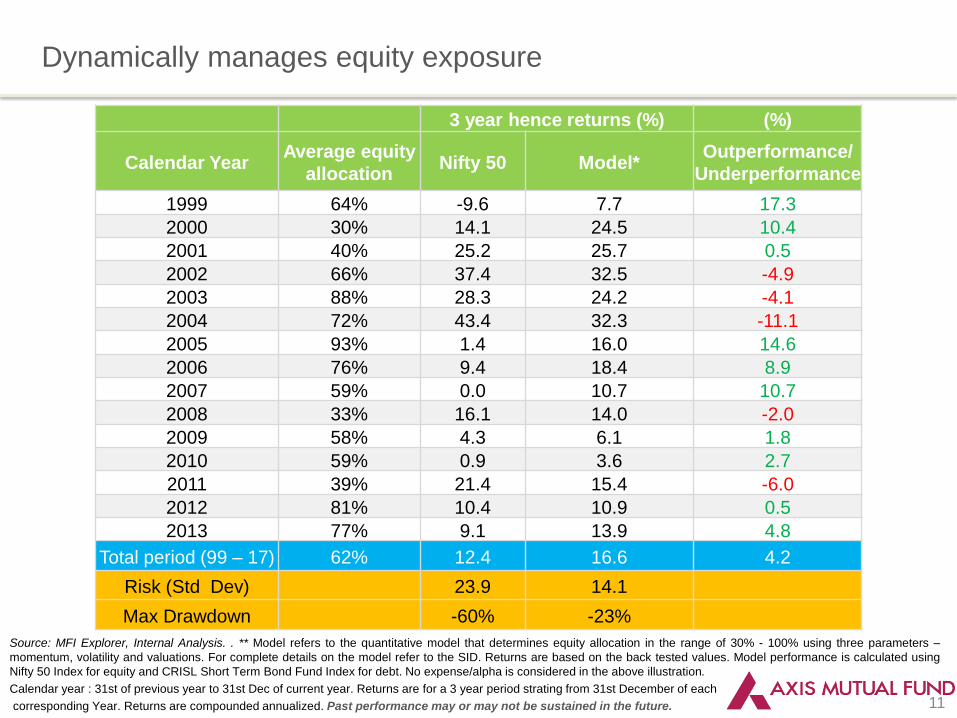
Dynamically manages equity exposure
3 year hence returns (%) (%)
Calendar Year Average equity
allocation Nifty 50 Model*
Outperformance/
Underperformance
1999 64% -9.6 7.7 17.3
2000 30% 14.1 24.5 10.4
2001 40% 25.2 25.7 0.5
2002 66% 37.4 32.5 -4.9
2003 88% 28.3 24.2 -4.1
2004 72% 43.4 32.3 -11.1
2005 93% 1.4 16.0 14.6
2006 76% 9.4 18.4 8.9
2007 59% 0.0 10.7 10.7
2008 33% 16.1 14.0 -2.0
2009 58% 4.3 6.1 1.8
2010 59% 0.9 3.6 2.7
2011 39% 21.4 15.4 -6.0
2012 81% 10.4 10.9 0.5
2013 77% 9.1 13.9 4.8
Total period (99 – 17) 62% 12.4 16.6 4.2
Risk (Std Dev) 23.9 14.1
Max Drawdown -60% -23%
Source: MFI Explorer, Internal Analysis. . ** Model refers to the quantitative model that determines equity allocation in the range of 30% - 100% using three parameters –
momentum, volatility and valuations. For complete details on the model refer to the SID. Returns are based on the back tested values. Model performance is calculated using
Nifty 50 Index for equity and CRISL Short Term Bond Fund Index for debt. No expense/alpha is considered in the above illustration.
Calendar year : 31st of previous year to 31st Dec of current year. Returns are for a 3 year period strating from 31st December of each
corresponding Year. Returns are compounded annualized. Past performance may or may not be sustained in the future.
12
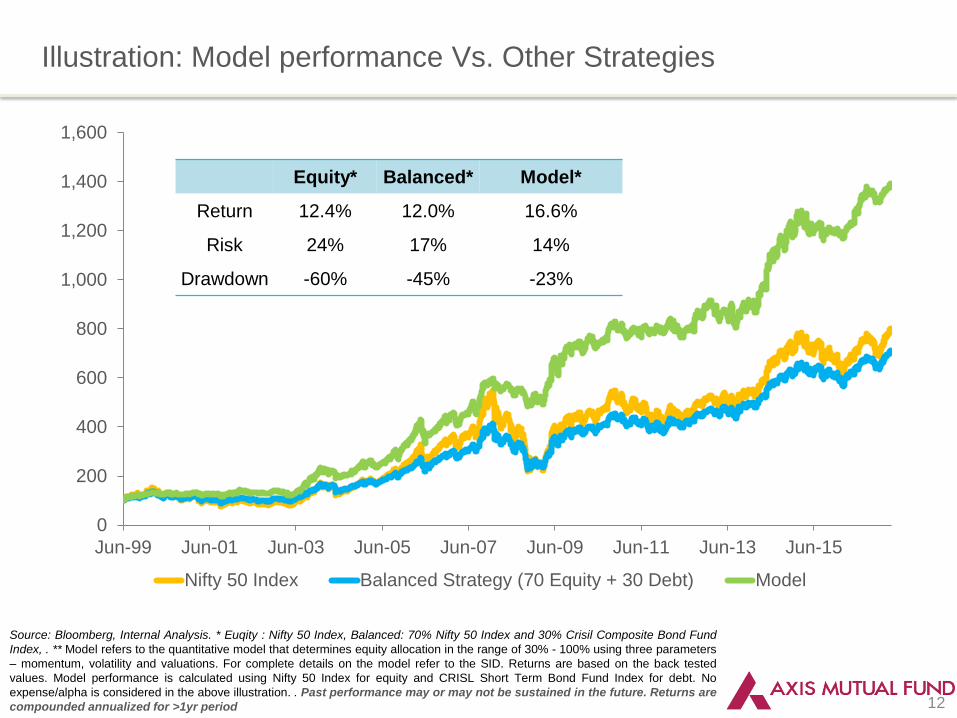
Illustration: Model performance Vs. Other Strategies
Source: Bloomberg, Internal Analysis. * Euqity : Nifty 50 Index, Balanced: 70% Nifty 50 Index and 30% Crisil Composite Bond Fund
Index, . ** Model refers to the quantitative model that determines equity allocation in the range of 30% - 100% using three parameters
– momentum, volatility and valuations. For complete details on the model refer to the SID. Returns are based on the back tested
values. Model performance is calculated using Nifty 50 Index for equity and CRISL Short Term Bond Fund Index for debt. No
expense/alpha is considered in the above illustration. . Past performance may or may not be sustained in the future. Returns are
compounded annualized for >1yr period
Equity* Balanced* Model*
Return 12.4% 12.0% 16.6%
Risk 24% 17% 14%
Drawdown -60% -45% -23%
0
200
400
600
800
1,000
1,200
1,400
1,600
Jun-99 Jun-01 Jun-03 Jun-05 Jun-07 Jun-09 Jun-11 Jun-13 Jun-15
Nifty 50 Index Balanced Strategy (70 Equity + 30 Debt) Model
13
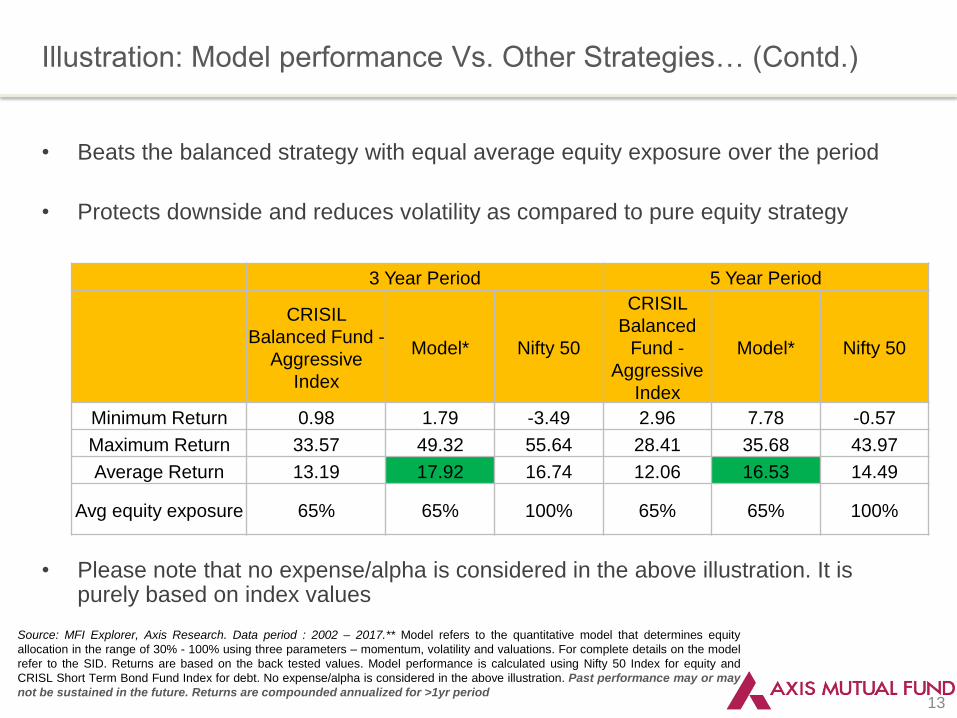
Illustration: Model performance Vs. Other Strategies… (Contd.)
• Beats the balanced strategy with equal average equity exposure over the period
• Protects downside and reduces volatility as compared to pure equity strategy
• Please note that no expense/alpha is considered in the above illustration. It is purely based on index values
3 Year Period 5 Year Period
CRISIL
Balanced Fund -
Aggressive
Index
Model* Nifty 50
CRISIL
Balanced
Fund -
Aggressive
Index
Model* Nifty 50
Minimum Return 0.98 1.79 -3.49 2.96 7.78 -0.57
Maximum Return 33.57 49.32 55.64 28.41 35.68 43.97
Average Return 13.19 17.92 16.74 12.06 16.53 14.49
Avg equity exposure 65% 65% 100% 65% 65% 100%
Source: MFI Explorer, Axis Research. Data period : 2002 – 2017.** Model refers to the quantitative model that determines equity
allocation in the range of 30% - 100% using three parameters – momentum, volatility and valuations. For complete details on the model
refer to the SID. Returns are based on the back tested values. Model performance is calculated using Nifty 50 Index for equity and
CRISL Short Term Bond Fund Index for debt. No expense/alpha is considered in the above illustration. Past performance may or may
not be sustained in the future. Returns are compounded annualized for >1yr period
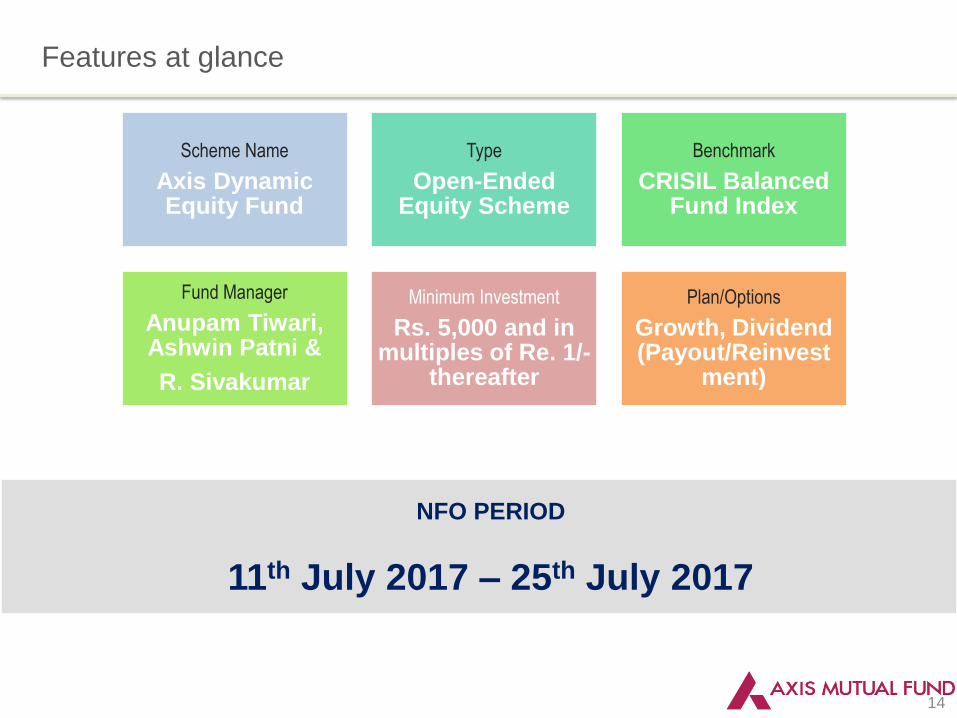
Features at glance
14
Scheme Name
Axis Dynamic Equity Fund
Type
Open-Ended Equity Scheme
Benchmark
CRISIL Balanced Fund Index
Fund Manager
Anupam Tiwari, Ashwin Patni &
R. Sivakumar
Minimum Investment
Rs. 5,000 and in multiples of Re. 1/-
thereafter
Plan/Options
Growth, Dividend (Payout/Reinvest
ment)
NFO PERIOD
11th July 2017 – 25th July 2017
15
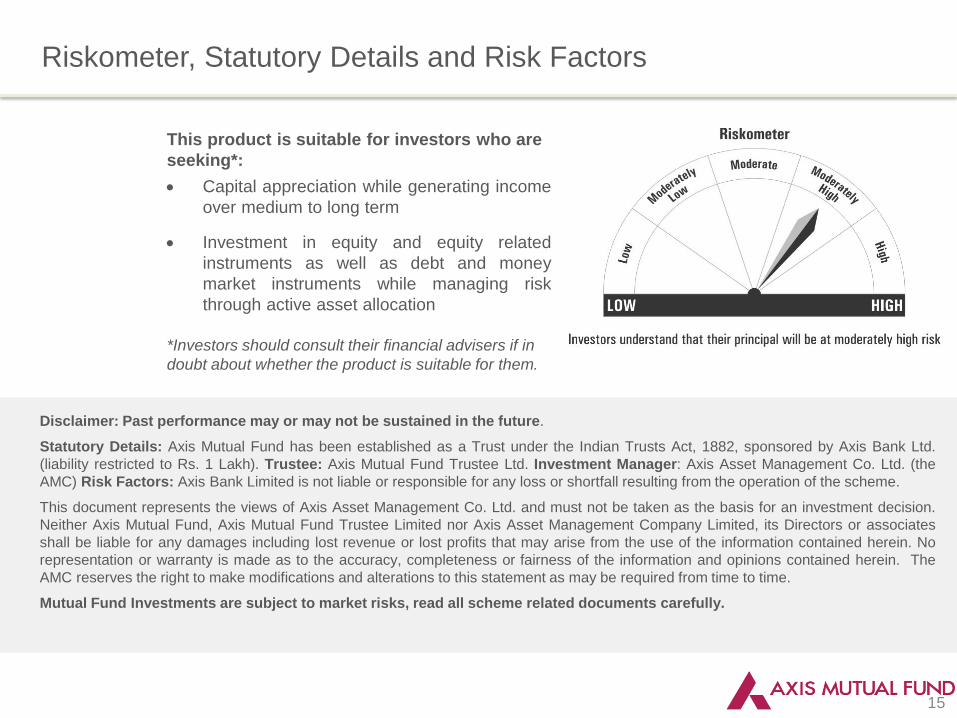
Riskometer, Statutory Details and Risk Factors
Disclaimer: Past performance may or may not be sustained in the future.
Statutory Details: Axis Mutual Fund has been established as a Trust under the Indian Trusts Act, 1882, sponsored by Axis Bank Ltd.
(liability restricted to Rs. 1 Lakh). Trustee: Axis Mutual Fund Trustee Ltd. Investment Manager: Axis Asset Management Co. Ltd. (the
AMC) Risk Factors: Axis Bank Limited is not liable or responsible for any loss or shortfall resulting from the operation of the scheme.
This document represents the views of Axis Asset Management Co. Ltd. and must not be taken as the basis for an investment decision.
Neither Axis Mutual Fund, Axis Mutual Fund Trustee Limited nor Axis Asset Management Company Limited, its Directors or associates
shall be liable for any damages including lost revenue or lost profits that may arise from the use of the information contained herein. No
representation or warranty is made as to the accuracy, completeness or fairness of the information and opinions contained herein. The
AMC reserves the right to make modifications and alterations to this statement as may be required from time to time.
Mutual Fund Investments are subject to market risks, read all scheme related documents carefully.
This product is suitable for investors who are
seeking*:
Capital appreciation while generating income
over medium to long term
Investment in equity and equity related
instruments as well as debt and money
market instruments while managing risk
through active asset allocation
*Investors should consult their financial advisers if in
doubt about whether the product is suitable for them.