Embed Size (px)
DESCRIPTION
Bird diversity: A predictable function of satellite-derived estimates of seasonal variation in canopy light absorbance across the United States. Nicholas C. Coops University of British Columbia, Richard H. Waring Oregon State University Michael A. Wulder - PowerPoint PPT Presentation
Citation preview
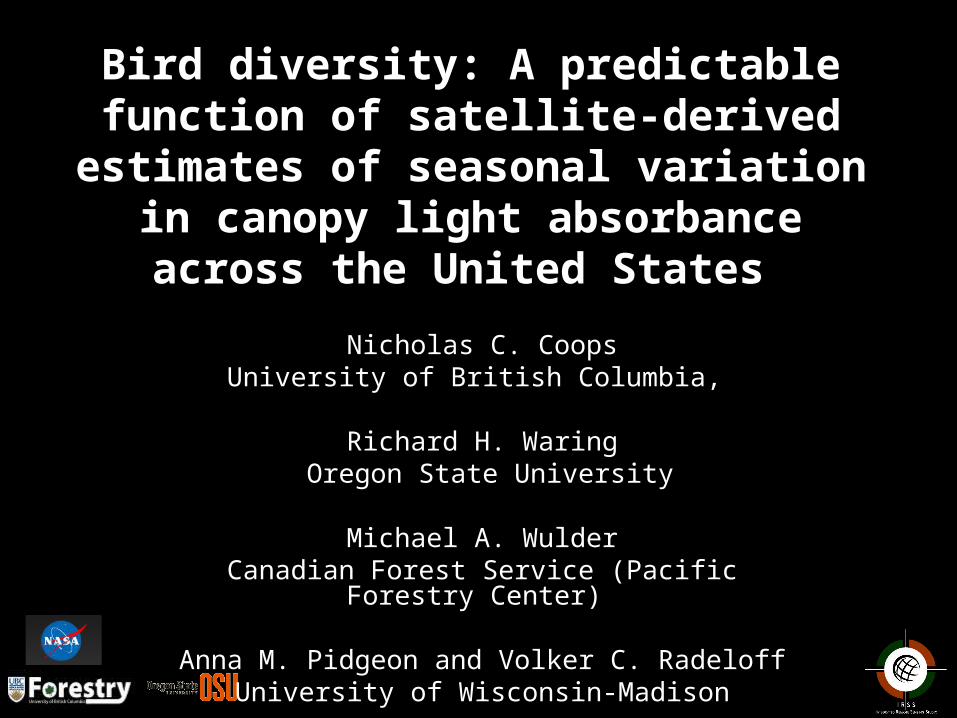
Bird diversity: A predictable function of satellite-derived estimates of
seasonal variation in canopy light absorbance across the United States
Nicholas C. CoopsUniversity of British Columbia,
Richard H. Waring Oregon State University
Michael A. WulderCanadian Forest Service (Pacific Forestry Center)
Anna M. Pidgeon and Volker C. RadeloffUniversity of Wisconsin-Madison
Background
• Understanding what controls biodiversity patterns across broad areas is important to predict how communities may respond to increases in human activities and climate change.
• Many mechanisms have been proposed to account for broad patterns of species richness.
• MacArthur (1972) suggested that biodiversity patterns respond to three major factors: – climate,
– productivity,
– and habitat structure
• Accessibility to that energy by each trophic group therefore drives biodiversity patterns.
• Birds are an interesting (and challenging) taxa to examine.
• Between 12-15% of the global 9,000+ avian species reside, at least at times, in forested ecosystems of NA.
• Bird species differ widely in migratory behaviour, nesting, feeding, mating strategies, territoriality, and other aspects of life history. – For example, closed canopies of trees provide ample nest sites for
forest birds, but none for grassland species.
• Understanding which combination of habitat and environmental features best predicts bird species is no trivial task.
• Fortunately, the North American Breeding Bird Survey (BBS) – 4,100 routes sampled along road networks– 420 bird species across the continent for the last four decades.
Remote Sensing Potential• Remote Sensing offers opportunity to map and monitor habitat suitability, and
seasonal variations in primary productivity over the landscape.
• Many approaches exist:– Simple measure of vegetation cover or greenness, such as NDVI, has been used to
estimate seasonal variation in vegetation cover.– The cumulative NDVI over the year measured shows a strong positive relationship
with species richness, bird, butterfly and carnivore richness at various spatial scales (AVHRR, TM).
• NDVI has been most widely used, but can be influenced by structure of vegetation, albedo, presence of snow, and the colour of exposed soil.
• An alternative, more biophysical expression of vegetation canopy greenness, is the fraction of visible light (photosynthetically active radiation) absorbed (fPAR), which provides an assessment of seasonal changes in photosynthetic activity.
• Despite fPAR being less commonly applied in biodiversity studies, it is fPAR, not NDVI, that determines the rates at which carbon is assimilated into carbohydrates during photosynthesis and water vapour evaporates or transpires.
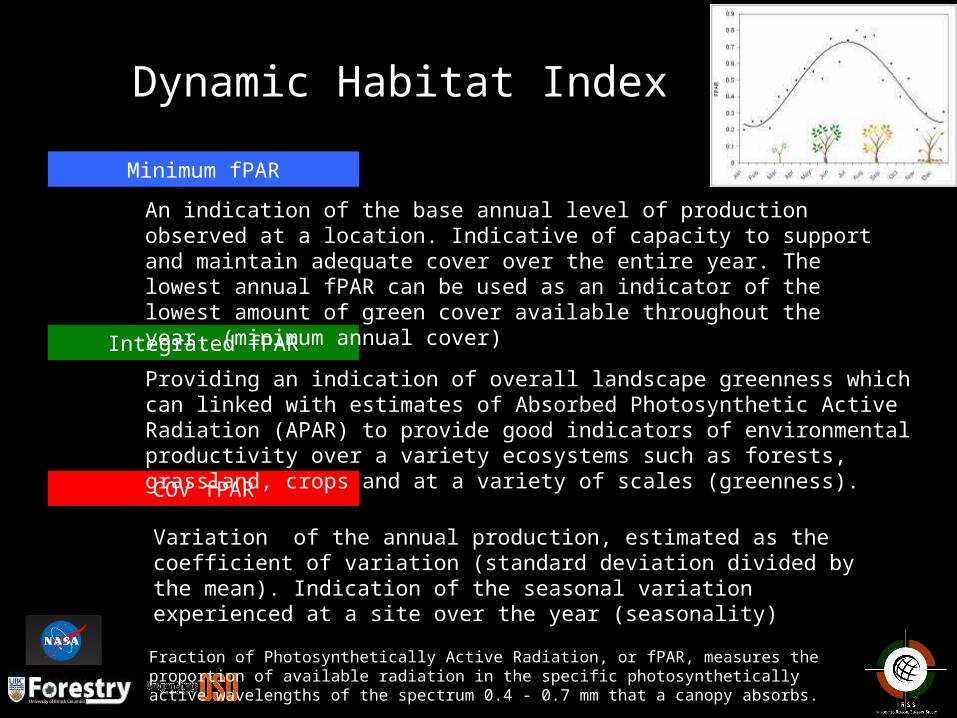
Dynamic Habitat Index
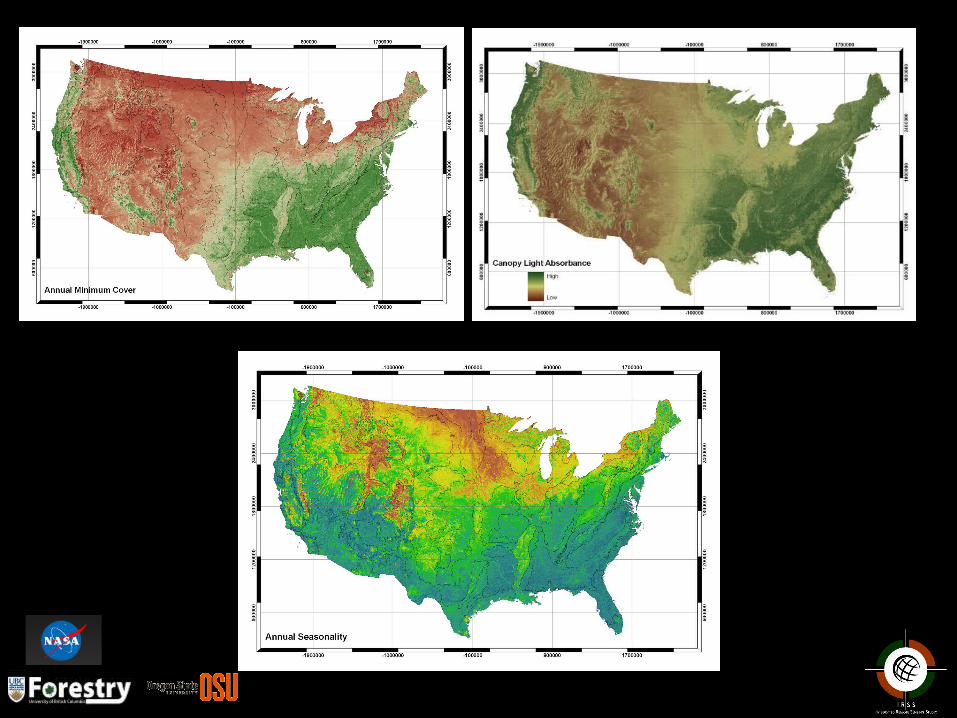
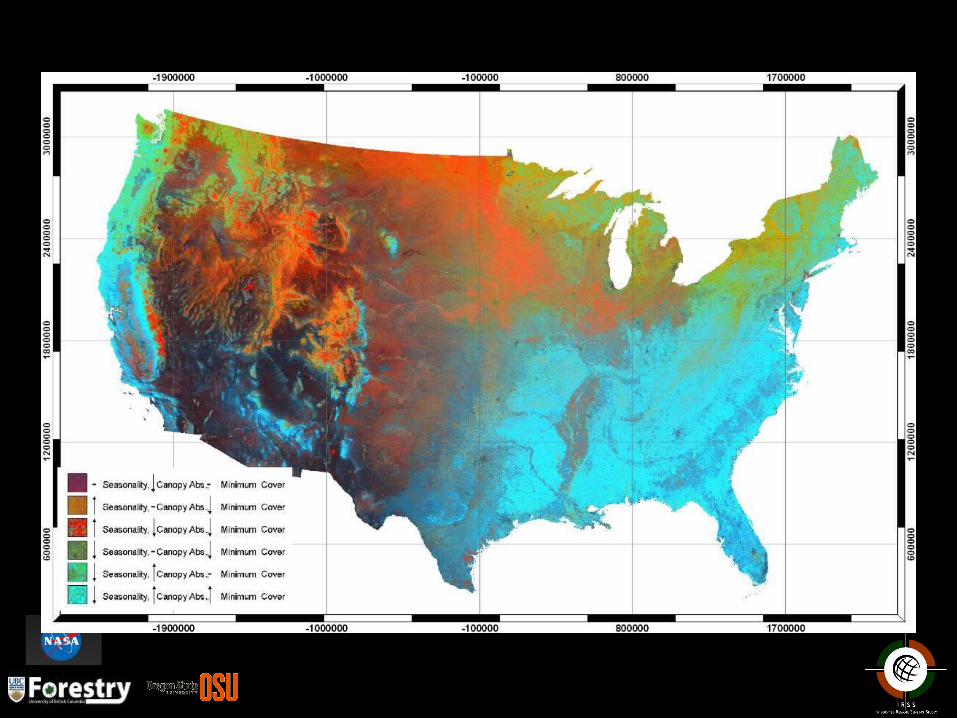
Minimum fPAR
Integrated fPAR
COV fPAR
Providing an indication of overall landscape greenness which can linked with estimates of Absorbed Photosynthetic Active Radiation (APAR) to provide good indicators of environmental productivity over a variety ecosystems such as forests, grassland, crops and at a variety of scales (greenness).
An indication of the base annual level of production observed at a location. Indicative of capacity to support and maintain adequate cover over the entire year. The lowest annual fPAR can be used as an indicator of the lowest amount of green cover available throughout the year. (minimum annual cover)
Variation of the annual production, estimated as the coefficient of variation (standard deviation divided by the mean). Indication of the seasonal variation experienced at a site over the year (seasonality)
Fraction of Photosynthetically Active Radiation, or fPAR, measures the proportion of available radiation in the specific photosynthetically active wavelengths of the spectrum 0.4 - 0.7 mm that a canopy absorbs.
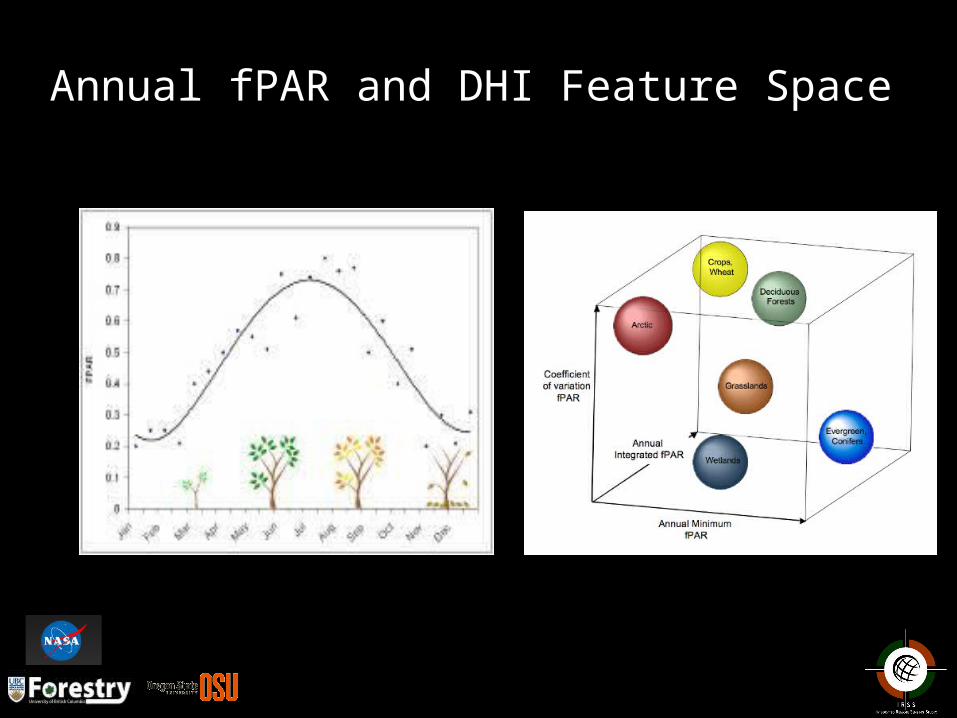
Annual fPAR and DHI Feature Space
MODIS fPAR
• Since the launch of MODIS in 2000 and 2002, improved estimates of fPAR are available.
• fPAR derived from a physically based model retrieved from reflectance of up to 7 spectral bands
• Combined the 8-day fPAR composites into monthly maximum fPAR product at 1km averaged from 2000 – 2006.
• fPAR Data from Boston University web site.
• We stratified landscape based on the MODIS vegetation continuous fields (VCF) classification which provides estimates of cover of woody vegetation.
• Cell was deemed forested if > 40% woody vegetation.
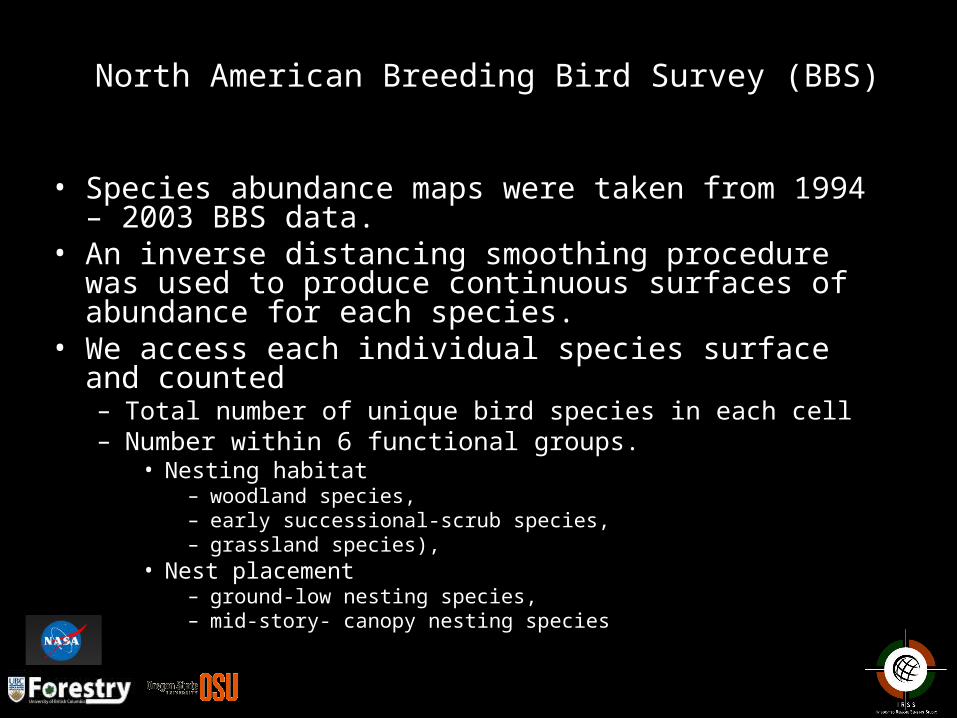
• Species abundance maps were taken from 1994 – 2003 BBS data.
• An inverse distancing smoothing procedure was used to produce continuous surfaces of abundance for each species.
• We access each individual species surface and counted – Total number of unique bird species in each cell– Number within 6 functional groups.
• Nesting habitat – woodland species, – early successional-scrub species, – grassland species),
• Nest placement – ground-low nesting species, – mid-story- canopy nesting species
North American Breeding Bird Survey (BBS)
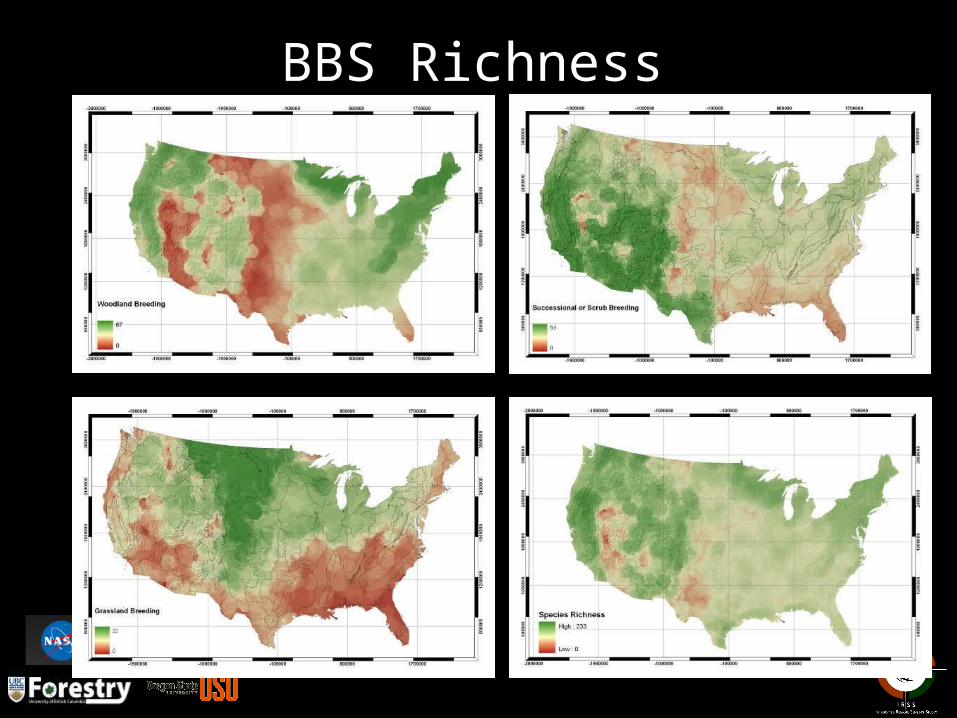
BBS Richness
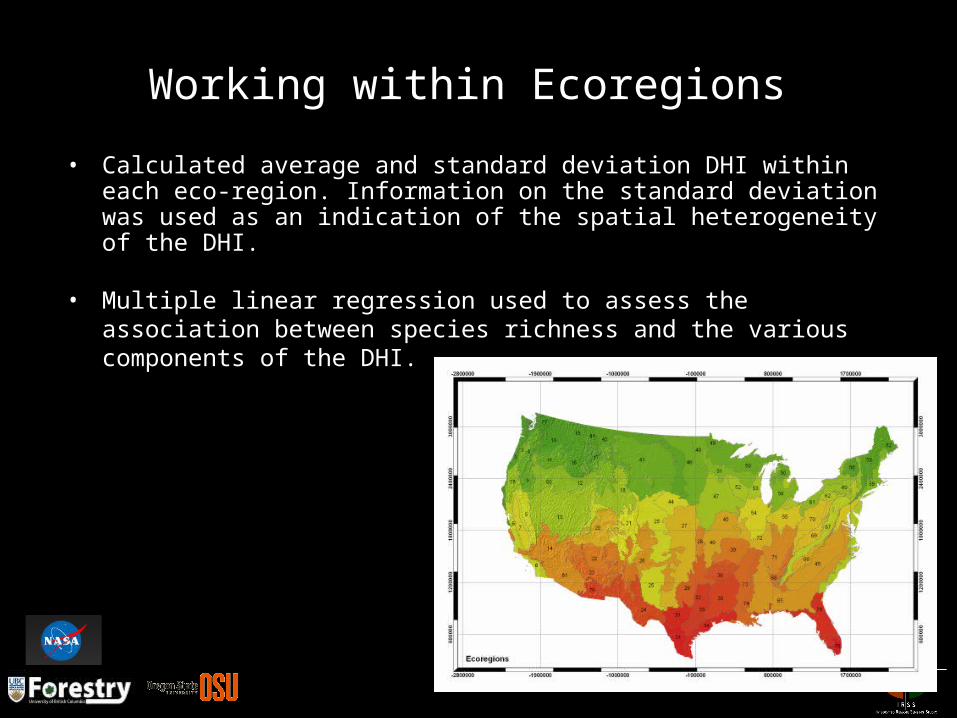
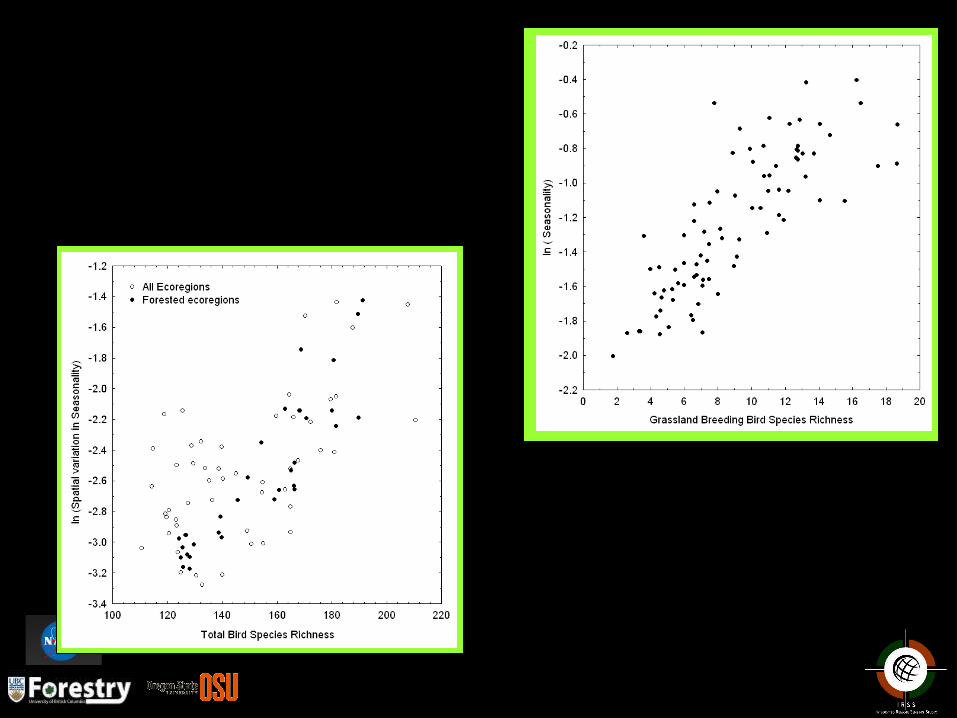
• Calculated average and standard deviation DHI within each eco-region. Information on the standard deviation was used as an indication of the spatial heterogeneity of the DHI.
• Multiple linear regression used to assess the association between species richness and the various components of the DHI.
Working within Ecoregions
Our Approach
• Aim: To test the predictive power of the DHI in reference to bird diversity patterns
•Limited analysis to the US: – We have readily available the relevant RS data stratified within
84 defined ecoregions previously used to assess tree diversity, – US is where bird survey data is most complete– large areas of the forested land mass does not experience
significant snow cover which can potentially confound canopy light absorbance estimates.
• If we are successful, we intend to extend the approach across all of NA.
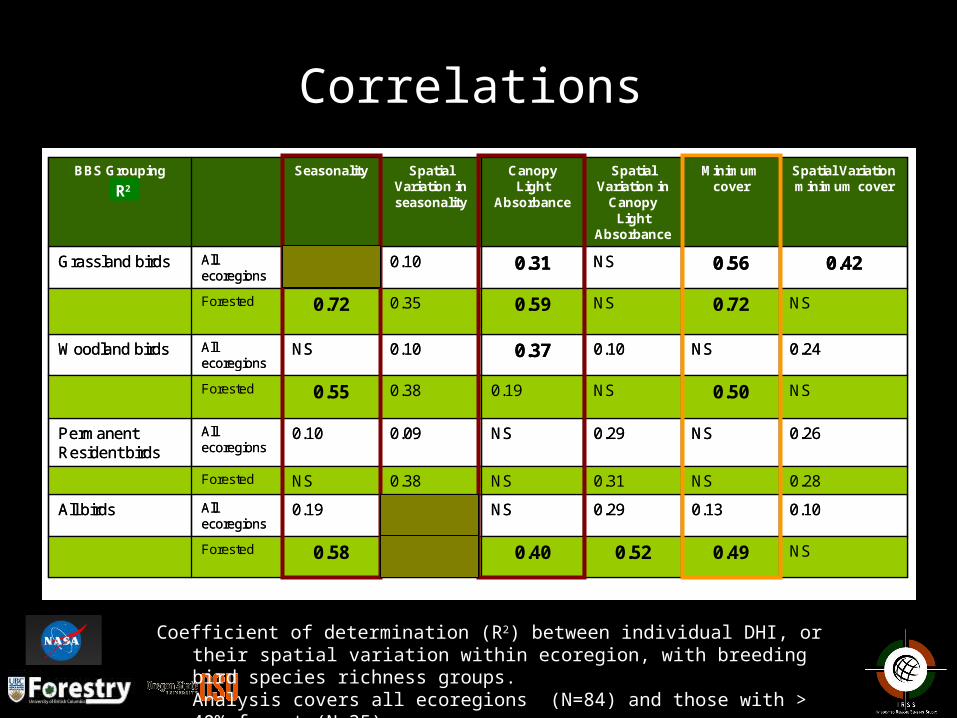
Correlations
NS0.49 0.52 0.40 0.83 0.58 Forested
0.10 0.13 0.29 NS0.49 0.19 All ecoregions
All birds
0.28 NS0.31 NS0.38 NSForested
0.26 NS0.29 NS0.09 0.10 All ecoregions
Permanent Resident birds
NS0.50 NS0.19 0.38 0.55 Forested
0.24 NS0.100.37 0.10 NSAll ecoregions
Woodland birds
NS0.72 NS0.59 0.35 0.72 Forested
0.42 0.56 NS0.31 0.10 0.66 All ecoregions
Grassland birds
Spatial Variation minimum cover
Minimum cover
Spatial Variation in
Canopy Light
Absorbance
Canopy Light
Absorbance
Spatial Variation in seasonality
SeasonalityBBS Grouping(r)
Coefficient of determination (R2) between individual DHI, or their spatial variation within ecoregion, with breeding bird species richness groups.Analysis covers all ecoregions (N=84) and those with > 40% forest (N=35). Bold significant at 0.01 level
R2
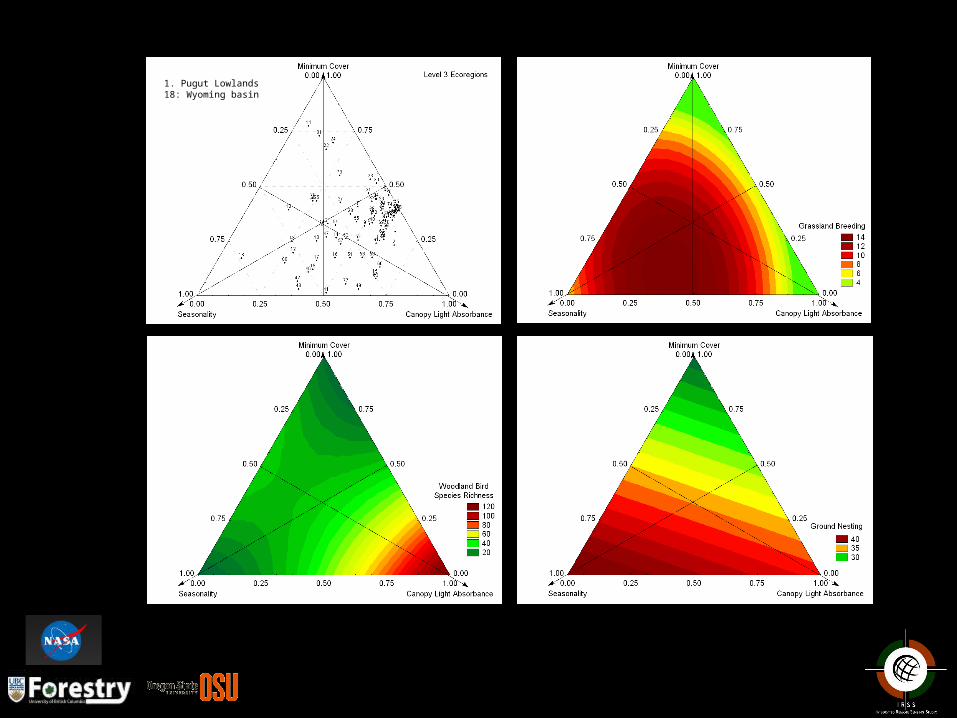
1. Pugut Lowlands18: Wyoming basin
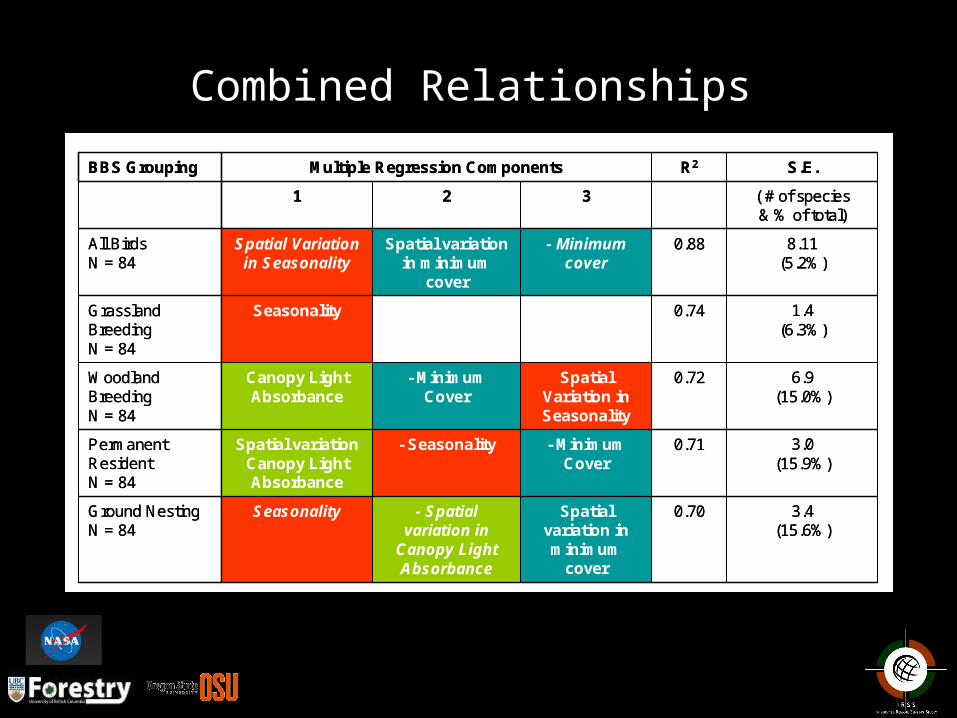
Combined Relationships
3.4(15.6%)
0.70Spatial variation in minimum
cover
- Spatial variation in
Canopy Light Absorbance
SeasonalityGround Nesting N = 84
3.0(15.9%)
0.71- Minimum Cover
- SeasonalitySpatial variation Canopy Light Absorbance
Permanent ResidentN = 84
6.9(15.0%)
0.72Spatial Variation in Seasonality
- Minimum Cover
Canopy Light Absorbance
Woodland BreedingN = 84
1.4(6.3%)
0.74SeasonalityGrassland BreedingN = 84
8.11(5.2%)
0.88- Minimum cover
Spatial variation in minimum
cover
Spatial Variation in Seasonality
All BirdsN = 84
( # of species & % of total)
321
S.E.R2Multiple Regression ComponentsBBS Grouping
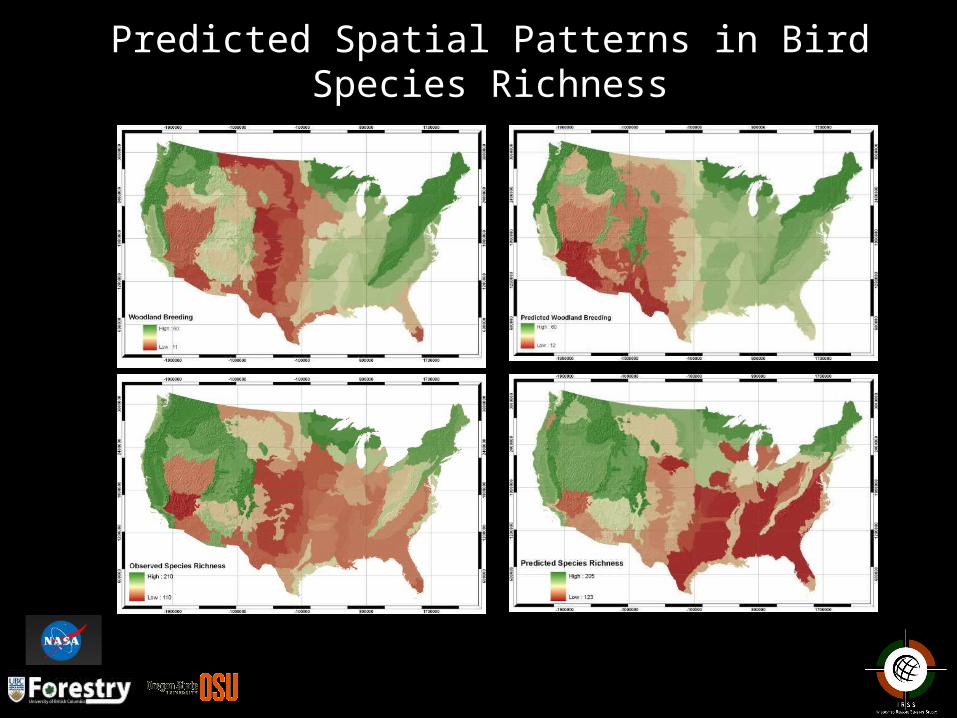
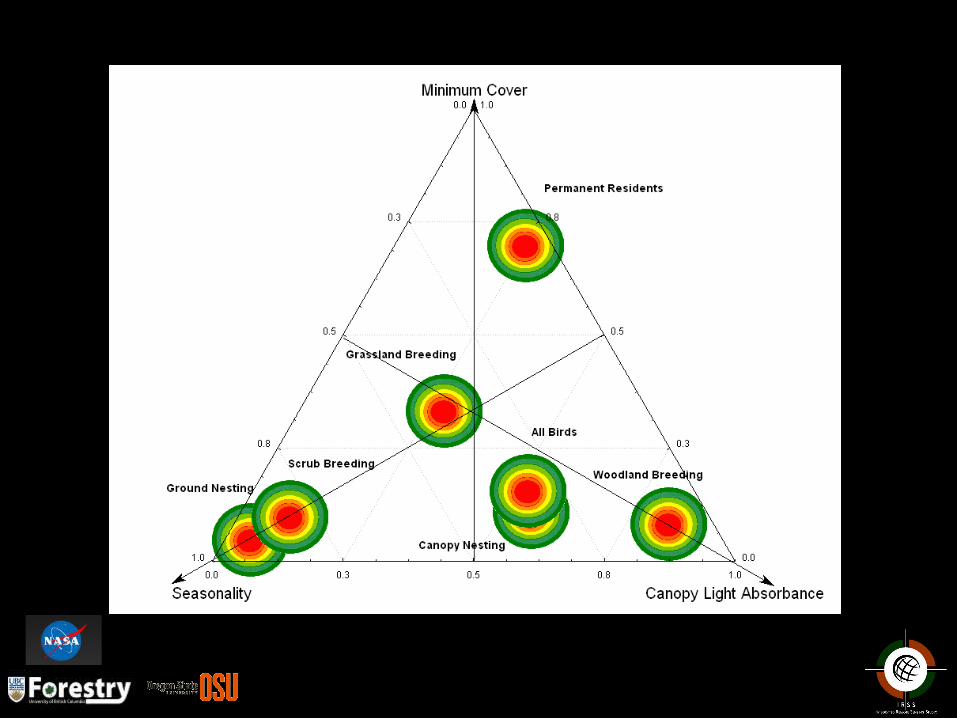
Predicted Spatial Patterns in Bird Species Richness
Some Thoughts• DHI Seasonality (defined as annual COV in greenness), and the spatial variation in
landscape greenness were the principal drivers explaining a range of patterns of species richness.
• Overall changes in annual minimum cover, and overall landscape greenness also provided some explanatory power but to a lesser extent.
• In the case of minimum cover, both grassland breeding and ground nesting birds show strong negative trends, indicating these functional groups reach greatest richness in areas with lower annual vegetative cover (native grasses, agricultural zones) or deciduous forest cover.
• The Breeding Bird Survey dataset provides a unique resource on bird population trends but does contain bias such as focus on areas of human presence and issues with nocturnal birds.
• One advantage of our approach is that total species number, rather than number of individuals was used.
• Understanding what determines biodiversity patterns is a major scientific challenges. Our results demonstrated the strong relationship between avian biodiversity patterns and a dynamic habitat index based on fPAR.
• This index thus may represent an effective tool for monitoring patterns of biodiversity on a broad scale. We are testing the index with other BBS data such as in Ontario, Canada and with the Canadian Butterfly atlas.
With Thanks
• Supported by the NASA Grant NNG04GK26G (Waring) • Canadian Space Agency (Wulder)
• We thank Brendan Mackey / Sandra Berry for initial ideas behind the DHI (ANU)
• Centre for Water Research (University of Western Australia) (Waring)
• Breeding Bird Survey Database
Coops, N.C., R.H. Waring, M.A. Wulder, A.M. Pidgeon, and V.C. Radeloff, (2008) Bird diversity: A predictable function of satellite-derived estimates of seasonal variation in canopy light
absorbance across the United States, Journal of Biogeography (in review).