Embed Size (px)
Citation preview
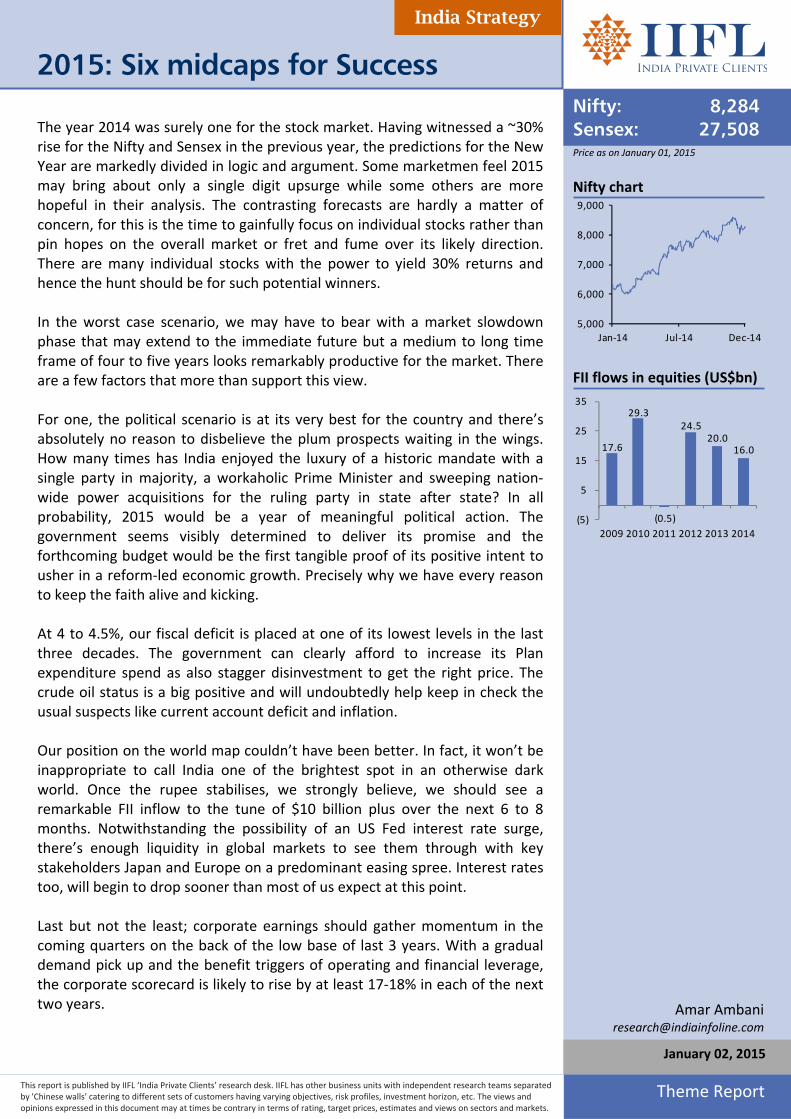
Price as on January 01, 2015
Nifty chart
5,000
6,000
7,000
8,000
9,000
Jan‐14 Jul‐14 Dec‐14 FII flows in equities (US$bn)
17.6
29.3
(0.5)
24.5 20.0
16.0
(5)
5
15
25
35
2009 2010 2011 2012 2013 2014
Nifty: 8,284Sensex: 27,508
Amar Ambani
2015: Six midcaps for Success
This report is published by IIFL ‘India Private Clients’ research desk. IIFL has other business units with independent research teams separated by 'Chinese walls' catering to different sets of customers having varying objectives, risk profiles, investment horizon, etc. The views and opinions expressed in this document may at times be contrary in terms of rating, target prices, estimates and views on sectors and markets.
January 02, 2015
India Strategy
Theme Report
The year 2014 was surely one for the stock market. Having witnessed a ~30% rise for the Nifty and Sensex in the previous year, the predictions for the New Year are markedly divided in logic and argument. Some marketmen feel 2015 may bring about only a single digit upsurge while some others are more hopeful in their analysis. The contrasting forecasts are hardly a matter of concern, for this is the time to gainfully focus on individual stocks rather than pin hopes on the overall market or fret and fume over its likely direction. There are many individual stocks with the power to yield 30% returns and hence the hunt should be for such potential winners. In the worst case scenario, we may have to bear with a market slowdown phase that may extend to the immediate future but a medium to long time frame of four to five years looks remarkably productive for the market. There are a few factors that more than support this view. For one, the political scenario is at its very best for the country and there’s absolutely no reason to disbelieve the plum prospects waiting in the wings. How many times has India enjoyed the luxury of a historic mandate with a single party in majority, a workaholic Prime Minister and sweeping nation‐wide power acquisitions for the ruling party in state after state? In all probability, 2015 would be a year of meaningful political action. The government seems visibly determined to deliver its promise and the forthcoming budget would be the first tangible proof of its positive intent to usher in a reform‐led economic growth. Precisely why we have every reason to keep the faith alive and kicking. At 4 to 4.5%, our fiscal deficit is placed at one of its lowest levels in the last three decades. The government can clearly afford to increase its Plan expenditure spend as also stagger disinvestment to get the right price. The crude oil status is a big positive and will undoubtedly help keep in check the usual suspects like current account deficit and inflation. Our position on the world map couldn’t have been better. In fact, it won’t be inappropriate to call India one of the brightest spot in an otherwise dark world. Once the rupee stabilises, we strongly believe, we should see a remarkable FII inflow to the tune of $10 billion plus over the next 6 to 8 months. Notwithstanding the possibility of an US Fed interest rate surge, there’s enough liquidity in global markets to see them through with key stakeholders Japan and Europe on a predominant easing spree. Interest rates too, will begin to drop sooner than most of us expect at this point. Last but not the least; corporate earnings should gather momentum in the coming quarters on the back of the low base of last 3 years. With a gradual demand pick up and the benefit triggers of operating and financial leverage, the corporate scorecard is likely to rise by at least 17‐18% in each of the next two years.
2015: Six midcaps for Success
Yes, corrections would indeed remain an integral feature of the market voyage, as they have always been, but more importantly, the overall trend is only pointing to an upward march. Never mind the ensuing dips; the market is well poised to record new highs in the years to come.
Far from indecision, this is the time ripe for positive action…this is the time to correct the reactionary sentiment of panic and perplexity that gains ground on every correction…this is the time to increase our hand‐picked exposure to that phenomenal investment avenue called equities. Here’re our six picks: Bajaj Corp, CanFin, Granules India, Indian Hume Pipe, MM Forgings, Symphony.
Wishing you all a Happy and Prosperous 2015!
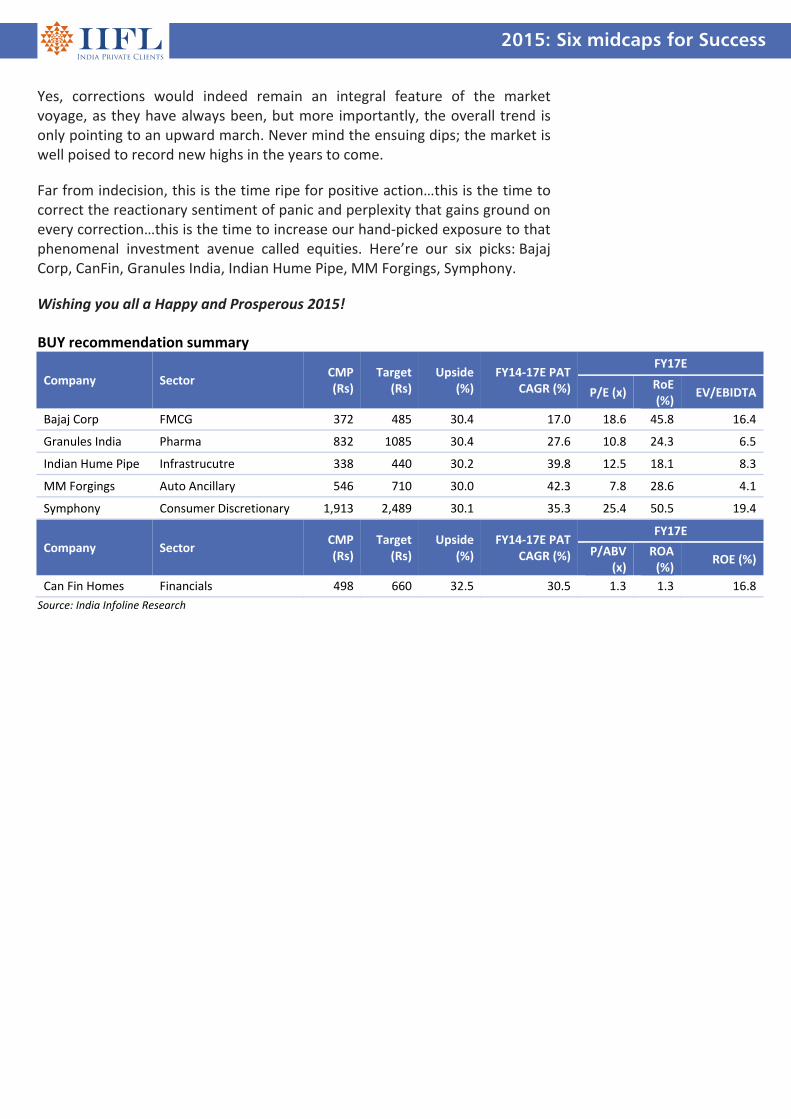
BUY recommendation summary
Company Sector CMP (Rs)
Target (Rs)
Upside (%)
FY14‐17E PAT CAGR (%)
FY17E
P/E (x) RoE (%)
EV/EBIDTA
Bajaj Corp FMCG 372 485 30.4 17.0 18.6 45.8 16.4
Granules India Pharma 832 1085 30.4 27.6 10.8 24.3 6.5
Indian Hume Pipe Infrastrucutre 338 440 30.2 39.8 12.5 18.1 8.3
MM Forgings Auto Ancillary 546 710 30.0 42.3 7.8 28.6 4.1
Symphony Consumer Discretionary 1,913 2,489 30.1 35.3 25.4 50.5 19.4
Company Sector CMP (Rs)
Target (Rs)
Upside (%)
FY14‐17E PAT CAGR (%)
FY17E
P/ABV (x)
ROA (%)
ROE (%)
Can Fin Homes Financials 498 660 32.5 30.5 1.3 1.3 16.8
Source: India Infoline Research
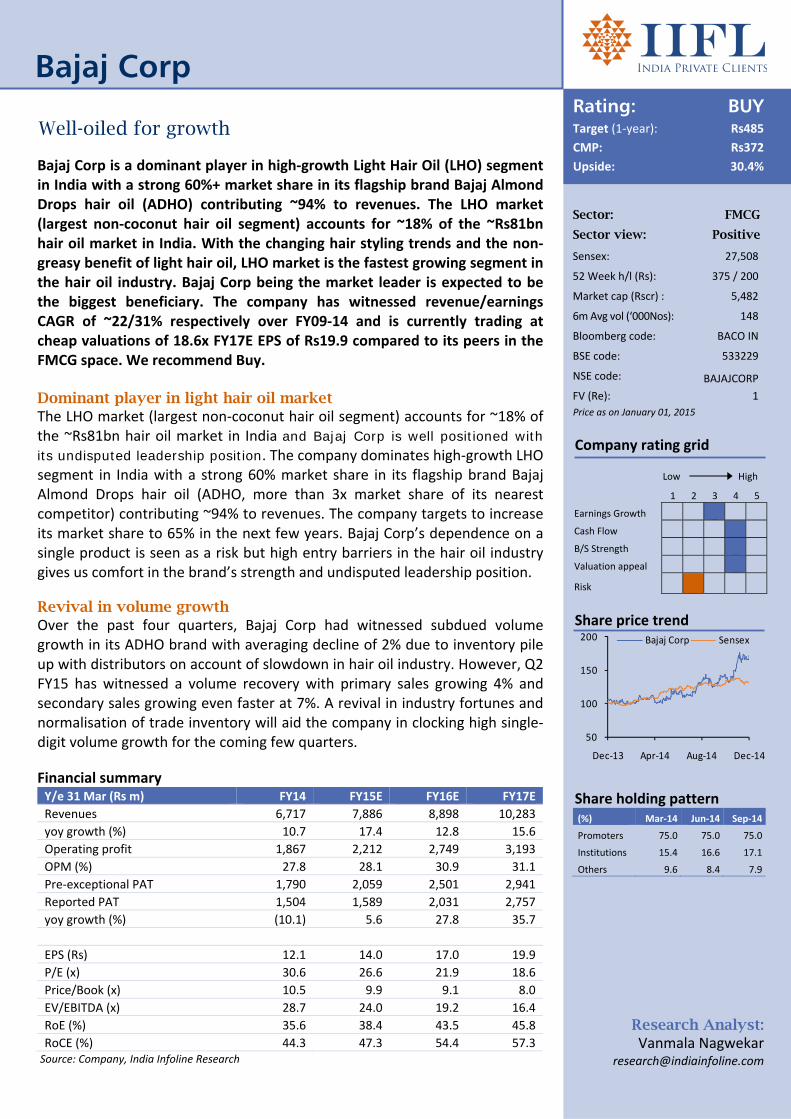
Sector: FMCG Sector view: Positive
Sensex: 27,508
52 Week h/l (Rs): 375 / 200
Market cap (Rscr) : 5,482
6m Avg vol (‘000Nos): 148
Bloomberg code: BACO IN
BSE code: 533229
NSE code: BAJAJCORP
FV (Re): 1
Price as on January 01, 2015
Company rating grid
Low High
1 2 3 4 5
Earnings Growth
Cash Flow
B/S Strength
Valuation appeal
Risk
Share price trend
50
100
150
200
Dec‐13 Apr‐14 Aug‐14 Dec‐14
Bajaj Corp Sensex
Share holding pattern (%) Mar‐14 Jun‐14 Sep‐14
Promoters 75.0 75.0 75.0
Institutions 15.4 16.6 17.1
Others 9.6 8.4 7.9
Rating: BUYTarget (1‐year): Rs485
CMP: Rs372
Upside: 30.4%
Research Analyst: Vanmala Nagwekar
Bajaj Corp
Well-oiled for growth
Bajaj Corp is a dominant player in high‐growth Light Hair Oil (LHO) segment in India with a strong 60%+ market share in its flagship brand Bajaj Almond Drops hair oil (ADHO) contributing ~94% to revenues. The LHO market (largest non‐coconut hair oil segment) accounts for ~18% of the ~Rs81bn hair oil market in India. With the changing hair styling trends and the non‐greasy benefit of light hair oil, LHO market is the fastest growing segment in the hair oil industry. Bajaj Corp being the market leader is expected to be the biggest beneficiary. The company has witnessed revenue/earnings CAGR of ~22/31% respectively over FY09‐14 and is currently trading at cheap valuations of 18.6x FY17E EPS of Rs19.9 compared to its peers in the FMCG space. We recommend Buy. Dominant player in light hair oil market The LHO market (largest non‐coconut hair oil segment) accounts for ~18% of the ~Rs81bn hair oil market in India and Bajaj Corp is well positioned with its undisputed leadership position. The company dominates high‐growth LHO segment in India with a strong 60% market share in its flagship brand Bajaj Almond Drops hair oil (ADHO, more than 3x market share of its nearest competitor) contributing ~94% to revenues. The company targets to increase its market share to 65% in the next few years. Bajaj Corp’s dependence on a single product is seen as a risk but high entry barriers in the hair oil industry gives us comfort in the brand’s strength and undisputed leadership position.
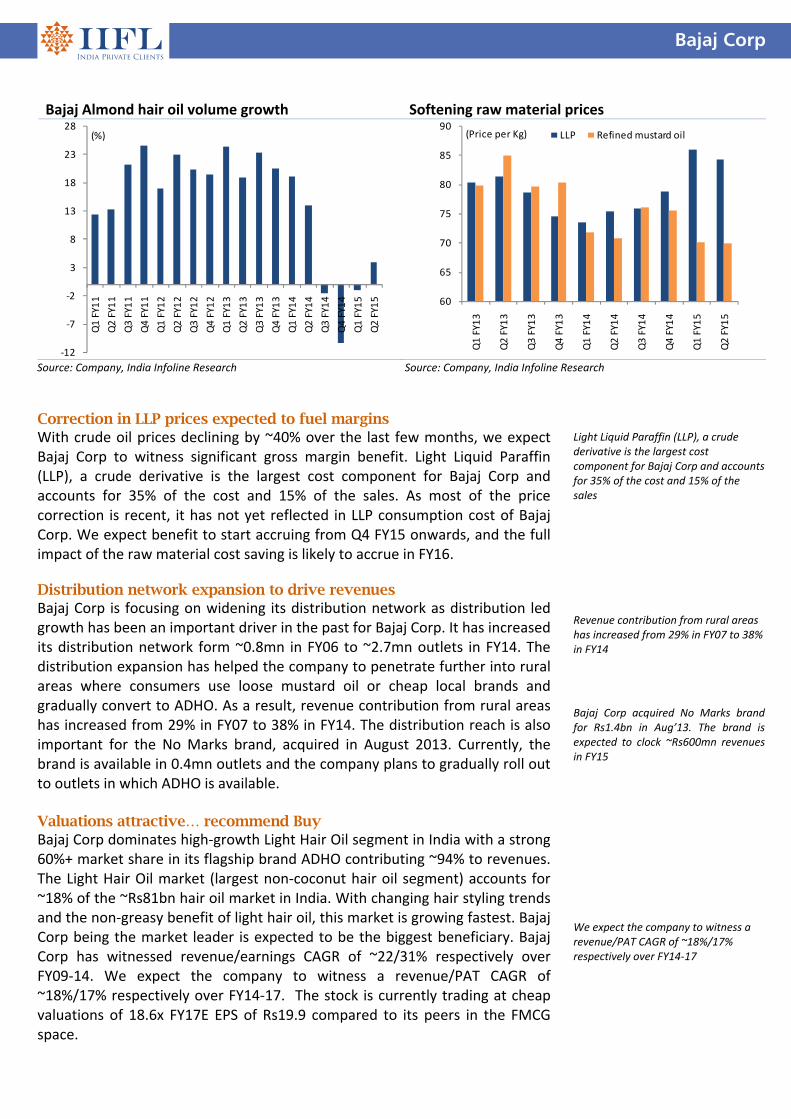
Revival in volume growth Over the past four quarters, Bajaj Corp had witnessed subdued volume growth in its ADHO brand with averaging decline of 2% due to inventory pile up with distributors on account of slowdown in hair oil industry. However, Q2 FY15 has witnessed a volume recovery with primary sales growing 4% and secondary sales growing even faster at 7%. A revival in industry fortunes and normalisation of trade inventory will aid the company in clocking high single‐digit volume growth for the coming few quarters.
Financial summary Y/e 31 Mar (Rs m) FY14 FY15E FY16E FY17E
Revenues 6,717 7,886 8,898 10,283
yoy growth (%) 10.7 17.4 12.8 15.6
Operating profit 1,867 2,212 2,749 3,193
OPM (%) 27.8 28.1 30.9 31.1
Pre‐exceptional PAT 1,790 2,059 2,501 2,941
Reported PAT 1,504 1,589 2,031 2,757
yoy growth (%) (10.1) 5.6 27.8 35.7
EPS (Rs) 12.1 14.0 17.0 19.9
P/E (x) 30.6 26.6 21.9 18.6
Price/Book (x) 10.5 9.9 9.1 8.0
EV/EBITDA (x) 28.7 24.0 19.2 16.4
RoE (%) 35.6 38.4 43.5 45.8
RoCE (%) 44.3 47.3 54.4 57.3 Source: Company, India Infoline Research
Bajaj Corp
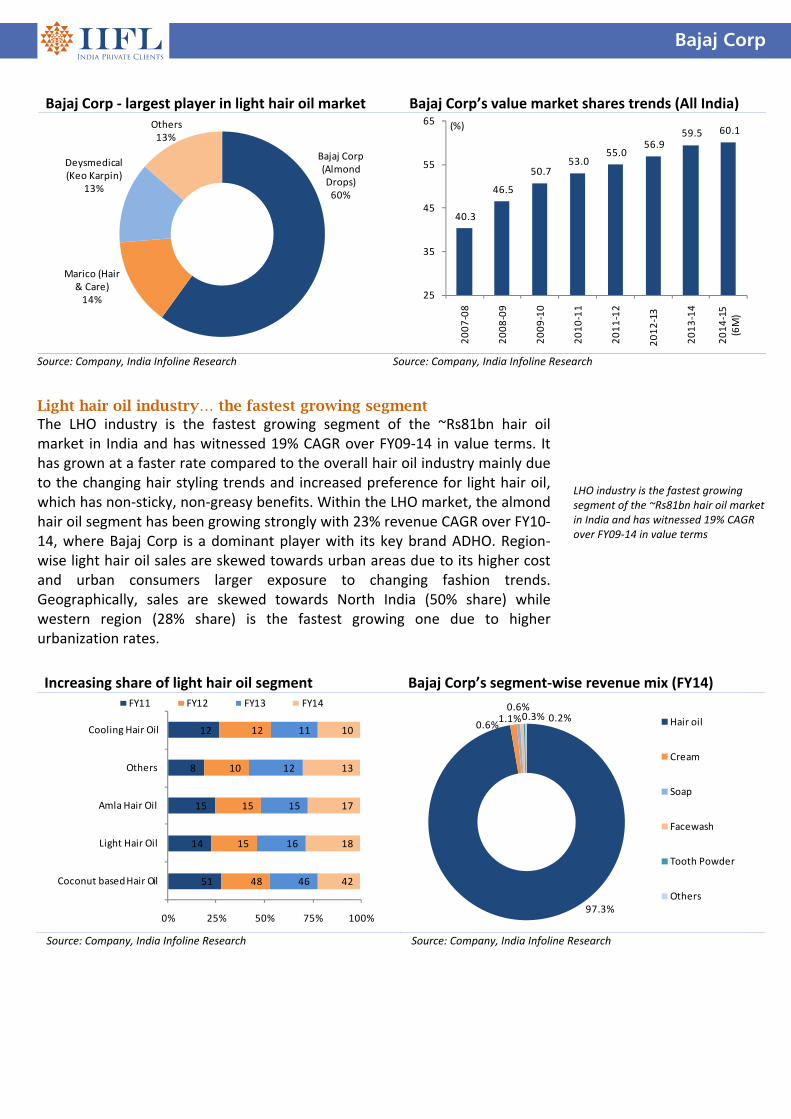
Light hair oil industry… the fastest growing segment The LHO industry is the fastest growing segment of the ~Rs81bn hair oil market in India and has witnessed 19% CAGR over FY09‐14 in value terms. It has grown at a faster rate compared to the overall hair oil industry mainly due to the changing hair styling trends and increased preference for light hair oil, which has non‐sticky, non‐greasy benefits. Within the LHO market, the almond hair oil segment has been growing strongly with 23% revenue CAGR over FY10‐14, where Bajaj Corp is a dominant player with its key brand ADHO. Region‐ wise light hair oil sales are skewed towards urban areas due to its higher cost and urban consumers larger exposure to changing fashion trends. Geographically, sales are skewed towards North India (50% share) while western region (28% share) is the fastest growing one due to higher urbanization rates.
LHO industry is the fastest growing segment of the ~Rs81bn hair oil market in India and has witnessed 19% CAGR over FY09‐14 in value terms
Bajaj Corp ‐ largest player in light hair oil market Bajaj Corp’s value market shares trends (All India)
Bajaj Corp (Almond Drops)60%
Marico (Hair & Care)14%
Deysmedical (Keo Karpin)
13%
Others 13%
40.3
46.5
50.7 53.0
55.0 56.9
59.5 60.1
25
35
45
55
65
2007‐08
2008‐09
2009‐10
2010‐11
2011‐12
2012‐13
2013‐14
2014‐15
(6M)
(%)
Source: Company, India Infoline Research Source: Company, India Infoline Research
Increasing share of light hair oil segment Bajaj Corp’s segment‐wise revenue mix (FY14)
51
14
15
8
12
48
15
15
10
12
46
16
15
12
11
42
18
17
13
10
0% 25% 50% 75% 100%
Coconut based Hair Oil
Light Hair Oil
Amla Hair Oil
Others
Cooling Hair Oil
FY11 FY12 FY13 FY14
97.3%
1.1%0.6%
0.6%0.3% 0.2% Hair oil
Cream
Soap
Facewash
Tooth Powder
Others
Source: Company, India Infoline Research Source: Company, India Infoline Research
Bajaj Corp
Correction in LLP prices expected to fuel margins With crude oil prices declining by ~40% over the last few months, we expect Bajaj Corp to witness significant gross margin benefit. Light Liquid Paraffin (LLP), a crude derivative is the largest cost component for Bajaj Corp and accounts for 35% of the cost and 15% of the sales. As most of the price correction is recent, it has not yet reflected in LLP consumption cost of Bajaj Corp. We expect benefit to start accruing from Q4 FY15 onwards, and the full impact of the raw material cost saving is likely to accrue in FY16. Distribution network expansion to drive revenues Bajaj Corp is focusing on widening its distribution network as distribution led growth has been an important driver in the past for Bajaj Corp. It has increased its distribution network form ~0.8mn in FY06 to ~2.7mn outlets in FY14. The distribution expansion has helped the company to penetrate further into rural areas where consumers use loose mustard oil or cheap local brands and gradually convert to ADHO. As a result, revenue contribution from rural areas has increased from 29% in FY07 to 38% in FY14. The distribution reach is also important for the No Marks brand, acquired in August 2013. Currently, the brand is available in 0.4mn outlets and the company plans to gradually roll out to outlets in which ADHO is available. Valuations attractive… recommend Buy Bajaj Corp dominates high‐growth Light Hair Oil segment in India with a strong 60%+ market share in its flagship brand ADHO contributing ~94% to revenues. The Light Hair Oil market (largest non‐coconut hair oil segment) accounts for ~18% of the ~Rs81bn hair oil market in India. With changing hair styling trends and the non‐greasy benefit of light hair oil, this market is growing fastest. Bajaj Corp being the market leader is expected to be the biggest beneficiary. Bajaj Corp has witnessed revenue/earnings CAGR of ~22/31% respectively over FY09‐14. We expect the company to witness a revenue/PAT CAGR of ~18%/17% respectively over FY14‐17. The stock is currently trading at cheap valuations of 18.6x FY17E EPS of Rs19.9 compared to its peers in the FMCG space.
Light Liquid Paraffin (LLP), a crude derivative is the largest cost component for Bajaj Corp and accounts for 35% of the cost and 15% of the sales Revenue contribution from rural areas has increased from 29% in FY07 to 38% in FY14 Bajaj Corp acquired No Marks brand for Rs1.4bn in Aug’13. The brand is expected to clock ~Rs600mn revenues in FY15 We expect the company to witness a revenue/PAT CAGR of ~18%/17% respectively over FY14‐17
Bajaj Almond hair oil volume growth Softening raw material prices
‐12
‐7
‐2
3
8
13
18
23
28
Q1 FY11
Q2 FY11
Q3 FY11
Q4 FY11
Q1 FY12
Q2 FY12
Q3 FY12
Q4 FY12
Q1 FY13
Q2 FY13
Q3 FY13
Q4 FY13
Q1 FY14
Q2 FY14
Q3 FY14
Q4 FY14
Q1 FY15
Q2 FY15
(%)
60
65
70
75
80
85
90
Q1 FY13
Q2 FY13
Q3 FY13
Q4 FY13
Q1 FY14
Q2 FY14
Q3 FY14
Q4 FY14
Q1 FY15
Q2 FY15
(Price per Kg) LLP Refined mustard oil
Source: Company, India Infoline Research Source: Company, India Infoline Research
Bajaj Corp
Financials Income statement Y/e 31 Mar (Rs m) FY14 FY15E FY16E FY17E
Revenue 6,717 7,886 8,898 10,283
Operating profit 1,867 2,212 2,749 3,193
Depreciation (37) (47) (52) (56)
Interest expense (59) (2) (2) (2)
Other income 401 371 431 541
Profit before tax 2,172 2,535 3,127 3,676
Taxes (382) (475) (625) (735)
Adj. profit 1,790 2,059 2,501 2,941
Exceptional items* (286) (470) (470) (184)
Net profit 1,504 1,589 2,031 2,757 * No Marks acquisition amortisation expenses
Balance sheet Y/e 31 Mar (Rs m) FY14 FY15E FY16E FY17E
Equity capital 148 148 148 148
Reserves 5,073 5,368 5,847 6,705
Net worth 5,221 5,516 5,994 6,852
Total liabilities 5,221 5,516 5,994 6,852
Fixed assets 483 507 528 543
Intangible assets 1,126 836 542 584
Investments 2,107 2,207 2,407 2,907
Net working capital 215 313 374 459
Inventories 395 465 524 606
Sundry debtors 84 97 110 127
Other current assets 333 388 438 508
Sundry creditors (405) (475) (536) (620)
Other current liabilities (191) (161) (161) (161)
Cash 1,290 1,652 2,143 2,359
Total assets 5,221 5,516 5,994 6,852
Cash flow statement Y/e 31 Mar (Rs m) FY14 FY15E FY16E FY17E
Profit before tax 2,172 2,535 3,127 3,676
Depreciation 37 47 52 56
Tax paid (382) (475) (625) (735)
Working capital ∆ (67) (98) (61) (85)
Operating cashflow 1,760 2,008 2,492 2,912
Capital expenditure (1,187) 219 222 (114)
Free cash flow 573 2,227 2,714 2,798
Investments 248 (100) (200) (500)
Debt financing/ disposal
‐ ‐ ‐ ‐
Dividends paid (1,122) (1,294) (1,553) (1,898)
Other items (299) (470) (470) (184)
Net ∆ in cash (600) 362 491 216
Key ratios Y/e 31 Mar FY14 FY15E FY16E FY17E
Growth matrix (%)
Revenue growth 10.7 17.4 12.8 15.6
Op profit growth 8.0 18.5 24.3 16.2
EBIT growth 6.5 13.7 23.3 17.6
Net profit growth 7.0 15.0 21.5 17.6
Profitability ratios (%)
OPM 27.8 28.1 30.9 31.1
EBIT margin 33.2 32.2 35.2 35.8
Net profit margin 26.7 26.1 28.1 28.6
RoCE 44.3 47.3 54.4 57.3
RoNW 35.6 38.4 43.5 45.8
RoA 31.5 34.4 39.0 41.1
Per share ratios
EPS 12.1 14.0 17.0 19.9
Dividend per share 6.5 7.5 9.0 11.0
Cash EPS 12.4 14.3 17.3 20.3
Book value per share 35.4 37.4 40.6 46.5
Valuation ratios (x)
P/E 30.6 26.6 21.9 18.6
P/CEPS 30.0 26.0 21.5 18.3
P/B 10.5 9.9 9.1 8.0
EV/EBIDTA 28.7 24.0 19.2 16.4
Payout (%)
Dividend payout 62.7 62.8 62.1 64.6
Tax payout 17.6 18.8 20.0 20.0
Liquidity ratios
Debtor days 5 5 5 5
Inventory days 21 22 22 22
Creditor days 22 22 22 22
Du‐Pont Analysis Y/e 31 Mar (Rs m) FY14 FY15E FY16E FY17E
Tax burden (x) 0.82 0.81 0.80 0.80
Interest burden (x) 0.97 1.00 1.00 1.00
EBIT margin (x) 0.33 0.32 0.35 0.36
Asset turnover (x) 1.18 1.32 1.39 1.44
Financial leverage (x) 1.13 1.11 1.12 1.12
RoE (%) 35.6 38.4 43.5 45.8
Sector: Financials
Sector view: Positive
Sensex: 27,508
52 Week h/l (Rs): 548/160
Market cap (Rscr) : 1,020
6m Avg vol (‘000Nos): 51.5
Bloomberg code: CANF IN
BSE code: 511196
NSE code: CANFINHOME
FV (Rs): 10
Price as on January 01, 2015
Company rating grid
Low High
1 2 3 4 5
Earnings Growth
RoA Progression
B/S Strength
Valuation appeal
Risk
Share price trend
0
100
200
300
Dec‐13 Apr‐14 Aug‐14 Dec‐14
CanFin Home Sensex
Share holding pattern (%) Mar‐14 Jun‐14 Sep‐14
Promoter 42.4 42.4 42.4
Insti 0.9 0.9 1.1
Others 56.7 56.7 56.5
Rating: BUYTarget (1‐Year): Rs660
CMP: Rs498
Upside: 32.5%
Research Analyst: Rajiv Mehta
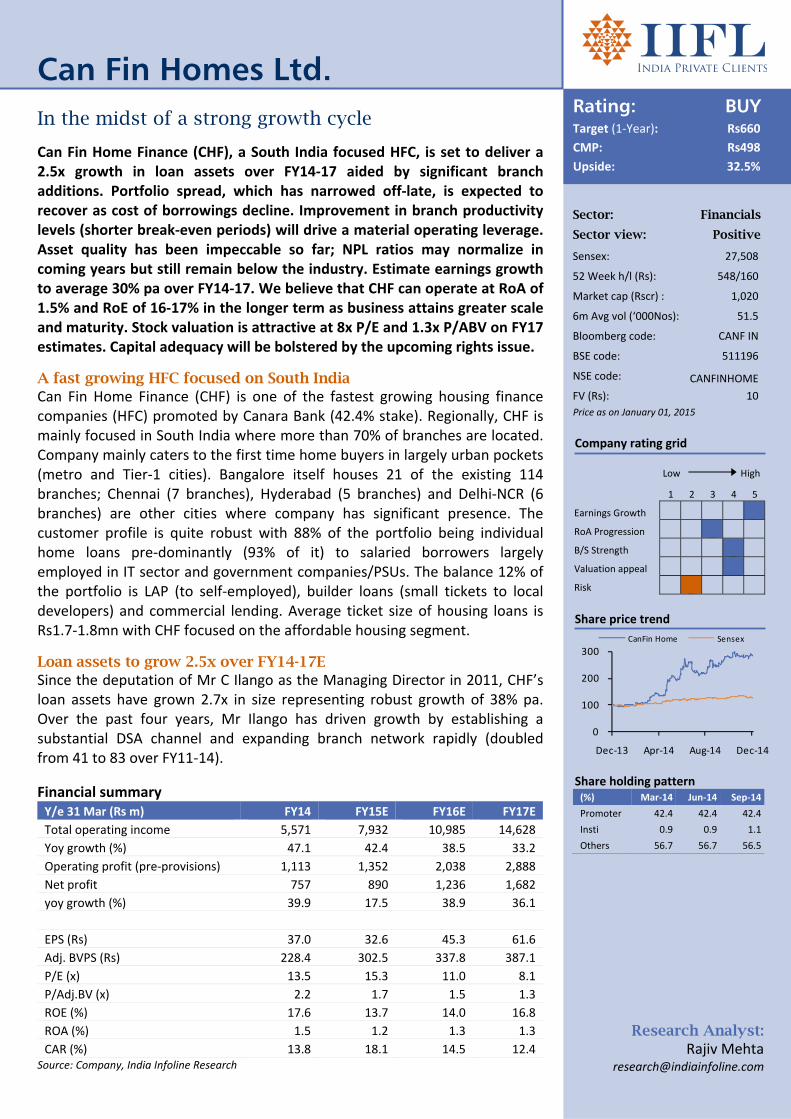
Can Fin Homes Ltd. In the midst of a strong growth cycle Can Fin Home Finance (CHF), a South India focused HFC, is set to deliver a 2.5x growth in loan assets over FY14‐17 aided by significant branch additions. Portfolio spread, which has narrowed off‐late, is expected to recover as cost of borrowings decline. Improvement in branch productivity levels (shorter break‐even periods) will drive a material operating leverage. Asset quality has been impeccable so far; NPL ratios may normalize in coming years but still remain below the industry. Estimate earnings growth to average 30% pa over FY14‐17. We believe that CHF can operate at RoA of 1.5% and RoE of 16‐17% in the longer term as business attains greater scale and maturity. Stock valuation is attractive at 8x P/E and 1.3x P/ABV on FY17 estimates. Capital adequacy will be bolstered by the upcoming rights issue.
A fast growing HFC focused on South India Can Fin Home Finance (CHF) is one of the fastest growing housing finance companies (HFC) promoted by Canara Bank (42.4% stake). Regionally, CHF is mainly focused in South India where more than 70% of branches are located. Company mainly caters to the first time home buyers in largely urban pockets (metro and Tier‐1 cities). Bangalore itself houses 21 of the existing 114 branches; Chennai (7 branches), Hyderabad (5 branches) and Delhi‐NCR (6 branches) are other cities where company has significant presence. The customer profile is quite robust with 88% of the portfolio being individual home loans pre‐dominantly (93% of it) to salaried borrowers largely employed in IT sector and government companies/PSUs. The balance 12% of the portfolio is LAP (to self‐employed), builder loans (small tickets to local developers) and commercial lending. Average ticket size of housing loans is Rs1.7‐1.8mn with CHF focused on the affordable housing segment.
Loan assets to grow 2.5x over FY14-17E Since the deputation of Mr C Ilango as the Managing Director in 2011, CHF’s loan assets have grown 2.7x in size representing robust growth of 38% pa. Over the past four years, Mr Ilango has driven growth by establishing a substantial DSA channel and expanding branch network rapidly (doubled from 41 to 83 over FY11‐14).
Financial summary Y/e 31 Mar (Rs m) FY14 FY15E FY16E FY17E
Total operating income 5,571 7,932 10,985 14,628
Yoy growth (%) 47.1 42.4 38.5 33.2
Operating profit (pre‐provisions) 1,113 1,352 2,038 2,888
Net profit 757 890 1,236 1,682
yoy growth (%) 39.9 17.5 38.9 36.1
EPS (Rs) 37.0 32.6 45.3 61.6
Adj. BVPS (Rs) 228.4 302.5 337.8 387.1
P/E (x) 13.5 15.3 11.0 8.1
P/Adj.BV (x) 2.2 1.7 1.5 1.3
ROE (%) 17.6 13.7 14.0 16.8
ROA (%) 1.5 1.2 1.3 1.3
CAR (%) 13.8 18.1 14.5 12.4 Source: Company, India Infoline Research
Can Fin Homes Ltd.
Disbursements traction to remain strong Loan portfolio to grow rapidly
0
50
100
150
200
0.0
15.0
30.0
45.0
60.0
FY07
FY08
FY09
FY10
FY11
FY12
FY13
FY14
FY15E
FY16E
FY17E
(No)(Rs bn)
Disbursements (LHS) Branches (RHS)
19 19 19 21 22 27
40
58
83
113
148
0
30
60
90
120
150
FY07 FY08 FY09 FY10 FY11 FY12 FY13 FY14 FY15E FY16E FY17E
(Rs bn)
Source: Company, India Infoline Research
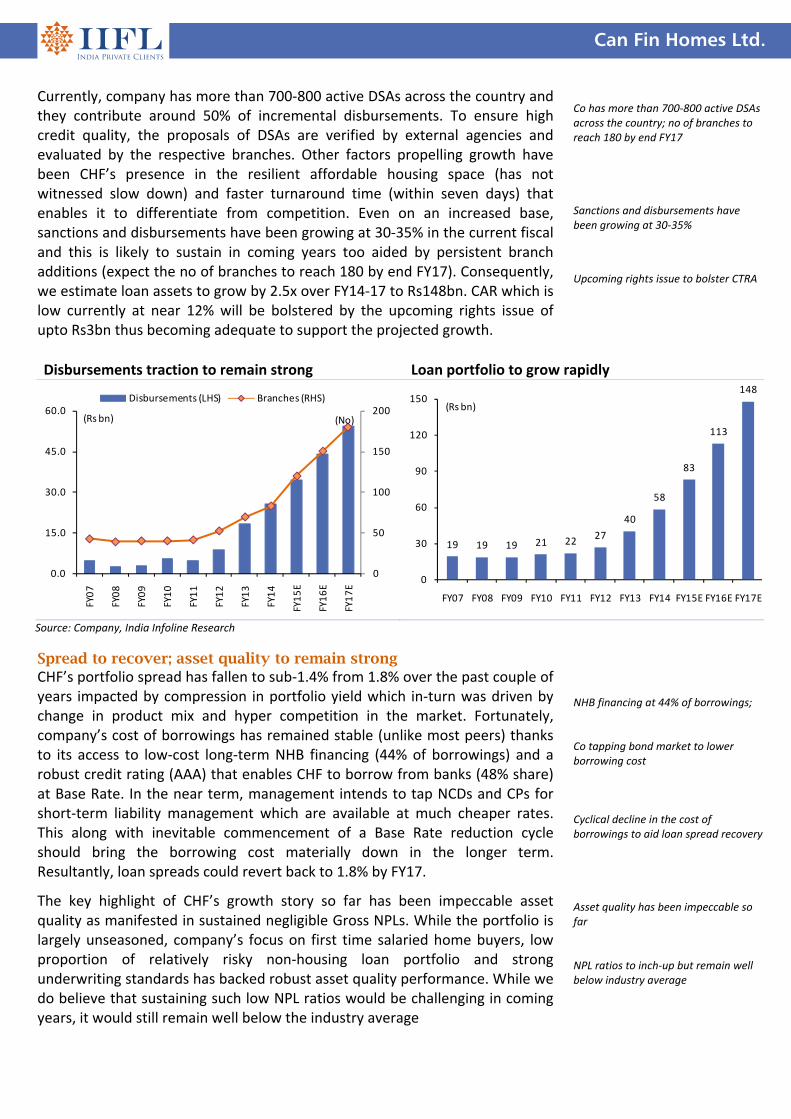
Currently, company has more than 700‐800 active DSAs across the country and they contribute around 50% of incremental disbursements. To ensure high credit quality, the proposals of DSAs are verified by external agencies and evaluated by the respective branches. Other factors propelling growth have been CHF’s presence in the resilient affordable housing space (has not witnessed slow down) and faster turnaround time (within seven days) that enables it to differentiate from competition. Even on an increased base, sanctions and disbursements have been growing at 30‐35% in the current fiscal and this is likely to sustain in coming years too aided by persistent branch additions (expect the no of branches to reach 180 by end FY17). Consequently, we estimate loan assets to grow by 2.5x over FY14‐17 to Rs148bn. CAR which is low currently at near 12% will be bolstered by the upcoming rights issue of upto Rs3bn thus becoming adequate to support the projected growth.
Spread to recover; asset quality to remain strong CHF’s portfolio spread has fallen to sub‐1.4% from 1.8% over the past couple of years impacted by compression in portfolio yield which in‐turn was driven by change in product mix and hyper competition in the market. Fortunately, company’s cost of borrowings has remained stable (unlike most peers) thanks to its access to low‐cost long‐term NHB financing (44% of borrowings) and a robust credit rating (AAA) that enables CHF to borrow from banks (48% share) at Base Rate. In the near term, management intends to tap NCDs and CPs for short‐term liability management which are available at much cheaper rates. This along with inevitable commencement of a Base Rate reduction cycle should bring the borrowing cost materially down in the longer term. Resultantly, loan spreads could revert back to 1.8% by FY17.
The key highlight of CHF’s growth story so far has been impeccable asset quality as manifested in sustained negligible Gross NPLs. While the portfolio is largely unseasoned, company’s focus on first time salaried home buyers, low proportion of relatively risky non‐housing loan portfolio and strong underwriting standards has backed robust asset quality performance. While we do believe that sustaining such low NPL ratios would be challenging in coming years, it would still remain well below the industry average
Co has more than 700‐800 active DSAs across the country; no of branches to reach 180 by end FY17 Sanctions and disbursements have been growing at 30‐35% Upcoming rights issue to bolster CTRA
NHB financing at 44% of borrowings; Co tapping bond market to lower borrowing cost Cyclical decline in the cost of borrowings to aid loan spread recovery Asset quality has been impeccable so far NPL ratios to inch‐up but remain well below industry average
Can Fin Homes Ltd.
Estimate 30% earnings CAGR over FY14‐17 RoA to gradually improve to 1.5% in longer term
14.3
21.9
7.74.8
25.6
39.9
17.5
38.936.1
0.0
10.0
20.0
30.0
40.0
50.0
FY09 FY10 FY11 FY12 FY13 FY14 FY15E FY16E FY17E
(%)
10.0
12.0
14.0
16.0
18.0
20.0
0.0
0.4
0.8
1.2
1.6
2.0
FY07
FY08
FY09
FY10
FY11
FY12
FY13
FY14
FY15E
FY16E
FY17E
(%)(%)
RoA (LHS) RoE (RHS)
Source: Company, India Infoline Research
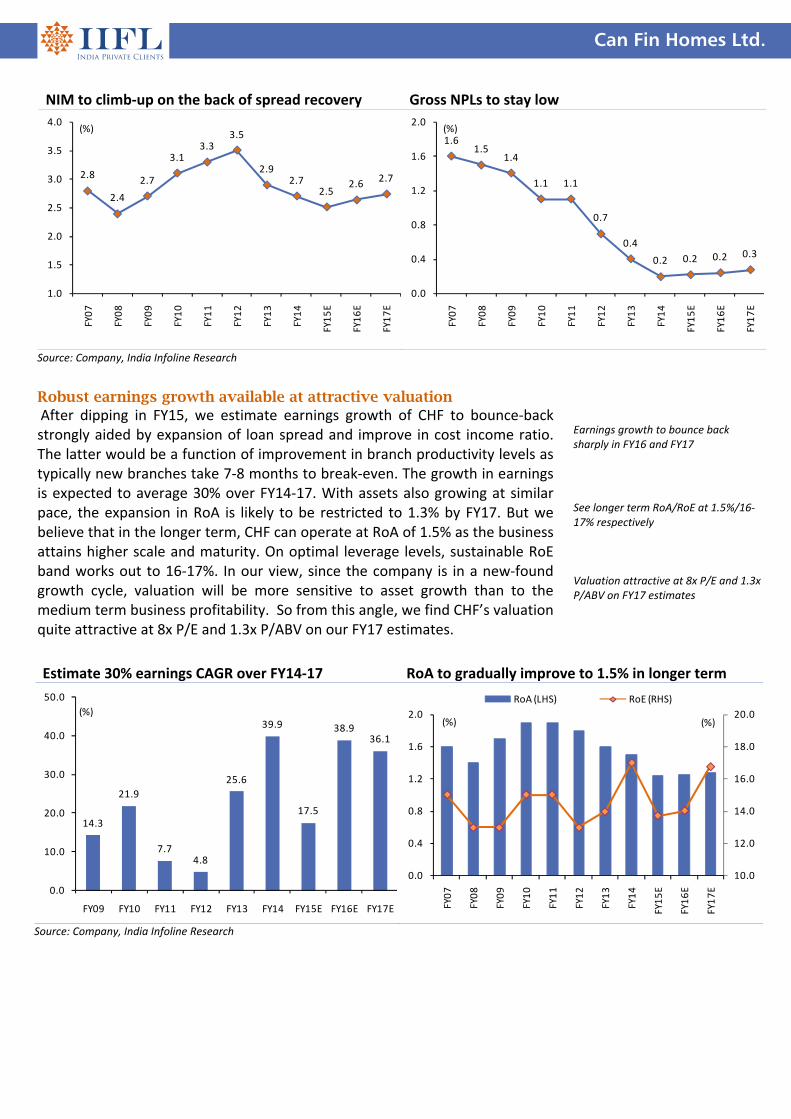
NIM to climb‐up on the back of spread recovery Gross NPLs to stay low
2.8
2.4
2.7
3.13.3
3.5
2.92.7
2.52.6
2.7
1.0
1.5
2.0
2.5
3.0
3.5
4.0
FY07
FY08
FY09
FY10
FY11
FY12
FY13
FY14
FY15E
FY16E
FY17E
(%)1.6
1.51.4
1.1 1.1
0.7
0.4
0.2 0.2 0.2 0.3
0.0
0.4
0.8
1.2
1.6
2.0
FY07
FY08
FY09
FY10
FY11
FY12
FY13
FY14
FY15E
FY16E
FY17E
(%)
Source: Company, India Infoline Research
Robust earnings growth available at attractive valuation After dipping in FY15, we estimate earnings growth of CHF to bounce‐back strongly aided by expansion of loan spread and improve in cost income ratio. The latter would be a function of improvement in branch productivity levels as typically new branches take 7‐8 months to break‐even. The growth in earnings is expected to average 30% over FY14‐17. With assets also growing at similar pace, the expansion in RoA is likely to be restricted to 1.3% by FY17. But we believe that in the longer term, CHF can operate at RoA of 1.5% as the business attains higher scale and maturity. On optimal leverage levels, sustainable RoE band works out to 16‐17%. In our view, since the company is in a new‐found growth cycle, valuation will be more sensitive to asset growth than to the medium term business profitability. So from this angle, we find CHF’s valuation quite attractive at 8x P/E and 1.3x P/ABV on our FY17 estimates.
Earnings growth to bounce back sharply in FY16 and FY17 See longer term RoA/RoE at 1.5%/16‐17% respectively Valuation attractive at 8x P/E and 1.3x P/ABV on FY17 estimates
Can Fin Homes Ltd.
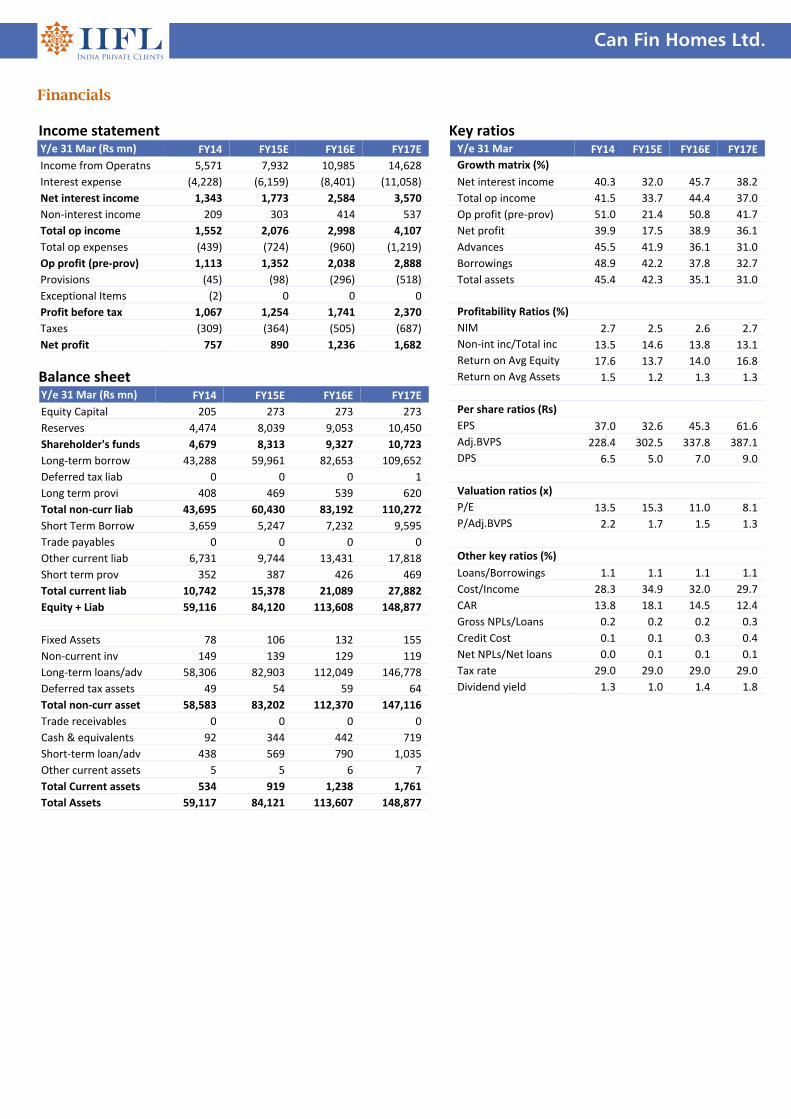
Financials Income statement Y/e 31 Mar (Rs mn) FY14 FY15E FY16E FY17E
Income from Operatns 5,571 7,932 10,985 14,628
Interest expense (4,228) (6,159) (8,401) (11,058)
Net interest income 1,343 1,773 2,584 3,570
Non‐interest income 209 303 414 537
Total op income 1,552 2,076 2,998 4,107
Total op expenses (439) (724) (960) (1,219)
Op profit (pre‐prov) 1,113 1,352 2,038 2,888
Provisions (45) (98) (296) (518)
Exceptional Items (2) 0 0 0
Profit before tax 1,067 1,254 1,741 2,370
Taxes (309) (364) (505) (687)
Net profit 757 890 1,236 1,682
Balance sheet Y/e 31 Mar (Rs mn) FY14 FY15E FY16E FY17E
Equity Capital 205 273 273 273
Reserves 4,474 8,039 9,053 10,450
Shareholder's funds 4,679 8,313 9,327 10,723
Long‐term borrow 43,288 59,961 82,653 109,652
Deferred tax liab 0 0 0 1
Long term provi 408 469 539 620
Total non‐curr liab 43,695 60,430 83,192 110,272
Short Term Borrow 3,659 5,247 7,232 9,595
Trade payables 0 0 0 0
Other current liab 6,731 9,744 13,431 17,818
Short term prov 352 387 426 469
Total current liab 10,742 15,378 21,089 27,882
Equity + Liab 59,116 84,120 113,608 148,877
Fixed Assets 78 106 132 155
Non‐current inv 149 139 129 119
Long‐term loans/adv 58,306 82,903 112,049 146,778
Deferred tax assets 49 54 59 64
Total non‐curr asset 58,583 83,202 112,370 147,116
Trade receivables 0 0 0 0
Cash & equivalents 92 344 442 719
Short‐term loan/adv 438 569 790 1,035
Other current assets 5 5 6 7
Total Current assets 534 919 1,238 1,761
Total Assets 59,117 84,121 113,607 148,877
Key ratios Y/e 31 Mar FY14 FY15E FY16E FY17E
Growth matrix (%)
Net interest income 40.3 32.0 45.7 38.2
Total op income 41.5 33.7 44.4 37.0
Op profit (pre‐prov) 51.0 21.4 50.8 41.7
Net profit 39.9 17.5 38.9 36.1
Advances 45.5 41.9 36.1 31.0
Borrowings 48.9 42.2 37.8 32.7
Total assets 45.4 42.3 35.1 31.0
Profitability Ratios (%)
NIM 2.7 2.5 2.6 2.7
Non‐int inc/Total inc 13.5 14.6 13.8 13.1
Return on Avg Equity 17.6 13.7 14.0 16.8
Return on Avg Assets 1.5 1.2 1.3 1.3
Per share ratios (Rs)
EPS 37.0 32.6 45.3 61.6
Adj.BVPS 228.4 302.5 337.8 387.1
DPS 6.5 5.0 7.0 9.0
Valuation ratios (x)
P/E 13.5 15.3 11.0 8.1
P/Adj.BVPS 2.2 1.7 1.5 1.3
Other key ratios (%)
Loans/Borrowings 1.1 1.1 1.1 1.1
Cost/Income 28.3 34.9 32.0 29.7
CAR 13.8 18.1 14.5 12.4
Gross NPLs/Loans 0.2 0.2 0.2 0.3
Credit Cost 0.1 0.1 0.3 0.4
Net NPLs/Net loans 0.0 0.1 0.1 0.1
Tax rate 29.0 29.0 29.0 29.0
Dividend yield 1.3 1.0 1.4 1.8
Sector:
Pharmaceuticals
Sector view: Positive
Sensex: 27,508
52 Week h/l (Rs): 941 / 189
Market cap (Rscr) : 1,700
3m Avg vol (‘000Nos): 132
Bloomberg code: GRAN IN
BSE code: 532482
NSE code: GRANULES
FV (Rs): 10
Price as on January 01, 2015
Company rating grid
Low High
1 2 3 4 5
Earnings Growth
Cash Flow
B/S Strength
Valuation appeal
Risk
Share price trend
0
100
200
300
400
500
Jan‐14 Jun‐14 Dec‐14
Granules Sensex
Share holding pattern % Mar‐14 Jun‐14 Sep‐14
Promoters 48.9 48.7 48.6
Insti 1.9 4.5 6.3
Others 49.2 46.8 45.1
Rating: BUYTarget (1‐Year): Rs1,085
CMP: Rs832
Upside: 30.4%
Research Analyst: Bhavesh Gandhi
Granules India
A healthy dose
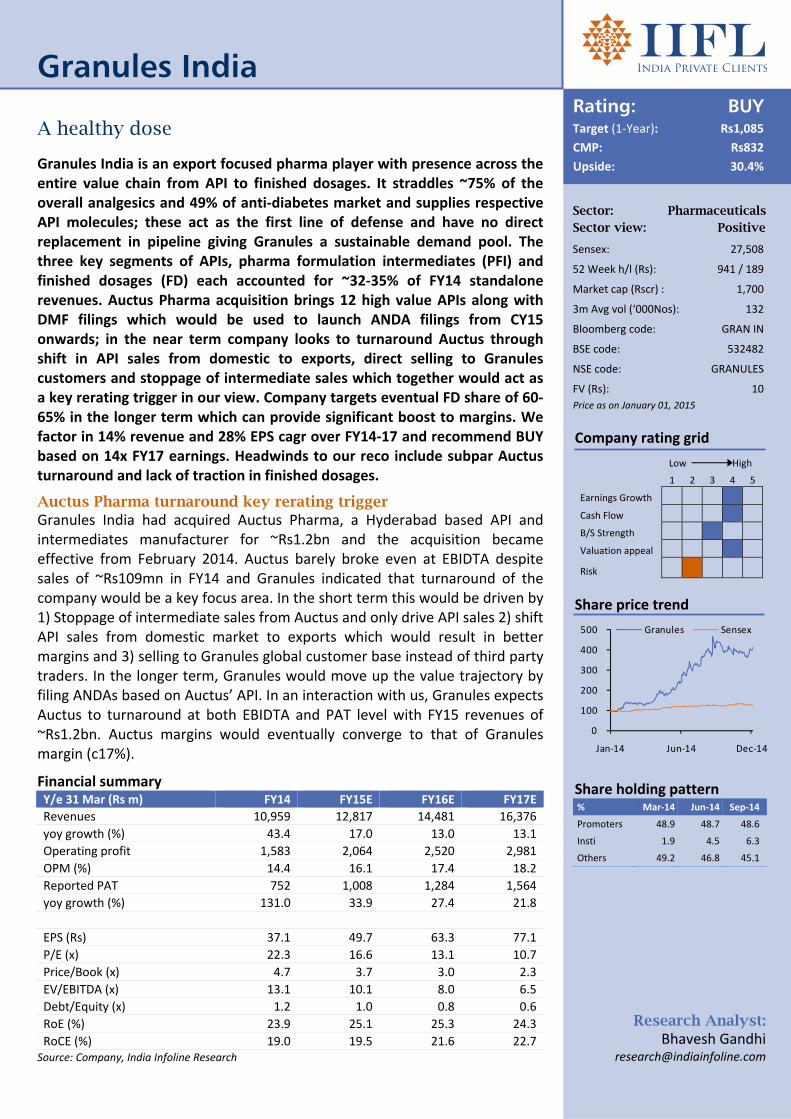
Granules India is an export focused pharma player with presence across the entire value chain from API to finished dosages. It straddles ~75% of the overall analgesics and 49% of anti‐diabetes market and supplies respective API molecules; these act as the first line of defense and have no direct replacement in pipeline giving Granules a sustainable demand pool. The three key segments of APIs, pharma formulation intermediates (PFI) and finished dosages (FD) each accounted for ~32‐35% of FY14 standalone revenues. Auctus Pharma acquisition brings 12 high value APIs along with DMF filings which would be used to launch ANDA filings from CY15 onwards; in the near term company looks to turnaround Auctus through shift in API sales from domestic to exports, direct selling to Granules customers and stoppage of intermediate sales which together would act as a key rerating trigger in our view. Company targets eventual FD share of 60‐65% in the longer term which can provide significant boost to margins. We factor in 14% revenue and 28% EPS cagr over FY14‐17 and recommend BUY based on 14x FY17 earnings. Headwinds to our reco include subpar Auctus turnaround and lack of traction in finished dosages.
Auctus Pharma turnaround key rerating trigger Granules India had acquired Auctus Pharma, a Hyderabad based API and intermediates manufacturer for ~Rs1.2bn and the acquisition became effective from February 2014. Auctus barely broke even at EBIDTA despite sales of ~Rs109mn in FY14 and Granules indicated that turnaround of the company would be a key focus area. In the short term this would be driven by 1) Stoppage of intermediate sales from Auctus and only drive API sales 2) shift API sales from domestic market to exports which would result in better margins and 3) selling to Granules global customer base instead of third party traders. In the longer term, Granules would move up the value trajectory by filing ANDAs based on Auctus’ API. In an interaction with us, Granules expects Auctus to turnaround at both EBIDTA and PAT level with FY15 revenues of ~Rs1.2bn. Auctus margins would eventually converge to that of Granules margin (c17%).
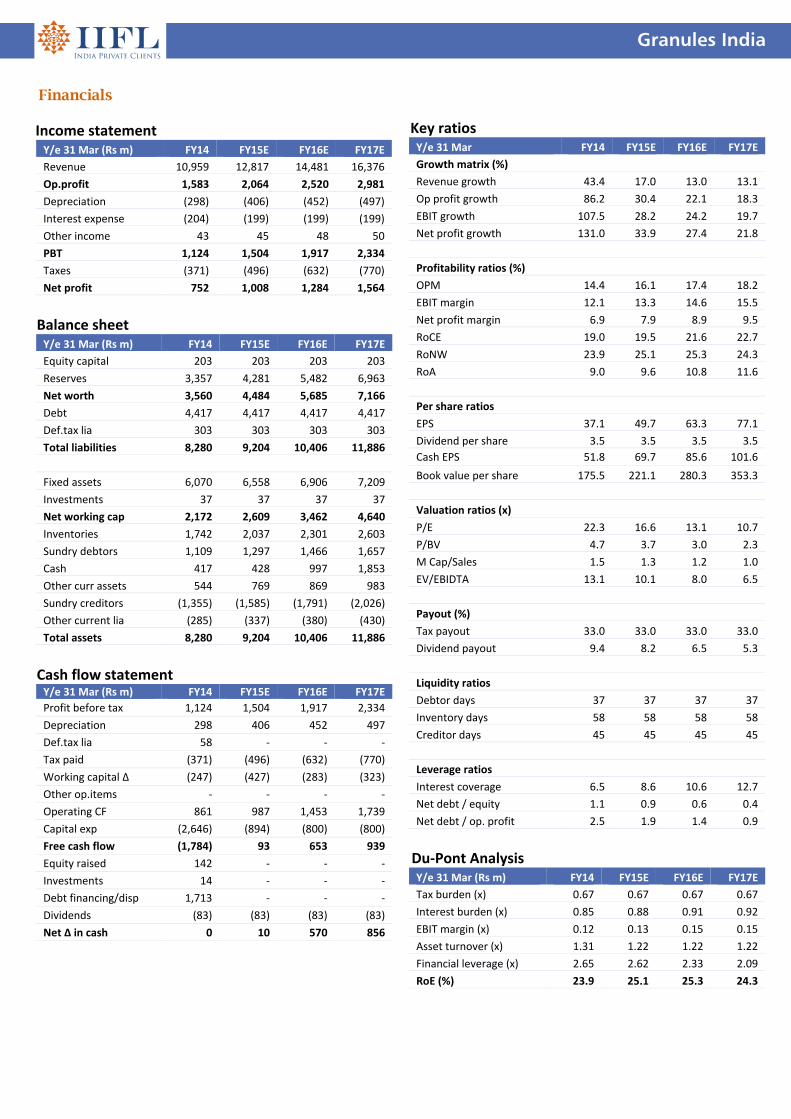
Financial summary Y/e 31 Mar (Rs m) FY14 FY15E FY16E FY17E
Revenues 10,959 12,817 14,481 16,376
yoy growth (%) 43.4 17.0 13.0 13.1
Operating profit 1,583 2,064 2,520 2,981
OPM (%) 14.4 16.1 17.4 18.2
Reported PAT 752 1,008 1,284 1,564
yoy growth (%) 131.0 33.9 27.4 21.8
EPS (Rs) 37.1 49.7 63.3 77.1
P/E (x) 22.3 16.6 13.1 10.7
Price/Book (x) 4.7 3.7 3.0 2.3
EV/EBITDA (x) 13.1 10.1 8.0 6.5
Debt/Equity (x) 1.2 1.0 0.8 0.6
RoE (%) 23.9 25.1 25.3 24.3
RoCE (%) 19.0 19.5 21.6 22.7 Source: Company, India Infoline Research
Granules India
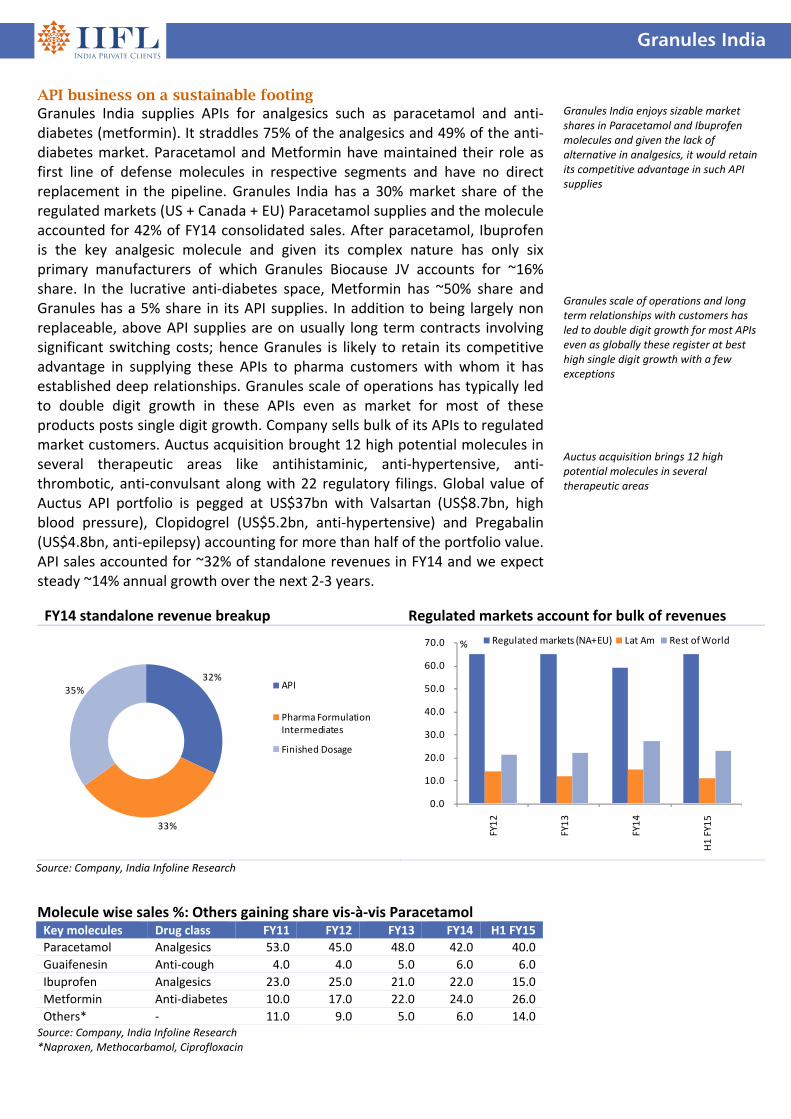
FY14 standalone revenue breakup Regulated markets account for bulk of revenues
32%
33%
35% API
Pharma Formulation Intermediates
Finished Dosage
0.0
10.0
20.0
30.0
40.0
50.0
60.0
70.0
FY12
FY13
FY14
H1 FY15
Regulated markets (NA+EU) Lat Am Rest of World%
Source: Company, India Infoline Research
API business on a sustainable footing Granules India supplies APIs for analgesics such as paracetamol and anti‐diabetes (metformin). It straddles 75% of the analgesics and 49% of the anti‐diabetes market. Paracetamol and Metformin have maintained their role as first line of defense molecules in respective segments and have no direct replacement in the pipeline. Granules India has a 30% market share of the regulated markets (US + Canada + EU) Paracetamol supplies and the molecule accounted for 42% of FY14 consolidated sales. After paracetamol, Ibuprofen is the key analgesic molecule and given its complex nature has only six primary manufacturers of which Granules Biocause JV accounts for ~16% share. In the lucrative anti‐diabetes space, Metformin has ~50% share and Granules has a 5% share in its API supplies. In addition to being largely non replaceable, above API supplies are on usually long term contracts involving significant switching costs; hence Granules is likely to retain its competitive advantage in supplying these APIs to pharma customers with whom it has established deep relationships. Granules scale of operations has typically led to double digit growth in these APIs even as market for most of these products posts single digit growth. Company sells bulk of its APIs to regulated market customers. Auctus acquisition brought 12 high potential molecules in several therapeutic areas like antihistaminic, anti‐hypertensive, anti‐thrombotic, anti‐convulsant along with 22 regulatory filings. Global value of Auctus API portfolio is pegged at US$37bn with Valsartan (US$8.7bn, high blood pressure), Clopidogrel (US$5.2bn, anti‐hypertensive) and Pregabalin (US$4.8bn, anti‐epilepsy) accounting for more than half of the portfolio value. API sales accounted for ~32% of standalone revenues in FY14 and we expect steady ~14% annual growth over the next 2‐3 years.
Molecule wise sales %: Others gaining share vis‐à‐vis Paracetamol Key molecules Drug class FY11 FY12 FY13 FY14 H1 FY15
Paracetamol Analgesics 53.0 45.0 48.0 42.0 40.0
Guaifenesin Anti‐cough 4.0 4.0 5.0 6.0 6.0
Ibuprofen Analgesics 23.0 25.0 21.0 22.0 15.0
Metformin Anti‐diabetes 10.0 17.0 22.0 24.0 26.0
Others* ‐ 11.0 9.0 5.0 6.0 14.0 Source: Company, India Infoline Research *Naproxen, Methocarbamol, Ciprofloxacin
Granules India enjoys sizable market shares in Paracetamol and Ibuprofen molecules and given the lack of alternative in analgesics, it would retain its competitive advantage in such API supplies Granules scale of operations and long term relationships with customers has led to double digit growth for most APIs even as globally these register at best high single digit growth with a few exceptions
Auctus acquisition brings 12 high potential molecules in several therapeutic areas
Granules India
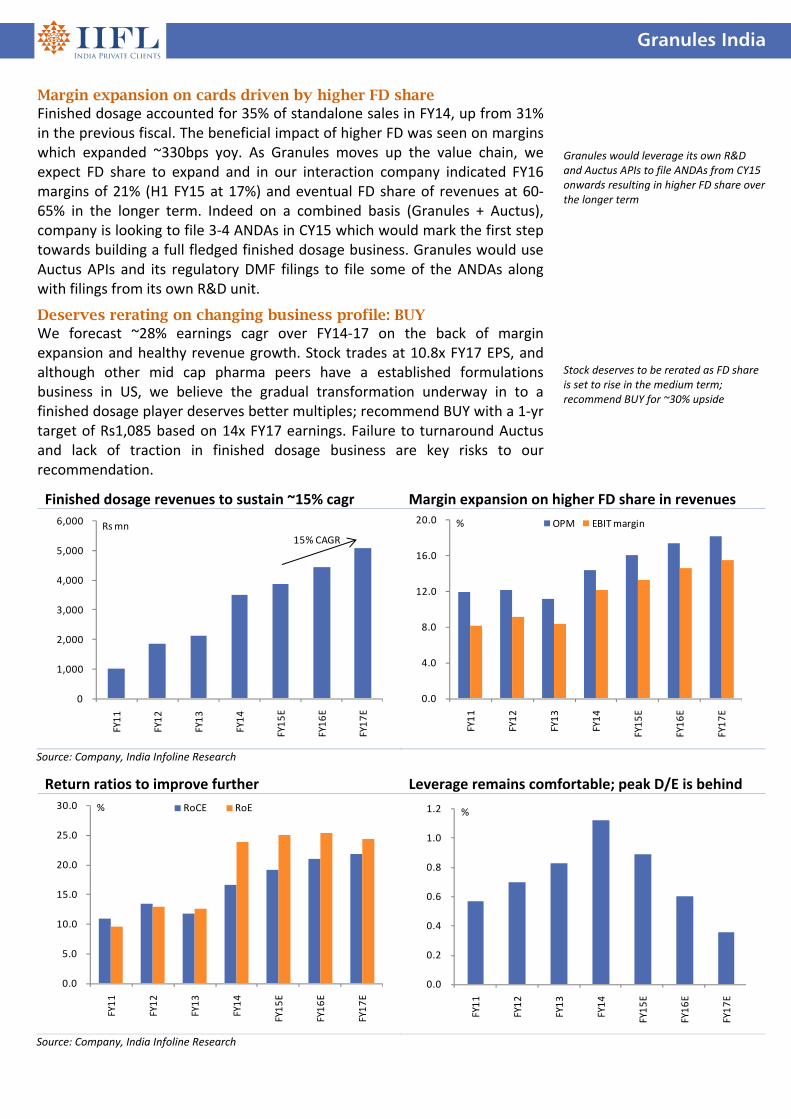
Return ratios to improve further Leverage remains comfortable; peak D/E is behind
0.0
5.0
10.0
15.0
20.0
25.0
30.0
FY11
FY12
FY13
FY14
FY15E
FY16E
FY17E
RoCE RoE%
0.0
0.2
0.4
0.6
0.8
1.0
1.2
FY11
FY12
FY13
FY14
FY15E
FY16E
FY17E
%
Source: Company, India Infoline Research
Finished dosage revenues to sustain ~15% cagr Margin expansion on higher FD share in revenues
0
1,000
2,000
3,000
4,000
5,000
6,000
FY11
FY12
FY13
FY14
FY15E
FY16E
FY17E
Rsmn
15% CAGR
0.0
4.0
8.0
12.0
16.0
20.0
FY11
FY12
FY13
FY14
FY15E
FY16E
FY17E
OPM EBIT margin%
Source: Company, India Infoline Research
Margin expansion on cards driven by higher FD share Finished dosage accounted for 35% of standalone sales in FY14, up from 31% in the previous fiscal. The beneficial impact of higher FD was seen on margins which expanded ~330bps yoy. As Granules moves up the value chain, we expect FD share to expand and in our interaction company indicated FY16 margins of 21% (H1 FY15 at 17%) and eventual FD share of revenues at 60‐65% in the longer term. Indeed on a combined basis (Granules + Auctus), company is looking to file 3‐4 ANDAs in CY15 which would mark the first step towards building a full fledged finished dosage business. Granules would use Auctus APIs and its regulatory DMF filings to file some of the ANDAs along with filings from its own R&D unit.
Deserves rerating on changing business profile: BUY We forecast ~28% earnings cagr over FY14‐17 on the back of margin expansion and healthy revenue growth. Stock trades at 10.8x FY17 EPS, and although other mid cap pharma peers have a established formulations business in US, we believe the gradual transformation underway in to a finished dosage player deserves better multiples; recommend BUY with a 1‐yr target of Rs1,085 based on 14x FY17 earnings. Failure to turnaround Auctus and lack of traction in finished dosage business are key risks to our recommendation.
Granules would leverage its own R&D and Auctus APIs to file ANDAs from CY15 onwards resulting in higher FD share over the longer term
Stock deserves to be rerated as FD share is set to rise in the medium term; recommend BUY for ~30% upside
Granules India
Financials
Income statement Y/e 31 Mar (Rs m) FY14 FY15E FY16E FY17E
Revenue 10,959 12,817 14,481 16,376
Op.profit 1,583 2,064 2,520 2,981
Depreciation (298) (406) (452) (497)
Interest expense (204) (199) (199) (199)
Other income 43 45 48 50
PBT 1,124 1,504 1,917 2,334
Taxes (371) (496) (632) (770)
Net profit 752 1,008 1,284 1,564
Balance sheet
Y/e 31 Mar (Rs m) FY14 FY15E FY16E FY17E
Equity capital 203 203 203 203
Reserves 3,357 4,281 5,482 6,963
Net worth 3,560 4,484 5,685 7,166
Debt 4,417 4,417 4,417 4,417
Def.tax lia 303 303 303 303
Total liabilities 8,280 9,204 10,406 11,886
Fixed assets 6,070 6,558 6,906 7,209
Investments 37 37 37 37
Net working cap 2,172 2,609 3,462 4,640
Inventories 1,742 2,037 2,301 2,603
Sundry debtors 1,109 1,297 1,466 1,657
Cash 417 428 997 1,853
Other curr assets 544 769 869 983
Sundry creditors (1,355) (1,585) (1,791) (2,026)
Other current lia (285) (337) (380) (430)
Total assets 8,280 9,204 10,406 11,886
Cash flow statement
Y/e 31 Mar (Rs m) FY14 FY15E FY16E FY17E
Profit before tax 1,124 1,504 1,917 2,334
Depreciation 298 406 452 497
Def.tax lia 58 ‐ ‐ ‐
Tax paid (371) (496) (632) (770)
Working capital ∆ (247) (427) (283) (323)
Other op.items ‐ ‐ ‐ ‐
Operating CF 861 987 1,453 1,739
Capital exp (2,646) (894) (800) (800)
Free cash flow (1,784) 93 653 939
Equity raised 142 ‐ ‐ ‐
Investments 14 ‐ ‐ ‐
Debt financing/disp 1,713 ‐ ‐ ‐
Dividends (83) (83) (83) (83)
Net ∆ in cash 0 10 570 856
Key ratios Y/e 31 Mar FY14 FY15E FY16E FY17E
Growth matrix (%)
Revenue growth 43.4 17.0 13.0 13.1
Op profit growth 86.2 30.4 22.1 18.3
EBIT growth 107.5 28.2 24.2 19.7
Net profit growth 131.0 33.9 27.4 21.8
Profitability ratios (%)
OPM 14.4 16.1 17.4 18.2
EBIT margin 12.1 13.3 14.6 15.5
Net profit margin 6.9 7.9 8.9 9.5
RoCE 19.0 19.5 21.6 22.7
RoNW 23.9 25.1 25.3 24.3
RoA 9.0 9.6 10.8 11.6
Per share ratios
EPS 37.1 49.7 63.3 77.1
Dividend per share 3.5 3.5 3.5 3.5
Cash EPS 51.8 69.7 85.6 101.6
Book value per share 175.5 221.1 280.3 353.3
Valuation ratios (x)
P/E 22.3 16.6 13.1 10.7
P/BV 4.7 3.7 3.0 2.3
M Cap/Sales 1.5 1.3 1.2 1.0
EV/EBIDTA 13.1 10.1 8.0 6.5
Payout (%)
Tax payout 33.0 33.0 33.0 33.0
Dividend payout 9.4 8.2 6.5 5.3
Liquidity ratios
Debtor days 37 37 37 37
Inventory days 58 58 58 58
Creditor days 45 45 45 45
Leverage ratios
Interest coverage 6.5 8.6 10.6 12.7
Net debt / equity 1.1 0.9 0.6 0.4
Net debt / op. profit 2.5 1.9 1.4 0.9
Du‐Pont Analysis Y/e 31 Mar (Rs m) FY14 FY15E FY16E FY17E
Tax burden (x) 0.67 0.67 0.67 0.67
Interest burden (x) 0.85 0.88 0.91 0.92
EBIT margin (x) 0.12 0.13 0.15 0.15
Asset turnover (x) 1.31 1.22 1.22 1.22
Financial leverage (x) 2.65 2.62 2.33 2.09
RoE (%) 23.9 25.1 25.3 24.3
Sector: Infrastructure
Sector view: Neutral
Sensex: 27,508
52 Week h/l (Rs): 349 / 117
Market cap (Rscr) : 820
6m Avg vol (‘000Nos): 66
Bloomberg code: INHP IN
BSE code: 504741
NSE code: INDIANHUME
FV (Rs): 2
Price as on January 01, 2015
Company rating grid
Low High
1 2 3 4 5
Earnings Growth
Cash Flow
B/S Strength
Valuation appeal
Risk
Share price trend
0
100
200
300
Dec‐13 Jun‐14 Dec‐14
INDIANHUME Sensex
Share holding pattern % Mar‐14 Jun‐14 Sep‐14
Promoters 69.9 69.9 69.9
Insti 3.4 3.0 2.8
Others 26.7 27.1 27.2
Rating: BUYTarget (1‐Year): Rs440
CMP: Rs338
Upside: 30.2%
Research Analyst: Tarang Bhanushali
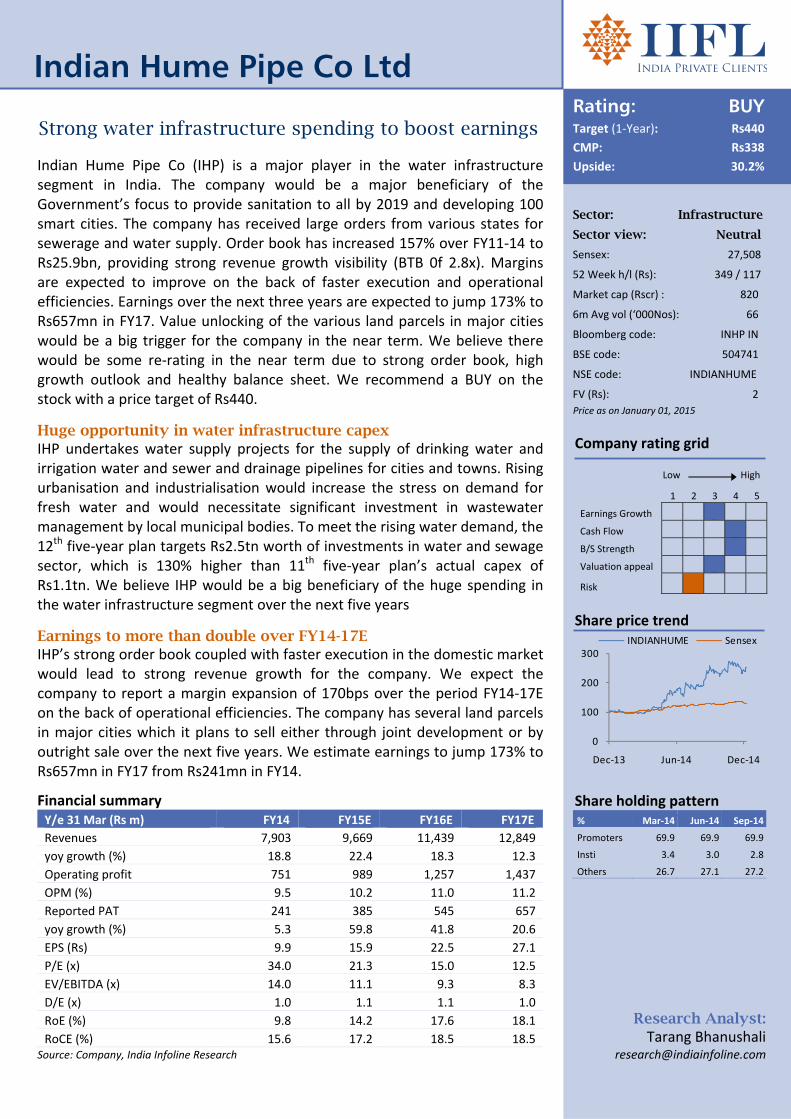
Strong water infrastructure spending to boost earnings Indian Hume Pipe Co (IHP) is a major player in the water infrastructure segment in India. The company would be a major beneficiary of the Government’s focus to provide sanitation to all by 2019 and developing 100 smart cities. The company has received large orders from various states for sewerage and water supply. Order book has increased 157% over FY11‐14 to Rs25.9bn, providing strong revenue growth visibility (BTB 0f 2.8x). Margins are expected to improve on the back of faster execution and operational efficiencies. Earnings over the next three years are expected to jump 173% to Rs657mn in FY17. Value unlocking of the various land parcels in major cities would be a big trigger for the company in the near term. We believe there would be some re‐rating in the near term due to strong order book, high growth outlook and healthy balance sheet. We recommend a BUY on the stock with a price target of Rs440.
Huge opportunity in water infrastructure capex IHP undertakes water supply projects for the supply of drinking water and irrigation water and sewer and drainage pipelines for cities and towns. Rising urbanisation and industrialisation would increase the stress on demand for fresh water and would necessitate significant investment in wastewater management by local municipal bodies. To meet the rising water demand, the 12th five‐year plan targets Rs2.5tn worth of investments in water and sewage sector, which is 130% higher than 11th five‐year plan’s actual capex of Rs1.1tn. We believe IHP would be a big beneficiary of the huge spending in the water infrastructure segment over the next five years
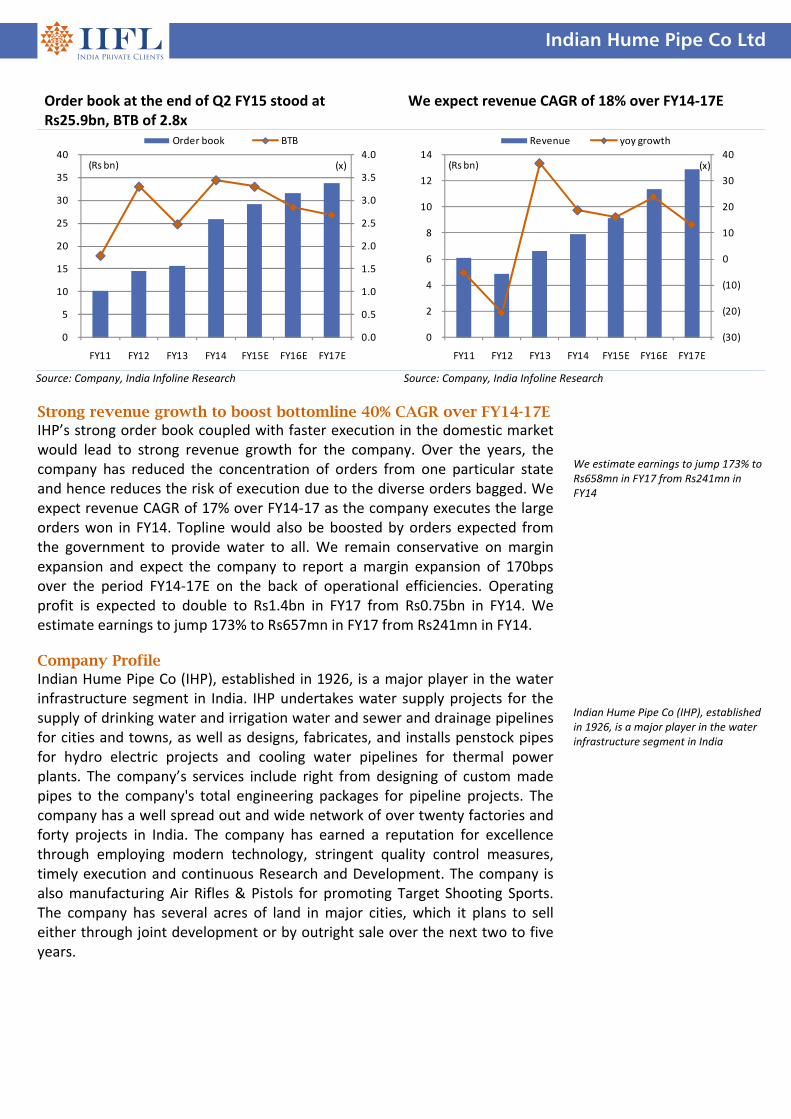
Earnings to more than double over FY14-17E IHP’s strong order book coupled with faster execution in the domestic market would lead to strong revenue growth for the company. We expect the company to report a margin expansion of 170bps over the period FY14‐17E on the back of operational efficiencies. The company has several land parcels in major cities which it plans to sell either through joint development or by outright sale over the next five years. We estimate earnings to jump 173% to Rs657mn in FY17 from Rs241mn in FY14.
Financial summary Y/e 31 Mar (Rs m) FY14 FY15E FY16E FY17E
Revenues 7,903 9,669 11,439 12,849
yoy growth (%) 18.8 22.4 18.3 12.3
Operating profit 751 989 1,257 1,437
OPM (%) 9.5 10.2 11.0 11.2
Reported PAT 241 385 545 657
yoy growth (%) 5.3 59.8 41.8 20.6
EPS (Rs) 9.9 15.9 22.5 27.1
P/E (x) 34.0 21.3 15.0 12.5
EV/EBITDA (x) 14.0 11.1 9.3 8.3
D/E (x) 1.0 1.1 1.1 1.0
RoE (%) 9.8 14.2 17.6 18.1
RoCE (%) 15.6 17.2 18.5 18.5 Source: Company, India Infoline Research
Indian Hume Pipe Co Ltd
Indian Hume Pipe Co Ltd
Water infrastructure spending to surge India faces an impending water crisis as it moves on into the 21st century. India has 16% of world’s population with just 4% of world’s fresh water resources. The demands of a rapidly industrializing economy and urbanizing society come at a time when the potential for augmenting supply is limited, water tables are falling and water quality issues are increasingly coming to the fore. It is estimated that by 2020, India will become a water‐scarce nation. The country thus faces a looming water crisis where demand is set to outstrip supply by 50% by 2030 according to Water Resources Group. Climate change is set to compound the issue. Climate change and its resulting impacts such as changes in rainfall patterns increase in frequency and severity of extreme weather events along with droughts and floods will make water security and distribution even more difficult and costly to achieve. While a trend of increasing urbanisation and industrialisation would increase the stress on demand for fresh water, it would also necessitate significant investment in wastewater management by local municipal bodies. The Central Government has already shown its intent to improve the water infrastructure in the country. Through the National Rural Water Drinking program, government aims to provide clean drinking water to rural households across India. It has also setup a ministry for the Clean Ganga river project. To meet the rising water demand, the 12th Five‐year Plan targets Rs2.5tn worth of investments in water and sewage sector, which is 130% higher than last five‐year plan’s actual capex of Rs1.1tn. According to a recent report by the High Powered Expert Committee (HPEC), the next 20 years capex expenditure on water supply alone is estimated at ~Rs3.2tn translating into an opportunity of ~Rs160bn per annum. Besides that, operation and maintenance expenditure on water supply is pegged at ~Rs5.46tn (~Rs270bn per annum). We believe IHP would be a big beneficiary of the huge spending in the water infrastructure segment over the next five years. Orderbook at Rs25.9bn; a BTB of 2.8x IHP undertakes water supply projects for the supply of drinking water and irrigation water and sewer and drainage pipelines for cities and towns, as well as designs, fabricates, and installs penstock pipes for hydro electric projects and cooling water pipelines for thermal power plants. With an increase in focus to augment the water resources over the last three years, the company’s order book has more than doubled over the period FY11‐14. We believe, going ahead, order inflow for the company would remain strong as the Government starts to implement its plan to cover every household with total sanitation by year 2019. As per census 2011 data, in India ~46% have sanitation facility within their premises. Covering the remaining 54% households in the next five years will require huge pipeline infrastructure, leading to a robust demand opportunity for plastic and cement pipes. We feel that IHP would be a major beneficiary of the orders in cement pipes space. Order book at Q2 FY15 stood at Rs25.9bn, a BTB of 2.8x, providing strong revenue growth visibility over the next two years. We expect order inflow to remain strong over the next two years on the back of strong ordering in the water infrastructure space.
The country thus faces a looming water crisis where demand is set to outstrip supply by 50% by 2030 To meet the rising water demand, the 12th Five‐year Plan targets Rs2.5tn worth of investments in water and sewage sector, which is 130% higher than last five‐year plan’s actual capex of Rs1.1tn.
Order book at Q2 FY15 stood at Rs25.9bn, a BTB of 2.8x, providing strong revenue growth visibility over the next two years.
Indian Hume Pipe Co Ltd
Strong revenue growth to boost bottomline 40% CAGR over FY14-17E IHP’s strong order book coupled with faster execution in the domestic market would lead to strong revenue growth for the company. Over the years, the company has reduced the concentration of orders from one particular state and hence reduces the risk of execution due to the diverse orders bagged. We expect revenue CAGR of 17% over FY14‐17 as the company executes the large orders won in FY14. Topline would also be boosted by orders expected from the government to provide water to all. We remain conservative on margin expansion and expect the company to report a margin expansion of 170bps over the period FY14‐17E on the back of operational efficiencies. Operating profit is expected to double to Rs1.4bn in FY17 from Rs0.75bn in FY14. We estimate earnings to jump 173% to Rs657mn in FY17 from Rs241mn in FY14. Company Profile Indian Hume Pipe Co (IHP), established in 1926, is a major player in the water infrastructure segment in India. IHP undertakes water supply projects for the supply of drinking water and irrigation water and sewer and drainage pipelines for cities and towns, as well as designs, fabricates, and installs penstock pipes for hydro electric projects and cooling water pipelines for thermal power plants. The company’s services include right from designing of custom made pipes to the company's total engineering packages for pipeline projects. The company has a well spread out and wide network of over twenty factories and forty projects in India. The company has earned a reputation for excellence through employing modern technology, stringent quality control measures, timely execution and continuous Research and Development. The company is also manufacturing Air Rifles & Pistols for promoting Target Shooting Sports. The company has several acres of land in major cities, which it plans to sell either through joint development or by outright sale over the next two to five years.
We estimate earnings to jump 173% to Rs658mn in FY17 from Rs241mn in FY14 Indian Hume Pipe Co (IHP), established in 1926, is a major player in the water infrastructure segment in India
Order book at the end of Q2 FY15 stood at Rs25.9bn, BTB of 2.8x
We expect revenue CAGR of 18% over FY14‐17E
0.0
0.5
1.0
1.5
2.0
2.5
3.0
3.5
4.0
0
5
10
15
20
25
30
35
40
FY11 FY12 FY13 FY14 FY15E FY16E FY17E
(x)(Rs bn)
Order book BTB
(30)
(20)
(10)
0
10
20
30
40
0
2
4
6
8
10
12
14
FY11 FY12 FY13 FY14 FY15E FY16E FY17E
(x)(Rs bn)
Revenue yoy growth
Source: Company, India Infoline Research Source: Company, India Infoline Research
Indian Hume Pipe Co Ltd
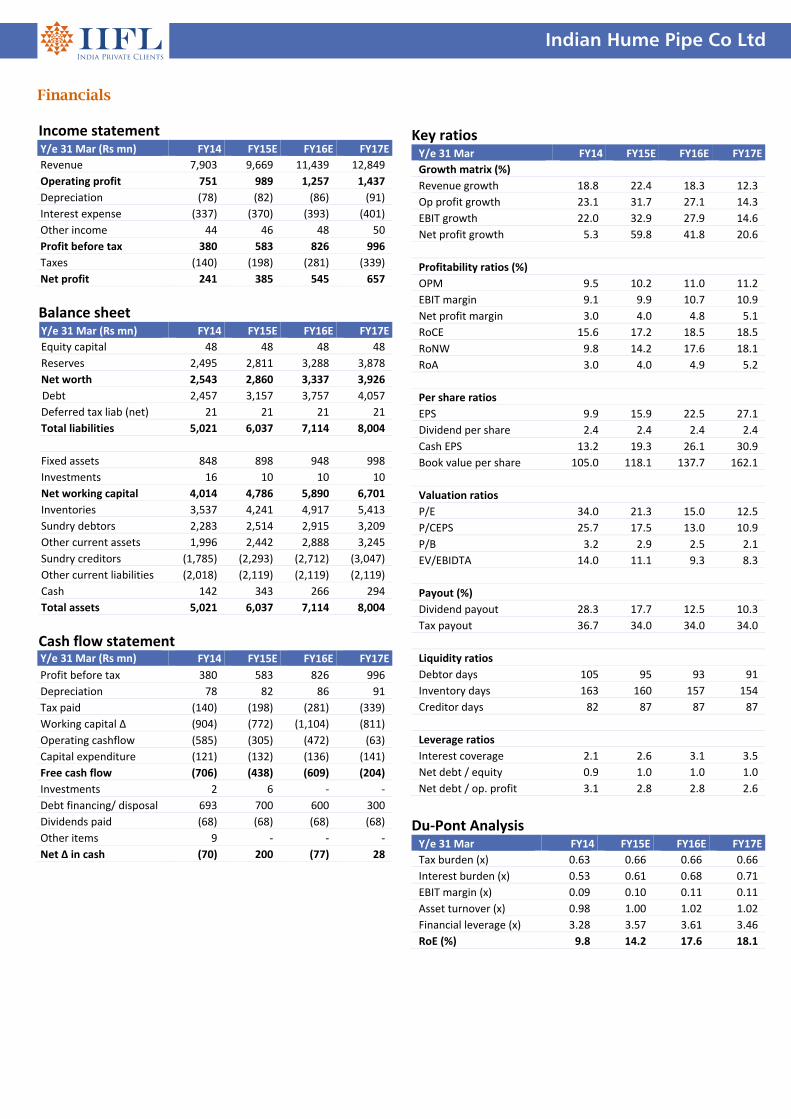
Financials Income statement Y/e 31 Mar (Rs mn) FY14 FY15E FY16E FY17E
Revenue 7,903 9,669 11,439 12,849
Operating profit 751 989 1,257 1,437
Depreciation (78) (82) (86) (91)
Interest expense (337) (370) (393) (401)
Other income 44 46 48 50
Profit before tax 380 583 826 996
Taxes (140) (198) (281) (339)
Net profit 241 385 545 657
Balance sheet Y/e 31 Mar (Rs mn) FY14 FY15E FY16E FY17E
Equity capital 48 48 48 48
Reserves 2,495 2,811 3,288 3,878
Net worth 2,543 2,860 3,337 3,926
Debt 2,457 3,157 3,757 4,057
Deferred tax liab (net) 21 21 21 21
Total liabilities 5,021 6,037 7,114 8,004
Fixed assets 848 898 948 998
Investments 16 10 10 10
Net working capital 4,014 4,786 5,890 6,701
Inventories 3,537 4,241 4,917 5,413
Sundry debtors 2,283 2,514 2,915 3,209
Other current assets 1,996 2,442 2,888 3,245
Sundry creditors (1,785) (2,293) (2,712) (3,047)
Other current liabilities (2,018) (2,119) (2,119) (2,119)
Cash 142 343 266 294
Total assets 5,021 6,037 7,114 8,004
Cash flow statement Y/e 31 Mar (Rs mn) FY14 FY15E FY16E FY17E
Profit before tax 380 583 826 996
Depreciation 78 82 86 91
Tax paid (140) (198) (281) (339)
Working capital ∆ (904) (772) (1,104) (811)
Operating cashflow (585) (305) (472) (63)
Capital expenditure (121) (132) (136) (141)
Free cash flow (706) (438) (609) (204)
Investments 2 6 ‐ ‐
Debt financing/ disposal 693 700 600 300
Dividends paid (68) (68) (68) (68)
Other items 9 ‐ ‐ ‐
Net ∆ in cash (70) 200 (77) 28
Key ratios Y/e 31 Mar FY14 FY15E FY16E FY17E
Growth matrix (%)
Revenue growth 18.8 22.4 18.3 12.3
Op profit growth 23.1 31.7 27.1 14.3
EBIT growth 22.0 32.9 27.9 14.6
Net profit growth 5.3 59.8 41.8 20.6
Profitability ratios (%)
OPM 9.5 10.2 11.0 11.2
EBIT margin 9.1 9.9 10.7 10.9
Net profit margin 3.0 4.0 4.8 5.1
RoCE 15.6 17.2 18.5 18.5
RoNW 9.8 14.2 17.6 18.1
RoA 3.0 4.0 4.9 5.2
Per share ratios
EPS 9.9 15.9 22.5 27.1
Dividend per share 2.4 2.4 2.4 2.4
Cash EPS 13.2 19.3 26.1 30.9
Book value per share 105.0 118.1 137.7 162.1
Valuation ratios
P/E 34.0 21.3 15.0 12.5
P/CEPS 25.7 17.5 13.0 10.9
P/B 3.2 2.9 2.5 2.1
EV/EBIDTA 14.0 11.1 9.3 8.3
Payout (%)
Dividend payout 28.3 17.7 12.5 10.3
Tax payout 36.7 34.0 34.0 34.0
Liquidity ratios
Debtor days 105 95 93 91
Inventory days 163 160 157 154
Creditor days 82 87 87 87
Leverage ratios
Interest coverage 2.1 2.6 3.1 3.5
Net debt / equity 0.9 1.0 1.0 1.0
Net debt / op. profit 3.1 2.8 2.8 2.6
Du‐Pont Analysis Y/e 31 Mar FY14 FY15E FY16E FY17E
Tax burden (x) 0.63 0.66 0.66 0.66
Interest burden (x) 0.53 0.61 0.68 0.71
EBIT margin (x) 0.09 0.10 0.11 0.11
Asset turnover (x) 0.98 1.00 1.02 1.02
Financial leverage (x) 3.28 3.57 3.61 3.46
RoE (%) 9.8 14.2 17.6 18.1
Sector: Auto Ancillary Sector view: Positive
Sensex: 27,508
52 Week h/l (Rs): 580 / 89
Market cap (Rscr) : 666
6m Avg vol (‘000Nos): 147
Bloomberg code: MMFG IN
BSE code: 522241
NSE code: MMFL
FV (Rs): 10
Price as on January 01, 2015
Company rating grid
Low High
1 2 3 4 5
Earnings Growth
Cash Flow
B/S Strength
Valuation appeal
Risk
Share price trend
50
250
450
650
Dec‐13 Jun‐14 Dec‐14
MMFL Sensex
Share holding pattern
Mar‐14 Jun‐14 Sep‐14
Promoters 59.5 58.7 59.3
Institutions 8.3 7.7 7.9
Others 32.2 33.6 32.9
Rating: BUYTarget (1‐Year): Rs710
CMP: Rs546
Upside: 30.0%
Research Analyst:
Prayesh Jain [email protected]
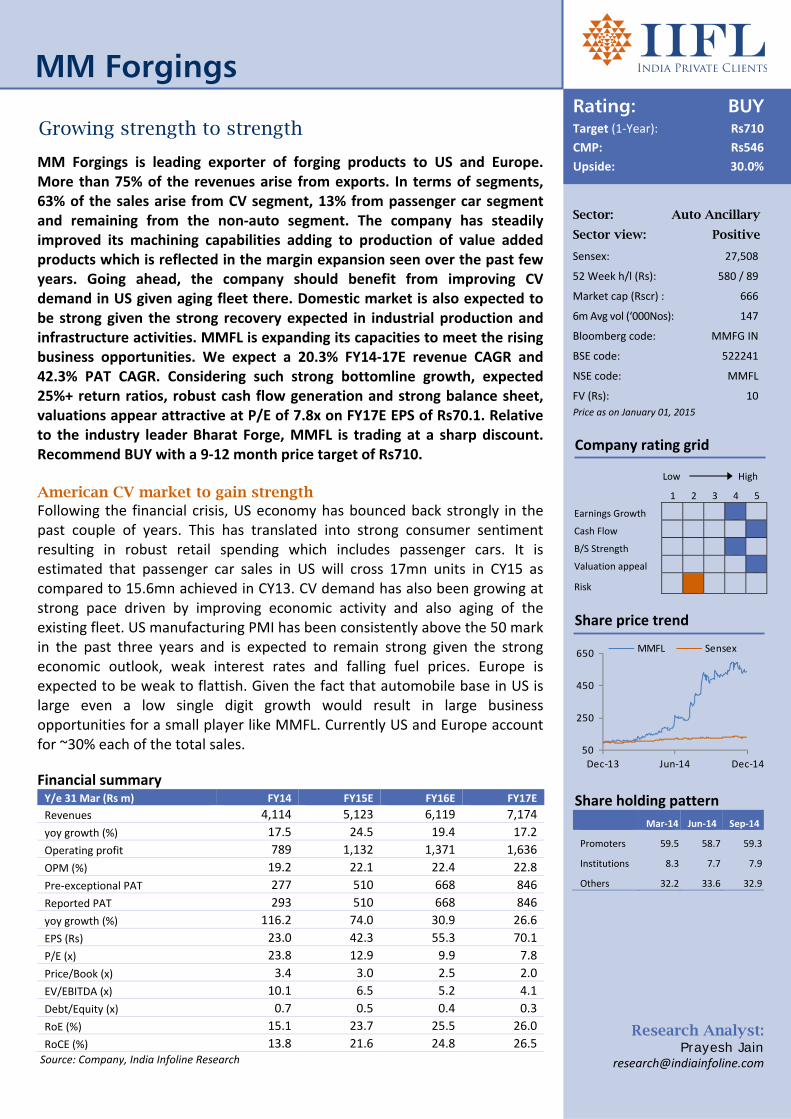
MM Forgings
Growing strength to strength
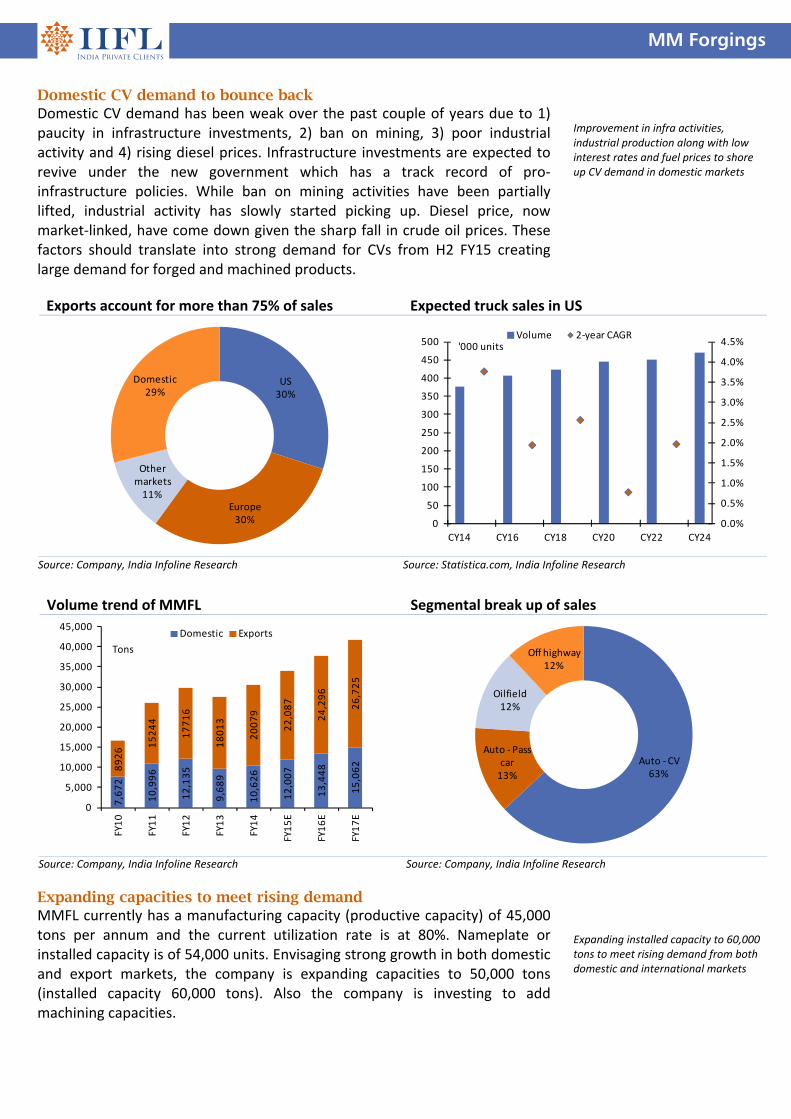
MM Forgings is leading exporter of forging products to US and Europe. More than 75% of the revenues arise from exports. In terms of segments, 63% of the sales arise from CV segment, 13% from passenger car segment and remaining from the non‐auto segment. The company has steadily improved its machining capabilities adding to production of value added products which is reflected in the margin expansion seen over the past few years. Going ahead, the company should benefit from improving CV demand in US given aging fleet there. Domestic market is also expected to be strong given the strong recovery expected in industrial production and infrastructure activities. MMFL is expanding its capacities to meet the rising business opportunities. We expect a 20.3% FY14‐17E revenue CAGR and 42.3% PAT CAGR. Considering such strong bottomline growth, expected 25%+ return ratios, robust cash flow generation and strong balance sheet, valuations appear attractive at P/E of 7.8x on FY17E EPS of Rs70.1. Relative to the industry leader Bharat Forge, MMFL is trading at a sharp discount. Recommend BUY with a 9‐12 month price target of Rs710. American CV market to gain strength Following the financial crisis, US economy has bounced back strongly in the past couple of years. This has translated into strong consumer sentiment resulting in robust retail spending which includes passenger cars. It is estimated that passenger car sales in US will cross 17mn units in CY15 as compared to 15.6mn achieved in CY13. CV demand has also been growing at strong pace driven by improving economic activity and also aging of the existing fleet. US manufacturing PMI has been consistently above the 50 mark in the past three years and is expected to remain strong given the strong economic outlook, weak interest rates and falling fuel prices. Europe is expected to be weak to flattish. Given the fact that automobile base in US is large even a low single digit growth would result in large business opportunities for a small player like MMFL. Currently US and Europe account for ~30% each of the total sales. Financial summary Y/e 31 Mar (Rs m) FY14 FY15E FY16E FY17E
Revenues 4,114 5,123 6,119 7,174
yoy growth (%) 17.5 24.5 19.4 17.2
Operating profit 789 1,132 1,371 1,636
OPM (%) 19.2 22.1 22.4 22.8
Pre‐exceptional PAT 277 510 668 846
Reported PAT 293 510 668 846
yoy growth (%) 116.2 74.0 30.9 26.6
EPS (Rs) 23.0 42.3 55.3 70.1
P/E (x) 23.8 12.9 9.9 7.8
Price/Book (x) 3.4 3.0 2.5 2.0
EV/EBITDA (x) 10.1 6.5 5.2 4.1
Debt/Equity (x) 0.7 0.5 0.4 0.3
RoE (%) 15.1 23.7 25.5 26.0
RoCE (%) 13.8 21.6 24.8 26.5 Source: Company, India Infoline Research
MM Forgings
Domestic CV demand to bounce back Domestic CV demand has been weak over the past couple of years due to 1) paucity in infrastructure investments, 2) ban on mining, 3) poor industrial activity and 4) rising diesel prices. Infrastructure investments are expected to revive under the new government which has a track record of pro‐infrastructure policies. While ban on mining activities have been partially lifted, industrial activity has slowly started picking up. Diesel price, now market‐linked, have come down given the sharp fall in crude oil prices. These factors should translate into strong demand for CVs from H2 FY15 creating large demand for forged and machined products.
Expanding capacities to meet rising demand MMFL currently has a manufacturing capacity (productive capacity) of 45,000 tons per annum and the current utilization rate is at 80%. Nameplate or installed capacity is of 54,000 units. Envisaging strong growth in both domestic and export markets, the company is expanding capacities to 50,000 tons (installed capacity 60,000 tons). Also the company is investing to add machining capacities.
Improvement in infra activities, industrial production along with low interest rates and fuel prices to shore up CV demand in domestic markets
Expanding installed capacity to 60,000 tons to meet rising demand from both domestic and international markets
Exports account for more than 75% of sales Expected truck sales in US
US30%
Europe30%
Other markets11%
Domestic29%
0.0%
0.5%
1.0%
1.5%
2.0%
2.5%
3.0%
3.5%
4.0%
4.5%
0
50
100
150
200
250
300
350
400
450
500
CY14 CY16 CY18 CY20 CY22 CY24
Volume 2‐year CAGR'000 units
Source: Company, India Infoline Research Source: Statistica.com, India Infoline Research
Volume trend of MMFL Segmental break up of sales
7,672
10,996
12,135
9,689
10,626
12,007
13,448
15,062
8926 1
5244
17716
18013
20079
22,087
24,296
26,725
0
5,000
10,000
15,000
20,000
25,000
30,000
35,000
40,000
45,000
FY10
FY11
FY12
FY13
FY14
FY15E
FY16E
FY17E
Domestic Exports
Tons
Auto ‐CV63%
Auto ‐Pass car13%
Oilfield12%
Off highway12%
Source: Company, India Infoline Research Source: Company, India Infoline Research
MM Forgings
Operating leverage and value addition to drive margins 1) Operating leverage: Current capacity utilization levels for MMFL is at 80%
of the productive capacity leaving substantial scope for operating leverage. To add to this, the company through its efforts has brought down costs related to power through setting up captive wind‐farms.
2) Value addition: Over the years the company has increased value addition by adding machining capacity utilization of which stood at 15% at the end of FY14 which is expected to go up to 25% in the next three years. Margins on machining are relatively higher.
The aforementioned factors could result in substantial improvement in margins for MMFL from the current levels. However, the company has been conservative in terms of guidance of 22‐23% OPM.
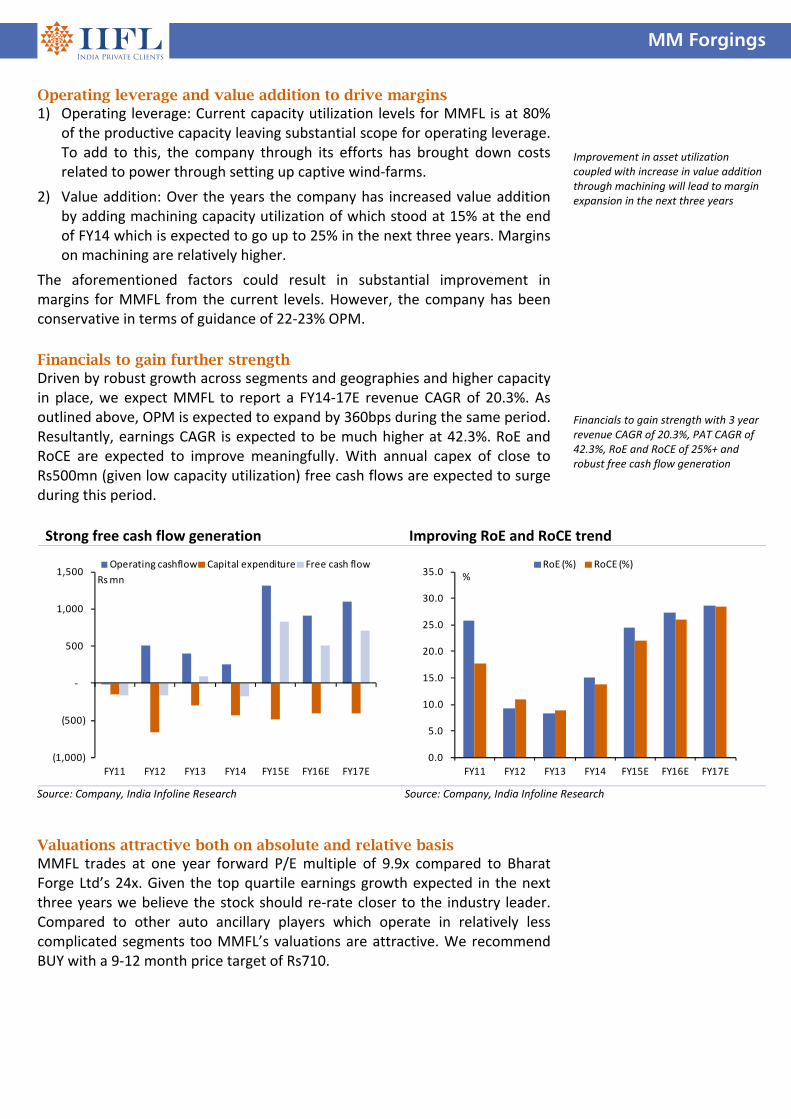
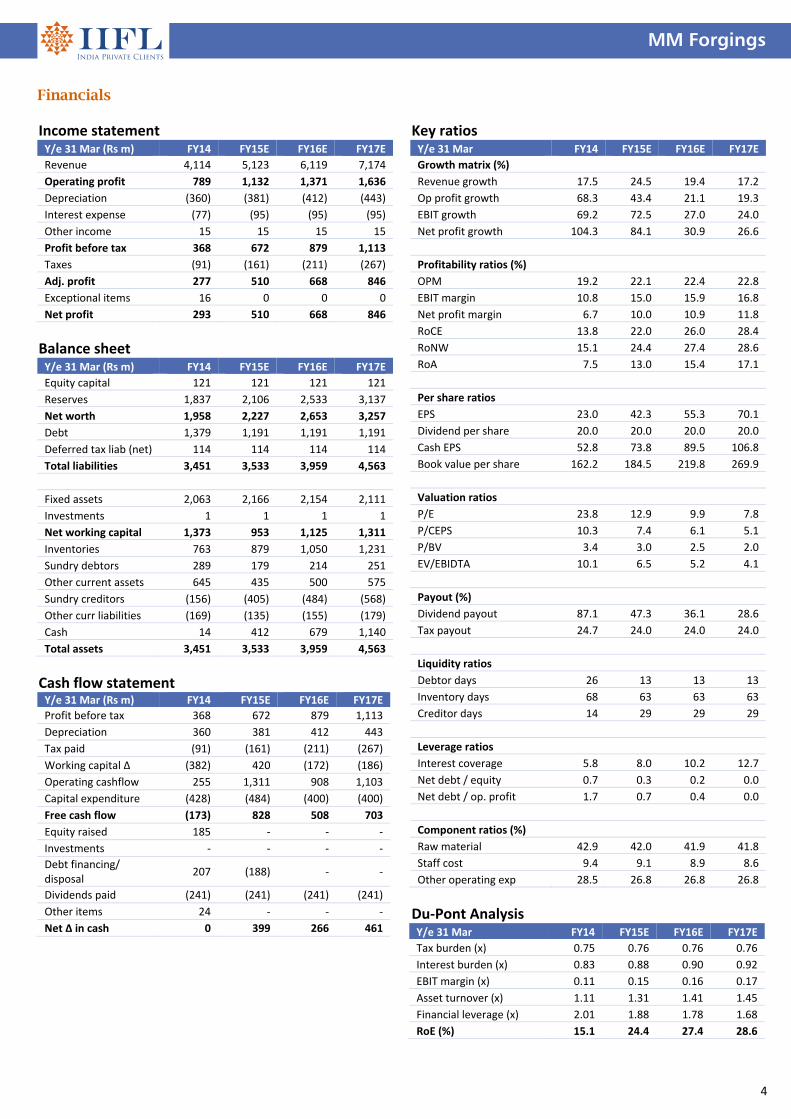
Financials to gain further strength Driven by robust growth across segments and geographies and higher capacity in place, we expect MMFL to report a FY14‐17E revenue CAGR of 20.3%. As outlined above, OPM is expected to expand by 360bps during the same period. Resultantly, earnings CAGR is expected to be much higher at 42.3%. RoE and RoCE are expected to improve meaningfully. With annual capex of close to Rs500mn (given low capacity utilization) free cash flows are expected to surge during this period.
Valuations attractive both on absolute and relative basis MMFL trades at one year forward P/E multiple of 9.9x compared to Bharat Forge Ltd’s 24x. Given the top quartile earnings growth expected in the next three years we believe the stock should re‐rate closer to the industry leader. Compared to other auto ancillary players which operate in relatively less complicated segments too MMFL’s valuations are attractive. We recommend BUY with a 9‐12 month price target of Rs710.
Improvement in asset utilization coupled with increase in value addition through machining will lead to margin expansion in the next three years Financials to gain strength with 3 year revenue CAGR of 20.3%, PAT CAGR of 42.3%, RoE and RoCE of 25%+ and robust free cash flow generation
Strong free cash flow generation Improving RoE and RoCE trend
(1,000)
(500)
‐
500
1,000
1,500
FY11 FY12 FY13 FY14 FY15E FY16E FY17E
Operating cashflow Capital expenditure Free cash flow
Rs mn
0.0
5.0
10.0
15.0
20.0
25.0
30.0
35.0
FY11 FY12 FY13 FY14 FY15E FY16E FY17E
RoE (%) RoCE (%)%
Source: Company, India Infoline Research Source: Company, India Infoline Research
4
MM Forgings
Financials Income statement Y/e 31 Mar (Rs m) FY14 FY15E FY16E FY17E
Revenue 4,114 5,123 6,119 7,174
Operating profit 789 1,132 1,371 1,636
Depreciation (360) (381) (412) (443)
Interest expense (77) (95) (95) (95)
Other income 15 15 15 15
Profit before tax 368 672 879 1,113
Taxes (91) (161) (211) (267)
Adj. profit 277 510 668 846
Exceptional items 16 0 0 0
Net profit 293 510 668 846
Balance sheet Y/e 31 Mar (Rs m) FY14 FY15E FY16E FY17E
Equity capital 121 121 121 121
Reserves 1,837 2,106 2,533 3,137
Net worth 1,958 2,227 2,653 3,257
Debt 1,379 1,191 1,191 1,191
Deferred tax liab (net) 114 114 114 114
Total liabilities 3,451 3,533 3,959 4,563
Fixed assets 2,063 2,166 2,154 2,111
Investments 1 1 1 1
Net working capital 1,373 953 1,125 1,311
Inventories 763 879 1,050 1,231
Sundry debtors 289 179 214 251
Other current assets 645 435 500 575
Sundry creditors (156) (405) (484) (568)
Other curr liabilities (169) (135) (155) (179)
Cash 14 412 679 1,140
Total assets 3,451 3,533 3,959 4,563
Cash flow statement Y/e 31 Mar (Rs m) FY14 FY15E FY16E FY17E
Profit before tax 368 672 879 1,113
Depreciation 360 381 412 443
Tax paid (91) (161) (211) (267)
Working capital ∆ (382) 420 (172) (186)
Operating cashflow 255 1,311 908 1,103
Capital expenditure (428) (484) (400) (400)
Free cash flow (173) 828 508 703
Equity raised 185 ‐ ‐ ‐
Investments ‐ ‐ ‐ ‐
Debt financing/ disposal
207 (188) ‐ ‐
Dividends paid (241) (241) (241) (241)
Other items 24 ‐ ‐ ‐
Net ∆ in cash 0 399 266 461
Key ratios Y/e 31 Mar FY14 FY15E FY16E FY17E
Growth matrix (%)
Revenue growth 17.5 24.5 19.4 17.2
Op profit growth 68.3 43.4 21.1 19.3
EBIT growth 69.2 72.5 27.0 24.0
Net profit growth 104.3 84.1 30.9 26.6
Profitability ratios (%)
OPM 19.2 22.1 22.4 22.8
EBIT margin 10.8 15.0 15.9 16.8
Net profit margin 6.7 10.0 10.9 11.8
RoCE 13.8 22.0 26.0 28.4
RoNW 15.1 24.4 27.4 28.6
RoA 7.5 13.0 15.4 17.1
Per share ratios
EPS 23.0 42.3 55.3 70.1
Dividend per share 20.0 20.0 20.0 20.0
Cash EPS 52.8 73.8 89.5 106.8
Book value per share 162.2 184.5 219.8 269.9
Valuation ratios
P/E 23.8 12.9 9.9 7.8
P/CEPS 10.3 7.4 6.1 5.1
P/BV 3.4 3.0 2.5 2.0
EV/EBIDTA 10.1 6.5 5.2 4.1
Payout (%)
Dividend payout 87.1 47.3 36.1 28.6
Tax payout 24.7 24.0 24.0 24.0
Liquidity ratios
Debtor days 26 13 13 13
Inventory days 68 63 63 63
Creditor days 14 29 29 29
Leverage ratios
Interest coverage 5.8 8.0 10.2 12.7
Net debt / equity 0.7 0.3 0.2 0.0
Net debt / op. profit 1.7 0.7 0.4 0.0
Component ratios (%)
Raw material 42.9 42.0 41.9 41.8
Staff cost 9.4 9.1 8.9 8.6
Other operating exp 28.5 26.8 26.8 26.8
Du‐Pont Analysis Y/e 31 Mar FY14 FY15E FY16E FY17E
Tax burden (x) 0.75 0.76 0.76 0.76
Interest burden (x) 0.83 0.88 0.90 0.92
EBIT margin (x) 0.11 0.15 0.16 0.17
Asset turnover (x) 1.11 1.31 1.41 1.45
Financial leverage (x) 2.01 1.88 1.78 1.68
RoE (%) 15.1 24.4 27.4 28.6
Sector: Consumer
Discretionary Sector view: Positive
Sensex: 27,508
52 Week h/l (Rs): 2,149 / 365
Market cap (Rscr) : 6,715
6m Avg vol (‘000Nos): 23
Bloomberg code: SYML IN
BSE code: 517385
NSE code: SYMPHONY
FV (Rs): 2
Price as on January 01, 2015
Share price trend
0
200
400
600
Dec‐13 Mar‐14 Jul‐14 Oct‐14
Symphony Sensex
Share holding pattern % Mar‐14 Jun‐14 Sep‐14
Promoters 75.0 75.0 75.0
Insti 5.8 5.7 6.5
Others 19.2 19.3 18.5
Rating: BUYTarget (1‐Year): Rs2,489
CMP: Rs1,913
Upside: 30%
Research Analyst: Pratik Tholiya
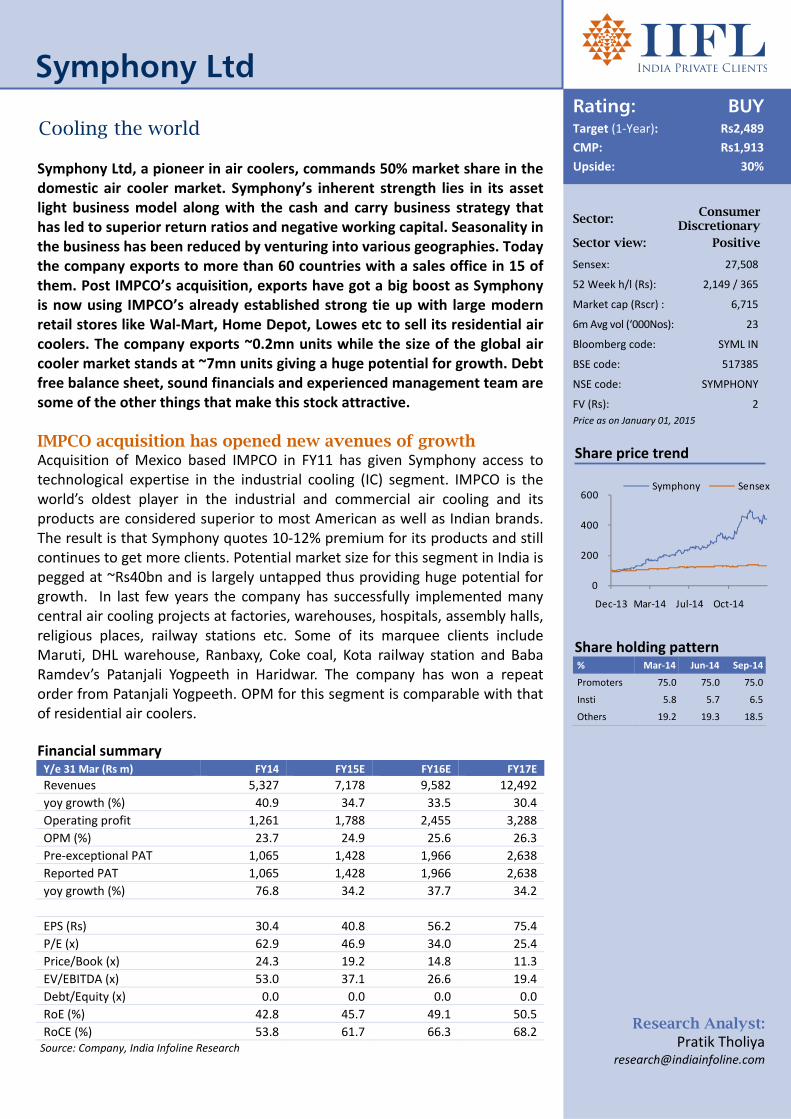
Symphony Ltd
Cooling the world Symphony Ltd, a pioneer in air coolers, commands 50% market share in the domestic air cooler market. Symphony’s inherent strength lies in its asset light business model along with the cash and carry business strategy that has led to superior return ratios and negative working capital. Seasonality in the business has been reduced by venturing into various geographies. Today the company exports to more than 60 countries with a sales office in 15 of them. Post IMPCO’s acquisition, exports have got a big boost as Symphony is now using IMPCO’s already established strong tie up with large modern retail stores like Wal‐Mart, Home Depot, Lowes etc to sell its residential air coolers. The company exports ~0.2mn units while the size of the global air cooler market stands at ~7mn units giving a huge potential for growth. Debt free balance sheet, sound financials and experienced management team are some of the other things that make this stock attractive. IMPCO acquisition has opened new avenues of growth Acquisition of Mexico based IMPCO in FY11 has given Symphony access to technological expertise in the industrial cooling (IC) segment. IMPCO is the world’s oldest player in the industrial and commercial air cooling and its products are considered superior to most American as well as Indian brands. The result is that Symphony quotes 10‐12% premium for its products and still continues to get more clients. Potential market size for this segment in India is pegged at ~Rs40bn and is largely untapped thus providing huge potential for growth. In last few years the company has successfully implemented many central air cooling projects at factories, warehouses, hospitals, assembly halls, religious places, railway stations etc. Some of its marquee clients include Maruti, DHL warehouse, Ranbaxy, Coke coal, Kota railway station and Baba Ramdev’s Patanjali Yogpeeth in Haridwar. The company has won a repeat order from Patanjali Yogpeeth. OPM for this segment is comparable with that of residential air coolers. Financial summary Y/e 31 Mar (Rs m) FY14 FY15E FY16E FY17E
Revenues 5,327 7,178 9,582 12,492
yoy growth (%) 40.9 34.7 33.5 30.4
Operating profit 1,261 1,788 2,455 3,288
OPM (%) 23.7 24.9 25.6 26.3
Pre‐exceptional PAT 1,065 1,428 1,966 2,638
Reported PAT 1,065 1,428 1,966 2,638
yoy growth (%) 76.8 34.2 37.7 34.2
EPS (Rs) 30.4 40.8 56.2 75.4
P/E (x) 62.9 46.9 34.0 25.4
Price/Book (x) 24.3 19.2 14.8 11.3
EV/EBITDA (x) 53.0 37.1 26.6 19.4
Debt/Equity (x) 0.0 0.0 0.0 0.0
RoE (%) 42.8 45.7 49.1 50.5
RoCE (%) 53.8 61.7 66.3 68.2 Source: Company, India Infoline Research
Symphony Ltd
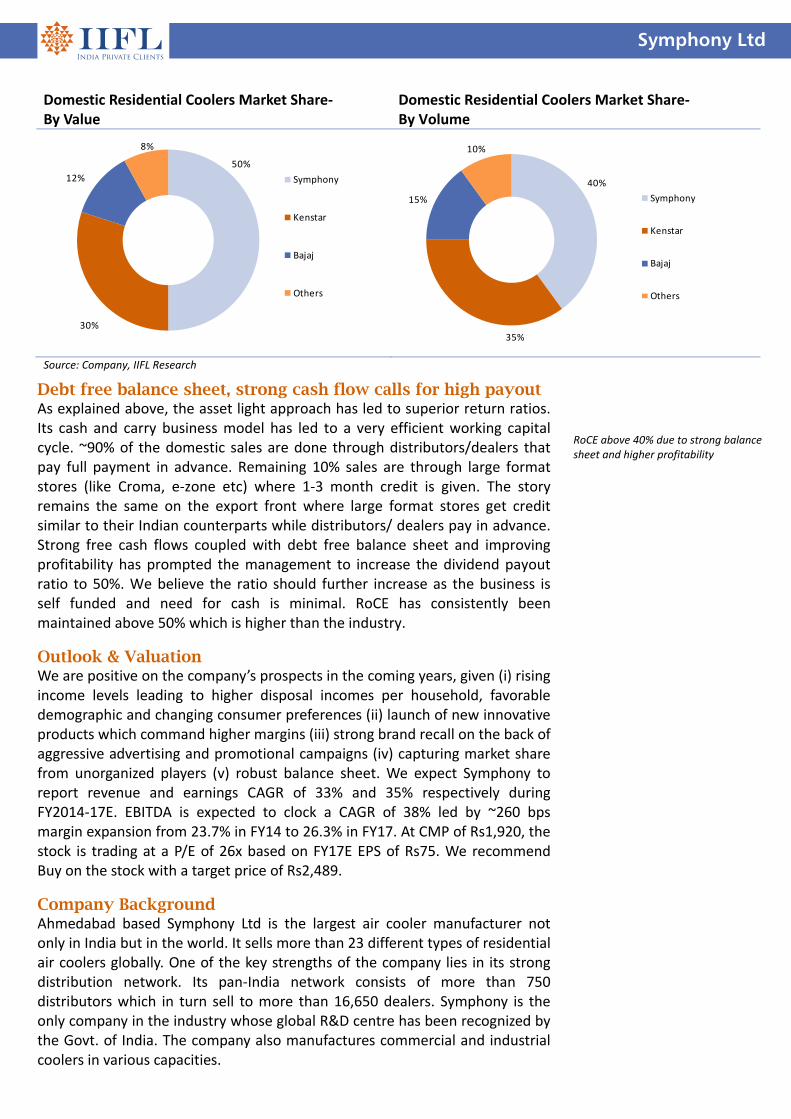
Domestic demand robust; shift to organized sector key trigger The domestic market for residential air coolers is at ~6.2mn units of which 80% is controlled by unorganized sector. The penetration of air coolers is currently very low at ~9%. Households owning only fans are ~58%. These households are the target audience for Symphony. With increasing purchasing power and changing lifestyle preferences, the shift from fans to air coolers is expected to happen at a much faster pace in the coming years. Besides, cost of owning, operating and maintaining air coolers is far less than that of air conditioners. Consumer’s preference for superior quality, high performance, aesthetical appeal and prompt after sales service will drive them towards the organized sector. During FY08‐14, the industry grew at ~15%. The organized market managed to grow at a faster pace of 25% led by Symphony which recorded a growth of ~39%. In the coming 2‐3 years we expect the company to register 35% growth. This high growth can also be attributed to higher advertising and promotional spends. Symphony’s advertising budget is highest in the industry (~4.5% of sales) which has helped it to remain on the top of the mind of the customers. Over the years “Symphony” has become synonymous with air coolers
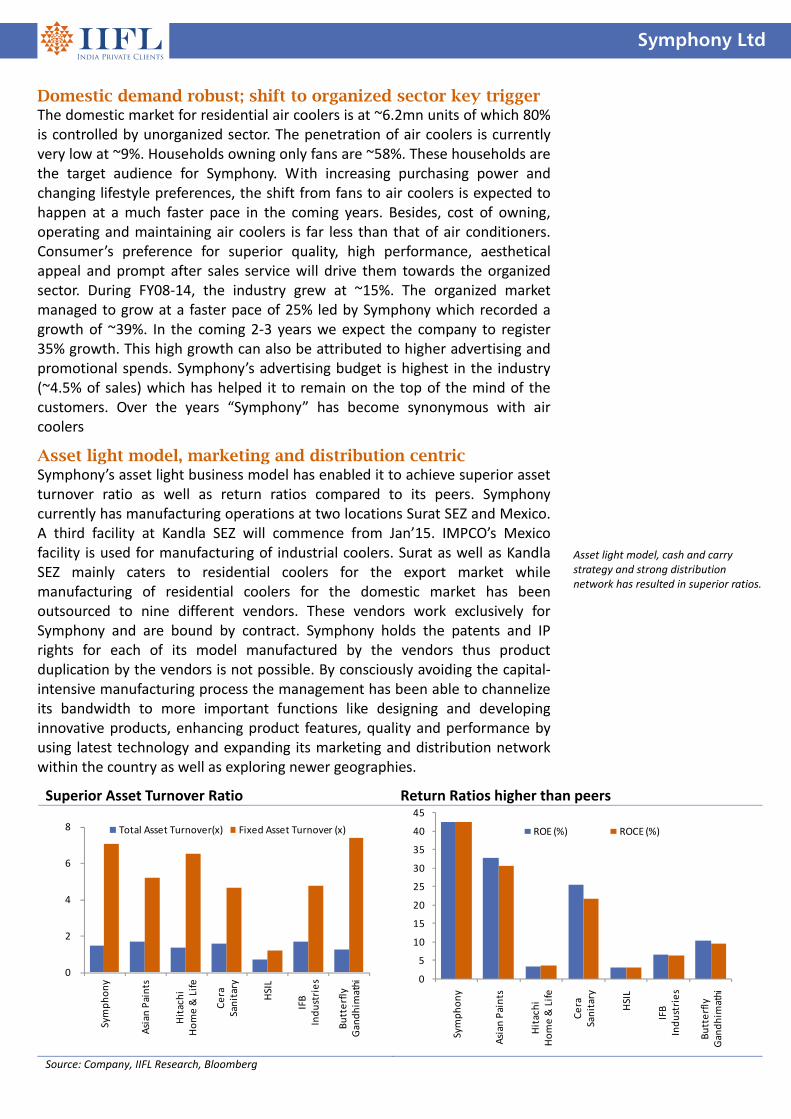
Asset light model, marketing and distribution centric Symphony’s asset light business model has enabled it to achieve superior asset turnover ratio as well as return ratios compared to its peers. Symphony currently has manufacturing operations at two locations Surat SEZ and Mexico. A third facility at Kandla SEZ will commence from Jan’15. IMPCO’s Mexico facility is used for manufacturing of industrial coolers. Surat as well as Kandla SEZ mainly caters to residential coolers for the export market while manufacturing of residential coolers for the domestic market has been outsourced to nine different vendors. These vendors work exclusively for Symphony and are bound by contract. Symphony holds the patents and IP rights for each of its model manufactured by the vendors thus product duplication by the vendors is not possible. By consciously avoiding the capital‐intensive manufacturing process the management has been able to channelize its bandwidth to more important functions like designing and developing innovative products, enhancing product features, quality and performance by using latest technology and expanding its marketing and distribution network within the country as well as exploring newer geographies.
Asset light model, cash and carry strategy and strong distribution network has resulted in superior ratios.
Superior Asset Turnover Ratio Return Ratios higher than peers
0
2
4
6
8
Symphony
Asian
Paints
Hitachi
Home & Life
Cera
Sanitary
HSIL
IFB
Industries
Butterfly
Gandhim
athi
Total Asset Turnover(x) Fixed Asset Turnover (x)
0
5
10
15
20
25
30
35
40
45
Symphony
Asian
Paints
Hitachi
Home & Life
Cera
Sanitary
HSIL
IFB
Industries
Butterfly
Gandhim
athi
ROE (%) ROCE (%)
Source: Company, IIFL Research, Bloomberg
Symphony Ltd
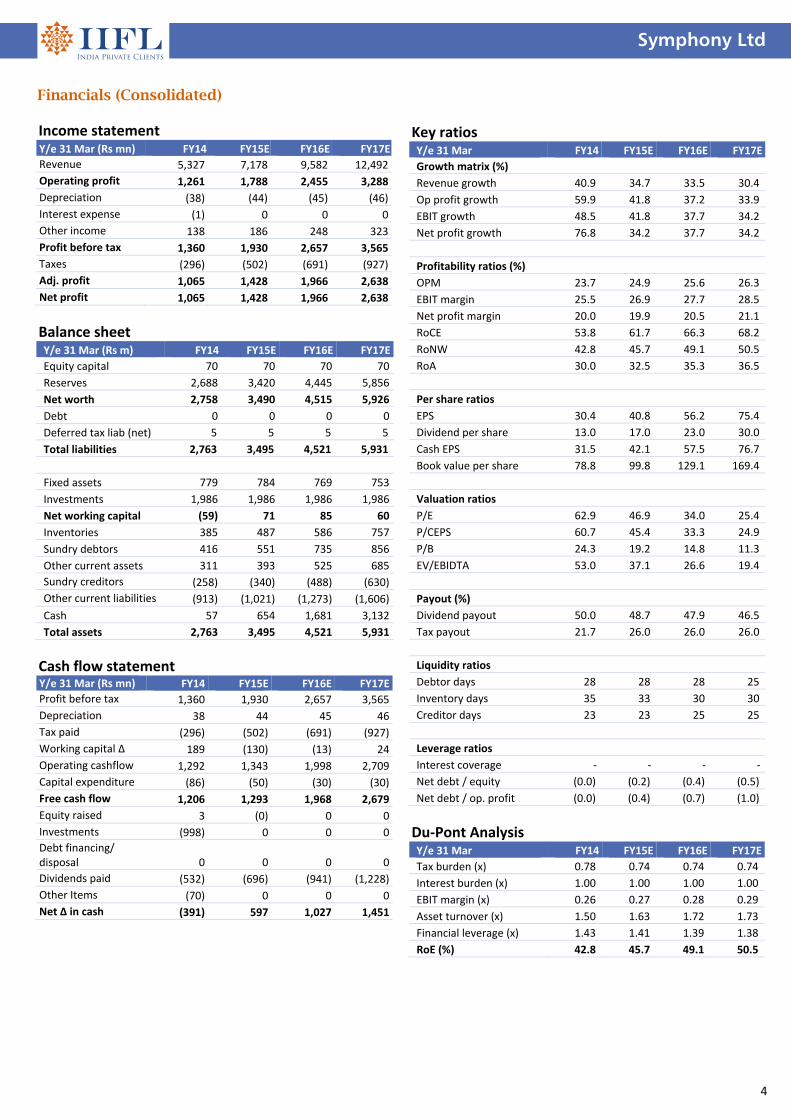
Debt free balance sheet, strong cash flow calls for high payout As explained above, the asset light approach has led to superior return ratios. Its cash and carry business model has led to a very efficient working capital cycle. ~90% of the domestic sales are done through distributors/dealers that pay full payment in advance. Remaining 10% sales are through large format stores (like Croma, e‐zone etc) where 1‐3 month credit is given. The story remains the same on the export front where large format stores get credit similar to their Indian counterparts while distributors/ dealers pay in advance. Strong free cash flows coupled with debt free balance sheet and improving profitability has prompted the management to increase the dividend payout ratio to 50%. We believe the ratio should further increase as the business is self funded and need for cash is minimal. RoCE has consistently been maintained above 50% which is higher than the industry.
Outlook & Valuation We are positive on the company’s prospects in the coming years, given (i) rising income levels leading to higher disposal incomes per household, favorable demographic and changing consumer preferences (ii) launch of new innovative products which command higher margins (iii) strong brand recall on the back of aggressive advertising and promotional campaigns (iv) capturing market share from unorganized players (v) robust balance sheet. We expect Symphony to report revenue and earnings CAGR of 33% and 35% respectively during FY2014‐17E. EBITDA is expected to clock a CAGR of 38% led by ~260 bps margin expansion from 23.7% in FY14 to 26.3% in FY17. At CMP of Rs1,920, the stock is trading at a P/E of 26x based on FY17E EPS of Rs75. We recommend Buy on the stock with a target price of Rs2,489.
Company Background Ahmedabad based Symphony Ltd is the largest air cooler manufacturer not only in India but in the world. It sells more than 23 different types of residential air coolers globally. One of the key strengths of the company lies in its strong distribution network. Its pan‐India network consists of more than 750 distributors which in turn sell to more than 16,650 dealers. Symphony is the only company in the industry whose global R&D centre has been recognized by the Govt. of India. The company also manufactures commercial and industrial coolers in various capacities.
RoCE above 40% due to strong balance sheet and higher profitability
Domestic Residential Coolers Market Share‐ By Value
Domestic Residential Coolers Market Share‐ By Volume
50%
30%
12%
8%
Symphony
Kenstar
Bajaj
Others
40%
35%
15%
10%
Symphony
Kenstar
Bajaj
Others
Source: Company, IIFL Research
4
Symphony Ltd
Financials (Consolidated) Income statement Y/e 31 Mar (Rs mn) FY14 FY15E FY16E FY17E
Revenue 5,327 7,178 9,582 12,492
Operating profit 1,261 1,788 2,455 3,288
Depreciation (38) (44) (45) (46)
Interest expense (1) 0 0 0
Other income 138 186 248 323
Profit before tax 1,360 1,930 2,657 3,565
Taxes (296) (502) (691) (927)
Adj. profit 1,065 1,428 1,966 2,638
Net profit 1,065 1,428 1,966 2,638
Balance sheet Y/e 31 Mar (Rs m) FY14 FY15E FY16E FY17E
Equity capital 70 70 70 70
Reserves 2,688 3,420 4,445 5,856
Net worth 2,758 3,490 4,515 5,926
Debt 0 0 0 0
Deferred tax liab (net) 5 5 5 5
Total liabilities 2,763 3,495 4,521 5,931
Fixed assets 779 784 769 753
Investments 1,986 1,986 1,986 1,986
Net working capital (59) 71 85 60
Inventories 385 487 586 757
Sundry debtors 416 551 735 856
Other current assets 311 393 525 685
Sundry creditors (258) (340) (488) (630)
Other current liabilities (913) (1,021) (1,273) (1,606)
Cash 57 654 1,681 3,132
Total assets 2,763 3,495 4,521 5,931
Cash flow statement Y/e 31 Mar (Rs mn) FY14 FY15E FY16E FY17E
Profit before tax 1,360 1,930 2,657 3,565
Depreciation 38 44 45 46
Tax paid (296) (502) (691) (927)
Working capital ∆ 189 (130) (13) 24
Operating cashflow 1,292 1,343 1,998 2,709
Capital expenditure (86) (50) (30) (30)
Free cash flow 1,206 1,293 1,968 2,679
Equity raised 3 (0) 0 0
Investments (998) 0 0 0
Debt financing/ disposal 0 0 0 0
Dividends paid (532) (696) (941) (1,228)
Other Items (70) 0 0 0
Net ∆ in cash (391) 597 1,027 1,451
Key ratios Y/e 31 Mar FY14 FY15E FY16E FY17E
Growth matrix (%)
Revenue growth 40.9 34.7 33.5 30.4
Op profit growth 59.9 41.8 37.2 33.9
EBIT growth 48.5 41.8 37.7 34.2
Net profit growth 76.8 34.2 37.7 34.2
Profitability ratios (%)
OPM 23.7 24.9 25.6 26.3
EBIT margin 25.5 26.9 27.7 28.5
Net profit margin 20.0 19.9 20.5 21.1
RoCE 53.8 61.7 66.3 68.2
RoNW 42.8 45.7 49.1 50.5
RoA 30.0 32.5 35.3 36.5
Per share ratios
EPS 30.4 40.8 56.2 75.4
Dividend per share 13.0 17.0 23.0 30.0
Cash EPS 31.5 42.1 57.5 76.7
Book value per share 78.8 99.8 129.1 169.4
Valuation ratios
P/E 62.9 46.9 34.0 25.4
P/CEPS 60.7 45.4 33.3 24.9
P/B 24.3 19.2 14.8 11.3
EV/EBIDTA 53.0 37.1 26.6 19.4
Payout (%)
Dividend payout 50.0 48.7 47.9 46.5
Tax payout 21.7 26.0 26.0 26.0
Liquidity ratios
Debtor days 28 28 28 25
Inventory days 35 33 30 30
Creditor days 23 23 25 25
Leverage ratios
Interest coverage ‐ ‐ ‐ ‐
Net debt / equity (0.0) (0.2) (0.4) (0.5)
Net debt / op. profit (0.0) (0.4) (0.7) (1.0)
Du‐Pont Analysis Y/e 31 Mar FY14 FY15E FY16E FY17E
Tax burden (x) 0.78 0.74 0.74 0.74
Interest burden (x) 1.00 1.00 1.00 1.00
EBIT margin (x) 0.26 0.27 0.28 0.29
Asset turnover (x) 1.50 1.63 1.72 1.73
Financial leverage (x) 1.43 1.41 1.39 1.38
RoE (%) 42.8 45.7 49.1 50.5
‘Best Broker of the Year’ – by Zee Business for contribution to brokingNirmal Jain, Chairman, IIFL, received the award for The Best Broker of the Year (for contribution to broking in India) at India's Best Market Analyst Awards 2014 organised by the Zee Business in Mumbai. The award was presented by the guest of Honour Amit Shah, president of the Bharatiya Janata Party and Piyush Goel, Minister of state with independent charge for power, coal new and renewable energy.
'Best Equity Broker of the Year' – Bloomberg UTV, 2011IIFL was awarded the 'Best Equity Broker of the Year' at the recently held Bloomberg UTV Financial Leadership Award, 2011. The award presented by the Hon'ble Finance Minister of India, Shri Pranab Mukherjee. The Bloomberg UTV Financial Leadership Awards acknowledge the extraordinary contribution of India's financial leaders and visionaries from January 2010 to January 2011.
'Best Broker in India' – Finance Asia, 2011IIFL has been awarded the 'Best Broker in India' by Finance Asia. The award is the result of Finance Asia's annual quest for the best financial services firms across Asia, which culminated in the Country Awards 2011
Other awards
2012BEST BROKING HOUSE WITH
GLOBAL PRESENCE
2009, 2012 & 2013BEST MARKET
ANALYSTBEST BROKERAGE,
INDIAMOST IMPROVED,
INDIABEST BROKER,
INDIA
2009FASTEST GROWING
LARGE BROKING HOUSE
Recommendation parameters for fundamental reports: Buy – Absolute return of over +15%
Accumulate – Absolute return between 0% to +15%
Reduce – Absolute return between 0% to ‐10%
Sell – Absolute return below ‐10% Call Failure ‐ In case of a Buy report, if the stock falls 20% below the recommended price on a closing basis, unless otherwise specified by the analyst; or, in case of a Sell report, if the stock rises 20% above the recommended price on a closing basis, unless otherwise specified by the analyst
India Infoline Group (hereinafter referred as IIFL) is engaged in diversified financial services business including equity broking, DP services, merchant banking, portfolio management services, distribution of Mutual Fund, insurance products and other investment products and also loans and finance business. India Infoline Ltd (“hereinafter referred as IIL”) is a part of the IIFL and is a member of the National Stock Exchange of India Limited (“NSE”) and the BSE Limited (“BSE”). IIL is also a Depository Participant registered with NSDL & CDSL, a SEBI registered merchant banker and a SEBI registered portfolio manager. IIL is a large broking house catering to retail, HNI and institutional clients. It operates through its branches and authorised persons and sub‐brokers spread across the country and the clients are provided online trading through internet and offline trading through branches and Customer Care. Terms & Conditions and Other Disclosures:‐ a) This research report (“Report”) is for the personal information of the authorised recipient(s) and is not for public distribution and should not be
reproduced or redistributed to any other person or in any form without IIL’s prior permission. The information provided in the Report is from publicly available data, which we believe, are reliable. While reasonable endeavors have been made to present reliable data in the Report so far as it relates to current and historical information, but IIL does not guarantee the accuracy or completeness of the data in the Report. Accordingly, IIL or any of its connected persons including its directors or subsidiaries or associates or employees shall not be in any way responsible for any loss or damage that may arise to any person from any inadvertent error in the information contained, views and opinions expressed in this publication.
b) Past performance should not be taken as an indication or guarantee of future performance, and no representation or warranty, express or implied, is
made regarding future performance. Information, opinions and estimates contained in this report reflect a judgment of its original date of publication by IIFL and are subject to change without notice. The price, value of and income from any of the securities or financial instruments mentioned in this report can fall as well as rise. The value of securities and financial instruments is subject to exchange rate fluctuation that may have a positive or adverse effect on the price or income of such securities or financial instruments.
c) The Report also includes analysis and views of our research team. The Report is purely for information purposes and does not construe to be
investment recommendation/advice or an offer or solicitation of an offer to buy/sell any securities. The opinions expressed in the Report are our current opinions as of the date of the Report and may be subject to change from time to time without notice. IIL or any persons connected with it do not accept any liability arising from the use of this document.
d) Investors should not solely rely on the information contained in this Report and must make investment decisions based on their own investment
objectives, judgment, risk profile and financial position. The recipients of this Report may take professional advice before acting on this information.
e) IIL has other business segments / divisions with independent research teams separated by 'chinese walls' catering to different sets of customers having varying objectives, risk profiles, investment horizon, etc and therefore, may at times have, different and contrary views on stocks, sectors and markets.
f) This report is not directed or intended for distribution to, or use by, any person or entity who is a citizen or resident of or located in any locality, state,
country or other jurisdiction, where such distribution, publication, availability or use would be contrary to local law, regulation or which would subject IIL and its affiliates to any registration or licensing requirement within such jurisdiction. The securities described herein may or may not be eligible for sale in all jurisdictions or to certain category of investors. Persons in whose possession this Report may come are required to inform themselves of and to observe such restrictions.
g) As IIL along with its associates, are engaged in various financial services business and so might have financial, business or other interests in other
entities including the subject company/ies mentioned in this Report. However, IIL encourages independence in preparation of research report and strives to minimize conflict in preparation of research report. IIL and its associates did not receive any compensation or other benefits from the subject company/ies mentioned in the Report or from a third party in connection with preparation of the Report. Accordingly, IIL and its associates do not have any material conflict of interest at the time of publication of this Report.
h) As IIL and its associates are engaged in various financial services business, it might have:‐
(a) received any compensation (except in connection with the preparation of this Report) from the subject company in the past twelve months; (b) managed or co‐managed public offering of securities for the subject company in the past twelve months; (c) received any compensation for investment banking or merchant banking or brokerage services from the subject company in the past twelve months; (d) received any compensation for products or services other than investment banking or merchant banking or brokerage services from the subject company in the past twelve months; (e) engaged in market making activity for the subject company.
i) IIL and its associates collectively do not own 1% or more of the equity securities of the subject company/ies mentioned in the report as of the last day of the month preceding the publication of the research report.
j) The Research Analyst/s engaged in preparation of this Report or his/her relative
(a) does not have any financial interests in the subject company/ies mentioned in this report; (b) does not own 1% or more of the equity securities of the subject company mentioned in the report as of the last day of the month preceding the publication of the research report; (c) does not have any other material conflict of interest at the time of publication of the research report.
k) The Research Analyst/s engaged in preparation of this Report:‐ (a) has not received any compensation from the subject company in the past twelve months; (b) has not managed or co‐managed public offering of securities for the subject company in the past twelve months; (c) has not received any compensation for investment banking or merchant banking or brokerage services from the subject company in the past twelve months; (d) has not received any compensation for products or services other than investment banking or merchant banking or brokerage services from the subject company in the past twelve months; (e) has not received any compensation or other benefits from the subject company or third party in connection with the research report; (f) has not served as an officer, director or employee of the subject company; (g) is not engaged in market making activity for the subject company.
We submit that no material disciplinary action has been taken on IIL by any regulatory authority impacting Equity Research Analysis. A graph of daily closing prices of securities is available at http://www.nseindia.com/ChartApp/install/charts/mainpage.jsp, www.bseindia.com and http://economictimes.indiatimes.com/markets/stocks/stock‐quotes. (Choose a company from the list on the browser and select the “three years” period in the price chart).
Published in 2015. © India Infoline Ltd 2015 India Infoline Limited (Formerly “India Infoline Distribution Company Limited”), CIN No.: U99999MH1996PLC132983, Corporate Office – IIFL Centre, Kamala City, Senapati Bapat Marg, Lower Parel, Mumbai – 400013 Tel: (91‐22) 4249 9000 .Fax: (91‐22) 40609049, Regd. Office – IIFL House, Sun Infotech Park, Road No. 16V, Plot No. B‐23, MIDC, Thane Industrial Area, Wagle Estate, Thane – 400604 Tel: (91‐22) 25806650. Fax: (91‐22) 25806654 E‐mail: [email protected] Website: www.indiainfoline.com, Refer www.indiainfoline.com for detail of Associates.
National Stock Exchange of India Ltd. SEBI Regn. No. : INB231097537/ INF231097537/ INE231097537, Bombay Stock Exchange Ltd. SEBI Regn. No.:INB011097533/ INF011097533/ BSE‐Currency, MCX Stock Exchange Ltd. SEBI Regn. No.: INB261097530/ INF261097530/ INE261097537, United Stock Exchange Ltd. SEBI Regn. No.: INE271097532, PMS SEBI Regn. No. INP000002213, IA SEBI Regn. No. INA000000623, SEBI RA Regn.:‐ Applied for
For Research related queries, write to: Amar Ambani, Head of Research at [email protected] For Sales and Account related information, write to customer care: [email protected] or call on 91‐22 4007 1000