Embed Size (px)
Citation preview
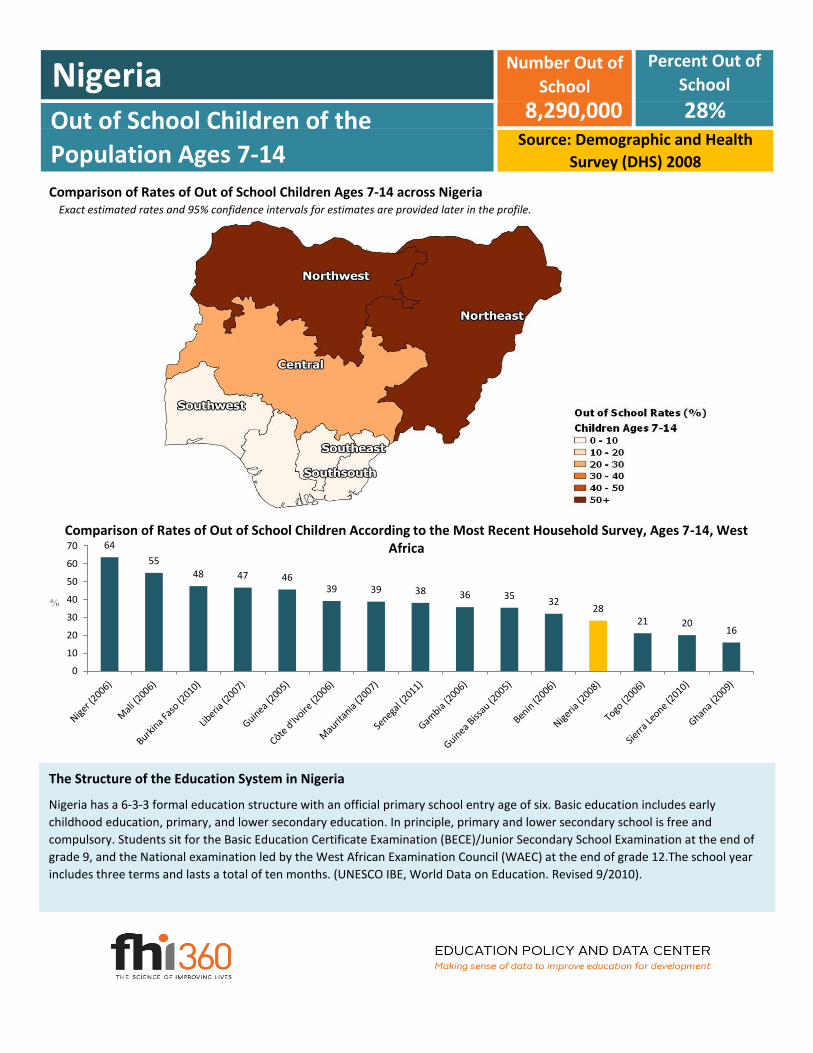
Exact estimated rates and 95% confidence intervals for estimates are provided later in the profile.
The Structure of the Education System in Nigeria
Percent Out of
School
28%
Number Out of
School
8,290,000 Source: Demographic and Health
Survey (DHS) 2008
Out of School Children of the
Population Ages 7-14
Nigeria
Nigeria has a 6-3-3 formal education structure with an official primary school entry age of six. Basic education includes early
childhood education, primary, and lower secondary education. In principle, primary and lower secondary school is free and
compulsory. Students sit for the Basic Education Certificate Examination (BECE)/Junior Secondary School Examination at the end of
grade 9, and the National examination led by the West African Examination Council (WAEC) at the end of grade 12.The school year
includes three terms and lasts a total of ten months. (UNESCO IBE, World Data on Education. Revised 9/2010).
Comparison of Rates of Out of School Children Ages 7-14 across Nigeria
28
64
55 48 47 46
39 39 38 36 35 32
21 20 16
0
10
20
30
40
50
60
70
%
Comparison of Rates of Out of School Children According to the Most Recent Household Survey, Ages 7-14, West Africa
Nigeria
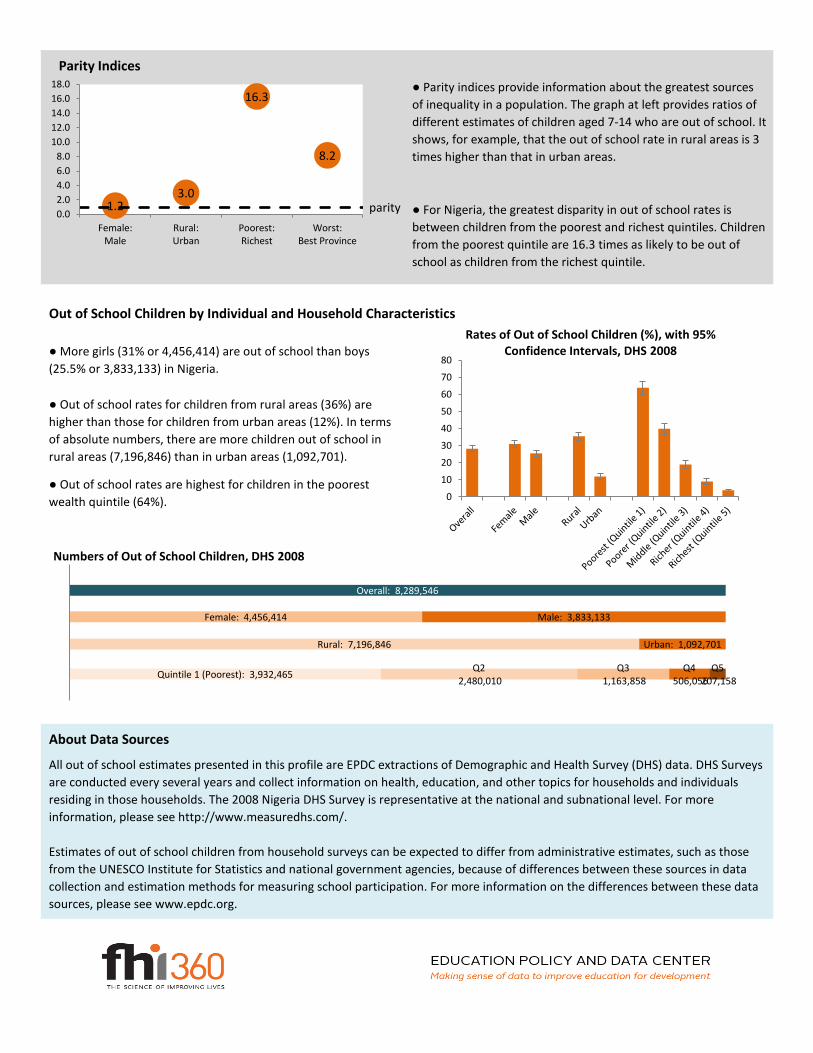
Out of School Children by Individual and Household Characteristics
About Data Sources
● For Nigeria, the greatest disparity in out of school rates is
between children from the poorest and richest quintiles. Children
from the poorest quintile are 16.3 times as likely to be out of
school as children from the richest quintile.
● Parity indices provide information about the greatest sources
of inequality in a population. The graph at left provides ratios of
different estimates of children aged 7-14 who are out of school. It
shows, for example, that the out of school rate in rural areas is 3
times higher than that in urban areas.
● Out of school rates are highest for children in the poorest
wealth quintile (64%).
All out of school estimates presented in this profile are EPDC extractions of Demographic and Health Survey (DHS) data. DHS Surveys
are conducted every several years and collect information on health, education, and other topics for households and individuals
residing in those households. The 2008 Nigeria DHS Survey is representative at the national and subnational level. For more
information, please see http://www.measuredhs.com/.
Estimates of out of school children from household surveys can be expected to differ from administrative estimates, such as those
from the UNESCO Institute for Statistics and national government agencies, because of differences between these sources in data
collection and estimation methods for measuring school participation. For more information on the differences between these data
sources, please see www.epdc.org.
● Out of school rates for children from rural areas (36%) are
higher than those for children from urban areas (12%). In terms
of absolute numbers, there are more children out of school in
rural areas (7,196,846) than in urban areas (1,092,701).
● More girls (31% or 4,456,414) are out of school than boys
(25.5% or 3,833,133) in Nigeria.
1.2 3.0
16.3
8.2
parity 0.0
2.0
4.0
6.0
8.0
10.0
12.0
14.0
16.0
18.0
Female:Male
Rural:Urban
Poorest:Richest
Worst:Best Province
Parity Indices
0
10
20
30
40
50
60
70
80
Rates of Out of School Children (%), with 95% Confidence Intervals, DHS 2008
Overall: 8,289,546
Female: 4,456,414 Male: 3,833,133
Quintile 1 (Poorest): 3,932,465 Q2
2,480,010 Q3
1,163,858 Q4
506,056 Q5
207,158
Rural: 7,196,846 Urban: 1,092,701
Numbers of Out of School Children, DHS 2008
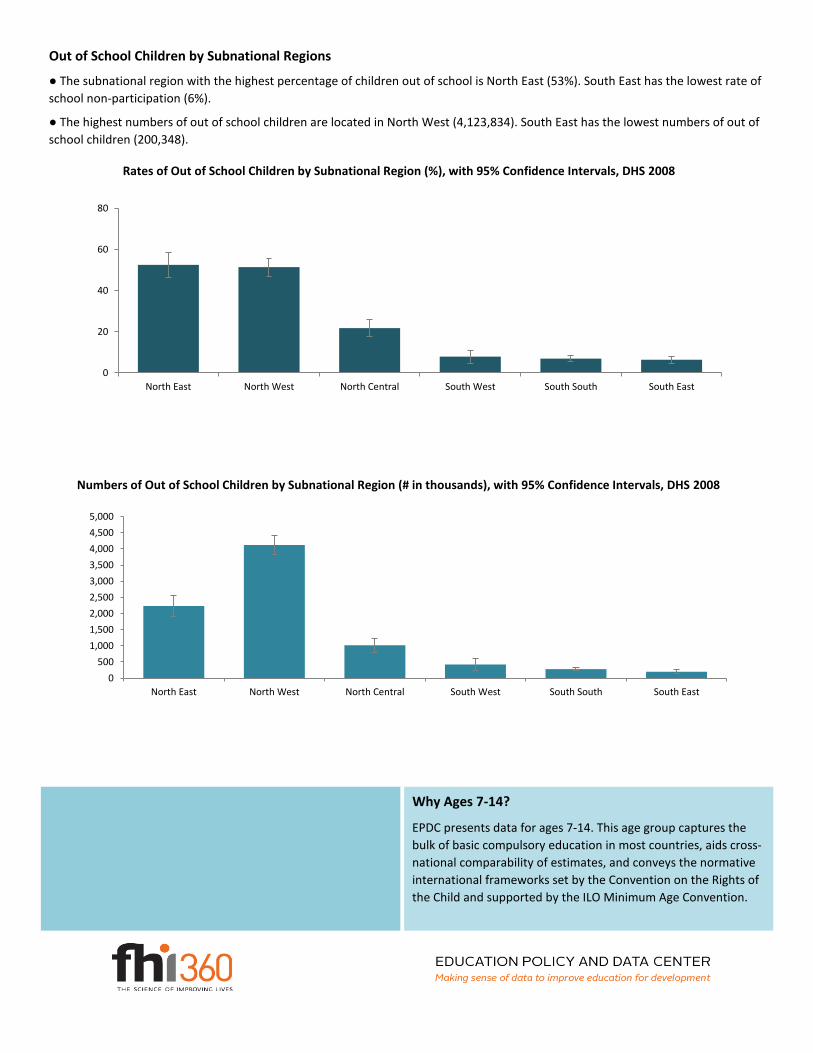
Out of School Children by Subnational Regions
● The subnational region with the highest percentage of children out of school is North East (53%). South East has the lowest rate of
school non-participation (6%).
● The highest numbers of out of school children are located in North West (4,123,834). South East has the lowest numbers of out of
school children (200,348).
EPDC presents data for ages 7-14. This age group captures the
bulk of basic compulsory education in most countries, aids cross-
national comparability of estimates, and conveys the normative
international frameworks set by the Convention on the Rights of
the Child and supported by the ILO Minimum Age Convention.
Why Ages 7-14?
0
20
40
60
80
North East North West North Central South West South South South East
Rates of Out of School Children by Subnational Region (%), with 95% Confidence Intervals, DHS 2008
0
500
1,000
1,500
2,000
2,500
3,000
3,500
4,000
4,500
5,000
North East North West North Central South West South South South East
Numbers of Out of School Children by Subnational Region (# in thousands), with 95% Confidence Intervals, DHS 2008
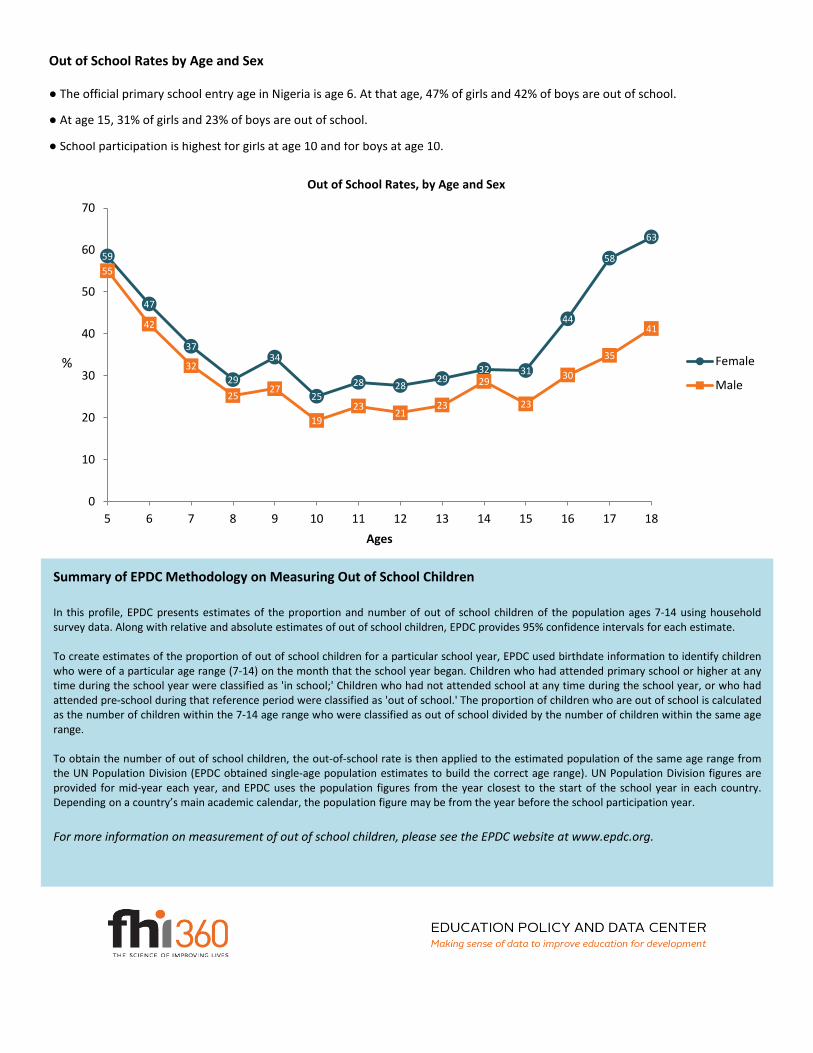
Out of School Rates by Age and Sex
● At age 15, 31% of girls and 23% of boys are out of school.
● School participation is highest for girls at age 10 and for boys at age 10.
● The official primary school entry age in Nigeria is age 6. At that age, 47% of girls and 42% of boys are out of school.
Summary of EPDC Methodology on Measuring Out of School Children
In this profile, EPDC presents estimates of the proportion and number of out of school children of the population ages 7-14 using household survey data. Along with relative and absolute estimates of out of school children, EPDC provides 95% confidence intervals for each estimate. To create estimates of the proportion of out of school children for a particular school year, EPDC used birthdate information to identify children who were of a particular age range (7-14) on the month that the school year began. Children who had attended primary school or higher at any time during the school year were classified as 'in school;' Children who had not attended school at any time during the school year, or who had attended pre-school during that reference period were classified as 'out of school.' The proportion of children who are out of school is calculated as the number of children within the 7-14 age range who were classified as out of school divided by the number of children within the same age range. To obtain the number of out of school children, the out-of-school rate is then applied to the estimated population of the same age range from the UN Population Division (EPDC obtained single-age population estimates to build the correct age range). UN Population Division figures are provided for mid-year each year, and EPDC uses the population figures from the year closest to the start of the school year in each country. Depending on a country’s main academic calendar, the population figure may be from the year before the school participation year.
For more information on measurement of out of school children, please see the EPDC website at www.epdc.org.
59
47
37
29
34
25
28 28 29
32 31
44
58
63
55
42
32
25 27
19
23 21
23
29
23
30
35
41
0
10
20
30
40
50
60
70
5 6 7 8 9 10 11 12 13 14 15 16 17 18
Ages
Out of School Rates, by Age and Sex
Female
Male
%
National 26 7,762,721 8,816,372
SexFemale 29 4,171,394 4,741,433
Male 24 3,549,830 4,116,436
AreaRural 33 6,700,928 7,692,765
Urban 10 914,908 1,270,493
Relative WealthPoorest Quintile 60 3,520,360 4,344,569
Poorer Quintile 37 2,198,742 2,761,278
Middle Quintile 17 999,861 1,327,855
Richer Quintile 7 396,191 615,922
Richest Quintile 3 166,812 247,504
RegionsNorth East 47 1,921,487 2,554,419
North West 47 3,819,512 4,428,155
North Central 18 804,345 1,239,794
South West 5 246,852 599,490
South South 6 223,498 340,845
South East 5 146,979 253,717
Estimated
proportion of
out of school
children of the
population ages
7-14 (%)
28
Upper limit of
95%
confidence
interval
Lower limit of
95%
confidence
interval
Lower limit of
95%
confidence
interval
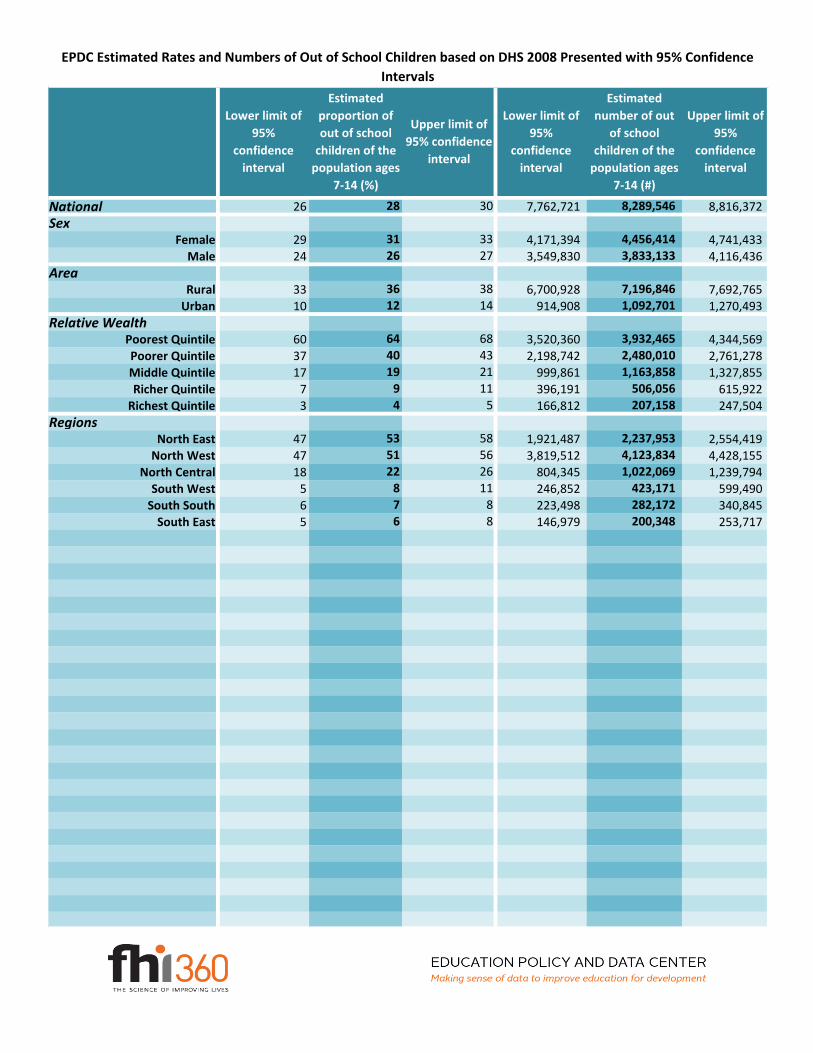
EPDC Estimated Rates and Numbers of Out of School Children based on DHS 2008 Presented with 95% Confidence
Intervals
12
64
40
19
31
26
36
22
8
7
6
9
4
53
51
11
8
8
Estimated
number of out
of school
children of the
population ages
7-14 (#)
8,289,546
4,456,414
3,833,133
7,196,846
1,092,701
Upper limit of
95% confidence
interval
30
33
27
38
14
68
43
21
11
5
58
56
26
3,932,465
2,480,010
1,163,858
1,022,069
423,171
282,172
200,348
506,056
207,158
2,237,953
4,123,834