Embed Size (px)
Citation preview
Latin America/Caribbean and Asia/Pacific Economics and Business Association
An initiative of the Inter-American Development Bank and the Asian Development Bank Institute
Sponsored by
InterAmerican Development Bank Integration and Trade Sector Institute for the Integration of Latin American and the Caribbean (INTAL)
Fourth LAEBA Annual Meeting
Lima, Peru – June 17, 2008
Regional Integration and Trade Cost in South Asia
Nilankan Banik and John Gilbert
Regional Integration and Trade Costs in South Asia1
Nilanjan Banik and John Gilbert2
Abstract
Until now, amount of inter-country trade within South Asian nations have been low.
While similarities in exports profile can be seen as a reason for this low value of trade it
might not be a valid one, especially in presence of growing South Asian income. Intra-
industry trade theory suggests that complementarity might actually increase trade in
presence of a rising income. There can be other important factors, such as, trade costs.
Using an augmented gravity model in a panel framework we try to identify the
components of trade costs that might have resulted in lower inter-country South Asian
trade.
Keywords: Regional Integration, Trade Cost, South Asia, Gravity model. JEL Classification: C32, F02, F15.
1 First draft, not to be quoted without authors’ permission. 2 Nilanjan Banik, Associate Professor, Center for Advanced Financial Studies, Institute for Financial Management and Research, Chennai, India. John Gilbert, Associate Professor, Department of Economics, Utah State University, Utah, USA. All correspondence to [email protected].
1
1. Introduction
The beneficial effect of free and fair trade is well known.3 Trade affects growth in three
primary ways. First, trade encourages flow of resources from low productive sectors to
the high productive sectors, leading to an overall increase in output. Export growth may
affect total productivity growth through dynamic spillover effects on the rest of the
economy (Feder, 1983). The possible sources of this positive dynamic spillover include
more efficient management styles, better forms of organization, labor training, and
knowledge about technology and international markets (Chuang, 1998). Second, with
unemployed resources, an increase in export sales lead to an overall expansion in
production and a fall in unemployment rate. As production increases, firms because of
increase in scale of operation (economies of scale) become more efficient (Helpman and
Krugman, 1985). Third, international trade also allows for the purchase of capital goods
from foreign countries and exposes an economy to technological advances of the
developed countries. Recent theoretical work suggests that capital goods import from
technologically advanced countries may increase productivity and thereby growth, since
knowledge and technology is embodied in equipment and machinery and therefore
transferred through international trade (Chuang 1998). In other words, trade plays an
important role for economic growth of a region.
Despite these positive aspects, free trade is opposed mainly because workers and
producers associated with the inefficient industries stand to lose out. There are
considerable amount of lobbying pressure by the inefficient producers demanding more
protection. As raising tariff barriers is not allowed under World Trade Organization
(WTO) framework, individual governments try to protect their respective economies by
imposing non-tariff barriers (NTBs), like, antidumping measures, import license, sanitary
standards, etc.
Besides these policy induced reasons, trade flow can also get affected because of other
reasons such as, transportation costs - both freight costs and time costs (Baier and 3 In the static sense we think of benefit accruing to countries trading on the basis of comparative advantage (Ricardian theory), or on the basis of different factor endowments (Hecksher-Ohlin-Vanek model). The dynamic effects of trade on growth depend crucially on the extent of technology transfers or knowledge spillovers through foreign direct investment (FDI) across countries (endogenous growth models and Helpman-Grossman models).
2
Bergstrand, 1997; Rose and van Wincoop, 1991); information costs (Rauch and Trindade,
2002); contract enforcement costs (Evans, 2001); use of different currencies (Rose and
van Wincoop, 2001); lack of trade facilitation measures, such as, inadequate logistics of
moving goods through ports, inefficient handling of custom documentation, lack of
harmonization of regulation standards, etc. (Wilson, et al., 2004); language barriers
(Eaton and Kortum, 2002); and local distribution costs - wholesale and retail (Feenstra,
1998). In fact, these other factors can be more important than price factors, like tariffs
and exchange rates, in affecting trade flows. Anderson and van Wincoop (2004) observe
that direct policy instruments such as tariffs and quotas are less important compared to
barriers such as lack of infrastructure, informational institutions, law enforcement and
local distribution costs.
Hence, success of trade liberalization can be fully realized if trading partners can control
for these above mentioned ‘non price factors of trade’ which are also known as trade
costs.4 Researchers can form an idea about trade costs by trying to account for all other
additional costs incurred in moving a good to the final consumer other than the marginal
cost of producing the good. For example, of the $2 export value for the Barbie dolls,
when they leave Hong Kong for the United States, about 35 cents covers Chinese labor,
65 cents covers the cost of materials, and the remainder covers transportation and
overhead, including profits earned in Hong Kong.5 The dolls sell for about $10 in the
United States, of which Mattel (the retailer of Barbie dolls in the US) earns at least $1,
and the rest covers transportation, marketing, wholesaling and retailing in the United
States (Feenstra, 1998).
According to Anderson and van Wincoop (2004) trade costs for industrialized countries
is 170 percent. This number breaks down as follows - 21 percent transportation costs, 44
percent border-related trade barriers, and 55 percent retail and wholesale distribution
costs (2.7 = 1.21×1.44×1.55) (pp. 692). On further commenting on the breakdown of 44
percent border-related trade barriers – an 8 percent is because of policy barriers; a 7
percent because of language barrier; a 14 percent because of currency barrier (from the
4 In literature, trade liberalization is also known as external sector liberalization. It means reduction in tariff barriers, phasing out of NTBs, like quotas, import license, etc., export promotion, and a move towards a market determined exchange rates. 5 If not otherwise specified, henceforth, $, will stands for US dollar.
3
use of different currencies); a 6 percent because of information barriers and 3 percent
because of security barriers.
Given the importance of trade costs in affecting trade flow among nations, it makes sense
to understand and to the extent possible identify trade costs, in South Asia. Such an
exercise will have important policy relevance in the context of South Asian Association
of Regional Cooperation (SAARC).6 In 1995, SAARC Preferential Trading Arrangement
(SAPTA) was formed with an idea of hastening trade flow in the region. In a 1999 report
(SAARC, 1999), following a call for “greater coordination of monetary and exchange
rate policy”, a tentative roadmap suggested goals of forming a South Asian Custom
Union (SACU) as early as 2015, followed by a South Asian Economic Union as early as
2020.7 Hence, at least at the political level, there seem to be some willingness to increase
trade flow in the region.
Against this backdrop the present paper tries to examine whether: (a) whether SAARC
nations actually share economic characteristics favorable for a deeper economic
integration; (b) identifying trade costs that are coming in way of deeper integration of
South Asian trade; (c) quantifying the sources of trade costs using an augmented gravity
panel framework; and finally; (d) policy recommendations.
2. SAPTA, SAFTA and the Story So Far
SAFTA is one of the many regional trading agreements (RTAs) that have been formed
over the last two decades. Repeated failures of multilateral negotiations, especially at
various ministerial meet of WTO, has lead to an increase in the number of RTAs.8 Also,
increased internationalization of markets (i.e. globalization), and the fear of losing out to
6 SAARC was formed in 1985, with Bangladesh, Bhutan, India, Maldives, Nepal, Pakistan and Sri Lanka, as its member. Initially SAARC focused on areas such as health, population activities and child welfare, culture and sports. However, with each passing year, the member countries started working on greater economic cooperation. 7 Some initial steps were taken in this direction with the establishment of Saarcfinance, a network of SAARC central bank governors and finance secretaries and its subsequent formal recognition as a SAARC body at the 11th SAARC summit held in Kathmandu, Nepal in 2002. Beginning on 1 January 2006, the South Asian Free Trade Area (SAFTA) came into effect. SAFTA strengthens the relationships defined under SAPTA and is envisaged as the next step towards formation of the SACU. 8 Around 205 RTAs notified under the General Agreement on Tariffs and Trade (GATT) and the WTO are in force today (http://www.wto.org/English/tratop_e/region_e/regfac_e.htm (Accessed: 5/23/2008).
4
other inefficient producers have put pressure on individual country to become part of any
RTA. The answer to a successful RTA therefore lies in controlling the factors that act
against RTA, and nurturing the factors which helps forming and sustaining a RTA. Some
of the factors that affect formation of a RTA are considered below.
Extent of Trade: Countries trading more among themselves are likely to form a RTA. In
fact, RTA is more likely to happen when trade happens in similar commodities, that is,
intra-industry trade. The likelihood that industry association will demand more protection
is less in case of intra-industry trade. In presence of intra-industry trade (for example,
India exporting TATA Indica cars to the US and at the same time importing FORD Fiesta
cars from the US), adjustment cost associated with removing trade barriers are lower. In
this case jobs lost due to customers shifting to more efficient foreign suppliers may to a
large extent be offset by the job enhancing expansion in foreign demand for similar,
differentiated good produced domestically. The political opposition to liberalizing and
expanding intra-industry trade tends to be far less when compared to trade involving in
dissimilar items, that is, inter-industry trade.
Country characteristics: Economies that are similar in terms of size are better candidates
for forming a RTA. Similarities are measured in terms of economic development and
geographical proximities. The more similar are the economies, the more is the likelihood
of intra-industry trade. Similarity is often measured in terms of per capita gross domestic
product (GDP). This is because geographically near economies with similar level of
economic development have access to similar kind of technology. Consequently they
tend to produce more or less similar items and tend to trade in similar commodities
(closely differentiated products as in the monopolistic competition type market structure).
As the literature on gravity model on trade demonstrates, similarities in economic
structure and geographical distance between respective economies are powerful
determinant of trade (Tinbergen, 1962; Linneman, 1966; and Frankel, 1997).9 Trade
increases with economic size and proximity of the trading partners.
Prices: Low technology intensive items, like, leather footwear, garments, gems and
jewellery, textile products, etc., which are typical of any developing country’s exports 9 Another major relevance of gravity model is that it provides the main linkage between trade barriers and trade flow – something we have used for this paper.
5
profile are very much sensitive to movement in prices, i.e. are price elastic. When it
comes to form a RTA, countries analyze whether such an arrangement will enable them
to realize a greater demand for their exports. From the demand-side perspective, it can be
argued that sustained demand growth cannot be maintained in a small domestic market,
since any economic impulse based on expansion of domestic demand is bound to be
exhausted. However, export markets do not exhaust quickly. RTA not only provides a
platform for a greater market share but also enable countries to produce efficiently. As
the literatures on monopolistic competition suggest, a way to produce exports
competitively is to take advantage of economies of scale in production which can be
realized from a greater market share resulting from a RTA (Helpman and Krugman,
1985; Leamer, 1984).
Government Policies and Symmetric Economic Activities: A more liberal government
policies is likely to be beneficial for a RTA. There is a general consensus in the literature
that trade volume, both exports and imports, increase following external sector
liberalization (Agosin, 1991; Bertola and Faini, 1991; Kohli, 1991; Clarke and
Kirkpatrick, 1992; Joshi and Little, 1996). Both the imports and exports of a country tend
to increase with external sector liberalization. Under small country assumption a fall in
tariff barriers reduces the price of imports and cause imports to rise. Exports also increase
and this is true whether the economy has a fixed, or, flexible exchange rate regimes.
Under flexible exchange rate regimes when the economy opens up, first its imports rise.
An increase in imports causes a relative increase in the supply of domestic currencies vis-
à-vis the foreign currencies. This happens because foreign currencies are used to finance
imports. With flexible exchange rates the value of domestic currency is market
determined; an excess supply causes its values to depreciate. This means the price of
exports for this economy falls; causing exports to rise. Under fixed exchange rate
regimes, increase in exports happen in a different way. First, because of liberalization
imports increase. However, market price of domestic currency does not fall as it is fixed
now. An increase in imports release resources from the import competing sectors. A
considerable portion of these resources find their use in the export sectors. As a result
production of exports increases. Exports price falls, partly because of increase production
and partly because inputs prices are cheaper with more coming from the import
6
competing sectors. Exports increase. Higher trade volume, resulting from external sector
liberalization, is expected to increase the likelihood of a RTA formation.
Similarly, symmetric economic activities among member nations also have
complementary effect towards forging for deeper economic integration, like, custom and
economic union. Symmetric economic activity implies that long-run movements in real
output are synchronized. Such co-movements of outputs may be due to dependence of
common factors such as geographical proximity and countries sharing similar industrial
profile. When countries share a similar industrial profile and are located closely, then the
demand shocks in one country may affect other countries in the region. This could also
arise if these economies all share a common trade linkage with major import markets. For
example, if all of these countries engage in trade with the European Union, then changes
in the European Union’s economic performance would have a similar effect on all the
countries concerned and cause them to behave synchronously. In this case, economic
trends would become more similar because all the sectors and therefore all the countries
would be affected in a similar way. Symmetry in economic activity implies that there is a
lesser contradiction in terms of formulating internal and external macroeconomic policies
– something which is prerequisite for forming an economic union.
Against this background, we analyze how well SAARC member nations fulfill these
desirable criteria for forming an RTA.
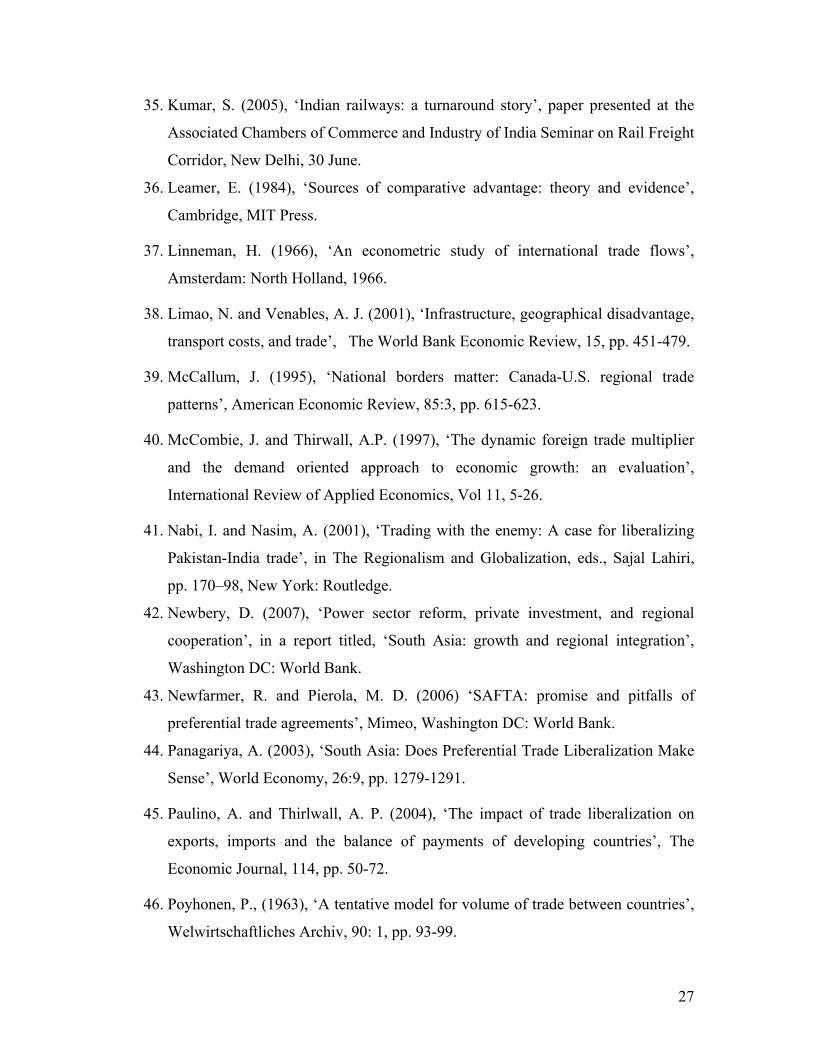
Extent of Trade: Trade in the SAFTA region is currently low (see, Table 1 and Table 2).
According to Newfarmer and Pierola (2006) South Asia’s intra-regional trade as a
percentage of its total trade volume has barely changed from around 2 percent in 1980 to
3 percent in 2004. Exports from South Asia have only increased from $17 billion since
1980 to $120 billion in 2004, in contrast to exports in East Asia growing from $80 billion
to nearly $1 trillion within the same period (Newfarmer and Pierola, 2006). Considering
factors other than trade costs (something we will be dealing latter), lower intra-SAFTA
trade is because of number of reasons.
(Insert Table 1 and Table 2)
First is because of low purchasing power resulting in a smaller regional market. Although
one of the fastest growing region in the world (GDP growth rate averaging around 7
7
percent over the last two years), measured in terms of per capita GDP (read, purchasing
power) these economies are quite small. For instance, until 2001, South Asia house one-
fifth of the world’s population but contributes to less than one twentieth of the world
income in terms of the GDP (Panagariya, 2003). There might not be enough demand for
major Indian exports, like, transport and machinery, gems and jewellery, leather products,
garments, etc., because of lower purchasing power of other SAARC nations. On the other
hand, from a supply side perspective some of the economies, like, Nepal, Bhutan and
Bangladesh, are small, and suffer from supply constraint to meet demand generated by
big economies, like, India.
Second reason for low trade can be attributed to presence of high tariff barriers. A
reflection of high tariff barriers is lower trade-GDP ratio in many of these SAFTA
member countries. In terms of their openness criteria – measured in terms of trade as a
percentage of GDP - Maldives and Sri Lanka are more open compared to India and
Pakistan (Table 3). On the whole, after the Middle East and North Africa, South Asia as a
region is least integrated with the world economy. This is particularly true in case of
agricultural products, where tariffs levied on developing-country exports were frequently
twice as high as that by the industrial countries. The simple average of the applied duties
in non-agricultural goods ranges from 10 percent in Sri Lanka to 21 percent in
Bangladesh. In India, this tariff is approximately 20 percent. In agriculture, the level of
protection is even higher and ranges from 25 percent in Pakistan to 100 percent in India
(Panagariya, 2003).10 Higher tariffs within the region has neutralized the benefit of
common cultural affinity, common geography and the advantage of common borders that
India share with other SAARC nations.
(Insert Table 3) Third is because of low technology intensive type tradable items (Table 4). Considering
these products, like textiles, animals, leather, etc. - not too much of disintegration in
10 Sometimes policy makers find it difficult to reduce tariffs because of domestic reason. A good example will be that of India. The average land holdings size for Indian farmer is around 1.4 hectare or 10,000 square meters (Brummer, 2006).These marginal farmers work in the land of big farmers. Under condition of lower tariffs big farmers make a loss and might stop production. Then marginal farmers are jobless – further worsening already unequal income distribution. Recognizing the need to lower tariff barriers, presently Indian policy makers are putting emphasis in educating rural population so to enable smooth transition (in terms of contribution to national income) from agriculture to manufacturing and services sector.
8

production is possible. Disintegration of production itself leads to more trade, as
intermediate inputs cross borders several times during the manufacturing process
(Feenstra, 1998). For example, automobile parts and finished autos are both included in
trade between the United States and Canada – something clearly missing in the present
context.
(Insert Table 4) Hence, going by the metric of extent of trade, South Asian nations might not qualify for a
successful RTA. In fact because of this low intra-region trade factor, Panagariya (2003)
commented that forming an RTA in South Asia would results in more trade diversion
than trade creation. Trade creation happens when more efficient producer of one country
displace the less efficient producers of another member country within Free Trade Area
(FTA). On the other hand trade diversion results in displacement of more efficient
producers outside FTA - losing market share to less efficient producers within FTA. For
example, when Bangladesh allows Indian cement to be imported duty-free and this leads
to more efficient Indian cement industry to out compete the less efficient Bangladesh
cement industry, it results in trade creation. On the other hand, duty free access to Indian
television manufacturers to Bangladesh resulting in displacement of more efficient
Japanese television manufacturers who remain subject to duty, it results in trade
diversion. As earlier these economies in South Asia were having a relatively high tariff
structure the extent of trade diversion was expected to be high. However, with falling
tariffs there is a lesser chance of trade diversion.
Country (economic) characteristics: When comparing in terms of economic structure,
namely, savings as a percentage of GDP, demographic profile and labor mobility,
SAFTA member countries have many similarities (Table 5). The industrial sector
constitutes roughly a fourth of GDP in all countries, while the share of agriculture varies
from 16 percent in Sri Lanka to almost 34 percent in Nepal. Although a majority of the
population still lives in rural areas, all of these countries are becoming increasingly
urbanized. Except for the Maldives, saving as a proportion of GDP is also similar across
these countries. These countries also share a similar demographic profile: in all these
nations, age 65 and above is a small percentage of the population (varying between 4
percent in Bangladesh to 7 percent in Sri Lanka), that is, these economies have a much
9
younger group of working population. The more similar are the economies, the more
similar is their export profile. Greater economic cooperation among SAFTA members
holds important implications in the form of larger market and economies of scale in
production. These factors might act as further incentives for a successful RTA.
(Insert Table 5) Government Policies and Symmetric Economic Activity: The encouraging point is that
most of the SAARC economies have started to open up and have also registered healthy
GDP growth. During the period 2006-2007, all SAFTA countries, except for Nepal, have
witnessed strong economic growth in the range of 7-9 percent (Table 5).11 Similarly,
despite low intra-regional SAARC trade - accounting for less than 5 percent of the
region’s overall foreign trade - it is rising. The upward trend in trade is likely to continue
with SAARC economies further reducing tariffs because of their commitment at WTO;
and per capita GDP in the region continues to grow. Presently, because of restrictions on
legitimate trade, there exists a considerable amount of extra-legal trade. For example,
Taneja (2004) estimates that the magnitudes of legal and extra-legal trade between
Bangladesh and India are roughly the same, while extra-legal trade is estimated to be
nearly one third of the value of legal trade between India and Sri Lanka. Sarvanathan
(1994) put the estimate of India’s informal exports to Sri Lanka at $142 million while
that India’s informal exports from Sri Lanka at $121 million. Estimates of the magnitude
of extra-legal trade between India and Pakistan vary from $100 million to $1 billion per
year (South Asia Development and Cooperation Report, 2001/2; Nabi and Nasim, 2001).
As McCombie and Thirlwall (1997); and Paulino and Thirlwall (2004) have pointed out,
robust economic growth encourages a more liberalized trade regime. In their study
covering OECD countries between 1958 until 1988, Baier and Bergstrand (2001), have
observed that the average level of bilateral trade grew twice as fast as a country’s GDP.
About two-fifths of the growth of trade relative to income is explained by the combined
effect of falling tariffs and transport costs. Of these, falling tariffs were twice as
important as falling transportation costs. More open economy in the South Asian region
is going to lessen trade diversion – a concern raised by Panagariya (2003).
11 Nepal witnessed a political turmoil during the period aftermath takeover of power by King Gyanendra on 1st February, 2005.
10
More importantly, South Asian countries exhibit symmetric economic activity. There is
evidence of long term co-movement in supply side components of output in the SAARC
region (Banik, Biswas and Saunders, 2006). This means that an economic boom
(recession) in one of these nations is likely to reverberate throughout the region. In fact,
this aforementioned economic characteristic of South Asian countries will enable them to
go beyond the FTA framework and work for deeper economic integration, such as
forming a common market and economic union.
Intra-SAARC trade can flourish taking advantage of their geographical proximity, rising
income and falling tariffs. As shown by McCallum (1995) in presence of borderless trade
(that is, with minimal trade related disruption) Ontario and Quebec provinces in Canada
is expected to exports about ten times as much to California as to British Columbia.
3. Trade Costs
Having ended the last section with a positive note, it makes sense to reflect on key areas
of concern hurting trade flow in the South Asian region. As is evident from the literature
(discussed in pp.2-3), success of trade liberalization (read, controlling for the policy
variables, like, tariffs and non-tariffs barriers) can be attained only when countries can
control for trade costs. In the context of in South Asia, in its 2005 report, the U.S. Trade
and Development Agency has identified major components of trade cost. Much of the
sources of trade costs result from lack of trade facilitation and lack of availability of
physical infrastructure in South Asia. For instance, logistics costs in India are among the
highest in the world (at 13 percent of GDP), and inadequate infrastructure is responsible
for holding back GDP growth by roughly 2 percent, or an annual hit of approximately
$20 billion to economic progress (Economic Times, 2008).
Issues regarding trade facilitation have been discussed in length by Wilson and Ostuki
(2007). They pointed out South Asian region needs to build upon four areas of trade
facilitation – port efficiency, customs environment, regulatory environment and service
sector infrastructures (like electronic documentation, harmonizing regulations, etc.). For
instance, port congestion because of inefficient handling of goods or lack of adequate
capacity, affects turnaround time of feeder vessels. Then there are environmental (read,
11
hygiene) related issue. For instance, Indian exporters of edible items like rice, tea etc.,
find it difficult to ship their product from the nearest port of exit. Exporters in eastern
India are forced to transport edible items by road to Kakinada - a port in Andhra Pradesh
which offers mid water loading facilities - to avoid contamination. The congested
Kolkata port handles export of iron ore and other metals scraps, items which cause
pollution (read, dust particles) and thereby expose edible items to the risk of
contamination (Banik, 2008). The loss in time adds on cost for the exporters. As
Hummels (2001) points out, for each day saved in shipping time it is equivalent to saving
0.5 percent on ad-valorem tariff.
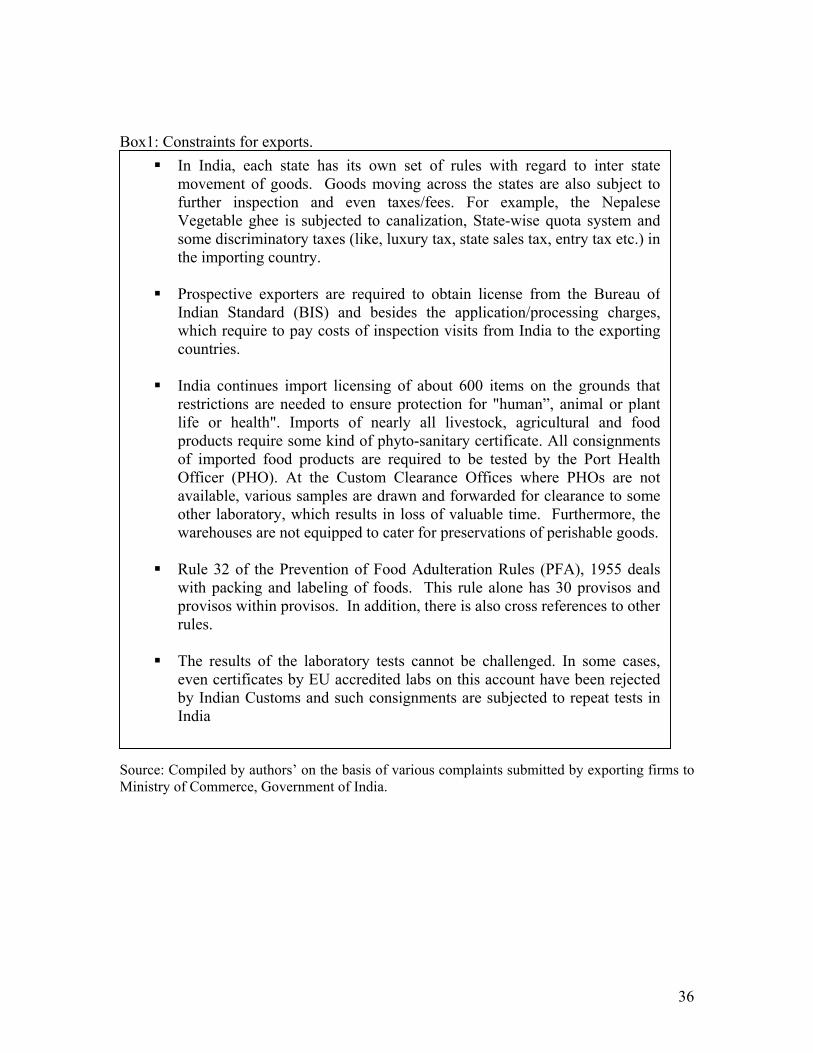
Coming back to another key element of trade facilitation, complex and nontransparent
administrative requirements (often pertaining to documentation) creates space for
corruption. Some of these administrative requirements can also be qualified as non-tariff
barriers (Box 1). At India-Bangladesh border a consignment needs at least 22
documentations, more than 55 signatures and a minimum 116 copies for the final
approval (RIS, 2004). Paying bribes is a common phenomenon. Across South Asia the
size of bribe was reported to be between 2.2 percent and 2.5 percent of firm sales (Ahmed
and Ghani, 2007). In the context of South Asia, size of bribe payments are relatively less
in India, Sri Lanka and Bhutan in comparison to Bangladesh, Pakistan and Nepal.
According to Wilson and Ostuki (2007), if countries in South Asia raise capacity building
in trade facilitation halfway to that of East Asia’s capacity, average trade is estimated to
increase by $2.6 billion. This is approximately 60 percent of the regional trade in South
Asia. The areas that will provide the greatest gains are service-sector infrastructure and
efficiency in airtime and maritime ports (Table 6).
(Insert Table 6 and Box 1) On availability of physical infrastructure, South Asia is facing a major problem. Lack of
proper infrastructure facilities indirectly raises the costs of exports. Some studies have
already commented on the importance of infrastructure in explaining variations in income
and export growth among countries (Hall and Jones, 1999; Stiglitz, 1989). Deteriorating
infrastructure due to poor physical conditions (e.g. periodic flooding, soil erosion, poor
soil conditions) has resulted in higher transport cost in South Asia (De, 2008). For
example, the average transport costs on the India (Kolkata) - Bangladesh (Petrapole)
12
route is 2543 Indian Rupees – which is about 40 percent higher than other highways in
the East Asian region (Das and Pohit, 2004). A carpet manufacture in Kathmandu
reported that because of poor roads condition he has to shell out around 100,000
Nepalese Rupees on account of vehicle maintenance (Biggs et al., 2000). Transport cost
is larger for landlocked countries like, Nepal and least for Sri Lanka (De, 2008). The
trade-weighted ad-valorem transportation costs are listed in Box 2. Higher transport cost
is bad. As pointed out by Limao and Venables (2001), doubling of transport costs can
lead to a drop in country’s trade by about 80 percent.
(Insert Box 2) Another area of concern is lack of electricity. For example, manufacturers in India on
average face almost 17 significant power outages per month versus 1 in Malaysia and less
than 5 in China. Similarly, in Pakistan, the typical business loss 5.6 percent in annual
sales revenue because of power shortage (Newbery, 2007). According to data from the
World Bank Enterprise Surveys, private businesses in lower and middle income countries
worldwide estimate that they lose on average 7.5 percent of their sales due to electricity
and telephone outages and insufficient water supply.12 This is quite high in comparison to
losing 3.8 percent average sales figure for high income countries.
Factors like poor institution and government regulation has certainly contributed in South
Asian countries not faring well when it comes to ranking countries in terms of, “easiness
of doing business”. It also takes time to enforce contract (Table 7a and 7b). The World
Bank, in its annual exercise, ranks countries in terms of easiness of doing business. In
Doing Business Report 2008, the sample size involved 178 countries. Easiness of doing
business is measured in terms of procedures (see, Box 3), time, and cost involved in
launching a commercial or industrial firm with up to 50 employees and start-up capital of
10 times the economy's per-capita gross national income (GNI).
(Insert Table 7a, 7b and Box 3) Clearly there is a need for building physical infrastructure and capacity building in terms
of trade facilitation. High public debt and shift in focus of development, more towards
social sector infrastructure, like, health and education, is leaving government resource
crunch. There is a need to tap private sector funds, especially, when there are few
12 For more on the Enterprise survey visit: http://www.enterprisesurveys.org/ExploreTopics/?topicid=8 (Accessed: 5/28/2008)
13
billionaires in corporate India.13 Unfortunately, not too much private fund is forthcoming
mainly because of regulatory reason (Banik, 2007). The government uses the “force
majeure” clause more often and, hence, does not fulfill the promises it made to private
providers at the beginning of infrastructure projects.14 For example, if, upon the
completion of a road, the projected number of vehicles is not realized, the government
can alter the agreement. Even appealing in the court is a lengthy procedure and may take
several years to settle. Some sector specific recommendations are as follows:
In the power sector, there is a need to create a market for power and this is particularly
true in the context of India where the power-surplus States can trade with the power-
deficient States. Although, private participation is allowed in power generation in India,
not many responses have been forthcoming because of lower power tariffs. Private
investors are expected to produce electricity for sale to the state electricity boards, which
would control transmission and distribution. These boards are however financially very
weak, partly because electricity tariffs for many categories of consumers, like farmers,
are too low and also because very large amounts of power are lost in the transmission and
distribution. There is a need to privatize distribution in the hope that this will overcome
the corruption that leads to the enormous distribution losses.
In railways, there is a need to correct the tilted fare structures, in which freight rates have
been set excessively high to subsidize passenger fares. There is also a need to increase
operational efficiency as there are problems with project execution. For example in India,
among the 300 projects in the 1 billion Indian Rupees and above cost category, more than
130 projects are encountering time overruns of up to 160 months. A comprehensive
review of 78 such railway projects has revealed that all suffer huge time and cost
overruns due to various problems related to land acquisition, litigation, rehabilitation,
13 India has the highest numbers of billionaires in Asia. http://www.ndtv.com/convergence/ndtv/story.aspx?id=NEWEN20080043243 (Accessed: 5/20/2008) 14 The “Force majeure” clause refers to exceptional matters or events beyond the control of either party, that is, the Government and the providers. For example, while building the Bangalore-Mysore highway in India, the promoter (Nandi Infrastructure Corridor Enterprises) was promised free land alongside the expressway, to recoup its investment cost. This promise was never fulfilled because of political factors. Delays in land acquisition, red tape and a five years legal battle have raised the estimated cost by Rupees 6 billion (KPMG Report, 2005).
14
contractors and labor (Kumar, 2005). In Bangladesh railways have a serious problem
with maintenance especially in those areas frequented by flood.
Like railways, there are problems with project execution in the road sector. National
highway development programs in India are progressing slowly, hampered by time
overruns and budgetary constraints (Table 8).
(Insert Table 8) Both civil aviation and ports have problems related to labor issues. Individual
governments need to introduce labor market reforms, something that is yet to happen in
South Asia. In India, the government also needs to address the problems associated with
encroachments, where unutilized ports and aviation authority’s lands are gradually being
taken over by local settlers.
Addressing these concerns is certainly going to increase cross border trade in South Asia,
especially in a period of falling tariffs and rising income. The region will definitely gain
through complementary investment in infrastructure and continued regulatory reform.
4. Model The original application of Newtonian law of gravity in the field of economics goes back
to the work of Tinbergen (1962); Poyhonen (1963); and Linnemann (1966), suggesting
that bilateral trade between two nations is positively related to their national income and
inversely related to the distance between them. Although backed by little economical
underpinning these earlier models became popular because of their prognostic nature in
explaining trade flow. Later, however, economists have worked on building theoretical
(microeconomic) foundation of gravity model (Anderson, 1979; Bergstrand, 1985;
Deardorff, 1998). 15
In the context of South Asia, Srinivasan and Canonero (1993) include tariffs and
exchange rate in the basic gravity model and conclude under SAFTA potential gains for
India’s trade with it’s regional partners would increase by 13 times. Considering time
period between 1968 until 1991, and ten composite commodities, the study suggests that
the effect of removal of tariffs would lead to an increase in trade that is 3 percent of GNI
for India, 7 percent for Pakistan, 21 percent for Bangladesh, 36 percent for Sri Lanka and
15 For more discussion on the theory of gravity model see, Anderson and van Wincoop (2004).
15
59 percent for Nepal. This study considered five countries from South Asia and their
major trading partners, spanning North America, Europe and Asia. Since the objective of
this present paper is to look at trade cost in the context of South Asian region only, we
have considered trade flow within South Asia. Besides, working with a more recent data
set, we have also incorporated trade costs as an additional variable in our gravity
equation.
Methodology and Data: Following, Anderson and van Wincoop (2004), most estimated
gravity equations in the literature take the following form:
‡”1=
21 +)ln(++=M
mij
mijmjiij εzβyαyαx
where, is the log of exports from country i to country j, and are the log of GDP
of the exporting and importing country and is a set of observables to
which bilateral trade barriers are related. is the disturbance term.
ijx iyij
y
mijz ),,1=( Mm K
ijε
For the purpose of our study, following Frankel and Wei (1993), we will estimate a
variant of the above equation which takes the following form: tijij
tij
tij
tij
tj
ti
tj
ti
tij eDαTCαERαTαIIαpypyαx +++++)×(+)×(= 654321
where, and are the per capita income (read, per capita GDP) of country i and j;
and are the state of infrastructure captured through infrastructure index in country i
and j; and are the bilateral tariff rates (weighted average) and exchange rates
between country i and j; denotes the transaction cost of trade (measured as a
function of difference between weighted average cif and fob price); and finally
stands for country specific dummy variables. All the variables (except
for the dummy variables) are expressed in log form with the estimated coefficients
interpreted in terms of elasticity.
tipy t
jpy
tiI t
jI
tijT t
ijER
tijTC
ijD )4,,1=( Kj
The expected sign for 1α and 2α are assumed to be positive. Trade between countries is
expected to increase with a higher per capita income and with a better state of
infrastructure. Likewise, inter-country trade is likely to fall with higher tariffs, higher
16
price of exports, and trade costs. Accordingly, ,3α 4α and 5α are expected to be
negative.
As we are considering panel framework, the term captures both country specific
(cross sectional) and temporal effects at time t. A general expression for is:
, where, can be thought of country specific intercept;
tije
tije
tjitjtije ,,ηµβγ +++= 1-+ jβγ tµ
capture time effect and tji ,,η the over all purely random disturbance term.16 The
combined, time and country specific fixed effect terms, eliminates omitted variables bias
arising both from unobserved variables that are constant over time and from unobserved
variables that are constant across countries.
If is observed for all countries, then the entire model can be treated as an ordinary
linear model and fit by least squares. For the purpose of estimation we consider the
classic pool, least square dummy variable model (LSDV) and the within transformation
model. If contains only a constant term, then the ordinary least squares estimation
provides consistent and efficient estimates of the common intercept terms and the slope
vectors. This is a classic pool model where modeling is done without dummy variables.
However, not considering country specific time invariant characteristics seem
unscientific and hence use of country specific dummies to capture such effect. This is
LSDV model. However, the problem with modeling in this fashion is loss in degrees of
freedom arising from estimating dummy coefficients. A more efficient way is to use
within transformation model. Here the pooled regression is re-formulated in terms of
deviation from the series means leading to disappearance of the intercept terms and the
dummies. This model is more efficient than models with dummy variables as it gives n
degrees of freedom (corresponding to relevant dummies and the intercept term) back with
same parameter estimates. Finally, we consider the random effect model. Unlike, in the
fixed effect, where the country specific intercept, , is assumed to be fix, in random
effect model, we assume that it is a random variable with a mean value (say),
1-+ jβγ
1-+ jβγ
1-+ jβγ
λβγ =+
16 The use of is to avoid dummy variable trap. 1-jβ
17
which does not vary across cross section. The intercept value for each cross section can
be expressed as , where , is a white noise process. ij ελλ += 11 iε
For each one of these variables superscript t stands for the time period 1995-2006. This is
the period when considerable amount of reforms process have been undertaken or
accomplished in the South Asian region. Country i is India (the base country) and country
j stands for India’s trading partners in South Asia. The reason for treating India as the
base country (denoted by subscript i) is because it is the largest economy in the region,
representing 80 percent of the total GDP in South Asia (International Financial Statistics
Yearbook, 2007). The dummy variables is expected to capture India’s trade relation with
partner countries in South Asia
For deriving infrastructure index, we have used Principal Component Analysis (PCA)
methodology. PCA involves finding that relationship between the variables that explains
the maximum possible variation in the total data. An attempt has been made here to
construct a single composite index of infrastructure involving all five subcategories of
infrastructure – roads, railways, air, electricity and telephones – at each point in time. In
the PCA approach, the first principal component is that linear combination of weighted
indicators, which explains the maximum of variance across the observations at a point in
time. To the extent one component index of infrastructure has a different variance than
another, assigning equal weights, or doing simple average of different component
indexes, seem unscientific; and hence the importance of assigning different weights to
different component indexes of infrastructure. Each factor is nothing but a linear
weighted combination of the various variables used. In all the indices calculated, we used
the first factor only. The first factor in all the cases, explained more than 60 percent of the
variation. Before multiplying by the respective weights, individual infrastructure
variables are converted into ‘unit-free’ values. This is done by dividing country-wise
(that is, column-wise) standard deviation to neutralize the heterogeneity due to varied
units. Standardization also eliminates unnecessary weights given to some measures on
account of their high unit values.
Therefore, Infrastructure Index (Iit) is a linear combination of the unit free values of the
individual facilities such that:
Iit = ∑Wkt Xkit
18
where, Iit = Infrastructure index of the i-th country in t-th time,
Wkt = weight of the k-th type infrastructure in t-th time,
and Xkit = unit free value of the k-th type infrastructure for the i-th country in t-th time
point.
Finally, corresponds to the ratio (cif/fob-1), which as pointed out by Limao and
Venables (2001), contain cross sectional variation in transport costs, and calculating
transaction cost in this fashion is quite consistent with those obtained from the shipping
cost data.
tijTC
Now some comments about the methodology issue. The single equation way of
estimation might raise some issues relating to endogenity. However, intra-SAARC trade
is low. In addition if one consider bilateral trade flow as a percentage of GDP, it is
actually quite less. Endogenity is therefore ignore and is not expected to results in any
biased estimates. Similarly, as is observed in Table 9, robustness of the model have
increased moving from classic pool to LSDV and finally to within transformed fixed
effect. This is because the consistency problem specific to the time invariant factors do
not arise in case of within transformed fixed effect. Almost for the same reason we have
not considered dynamic panel. When the number of time periods T is finite and the
number of cross section N approaches infinity, LSDV estimators are inconsistent for
dynamic panel. Although we have worked with finite N in the present case, but
considering applicability of the present model, and more importantly to compare our
results with other studies done with respect to other geographical areas, we stick to the
static panel framework. As N in our case is small, generalized method of moments
(GMM) estimation techniques, which is expected to yield more consistent estimates in
presence of infinite N, is also not considered.17 Accordingly, we have used and report
results from classic pool, LSDV, within transformed fixed effect and random effect
model.
Data Source: Trade between countries is from United Nations COMTRADE database.
Trade figures are reported in current USA dollars for each country and all its trading
partners. The data are available annually and is deflated with GDP deflator. Because we 17 For more on the application of GMM techniques in the context of gravity equation see, Arellano and Bond, (1991); and Blundell and Bond, (1998). It is widely acknowledged use of GMM techniques in presence of less number of N may increase the finite sample bias.
19
didn’t find enough data on respective variables that we have considered for our study, we
have dropped Bhutan, Nepal, and Maldives, from our analysis. In total we have 48
observations, where we considered India’s exports (in value term) to Bangladesh, Nepal,
Pakistan and Sri Lanka, for the period between 1995 until 2006. Regarding tariffs, the
figures are effective tariffs. These are average tariffs and include import and export
duties. The data on tariffs come from COMTRADE database.
Exchange rate data are bilateral exchange rates between India and its trading partners. We
are measuring exchange rate as foreign currencies per unit of domestic currency.
Exchange rates data are collected from International Financial Statistics Yearbook,
International Monetary Fund.
For constructing the infrastructure index, we considered railway lines (in kilometer) as a
proportion of total surface area; road length (in kilometer) as a proportion of total surface
area; air transport, passengers carried (normalized with respect to number of airports with
paved runways for each country); fixed line and mobile phone subscribers (per 100
people) and electric power consumption (in kilowatt per capita). Normalizing respective
variables in this fashion (that is, in per capita term or with respect to country size) is
expected to avoid possible heteroscedasticity in error term. The variables on
infrastructure are collected from World Development Indicators Database, World Bank.
Results: The results have come out with expected sign (may be, except for the dummy
variables) and the significance of the estimates have increased (read, more robust) as we
have moved from classic pool, towards more efficient methodology of LSDV and within
transformed LSDV (Table 9). Importantly, the trade costs variable, have statistically
significant coefficients in three out of four cases. Based on our estimates, we find the
income elasticity of India’s exports varied between 0.369434 and 0.590614. That is, if we
take the income coefficient to be 0.369434, we are saying that for a 100 percent increase
in combined per capita GDP, exports from India will increase by 29 percent (that is,
20.369434 – 1 = 29). Similarly coefficients with respect to trade cost varies between
-0.794491 to -0.498930, which is to say, for 100 percent increase in trade cost, exports
from Indian to neighboring Asia is expected to fall by 73 percent and 42 percent
respectively. Our estimates of income and trade cost are slightly lower than the estimated
value by, Baier and Bergstrand (2001), and Anderson and van Wincoop (2004). One
20
reason is that we dealt with gross exports figure and not commodity specific data. There
can be measurement error. As pointed out by Hummels and Lugovskyy (2006), the
measure of trade cost can become biased if high transport cost countries systematically
import lower transport cost goods (see also, De, 2008). However, the main objective of
this present paper was to identify the importance of trade costs, among other factors, like
price, infrastructure, income and tariffs, more from a macro perspective. We have already
documented various elements of trade costs and through our empirical results it become
evident that it is indeed one of the important variables affecting trade flow among South
Asian nations. Indian exports are also quite price sensitive. An expected increase in price
of Indian exports by 100 percent is going to reduce demand by a whopping 600 percent
(see, within transformed column). It makes sense, as most export items in the context of
South Asia typically comprises of low technology intensive (price sensitive) items, a little
increase in price (through exchange rate pass-through) will have a huge impact on
demand. However, in general exchange rate data does not come out to be that robust. The
dummy variables, capturing country specific trading relation with India has come with
negative signs which in some way reflect the no trade pact attitude between India and
Pakistan. Finally, one of the coefficients on infrastructure variable has also turned to be
significant, reiterating the need for building physical infrastructure in the region.
(Insert Table 9) 5. Policy Recommendations and Conclusion
As is evident from the above analysis, income and trade costs are important factors so far
as intra flow of SAARC trade is concerned. Since income in the region is increasing, and
SAARC member nations are also depicting symmetric economic activities it makes sense
to reduce trade cost. However, unlike tariffs measures which are easy to lower,
controlling for trade costs will take time and requires some commitments at policy level.
The benefit of falling tariffs, geographical proximity, and similarities in economic
factors, can be leveraged more if some steps are taken at the policy level. The following
measures need to be considered for enhancing trade flow in the region:
(a) Granting of transit facilities for movement of goods, services, and energy, through
their own territories but originating from neighboring countries. At present, Bangladesh
21
does not allow its territory for transporting goods from North Eastern Indian States to
mainland India. Similarly, despite having huge reserves of natural gas, Bangladesh does
not trade in energy with India because of lack of adequate infrastructure and political
unwillingness. Again, there is no simple way to transfer goods from Kolkata in India, to
neighboring Dhaka in Bangladesh. In the border town in Bangladesh, the trains run on
metre-gauge, while in India they run on broad-gauge. Similarly, India had an issue with
Pakistan to allow shipment of gas from Iran through Afghanistan.
(b) There is a need to liberalize trade and investment measures in services. Because of
lack of adequate physical infrastructure services exports in the South Asian region (which
are less dependent on infrastructure) are performing well compared to its manufactured
exports (which are more dependent on infrastructure). While commenting on the sources
of growth, Ahmed and Ghani (2007) found that for the period between 1995-2003
exports of services from South Asia grew at 14 percent per annum compared to less than
8 percent for East Asia. India and Bangladesh have performed well in areas of selling
computers and information communication, while, Pakistan has excelled in the area of
transport services and Sri Lanka in travel services. These nations can therefore further
built on areas of competitive strength by liberalizing investment and trade in services.
(c) Transfer of fund from the economically advance region to economically poor regions,
to help the laggard regions modernize and diversify their economies. A reason for
European Union (EU) becoming success story is not only the member countries removed
tariff and quota restrictions but also transferred fund to less developed countries in the
region. For example, Poland has been allocated a sum of $27 billion over the next three
years to modernize and diversify its economy. In this way, India can aid releasing some
supply side constraints that currently these smaller economies in South Asia are facing.
On a similar note, India also stands to gain by extending unilateral duty free and quota
free access to its market for products from least developed countries, like Bangladesh.18
Ability to sell in the Indian market will give these countries necessary purchasing power
which in turn can be spent on purchasing Indian goods.
(d) Reducing the number of negative lists. India’s negative list in the context of SAFTA
is larger than that in some of its bilateral free trade agreements, and almost four times as
18 India already has unilateral free trade arrangements with Bhutan and Nepal.
22
large as its latest offer in the negotiation for a free trade area with Association of
Southeast Asian Nations (ASEAN). For instance, India subjects 15 out of top 20 Sri
Lanka’s exports to either a tariff rate quota (meaning the tariff preferences applies only
up to a pre specified quantity of imports) or negative list (Baysan et al., 2004). Similarly,
out of 319 items on which Sri Lanka offered concessions of zero duty to India only three
items are actually exported to Sri Lanka (Weerakoon, 2001).
And lastly, (f) further easing of political differences with respect to India and Pakistan.
Issue relating to Kashmir always comes into forefront whenever some economic
decisions need to be taken. Because of political difference member countries have simply
refused to participate in mutually gainful situation, leave alone, trying to give any
unilateral concession.
23
References
1. Agosin, M. (1991), ‘Trade policy reform and economic performance: a review of
the issues and some preliminary evidence’, UNCTAD Discussion Papers, No. 41,
Geneva, Switzerland.
2. Anderson, J. E. (1979), ‘A theoretical foundation for the gravity equation’,
American Economic Review, 69, pp. 106-116.
3. Anderson, J.E and van Wincoop, E. (2004), ‘Trade costs’, Journal of Economic
Literature, XLII, pp.691-751.
4. Arellano, M. and Bond, S.R. (1991), ‘Some tests of specification for panel data:
Monte Carlo evidence and an application to employment equations’, Review of
Economic Studies, 58, pp. 277-297.
5. Baier, S. L. and Bergstrand, H. J. (2001), ‘The growth of world trade: tariffs,
transport costs and income similarity’, Journal of International Economics, 53:1
pp. 1-27.
6. Banik, N. (2008), ‘India’s trade agenda - dil mange more!’, Reuters, Available at:
http://in.reuters.com/article/globalCoverage3/idINIndia-33732020080523
(Accessed: 5/25/2008).
7. Banik, N. (2007), ‘India’s exports: Is the bull run over?’, Asia-Pacific Trade and
Investment Review, 3:2, pp. 47-66.
8. Banik, N., B. Biswas, and Saunders, P. (2006), ‘An optimum currency area in
South Asia: Is it plausible?’, Journal of World Trade, 40:3, June, pp.387-405.
9. Baysan, T., A., Panagariya, and Nihal, P. (2004), ‘Preferential trading in South
Asia’, Background Technical Paper, South Asia, Washington DC: World Bank.
10. Bergstrand, J. H. (1985), ‘The gravity equation in international trade: some
microeconomic foundations and empirical evidence’, Review of Economics and
Statistics, 67, pp. 474-81
11. Bertola, G. and Faini, R. (1991), ‘Import demand and non-tariff barriers: the
impact of trade liberalization’, Journal of Development Economics, 34, pp.269-
286.
24
12. Biggs, T., J. Nasir, K. Pandey, and Zhao, L., (2000), ‘Pilot investment climate
assessment: the business environment and manufacturing performance in Nepal’,
Report, World Bank Regional Program for Enterprise Development and
Federation of Nepalese Chambers of Commerce and Industry, Washington DC.
13. Blundell, R.W. and Bond, S.R. (1998), ‘Initial conditions and moment restrictions
in dynamic panel data models’, Journal of Econometrics, 87, pp. 115-143.
14. Chuang, C. (1998), ‘Learning by doing, the technology gap, and growth’,
International Economic Review, 39, pp. 697-721.
15. Clarke, R. and Kirkpatrick, C. (1992), ‘Trade policy reform and economic
performance in developing countries: assessing the empirical evidence’, in (R.
Adhikari, C. Kirkpatrick and J. Weiss, eds.), Industrial and trade policy reform in
developing countries, Manchester: Manchester University Press.
16. Das S. and Pohit, S. (2004), ‘Quantifying transport, regulatory and other costs of
India-Bangladesh trade’, National Council of Applied Economic Research, New
Delhi.
17. De, P. (2008), ‘Trade transportation costs in South Asia: An empirical
investigation’, Working Paper, Asian Development Bank Institute, Tokyo.
18. Deardorff, A. (1998), ‘Determinants of Bilateral Trade: Does Gravity Work in a
Neo-Classical World?’ in: Regionalization of the World Economy, J. Frankel
(ed.), University of Chicago Press, Chicago.
19. Djankov, S., R. L. Porta, F. L. Silanes, and Shleifer A. (2002). ‘The regulation of
entry’, Quarterly Journal of Economics, 117:1, pp. 1-37.
20. Eaton, J. and Kortum S. (2002), ‘Technology, geography and trade’,
Econometrica, 70:5, pp. 1741-1749.
21. Economic Times, (2008), ‘Infrastructure woes may hit economic progress’,
Available at: http://developed-india-
mission2020.blogspot.com/2008/01/infrastructure-woes-may-hit-economic.html
January 7, (Accessed: 5/25/2008).
25
22. Evans, C. L. (2001), ‘The costs of outsourcing’, mimeo, Federal Reserve Bank of
New York.
23. Feenstra, R. C. (1998), ‘Integration of trade and disintegration of production in
the global economy’, Journal of Economic Perspectives, 12:4, pp.31-50.
24. Feder, G. (1983), ‘On exports and economic growth’, Journal of Development
Economics, 12, pp. 59-73.
25. Frankel, J. A. (1997), ‘Regional trading blocs in the world trading system’,
Washington, DC: Institute of International Economics.
26. Frankel, J. A. and Wei, S. J., (1993) ‘Trading Blocs and Currency Blocs’, NBER
Working Paper No. 4335.
27. Hall, E.R. and Jones, I.C. (1999), ‘Why do some countries produce so much more
output per workers than other?’ Quarterly Journal of Economics, 114, pp. 83-116.
28. Helpman, E. and Krugman, P. (1985), ‘Increasing returns, imperfect competition,
and international trade’, Cambridge, MIT Press.
29. Hummels, D. (2001), ‘Towards a geography of trade costs’, Working Paper,
Purdue University, West Lafayette.
30. Hummels, D. and Lugovskyy, V. (2006), ‘Are matched partner trade statistics a
usable measure of transportation costs?’, Review of International Economics,
14:1, pp. 69-86.
31. International Monetary Fund (IMF). (2007), ‘International Financial Statistics
Yearbook’, Washington, DC: IMF.
32. Joshi, V. and Little, I. M. D. (1996), ‘India’s economic reforms 1991-2001’,
Oxford: Oxford University Press.
33. Kohli, U. (1991), ‘Technology duality and foreign trade’, Ann Arbor: University
of Michigan Press.
34. KPMG Report (2005), ‘Public private partnership in Indian infrastructure’, New
Delhi, India.
26
35. Kumar, S. (2005), ‘Indian railways: a turnaround story’, paper presented at the
Associated Chambers of Commerce and Industry of India Seminar on Rail Freight
Corridor, New Delhi, 30 June.
36. Leamer, E. (1984), ‘Sources of comparative advantage: theory and evidence’,
Cambridge, MIT Press.
37. Linneman, H. (1966), ‘An econometric study of international trade flows’,
Amsterdam: North Holland, 1966.
38. Limao, N. and Venables, A. J. (2001), ‘Infrastructure, geographical disadvantage,
transport costs, and trade’, The World Bank Economic Review, 15, pp. 451-479.
39. McCallum, J. (1995), ‘National borders matter: Canada-U.S. regional trade
patterns’, American Economic Review, 85:3, pp. 615-623.
40. McCombie, J. and Thirwall, A.P. (1997), ‘The dynamic foreign trade multiplier
and the demand oriented approach to economic growth: an evaluation’,
International Review of Applied Economics, Vol 11, 5-26.
41. Nabi, I. and Nasim, A. (2001), ‘Trading with the enemy: A case for liberalizing
Pakistan-India trade’, in The Regionalism and Globalization, eds., Sajal Lahiri,
pp. 170–98, New York: Routledge.
42. Newbery, D. (2007), ‘Power sector reform, private investment, and regional
cooperation’, in a report titled, ‘South Asia: growth and regional integration’,
Washington DC: World Bank.
43. Newfarmer, R. and Pierola, M. D. (2006) ‘SAFTA: promise and pitfalls of
preferential trade agreements’, Mimeo, Washington DC: World Bank.
44. Panagariya, A. (2003), ‘South Asia: Does Preferential Trade Liberalization Make
Sense’, World Economy, 26:9, pp. 1279-1291.
45. Paulino, A. and Thirlwall, A. P. (2004), ‘The impact of trade liberalization on
exports, imports and the balance of payments of developing countries’, The
Economic Journal, 114, pp. 50-72.
46. Poyhonen, P., (1963), ‘A tentative model for volume of trade between countries’,
Welwirtschaftliches Archiv, 90: 1, pp. 93-99.
27
47. Rauch, J. E. and Trindade V. (2002), ‘Ethnic Chinese networks in international
trade’, Review of Economics and Statistics, 84:1, pp. 116-130.
48. Rose, A. K. and van Wincoop E. (2001), ‘National money as a barrier to trade: the
real case for currency union’, American Economic Review Paper Proceed, 91:2,
pp. 386-390.
49. Sadiq A. and E. Ghani (2007), ‘South Asia’s growth and regional integration’, in
a report titled, ‘South Asia: growth and regional integration’, Washington DC:
World Bank.
50. Sarvananthan, M., 1994, ‘Contraband trade and unofficial capital transfers
between Sri Lanka and India’, Economic and Political Weekly, 23 July.
51. South Asia Development and Cooperation Report, 2001-02, (New Delhi:
Research and Information System for the Non-Aligned and Other Developing
Countries).
52. Srinivasan, T. and Canonero, G. (1993), ‘Preferential trade arrangements:
estimating the effects on South Asian countries’, South Asia region discussion
paper series, IDP#142.
53. Stiglitz, J. (1989), ‘Rational peasants, efficient institutions, and a theory of rural
organization: methodological remarks for development economics’, in P. Bardhan
(ed.), The economic theory of agrarian institutions (Oxford: Clarendon Press), 18-
29.
54. Taneja, N., (2004) ‘Informal trade in SAARC region’, Economic and Political
Weekly, pp. 5367-5371, December.
55. Tinbergen, J. (1962), ‘Shaping the world economy: suggestions for an
International Economic Policy, New York.
56. United Nations (2004), ‘Industrial Commodity Statistics Yearbook’, New York:
Dept. of Economic & Social Affairs, United Nations.
57. United States Trade and Development Agency (2005), ‘Preliminary country
briefing report’, South Asia Transport and Trade Facilitation Conference,
October.
28
58. Weerakoon, D., (2001), ‘Indio-Sri Lanka free trade agreement: how free is it?’,
Economic and Political Weekly, pp. 627–629, February.
59. Wilson, J. S., and Ostuki T. (2007) ‘Cutting trade costs and improved business
facilitation in South Asia’, in a report titled, ‘South Asia: growth and regional
integration’, Washington DC: World Bank. Available at:
http://siteresources.worldbank.org/SOUTHASIAEXT/Resources/Publications/448
813-1171648504958/SAR_integration_ch9.pdf
60. World Bank (2008), ‘Doing Business Report – 2008’, Washington, DC.
61. World Development Indicators Online (WDI), Available at:
http://web.worldbank.org/WBSITE/EXTERNAL/DATASTATISTICS/0,,content
MDK:20398986~menuPK:64133163~pagePK:64133150~piPK:64133175~theSit
ePK:239419,00.html , World Bank.
29
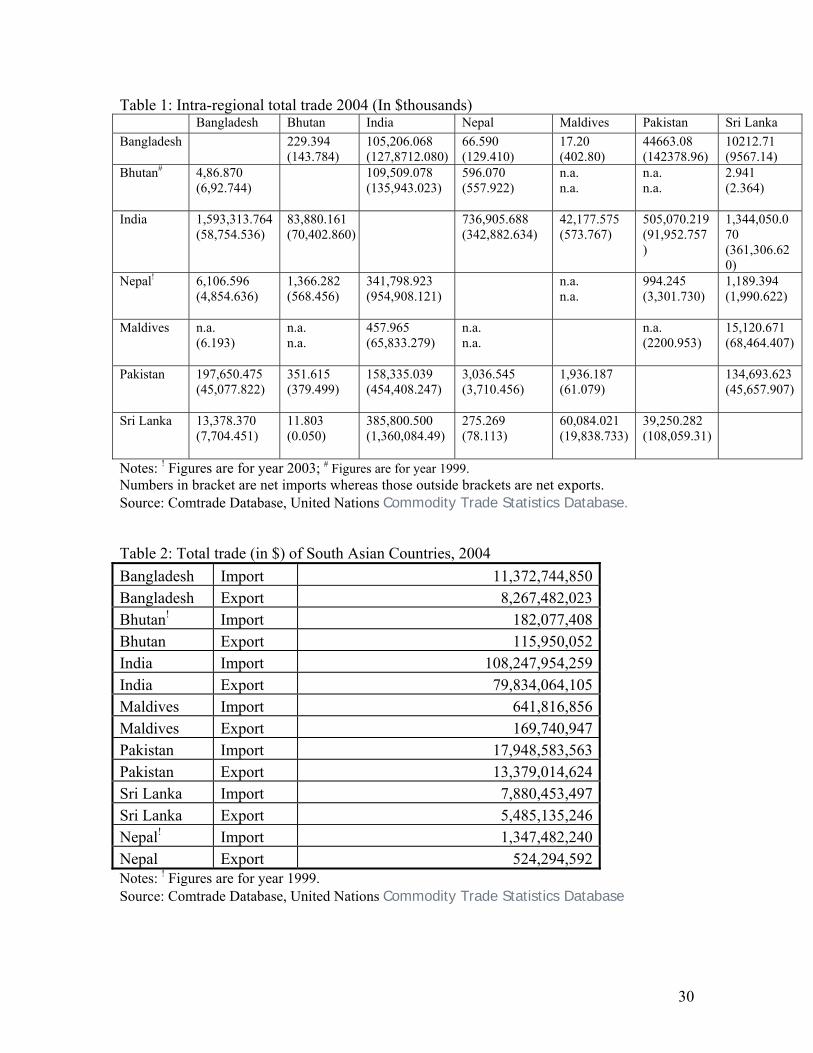
Table 1: Intra-regional total trade 2004 (In $thousands) Bangladesh Bhutan India Nepal Maldives Pakistan Sri Lanka Bangladesh 229.394
(143.784) 105,206.068 (127,8712.080)
66.590 (129.410)
17.20 (402.80)
44663.08 (142378.96)
10212.71 (9567.14)
Bhutan# 4,86.870 (6,92.744)
109,509.078 (135,943.023)
596.070 (557.922)
n.a. n.a.
n.a. n.a.
2.941 (2.364)
India 1,593,313.764 (58,754.536)
83,880.161 (70,402.860)
736,905.688 (342,882.634)
42,177.575 (573.767)
505,070.219 (91,952.757)
1,344,050.070 (361,306.620)
Nepal! 6,106.596 (4,854.636)
1,366.282 (568.456)
341,798.923 (954,908.121)
n.a. n.a.
994.245 (3,301.730)
1,189.394 (1,990.622)
Maldives n.a. (6.193)
n.a. n.a.
457.965 (65,833.279)
n.a. n.a.
n.a. (2200.953)
15,120.671 (68,464.407)
Pakistan 197,650.475 (45,077.822)
351.615 (379.499)
158,335.039 (454,408.247)
3,036.545 (3,710.456)
1,936.187 (61.079)
134,693.623 (45,657.907)
Sri Lanka 13,378.370 (7,704.451)
11.803 (0.050)
385,800.500 (1,360,084.49)
275.269 (78.113)
60,084.021 (19,838.733)
39,250.282 (108,059.31)
Notes: ! Figures are for year 2003; # Figures are for year 1999. Numbers in bracket are net imports whereas those outside brackets are net exports. Source: Comtrade Database, United Nations Commodity Trade Statistics Database. Table 2: Total trade (in $) of South Asian Countries, 2004 Bangladesh Import 11,372,744,850 Bangladesh Export 8,267,482,023 Bhutan! Import 182,077,408 Bhutan Export 115,950,052 India Import 108,247,954,259 India Export 79,834,064,105 Maldives Import 641,816,856 Maldives Export 169,740,947 Pakistan Import 17,948,583,563 Pakistan Export 13,379,014,624 Sri Lanka Import 7,880,453,497 Sri Lanka Export 5,485,135,246 Nepal! Import 1,347,482,240 Nepal Export 524,294,592 Notes: ! Figures are for year 1999. Source: Comtrade Database, United Nations Commodity Trade Statistics Database
30
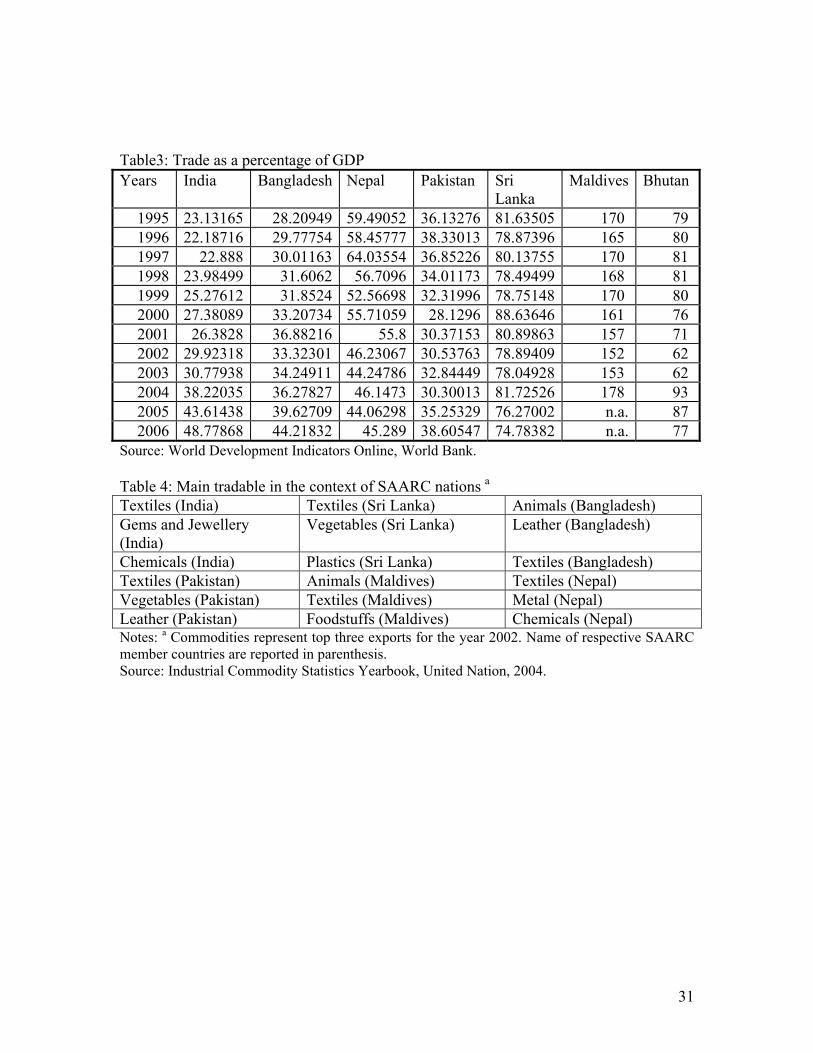
Table3: Trade as a percentage of GDP Years India Bangladesh Nepal Pakistan Sri
Lanka Maldives Bhutan
1995 23.13165 28.20949 59.49052 36.13276 81.63505 170 79 1996 22.18716 29.77754 58.45777 38.33013 78.87396 165 80 1997 22.888 30.01163 64.03554 36.85226 80.13755 170 81 1998 23.98499 31.6062 56.7096 34.01173 78.49499 168 81 1999 25.27612 31.8524 52.56698 32.31996 78.75148 170 80 2000 27.38089 33.20734 55.71059 28.1296 88.63646 161 76 2001 26.3828 36.88216 55.8 30.37153 80.89863 157 71 2002 29.92318 33.32301 46.23067 30.53763 78.89409 152 62 2003 30.77938 34.24911 44.24786 32.84449 78.04928 153 62 2004 38.22035 36.27827 46.1473 30.30013 81.72526 178 93 2005 43.61438 39.62709 44.06298 35.25329 76.27002 n.a. 87 2006 48.77868 44.21832 45.289 38.60547 74.78382 n.a. 77
Source: World Development Indicators Online, World Bank. Table 4: Main tradable in the context of SAARC nations a
Textiles (India) Textiles (Sri Lanka) Animals (Bangladesh) Gems and Jewellery (India)
Vegetables (Sri Lanka) Leather (Bangladesh)
Chemicals (India) Plastics (Sri Lanka) Textiles (Bangladesh) Textiles (Pakistan) Animals (Maldives) Textiles (Nepal) Vegetables (Pakistan) Textiles (Maldives) Metal (Nepal) Leather (Pakistan) Foodstuffs (Maldives) Chemicals (Nepal) Notes: a Commodities represent top three exports for the year 2002. Name of respective SAARC member countries are reported in parenthesis. Source: Industrial Commodity Statistics Yearbook, United Nation, 2004.
31
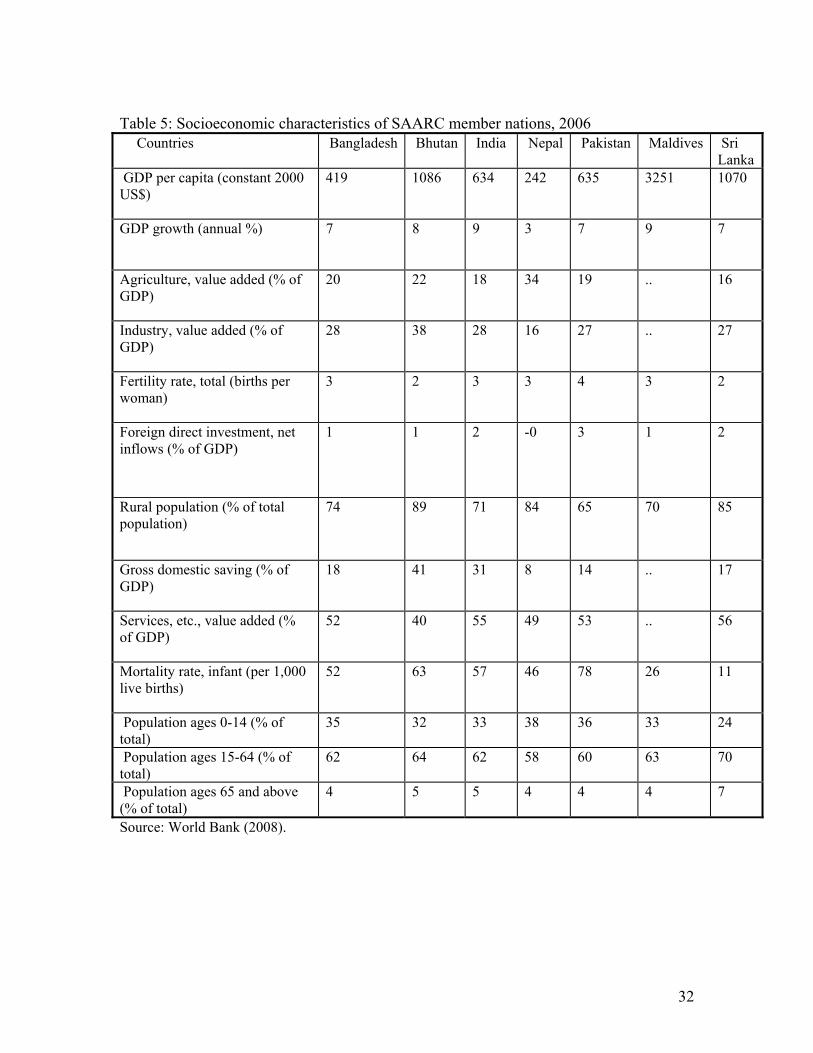
Table 5: Socioeconomic characteristics of SAARC member nations, 2006 CoCountries Bangladesh Bhutan India Nepal Pakistan Maldives Sri
Lanka GDP per capita (constant 2000 US$)
419 1086 634 242 635 3251 1070
GDP growth (annual %) 7 8 9 3 7 9 7
Agriculture, value added (% of GDP)
20 22 18 34 19 .. 16
Industry, value added (% of GDP)
28 38 28 16 27 .. 27
Fertility rate, total (births per woman)
3 2 3 3 4 3 2
Foreign direct investment, net inflows (% of GDP)
1 1 2 -0 3 1 2
Rural population (% of total population)
74 89 71 84 65 70 85
Gross domestic saving (% of GDP)
18 41 31 8 14 .. 17
Services, etc., value added (% of GDP)
52 40 55 49 53 .. 56
Mortality rate, infant (per 1,000 live births)
52 63 57 46 78 26 11
Population ages 0-14 (% of total)
35 32 33 38 36 33 24
Population ages 15-64 (% of total)
62 64 62 58 60 63 70
Population ages 65 and above (% of total)
4 5 5 4 4 4 7
Source: World Bank (2008).
32
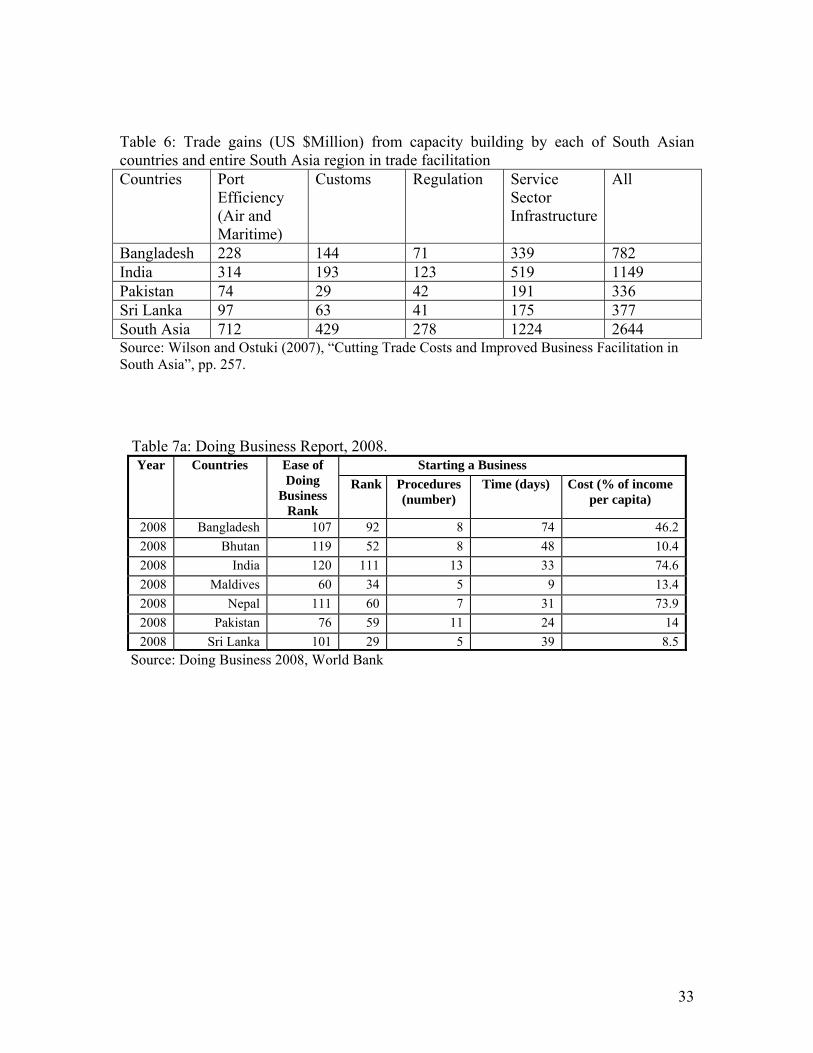
Table 6: Trade gains (US $Million) from capacity building by each of South Asian countries and entire South Asia region in trade facilitation Countries Port
Efficiency (Air and Maritime)
Customs Regulation Service Sector Infrastructure
All
Bangladesh 228 144 71 339 782 India 314 193 123 519 1149 Pakistan 74 29 42 191 336 Sri Lanka 97 63 41 175 377 South Asia 712 429 278 1224 2644 Source: Wilson and Ostuki (2007), “Cutting Trade Costs and Improved Business Facilitation in South Asia”, pp. 257.
Table 7a: Doing Business Report, 2008.
Source: Doing Business 2008, World Bank
Starting a Business Year Countries Ease of Doing
Business Rank
Rank Procedures (number)
Time (days) Cost (% of income per capita)
2008 Bangladesh 107 92 8 74 46.22008 Bhutan 119 52 8 48 10.42008 India 120 111 13 33 74.62008 Maldives 60 34 5 9 13.42008 Nepal 111 60 7 31 73.92008 Pakistan 76 59 11 24 142008 Sri Lanka 101 29 5 39 8.5
33
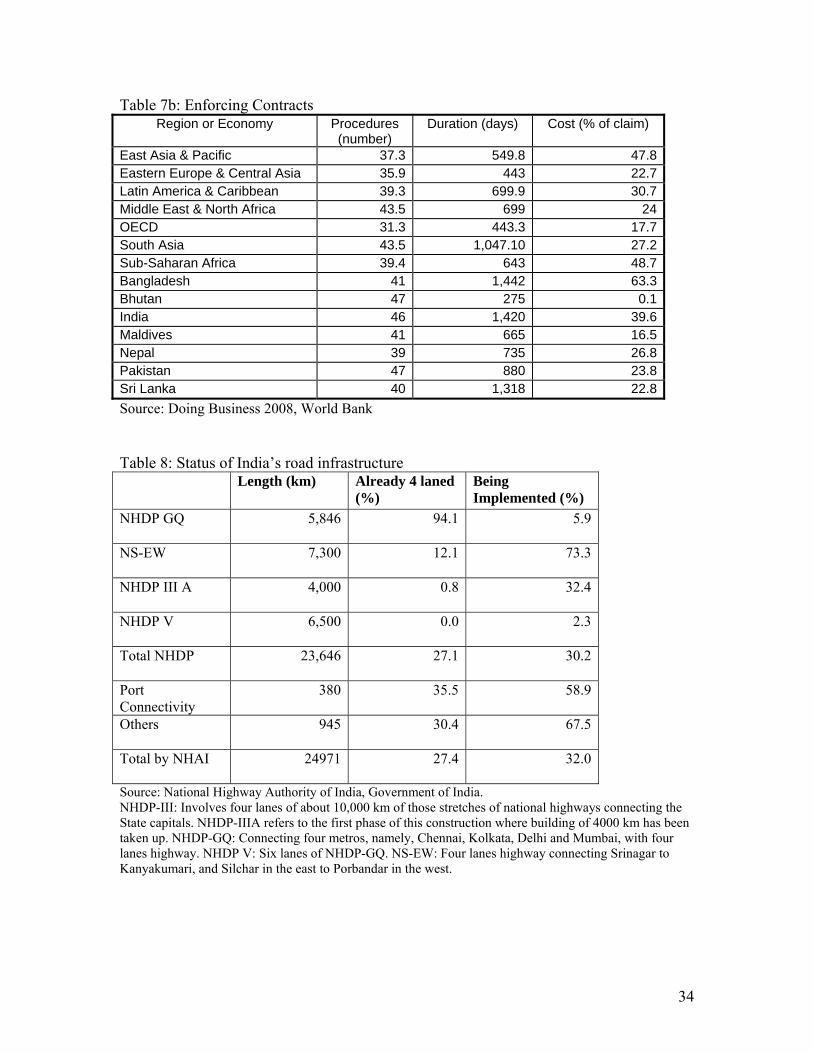
Table 7b: Enforcing Contracts Region or Economy Procedures
(number) Duration (days) Cost (% of claim)
East Asia & Pacific 37.3 549.8 47.8Eastern Europe & Central Asia 35.9 443 22.7Latin America & Caribbean 39.3 699.9 30.7Middle East & North Africa 43.5 699 24OECD 31.3 443.3 17.7South Asia 43.5 1,047.10 27.2Sub-Saharan Africa 39.4 643 48.7Bangladesh 41 1,442 63.3Bhutan 47 275 0.1India 46 1,420 39.6Maldives 41 665 16.5Nepal 39 735 26.8Pakistan 47 880 23.8Sri Lanka 40 1,318 22.8Source: Doing Business 2008, World Bank
Table 8: Status of India’s road infrastructure Length (km) Already 4 laned
(%) Being Implemented (%)
NHDP GQ 5,846 94.1 5.9
NS-EW 7,300 12.1 73.3
NHDP III A 4,000 0.8 32.4
NHDP V 6,500 0.0 2.3
Total NHDP 23,646 27.1 30.2
Port Connectivity
380 35.5 58.9
Others 945 30.4 67.5
Total by NHAI 24971 27.4 32.0
Source: National Highway Authority of India, Government of India. NHDP-III: Involves four lanes of about 10,000 km of those stretches of national highways connecting the State capitals. NHDP-IIIA refers to the first phase of this construction where building of 4000 km has been taken up. NHDP-GQ: Connecting four metros, namely, Chennai, Kolkata, Delhi and Mumbai, with four lanes highway. NHDP V: Six lanes of NHDP-GQ. NS-EW: Four lanes highway connecting Srinagar to Kanyakumari, and Silchar in the east to Porbandar in the west.
34
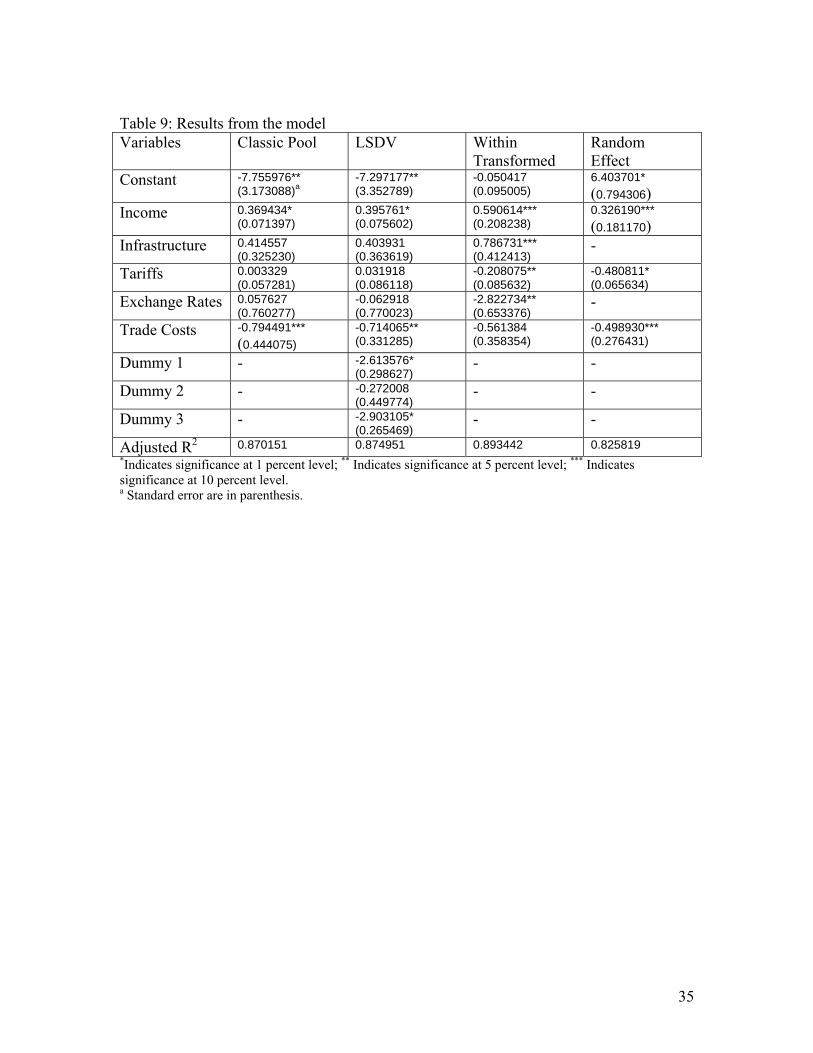
Table 9: Results from the model Variables Classic Pool LSDV Within
Transformed Random Effect
Constant -7.755976** (3.173088)a
-7.297177** (3.352789)
-0.050417 (0.095005)
6.403701* (0.794306)
Income 0.369434* (0.071397)
0.395761* (0.075602)
0.590614*** (0.208238)
0.326190*** (0.181170)
Infrastructure 0.414557 (0.325230)
0.403931 (0.363619)
0.786731*** (0.412413) -
Tariffs 0.003329 (0.057281)
0.031918 (0.086118)
-0.208075** (0.085632)
-0.480811* (0.065634)
Exchange Rates 0.057627 (0.760277)
-0.062918 (0.770023)
-2.822734** (0.653376) -
Trade Costs -0.794491*** (0.444075)
-0.714065** (0.331285)
-0.561384 (0.358354)
-0.498930*** (0.276431)
Dummy 1 - -2.613576* (0.298627) - -
Dummy 2 - -0.272008 (0.449774) - -
Dummy 3 - -2.903105* (0.265469) - -
Adjusted R2 0.870151 0.874951 0.893442 0.825819 *Indicates significance at 1 percent level; ** Indicates significance at 5 percent level; *** Indicates significance at 10 percent level. a Standard error are in parenthesis.
35
Box1: Constraints for exports.
In India, each state has its own set of rules with regard to inter statemovement of goods. Goods moving across the states are also subject tofurther inspection and even taxes/fees. For example, the NepaleseVegetable ghee is subjected to canalization, State-wise quota system andsome discriminatory taxes (like, luxury tax, state sales tax, entry tax etc.) inthe importing country.
Prospective exporters are required to obtain license from the Bureau of
Indian Standard (BIS) and besides the application/processing charges,which require to pay costs of inspection visits from India to the exportingcountries.
India continues import licensing of about 600 items on the grounds that
restrictions are needed to ensure protection for "human”, animal or plantlife or health". Imports of nearly all livestock, agricultural and foodproducts require some kind of phyto-sanitary certificate. All consignmentsof imported food products are required to be tested by the Port HealthOfficer (PHO). At the Custom Clearance Offices where PHOs are notavailable, various samples are drawn and forwarded for clearance to someother laboratory, which results in loss of valuable time. Furthermore, thewarehouses are not equipped to cater for preservations of perishable goods.
Rule 32 of the Prevention of Food Adulteration Rules (PFA), 1955 deals
with packing and labeling of foods. This rule alone has 30 provisos andprovisos within provisos. In addition, there is also cross references to otherrules.
The results of the laboratory tests cannot be challenged. In some cases,
even certificates by EU accredited labs on this account have been rejectedby Indian Customs and such consignments are subjected to repeat tests inIndia
Source: Compiled by authors’ on the basis of various complaints submitted by exporting firms to Ministry of Commerce, Government of India.
36
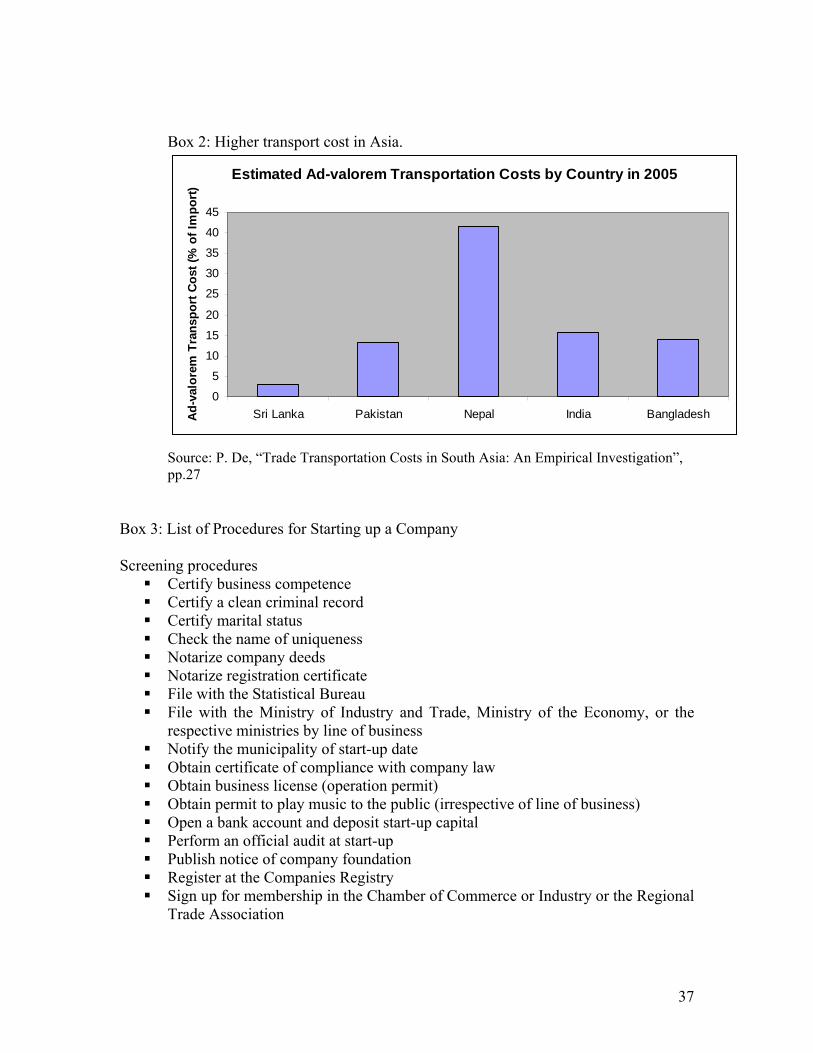
Box 2: Higher transport cost in Asia.
Estimated Ad-valorem Transportation Costs by Country in 2005
0
5
10
15
20
25
30
35
40
45
Sri Lanka Pakistan Nepal India BangladeshAd-
valo
rem
Tra
nspo
rt C
ost (
% o
f Im
port)
Source: P. De, “Trade Transportation Costs in South Asia: An Empirical Investigation”, pp.27
Box 3: List of Procedures for Starting up a Company
Screening procedures Certify business competence Certify a clean criminal record Certify marital status Check the name of uniqueness Notarize company deeds Notarize registration certificate File with the Statistical Bureau File with the Ministry of Industry and Trade, Ministry of the Economy, or the
respective ministries by line of business Notify the municipality of start-up date Obtain certificate of compliance with company law Obtain business license (operation permit) Obtain permit to play music to the public (irrespective of line of business) Open a bank account and deposit start-up capital Perform an official audit at start-up Publish notice of company foundation Register at the Companies Registry Sign up for membership in the Chamber of Commerce or Industry or the Regional
Trade Association
37
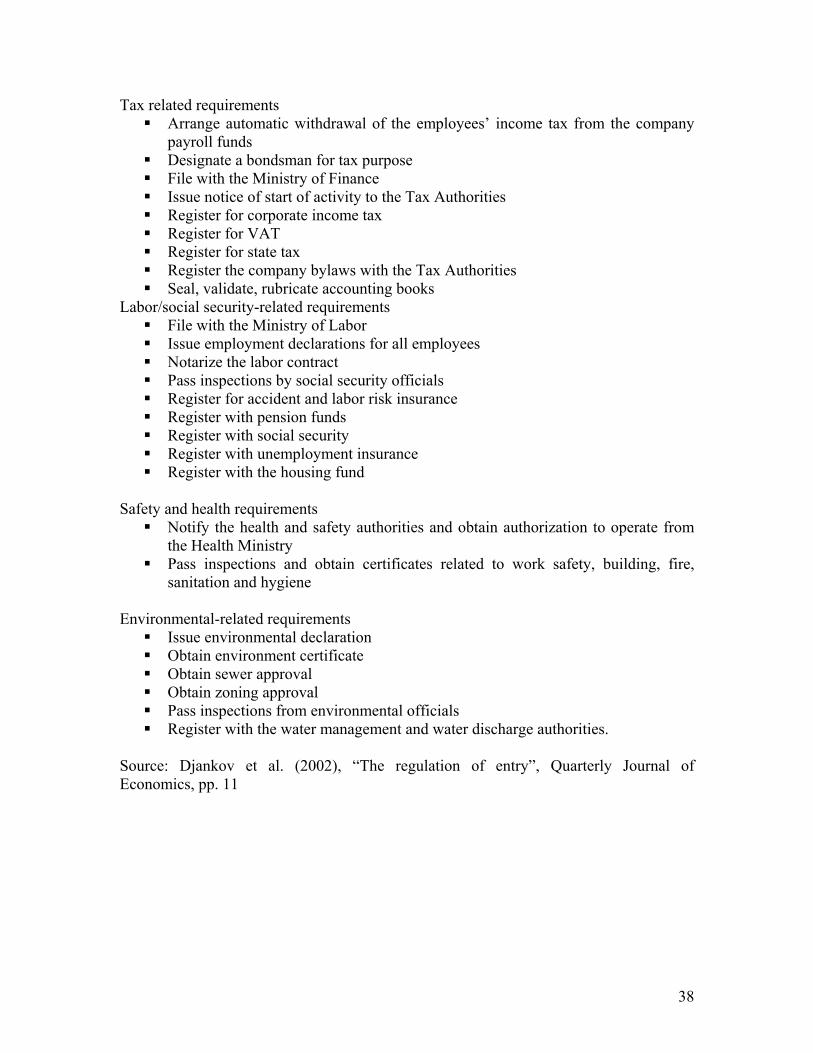
Tax related requirements Arrange automatic withdrawal of the employees’ income tax from the company
payroll funds Designate a bondsman for tax purpose File with the Ministry of Finance Issue notice of start of activity to the Tax Authorities Register for corporate income tax Register for VAT Register for state tax Register the company bylaws with the Tax Authorities Seal, validate, rubricate accounting books
Labor/social security-related requirements File with the Ministry of Labor Issue employment declarations for all employees Notarize the labor contract Pass inspections by social security officials Register for accident and labor risk insurance Register with pension funds Register with social security Register with unemployment insurance Register with the housing fund
Safety and health requirements Notify the health and safety authorities and obtain authorization to operate from
the Health Ministry Pass inspections and obtain certificates related to work safety, building, fire,
sanitation and hygiene Environmental-related requirements Issue environmental declaration Obtain environment certificate Obtain sewer approval Obtain zoning approval Pass inspections from environmental officials Register with the water management and water discharge authorities.
Source: Djankov et al. (2002), “The regulation of entry”, Quarterly Journal of Economics, pp. 11
38