Embed Size (px)
DESCRIPTION
my internship report. faulty readings.
Citation preview
PERFORMANCE, FABRICATION AND ANALYSIS
OF SOLAR DESALINATION SYSTEM USING PV PANELS
SCIENTIST “F” DIRECTOR,
NISE, GURGAON
SUBMITTED BY:VISMAY PARMARB.TECH (MECHANICAL ENGINEERING)DELHI TECHNOLOGICAL UNIVERSITY
P a g e | 1
SUMMER TRAINING REPORT
“Performance, Fabrication and AnalysisOf Solar Desalination system using PV Panels”
For partial completion of B.Tech in Mechanical EngineeringAt Delhi Technological University
Under guidance ofEr. S.K Singh
Scientist (‘F’)Submitted by:
Vismay Parmar.Student, B.Tech in Mechanical EngineeringDelhi Technological UniversityDelhi.
Duration of training: 3rd June, 2015 to 24th July, 2015
NATIONAL INSTITUTE OF SOLAR ENERGYGwal Pahari, Gurgaon
Haryana, INDIA
P a g e | 2
ACKNOWLEDGEMENT
This report is summary of my internship at NISE, Gurgaon. My successful completion of eight week internship at NISE would not be possible without help from number of people. I take this opportunity to acknowledge them.
First and foremost, I would like to thank Er. S K Singh, Scientist “F”, NISE; who took time from his busy schedule to give me opportunity to work under his guidance at one of the most pioneering research institute. During my internship, I have gained new insights about solar thermal energy technologies from him.
I would also thank Mrs Anju Singh and Mr. Umakant Sahu, who is completing his PhD at NISE; to help me conduct experiments and for their constant motivation and support to successfully complete my internship here.
This internship is perceived as a big milestone in my career and I hope to apply my skills and knowledge learnt here towards my goals.
Thank you.
Sincerely,
Vismay Parmar.Student, B.Tech in Mechanical EngineeringDelhi Technological University.
P a g e | 3
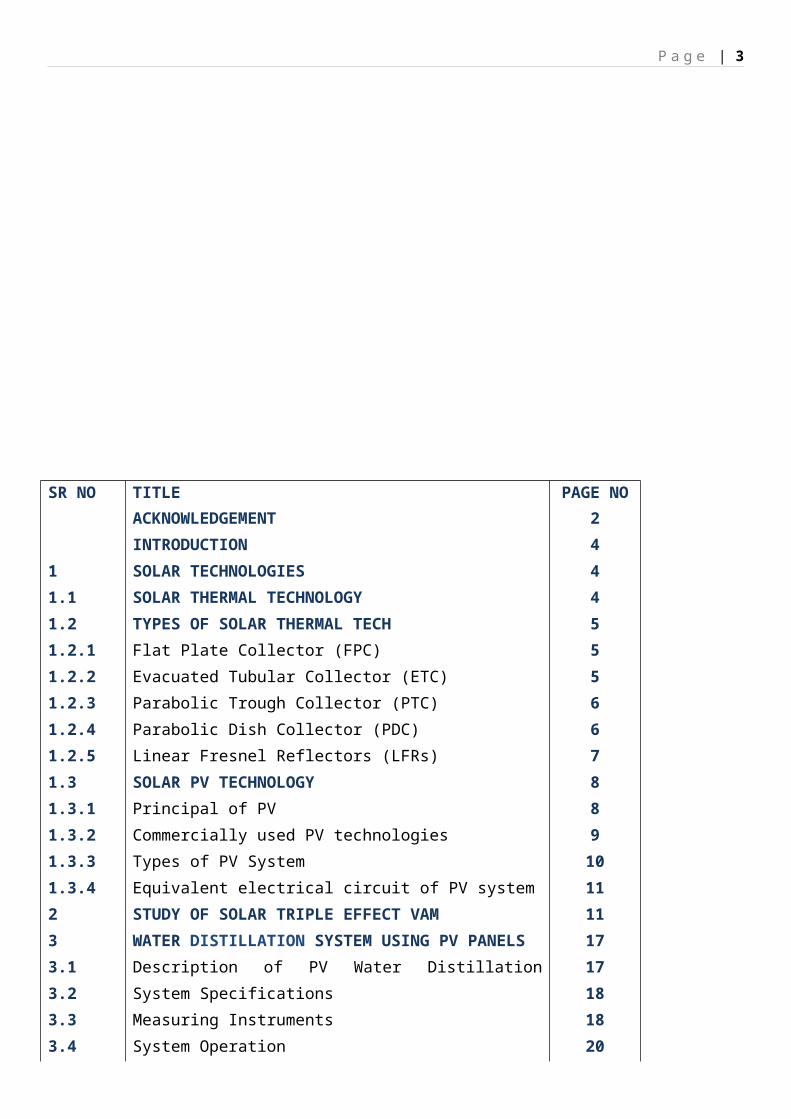
SR NO TITLE PAGE NO
ACKNOWLEDGEMENT 2
INTRODUCTION 4
1 SOLAR TECHNOLOGIES 4
1.1 SOLAR THERMAL TECHNOLOGY 4
1.2 TYPES OF SOLAR THERMAL TECH 5
1.2.1 Flat Plate Collector (FPC) 5
1.2.2 Evacuated Tubular Collector (ETC) 5
1.2.3 Parabolic Trough Collector (PTC) 6
1.2.4 Parabolic Dish Collector (PDC) 6
1.2.5 Linear Fresnel Reflectors (LFRs) 7
1.3 SOLAR PV TECHNOLOGY 8

P a g e | 4
1.3.1 Principal of PV 8
1.3.2 Commercially used PV technologies 9
1.3.3 Types of PV System 10
1.3.4 Equivalent electrical circuit of PV system 11
2 STUDY OF SOLAR TRIPLE EFFECT VAM 11
3 WATER DISTILLATION SYSTEM USING PV PANELS 17
3.1 Description of PV Water Distillation System 17
3.2 System Specifications 18
3.3 Measuring Instruments 18
3.4 System Operation 20
3.5 Data collection and Analysis 20
3.6 Conclusion 24
4 REFERENCE 25
P a g e | 5
INTRODUCTION
The sun is an enormous sphere of extremely hot gaseous mater and it is situated about 1.5× 10¹¹m away from the earth. It is 1.39× 10⁹ m in diameter (about 109 times the earth), and it continuously generating heat by thermonuclear fusion reaction, four hydrogen atoms (i.e. four proton) combine to form one helium atom. The mass of one helium atom is less than that of the combine mass of four protons. This loss in mass in reaction is converted into energy and that is known as Solar Energy. It is estimated that about 90 % of energy is produced in the interior regions which is within 23 % of the sun’s radius, and that contains 40 % of the mass of the Sun. This energy is radiated from the surface of the sun in all direction, and a very small fraction of its reached the earth. Solar energy is considered to be the predominant source of all forms of energy on the earth. Almost every part of the earth receives some amount of solar energy. The uneven heating of the air is due to solar radiation power of the wind. Heating of the air also influences of global evaporation and precipitation process. Even the energy in fossil fuel is actually solar energy that was first stored as chemical energy in bio-mass and transformed into coal, oil or gas over millions of years ago. The energy collected by 1 m2 of solar collector in a day is approximately equal to that release by burning 1 kg coal or we can say burning of 0.5 litres of kerosene. Thus the solar energy is a dilute source and large areas are needed for its collection. Man has been harnessing the sun’s energy and using it to meet energy requirements for ages. Solar energy received on the earth in the form of heat and light can be harnessed to supply thermal as well as electrical energy. On the basis of utilization pattern, technology to harness solar energy can be divided into two as seen in fig.1;
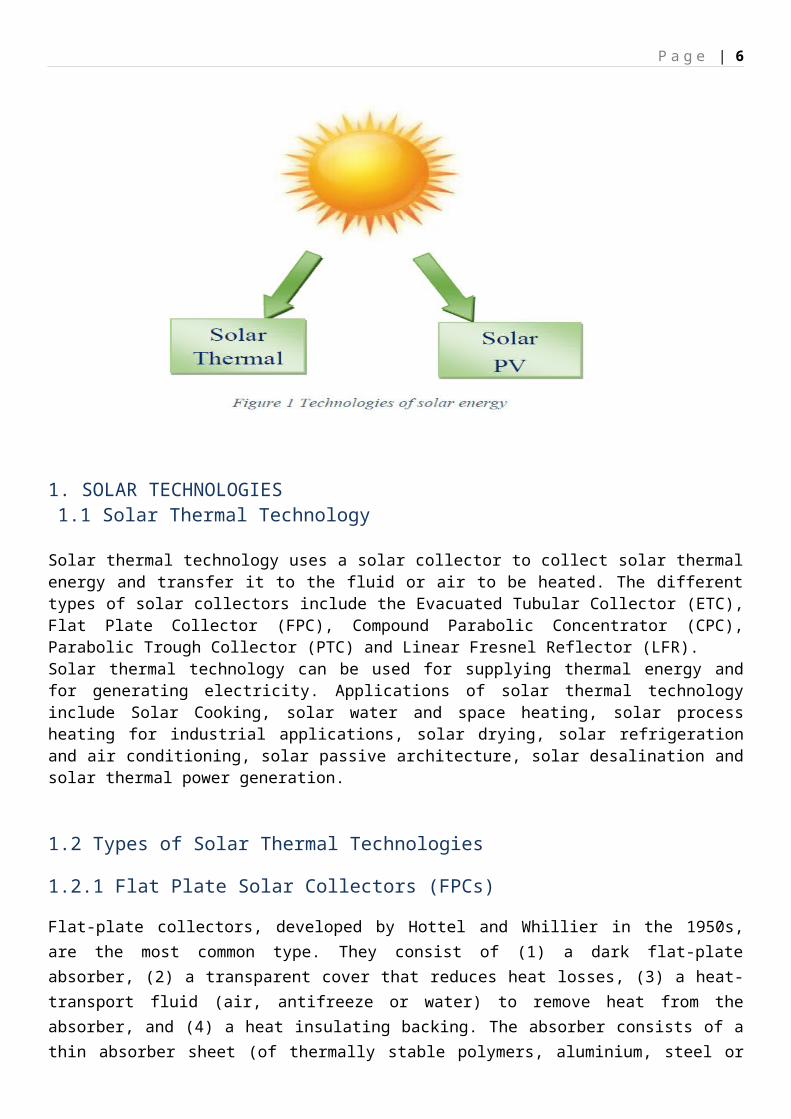
1. SOLAR TECHNOLOGIES 1.1 Solar Thermal Technology
Solar thermal technology uses a solar collector to collect solar thermal energy and transfer it to the fluid or air to be heated. The different types of solar collectors include the Evacuated Tubular Collector (ETC), Flat Plate Collector (FPC), Compound Parabolic Concentrator (CPC), Parabolic Trough Collector (PTC) and Linear Fresnel Reflector (LFR). Solar thermal technology can be used for supplying thermal energy and for generating electricity. Applications of solar thermal technology include Solar Cooking, solar water and space heating, solar process
P a g e | 6
heating for industrial applications, solar drying, solar refrigeration and air conditioning, solar passive architecture, solar desalination and solar thermal power generation.
1.2 Types of Solar Thermal Technologies
1.2.1 Flat Plate Solar Collectors (FPCs)
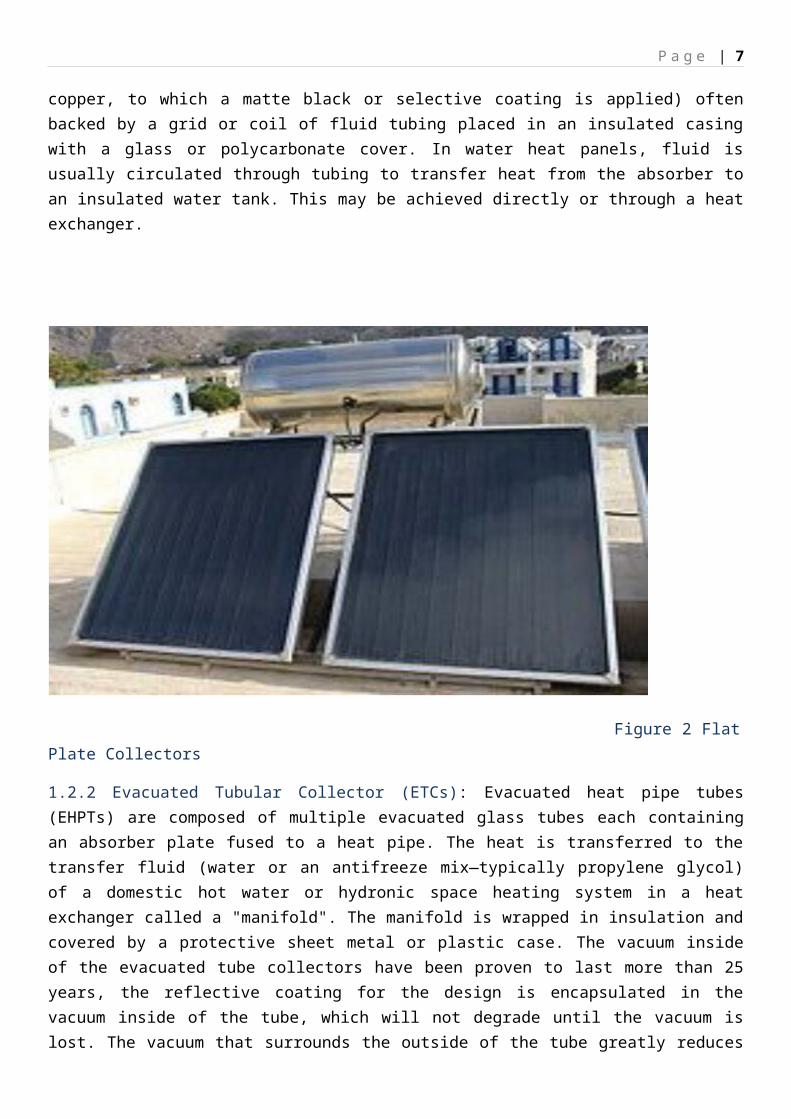
Flat-plate collectors, developed by Hottel and Whillier in the 1950s, are the most common type. They consist of (1) a dark flat-plate absorber, (2) a transparent cover that reduces heat losses, (3) a heat-transport fluid (air, antifreeze or water) to remove heat from the absorber, and (4) a heat insulating backing. The absorber consists of a thin absorber sheet (of thermally stable polymers, aluminium, steel or copper, to which a matte black or selective coating is applied) often backed by a grid or coil of fluid tubing placed in an insulated casing with a glass or polycarbonate cover. In water heat panels, fluid is usually circulated through tubing to transfer heat from the absorber to an insulated water tank. This may be achieved directly or through a heat exchanger.
Figure 2 Flat Plate Collectors
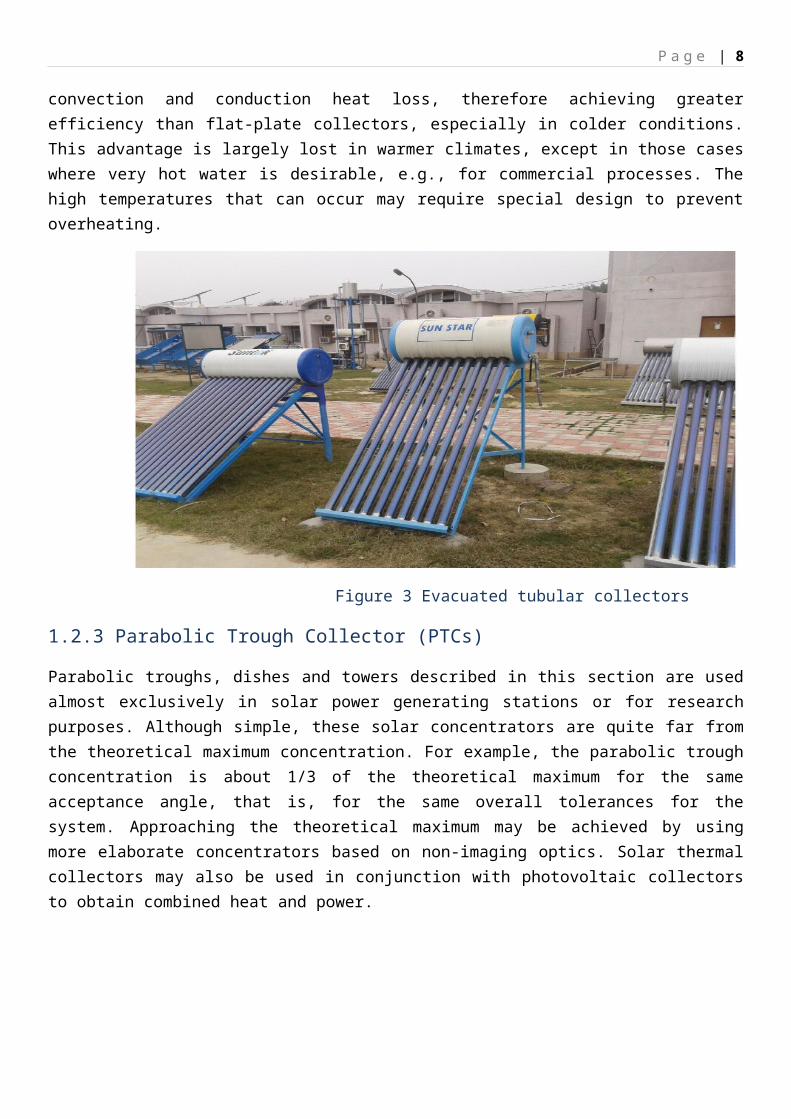
1.2.2 Evacuated Tubular Collector (ETCs): Evacuated heat pipe tubes (EHPTs) are composed of multiple evacuated glass tubes each containing an absorber plate fused to a heat pipe. The heat is transferred to the transfer fluid (water or an antifreeze mix—typically propylene glycol) of a domestic hot water or hydronic space heating system in a heat exchanger called a "manifold". The manifold is wrapped in insulation and covered by a protective sheet metal or plastic case. The vacuum inside of the evacuated tube collectors have been proven to last more than 25 years, the reflective coating for the design is encapsulated in the vacuum inside of the tube, which will not degrade until the vacuum is lost. The vacuum that surrounds the outside of the tube greatly reduces convection and conduction heat loss, therefore achieving greater efficiency than flat-plate collectors, especially in colder conditions. This advantage is largely lost in warmer climates, except in those cases where very hot water is desirable, e.g., for commercial processes. The high temperatures that can occur may require special design to prevent overheating.
P a g e | 7
Figure 3 Evacuated tubular collectors
1.2.3 Parabolic Trough Collector (PTCs)
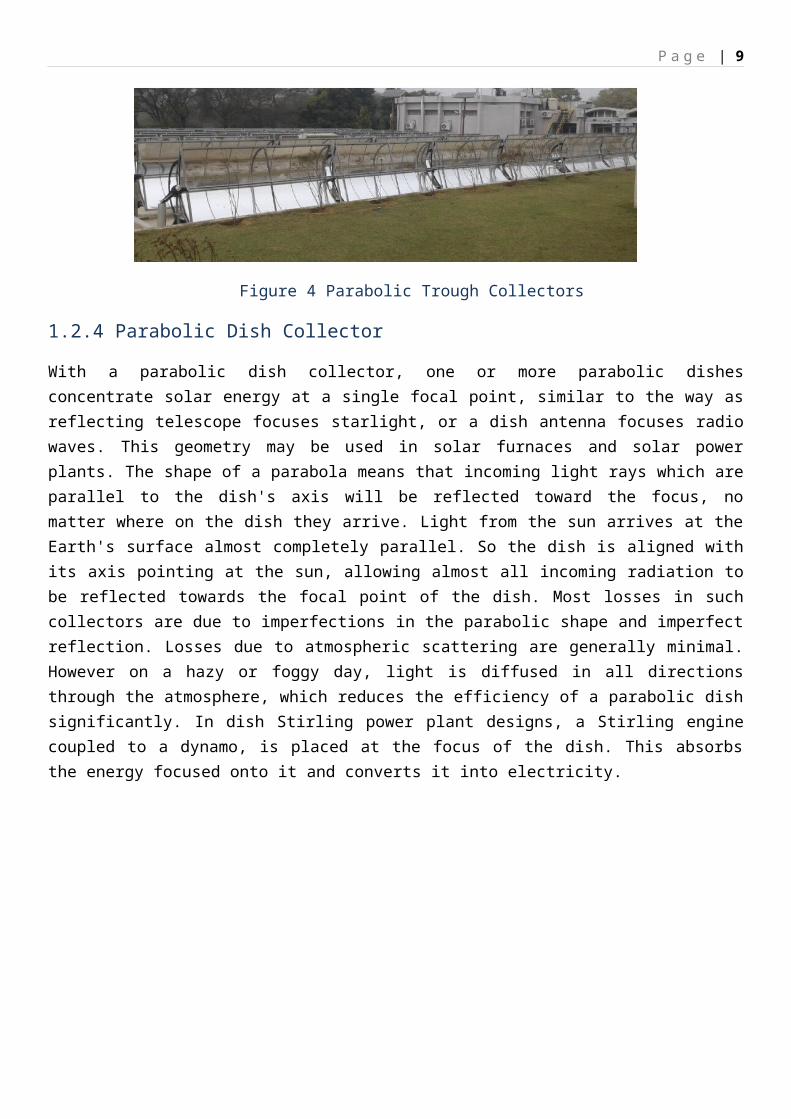
Parabolic troughs, dishes and towers described in this section are used almost exclusively in solar power generating stations or for research purposes. Although simple, these solar concentrators are quite far from the theoretical maximum concentration. For example, the parabolic trough concentration is about 1/3 of the theoretical maximum for the same acceptance angle, that is, for the same overall tolerances for the system. Approaching the theoretical maximum may be achieved by using more elaborate concentrators based on non-imaging optics. Solar thermal collectors may also be used in conjunction with photovoltaic collectors to obtain combined heat and power.
Figure 4 Parabolic Trough Collectors
1.2.4 Parabolic Dish Collector
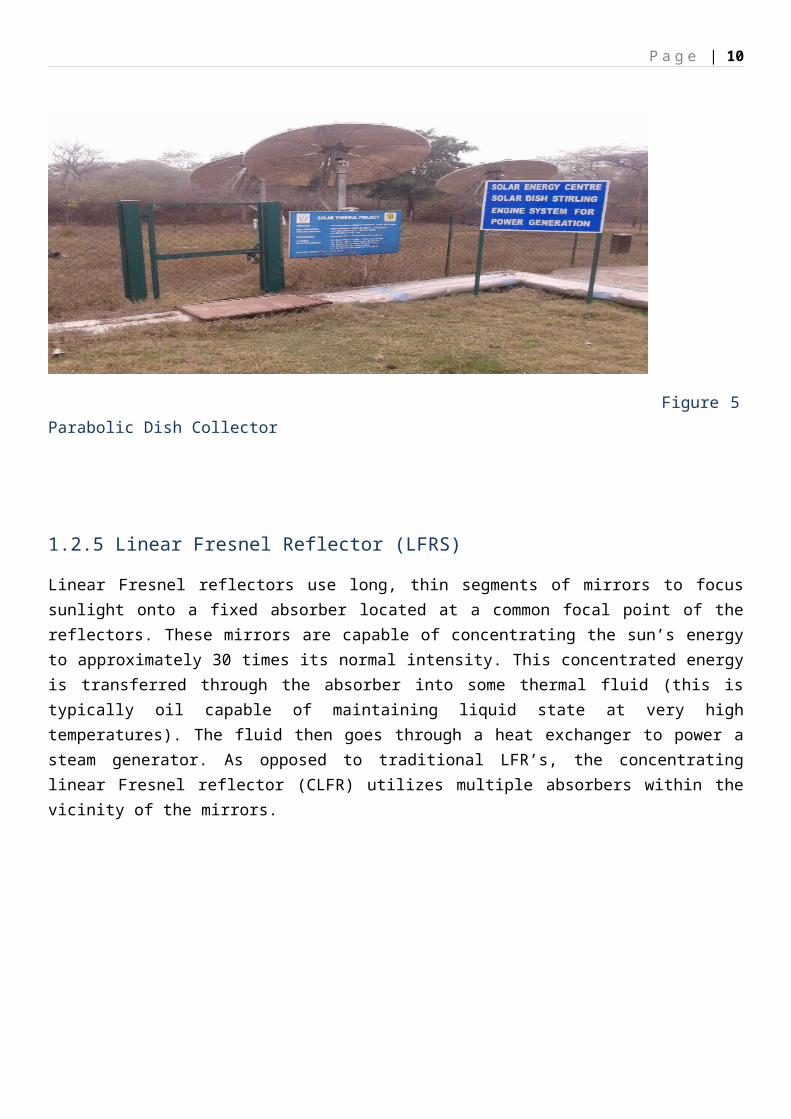
With a parabolic dish collector, one or more parabolic dishes concentrate solar energy at a single focal point, similar to the way as reflecting telescope focuses starlight, or a dish antenna focuses radio waves. This geometry may be used in solar furnaces and solar power plants. The shape of a parabola means that incoming light rays which are parallel to the dish's axis will be reflected toward the focus, no matter where on the dish they arrive. Light from the sun arrives at the Earth's surface almost completely parallel. So the dish is aligned with its axis pointing at the sun, allowing almost all incoming radiation to be reflected towards the focal point of the dish. Most losses in such collectors are due to imperfections in the parabolic
P a g e | 8
shape and imperfect reflection. Losses due to atmospheric scattering are generally minimal. However on a hazy or foggy day, light is diffused in all directions through the atmosphere, which reduces the efficiency of a parabolic dish significantly. In dish Stirling power plant designs, a Stirling engine coupled to a dynamo, is placed at the focus of the dish. This absorbs the energy focused onto it and converts it into electricity.
Figure 5 Parabolic Dish Collector
1.2.5 Linear Fresnel Reflector (LFRS)
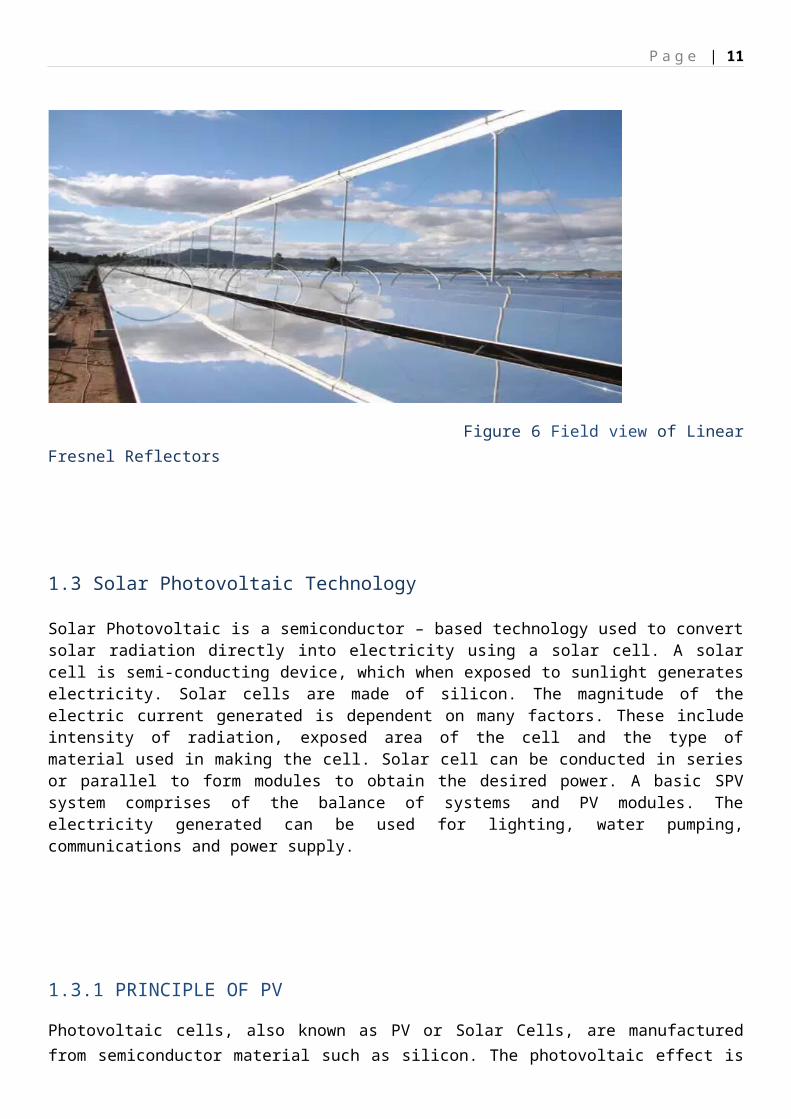
Linear Fresnel reflectors use long, thin segments of mirrors to focus sunlight onto a fixed absorber located at a common focal point of the reflectors. These mirrors are capable of concentrating the sun’s energy to approximately 30 times its normal intensity. This concentrated energy is transferred through the absorber into some thermal fluid (this is typically oil capable of maintaining liquid state at very high temperatures). The fluid then goes through a heat exchanger to power a steam generator. As opposed to traditional LFR’s, the concentrating linear Fresnel reflector (CLFR) utilizes multiple absorbers within the vicinity of the mirrors.
P a g e | 9
Figure 6 Field view of Linear Fresnel Reflectors
1.3 Solar Photovoltaic Technology
Solar Photovoltaic is a semiconductor – based technology used to convert solar radiation directly into electricity using a solar cell. A solar cell is semi-conducting device, which when exposed to sunlight generates electricity. Solar cells are made of silicon. The magnitude of the electric current generated is dependent on many factors. These include intensity of radiation, exposed area of the cell and the type of material used in making the cell. Solar cell can be conducted in series or parallel to form modules to obtain the desired power. A basic SPV system comprises of the balance of systems and PV modules. The electricity generated can be used for lighting, water pumping, communications and power supply.
1.3.1 PRINCIPLE OF PV
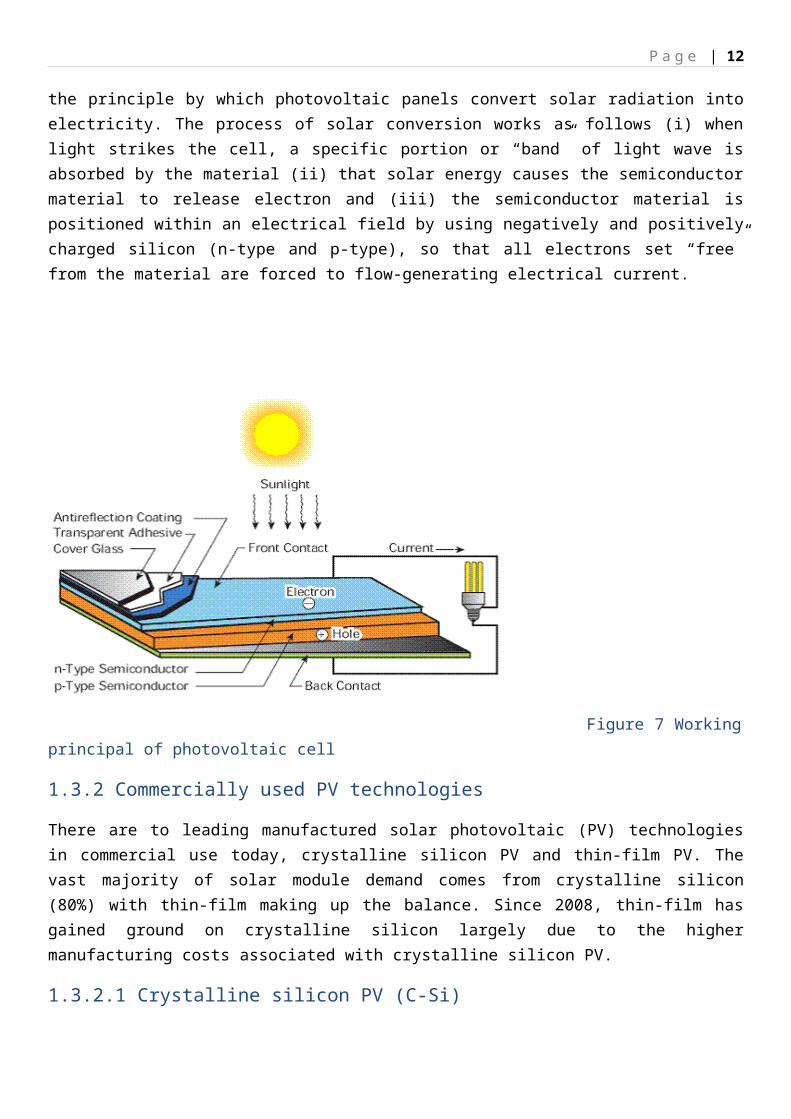
Photovoltaic cells, also known as PV or Solar Cells, are manufactured from semiconductor material such as silicon. The photovoltaic effect is the principle by which photovoltaic panels convert solar radiation into electricity. The process of solar conversion works as follows (i) when light strikes the cell, a specific portion or “band” of light wave is absorbed by the material (ii) that solar energy causes the semiconductor material to release electron and (iii) the semiconductor material is positioned within an electrical field by using negatively and positively charged silicon (n-type and p-type), so that all electrons set “free” from the material are forced to flow-generating electrical current.
P a g e | 10
Figure 7 Working principal of photovoltaic cell
1.3.2 Commercially used PV technologies
There are to leading manufactured solar photovoltaic (PV) technologies in commercial use today, crystalline silicon PV and thin-film PV. The vast majority of solar module demand comes from crystalline silicon (80%) with thin-film making up the balance. Since 2008, thin-film has gained ground on crystalline silicon largely due to the higher manufacturing costs associated with crystalline silicon PV.
1.3.2.1 Crystalline silicon PV (C-Si)
C-Si cells were first commercialized by Bell Labs in 1950s. They are made by slicing high purity silicon into thin wafers with the thickness of human hair. Crystalline cells are classified as mono-crystalline silicon and multi-crystalline silicon based on the type of crystals used for making of wafer.
1.3.2.2 Mono-crystalline silicon (Mono C-Si)
Mono-crystalline silicon solar modules are the workhorse of solar industry. They are extremely durable and have the highest commercial power conversion efficiency. Single/Mono-crystalline silicon has as ordered crystalline structure, with each atom, ideally lying in a predetermined position. These cells are made from very pure mono-crystalline silicon. This crystal is cut into wafers roughly 0.2mm thick before the wafers are chemically treated and electrical contents added. The fact that they are cut from a single crystal means that they are highly efficient, with modules in production converting up to 15-20% of energy from the sun into electricity and test models upto 24.4%. Max cell efficiency tested was 18.4% of mono-crystalline silicon cells.
1.3.2.2 Multi-crystalline silicon (Multi C-Si)
Multi crystalline solar modules are made from a block of silicon that contains multiple crystals. Techniques for the production of multi crystalline silicon are simpler, and therefore cheaper than those required for single crystal material. Such multi crystalline material is widely used for commercial solar cell production. Efficiency of multi crystalline cell is 20.4 ± 0.5%. The max efficiency of multi-crystalline silicon cell observed is 17.9%.
P a g e | 11
1.3.3 Types of PV System
1.3.3.1 Stand-alone PV system:
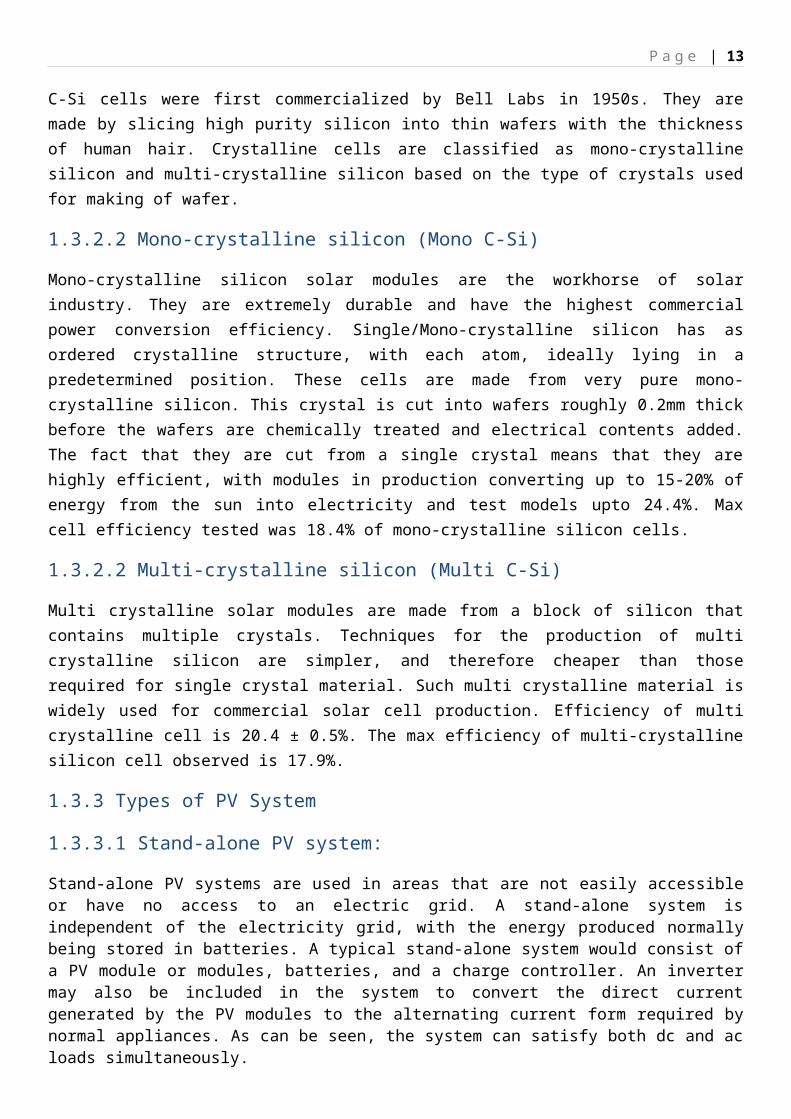
Stand-alone PV systems are used in areas that are not easily accessible or have no access to an electric grid. A stand-alone system is independent of the electricity grid, with the energy produced normally being stored in batteries. A typical stand-alone system would consist of a PV module or modules, batteries, and a charge controller. An inverter may also be included in the system to convert the direct current generated by the PV modules to the alternating current form required by normal appliances. As can be seen, the system can satisfy both dc and ac loads simultaneously.
Figure 8 Schematic diagram of Stand-alone PV system
1.3.3.2 SPV Hybrid system
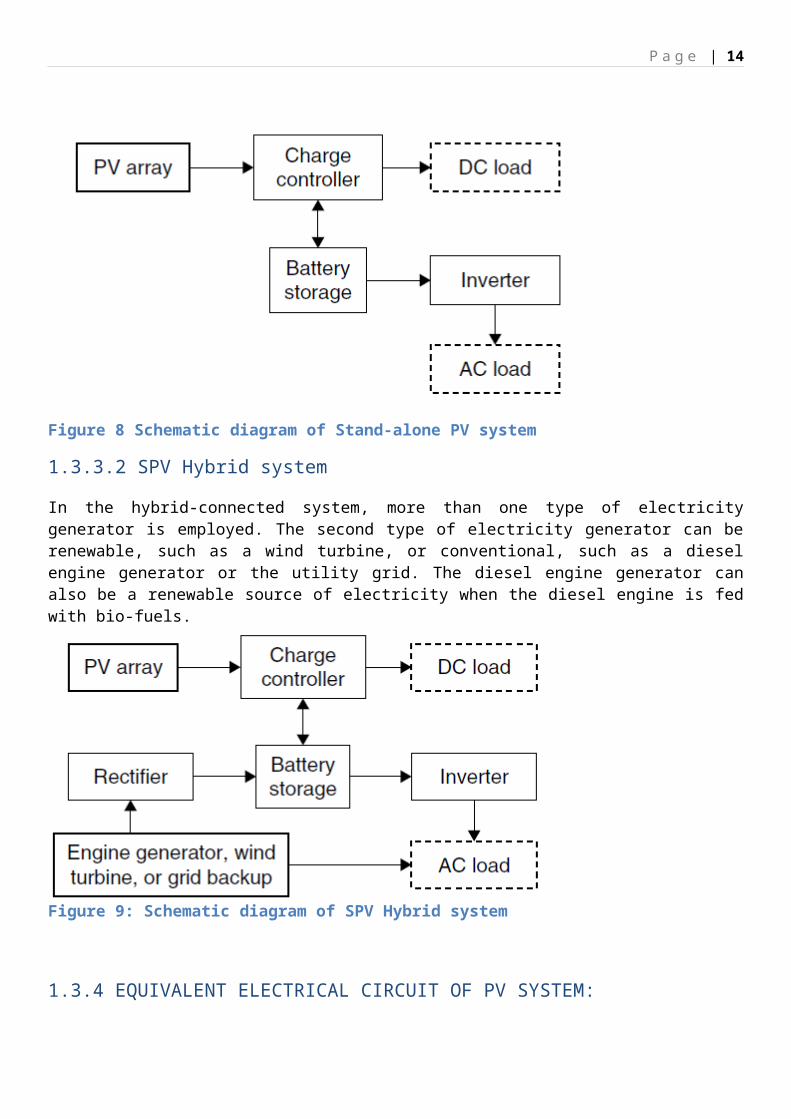
In the hybrid-connected system, more than one type of electricity generator is employed. The second type of electricity generator can be renewable, such as a wind turbine, or conventional, such as a diesel engine generator or the utility grid. The diesel engine generator can also be a renewable source of electricity when the diesel engine is fed with bio-fuels.
Figure 9: Schematic diagram of SPV Hybrid system
P a g e | 12
1.3.4 EQUIVALENT ELECTRICAL CIRCUIT OF PV SYSTEM:
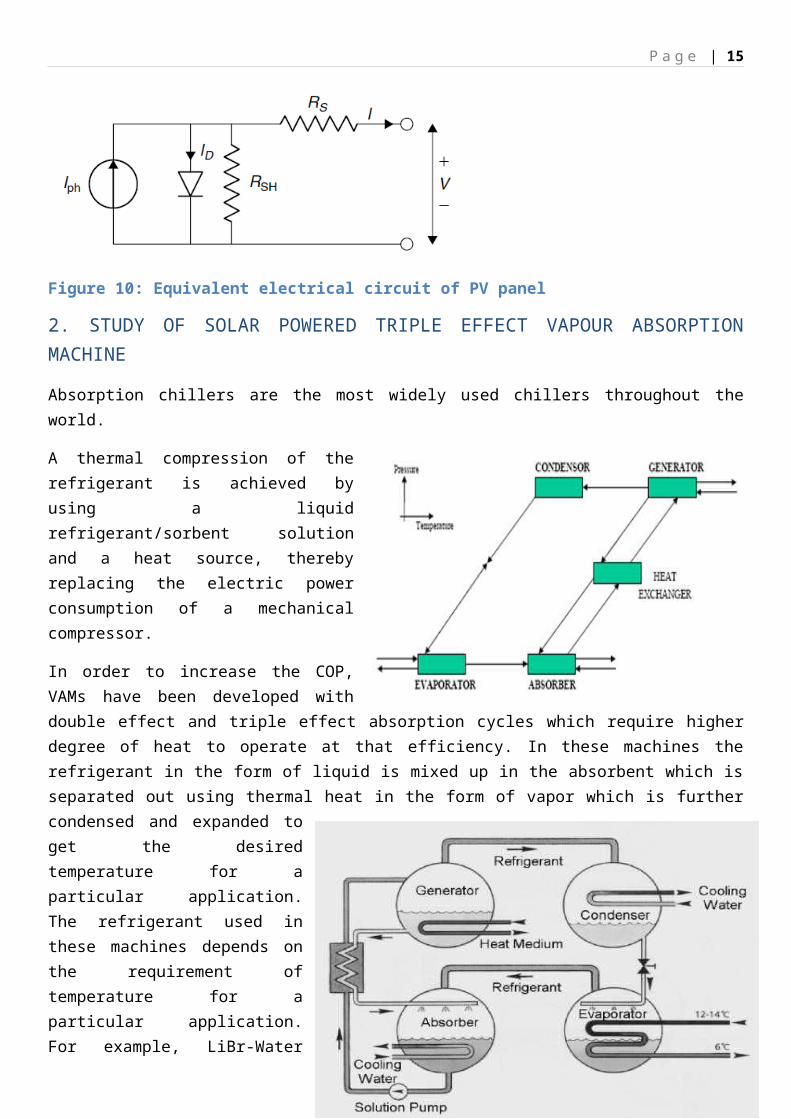
Figure 10: Equivalent electrical circuit of PV panel
2. STUDY OF SOLAR POWERED TRIPLE EFFECT VAPOUR ABSORPTION MACHINE
Absorption chillers are the most widely used chillers throughout the world.
A thermal compression of the refrigerant is achieved by using a liquid refrigerant/sorbent solution and a heat source, thereby replacing the electric power consumption of a mechanical compressor.
In order to increase the COP, VAMs have been developed with double effect and triple effect absorption cycles which require higher degree of heat to operate at that efficiency. In these machines the refrigerant in the form of liquid is mixed up in the absorbent which is separated out using thermal heat in the form of vapor which is further condensed and expanded to get the desired temperature for a particular application.The refrigerant used in these machines depends on the requirement of temperature for a particular application. For example, LiBr-Water combination is generally being used in VAMs. For applications where temperature requirement are less, to store perishable food products, generally between -20oC and 4oC, ammonia is being used as the refrigerant whose freezing temperature is much below the required temperature for cooling.
P a g e | 13
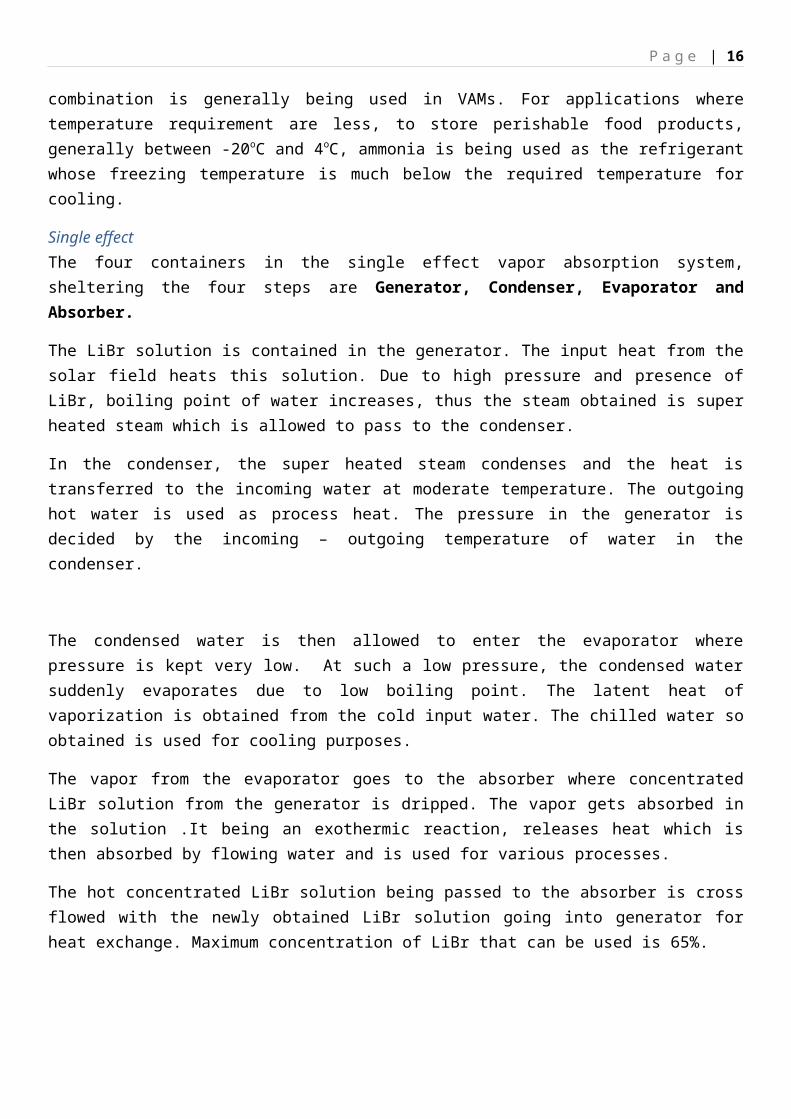
Single effectThe four containers in the single effect vapor absorption system, sheltering the four steps are Generator, Condenser, Evaporator and Absorber.
The LiBr solution is contained in the generator. The input heat from the solar field heats this solution. Due to high pressure and presence of LiBr, boiling point of water increases, thus the steam obtained is super heated steam which is allowed to pass to the condenser.
In the condenser, the super heated steam condenses and the heat is transferred to the incoming water at moderate temperature. The outgoing hot water is used as process heat. The pressure in the generator is decided by the incoming – outgoing temperature of water in the condenser.
The condensed water is then allowed to enter the evaporator where pressure is kept very low. At such a low pressure, the condensed water suddenly evaporates due to low boiling point. The latent heat of vaporization is obtained from the cold input water. The chilled water so obtained is used for cooling purposes.
The vapor from the evaporator goes to the absorber where concentrated LiBr solution from the generator is dripped. The vapor gets absorbed in the solution .It being an exothermic reaction, releases heat which is then absorbed by flowing water and is used for various processes.
The hot concentrated LiBr solution being passed to the absorber is cross flowed with the newly obtained LiBr solution going into generator for heat exchange. Maximum concentration of LiBr that can be used is 65%.
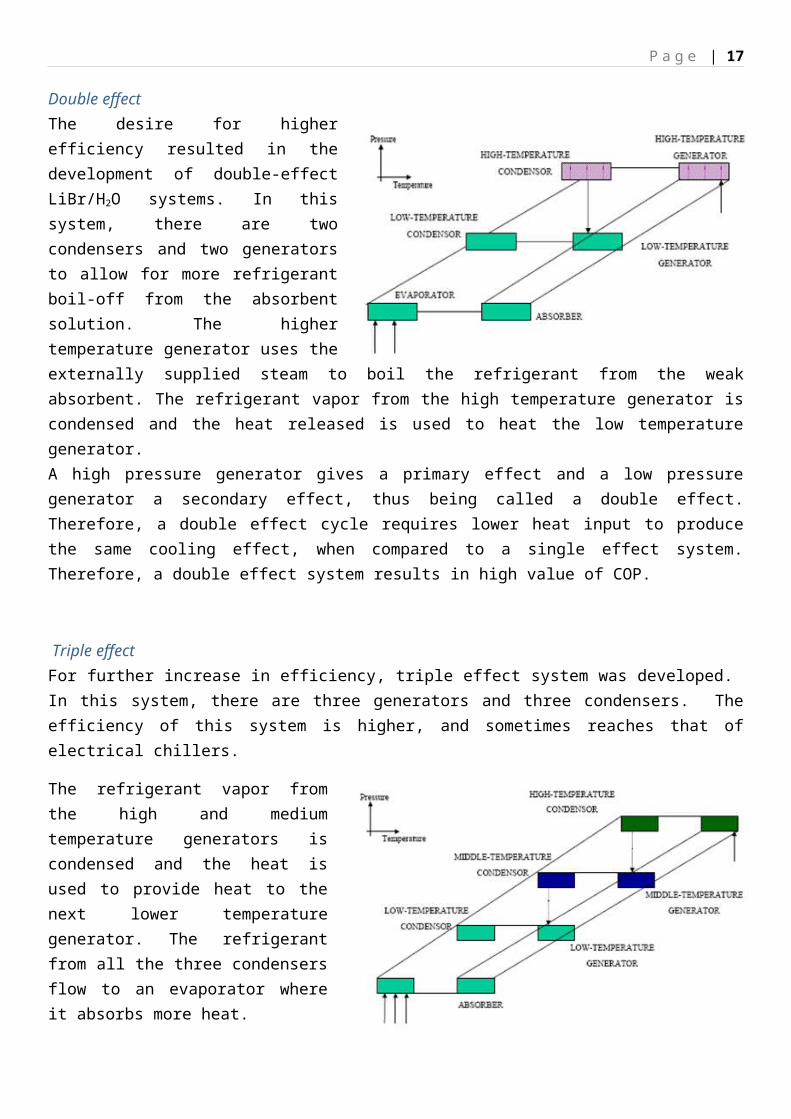
Double effectThe desire for higher efficiency resulted in the development of double-effect LiBr/H2O systems. In this system, there are two condensers and two generators to allow for more refrigerant boil-off from the absorbent solution. The higher temperature generator uses the externally supplied steam to boil the refrigerant from the weak absorbent. The refrigerant vapor from the high temperature generator is condensed and the heat released is used to heat the low temperature generator.A high pressure generator gives a primary effect and a low pressure generator a secondary effect, thus being called a double effect. Therefore, a double effect cycle requires lower heat input to produce the same cooling effect, when compared to a single effect system. Therefore, a double effect system results in high value of COP.
Triple effect For further increase in efficiency, triple effect system was developed. In this system, there are three generators and three condensers. The efficiency of this system is higher, and sometimes reaches that of electrical chillers.
P a g e | 14
The refrigerant vapor from the high and medium temperature generators is condensed and the heat is used to provide heat to the next lower temperature generator. The refrigerant from all the three condensers flow to an evaporator where it absorbs more heat.
Triple effect Solar Cooling System at Solar Energy Centre
Specifications• Heat source : Hot water from solar collectors • Hot water temperature : 210°C • Cooling capacity : 100 kW• Chilled water Temperature: 12 / 7 Deg C.• Cooling water inlet Temperature : 32 Deg C• COP of cooling system : 1.7• Thermal storage : Chilled water / Hot water / PCM for short duration
The system consists of a high efficiency three stage Vapor Absorption Machine (VAM) based on LiBr cycle with coefficient of performance 1.7, suitable medium temperature solar concentrating collectors and appropriate storage system.288m2 parabolic trough collectors (PTC) provide pressurized water at 210oC temperature. This heat is used in VAM to generate 7oC chilled water, which in turn is circulated through the Fan Coil Unit installed in 13 rooms to be cooled.Also, there is effective solar thermal energy storage in the form of Phase Change Material (PCM). In winter, the solar heated water, instead of pushing through the VAM, is circulated through the FCU to provide cooling.
P a g e | 15
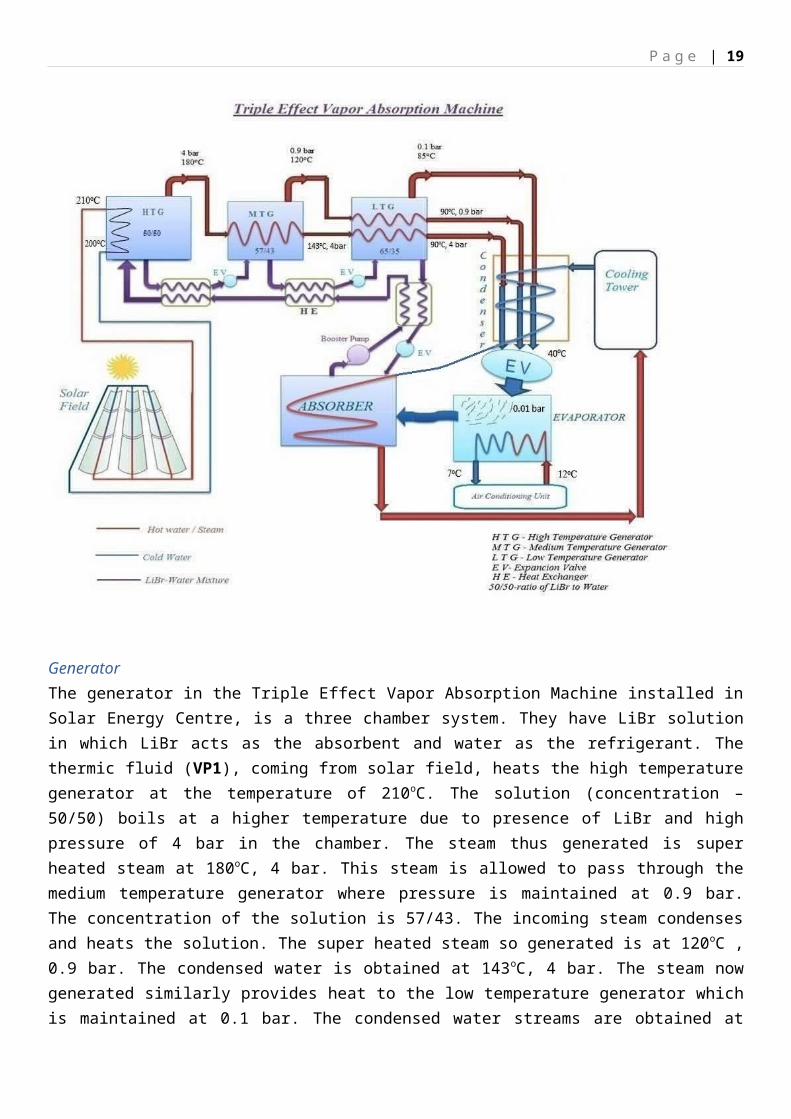
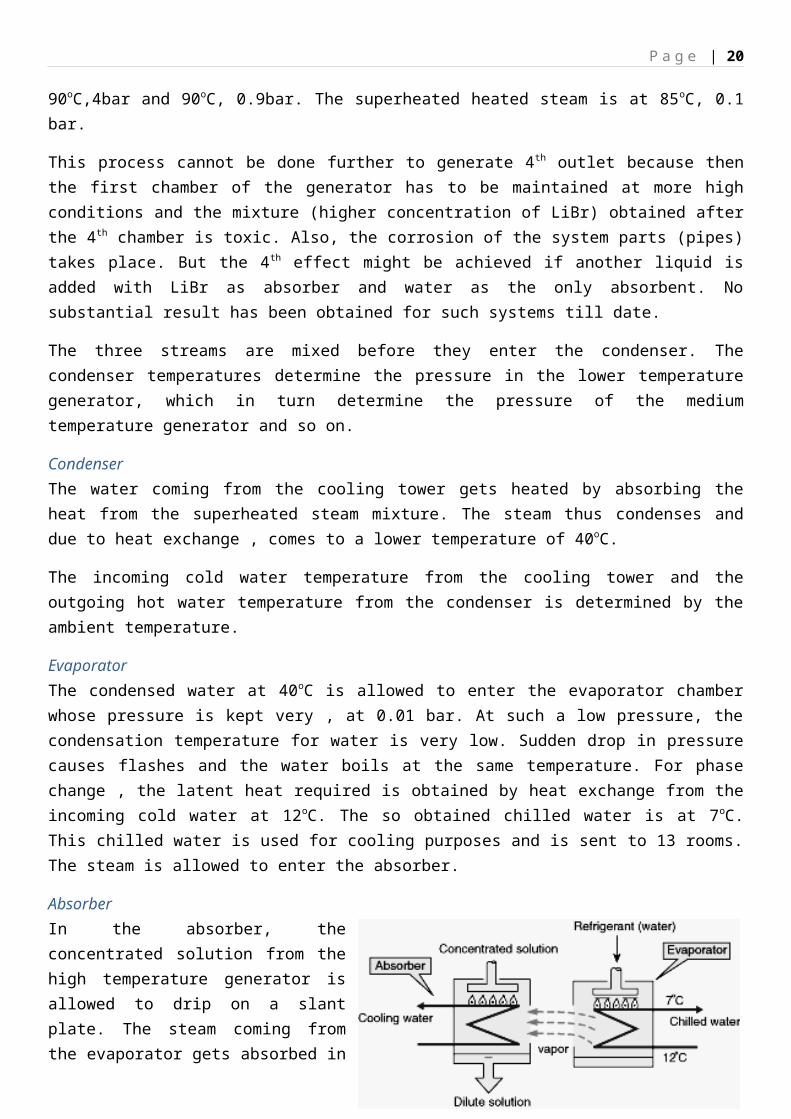
GeneratorThe generator in the Triple Effect Vapor Absorption Machine installed in Solar Energy Centre, is a three chamber system. They have LiBr solution in which LiBr acts as the absorbent and water as the refrigerant. The thermic fluid (VP1), coming from solar field, heats the high temperature generator at the temperature of 210oC. The solution (concentration – 50/50) boils at a higher temperature due to presence of LiBr and high pressure of 4 bar in the chamber. The steam thus generated is super heated steam at 180oC, 4 bar. This steam is allowed to pass through the medium temperature generator where pressure is maintained at 0.9 bar. The concentration of the solution is 57/43. The incoming steam condenses and heats the solution. The super heated steam so generated is at 120oC , 0.9 bar. The condensed water is obtained at 143oC, 4 bar. The steam now generated similarly provides heat to the low temperature generator which is maintained at 0.1 bar. The condensed water streams are obtained at 90oC,4bar and 90oC, 0.9bar. The superheated heated steam is at 85oC, 0.1 bar.
This process cannot be done further to generate 4 th outlet because then the first chamber of the generator has to be maintained at more high conditions and the mixture (higher concentration of LiBr) obtained after the 4th chamber is toxic. Also, the corrosion of the system parts (pipes) takes place. But the 4 th effect might be achieved if another liquid is added with LiBr as absorber and water as the only absorbent. No substantial result has been obtained for such systems till date.
P a g e | 16
The three streams are mixed before they enter the condenser. The condenser temperatures determine the pressure in the lower temperature generator, which in turn determine the pressure of the medium temperature generator and so on.
CondenserThe water coming from the cooling tower gets heated by absorbing the heat from the superheated steam mixture. The steam thus condenses and due to heat exchange , comes to a lower temperature of 40oC.
The incoming cold water temperature from the cooling tower and the outgoing hot water temperature from the condenser is determined by the ambient temperature.
EvaporatorThe condensed water at 40oC is allowed to enter the evaporator chamber whose pressure is kept very , at 0.01 bar. At such a low pressure, the condensation temperature for water is very low. Sudden drop in pressure causes flashes and the water boils at the same temperature. For phase change , the latent heat required is obtained by heat exchange from the incoming cold water at 12oC. The so obtained chilled water is at 7oC. This chilled water is used for cooling purposes and is sent to 13 rooms. The steam is allowed to enter the absorber.
AbsorberIn the absorber, the concentrated solution from the high temperature generator is allowed to drip on a slant plate. The steam coming from the evaporator gets absorbed in the concentrated solution, regaining its original concentration. This process of absorption is exothermic. The heat thus released is absorbed by the water and the heated water is used as process heat. The 50/50 concentration solution is pumped back to the high temperature generator. In the way, it exchanges heat with the solutions passing from one chamber of the generator to the other. The cycle is thus completed.
The COP of this VAM is 1.7.
Calculations
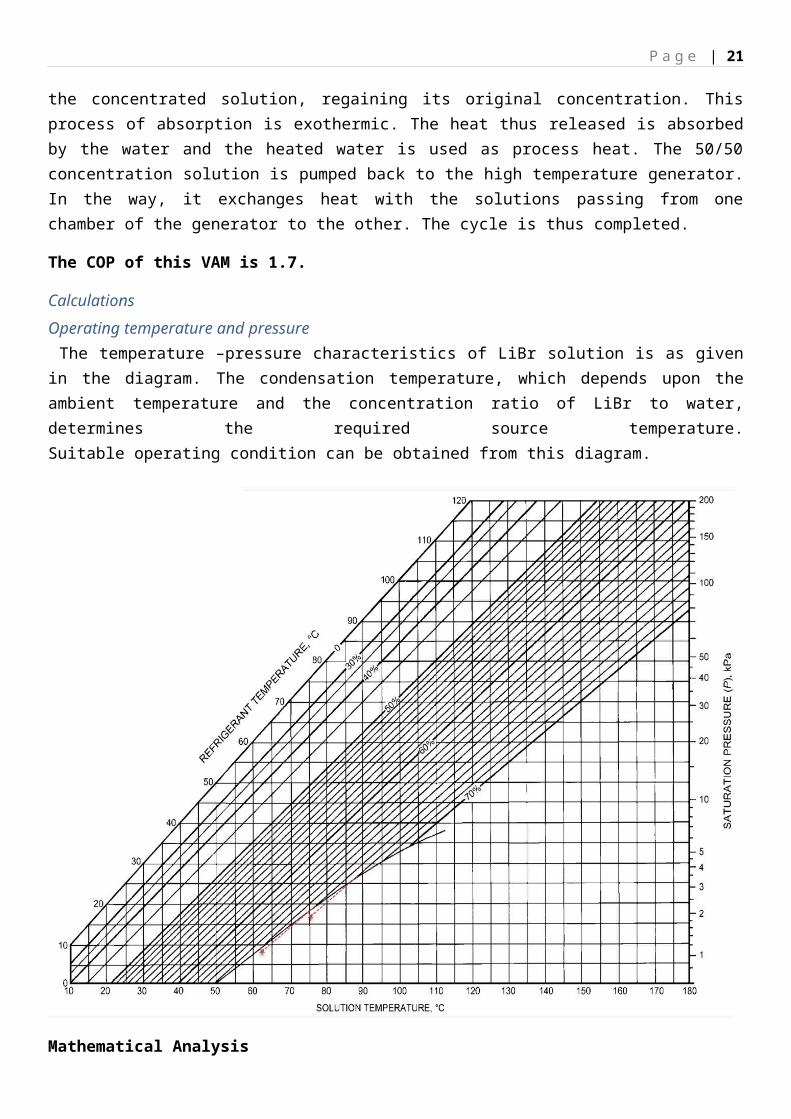
Operating temperature and pressure The temperature –pressure characteristics of LiBr solution is as given in the diagram. The condensation temperature, which depends upon the ambient temperature and the concentration ratio of LiBr to water, determines the required source temperature.Suitable operating condition can be obtained from this diagram.
P a g e | 17
Mathematical Analysis
Let, the high temperature generator produces heat at the rate 1kg/hr, which further produces ‘a’ kg/hr steam from the second generator. From the third generator, ‘b’ kg/hr steam is generated.
Mass balance and energy balanceIn the second generator, the steam flowing at 1kg/hr provides latent her for the a kg/hr steam.
1*(H4,180,v – H4,143,l) = a*(H0.9,120,v – H0.9,120,l)=> 1*(2817.04-604.7) = a*(2717.34-503.7)=> a=0.99
In the third generator, water from first generator and that from second generator , produce steam at the rate b kg/hr.
1*(H4,143,l – H4,90,l) + a*(H0.9,120,v – H0.9,90,l) = b*(H0.1,85,v – H0.1,85,l)=> 1*(604.7 – 376.9) + 0.99*(2717.34 – 376.9) = b*(2659.02 – 355.8)=> b=1.1
Thus, the water/steam obtained after the third generator is ( 1+0.99+1.1) = 3.1 kg/hr.
P a g e | 18
Concentration of solution in the third generator is 65/35 and that in first generator is 50/50. Thus, the mixture going into absorber from the third generator is at 10.3kg/hr. The total mixture going to the first generator after the heat exchanges at the three stages, from the absorber (at 40oC) is at 13.4kg/hr.
Let LiBr specific heat = 1kcal/sec
Mass and heat balance
Low temperature heat exchanger10.3 kg/hr mixture is going from 85oC to 40oC and gives heat to 13.4kg/hr mixture.
10.3*(85-40) = 13.4*(t3-40)=> t3=74.59oC
Thus, temperature after heat exchange from third generator = 74.59oC
Medium temperature heat exchanger10.3 + 1.1 =11.4 kg/hr (steam from first and second generator) is going from 120oC to 85oC. The mixture absorbs this heat release.
11.4*(120 – 85) = 13.4*(t2 - t3)=> 11.4*35 = 13.4*( t2 – 74.59)=> t2= 104.36oC
Thus, temperature after heat exchange from second generator = 104.36oC
Low temperature heat exchanger10.3 + 1.1 + 0.99=12.39 kg/hr (steam from first and second generator) is going from 180oC to 120oC. The mixture absorbs this heat release.
12.39*(180 – 120) = 13.4*(t1 – t2)=> 12.39*60 = 13.4*( t1 – 104.36)=> t2= 159.84oC
Thus, temperature after heat exchange from second generator = 159.84oC
Heat input from solar field = sensible heat required to change the temperature of the mixture from 159.84oC to 180oC and converting 1kg water to steam at 180oC.
Qin = [13.4*(180-159.84)*4.187] + [1*(2817.04 – 763.2) = 3184.93 KJ/hr = 0.88 KW
The three mixtures are flashed slowly in the evaporator where pressure is kept at 0.01 bar and evaporate at that point.
Assuming the flashing process to be isentropic,
Entropy before flashing= 0.5724 kJ/kg-K
Enthalpy after flashing = H = 159.98 KJ/kg
Heat taken from the cold water= Qout = (1 + a + b)* (H0.01,7,v – H)
P a g e | 19
= 3.1*(2514.2 – 159.98)= 7298.08 KJ/hr = 2 KW
COP = Qout/Qin = 2/0.88 = 2.2
Losses occur in the heat exchange process in the re-generators. Also, it was assumed that the specific heat of LiBr is equal to that of water for simplified calculations, but it is higher than that. Approximately 15% losses occur in the process.
Considering all the losses, COP is obtained to be 1.7
The calculation shown above is for 2 KW output. The VAM installed in SEC is a 100 KW system.
3. WATER DISTILLATION USING PV PANELS:
3.1 DESCRIPTION OF THE SYSTEM:
The system consists of photovoltaic panel mounted on frame inclined at 25ο. At the back of the panel, is a cloth attached having a pipe at its top. Water flows through pipe at a very slow speed (8mm/min). With a narrow opening in pipe, water wets the cloth attached to panel. Wet cloth takes away the panel heat and keeps it at a relatively lower temperature. As wet cloth takes heat, water from the cloth gets evaporated and to collect the vapour, a polycarobonate/plastic sheet is used to seal the bottom of the panel. Vapour is condensed on the sheet and collected down the slope into a beaker.
During the course of this project, the following data attributes were observed.
(i) Performance of PV panel w.r.t reference panel
(ii) Temperature of surface of panel w.r.t reference panel
(iii) Daily DNI
Surface temperature was measured using sensors and data was fed into data logger giving data from morning till evening. DNI was measured using pyranometers.
To measure the efficiency of panels, I-V / P-V characteristic curve were plotted by collecting data using rheostat, ammeters and voltmeters.
Thus the project is aimed at providing pure water along with increased performance of panels.
P a g e | 20
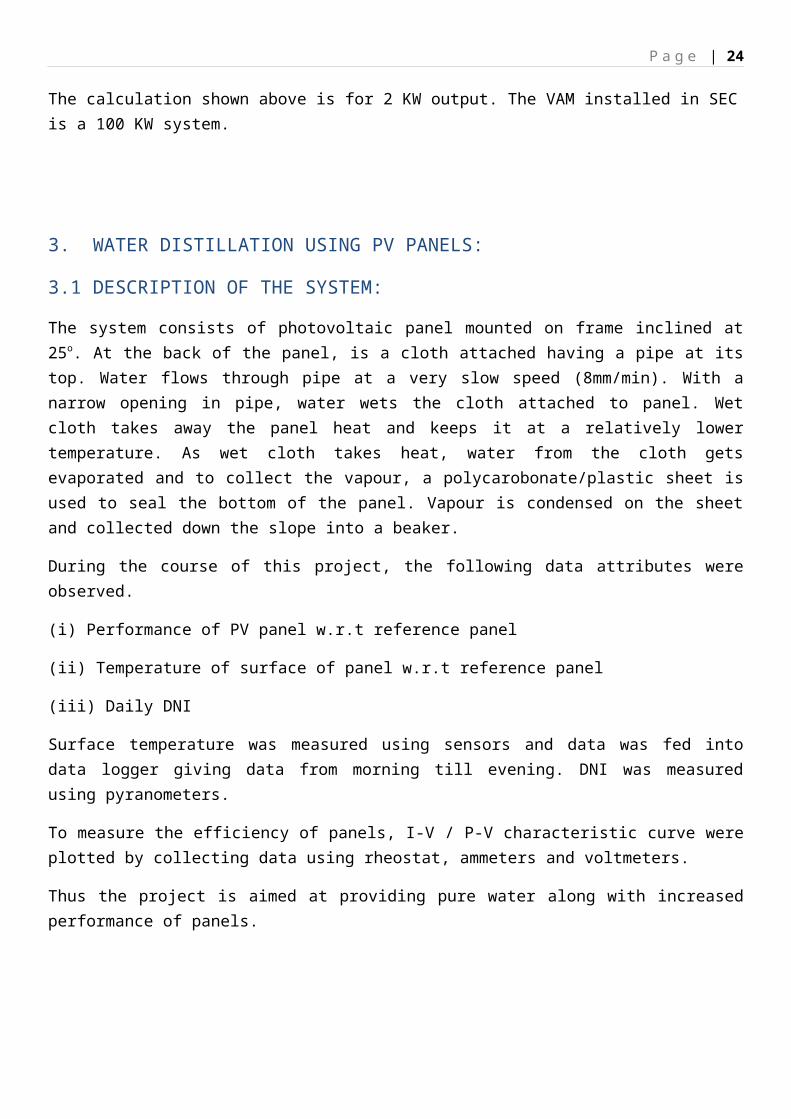
Figure 11 Photo of panel connected with rheostat and multimeters
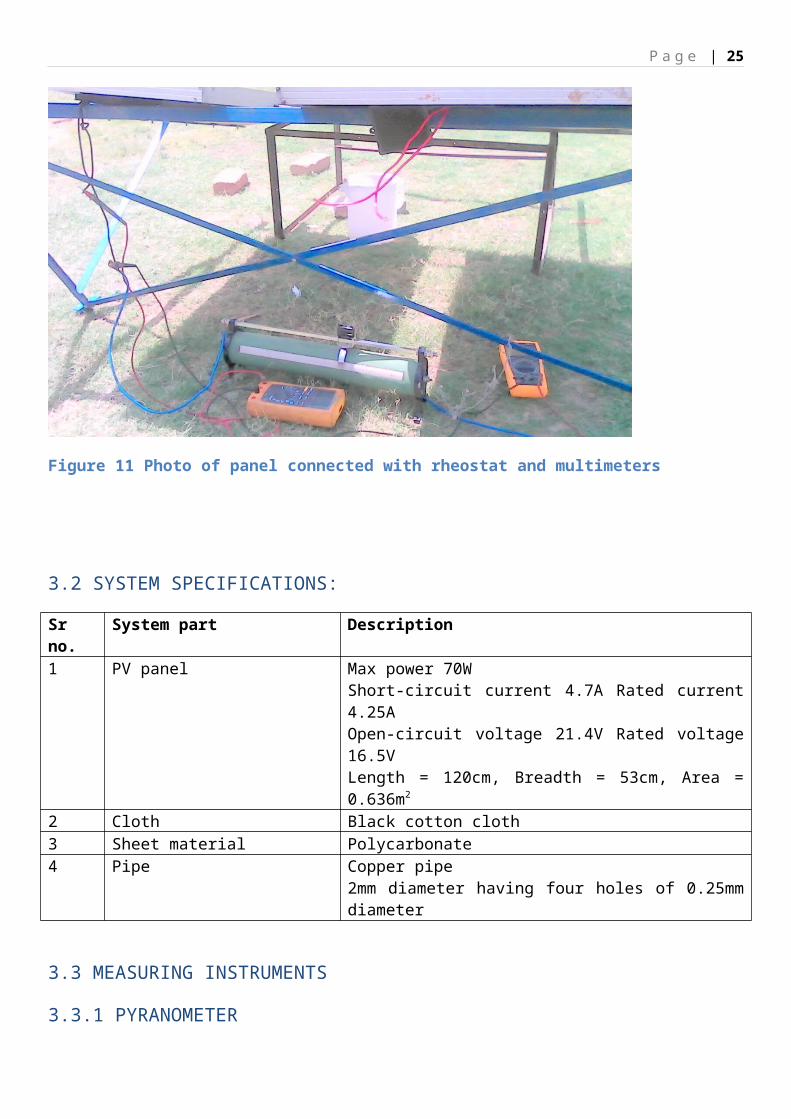
3.2 SYSTEM SPECIFICATIONS:
Sr no. System part Description1 PV panel Max power 70W
Short-circuit current 4.7A Rated current 4.25AOpen-circuit voltage 21.4V Rated voltage 16.5VLength = 120cm, Breadth = 53cm, Area = 0.636m2
2 Cloth Black cotton cloth3 Sheet material Polycarbonate4 Pipe Copper pipe
2mm diameter having four holes of 0.25mm diameter
3.3 MEASURING INSTRUMENTS
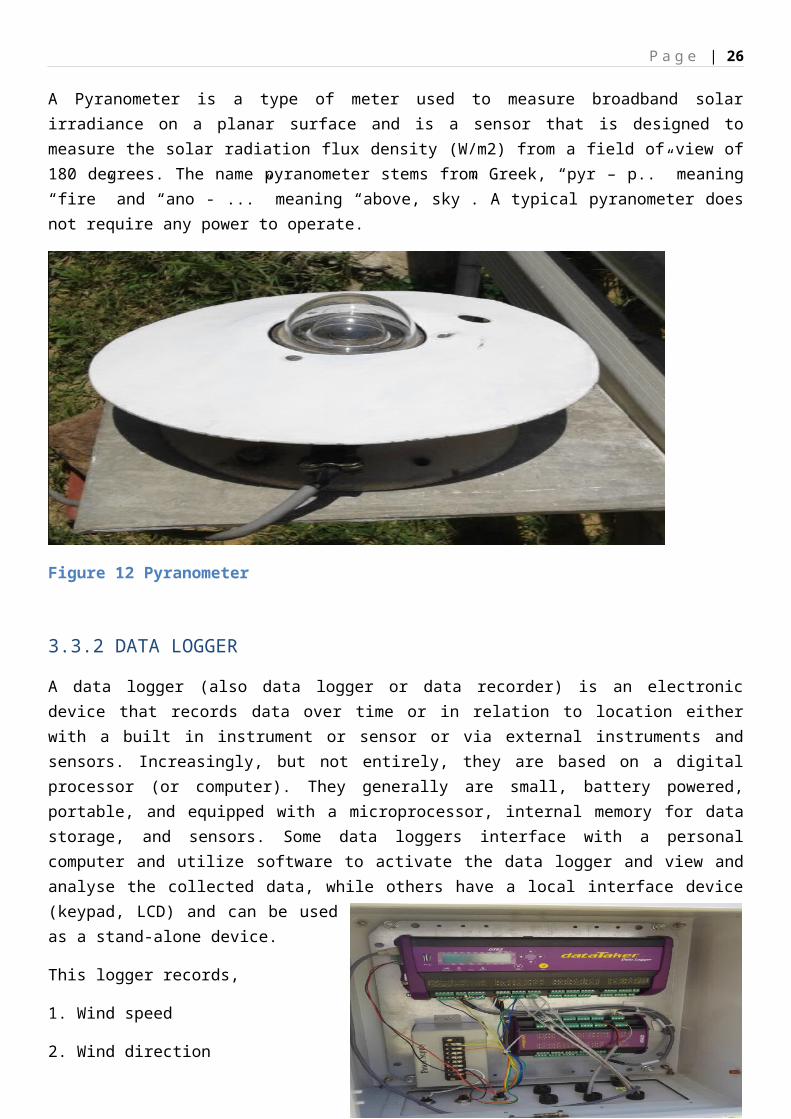
3.3.1 PYRANOMETER
A Pyranometer is a type of meter used to measure broadband solar irradiance on a planar surface and is a sensor that is designed to measure the solar radiation flux density (W/m2) from a field of view of 180 degrees. The name pyranometer stems from Greek, “pyr – p..” meaning “fire” and “ano - ...” meaning “above, sky”. A typical pyranometer does not require any power to operate.
P a g e | 21
Figure 12 Pyranometer
3.3.2 DATA LOGGER
A data logger (also data logger or data recorder) is an electronic device that records data over time or in relation to location either with a built in instrument or sensor or via external instruments and sensors. Increasingly, but not entirely, they are based on a digital processor (or computer). They generally are small, battery powered, portable, and equipped with a microprocessor, internal memory for data storage, and sensors. Some data loggers interface with a personal computer and utilize software to activate the data logger and view and analyse the collected data, while others have a local interface device (keypad, LCD) and can be used as a stand-alone device.
This logger records,
1. Wind speed
2. Wind direction
3. Global radiation
4. Temperatures with thermocouples (j-type)
5. Ambient wind temperature
Figure 13 Data Logger
P a g e | 22
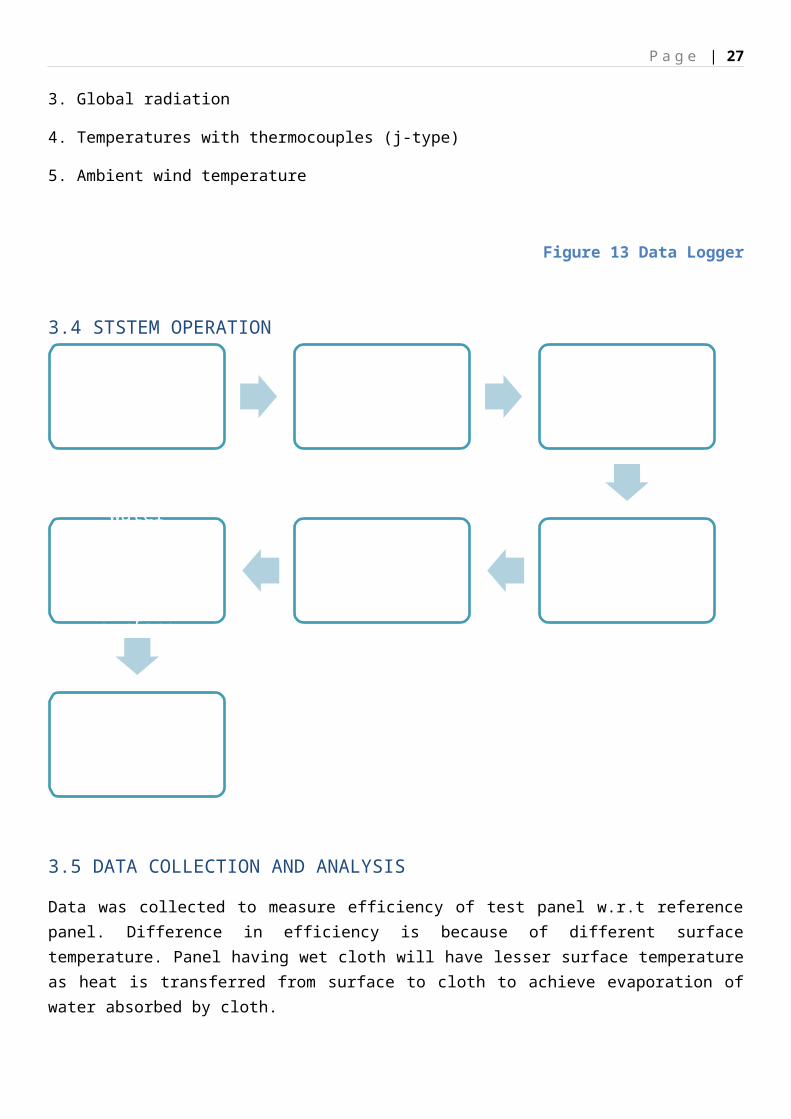
3.4 STSTEM OPERATION
3.5 DATA COLLECTION AND ANALYSIS
Data was collected to measure efficiency of test panel w.r.t reference panel. Difference in efficiency is because of different surface temperature. Panel having wet cloth will have lesser surface temperature as heat is transferred from surface to cloth to achieve evaporation of water absorbed by cloth.
3.5.1 CALCULATING PANEL EFFICIENCY
3.5.1.1 FOR TEST PANEL
Date: 17th June, 2015.Time: 12:00 PM – 12:05PM
voltae1 (V1)
current1 (I1)
power1 (P1)
0.09 3.1 0.279
4.04 3.1812.8472
9.66 3.2931.7814
Water Inlet through copper pipe
Water wets cloth from holes in pipe
Wet cloth absorbs heat from PV Panel
Evaporation of water
Condensation on sheet
Water collected in beaker flowing
through inclined surface
Pure water and hot water
P a g e | 23
11.76 3.0135.3976
13.94 2.45 34.153
15.62 1.6625.9292
16.04 1.4222.7768
16.57 1.4323.6951
16.73 0.9916.5627
16.79 0.9 15.111
16.83 0.8714.6421
16.99 0.7412.5726
17.03 0.7112.0913
17.05 0.6911.7645
17.28 0.53 9.158417.33 0.49 8.491717.37 0.46 7.990217.46 0.37 6.460217.5 0.32 5.617.56 0.26 4.565617.6 0.22 3.87217.66 0.17 3.002217.69 0.15 2.653517.71 0.13 2.302317.75 0.12 2.1317.75 0.11 1.952517.75 0.1 1.775
From the above data plotting, I-V and P-V characteristics
P a g e | 24
0 2 4 6 8 10 12 14 16 18 200
0.5
1
1.5
2
2.5
3
3.5
current1
current1
0 2 4 6 8 10 12 14 16 18 200
5
10
15
20
25
30
35
40
power1
power1
From the above graphs:
Vm = 13.94V
Im = 2.45A
Pm = 35.153W
Isc = 4.7A
Voc = 21.4V
Average radiation intensity = Input power = Pin = 766.49 W/m2
Area of panel = A= 0.636m2
Efficiency η1 = (Pm/Pi)*100
η1 = 35.153*100/(766.49*0.636) η1 = 9.211%
Thus, efficiency of test panel, having cooler surface is 9.211%.
3.5.1.2 For reference panel:
voltage2 (V2)
current2 (I2)
power2 (P2)
0.06 3.6 0.2160.14 3.33 0.4662
4.36 3.5315.3908
11.37 2.8932.8593
14.67 1.7625.8192
15.91 0.9 14.31916.4 0.85 13.94
P a g e | 25
16.53 0.7211.9016
16.81 0.58 9.749816.77 0.55 9.223516.16 0.41 6.625616.96 0.33 5.596817.1 0.29 4.95917.18 0.26 4.466817.18 0.21 3.607817.28 0.18 3.110417.28 0.17 2.937617.36 0.15 2.60417.39 0.13 2.260717.34 0.11 1.907417.41 0.1 1.74117.41 0.08 1.392817.41 0.07 1.2187
From the above data, similar graphs are plotted
0 2 4 6 8 10 12 14 16 18 200
5
10
15
20
25
30
35
power2
power2
0 2 4 6 8 10 12 14 16 18 200
0.5
1
1.5
2
2.5
3
3.5
4
current2
Thus, from the graph;
Pm = 32.8595W
Vm = 11.37V
Im = 2.89A
Efficiency = Pm/Pi
η2 = (32.9585*100)/(766.49*0.636) η2 = 6.74%.
P a g e | 26
3.5.2 COMPARISON OF VARIATION IN SURFACE TEMPERATURE OF TEST PANEL AND REFERENCE PANEL WITH CHANGE IN TIME AND DNI
1 6 11 16 21 26 31 36 41 46 51 56 61 66 71 76 81 86 91 96 1011061111161211261311361411461511561611661711761810
10
20
30
40
50
60
70
80
Surface temperature comparison between test and reference panels
Surface T1 (Avg.) ( コ C) Surface T2 (Avg.) ( コ C)
Surface T1 is surface of test panel and T2 that of reference panel. It is clearly shown that temperature of test panel remains lower than that of reference panel. This lower temperature increases efficiency of panel.
3.6 CONCLUSION:
P a g e | 27
From the above analysis, it is observed that efficiency of panel with cooler surface (i.e having wet cloth) is 2.471% more than that of reference panel during the time of recording of observations. Considering factor like variations in global radiation, wind-speed, humidity and ambient temperature; average difference in efficiency for a whole day can be around 1.5-2%. Thus, by transferring heat from surface of panel to wet cloth, attached to it; dual objective of getting desalinated water and higher panel efficiency is achieved. This method of desalinating will make notable difference in market of desalination technologies, given further research is carried out to tackle problems in areas described below.
FUTURE RESEARCH:
This section focusses on areas that can be possibly explored to carry out further research on this project
Change in material of cloth to absorb more brackish water Measure the effect of flow on output quantity of water w.r.t DNI. Effect of humidity, ambient temperature and wind velocity on condensation rate Water quality v/s water flow rate
4. REFERENCES:
1. Hikmet S. Aybar,”Mathematical modelling of inclined solar water distillation system”, Desalination190 (2006), pp63-70.
2. Solar Photovoltaic Technology and systems by Chetan Singh Solanki.
3. Solar energy engineering by Soteris Kalogirou.
4. Vishakha Sinha, Er. SK Singh, “Solar Thermal Technology, Internship report”, May-July, 2014.