Embed Size (px)
Citation preview
Volume 4:
Nitrogen Loss inSurface Runoff
Assessment of Environmental Sustainability in Alberta's Agricultural Watersheds Project
Volume 4:
Nitrogen Loss in Surface Runoff
Janna P. Casson1, Barry M. Olson1, Joanne L. Little1, and Sheilah C. Nolan2
1Water Resources Branch, Alberta Agriculture and Rural Development, Lethbridge, Alberta, Canada
2Agri-Environmental Management Branch, Alberta Agriculture and Rural Development, Edmonton, Alberta, Canada
2008

ii
Citation Casson, J.P., Olson, B.M., Little, J.L., and Nolan, S.C. 2008. Assessment of Environmental Sustainability in Alberta's Agricultural Watersheds Project. Volume 4: Nitrogen loss in surface runoff. Alberta Agriculture and Rural Development, Lethbridge, Alberta, Canada. 71 pp. Published by Water Resources Branch Alberta Agriculture and Rural Development Lethbridge, Alberta, Canada Copyright © 2008. Her Majesty the Queen in Right of Alberta (Alberta Agriculture and Rural Development). All rights reserved. No part of this publication may be reproduced, stored in a retrieval system, or transmitted in any form or by any means, electronic, mechanical, photocopying, or otherwise without permission from Alberta Agriculture and Rural Development. Printed in Canada Copies of this report are available from Water Resources Branch Alberta Agriculture and Rural Development Agriculture Centre 100, 5401 - 1 Avenue South, Lethbridge, Alberta Canada, T1J 4V6 Phone (403) 381-5140
iii
ABSTRACT Agricultural sources of nutrients are associated with the eutrophication of surface waters in Alberta and elsewhere. Eutrophication is the excessive growth of aquatic plants and algae due to the enrichment of surface waters with nutrients, and this can degrade water quality for domestic, industrial, and recreational uses. Phosphorus (P) and nitrogen (N) from agricultural land are major non-point sources nutrients of particular concern. The application of commercial fertilizers, livestock manure, and increase water erosion contribute to nutrient loss. The ability to predict the amount of nutrient loss in runoff water from soil characteristics would be a useful tool for determining potential risk to nutrient losses in Alberta. Although some work has been carried out for P in Alberta, there are limited field-scale data for determining soil N and runoff N relationships in the province. The purpose of this 3-yr study was to determine the field-scale relationship between soil nitrate N and runoff total N and nitrate N from field-sized catchments or “microwatersheds” under spring snowmelt and summer rainfall conditions in Alberta. Eight field-scale micro watersheds (2 to 248 ha) throughout Alberta were selected for the study. One site was ungrazed grassland, five sites were cultivated, non-manured crop fields, and two sites were manured crop fields. The sites were instrumented with circular flumes and automated water samplers and runoff was monitored for a 3-yr period. Soils were sampled from three incremental layers (0 to 2.5 cm, 2.5 to 5 cm and 5 to 15 cm) each spring and fall using a stratified landform-based approach. Soil samples were analyzed for extractable nitrate N content and the results were calculated for the 0- to 2.5-cm, 0- to 5-cm, and 0- to 15-cm soil layers. Water samples were analyzed for nitrate N, ammonia N, and total N concentrations. Moderate to high application rates of manure caused higher nitrate N levels in the soil. The seasonal mean nitrate N content in the surface 15 cm of soil ranged from 2 to 74 mg kg-1 among the sites. The manured sites tended to have higher nitrate N content and the grassland site had the least amount of nitrate N. Spring runoff, which was mainly from snowmelt, accounted for the majority of runoff at nearly all of the sites, overall, snowmelt runoff accounted for 90% of the runoff. The seasonal nitrate N flow-weighted mean concentration (FWMC) ranged from below detection limit to 43.4 mg L-1, and the seasonal total N FWMC ranged from 0.43 to 106 mg L-1 among the sites. Concentrations of total N exported from the microwatersheds exceeded the in-stream Alberta water quality guideline of 1 mg L-1 total N at all sites. Significant linear relationships were found between extractable nitrate N in soil and total N in runoff (r2 = 0.65 to 0.72), and between extractable nitrate N in soil and nitrate N in runoff (r2 = 0.62 to 0.69). There was no relationship between soil nitrate N and runoff ammonia N. The relationships were driven by one point from one of the manured sites (from a single rainfall event in 2005), and when this point was removed, the relationships were considerably weaker (r2 = 0.28 to 0.44). Therefore, the relationships are not particularly strong and soil extractable nitrate N is a weak predictor of nitrate N or total N in edge-of-field runoff water.

iv
ACKNOWLEDGEMENTS We wish to thank Rod Bennett, Frank Hecker, Andrea Kalischuk, Brent Paterson, Andy Jedrych, Callie Volf, and Gerald Ontkean. Thanks to Lawrence Schinkel, Murray Peters, Ward Henry, Syd Abday, Wayne Jamieson, Francine Forrest, Debbie Werk, Keith Adamson, Paul Graveland, Andrea Kalischuk, Janelle Villeneuve for assistance with runoff sampling; and to Tom Goddard, Brandon Green, Doug Keyes, Roger Andreiuk, Doug Penney, Wayne Pettapiece, Bob MacMillan, Emmanuel Mapfumo, Deb Werk, Germar Lohstraeter, Kerrianne Koehler-Munro, Craig Sprout, Mark Nelson, Wiebe Buruma, Bonnie Clease, Dave Hyland, Roger Skretting, Paul Maloff, Heather Kolberg, and Dave Coutts for assistance with soil sampling design, method development, and data collection. Thanks also to Enviro-Test Laboratories (now ALS Laboratory Group) and Norwest Labs (now part of Bodycote Testing Group) for sample analysis. In addition, this project would not be possible without the cooperation of the producers, landowners, and the municipalities. Partial funding for this study came from the Agricultural Funding Consortium, with contributions from the Alberta Livestock Industry Development Fund, the Alberta Crop Industry Development Fund, and the Alberta Agricultural Research Institute.
v
TABLE OF CONTENTS
Abstract ……………………….……………………………………………………………… iii Acknowledgements ……………..…………………………………………………………… iv Table of contents …………….….…………………………………………………………… v List of figures …………….………………………………………………………………….. vi List of tables …………………………………………………………………………….……. vii List of appendices ………………..…………………………………………….…………….. viii Introduction …….…..…………..……………………………………………………………. 1 Materials and methods ……………………………………………………………………….. 4 Site description ……..……………….……………………………………………….. 4 Soil sampling and analysis …………………………………………………………… 6 Soil sampling ………………………………………………………………… 6 Quality control………………………………………..………………………. 7 Extractable nitrate nitrogen …..……..……………………………………….. 7 Site instrumentation ………..………………………………………………………… 7 Flumes ……….……………………………………………………………….. 7 Other instrumentation………………………………………………………… 8 Water sampling and analysis …….………..…………………………………………. 9 Data analysis ……………..…………….…………………………………………….. 9 Flow measurements ………………………………………………………….. 9 Runoff nitrogen calculations …………………….…………………………… 10 Statistical analysis …………….……………………………………………… 10 Results and discussion ……………………………………………………………………….. 11 Soil nitrate nitrogen …………………………..………………………………………. 11 Quality control results………………………………………………………… 11 Soil nitrate nitrogen content …………….……………………………………. 13 Runoff water …………….…………………………………………………….……. 16 Hydrographs …………………………………………………………….……. 16 Spring runoff nitrogen concentrations …………..…………………………… 20 Summer runoff nitrogen concentrations ………………..……………………. 22 Relating nitrogen concentrations in soil and runoff ……….……….………….…….. 23 Conclusions …………………………………………………………………………….……. 26 References ……………………………………………………………………………….…… 27 Appendices …..………………………………………………………………………………. 30
vi
LIST OF FIGURES
Figure 1. Microwatershed sites within the agricultural regions of Alberta …….…….……. 4 Figure 2. Profile and front view of a typical circular flume …….…………………………. 8 Figure 3. Extractable nitrate N values for the batch soil samples compared to the check samples. Perfect agreement between the batch and check samples would have resulted in all the points falling on a 1-to-1 line …….…………………………… 12 Figure 4. Mean extractable nitrate N in soil at the upper, mid, and lower landform positions at the study sites in the fall of 2002. Within each site, bars with the same letter are not significantly different at P ≤ 0.05 ……….…………………… 16 Figure 5. Relationships between nitrate N in soil and N in runoff ……..………………….. 25
vii
LIST OF TABLES Table 1. Characteristics and management information of the fields closest to the drainage outlet at the eight microwatershed sites (Little et al. 2007) …..………... 4 Table 2. Summary of surface soil and landform characteristics in the microwatersheds (Little et al. 2006, 2007) …………………………………………………………. 6 Table 3. Extractable nitrate N means for the reference soil samples …….……………….. 11 Table 4. Nitrate N content of five batch sample compared to the corresponding check sample values …………………………………………………………………….. 12 Table 5. Mean extractable nitrate N values in the 0- to 2.5-cm soil layer at each microwatershed site ……………………………………………………………… 14 Table 6. Mean extractable nitrate N values in the 0- to 5-cm soil layer at each microwatershed site ……………………………………………………………… 15 Table 7. Mean extractable nitrate N values in the 0- to 15-cm soil layer at each microwatershed site………………………………………………………………. 15 Table 8. Hydrological characteristics of the spring and summer runoff events…………… 17 Table 9. Precipitation differences from 30-yr normal (1971 to 2000) data for each
microwatershed site ……………………………………………………………… 18 Table 10. Minima, maxima, and flow-weighted mean concentrations (FWMC) of nitrate N and total N from all sites ………………………………………………. 21 Table 11. Ratio of nitrate N flow-weighted mean concentration (FWMC) to total N FWMC by runoff type. Ratios of ammonia N FWMC to total N FWMC are in parentheses ………………..………………………………….…………… 22
viii
LIST OF APPENDICES Appendix 1. Descriptive statistics for the soil extractable nitrate N data for the eight
microwatersheds……………………………………………………………… 30 Appendix 2. Extractable soil nitrate N data for the reference samples (i.e., Sample 52) from the eight microwatersheds ……………………………………………… 38 Appendix 3. Extractable soil nitrate N data for the check samples and the corresponding batch samples ………………………………………………… 39 Appendix 4. Extractable soil nitrate N data for the eight microwatersheds from 2002 to 2005 ……………………………………………………………………….. 47 Appendix 5. Runoff N concentrations from the microwatershed sites …………………….. 5
1
INTRODUCTION Nitrogen (N) is a key nutrient input for optimum crop production in intensive agricultural systems, and most agricultural systems are deficient in N and will respond significantly to added N (Delgado 2002; Eickhout et al. 2006). Nitrogen is often applied to crop land through the use of commercial fertilizers and livestock manures. Nitrogen can also be increased in soil through the use of legumes in crop rotations. At the beginning of this century, 49.5 million Mg of N fertilizer was used worldwide (Baligar et al. 2001). Being one of the most dynamic and mobile elements, N is difficult to manage for crop production (Delgado 2002). The recovery of N fertilizer is about 50% on average, and the excess accumulates in soil or is lost (Delgado 2002; Eickhout et al. 2006). Nitrogen fertilizer is susceptible to losses through volatilization, denitrification, leaching, surface runoff, and wind erosion (Delgado 2002). The loss of N to surface water, with sufficient phosphorus (P), can cause or accelerate eutrophication (Chambers et al. 2001; Eickhout et al. 2006). High nitrate N levels in drinking water can have human health implications (Chambers et al. 2001). Nitrogen enters lakes and streams with sediment and as dissolved organic and inorganic forms (Follett and Delgado 2002). Eutrophication is the excessive growth of aquatic plants and algae due to the enrichment of surface waters with nutrients, which in turn cause oxygen depletion, taste and odour problems, loss of biodiversity, and loss of aesthetic and recreational value (Carpenter et al. 1998; Follett and Delgado 2002). Even though N and P are associated with accelerated eutrophication, P has received the most attention (Sharpley et al. 1987). In water bodies, P tends to be the more limiting nutrient. Sharpley et al. (1987) suggested that N is less limiting because of N exchange between the atmosphere and water bodies and fixation of atmospheric N by blue-green algae. Nutrient additions that cause eutrophication have been identified as “one of the most significant forms of river pollution” by the United Nations (UNESCO 2002) and one of most common causes of impairment in fresh waters in the United States (US EPA 1998). Contamination of ground and surface water by N is also a growing concern in Canada (Chambers et al. 2001; De Jong et al. 2007). Eickhout et al. (2006) predicted that losses of N to air and water will continue to increase well into the twenty-second century, particularly in developing countries, because of increased human population, increased food consumption, a shift to more meat-based diets, increased in the arable land base, and more intensive agricultural systems. Nitrogen loss through runoff has been studied by many researchers looking at the effects of land cover and management (Burnwell et al. 1975; Douglas et al. 1998; Schilling and Spooner 2006), manure application (Eghball and Gilley 1999; Harmel et al. 2006; Miller et al. 2006), commercial fertilizers (Gascho et al. 1998), soil type (Harmel et al. 2006), hydrology (Zheng et al. 2006), and tillage methods (Römkens et al. 1973; Masand 1992). Though nitrate N can be lost through surface runoff, larger amounts are generally lost through sub-surface flow (Hubbard and Sheridan 1983; Alberts and Spomer 1985; Hubbard et al. 1991; Lowrance 1992).
2
Harmel et al. (2006) summarized N and P load data (expressed as kg ha-1) from 40 peer reviewed papers. They reported that annual N loads exhibited no relationship with field size, but dissolved N was significantly related to application rate. However, particulate and total N were not related to application rate. They also reported that, on average, particulate N losses contributed three times as much as dissolved forms. They found a weak, significant direct relationship between annual P load and soil-test phosphorus (STP), but there was no mention of a relationship or lack of a relationship between annual N load and soil N. Particulate N loads were highest with conventional tillage compared to conservation or zero-tillage. Dissolved N losses were higher with zero tillage, and N loads were lower from pasture and rangeland compared to cultivated land. Even though conservation tillage had a clear effect on nutrient load loss, there was no clear tendency regarding effects on nutrient loads by other conservation practices such as waterways, terraces, riparian buffers, and filter strips. Export coefficients of N, P, and suspended solids for southern Alberta were reviewed by Jeje (2006). For non-intensive agriculture land, total N export coefficients ranged from 0.63 to 9.8 kg ha-1 yr-1; whereas, export coefficients ranged from 0.1 to 14.9 kg ha-1 yr-1 for intensive agricultural land. The amount of N lost in surface runoff is usually small compared to N fertilizer inputs to cropping systems. In an 8-year monitoring project of 20 watersheds, Sharpley et al. (1987) found that 3 to 9% of N fertilizer inputs were lost in surface runoff. They also reported that on average 64% of total N lost in runoff was in particulate form. Crop rotation watersheds lost 2.3 times more N compared to unfertilized native grassland. Understanding relationships between nutrients near the soil surface and the loss of nutrients in runoff water and the factors that influence these relationships is useful in making predictions, assessing risk, and evaluating management practices. Relationships between soil P and runoff P has been reported by several researchers (Sharpley et al. 1977, 1978; Daniel et al. 1994; Pote et al. 1996; Torbert et al. 2002; Little et al. 2007). Similar type relationships have not been reported in the literature for N. A few researchers have shown some relationship between soil N and runoff N. Gilley et al. (2007), in a small-plot rainfall simulation study, reported that by reducing the nitrate N content in the top 5 cm of soil from 9.49 to 2.52 mg kg-1, the amount of nitrate N in runoff was reduced from 2.29 to 0.60 mg L-1. Miller et al. (2006) found a significant positive relationship between ammonium N in soil and ammonium N in runoff from a manure rate application study. Perhaps the dynamic nature of N in soil, and the fact P has received more attention, may be reasons why quantitative relationships between soil and runoff N are not readily available. From 1999 to 2006, the Alberta Soil Phosphorus Limits Project was carried out to develop recommendations for P limits for agricultural land in Alberta (Paterson et al. 2006). The project included literature reviews, laboratory studies, and field studies. One of the field studies was a 3-yr study where eight, small, agricultural watersheds in Alberta were monitored for soil nutrients and nutrient loss in edge-of-field runoff water. The main focus of the study was to develop a relationship between soil-test phosphorus (STP) and P in the runoff water. Little et al. (2006, 2007) reported a linear relationship between soil and runoff P. In addition to the P data, N in the soil and runoff water was also measured, but the results were not reported. The purpose of this

3
report is to summarize the N data from the Alberta Soil Phosphorus Limits Project watershed study. The main objective of this study was to determine the field-scale relationship between soil nitrate N and runoff total N and nitrate N from field-sized catchments or “microwatersheds” under spring snowmelt and summer rainfall conditions in Alberta.
4
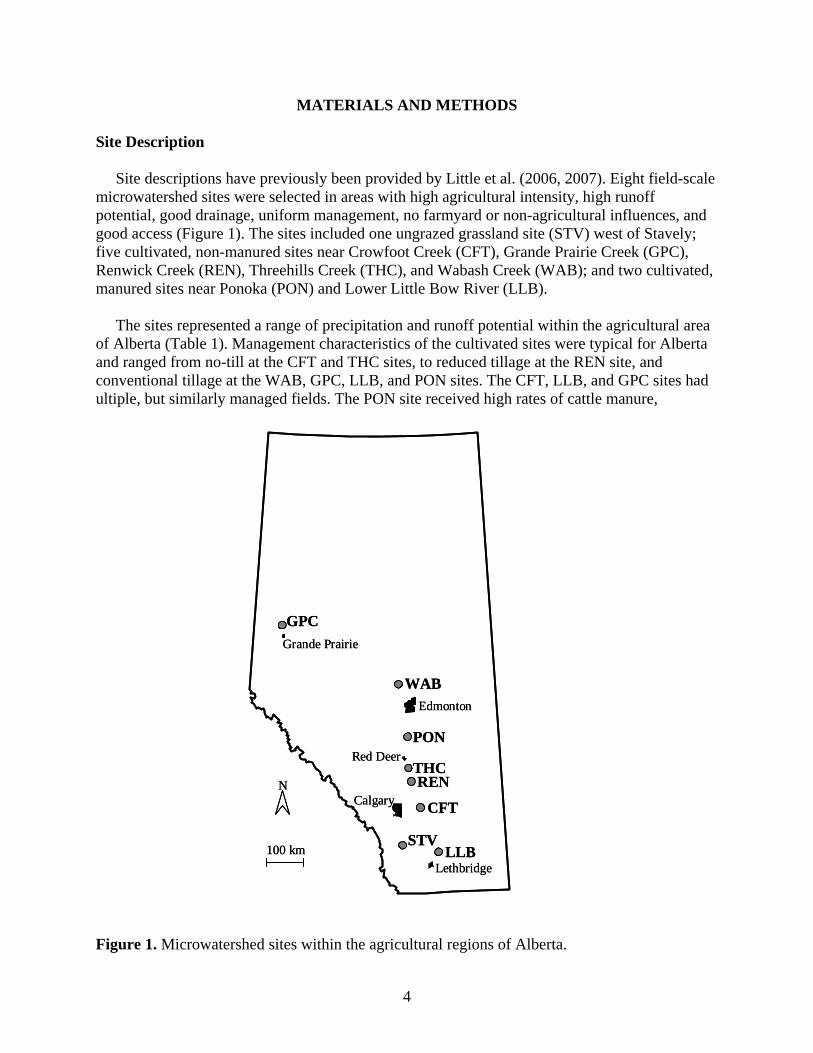
MATERIALS AND METHODS Site Description Site descriptions have previously been provided by Little et al. (2006, 2007). Eight field-scale microwatershed sites were selected in areas with high agricultural intensity, high runoff potential, good drainage, uniform management, no farmyard or non-agricultural influences, and good access (Figure 1). The sites included one ungrazed grassland site (STV) west of Stavely; five cultivated, non-manured sites near Crowfoot Creek (CFT), Grande Prairie Creek (GPC), Renwick Creek (REN), Threehills Creek (THC), and Wabash Creek (WAB); and two cultivated, manured sites near Ponoka (PON) and Lower Little Bow River (LLB). The sites represented a range of precipitation and runoff potential within the agricultural area of Alberta (Table 1). Management characteristics of the cultivated sites were typical for Alberta and ranged from no-till at the CFT and THC sites, to reduced tillage at the REN site, and conventional tillage at the WAB, GPC, LLB, and PON sites. The CFT, LLB, and GPC sites had ultiple, but similarly managed fields. The PON site received high rates of cattle manure,
Figure 1. Microwatershed sites within the agricultural regions of Alberta.
GPCGrande Prairie
PON
WABEdmonton
Red DeerTHCREN
CFT
STVLLB
Calgary
Lethbridge100 km
N
GPCGrande Prairie
PON
WABEdmonton
Red DeerTHCREN
CFT
STVLLB
Calgary
Lethbridge100 km
N
5
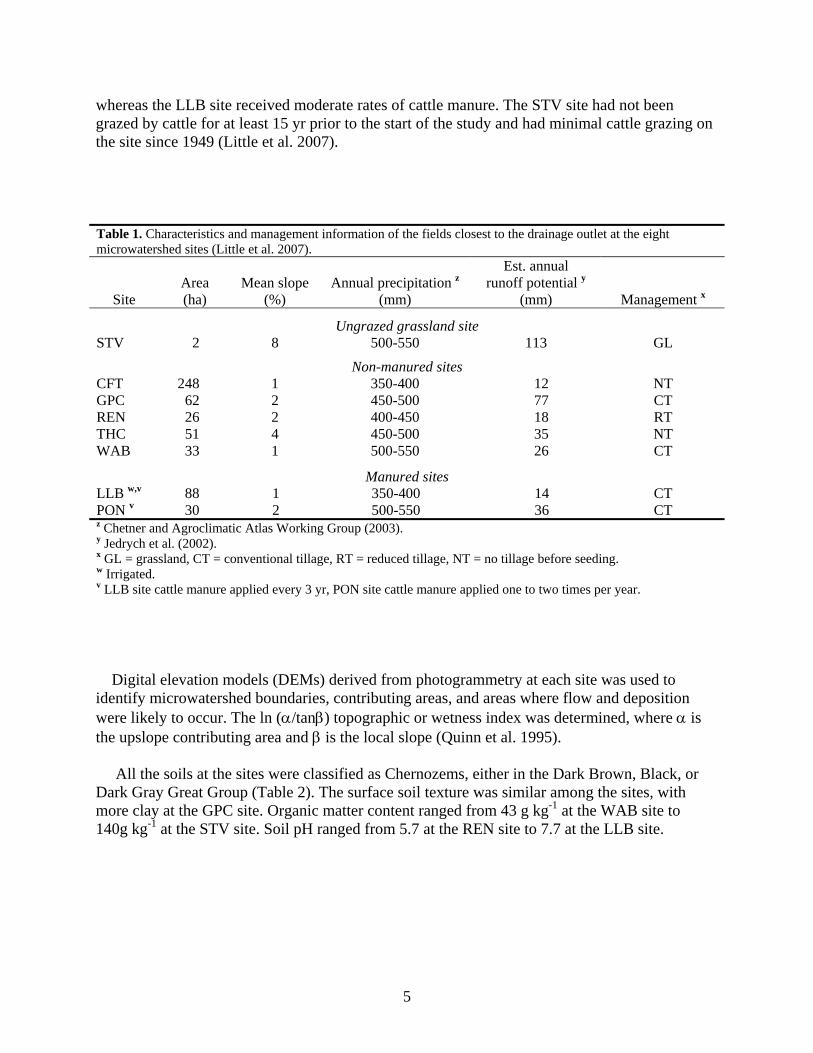
whereas the LLB site received moderate rates of cattle manure. The STV site had not been grazed by cattle for at least 15 yr prior to the start of the study and had minimal cattle grazing on the site since 1949 (Little et al. 2007). Table 1. Characteristics and management information of the fields closest to the drainage outlet at the eight microwatershed sites (Little et al. 2007).
Site
Area (ha)
Mean slope (%)
Annual precipitation z (mm)
Est. annual runoff potential y
(mm) Management x
Ungrazed grassland site STV 2 8 500-550 113 GL
Non-manured sites CFT 248 1 350-400 12 NT GPC 62 2 450-500 77 CT REN 26 2 400-450 18 RT THC 51 4 450-500 35 NT WAB 33 1 500-550 26 CT
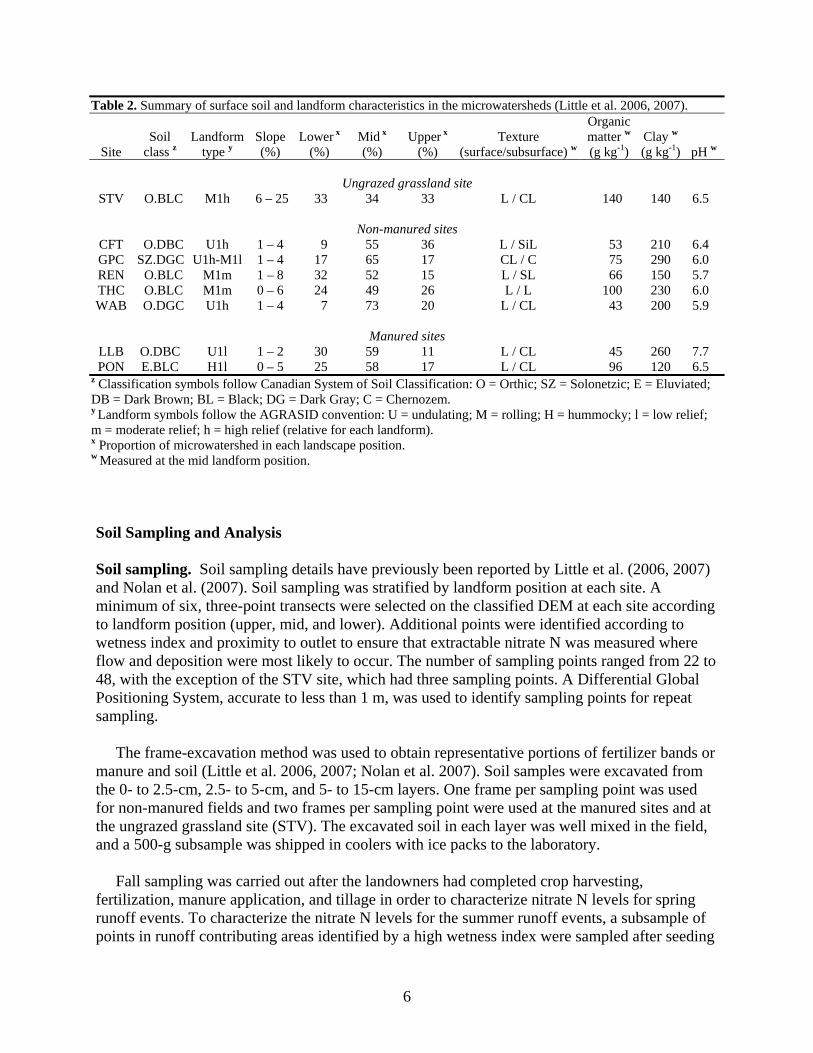
Manured sites LLB w,v 88 1 350-400 14 CT PON v 30 2 500-550 36 CT z Chetner and Agroclimatic Atlas Working Group (2003). y Jedrych et al. (2002). x GL = grassland, CT = conventional tillage, RT = reduced tillage, NT = no tillage before seeding. w Irrigated. v LLB site cattle manure applied every 3 yr, PON site cattle manure applied one to two times per year. Digital elevation models (DEMs) derived from photogrammetry at each site was used to identify microwatershed boundaries, contributing areas, and areas where flow and deposition were likely to occur. The ln (α/tanβ) topographic or wetness index was determined, where α is the upslope contributing area and β is the local slope (Quinn et al. 1995). All the soils at the sites were classified as Chernozems, either in the Dark Brown, Black, or Dark Gray Great Group (Table 2). The surface soil texture was similar among the sites, with more clay at the GPC site. Organic matter content ranged from 43 g kg-1 at the WAB site to 140g kg-1 at the STV site. Soil pH ranged from 5.7 at the REN site to 7.7 at the LLB site.
6
Table 2. Summary of surface soil and landform characteristics in the microwatersheds (Little et al. 2006, 2007).
Site Soil
class z Landform
type y Slope
(%) Lower x
(%) Mid x (%)
Upper x (%)
Texture (surface/subsurface) w
Organic matter w
(g kg-1) Clay w(g kg-1) pH w
Ungrazed grassland site
STV O.BLC M1h 6 – 25 33 34 33 L / CL 140 140 6.5
Non-manured sites CFT O.DBC U1h 1 – 4 9 55 36 L / SiL 53 210 6.4 GPC SZ.DGC U1h-M1l 1 – 4 17 65 17 CL / C 75 290 6.0 REN O.BLC M1m 1 – 8 32 52 15 L / SL 66 150 5.7 THC O.BLC M1m 0 – 6 24 49 26 L / L 100 230 6.0 WAB O.DGC U1h 1 – 4 7 73 20 L / CL 43 200 5.9
Manured sites
LLB O.DBC U1l 1 – 2 30 59 11 L / CL 45 260 7.7 PON E.BLC H1l 0 – 5 25 58 17 L / CL 96 120 6.5
z Classification symbols follow Canadian System of Soil Classification: O = Orthic; SZ = Solonetzic; E = Eluviated; DB = Dark Brown; BL = Black; DG = Dark Gray; C = Chernozem. y Landform symbols follow the AGRASID convention: U = undulating; M = rolling; H = hummocky; l = low relief; m = moderate relief; h = high relief (relative for each landform). x Proportion of microwatershed in each landscape position. w Measured at the mid landform position. Soil Sampling and Analysis Soil sampling. Soil sampling details have previously been reported by Little et al. (2006, 2007) and Nolan et al. (2007). Soil sampling was stratified by landform position at each site. A minimum of six, three-point transects were selected on the classified DEM at each site according to landform position (upper, mid, and lower). Additional points were identified according to wetness index and proximity to outlet to ensure that extractable nitrate N was measured where flow and deposition were most likely to occur. The number of sampling points ranged from 22 to 48, with the exception of the STV site, which had three sampling points. A Differential Global Positioning System, accurate to less than 1 m, was used to identify sampling points for repeat sampling. The frame-excavation method was used to obtain representative portions of fertilizer bands or manure and soil (Little et al. 2006, 2007; Nolan et al. 2007). Soil samples were excavated from the 0- to 2.5-cm, 2.5- to 5-cm, and 5- to 15-cm layers. One frame per sampling point was used for non-manured fields and two frames per sampling point were used at the manured sites and at the ungrazed grassland site (STV). The excavated soil in each layer was well mixed in the field, and a 500-g subsample was shipped in coolers with ice packs to the laboratory. Fall sampling was carried out after the landowners had completed crop harvesting, fertilization, manure application, and tillage in order to characterize nitrate N levels for spring runoff events. To characterize the nitrate N levels for the summer runoff events, a subsample of points in runoff contributing areas identified by a high wetness index were sampled after seeding
7
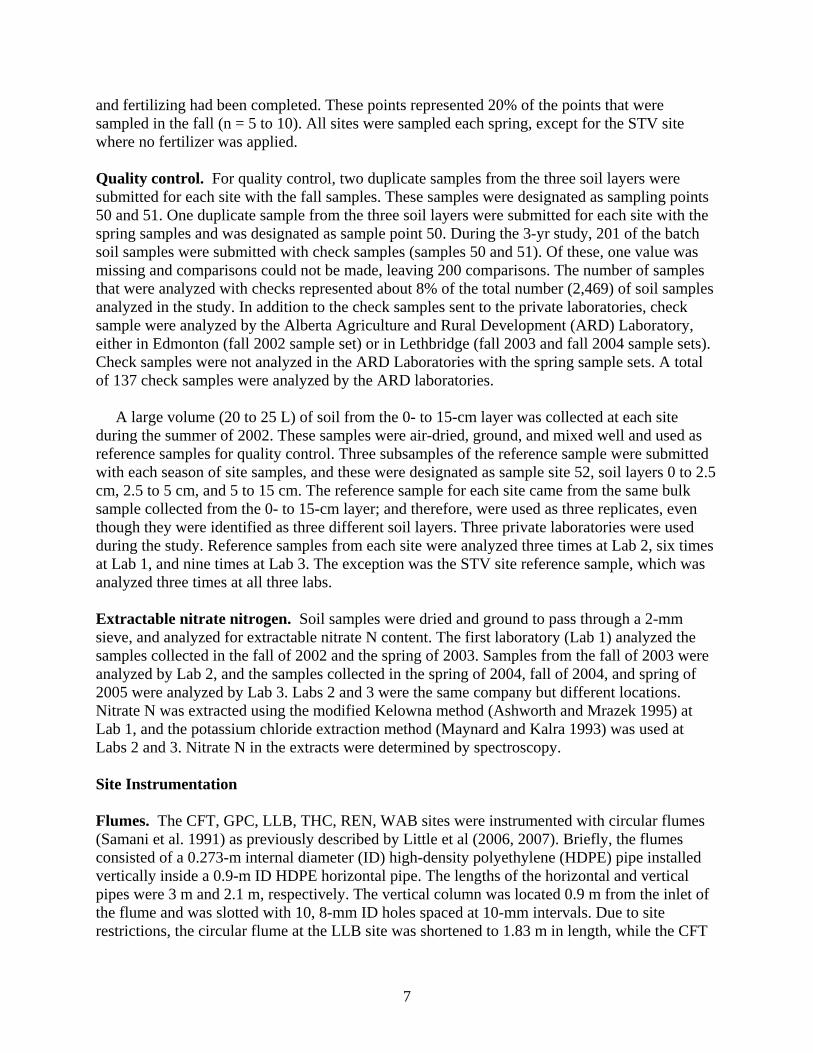
and fertilizing had been completed. These points represented 20% of the points that were sampled in the fall (n = 5 to 10). All sites were sampled each spring, except for the STV site where no fertilizer was applied. Quality control. For quality control, two duplicate samples from the three soil layers were submitted for each site with the fall samples. These samples were designated as sampling points 50 and 51. One duplicate sample from the three soil layers were submitted for each site with the spring samples and was designated as sample point 50. During the 3-yr study, 201 of the batch soil samples were submitted with check samples (samples 50 and 51). Of these, one value was missing and comparisons could not be made, leaving 200 comparisons. The number of samples that were analyzed with checks represented about 8% of the total number (2,469) of soil samples analyzed in the study. In addition to the check samples sent to the private laboratories, check sample were analyzed by the Alberta Agriculture and Rural Development (ARD) Laboratory, either in Edmonton (fall 2002 sample set) or in Lethbridge (fall 2003 and fall 2004 sample sets). Check samples were not analyzed in the ARD Laboratories with the spring sample sets. A total of 137 check samples were analyzed by the ARD laboratories. A large volume (20 to 25 L) of soil from the 0- to 15-cm layer was collected at each site during the summer of 2002. These samples were air-dried, ground, and mixed well and used as reference samples for quality control. Three subsamples of the reference sample were submitted with each season of site samples, and these were designated as sample site 52, soil layers 0 to 2.5 cm, 2.5 to 5 cm, and 5 to 15 cm. The reference sample for each site came from the same bulk sample collected from the 0- to 15-cm layer; and therefore, were used as three replicates, even though they were identified as three different soil layers. Three private laboratories were used during the study. Reference samples from each site were analyzed three times at Lab 2, six times at Lab 1, and nine times at Lab 3. The exception was the STV site reference sample, which was analyzed three times at all three labs. Extractable nitrate nitrogen. Soil samples were dried and ground to pass through a 2-mm sieve, and analyzed for extractable nitrate N content. The first laboratory (Lab 1) analyzed the samples collected in the fall of 2002 and the spring of 2003. Samples from the fall of 2003 were analyzed by Lab 2, and the samples collected in the spring of 2004, fall of 2004, and spring of 2005 were analyzed by Lab 3. Labs 2 and 3 were the same company but different locations. Nitrate N was extracted using the modified Kelowna method (Ashworth and Mrazek 1995) at Lab 1, and the potassium chloride extraction method (Maynard and Kalra 1993) was used at Labs 2 and 3. Nitrate N in the extracts were determined by spectroscopy. Site Instrumentation Flumes. The CFT, GPC, LLB, THC, REN, WAB sites were instrumented with circular flumes (Samani et al. 1991) as previously described by Little et al (2006, 2007). Briefly, the flumes consisted of a 0.273-m internal diameter (ID) high-density polyethylene (HDPE) pipe installed vertically inside a 0.9-m ID HDPE horizontal pipe. The lengths of the horizontal and vertical pipes were 3 m and 2.1 m, respectively. The vertical column was located 0.9 m from the inlet of the flume and was slotted with 10, 8-mm ID holes spaced at 10-mm intervals. Due to site restrictions, the circular flume at the LLB site was shortened to 1.83 m in length, while the CFT
8
site had a smaller version of the circular flume (0.61-m ID by 1.83-m long). The PON site was initially instrumented with a 0.61-m H-flume, which was replaced with a circular flume in June 2003. The STV site was bordered on the down-slope edge with a trough, which directed runoff water into a 0.15-m trapezoidal flume.
Figure 2. Profile and front view of a typical circular flume. Other instrumentation. Each site was equipped with a float potentiometer placed within the vertical column to measure head (or stage). Staff gauges were mounted on the exterior of the vertical column for manual flow measurements during site visits. Sites were also equipped with Lakewood TP10K5 thermistors and Davis tipping bucket rain gauges, which were replaced with Texas tipping bucket rain gauges in May 2004. Sites were powered with two, 15-W solar panels, and rechargeable 12-V batteries. A second float potentiometer and Lakewood datalogger were installed at most sites in 2004 for backup collection of flow data. Each site was equipped with ROM Communications Microcom units, except for the STV site. These units were integrated dataloggers with analog cellular communications technology that allowed real-time monitoring of site conditions. The units were programmed to monitor head, temperature, precipitation, and battery voltage every 30 s. When detected, flow or precipitation were recorded in the datalogger and reported on the website every 15 min and alarms were sent via pagers and emails to team members. A technician and a continuously-monitored meteorological station were permanently on-site at the STV site. This site was equipped with a Lakewood Ultralogger and a float potentiometer to record head.
9
Water samples were taken by ISCO 6700 automated water sampling devices (Tededyne Isco Inc., Lincoln, Nebraska, United States), equipped with 24, 1-L ProPaks™ and disposable polyethylene inserts. The ISCO samplers were programmed to take a 150-mL sample every 15 minutes for a total volume of 900 mL or six samples per bottle. Changes in head were used to trigger the ISCO via a ROM Communications Microcom unit whenever flow volumes reached the minimum criteria set for each microwatershed site. A natural gas company constructed an earth road through the REN site in January 2004 that bisected the natural runoff pattern. In May 2004, two culverts were installed under the new road at low points to allow runoff to move through the microwatershed to the flume. Unfortunately, the road affected the 2004 runoff due to increased erosion at the site and because some of the runoff flowed over the county road northeast of the flume before entering the rear of the flume. A vertical pipe was installed on the edge of the road culvert in August 2004 to divert runoff from the road directly into the culvert. Water Sampling and Analysis Water samples were collected daily during runoff events and then immediately transported in coolers to the nearest Envirotest Laboratory location in Calgary, Edmonton, or Grande Prairie. Within a 24-h period of continuous sampling, 16 water samples in ProPaks™ were collected. Each sample was analyzed for P, which was the main focus of the study (Little et al. 2006, 2007). For N in the water samples, the first, middle, and last samples of the daily ProPaks™ samples were analyzed within 48 h for nitrate N and nitrite N, within 28 d for ammonia N and total Kjeldahl N, and within 7 d for total suspended solids and total dissolved solids. Blanks filled with deionized water, as well as a prepared standards of known N concentrations, were submitted to the lab with each batch of samples as part of a quality assurance/quality control program. Data Analysis Flow measurements. Prior to head (or stage) data being converted to flows, values were corrected for the offset or zero value of the flume. The flumes were then calibrated using the Water Ware software program developed by Samani et al. (1991). The resulting calibrations were then plotted in TableCurve 2D, version 3 (Jandel Scientific Software 1994), to fit an appropriate curve to the data. Once a curve was selected and applied to the heads, a correction factor was applied to account for the slope of the flume and for any inactive head in the flume. Flows in the 0.9-m circular flumes were best described by the following power function.
y = 0.0702 x2.093 (1) Where: y = flow (L s-1)
x = head (cm)
10
Flows in the 0.61-m circular flume at the CFT site were described by the following power function. y = 0.0000673 x2.072 (2) Runoff nitrogen calculations. To calculate flow-weighted mean concentrations (FWMCs), water flow data were linearly interpolated to 1-minute intervals using Proc Expand in SAS (Statistical Software Institute Inc. 2003) (Little 2006, 2007). The area under the curve was then integrated to estimate total daily flow volumes using a SAS area macro. The mean daily concentration data were then matched to the total daily volumes and loads were calculated for matching values by multiplying flow and concentration data. Seasonal FWMCs were then calculated by dividing the total load for all events by the total flow volume for all events during the season. Missing flows were accounted for using three methods depending on the period of time for which data were missing (Little 2006, 2007). If the time period for which the flow data were missing was less than 1 d, flows were linearly interpolated with missing head values supplemented by manual field measurements, where possible. If the time period was greater than 1 d, FWMCs were calculated for days with flow, and mean daily concentrations (not flow-weighted) were used for days without flow. The daily averages were then averaged for the whole event to determine the concentration. If no flow data were available, mean concentrations of the parameters were used. Statistical analysis. Analyses of the soil and water samples were completed using SAS version 9.1 (SAS Institute Inc. 2003). The Univariate procedure was used to test the distribution of the data, and the Means and Summary procedures were used to generate descriptive statistics. The REG procedure was used to relate measures of soil nitrate N to runoff N fractions. The General Linear Model(GLM) procedure and Tukey test were used to determined significant differences among the three laboratories using the data for the reference soil samples. The GLM procedure and Tukey test were also used to determine significant differences among the upper, mid, and lower slope positions for soil nitrate N at each watershed site. A significance level of 0.05 was used throughout this study.
11
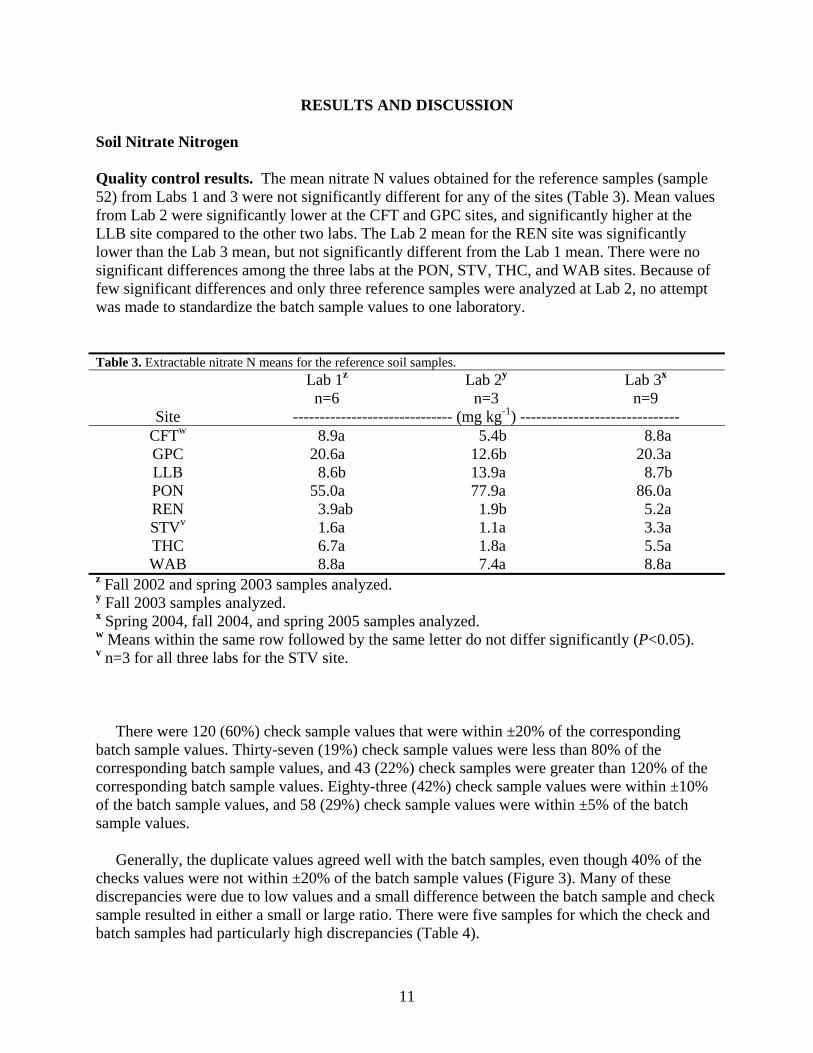
RESULTS AND DISCUSSION Soil Nitrate Nitrogen Quality control results. The mean nitrate N values obtained for the reference samples (sample 52) from Labs 1 and 3 were not significantly different for any of the sites (Table 3). Mean values from Lab 2 were significantly lower at the CFT and GPC sites, and significantly higher at the LLB site compared to the other two labs. The Lab 2 mean for the REN site was significantly lower than the Lab 3 mean, but not significantly different from the Lab 1 mean. There were no significant differences among the three labs at the PON, STV, THC, and WAB sites. Because of few significant differences and only three reference samples were analyzed at Lab 2, no attempt was made to standardize the batch sample values to one laboratory. Table 3. Extractable nitrate N means for the reference soil samples.
Lab 1z
n=6 Lab 2y
n=3 Lab 3x
n=9 Site ------------------------------ (mg kg-1) ------------------------------
CFTw 8.9a 5.4b 8.8a GPC 20.6a 12.6b 20.3a LLB 8.6b 13.9a 8.7b PON 55.0a 77.9a 86.0a REN 3.9ab 1.9b 5.2a STVv 1.6a 1.1a 3.3a THC 6.7a 1.8a 5.5a WAB 8.8a 7.4a 8.8a
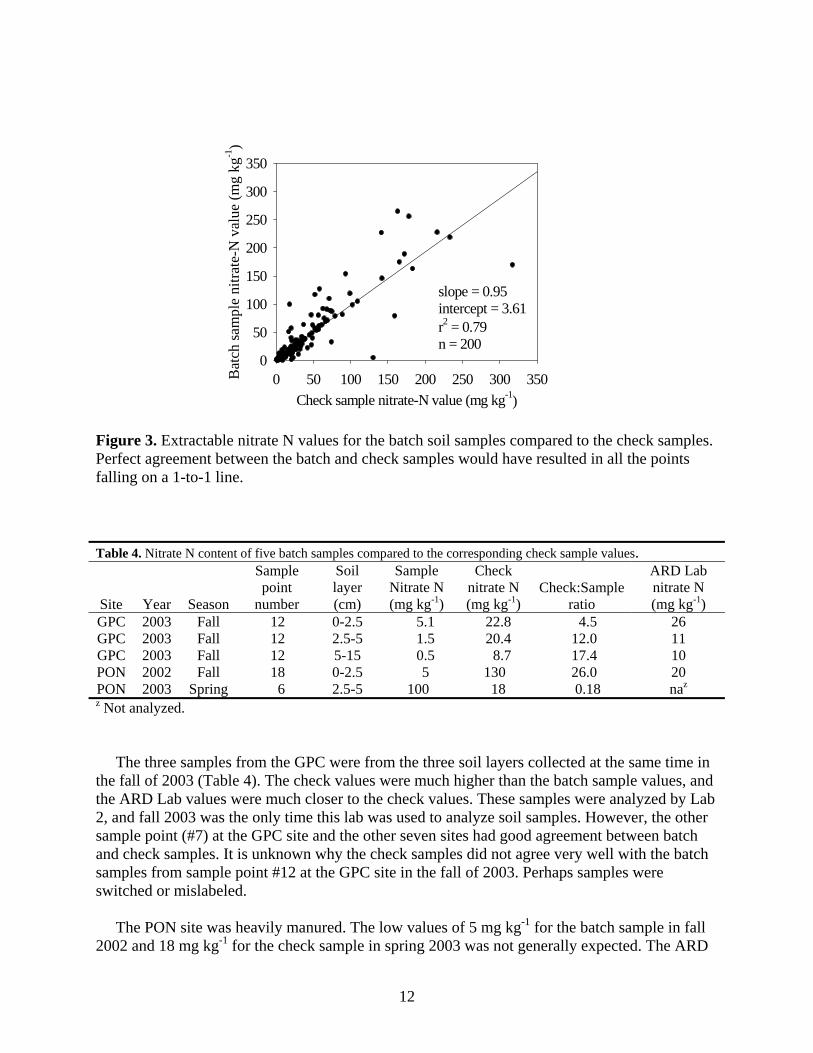
z Fall 2002 and spring 2003 samples analyzed. y Fall 2003 samples analyzed. x Spring 2004, fall 2004, and spring 2005 samples analyzed. w Means within the same row followed by the same letter do not differ significantly (P<0.05). v n=3 for all three labs for the STV site. There were 120 (60%) check sample values that were within ±20% of the corresponding batch sample values. Thirty-seven (19%) check sample values were less than 80% of the corresponding batch sample values, and 43 (22%) check samples were greater than 120% of the corresponding batch sample values. Eighty-three (42%) check sample values were within ±10% of the batch sample values, and 58 (29%) check sample values were within ±5% of the batch sample values. Generally, the duplicate values agreed well with the batch samples, even though 40% of the checks values were not within ±20% of the batch sample values (Figure 3). Many of these discrepancies were due to low values and a small difference between the batch sample and check sample resulted in either a small or large ratio. There were five samples for which the check and batch samples had particularly high discrepancies (Table 4).
12
Figure 3. Extractable nitrate N values for the batch soil samples compared to the check samples. Perfect agreement between the batch and check samples would have resulted in all the points falling on a 1-to-1 line. Table 4. Nitrate N content of five batch samples compared to the corresponding check sample values.
Site Year Season
Sample point
number
Soil layer (cm)
Sample Nitrate N (mg kg-1)
Check nitrate N (mg kg-1)
Check:Sample ratio
ARD Lab nitrate N (mg kg-1)
GPC 2003 Fall 12 0-2.5 5.1 22.8 4.5 26 GPC 2003 Fall 12 2.5-5 1.5 20.4 12.0 11 GPC 2003 Fall 12 5-15 0.5 8.7 17.4 10 PON 2002 Fall 18 0-2.5 5 130 26.0 20 PON 2003 Spring 6 2.5-5 100 18 0.18 naz z Not analyzed. The three samples from the GPC were from the three soil layers collected at the same time in the fall of 2003 (Table 4). The check values were much higher than the batch sample values, and the ARD Lab values were much closer to the check values. These samples were analyzed by Lab 2, and fall 2003 was the only time this lab was used to analyze soil samples. However, the other sample point (#7) at the GPC site and the other seven sites had good agreement between batch and check samples. It is unknown why the check samples did not agree very well with the batch samples from sample point #12 at the GPC site in the fall of 2003. Perhaps samples were switched or mislabeled. The PON site was heavily manured. The low values of 5 mg kg-1 for the batch sample in fall 2002 and 18 mg kg-1 for the check sample in spring 2003 was not generally expected. The ARD
Check sample nitrate-N value (mg kg-1)0 50 100 150 200 250 300 350B
atch
sam
ple
nitra
te-N
val
ue (m
g kg
-1)
0
50
100
150
200
250
300
350
slope = 0.95intercept = 3.61r2 = 0.79n = 200
13
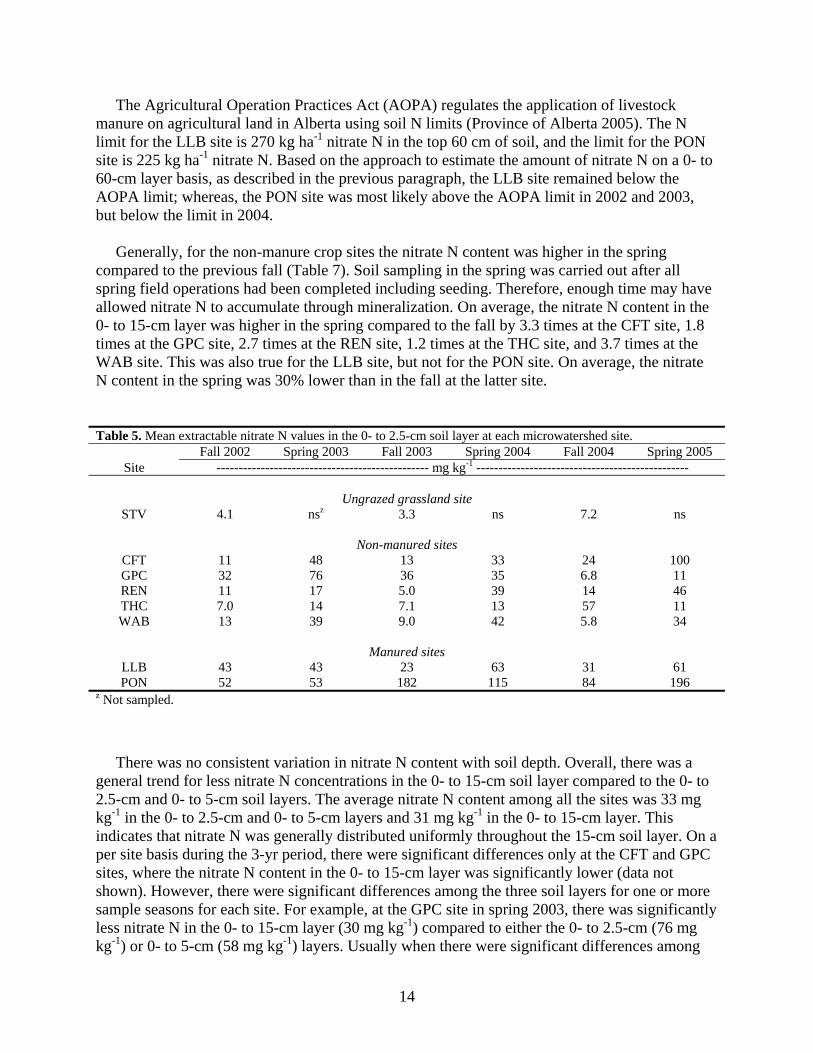
Lab value in fall 2002 was not useful (Table 4). A total of 252 batch soil samples from the PON site were analyzed, and the values ranged from 1.8 to 325 mg kg-1. Because of the range and distribution of the data, the discrepancies between the PON site batch and check samples, shown in Table 4, could not be explained by identifying one or the other as outliers. The option is no longer available to re-analyze soil samples. Therefore, based on the checks sample results, no adjustments were made to the main data set. Soil nitrate nitrogen content. The seasonal mean values of extractable nitrate N ranged from 3.3 to 196 mg kg-1 in the 0- to 2.5-cm layer (Table 5), 2.4 to 177 mg kg-1 in the 0- to 5-cm layer (Table 6), and 1.6 to 163 mg kg-1 in the 0- to 15-cm layer (Table 7). The STV site had the lowest nitrate N content and the PON site had the highest nitrate N content. The soil at the LLB site contained about one-third the amount of nitrate N compared to the PON site. The five non-manured cultivated sites had soil nitrate N intermediate between the STV and LLB sites. In the 0- to 15-cm layer, for example, the 3-yr mean values were 3.2 mg kg-1 for the STV site, 37 mg kg-1 for the LLB site, 116 mg kg-1 for the PON site, and a range of 12 to 19 mg kg-1 for the five non-manured, cultivated sites (CFT, GPC, REN, THC, WAB). It would appear that manure application increased the soil nitrate N content at the LLB and PON sites. The extractable nitrate N results among the sites followed the same pattern reported for soil-test P (STP) by Little et al. (2007). For example, in 2002, the mean STP in the 0- to 15-cm layer was 3 mg kg-1 at the STV site, 269 mg kg-1 at the LLB site, 512 mg kg-1 at the PON site, and 20 to 35 mg kg-1 at the five non-manured, cultivated sites (Little et al. 2007). The relative differences among the grassland, non-manured, and manured sites were not as great for nitrate N compared to STP. This difference between the two nutrients may be due to loss processes, such as leaching, volatilization, and denitrification, which may affect nitrate N concentrations. Agronomically, most of the sites were low in extractable nitrate N. Sampling soil to the 60-cm depth is preferred when making N fertilizer recommendations; however, samples were taken only to the 15-cm depth in this study. Adjustment factors can be used to convert values to a 0- to 60-cm basis. An adjustment factor of 1.84 was used for the seven non-irrigated sites, and a adjustment factor of 3.03 was used for the LLB irrigated site (Soil Test Technical Advisory Group 1988). The values in Table 7 were first converted to kg ha-1, using soil bulk density values, which were measured at each site in the fall of 2004 except for the GPC site. Soil bulk density values used were 600 kg m-3 for the STV site, 900 kg m-3 for the THC and PON sites, 1000 kg m-3 for the REN site, and 1100 kg m-3 for the CFT, WAB, and LLB sites (unpublished data). The bulk density at the GPC was assumed to be 1000 kg m-3. Using nitrate N values determined for the fall season in 2002, 2003, and 2004, N fertilizer requirements were estimated for silage barley production (McKenzie et al. 2000). Recommendations ranged from 56 to 140 kg ha-1 N fertilizer for the non-manured, cultivated sites. About 56 to 78 kg ha-1 could be applied at the LLB site, and 67 kg ha-1 N fertilizer at the PON site, but only in 2004 (i.e., for the 2005 crop year). These N fertilizer recommendations are crude estimates, and were meant to only to give an indication of the level of N deficiency at the sites. Obtaining soil samples to the 60-cm depth, as well as taking into account actual soil moisture conditions, target crop, and economic factors, would provide more realistic recommendations.
14
The Agricultural Operation Practices Act (AOPA) regulates the application of livestock manure on agricultural land in Alberta using soil N limits (Province of Alberta 2005). The N limit for the LLB site is 270 kg ha-1 nitrate N in the top 60 cm of soil, and the limit for the PON site is 225 kg ha-1 nitrate N. Based on the approach to estimate the amount of nitrate N on a 0- to 60-cm layer basis, as described in the previous paragraph, the LLB site remained below the AOPA limit; whereas, the PON site was most likely above the AOPA limit in 2002 and 2003, but below the limit in 2004. Generally, for the non-manure crop sites the nitrate N content was higher in the spring compared to the previous fall (Table 7). Soil sampling in the spring was carried out after all spring field operations had been completed including seeding. Therefore, enough time may have allowed nitrate N to accumulate through mineralization. On average, the nitrate N content in the 0- to 15-cm layer was higher in the spring compared to the fall by 3.3 times at the CFT site, 1.8 times at the GPC site, 2.7 times at the REN site, 1.2 times at the THC site, and 3.7 times at the WAB site. This was also true for the LLB site, but not for the PON site. On average, the nitrate N content in the spring was 30% lower than in the fall at the latter site. Table 5. Mean extractable nitrate N values in the 0- to 2.5-cm soil layer at each microwatershed site.
Fall 2002 Spring 2003 Fall 2003 Spring 2004 Fall 2004 Spring 2005 Site ------------------------------------------------ mg kg-1 ------------------------------------------------
Ungrazed grassland site
STV 4.1 nsz 3.3 ns 7.2 ns
Non-manured sites CFT 11 48 13 33 24 100 GPC 32 76 36 35 6.8 11 REN 11 17 5.0 39 14 46 THC 7.0 14 7.1 13 57 11 WAB 13 39 9.0 42 5.8 34
Manured sites
LLB 43 43 23 63 31 61 PON 52 53 182 115 84 196
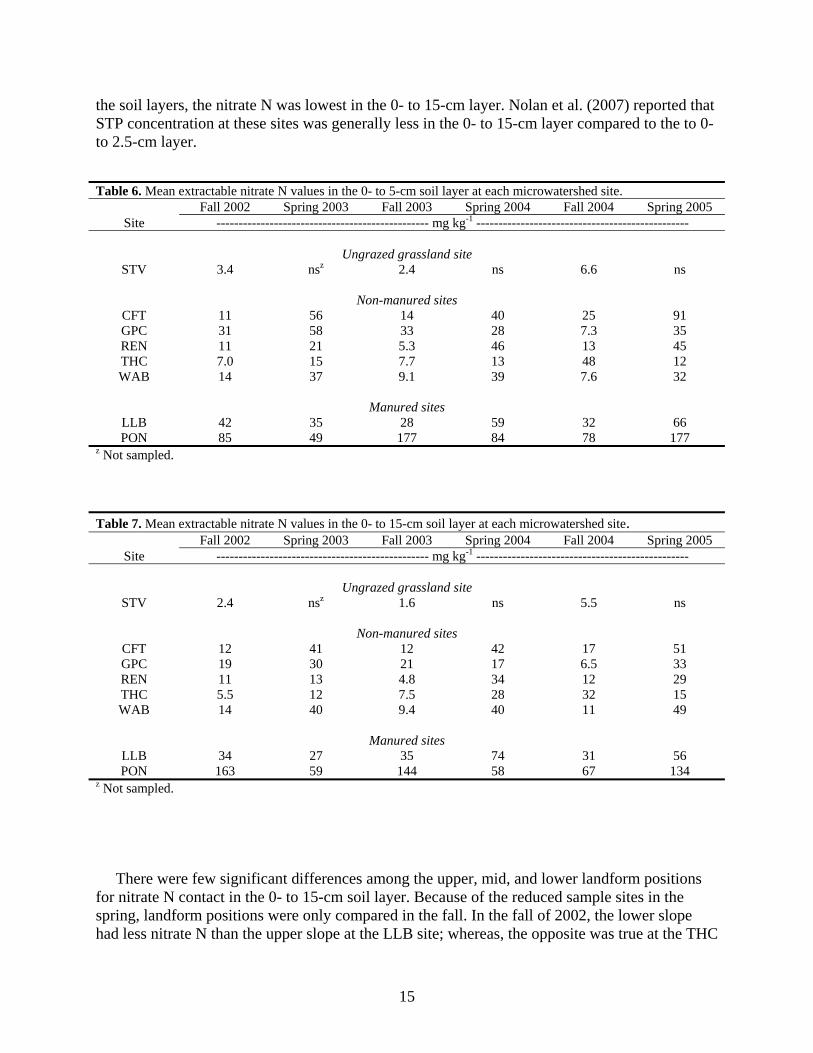
z Not sampled. There was no consistent variation in nitrate N content with soil depth. Overall, there was a general trend for less nitrate N concentrations in the 0- to 15-cm soil layer compared to the 0- to 2.5-cm and 0- to 5-cm soil layers. The average nitrate N content among all the sites was 33 mg kg-1 in the 0- to 2.5-cm and 0- to 5-cm layers and 31 mg kg-1 in the 0- to 15-cm layer. This indicates that nitrate N was generally distributed uniformly throughout the 15-cm soil layer. On a per site basis during the 3-yr period, there were significant differences only at the CFT and GPC sites, where the nitrate N content in the 0- to 15-cm layer was significantly lower (data not shown). However, there were significant differences among the three soil layers for one or more sample seasons for each site. For example, at the GPC site in spring 2003, there was significantly less nitrate N in the 0- to 15-cm layer (30 mg kg-1) compared to either the 0- to 2.5-cm (76 mg kg-1) or 0- to 5-cm (58 mg kg-1) layers. Usually when there were significant differences among
15
the soil layers, the nitrate N was lowest in the 0- to 15-cm layer. Nolan et al. (2007) reported that STP concentration at these sites was generally less in the 0- to 15-cm layer compared to the to 0- to 2.5-cm layer. Table 6. Mean extractable nitrate N values in the 0- to 5-cm soil layer at each microwatershed site.
Fall 2002 Spring 2003 Fall 2003 Spring 2004 Fall 2004 Spring 2005 Site ------------------------------------------------ mg kg-1 ------------------------------------------------
Ungrazed grassland site
STV 3.4 nsz 2.4 ns 6.6 ns
Non-manured sites CFT 11 56 14 40 25 91 GPC 31 58 33 28 7.3 35 REN 11 21 5.3 46 13 45 THC 7.0 15 7.7 13 48 12 WAB 14 37 9.1 39 7.6 32
Manured sites
LLB 42 35 28 59 32 66 PON 85 49 177 84 78 177
z Not sampled. Table 7. Mean extractable nitrate N values in the 0- to 15-cm soil layer at each microwatershed site.
Fall 2002 Spring 2003 Fall 2003 Spring 2004 Fall 2004 Spring 2005 Site ------------------------------------------------ mg kg-1 ------------------------------------------------
Ungrazed grassland site
STV 2.4 nsz 1.6 ns 5.5 ns
Non-manured sites CFT 12 41 12 42 17 51 GPC 19 30 21 17 6.5 33 REN 11 13 4.8 34 12 29 THC 5.5 12 7.5 28 32 15 WAB 14 40 9.4 40 11 49
Manured sites
LLB 34 27 35 74 31 56 PON 163 59 144 58 67 134
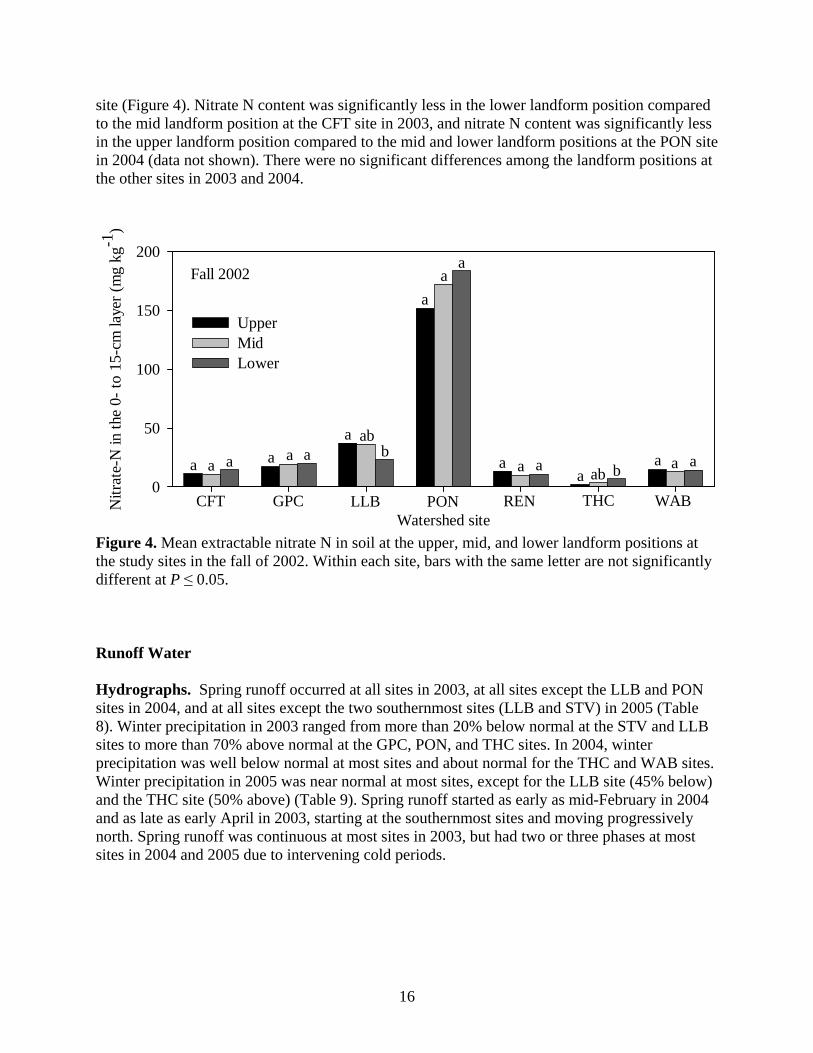
z Not sampled. There were few significant differences among the upper, mid, and lower landform positions for nitrate N contact in the 0- to 15-cm soil layer. Because of the reduced sample sites in the spring, landform positions were only compared in the fall. In the fall of 2002, the lower slope had less nitrate N than the upper slope at the LLB site; whereas, the opposite was true at the THC
16
site (Figure 4). Nitrate N content was significantly less in the lower landform position compared to the mid landform position at the CFT site in 2003, and nitrate N content was significantly less in the upper landform position compared to the mid and lower landform positions at the PON site in 2004 (data not shown). There were no significant differences among the landform positions at the other sites in 2003 and 2004.
Figure 4. Mean extractable nitrate N in soil at the upper, mid, and lower landform positions at the study sites in the fall of 2002. Within each site, bars with the same letter are not significantly different at P ≤ 0.05. Runoff Water Hydrographs. Spring runoff occurred at all sites in 2003, at all sites except the LLB and PON sites in 2004, and at all sites except the two southernmost sites (LLB and STV) in 2005 (Table 8). Winter precipitation in 2003 ranged from more than 20% below normal at the STV and LLB sites to more than 70% above normal at the GPC, PON, and THC sites. In 2004, winter precipitation was well below normal at most sites and about normal for the THC and WAB sites. Winter precipitation in 2005 was near normal at most sites, except for the LLB site (45% below) and the THC site (50% above) (Table 9). Spring runoff started as early as mid-February in 2004 and as late as early April in 2003, starting at the southernmost sites and moving progressively north. Spring runoff was continuous at most sites in 2003, but had two or three phases at most sites in 2004 and 2005 due to intervening cold periods.
Watershed site
Nitr
ate-
N in
the
0- to
15-
cm la
yer (
mg
kg-1
)
0
50
100
150
200
UpperMidLower
Fall 2002
CFT GPC LLB PON REN THC WAB
ba ab
ba aba aaa aa
a
aa
a aaa aa
17
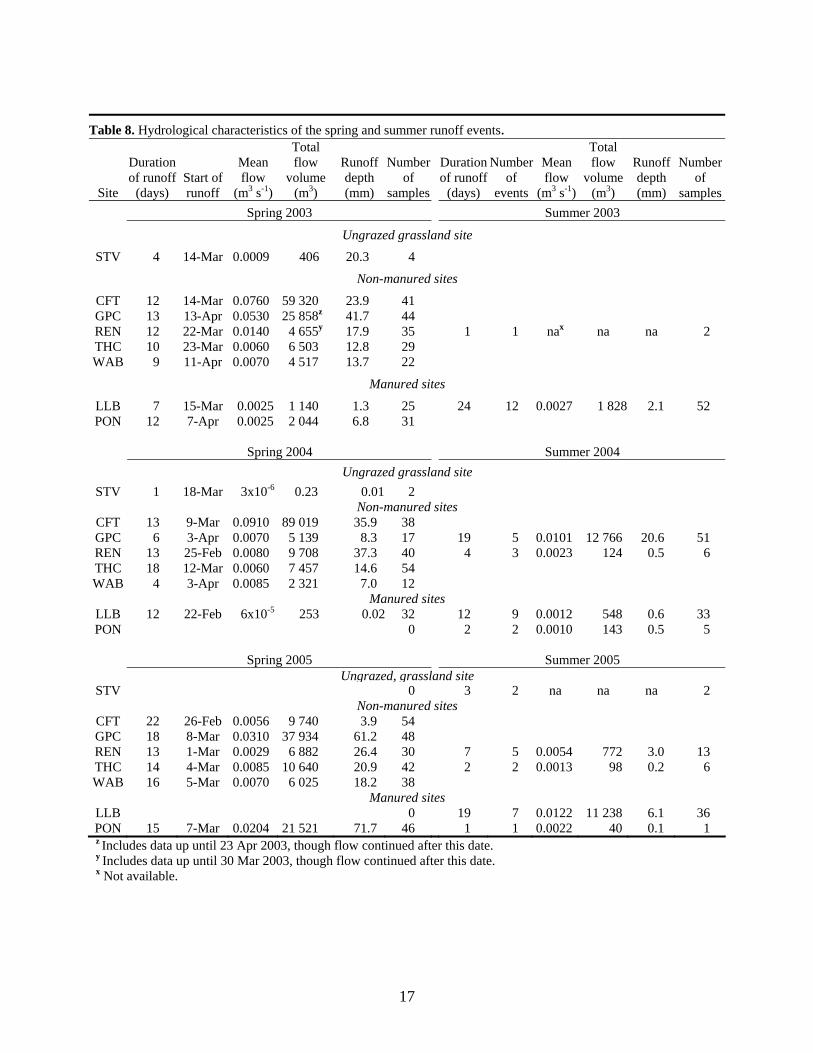
Table 8. Hydrological characteristics of the spring and summer runoff events.
Site
Duration of runoff
(days) Start of runoff
Mean flow
(m3 s-1)
Total flow
volume (m3)
Runoff depth (mm)
Number of
samples
Duration of runoff
(days)
Number of
events
Mean flow
(m3 s-1)
Total flow
volume (m3)
Runoff depth (mm)
Number of
samples Spring 2003 Summer 2003
Ungrazed grassland site STV 4 14-Mar 0.0009 406 20.3 4
Non-manured sites
CFT 12 14-Mar 0.0760 59 320 23.9 41 GPC 13 13-Apr 0.0530 25 858z 41.7 44 REN 12 22-Mar 0.0140 4 655y 17.9 35 1 1 nax na na 2 THC 10 23-Mar 0.0060 6 503 12.8 29 WAB 9 11-Apr 0.0070 4 517 13.7 22
Manured sites
LLB 7 15-Mar 0.0025 1 140 1.3 25 24 12 0.0027 1 828 2.1 52 PON 12 7-Apr 0.0025 2 044 6.8 31
Spring 2004 Summer 2004
Ungrazed grassland site STV 1 18-Mar 3x10⁻⁶ 0.23 0.01 2
Non-manured sites CFT 13 9-Mar 0.0910 89 019 35.9 38 GPC 6 3-Apr 0.0070 5 139 8.3 17 19 5 0.0101 12 766 20.6 51 REN 13 25-Feb 0.0080 9 708 37.3 40 4 3 0.0023 124 0.5 6 THC 18 12-Mar 0.0060 7 457 14.6 54 WAB 4 3-Apr 0.0085 2 321 7.0 12
Manured sites LLB 12 22-Feb 6x10⁻⁵ 253 0.02 32 12 9 0.0012 548 0.6 33 PON 0 2 2 0.0010 143 0.5 5
Spring 2005 Summer 2005
Ungrazed, grassland siteSTV 0 3 2 na na na 2
Non-manured sites CFT 22 26-Feb 0.0056 9 740 3.9 54 GPC 18 8-Mar 0.0310 37 934 61.2 48 REN 13 1-Mar 0.0029 6 882 26.4 30 7 5 0.0054 772 3.0 13 THC 14 4-Mar 0.0085 10 640 20.9 42 2 2 0.0013 98 0.2 6 WAB 16 5-Mar 0.0070 6 025 18.2 38
Manured sites LLB 0 19 7 0.0122 11 238 6.1 36 PON 15 7-Mar 0.0204 21 521 71.7 46 1 1 0.0022 40 0.1 1 z Includes data up until 23 Apr 2003, though flow continued after this date. y Includes data up until 30 Mar 2003, though flow continued after this date. x Not available.
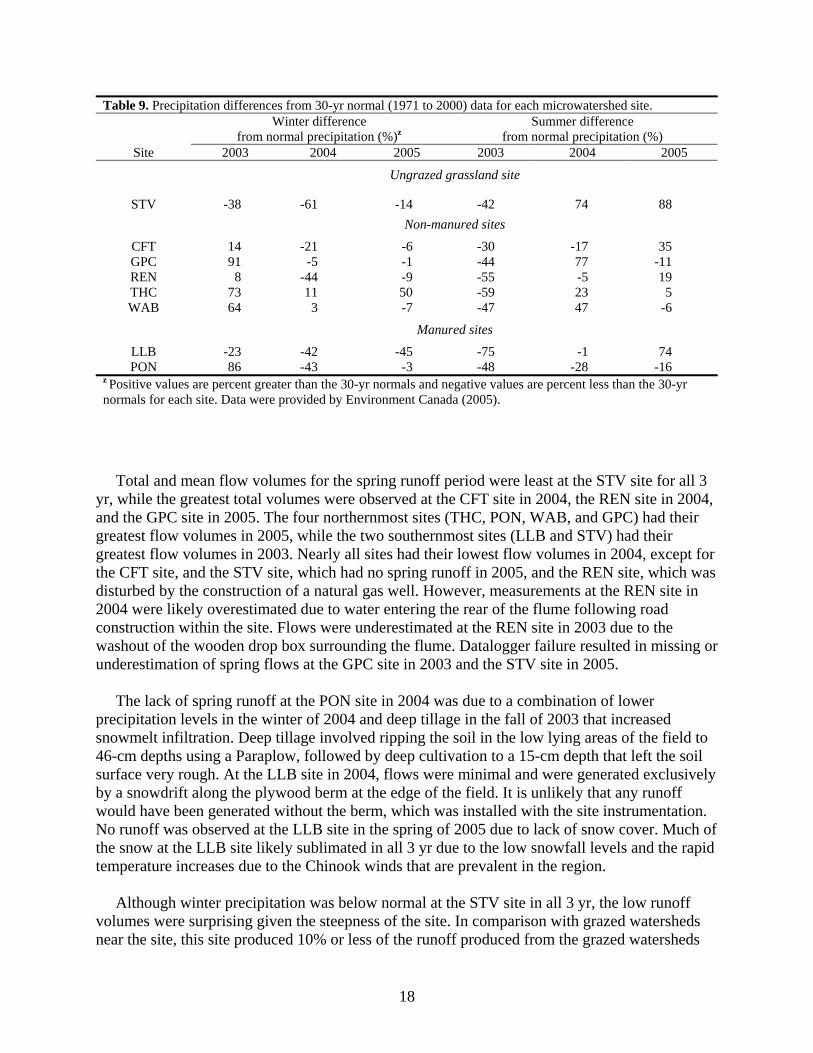
18
Table 9. Precipitation differences from 30-yr normal (1971 to 2000) data for each microwatershed site. Winter difference
from normal precipitation (%)z Summer difference
from normal precipitation (%) Site 2003 2004 2005 2003 2004 2005
Ungrazed grassland site
STV -38 -61 -14 -42 74 88 Non-manured sites
CFT 14 -21 -6 -30 -17 35 GPC 91 -5 -1 -44 77 -11 REN 8 -44 -9 -55 -5 19 THC 73 11 50 -59 23 5 WAB 64 3 -7 -47 47 -6
Manured sites
LLB -23 -42 -45 -75 -1 74 PON 86 -43 -3 -48 -28 -16
z Positive values are percent greater than the 30-yr normals and negative values are percent less than the 30-yr normals for each site. Data were provided by Environment Canada (2005).
Total and mean flow volumes for the spring runoff period were least at the STV site for all 3 yr, while the greatest total volumes were observed at the CFT site in 2004, the REN site in 2004, and the GPC site in 2005. The four northernmost sites (THC, PON, WAB, and GPC) had their greatest flow volumes in 2005, while the two southernmost sites (LLB and STV) had their greatest flow volumes in 2003. Nearly all sites had their lowest flow volumes in 2004, except for the CFT site, and the STV site, which had no spring runoff in 2005, and the REN site, which was disturbed by the construction of a natural gas well. However, measurements at the REN site in 2004 were likely overestimated due to water entering the rear of the flume following road construction within the site. Flows were underestimated at the REN site in 2003 due to the washout of the wooden drop box surrounding the flume. Datalogger failure resulted in missing or underestimation of spring flows at the GPC site in 2003 and the STV site in 2005. The lack of spring runoff at the PON site in 2004 was due to a combination of lower precipitation levels in the winter of 2004 and deep tillage in the fall of 2003 that increased snowmelt infiltration. Deep tillage involved ripping the soil in the low lying areas of the field to 46-cm depths using a Paraplow, followed by deep cultivation to a 15-cm depth that left the soil surface very rough. At the LLB site in 2004, flows were minimal and were generated exclusively by a snowdrift along the plywood berm at the edge of the field. It is unlikely that any runoff would have been generated without the berm, which was installed with the site instrumentation. No runoff was observed at the LLB site in the spring of 2005 due to lack of snow cover. Much of the snow at the LLB site likely sublimated in all 3 yr due to the low snowfall levels and the rapid temperature increases due to the Chinook winds that are prevalent in the region. Although winter precipitation was below normal at the STV site in all 3 yr, the low runoff volumes were surprising given the steepness of the site. In comparison with grazed watersheds near the site, this site produced 10% or less of the runoff produced from the grazed watersheds
19
(Mapfumo et al. 2002), even though this site had more snow accumulation than the grazed sites. The increased snow accumulation was attributed to the abundant litter cover, which was more heterogeneous and five to seven and a half times greater in mass than at the grazed sites (W. Willms, Agriculture and Agri-Food Canada, personal communications). The litter cover may have also increased infiltration; however, it is unlikely that it would account for that much of the observed decrease. Runoff volumes were very high at the GPC and PON sites in 2005, due to above average snowfall and a rapid melt. Unfortunately, the peaks of the hydrograph were missed from these sites due to the binding of the float potentiometer within the vertical pipe at high flows. Therefore, the total flow volumes were underestimated at both of these sites in the spring of 2005. Reports from the local newspaper suggest that the runoff observed at the GPC site caused local flooding (Daily Herald Tribune – March 11, 2005) and field observations indicated that the water depth at the site was at least 1 m deep. The rapid temperature change was likely responsible for the large volumes as precipitation levels were around normal at both sites in 2005. Summer events were much less common than spring events, occurring at only two sites in 2003, four sites in 2004, and five sites in 2005. Summer precipitation was below normal at all sites in 2003, but was above average at the northernmost sites (GPC, WAB, THC) and at the STV site in 2004, and at the southernmost sites in 2005 (LLB, STV, CFT, REN) (Table 9). Only the PON site had below average summer precipitation in all 3 yr. Most runoff events at the LLB site were of short duration (less than 12 h), had low flow rates, and were generated as a result of irrigation with a center-pivot sprinkler system. Although the size of the irrigation events was relatively small, they generated the majority of runoff in 2003 and 2004. In addition, summer runoff volumes at the LLB site were greater than the volume of spring snowmelt runoff in all 3 yr. Irrigation accounted for 57% of the runoff in 2003, 68% of the runoff in 2004, but only 8% of the runoff in 2005. Summer rainfall runoff was very high in 2005 when two, greater than 1-in-100 yr, rainfall events were recorded in the LLB region. More than 250 mm of rain was recorded in June compared with the 30-yr normal value of 53 mm, with another 137 mm recorded in September compared with the 30-yr normal value of 38.3 mm. These two events from June 5 to 9 and September 10 to 14 accounted for 85% of the runoff volume at the LLB site in 2005. Summer events accounted for 71% of the total runoff at the GPC site in 2004; however, at the remainder of the sites, summer runoff was relatively minor, ranging from 0.18% at the PON site in 2005 to 10% at the REN site in 2005. Two sites (CFT and WAB) generated no summer runoff. Overall, summer events accounted for slightly less than 10% of all runoff during the 3-yr study. The relatively minor contribution of summer precipitation events to the P exported by overland flow compared to spring runoff is typical of cold climates in the western Canadian prairies. Nicholaichuk (1967) estimated that 80% of the runoff from two small watersheds in Saskatchewan was generated by spring snowmelt. In Alberta, total yearly runoff from small agricultural watersheds tends to be dominated by snowmelt (Gill et al. 1998; Wuite and Chanasyk 2003; Ontkean et al. 2005). For the majority of the microwatersheds, spring snowmelt runoff was still the predominant contributor to runoff.
20
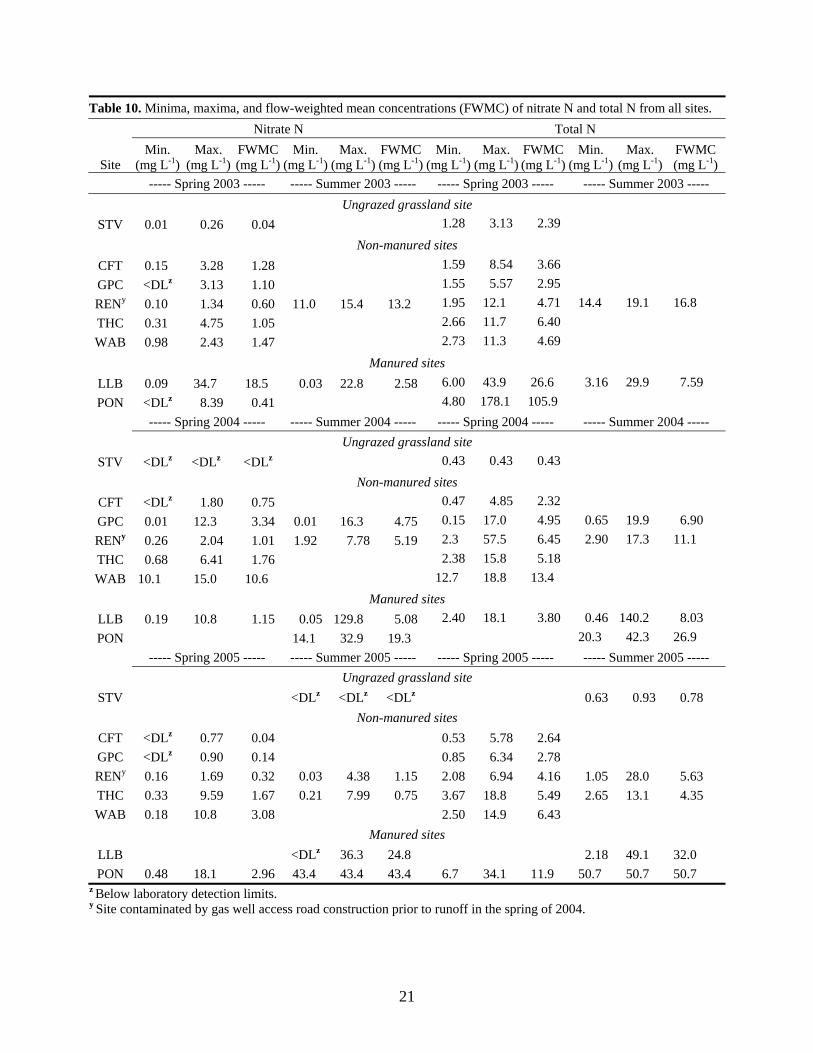
Spring runoff nitrogen concentrations. The nitrate N FWMCs of the non-manured sites ranged from 0.60 mg L-1 at the REN site to 1.47 mg L-1 at the WAB site in 2003, 0.75 mg L-1 at the CFT to 10.6 mg L-1 at the WAB site in 2004, and 0.04 mg L-1 at the CFT to 3.08 mg L-1 at the WAB site in 2005 (Table 10). The spring runoff nitrate N FWMCs from the STV site in 2003 and 2004 were much lower than nitrate N FWMCs from the non-manured sites, due to the much smaller volumes of runoff from this highly vegetated grassland site. Levels of nitrate N FWMC were greatest (18.5 mg L-1) at the LLB site in the spring of 2003 following the manure application in the fall of 2002. In contrast, the heavily manured PON site nitrate N FWMC value was two orders of magnitude lower than at the LLB site and lower than at the non-manured CFT, GPC, REN, THC, and WAB sites in 2003 (Table 10). No manure was applied to the LLB site in the fall of 2003, and the 2004 spring runoff nitrate N FWMC was an order of magnitude lower than in the previous year at this site because the runoff was generated from a snowdrift along the fence line at this site in February 2004; and therefore, the runoff was diluted and not due to a true field runoff event. In 2004, there was no spring runoff at the PON site. In 2005, the nitrate N FWMC value at the PON site was higher than in 2003. However, the nitrate N FWMC for PON in 2005 (2.96 mg L-1) was lower than at the non-manured WAB site (3.08 mg L-1).
The spring runoff total N FWMC of the non-manured sites ranged from 2.96 mg L-1 at the GPC site to 6.40 mg L-1 at the THC site in 2003, 2.32 mg L-1 at the CFT to 13.4 mg L-1 at the WAB site in 2004, and 2.64 mg L-1 at the CFT to 6.43 mg L-1 at the WAB site in 2005 (Table 10). The spring runoff total N FWMCs at the STV site were higher in 2003 than in 2004, and they were lower than the runoff values from the non-manured sites in both years.
The LLB site had manure applied to the portion of the microwatershed nearest the outlet in the spring of 2002, which allowed greater opportunity for N to be adsorbed by soil and mixed with the subsurface soil by intensive tillage following spring manure application and fall harvest. As such, the total N FWMCs values in 2003 spring runoff at the LLB site were an order of magnitude lower than at the PON site (Table 10). Spring runoff total N FWMCS were higher in 2003 than in 2004 at the LLB site and higher in 2003 than in 2005 at the PON site.
The total N FWMC at the heavily manured PON site was extremely high in the spring of 2003, with some individual total N values exceeding 100 mg L-1. Total suspended solids (TSS) concentrations were also elevated (data not shown) and accumulation of sediment in the flume was observed during field visits, indicating that selective sampling of sediment from the H-flume may have been an issue at the PON site. The replacement of the H-flume in the spring of 2003 mitigated these concerns. Given the high total N FWMC and the poor incorporation following the recent manure application, it is likely that the soil nitrate N was overwhelmed by the N content of the manure and was not representative of soil N conditions. Individual values at the PON site in the spring of 2003 were as high as 178.1 mg L-1, with a FWMC of 105.9 mg L-1 total N (Table 10). These extremely high values can be attributed to the application of manure close to freeze up in the fall of 2002. The manure was very poorly incorporated and visible on the
21
Table 10. Minima, maxima, and flow-weighted mean concentrations (FWMC) of nitrate N and total N from all sites. Nitrate N Total N
Site Min.
(mg L-1) Max.
(mg L-1) FWMC (mg L-1)
Min. (mg L-1)
Max. (mg L-1)
FWMC(mg L-1)
Min. (mg L-1)
Max. (mg L-1)
FWMC(mg L-1)
Min. (mg L-1)
Max. (mg L-1)
FWMC (mg L-1)
----- Spring 2003 ----- ----- Summer 2003 ----- ----- Spring 2003 ----- ----- Summer 2003 ----- Ungrazed grassland site
STV 0.01 0.26 0.04 1.28 3.13 2.39 Non-manured sites
CFT 0.15 3.28 1.28 1.59 8.54 3.66 GPC <DLz 3.13 1.10 1.55 5.57 2.95 RENy 0.10 1.34 0.60 11.0 15.4 13.2 1.95 12.1 4.71 14.4 19.1 16.8 THC 0.31 4.75 1.05 2.66 11.7 6.40 WAB 0.98 2.43 1.47 2.73 11.3 4.69
Manured sites LLB 0.09 34.7 18.5 0.03 22.8 2.58 6.00 43.9 26.6 3.16 29.9 7.59 PON <DLz 8.39 0.41 4.80 178.1 105.9
----- Spring 2004 ----- ----- Summer 2004 ----- ----- Spring 2004 ----- ----- Summer 2004 ----- Ungrazed grassland site
STV <DLz <DLz <DLz 0.43 0.43 0.43 Non-manured sites
CFT <DLz 1.80 0.75 0.47 4.85 2.32 GPC 0.01 12.3 3.34 0.01 16.3 4.75 0.15 17.0 4.95 0.65 19.9 6.90 RENy 0.26 2.04 1.01 1.92 7.78 5.19 2.3 57.5 6.45 2.90 17.3 11.1 THC 0.68 6.41 1.76 2.38 15.8 5.18 WAB 10.1 15.0 10.6 12.7 18.8 13.4
Manured sites LLB 0.19 10.8 1.15 0.05 129.8 5.08 2.40 18.1 3.80 0.46 140.2 8.03 PON 14.1 32.9 19.3 20.3 42.3 26.9
----- Spring 2005 ----- ----- Summer 2005 ----- ----- Spring 2005 ----- ----- Summer 2005 ----- Ungrazed grassland site
STV <DLz <DLz <DLz 0.63 0.93 0.78 Non-manured sites
CFT <DLz 0.77 0.04 0.53 5.78 2.64 GPC <DLz 0.90 0.14 0.85 6.34 2.78 RENy 0.16 1.69 0.32 0.03 4.38 1.15 2.08 6.94 4.16 1.05 28.0 5.63 THC 0.33 9.59 1.67 0.21 7.99 0.75 3.67 18.8 5.49 2.65 13.1 4.35 WAB 0.18 10.8 3.08 2.50 14.9 6.43
Manured sites LLB <DLz 36.3 24.8 2.18 49.1 32.0 PON 0.48 18.1 2.96 43.4 43.4 43.4 6.7 34.1 11.9 50.7 50.7 50.7
z Below laboratory detection limits. y Site contaminated by gas well access road construction prior to runoff in the spring of 2004.
22
surface at the time of soil sampling; and therefore, the 2003 spring runoff nitrate N and total N FWMCs from PON were deemed as outliers.
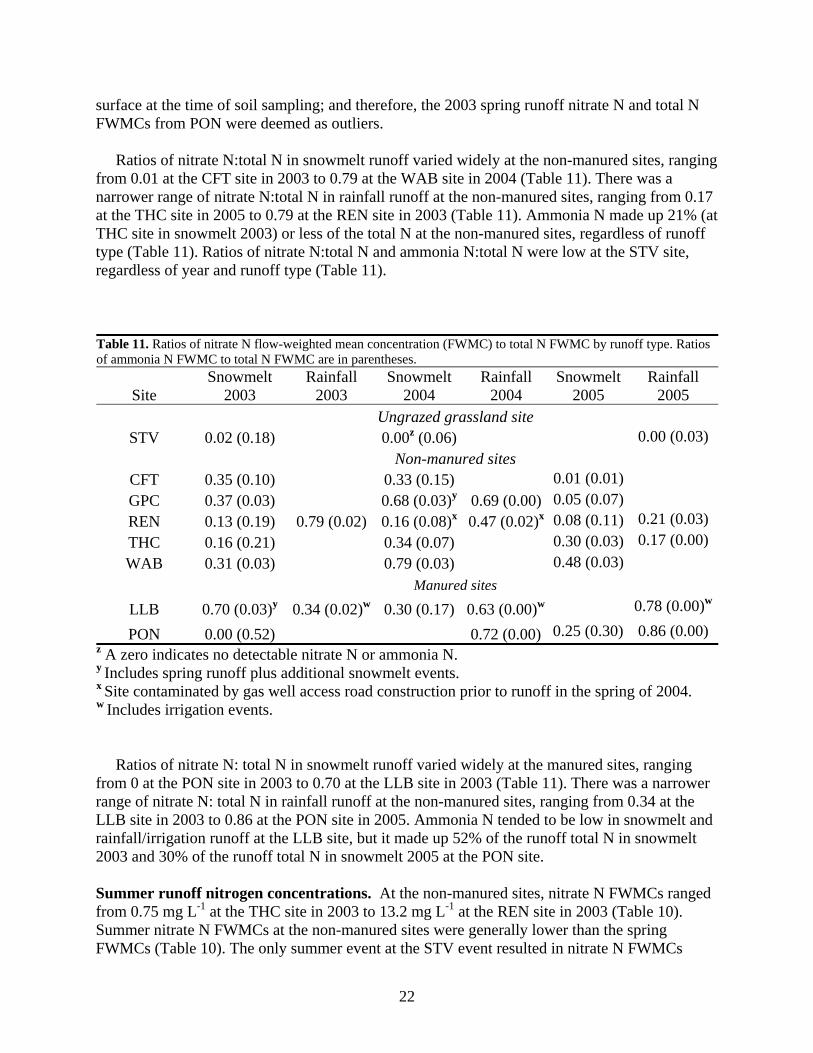
Ratios of nitrate N:total N in snowmelt runoff varied widely at the non-manured sites, ranging from 0.01 at the CFT site in 2003 to 0.79 at the WAB site in 2004 (Table 11). There was a narrower range of nitrate N:total N in rainfall runoff at the non-manured sites, ranging from 0.17 at the THC site in 2005 to 0.79 at the REN site in 2003 (Table 11). Ammonia N made up 21% (at THC site in snowmelt 2003) or less of the total N at the non-manured sites, regardless of runoff type (Table 11). Ratios of nitrate N:total N and ammonia N:total N were low at the STV site, regardless of year and runoff type (Table 11). Table 11. Ratios of nitrate N flow-weighted mean concentration (FWMC) to total N FWMC by runoff type. Ratios of ammonia N FWMC to total N FWMC are in parentheses.
Site Snowmelt
2003 Rainfall
2003 Snowmelt
2004 Rainfall
2004 Snowmelt
2005 Rainfall
2005 Ungrazed grassland site
STV 0.02 (0.18) 0.00z (0.06) 0.00 (0.03) Non-manured sites
CFT 0.35 (0.10) 0.33 (0.15) 0.01 (0.01) GPC 0.37 (0.03) 0.68 (0.03)y 0.69 (0.00) 0.05 (0.07) REN 0.13 (0.19) 0.79 (0.02) 0.16 (0.08)x 0.47 (0.02)x 0.08 (0.11) 0.21 (0.03) THC 0.16 (0.21) 0.34 (0.07) 0.30 (0.03) 0.17 (0.00) WAB 0.31 (0.03) 0.79 (0.03) 0.48 (0.03)
Manured sites
LLB 0.70 (0.03)y 0.34 (0.02)w 0.30 (0.17) 0.63 (0.00)w 0.78 (0.00)w
PON 0.00 (0.52) 0.72 (0.00) 0.25 (0.30) 0.86 (0.00) z A zero indicates no detectable nitrate N or ammonia N. y Includes spring runoff plus additional snowmelt events. x Site contaminated by gas well access road construction prior to runoff in the spring of 2004. w Includes irrigation events. Ratios of nitrate N: total N in snowmelt runoff varied widely at the manured sites, ranging from 0 at the PON site in 2003 to 0.70 at the LLB site in 2003 (Table 11). There was a narrower range of nitrate N: total N in rainfall runoff at the non-manured sites, ranging from 0.34 at the LLB site in 2003 to 0.86 at the PON site in 2005. Ammonia N tended to be low in snowmelt and rainfall/irrigation runoff at the LLB site, but it made up 52% of the runoff total N in snowmelt 2003 and 30% of the runoff total N in snowmelt 2005 at the PON site. Summer runoff nitrogen concentrations. At the non-manured sites, nitrate N FWMCs ranged from 0.75 mg L-1 at the THC site in 2003 to 13.2 mg L-1 at the REN site in 2003 (Table 10). Summer nitrate N FWMCs at the non-manured sites were generally lower than the spring FWMCs (Table 10). The only summer event at the STV event resulted in nitrate N FWMCs
23
below the laboratory detection limit. Summer nitrate N FWMCs at the manured sites ranged from 2.58 mg L-1 at the LLB site in 2003 to 43.4 mg L-1 at the PON site in 2005. Comparisons between spring and summer events were difficult to make at the manured sites because only the LLB site in 2003 and PON in 2005 had spring snowmelt runoff and summer runoff (spring 2004 at the LLB site was omitted because of diluted runoff from the fence line snowdrift as described previously). In 2003, the spring nitrate N FWMC was higher than the summer nitrate N FMWC at the LLB site, but in 2005 the summer nitrate N FWMC was higher than the spring nitrate N FWMC at the PON site. The total N FWMCs were higher in summer runoff at the non-manured sites than in spring runoff (except at the THC site in 2005) with values ranging from 4.35 mg L-1 at the THC site in 2005 to 16.8 mg L-1 at the REN site in 2003 (Table 10). The only summer event at the STV event resulted in total N FWMCs an order of magnitude below the non-manured site values (Table 10). The summer total N FWMCs ranged from 7.59 mg L-1 at the LLB site in 2003 to 50.7 mg L-1 at the PON site in 2005 (Table 10). At the LLB site, the summer total N FWMC was lower than during spring runoff in 2003 and higher in summer than in spring 2004 (due to the diluted runoff being generated from the snowdrift along the fence line as described previously). The summer total N FWMC was higher than the spring total N FWMC at the PON site in 2005 (Table 10). Regardless of how runoff was generated, concentrations of total N exported from the microwatersheds exceeded the in-stream Alberta water quality guideline of 1 mg L-1 total N for the protection of aquatic life (Alberta Environment 1999). It should be noted that this guideline was developed for third- and fourth-order streams, which are much larger than our ephemeral first-order streams and may not be directly applicable to field scales. Even runoff from the ungrazed native prairie site exceeded the 1 mg L-1 total N guideline in spring 2003 (Table 10). As such, it appears that applying the 1 mg L-1 total N water quality objective to field scales may not be appropriate. Relating Nitrogen Concentrations in Soil and Runoff
Results from spring and summer runoff events were included for analysis of the relationship between mean soil nitrate N and runoff nitrate N and total N FWMCs. Seasonal flow-weighted averages were calculated by summing the loads from all spring or summer events and dividing by the flow during that period. Spring snowmelt runoff results were related to the soil sampling results from the previous fall, while summer runoff events were related to the soil sampling results from the spring of the same year. The 2004 and 2005 data from the REN site were excluded since comparison of the results with those measured in 2003 indicated that the gas well access road construction in spring 2004 caused abnormally high concentrations of TP in the spring and summer runoff (Little et al. 2006). Data from spring snowmelt in 2004 at the LLB site were also excluded as runoff was generated exclusively from a snow bank at the edge of the field and would not have occurred without the berm constructed to direct runoff into the flume. Results from the spring runoff in 2003 at the PON site were also excluded due to the recent application of manure that was poorly incorporated due to the frozen soil conditions and the selective sampling of sediment by the ISCO due to sediment accumulation in the H-flume.
24
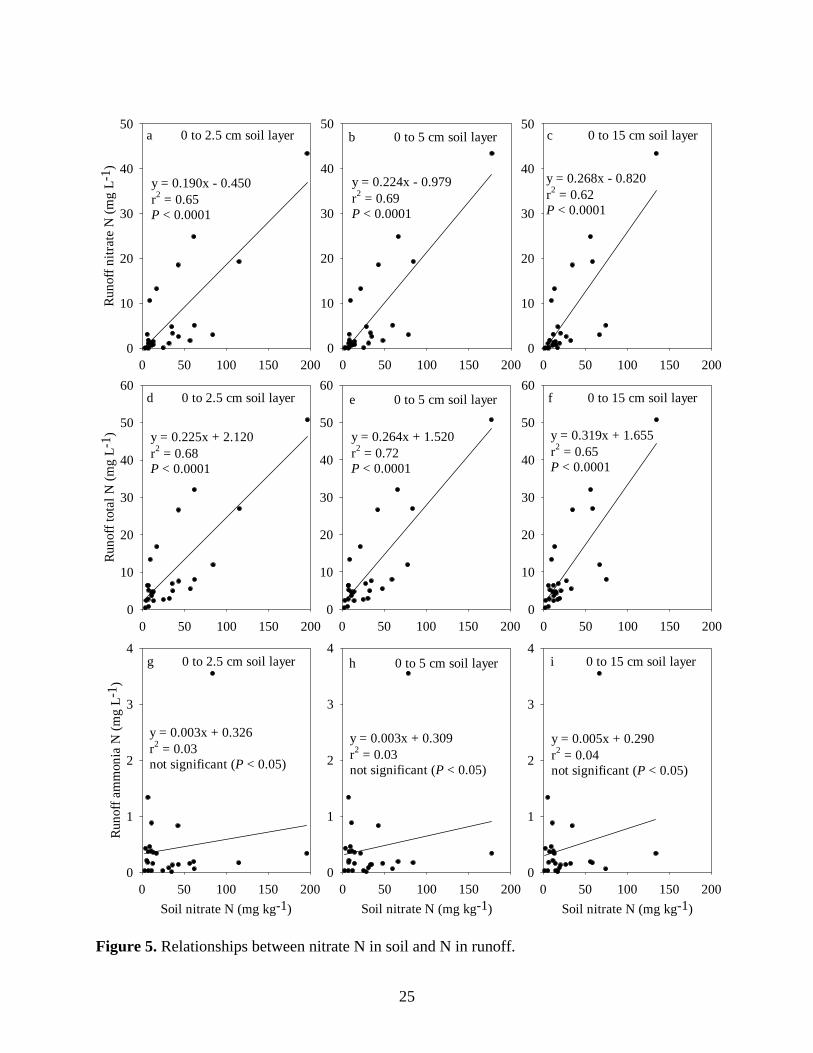
Significant linear relationships were found between nitrate N in soil and nitrate N (r2 = 0.62 to 0.69) and total N (r2 = 0.65 to 0.72) FWMCs in spring and summer runoff for all three soil layers (Figure 5a-f). Differences among the three soil layers were minimal, and this reflects the similarity of nitrate N content among the soil layers. Coefficients of determination improved slightly in the 0- to 5-cm soil layer compared with the 0- to 2.5-cm and 0- to 15-cm soil layers. There were no relationships between soil nitrate N and runoff ammonia N (Figure 5g-i). Although previous studies have found that surface runoff interacts with only a very shallow depth of soil (Sharpley et al. 1978; Sharpley 1985), the relationships developed in our study had similar predictive ability among the soil layers for nitrate N and total N in runoff (Figure 5a-f). Statistical comparisons of the relationships indicated that the slopes and intercepts of the relationships for all three layers were not significantly different. It was anticipated that soil nitrate N from shallower sampling depths may have a stronger relationship with runoff N because the majority of runoff occurred during spring snowmelt when frozen soil restricts infiltration and minimizes the interaction between runoff and soils. However, given that soil nitrate N values among all three layers were similar in our study, it was not surprising they predicted runoff N equally well. Except for one point from the PON site, the soil nitrate N mean values used in the relationships were within a relatively narrow range from 2 to 74 mg kg-1. The one point from the PON site drives the relationship (Figure 5a-f). This point represented the rainfall runoff event that occurred at the PON site in 2005, and when this data point was removed, the coefficients of determination declined from 0.62 to 0.69 to 0.28 to 0.35 for nitrate N FWMC relationships and from 0.65 to 0.72 to 0.36 to 0.44 for total N FWMC relationships. Even though the relationships were still significant (P values of 0.0003 to 0.0070), soil nitrate N explained 44% or less of the variation in runoff N FWMC. The moderately manured LLB site behaved more like a non-manured sites in respect to how much soil nitrate N was lost to runoff, and this is in contrast to findings for STP and runoff P from these same microwatershed sites (Little et al. 2007; Little et al. 2006). They found strong relationships between STP and runoff P (r2 ≥ 0.87), with clear distinctions among the heavily manure PON site, the moderately manured LLB site, and the other six sites.
25
Figure 5. Relationships between nitrate N in soil and N in runoff.
a 0 to 2.5 cm soil layer
0 50 100 150 200
Runo
ff ni
trate
N (m
g L-
1 )
0
10
20
30
40
50b 0 to 5 cm soil layer
0 50 100 150 2000
10
20
30
40
50c 0 to 15 cm soil layer
0 50 100 150 2000
10
20
30
40
50
Soil nitrate N (mg kg-1)0 50 100 150 200
Runo
ff am
mon
ia N
(mg
L-1 )
0
1
2
3
4
Soil nitrate N (mg kg-1)0 50 100 150 200
0
1
2
3
4
Soil nitrate N (mg kg-1)0 50 100 150 200
0
1
2
3
4
0 50 100 150 200
Runo
ff to
tal N
(mg
L-1 )
0
10
20
30
40
50
60
0 50 100 150 2000
10
20
30
40
50
60
0 50 100 150 2000
10
20
30
40
50
60d 0 to 2.5 cm soil layer e 0 to 5 cm soil layer f 0 to 15 cm soil layer
g 0 to 2.5 cm soil layer h 0 to 5 cm soil layer i 0 to 15 cm soil layer
y = 0.190x - 0.450r2 = 0.65P < 0.0001
y = 0.225x + 2.120r2 = 0.68P < 0.0001
y = 0.224x - 0.979r2 = 0.69P < 0.0001
y = 0.268x - 0.820r2 = 0.62P < 0.0001
y = 0.264x + 1.520r2 = 0.72P < 0.0001
y = 0.319x + 1.655r2 = 0.65P < 0.0001
y = 0.003x + 0.326r2 = 0.03not significant (P < 0.05)
y = 0.003x + 0.309r2 = 0.03not significant (P < 0.05)
y = 0.005x + 0.290r2 = 0.04not significant (P < 0.05)
26
CONCLUSIONS Moderate to high application rates of manure caused higher nitrate N levels in the soil. The nitrate N content in the surface 15-cm of soil ranged from 5 to 51 mg kg-1 at the five cultivated, non-manured sites, 27 to 74 mg kg-1 at the two manured sites, and 2 to 6 mg kg-1 at the grassland site. The five cultivated non-manured sites and the manured site at LLB contained nitrate N less than optimum agronomic levels and crops would likely respond to added N fertilizer. There were few differences among the 0- to 2.5-cm, 0- to 5-cm, and 0- to 15-cm soil layers, suggesting that nitrate N tended to be evenly distributed in the top 15 cm of soil. There were also few significant differences among the upper, mid, and lower landform positions at the sites. Spring runoff accounted for the majority of runoff at nearly all of the sites, except for the irrigated LLB site and the GPC site in 2004. Snowmelt runoff accounted for 90% of the runoff volume from the eight sites during the 3 yr of the study. The seasonal nitrate N FWMC ranged from below detection limit of 0.04 mg L-1 at the grassland site, from 0.04 to 13.2 mg L-1 among the five cultivated, non-manured sites, and from 0.41 to 43.4 mg L-1 for the two manured sites. The seasonal total N FWMC ranged from 0.43 to 2.39 mg L-1 at the grassland site, from 2.32 to 17.3 mg L-1 among the five cultivated, non-manured sites, and from 3.80 to 106 mg L-1 for the two manured sites. Concentrations of total N exported from the microwatersheds exceeded the in-stream Alberta water quality guideline for the protection of aquatic life of 1 mg L-1 total N at all sites. Linear relationships were found between extractable nitrate N in soil and total N in runoff and between extractable nitrate N in soil and nitrate N in runoff. There was no relationship between soil nitrate N and runoff ammonia N. The relationships among the three soil layers were similar, and this reflects the similar nitrate N concentrations among the soil layers. Therefore, nitrate N content in the three soil layers predicted nitrate N and total N concentrations in runoff water equally well. Coefficients of determination among the three soil layers ranged from 0.62 to 0.69 for nitrate N in runoff and from 0.65 to 0.72 for total N in runoff. These linear relationships were driven by one point from the heavily manured PON site. When this point was removed, coefficients of determination decreased to a range from 0.28 to 0.35 for the nitrate N in runoff and to a range from 0.36 to 0.44 for total N in runoff. Therefore, the relationships are not particularly strong and soil extractable nitrate N is a weak predictor of nitrate N or total N in edge-of-field runoff water.
27
REFERENCES Alberta Environment. 1999. Surface water quality guidelines for use in Alberta. Publication T/483. Alberta Environment, Edmonton, Alberta, Canada. 20 pp.
Alberts, E.E. and Spomer, R.G. 1985. Dissolved nitrogen and phosphorus in runoff from watersheds in conservation and conventional tillage. J. Soil Water Conserv. 40: 153-157.
Ashworth, J. and Mrazek, K. 1995. “Modified Kelowna” test for available phosphorus and potassium in soil. Commun. Soil Sci. Plant Anal. 26: 731-739.
Baligar, V.C., Fageria, N.K., and He, Z.L. 2001. Nutrient use efficiency in plants. Commun. Soil Sci. Plant Anal. 32: 921-950.
Burnwell, R.E., Timmons, D.R., and Holt, R.F. 1975. Nutrient transport in surface runoff as influenced by soil cover and seasonal periods. Soil Sci. Soc. Am. Proc. 39: 523-528.
Carpenter, S.R., Caraco, N.F., Correll, D.L., Howarth, R.W., Sharpley, A.N., and Smith, V.H. 1998. Nonpoint pollution of surface waters with phosphorus and nitrogen. Ecol. Applic. 8: 559-568.
Chambers, P.A., Guy, M., Roberts, E.S., Charlton, M.N., Kent, R., Gagnon, C., Grove, G., and Foster, N. 2001. Nutrients and their impact on the Canadian environment. Agriculture and Agri-Food Canada, Environment Canada, Fisheries and Oceans Canada, Health Canada, and Natural Resources Canada. 241 pp.
Chetner, S. and Agroclimatic Atlas Working Group. 2003. Agroclimatic atlas of Alberta: 1971-2000. Agdex 071-1, Alberta Agriculture, Food and Rural Development, Edmonton, Alberta, Canada. 97 pp.
Daniel, T.C., Sharpley, A.N., Edwards, D.R., Wedepohl, R., and Lemunyon, J.L. 1994. Minimizing surface water eutrophication from agriculture by phosphorus management. J. Soil Water Conserv. 49: 30-38 (supplement).
De Jong, R., Yang, J.Y., Drury, C.F., Huffman, E.C., Kirkwood, V., and Yang, X.M. 2007. The indicator of risk of water contamination by nitrate-nitrogen. Can. J. Soil Sci. 87: 179-188.
Delgado, J.A. 2002. Quantifying the loss mechanisms of nitrogen. J. Soil Water Conserv. 57: 389-398.
Douglas, Jr., C.L., King, K.A., and Zuzel, J.F. 1998. Nitrogen and phosphorus in surface and sediment from a wheat-pea rotation in northeastern Oregon. J. Environ. Qual. 27: 1170-1177.
Eghball B. and Gilley J.E. 1999. Phosphorus and nitrogen in runoff following beef cattle manure or compost application. J. Environ. Qual. 28: 1201-1210.
Eickhout, B., Bouwman, A.F., and van Zeijts, H. 2006. The role of nitrogen in world food production and environmental sustainability. Agric. Ecosyst. Environ. 116: 4-14.
Environment Canada. 2005. Climate normals and averages. [Online] Available at http://www.climate.weatheroffice.ec.gc.ca/climate_normals/stnselect_e.html (Accessed December 2005).
Follett, R.F. and Delgado, J.A. 2002. Nitrogen fate and transport in agricultural systems. J. Soil and Water Conserv. 57: 402-408.
28
Gascho, G.J., Wauchope, R.D., Davis, J.G., Truman, C.C., Dowler, C.C., Hook, J.E., Sumner, H.R., and Johnson, A.W. 1998. Nitrate-nitrogen, soluble, and bioavailable phosphorus runoff from simulated rainfall after fertilizer application. Soil Sci. Soc. Am. J. 62: 1711-1718.
Gill, S.I., Naeth, M.A., Chanasyk, D.S., and Baron, V.S. 1998. Runoff and sediment yield from snowmelt and rainfall as influenced by forage type and grazing intensity. Can. J. Soil Sci. 78: 699-706.
Gilley, J.E., Eghball, B., and Marx, D.B. 2007. Nitrogen and phosphorus concentrations of runoff as affected by moldboard plowing. Trans. ASABE 50: 1543-1548.
Harmel, D., Potter, S., Casebolt P., Reckhow, K., Green, C., and Haney, R. 2006. Compilation of measured nutrient load data for agricultural land uses in the United States. J. Am. Water Res. Assoc. 42: 1163-1178.
Hubbard, R.K., Leonard, R.A., and Johnson, A.W. 1991. Nitrate transport on a coastal plain soil underlain by plinthite. Trans ASAE 34: 802-808.
Hubbard, R.K. and Sheridan, J.M. 1983. Water and nitrate losses from a small upland coastal plain watershed. J. Environ. Qual. 12: 291-295.
Jandel Scientific Software. 1994. TableCurve 2D v. 3. AISN Software Inc.
Jedrych, A.T., Martin, T.C., and Vanderwel, D.S. 2002. Runoff map of Alberta at the AGRASID soil polygon scale. Pages 159-163 in Proceedings of the Alberta Soil Science Workshop, Lethbridge, Alberta, Canada. February 19-20, 2002.
Jeje, Y. 2006. Export coefficients for total phosphorus, total nitrogen, and total suspended solids in the southern Alberta region. Alberta Environment, Edmonton, Alberta, Canada. 22 pp.
Little, J.L., Nolan, S.C., and Casson, J.P. 2006. Relationships between soil-test phosphorus and runoff phosphorus in small Alberta watersheds. 150 pp. In Alberta Soil Phosphorus Limits Project. Volume 2: Field-scale losses and soil limits. Alberta Agriculture, Food and Rural Development, Lethbridge, Alberta, Canada.
Little, J.L., Nolan, S.C., Casson, J.P., and Olson, B.M. 2007. Relationship between soil and runoff phosphorus in small Alberta watersheds. J. Environ. Qual. 36: 1289-1300.
Lowrance, R. 1992. Nitrogen outputs from a field-size agricultural watershed. J. Environ. Qual. 21: 602-607.
Mapfumo, E., Willms, W.D., and Chanasyk, D.S. 2002. Water quality of surface runoff from grazed fescue grassland watersheds in Alberta. Water Qual. Res. J. Canada. 37: 543-562.
Masand, S.S. 1992. Effect of soil tillage methods and nitrogen levels on nitrogen loss in runoff. Indian J. Hill Farming 5: 151-153.
Maynard, D.G. and Kalra, Y.P. 1993. Nitrate and exchangeable ammonium nitrogen. Pages 25-38 in M.R. Carter (ed.). Soil sampling and methods of analysis. Canadian Society of Soil Science. CRC Press, Inc., Boca Raton, Florida, United States.
McKenzie, R.H., DeMulder, J., and Solberg, E. 2000. Optimizing barley silage production in Alberta. Agdex 114/540-1. Alberta Agriculture, Food and Rural Development, Edmonton, Alberta, Canada. 4 pp.
29
Miller, J.J., Olson, E.C.S., Chanasyk, D.S., Beasley, B.W., Larney, F.J., and Olson, B.M. 2006. Phosphorus and nitrogen in rainfall simulation runoff after fresh and composted beef cattle manure. J. Environ. Qual. 35: 1279-1290.
Nicholaichuk, W. 1967. Comparative watershed studies in southern Saskatchewan. Trans. ASAE. 10: 502-504.
Nolan, S.C., Little, J.L., Casson, J.P., Hecker. F.J., and Olson, B.M. 2007. Field-scale variation of soil phosphorus within small Alberta watersheds. J. Soil Water Conserv. 62: 414-422.
Ontkean, G.R., Chanasyk, D.S., and Bennett, D.R. 2005. Snowmelt and growing season phosphorus flux in an agricultural watershed in south-central Alberta, Canada. Water Qual. Res. J. Can. 40: 402-417.
Paterson, B.A., Olson, B.M., and Bennett, D.R. 2006. Alberta soil phosphorus limits project. Volume 1: Summary and recommendations. Alberta Agriculture, Food and Rural Development, Lethbridge, Alberta, Canada. 82 pp.
Pote, D.H., Daniel, T.C., Sharpley, A.N., Moore, Jr., P.A., Edwards, D.R., and Nichols, D.J. 1996. Relating extractable soil phosphorus to phosphorus losses in runoff. Soil Sci. Soc. Am. J. 60: 855-859.
Province of Alberta. 2005. Agricultural operations practices act and regulations. Alberta Queen’s Printer, Edmonton, Alberta, Canada.
Quinn, P.F., Beven, K.J., and Lamb, R. 1995. The ln(a/tanβ) Index: How to calculate it and how to use it within the topmodel framework. Hydrological Processes 9: 161-182.
Romkens, M.J.M., Nelson, D.W., and Mannering, J.V. 1973. Nitrogen and phosphorus composition of surface runoff as affected by tillage method. J. Environ. Qual. 2: 292-295.
Samani, Z., Jorat, S., and Yousaf, M. 1991. Hydraulic characteristics of circular flume. J. Irrig. and Drain. Eng. 117: 558-566.
SAS Institute Inc. 2002. The SAS® System for WindowsTM, release 9.1. SAS Institute Inc., Cary, North Carolina, United States.
Schilling, K.E. and Spooner, J. 2006. Effects of watershed-scale land use change on stream nitrate concentrations. J. Environ. Qual. 35: 2132-2145.
Sharpley, A.N. 1985. Depth of surface soil-runoff interaction as affected by rainfall, soil slope, and management. Soil Sci. Soc. Am. J. 49: 1010-1015.
Sharpley, A.N., Smith, S.J., and Naney, J.W. 1987. Environmental impact of agricultural nitrogen and phosphorus use. J. Agric. Food Chem. 35: 812-817.
Sharpley, A.N., Syers, J.K., and Tillman, R.W. 1978. An improved soil-sampling procedure for the prediction of dissolved inorganic phosphate concentrations in surface runoff from pastures. J. Environ. Qual. 7: 455-456.
Sharpley, A.N., Tillman, R.W., and Syers, J.K. 1977. Use of laboratory extraction data to predict losses of dissolved inorganic phosphate in surface runoff and tile drainage. J. Environ. Qual. 6: 33-36.
30
Soil Test Technical Advisory Group. 1988. Soil test recommendations for Alberta technical manual. Alberta Agriculture, Edmonton, Alberta, Canada.
Torbert, H.A., Daniel, T.C., Lemunyon, J.L., and Jones, R.M. 2002. Relationship of soil test phosphorus and sampling depth to runoff phosphorus in calcareous and noncalcareous soils. J. Environ. Qual. 31: 1380-1387.
United Nations Educational Scientific and Cultural Organization (UNESCO). 2002. UN World water development report: Water for people, water for life. [Online] Available at http://www.unesco.org/water/wwap/wwdr/table_contents.shtml. (Accessed January 10, 2006).
United States Environmental Protection Agency (US EPA). 1998. National Water Quality Inventory: 1998 Report to Congress. EPA #: 841-R00001. Washington, DC., United States.
Wuite, J.J. and Chanasyk, D.S. 2003. Evaluation of two beneficial management practices to improve water quality. Alberta Agricultural Research Institute Project No. 990054. 199 pp.
Zheng, F.-L., Huang, C.-H., and Norton L.D. 2006. Effects of near-surface hydraulic gradients on nitrate and phosphorus losses in surface runoff. J. Environ. Qual. 33: 2174-2182.
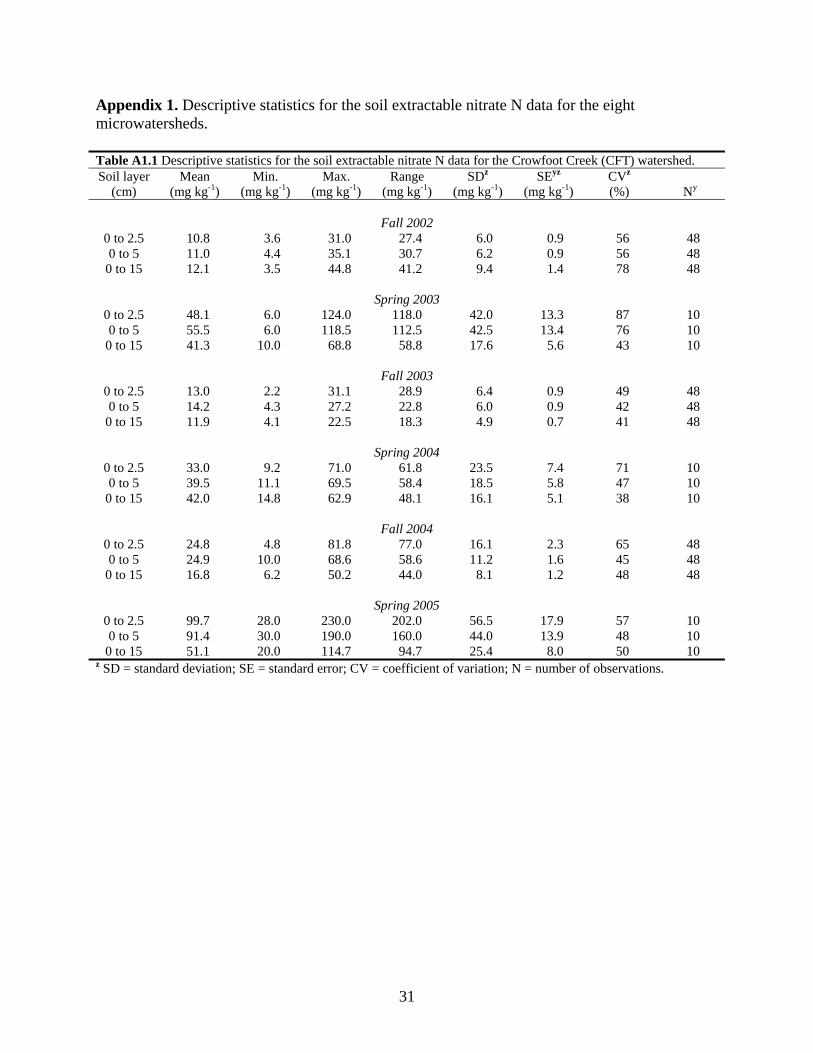
31
Appendix 1. Descriptive statistics for the soil extractable nitrate N data for the eight microwatersheds. Table A1.1 Descriptive statistics for the soil extractable nitrate N data for the Crowfoot Creek (CFT) watershed. Soil layer
(cm) Mean
(mg kg-1) Min.
(mg kg-1) Max.
(mg kg-1) Range
(mg kg-1) SDz
(mg kg-1) SEyz
(mg kg-1) CVz
(%) Ny
Fall 2002
0 to 2.5 10.8 3.6 31.0 27.4 6.0 0.9 56 48 0 to 5 11.0 4.4 35.1 30.7 6.2 0.9 56 48
0 to 15 12.1 3.5 44.8 41.2 9.4 1.4 78 48
Spring 2003 0 to 2.5 48.1 6.0 124.0 118.0 42.0 13.3 87 10 0 to 5 55.5 6.0 118.5 112.5 42.5 13.4 76 10
0 to 15 41.3 10.0 68.8 58.8 17.6 5.6 43 10
Fall 2003 0 to 2.5 13.0 2.2 31.1 28.9 6.4 0.9 49 48 0 to 5 14.2 4.3 27.2 22.8 6.0 0.9 42 48
0 to 15 11.9 4.1 22.5 18.3 4.9 0.7 41 48
Spring 2004 0 to 2.5 33.0 9.2 71.0 61.8 23.5 7.4 71 10 0 to 5 39.5 11.1 69.5 58.4 18.5 5.8 47 10
0 to 15 42.0 14.8 62.9 48.1 16.1 5.1 38 10
Fall 2004 0 to 2.5 24.8 4.8 81.8 77.0 16.1 2.3 65 48 0 to 5 24.9 10.0 68.6 58.6 11.2 1.6 45 48
0 to 15 16.8 6.2 50.2 44.0 8.1 1.2 48 48
Spring 2005 0 to 2.5 99.7 28.0 230.0 202.0 56.5 17.9 57 10 0 to 5 91.4 30.0 190.0 160.0 44.0 13.9 48 10
0 to 15 51.1 20.0 114.7 94.7 25.4 8.0 50 10 z SD = standard deviation; SE = standard error; CV = coefficient of variation; N = number of observations.
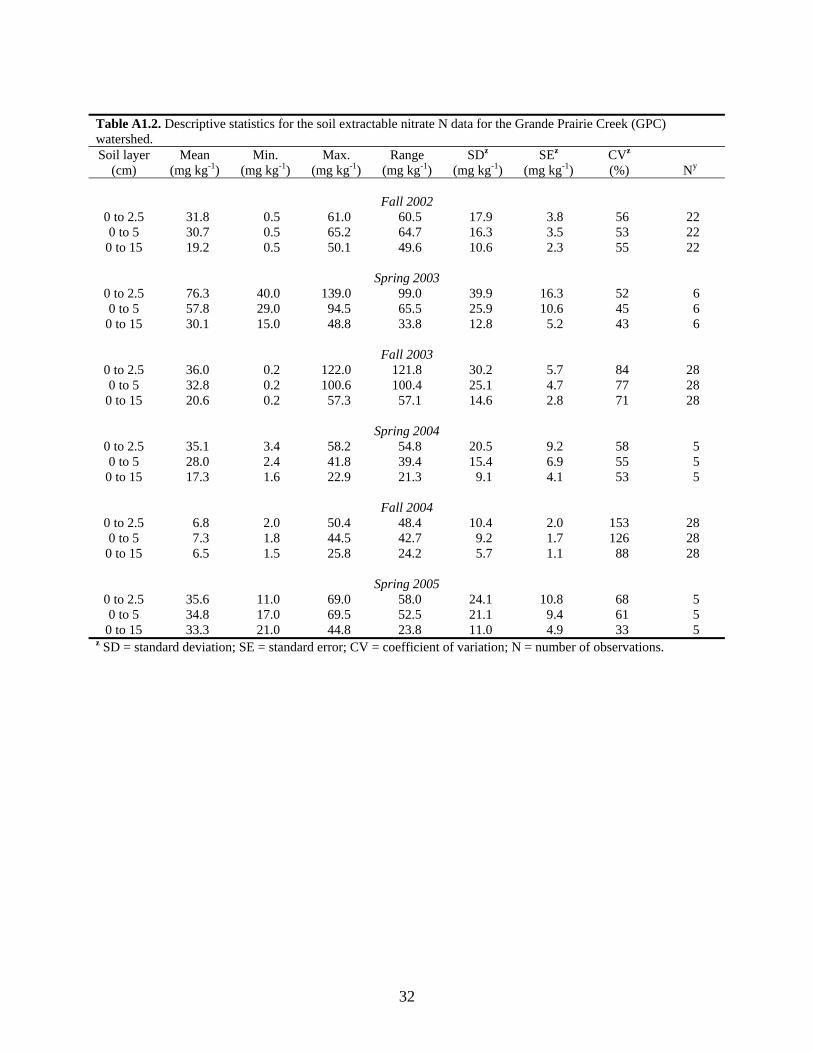
32
Table A1.2. Descriptive statistics for the soil extractable nitrate N data for the Grande Prairie Creek (GPC) watershed. Soil layer
(cm) Mean
(mg kg-1) Min.
(mg kg-1) Max.
(mg kg-1) Range
(mg kg-1) SDz
(mg kg-1) SEz
(mg kg-1) CVz
(%) Ny
Fall 2002
0 to 2.5 31.8 0.5 61.0 60.5 17.9 3.8 56 22 0 to 5 30.7 0.5 65.2 64.7 16.3 3.5 53 22
0 to 15 19.2 0.5 50.1 49.6 10.6 2.3 55 22
Spring 2003 0 to 2.5 76.3 40.0 139.0 99.0 39.9 16.3 52 6 0 to 5 57.8 29.0 94.5 65.5 25.9 10.6 45 6
0 to 15 30.1 15.0 48.8 33.8 12.8 5.2 43 6
Fall 2003 0 to 2.5 36.0 0.2 122.0 121.8 30.2 5.7 84 28 0 to 5 32.8 0.2 100.6 100.4 25.1 4.7 77 28
0 to 15 20.6 0.2 57.3 57.1 14.6 2.8 71 28
Spring 2004 0 to 2.5 35.1 3.4 58.2 54.8 20.5 9.2 58 5 0 to 5 28.0 2.4 41.8 39.4 15.4 6.9 55 5
0 to 15 17.3 1.6 22.9 21.3 9.1 4.1 53 5
Fall 2004 0 to 2.5 6.8 2.0 50.4 48.4 10.4 2.0 153 28 0 to 5 7.3 1.8 44.5 42.7 9.2 1.7 126 28
0 to 15 6.5 1.5 25.8 24.2 5.7 1.1 88 28
Spring 2005 0 to 2.5 35.6 11.0 69.0 58.0 24.1 10.8 68 5 0 to 5 34.8 17.0 69.5 52.5 21.1 9.4 61 5
0 to 15 33.3 21.0 44.8 23.8 11.0 4.9 33 5 z SD = standard deviation; SE = standard error; CV = coefficient of variation; N = number of observations.
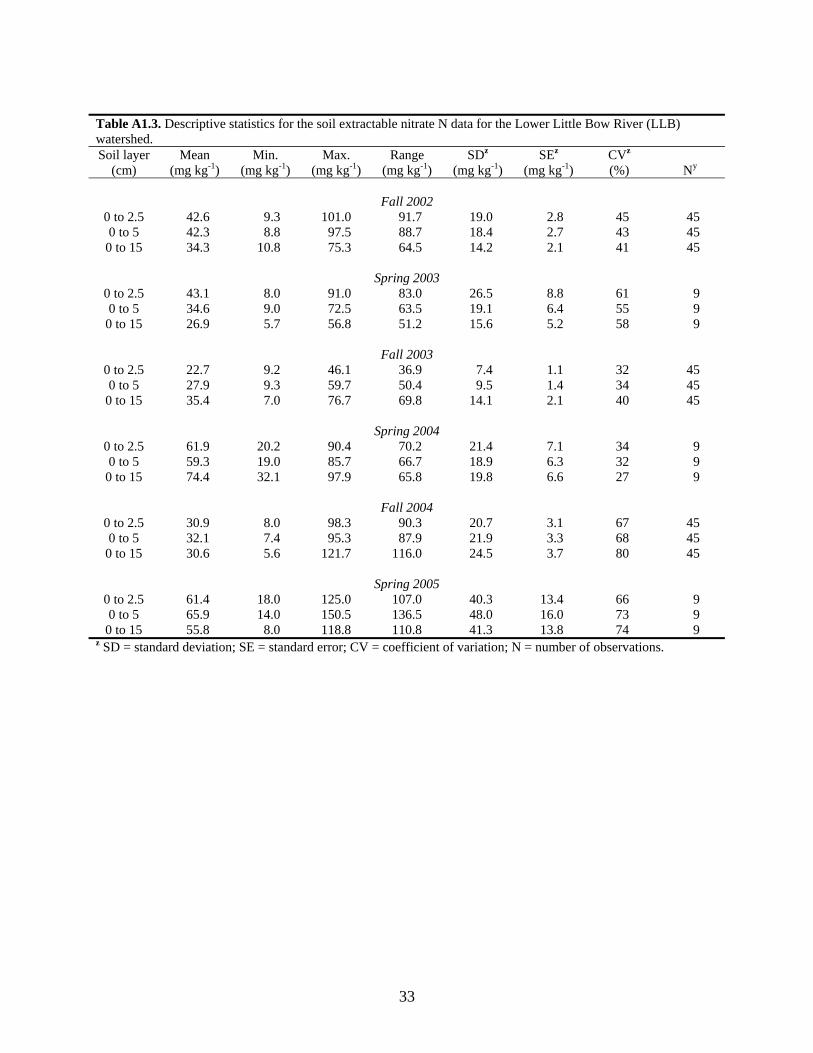
33
Table A1.3. Descriptive statistics for the soil extractable nitrate N data for the Lower Little Bow River (LLB) watershed. Soil layer
(cm) Mean
(mg kg-1) Min.
(mg kg-1) Max.
(mg kg-1) Range
(mg kg-1) SDz
(mg kg-1) SEz
(mg kg-1) CVz
(%) Ny
Fall 2002
0 to 2.5 42.6 9.3 101.0 91.7 19.0 2.8 45 45 0 to 5 42.3 8.8 97.5 88.7 18.4 2.7 43 45
0 to 15 34.3 10.8 75.3 64.5 14.2 2.1 41 45
Spring 2003 0 to 2.5 43.1 8.0 91.0 83.0 26.5 8.8 61 9 0 to 5 34.6 9.0 72.5 63.5 19.1 6.4 55 9
0 to 15 26.9 5.7 56.8 51.2 15.6 5.2 58 9
Fall 2003 0 to 2.5 22.7 9.2 46.1 36.9 7.4 1.1 32 45 0 to 5 27.9 9.3 59.7 50.4 9.5 1.4 34 45
0 to 15 35.4 7.0 76.7 69.8 14.1 2.1 40 45
Spring 2004 0 to 2.5 61.9 20.2 90.4 70.2 21.4 7.1 34 9 0 to 5 59.3 19.0 85.7 66.7 18.9 6.3 32 9
0 to 15 74.4 32.1 97.9 65.8 19.8 6.6 27 9
Fall 2004 0 to 2.5 30.9 8.0 98.3 90.3 20.7 3.1 67 45 0 to 5 32.1 7.4 95.3 87.9 21.9 3.3 68 45
0 to 15 30.6 5.6 121.7 116.0 24.5 3.7 80 45
Spring 2005 0 to 2.5 61.4 18.0 125.0 107.0 40.3 13.4 66 9 0 to 5 65.9 14.0 150.5 136.5 48.0 16.0 73 9
0 to 15 55.8 8.0 118.8 110.8 41.3 13.8 74 9 z SD = standard deviation; SE = standard error; CV = coefficient of variation; N = number of observations.
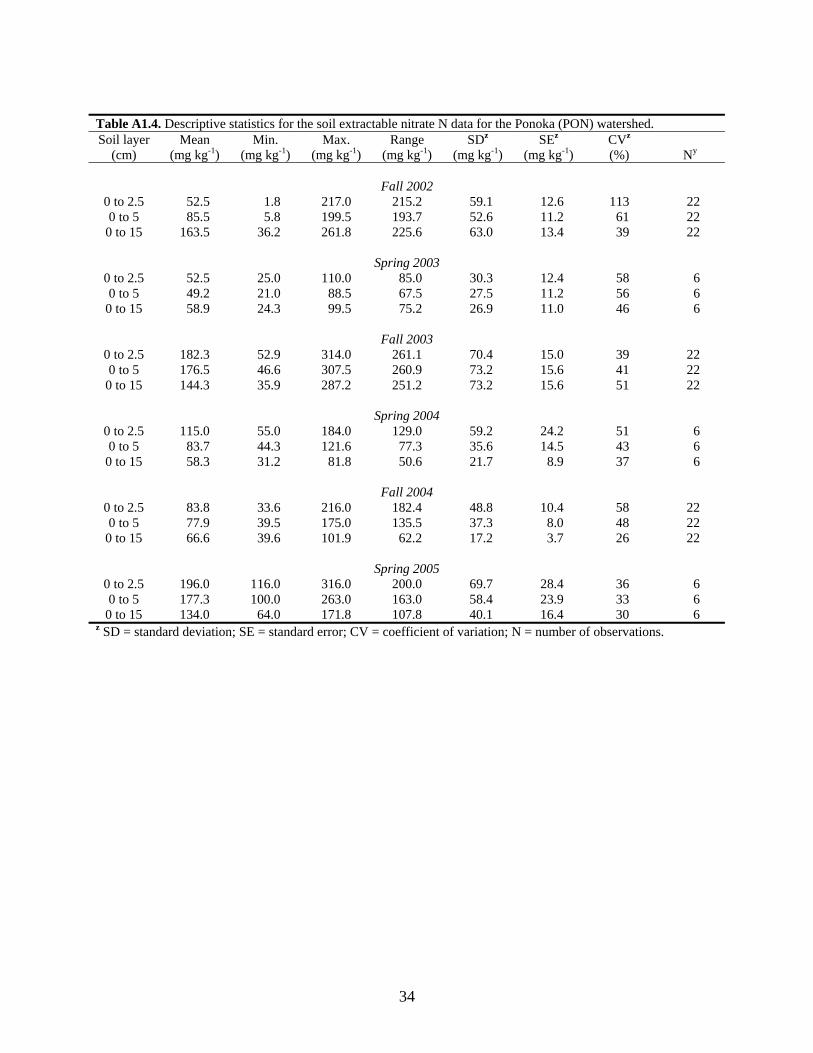
34
Table A1.4. Descriptive statistics for the soil extractable nitrate N data for the Ponoka (PON) watershed. Soil layer
(cm) Mean
(mg kg-1) Min.
(mg kg-1) Max.
(mg kg-1) Range
(mg kg-1) SDz
(mg kg-1) SEz
(mg kg-1) CVz
(%) Ny
Fall 2002
0 to 2.5 52.5 1.8 217.0 215.2 59.1 12.6 113 22 0 to 5 85.5 5.8 199.5 193.7 52.6 11.2 61 22
0 to 15 163.5 36.2 261.8 225.6 63.0 13.4 39 22
Spring 2003 0 to 2.5 52.5 25.0 110.0 85.0 30.3 12.4 58 6 0 to 5 49.2 21.0 88.5 67.5 27.5 11.2 56 6
0 to 15 58.9 24.3 99.5 75.2 26.9 11.0 46 6
Fall 2003 0 to 2.5 182.3 52.9 314.0 261.1 70.4 15.0 39 22 0 to 5 176.5 46.6 307.5 260.9 73.2 15.6 41 22
0 to 15 144.3 35.9 287.2 251.2 73.2 15.6 51 22
Spring 2004 0 to 2.5 115.0 55.0 184.0 129.0 59.2 24.2 51 6 0 to 5 83.7 44.3 121.6 77.3 35.6 14.5 43 6
0 to 15 58.3 31.2 81.8 50.6 21.7 8.9 37 6
Fall 2004 0 to 2.5 83.8 33.6 216.0 182.4 48.8 10.4 58 22 0 to 5 77.9 39.5 175.0 135.5 37.3 8.0 48 22
0 to 15 66.6 39.6 101.9 62.2 17.2 3.7 26 22
Spring 2005 0 to 2.5 196.0 116.0 316.0 200.0 69.7 28.4 36 6 0 to 5 177.3 100.0 263.0 163.0 58.4 23.9 33 6
0 to 15 134.0 64.0 171.8 107.8 40.1 16.4 30 6 z SD = standard deviation; SE = standard error; CV = coefficient of variation; N = number of observations.
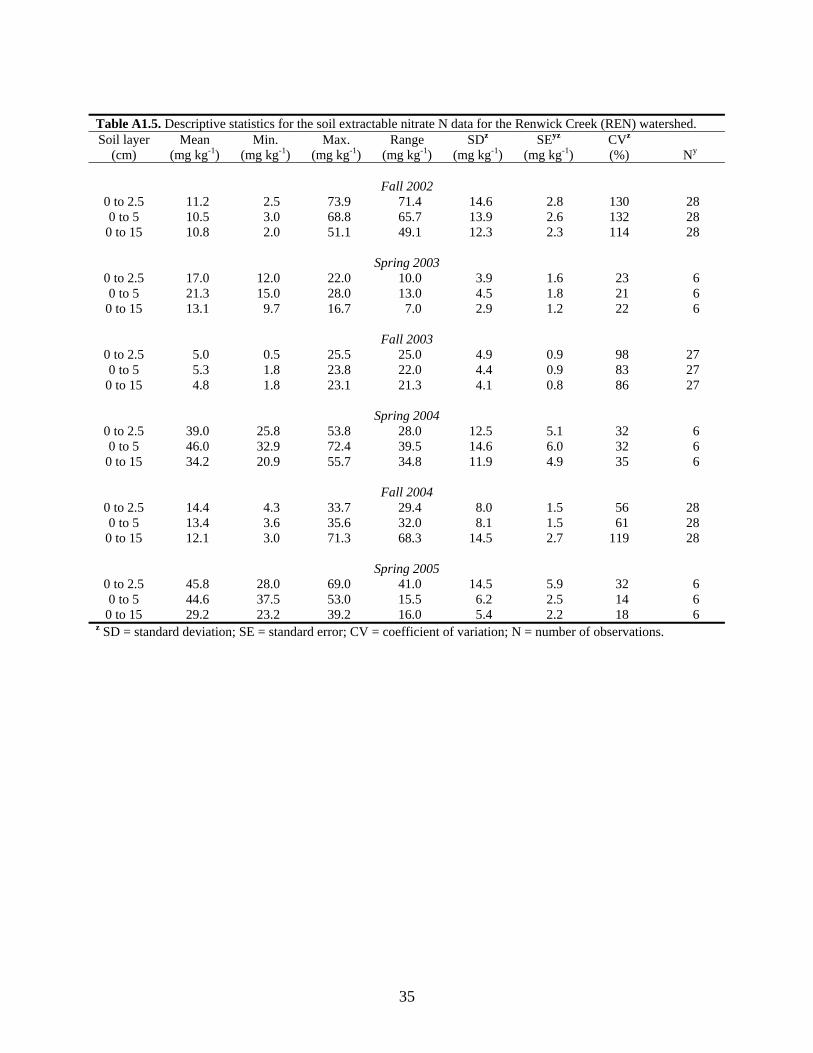
35
Table A1.5. Descriptive statistics for the soil extractable nitrate N data for the Renwick Creek (REN) watershed. Soil layer
(cm) Mean
(mg kg-1) Min.
(mg kg-1) Max.
(mg kg-1) Range
(mg kg-1) SDz
(mg kg-1) SEyz
(mg kg-1) CVz
(%) Ny
Fall 2002
0 to 2.5 11.2 2.5 73.9 71.4 14.6 2.8 130 28 0 to 5 10.5 3.0 68.8 65.7 13.9 2.6 132 28
0 to 15 10.8 2.0 51.1 49.1 12.3 2.3 114 28
Spring 2003 0 to 2.5 17.0 12.0 22.0 10.0 3.9 1.6 23 6 0 to 5 21.3 15.0 28.0 13.0 4.5 1.8 21 6
0 to 15 13.1 9.7 16.7 7.0 2.9 1.2 22 6
Fall 2003 0 to 2.5 5.0 0.5 25.5 25.0 4.9 0.9 98 27 0 to 5 5.3 1.8 23.8 22.0 4.4 0.9 83 27
0 to 15 4.8 1.8 23.1 21.3 4.1 0.8 86 27
Spring 2004 0 to 2.5 39.0 25.8 53.8 28.0 12.5 5.1 32 6 0 to 5 46.0 32.9 72.4 39.5 14.6 6.0 32 6
0 to 15 34.2 20.9 55.7 34.8 11.9 4.9 35 6
Fall 2004 0 to 2.5 14.4 4.3 33.7 29.4 8.0 1.5 56 28 0 to 5 13.4 3.6 35.6 32.0 8.1 1.5 61 28
0 to 15 12.1 3.0 71.3 68.3 14.5 2.7 119 28
Spring 2005 0 to 2.5 45.8 28.0 69.0 41.0 14.5 5.9 32 6 0 to 5 44.6 37.5 53.0 15.5 6.2 2.5 14 6
0 to 15 29.2 23.2 39.2 16.0 5.4 2.2 18 6 z SD = standard deviation; SE = standard error; CV = coefficient of variation; N = number of observations.
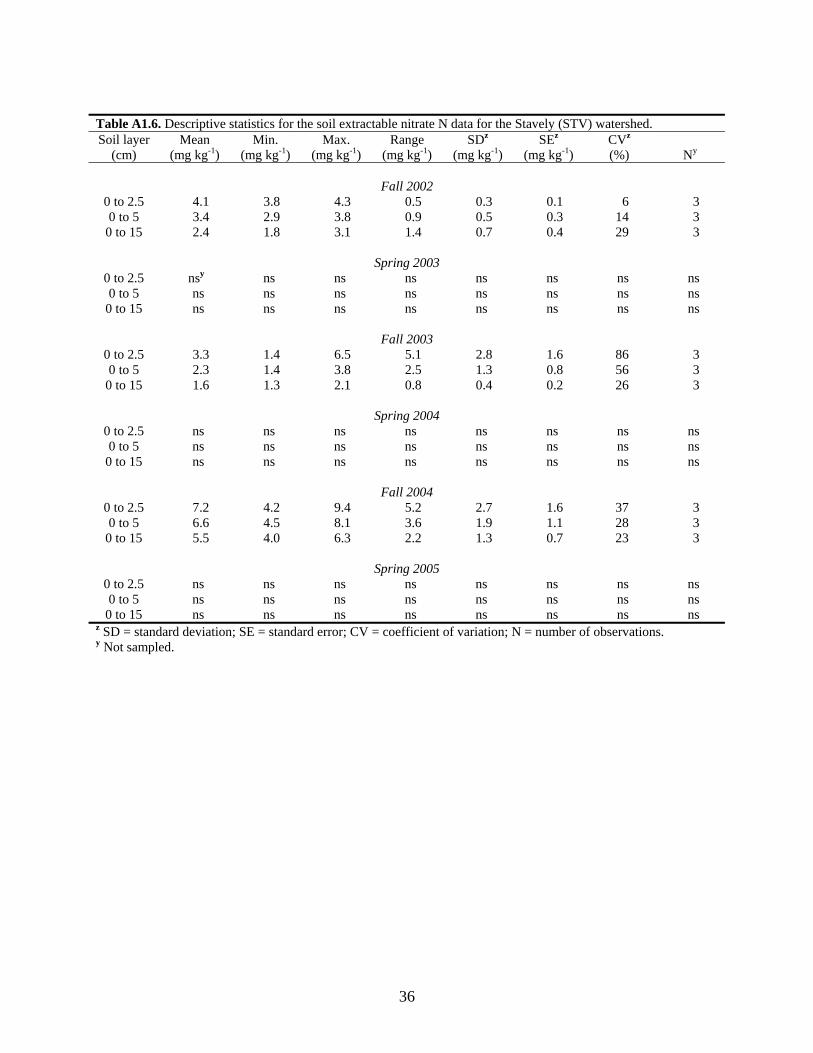
36
Table A1.6. Descriptive statistics for the soil extractable nitrate N data for the Stavely (STV) watershed. Soil layer
(cm) Mean
(mg kg-1) Min.
(mg kg-1) Max.
(mg kg-1) Range
(mg kg-1) SDz
(mg kg-1) SEz
(mg kg-1) CVz
(%) Ny
Fall 2002
0 to 2.5 4.1 3.8 4.3 0.5 0.3 0.1 6 3 0 to 5 3.4 2.9 3.8 0.9 0.5 0.3 14 3
0 to 15 2.4 1.8 3.1 1.4 0.7 0.4 29 3
Spring 2003 0 to 2.5 nsy ns ns ns ns ns ns ns 0 to 5 ns ns ns ns ns ns ns ns
0 to 15 ns ns ns ns ns ns ns ns
Fall 2003 0 to 2.5 3.3 1.4 6.5 5.1 2.8 1.6 86 3 0 to 5 2.3 1.4 3.8 2.5 1.3 0.8 56 3
0 to 15 1.6 1.3 2.1 0.8 0.4 0.2 26 3
Spring 2004 0 to 2.5 ns ns ns ns ns ns ns ns 0 to 5 ns ns ns ns ns ns ns ns
0 to 15 ns ns ns ns ns ns ns ns
Fall 2004 0 to 2.5 7.2 4.2 9.4 5.2 2.7 1.6 37 3 0 to 5 6.6 4.5 8.1 3.6 1.9 1.1 28 3
0 to 15 5.5 4.0 6.3 2.2 1.3 0.7 23 3
Spring 2005 0 to 2.5 ns ns ns ns ns ns ns ns 0 to 5 ns ns ns ns ns ns ns ns
0 to 15 ns ns ns ns ns ns ns ns z SD = standard deviation; SE = standard error; CV = coefficient of variation; N = number of observations. y Not sampled.
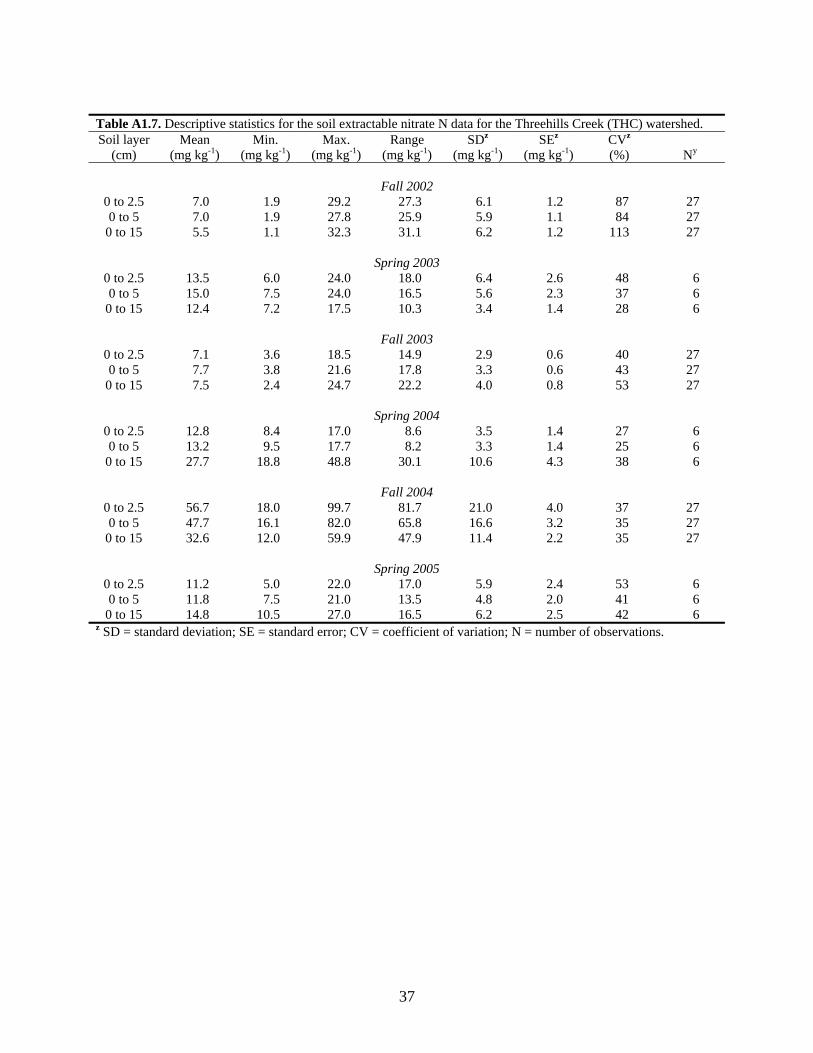
37
Table A1.7. Descriptive statistics for the soil extractable nitrate N data for the Threehills Creek (THC) watershed. Soil layer
(cm) Mean
(mg kg-1) Min.
(mg kg-1) Max.
(mg kg-1) Range
(mg kg-1) SDz
(mg kg-1) SEz
(mg kg-1) CVz
(%) Ny
Fall 2002
0 to 2.5 7.0 1.9 29.2 27.3 6.1 1.2 87 27 0 to 5 7.0 1.9 27.8 25.9 5.9 1.1 84 27
0 to 15 5.5 1.1 32.3 31.1 6.2 1.2 113 27
Spring 2003 0 to 2.5 13.5 6.0 24.0 18.0 6.4 2.6 48 6 0 to 5 15.0 7.5 24.0 16.5 5.6 2.3 37 6
0 to 15 12.4 7.2 17.5 10.3 3.4 1.4 28 6
Fall 2003 0 to 2.5 7.1 3.6 18.5 14.9 2.9 0.6 40 27 0 to 5 7.7 3.8 21.6 17.8 3.3 0.6 43 27
0 to 15 7.5 2.4 24.7 22.2 4.0 0.8 53 27
Spring 2004 0 to 2.5 12.8 8.4 17.0 8.6 3.5 1.4 27 6 0 to 5 13.2 9.5 17.7 8.2 3.3 1.4 25 6
0 to 15 27.7 18.8 48.8 30.1 10.6 4.3 38 6
Fall 2004 0 to 2.5 56.7 18.0 99.7 81.7 21.0 4.0 37 27 0 to 5 47.7 16.1 82.0 65.8 16.6 3.2 35 27
0 to 15 32.6 12.0 59.9 47.9 11.4 2.2 35 27
Spring 2005 0 to 2.5 11.2 5.0 22.0 17.0 5.9 2.4 53 6 0 to 5 11.8 7.5 21.0 13.5 4.8 2.0 41 6
0 to 15 14.8 10.5 27.0 16.5 6.2 2.5 42 6 z SD = standard deviation; SE = standard error; CV = coefficient of variation; N = number of observations.
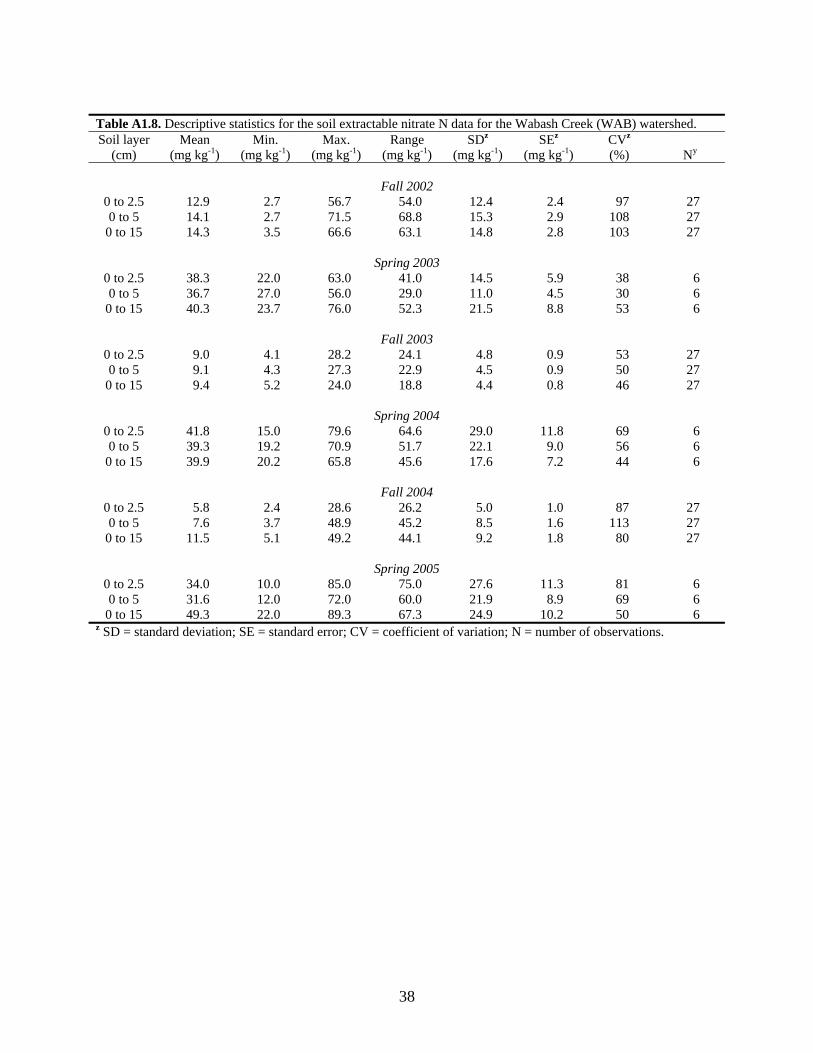
38
Table A1.8. Descriptive statistics for the soil extractable nitrate N data for the Wabash Creek (WAB) watershed. Soil layer
(cm) Mean
(mg kg-1) Min.
(mg kg-1) Max.
(mg kg-1) Range
(mg kg-1) SDz
(mg kg-1) SEz
(mg kg-1) CVz
(%) Ny
Fall 2002
0 to 2.5 12.9 2.7 56.7 54.0 12.4 2.4 97 27 0 to 5 14.1 2.7 71.5 68.8 15.3 2.9 108 27
0 to 15 14.3 3.5 66.6 63.1 14.8 2.8 103 27
Spring 2003 0 to 2.5 38.3 22.0 63.0 41.0 14.5 5.9 38 6 0 to 5 36.7 27.0 56.0 29.0 11.0 4.5 30 6
0 to 15 40.3 23.7 76.0 52.3 21.5 8.8 53 6
Fall 2003 0 to 2.5 9.0 4.1 28.2 24.1 4.8 0.9 53 27 0 to 5 9.1 4.3 27.3 22.9 4.5 0.9 50 27
0 to 15 9.4 5.2 24.0 18.8 4.4 0.8 46 27
Spring 2004 0 to 2.5 41.8 15.0 79.6 64.6 29.0 11.8 69 6 0 to 5 39.3 19.2 70.9 51.7 22.1 9.0 56 6
0 to 15 39.9 20.2 65.8 45.6 17.6 7.2 44 6
Fall 2004 0 to 2.5 5.8 2.4 28.6 26.2 5.0 1.0 87 27 0 to 5 7.6 3.7 48.9 45.2 8.5 1.6 113 27
0 to 15 11.5 5.1 49.2 44.1 9.2 1.8 80 27
Spring 2005 0 to 2.5 34.0 10.0 85.0 75.0 27.6 11.3 81 6 0 to 5 31.6 12.0 72.0 60.0 21.9 8.9 69 6
0 to 15 49.3 22.0 89.3 67.3 24.9 10.2 50 6 z SD = standard deviation; SE = standard error; CV = coefficient of variation; N = number of observations.
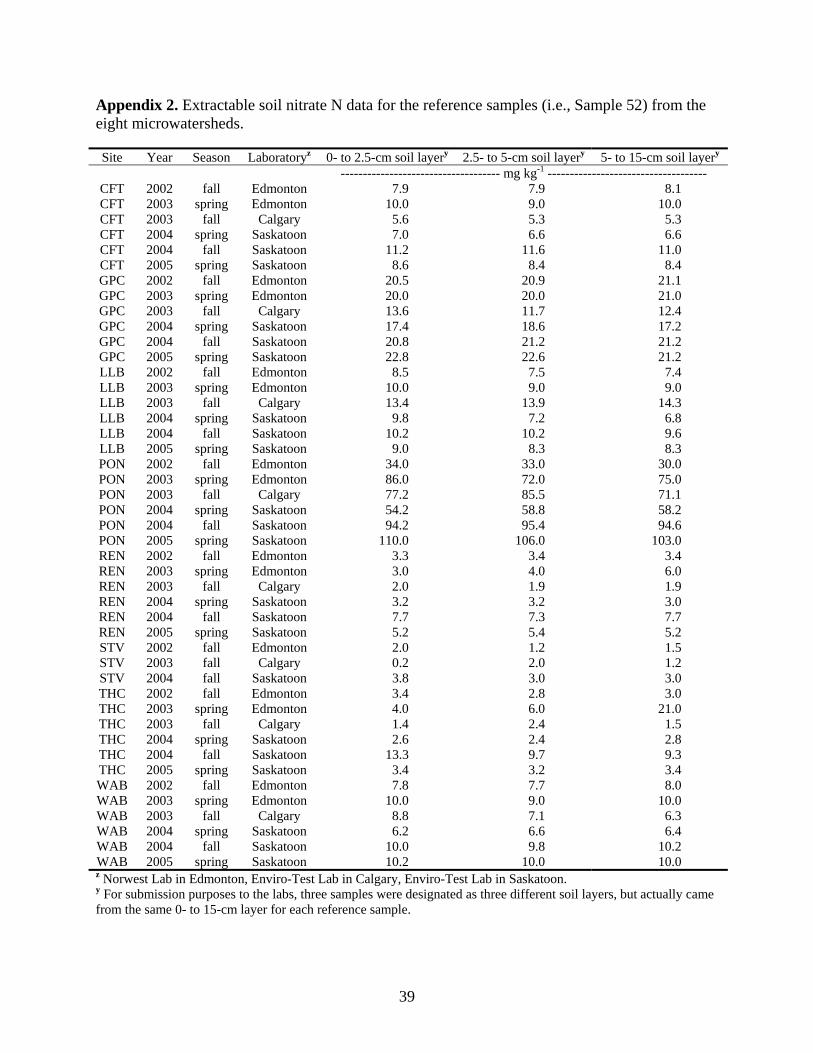
39
Appendix 2. Extractable soil nitrate N data for the reference samples (i.e., Sample 52) from the eight microwatersheds. Site Year Season Laboratoryz 0- to 2.5-cm soil layery 2.5- to 5-cm soil layery 5- to 15-cm soil layery
------------------------------------ mg kg-1 ------------------------------------ CFT 2002 fall Edmonton 7.9 7.9 8.1 CFT 2003 spring Edmonton 10.0 9.0 10.0 CFT 2003 fall Calgary 5.6 5.3 5.3 CFT 2004 spring Saskatoon 7.0 6.6 6.6 CFT 2004 fall Saskatoon 11.2 11.6 11.0 CFT 2005 spring Saskatoon 8.6 8.4 8.4 GPC 2002 fall Edmonton 20.5 20.9 21.1 GPC 2003 spring Edmonton 20.0 20.0 21.0 GPC 2003 fall Calgary 13.6 11.7 12.4 GPC 2004 spring Saskatoon 17.4 18.6 17.2 GPC 2004 fall Saskatoon 20.8 21.2 21.2 GPC 2005 spring Saskatoon 22.8 22.6 21.2 LLB 2002 fall Edmonton 8.5 7.5 7.4 LLB 2003 spring Edmonton 10.0 9.0 9.0 LLB 2003 fall Calgary 13.4 13.9 14.3 LLB 2004 spring Saskatoon 9.8 7.2 6.8 LLB 2004 fall Saskatoon 10.2 10.2 9.6 LLB 2005 spring Saskatoon 9.0 8.3 8.3 PON 2002 fall Edmonton 34.0 33.0 30.0 PON 2003 spring Edmonton 86.0 72.0 75.0 PON 2003 fall Calgary 77.2 85.5 71.1 PON 2004 spring Saskatoon 54.2 58.8 58.2 PON 2004 fall Saskatoon 94.2 95.4 94.6 PON 2005 spring Saskatoon 110.0 106.0 103.0 REN 2002 fall Edmonton 3.3 3.4 3.4 REN 2003 spring Edmonton 3.0 4.0 6.0 REN 2003 fall Calgary 2.0 1.9 1.9 REN 2004 spring Saskatoon 3.2 3.2 3.0 REN 2004 fall Saskatoon 7.7 7.3 7.7 REN 2005 spring Saskatoon 5.2 5.4 5.2 STV 2002 fall Edmonton 2.0 1.2 1.5 STV 2003 fall Calgary 0.2 2.0 1.2 STV 2004 fall Saskatoon 3.8 3.0 3.0 THC 2002 fall Edmonton 3.4 2.8 3.0 THC 2003 spring Edmonton 4.0 6.0 21.0 THC 2003 fall Calgary 1.4 2.4 1.5 THC 2004 spring Saskatoon 2.6 2.4 2.8 THC 2004 fall Saskatoon 13.3 9.7 9.3 THC 2005 spring Saskatoon 3.4 3.2 3.4 WAB 2002 fall Edmonton 7.8 7.7 8.0 WAB 2003 spring Edmonton 10.0 9.0 10.0 WAB 2003 fall Calgary 8.8 7.1 6.3 WAB 2004 spring Saskatoon 6.2 6.6 6.4 WAB 2004 fall Saskatoon 10.0 9.8 10.2 WAB 2005 spring Saskatoon 10.2 10.0 10.0 z Norwest Lab in Edmonton, Enviro-Test Lab in Calgary, Enviro-Test Lab in Saskatoon. y For submission purposes to the labs, three samples were designated as three different soil layers, but actually came from the same 0- to 15-cm layer for each reference sample.
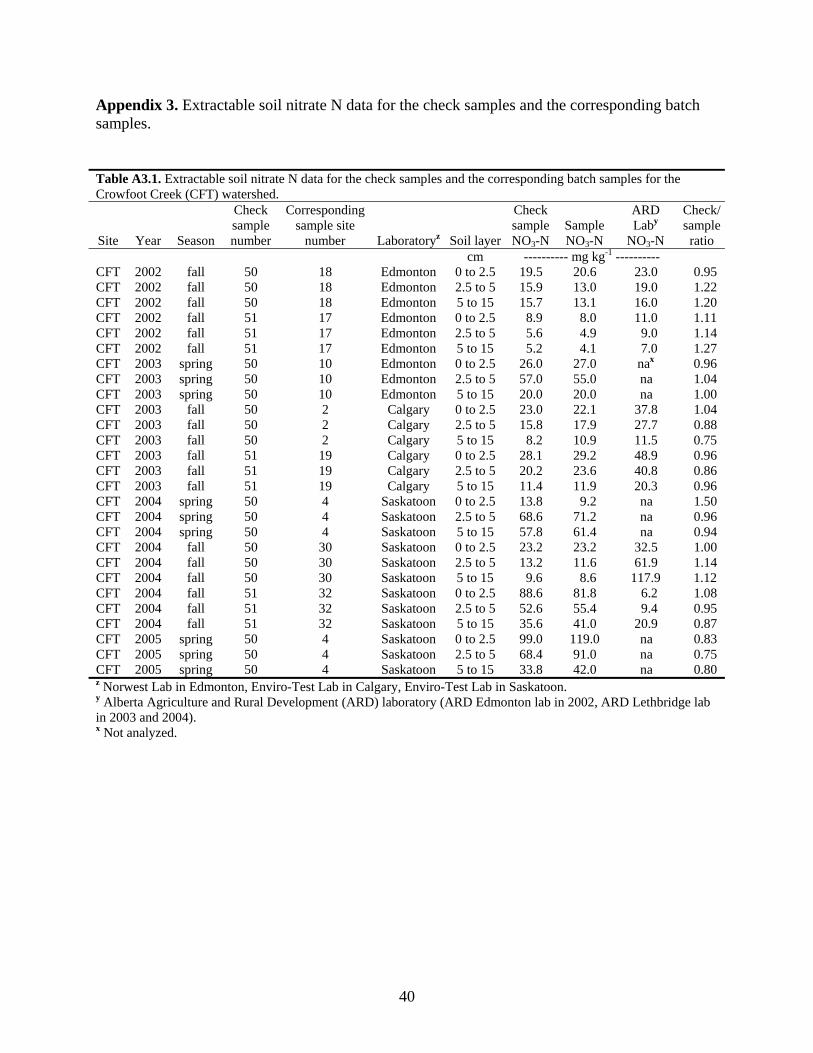
40
Appendix 3. Extractable soil nitrate N data for the check samples and the corresponding batch samples. Table A3.1. Extractable soil nitrate N data for the check samples and the corresponding batch samples for the Crowfoot Creek (CFT) watershed.
Site Year Season
Check sample number
Corresponding sample site
number Laboratoryz Soil layer
Check sample NO3-N
Sample NO3-N
ARD Laby
NO3-N
Check/sample ratio
cm ---------- mg kg-1 ---------- CFT 2002 fall 50 18 Edmonton 0 to 2.5 19.5 20.6 23.0 0.95 CFT 2002 fall 50 18 Edmonton 2.5 to 5 15.9 13.0 19.0 1.22 CFT 2002 fall 50 18 Edmonton 5 to 15 15.7 13.1 16.0 1.20 CFT 2002 fall 51 17 Edmonton 0 to 2.5 8.9 8.0 11.0 1.11 CFT 2002 fall 51 17 Edmonton 2.5 to 5 5.6 4.9 9.0 1.14 CFT 2002 fall 51 17 Edmonton 5 to 15 5.2 4.1 7.0 1.27 CFT 2003 spring 50 10 Edmonton 0 to 2.5 26.0 27.0 nax 0.96 CFT 2003 spring 50 10 Edmonton 2.5 to 5 57.0 55.0 na 1.04 CFT 2003 spring 50 10 Edmonton 5 to 15 20.0 20.0 na 1.00 CFT 2003 fall 50 2 Calgary 0 to 2.5 23.0 22.1 37.8 1.04 CFT 2003 fall 50 2 Calgary 2.5 to 5 15.8 17.9 27.7 0.88 CFT 2003 fall 50 2 Calgary 5 to 15 8.2 10.9 11.5 0.75 CFT 2003 fall 51 19 Calgary 0 to 2.5 28.1 29.2 48.9 0.96 CFT 2003 fall 51 19 Calgary 2.5 to 5 20.2 23.6 40.8 0.86 CFT 2003 fall 51 19 Calgary 5 to 15 11.4 11.9 20.3 0.96 CFT 2004 spring 50 4 Saskatoon 0 to 2.5 13.8 9.2 na 1.50 CFT 2004 spring 50 4 Saskatoon 2.5 to 5 68.6 71.2 na 0.96 CFT 2004 spring 50 4 Saskatoon 5 to 15 57.8 61.4 na 0.94 CFT 2004 fall 50 30 Saskatoon 0 to 2.5 23.2 23.2 32.5 1.00 CFT 2004 fall 50 30 Saskatoon 2.5 to 5 13.2 11.6 61.9 1.14 CFT 2004 fall 50 30 Saskatoon 5 to 15 9.6 8.6 117.9 1.12 CFT 2004 fall 51 32 Saskatoon 0 to 2.5 88.6 81.8 6.2 1.08 CFT 2004 fall 51 32 Saskatoon 2.5 to 5 52.6 55.4 9.4 0.95 CFT 2004 fall 51 32 Saskatoon 5 to 15 35.6 41.0 20.9 0.87 CFT 2005 spring 50 4 Saskatoon 0 to 2.5 99.0 119.0 na 0.83 CFT 2005 spring 50 4 Saskatoon 2.5 to 5 68.4 91.0 na 0.75 CFT 2005 spring 50 4 Saskatoon 5 to 15 33.8 42.0 na 0.80 z Norwest Lab in Edmonton, Enviro-Test Lab in Calgary, Enviro-Test Lab in Saskatoon. y Alberta Agriculture and Rural Development (ARD) laboratory (ARD Edmonton lab in 2002, ARD Lethbridge lab in 2003 and 2004). x Not analyzed.
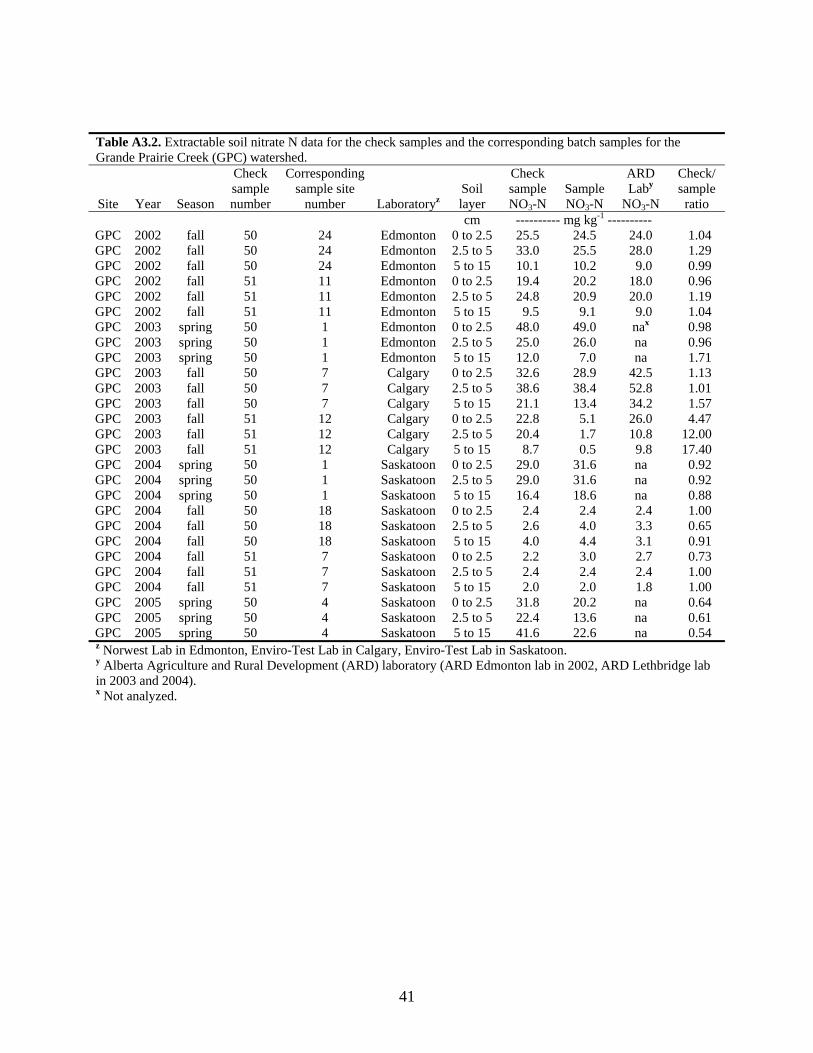
41
Table A3.2. Extractable soil nitrate N data for the check samples and the corresponding batch samples for the Grande Prairie Creek (GPC) watershed.
Site Year Season
Check sample number
Corresponding sample site
number Laboratoryz Soil layer
Check sample NO3-N
Sample NO3-N
ARD Laby
NO3-N
Check/ sample ratio
cm ---------- mg kg-1 ---------- GPC 2002 fall 50 24 Edmonton 0 to 2.5 25.5 24.5 24.0 1.04 GPC 2002 fall 50 24 Edmonton 2.5 to 5 33.0 25.5 28.0 1.29 GPC 2002 fall 50 24 Edmonton 5 to 15 10.1 10.2 9.0 0.99 GPC 2002 fall 51 11 Edmonton 0 to 2.5 19.4 20.2 18.0 0.96 GPC 2002 fall 51 11 Edmonton 2.5 to 5 24.8 20.9 20.0 1.19 GPC 2002 fall 51 11 Edmonton 5 to 15 9.5 9.1 9.0 1.04 GPC 2003 spring 50 1 Edmonton 0 to 2.5 48.0 49.0 nax 0.98 GPC 2003 spring 50 1 Edmonton 2.5 to 5 25.0 26.0 na 0.96 GPC 2003 spring 50 1 Edmonton 5 to 15 12.0 7.0 na 1.71 GPC 2003 fall 50 7 Calgary 0 to 2.5 32.6 28.9 42.5 1.13 GPC 2003 fall 50 7 Calgary 2.5 to 5 38.6 38.4 52.8 1.01 GPC 2003 fall 50 7 Calgary 5 to 15 21.1 13.4 34.2 1.57 GPC 2003 fall 51 12 Calgary 0 to 2.5 22.8 5.1 26.0 4.47 GPC 2003 fall 51 12 Calgary 2.5 to 5 20.4 1.7 10.8 12.00 GPC 2003 fall 51 12 Calgary 5 to 15 8.7 0.5 9.8 17.40 GPC 2004 spring 50 1 Saskatoon 0 to 2.5 29.0 31.6 na 0.92 GPC 2004 spring 50 1 Saskatoon 2.5 to 5 29.0 31.6 na 0.92 GPC 2004 spring 50 1 Saskatoon 5 to 15 16.4 18.6 na 0.88 GPC 2004 fall 50 18 Saskatoon 0 to 2.5 2.4 2.4 2.4 1.00 GPC 2004 fall 50 18 Saskatoon 2.5 to 5 2.6 4.0 3.3 0.65 GPC 2004 fall 50 18 Saskatoon 5 to 15 4.0 4.4 3.1 0.91 GPC 2004 fall 51 7 Saskatoon 0 to 2.5 2.2 3.0 2.7 0.73 GPC 2004 fall 51 7 Saskatoon 2.5 to 5 2.4 2.4 2.4 1.00 GPC 2004 fall 51 7 Saskatoon 5 to 15 2.0 2.0 1.8 1.00 GPC 2005 spring 50 4 Saskatoon 0 to 2.5 31.8 20.2 na 0.64 GPC 2005 spring 50 4 Saskatoon 2.5 to 5 22.4 13.6 na 0.61 GPC 2005 spring 50 4 Saskatoon 5 to 15 41.6 22.6 na 0.54 z Norwest Lab in Edmonton, Enviro-Test Lab in Calgary, Enviro-Test Lab in Saskatoon. y Alberta Agriculture and Rural Development (ARD) laboratory (ARD Edmonton lab in 2002, ARD Lethbridge lab in 2003 and 2004). x Not analyzed.
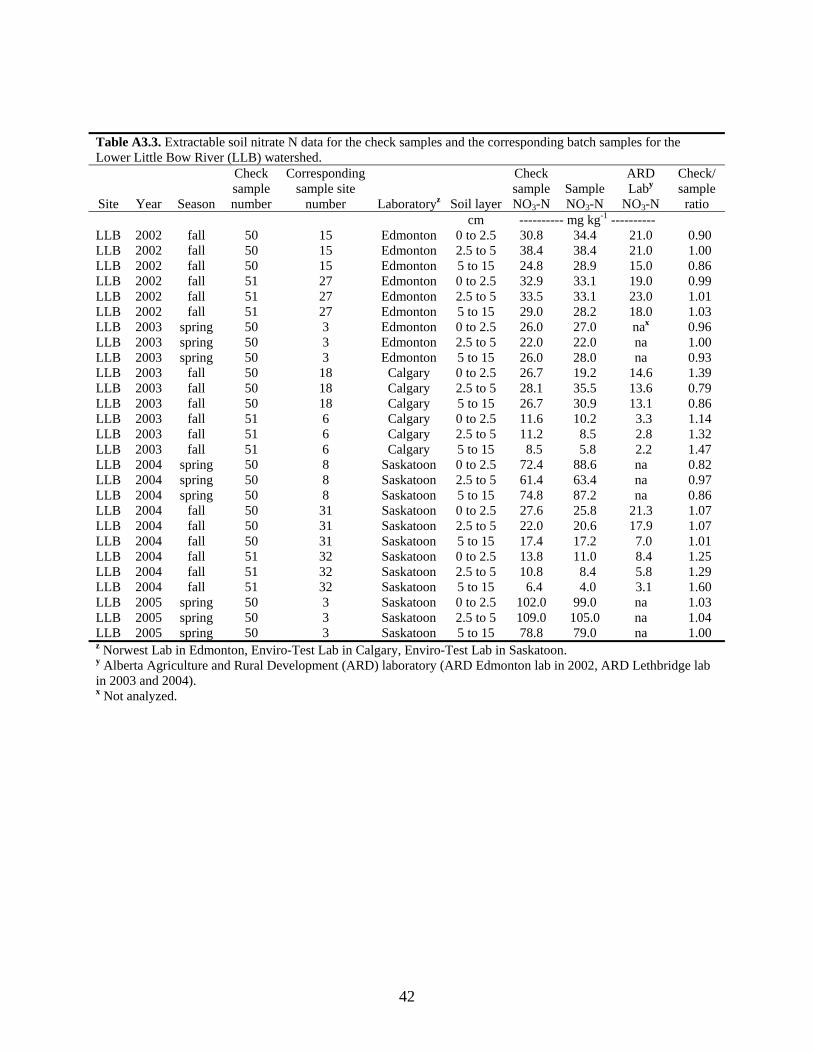
42
Table A3.3. Extractable soil nitrate N data for the check samples and the corresponding batch samples for the Lower Little Bow River (LLB) watershed.
Site Year Season
Check sample number
Corresponding sample site
number Laboratoryz Soil layer
Check sample NO3-N
Sample NO3-N
ARD Laby
NO3-N
Check/ sample ratio
cm ---------- mg kg-1 ---------- LLB 2002 fall 50 15 Edmonton 0 to 2.5 30.8 34.4 21.0 0.90 LLB 2002 fall 50 15 Edmonton 2.5 to 5 38.4 38.4 21.0 1.00 LLB 2002 fall 50 15 Edmonton 5 to 15 24.8 28.9 15.0 0.86 LLB 2002 fall 51 27 Edmonton 0 to 2.5 32.9 33.1 19.0 0.99 LLB 2002 fall 51 27 Edmonton 2.5 to 5 33.5 33.1 23.0 1.01 LLB 2002 fall 51 27 Edmonton 5 to 15 29.0 28.2 18.0 1.03 LLB 2003 spring 50 3 Edmonton 0 to 2.5 26.0 27.0 nax 0.96 LLB 2003 spring 50 3 Edmonton 2.5 to 5 22.0 22.0 na 1.00 LLB 2003 spring 50 3 Edmonton 5 to 15 26.0 28.0 na 0.93 LLB 2003 fall 50 18 Calgary 0 to 2.5 26.7 19.2 14.6 1.39 LLB 2003 fall 50 18 Calgary 2.5 to 5 28.1 35.5 13.6 0.79 LLB 2003 fall 50 18 Calgary 5 to 15 26.7 30.9 13.1 0.86 LLB 2003 fall 51 6 Calgary 0 to 2.5 11.6 10.2 3.3 1.14 LLB 2003 fall 51 6 Calgary 2.5 to 5 11.2 8.5 2.8 1.32 LLB 2003 fall 51 6 Calgary 5 to 15 8.5 5.8 2.2 1.47 LLB 2004 spring 50 8 Saskatoon 0 to 2.5 72.4 88.6 na 0.82 LLB 2004 spring 50 8 Saskatoon 2.5 to 5 61.4 63.4 na 0.97 LLB 2004 spring 50 8 Saskatoon 5 to 15 74.8 87.2 na 0.86 LLB 2004 fall 50 31 Saskatoon 0 to 2.5 27.6 25.8 21.3 1.07 LLB 2004 fall 50 31 Saskatoon 2.5 to 5 22.0 20.6 17.9 1.07 LLB 2004 fall 50 31 Saskatoon 5 to 15 17.4 17.2 7.0 1.01 LLB 2004 fall 51 32 Saskatoon 0 to 2.5 13.8 11.0 8.4 1.25 LLB 2004 fall 51 32 Saskatoon 2.5 to 5 10.8 8.4 5.8 1.29 LLB 2004 fall 51 32 Saskatoon 5 to 15 6.4 4.0 3.1 1.60 LLB 2005 spring 50 3 Saskatoon 0 to 2.5 102.0 99.0 na 1.03 LLB 2005 spring 50 3 Saskatoon 2.5 to 5 109.0 105.0 na 1.04 LLB 2005 spring 50 3 Saskatoon 5 to 15 78.8 79.0 na 1.00 z Norwest Lab in Edmonton, Enviro-Test Lab in Calgary, Enviro-Test Lab in Saskatoon. y Alberta Agriculture and Rural Development (ARD) laboratory (ARD Edmonton lab in 2002, ARD Lethbridge lab in 2003 and 2004). x Not analyzed.
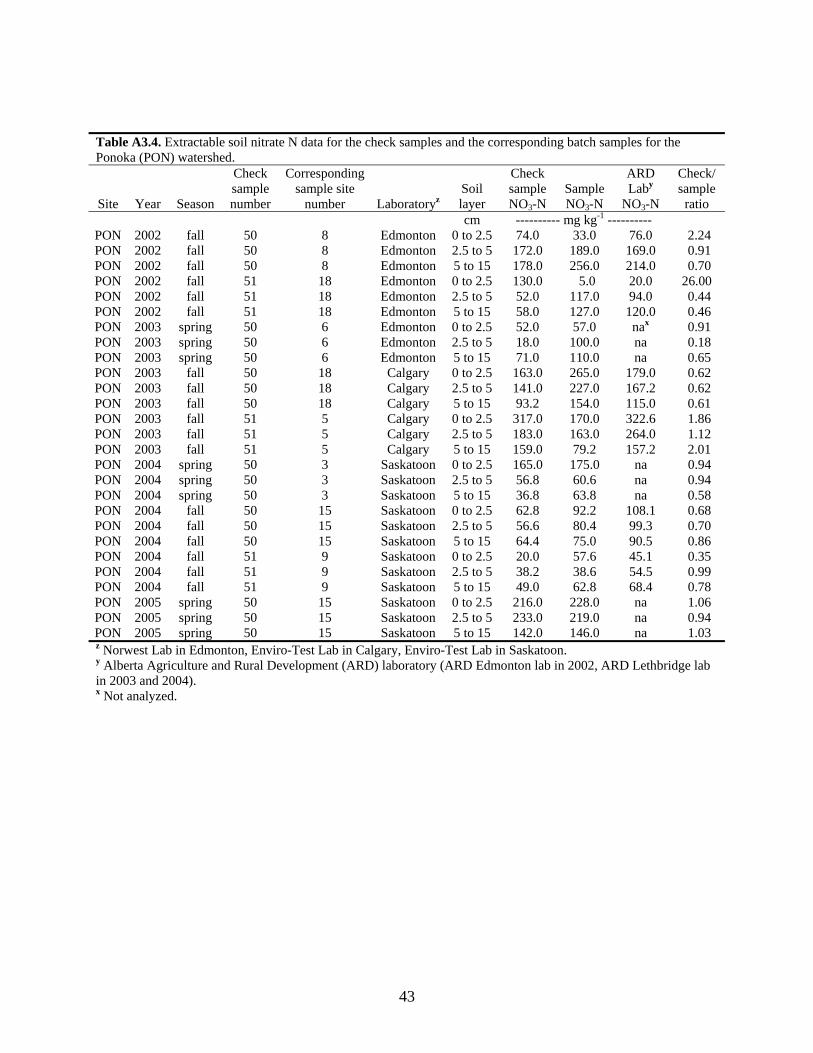
43
Table A3.4. Extractable soil nitrate N data for the check samples and the corresponding batch samples for the Ponoka (PON) watershed.
Site Year Season
Check sample number
Corresponding sample site
number Laboratoryz Soil layer
Check sample NO3-N
Sample NO3-N
ARD Laby
NO3-N
Check/ sample ratio
cm ---------- mg kg-1 ---------- PON 2002 fall 50 8 Edmonton 0 to 2.5 74.0 33.0 76.0 2.24 PON 2002 fall 50 8 Edmonton 2.5 to 5 172.0 189.0 169.0 0.91 PON 2002 fall 50 8 Edmonton 5 to 15 178.0 256.0 214.0 0.70 PON 2002 fall 51 18 Edmonton 0 to 2.5 130.0 5.0 20.0 26.00 PON 2002 fall 51 18 Edmonton 2.5 to 5 52.0 117.0 94.0 0.44 PON 2002 fall 51 18 Edmonton 5 to 15 58.0 127.0 120.0 0.46 PON 2003 spring 50 6 Edmonton 0 to 2.5 52.0 57.0 nax 0.91 PON 2003 spring 50 6 Edmonton 2.5 to 5 18.0 100.0 na 0.18 PON 2003 spring 50 6 Edmonton 5 to 15 71.0 110.0 na 0.65 PON 2003 fall 50 18 Calgary 0 to 2.5 163.0 265.0 179.0 0.62 PON 2003 fall 50 18 Calgary 2.5 to 5 141.0 227.0 167.2 0.62 PON 2003 fall 50 18 Calgary 5 to 15 93.2 154.0 115.0 0.61 PON 2003 fall 51 5 Calgary 0 to 2.5 317.0 170.0 322.6 1.86 PON 2003 fall 51 5 Calgary 2.5 to 5 183.0 163.0 264.0 1.12 PON 2003 fall 51 5 Calgary 5 to 15 159.0 79.2 157.2 2.01 PON 2004 spring 50 3 Saskatoon 0 to 2.5 165.0 175.0 na 0.94 PON 2004 spring 50 3 Saskatoon 2.5 to 5 56.8 60.6 na 0.94 PON 2004 spring 50 3 Saskatoon 5 to 15 36.8 63.8 na 0.58 PON 2004 fall 50 15 Saskatoon 0 to 2.5 62.8 92.2 108.1 0.68 PON 2004 fall 50 15 Saskatoon 2.5 to 5 56.6 80.4 99.3 0.70 PON 2004 fall 50 15 Saskatoon 5 to 15 64.4 75.0 90.5 0.86 PON 2004 fall 51 9 Saskatoon 0 to 2.5 20.0 57.6 45.1 0.35 PON 2004 fall 51 9 Saskatoon 2.5 to 5 38.2 38.6 54.5 0.99 PON 2004 fall 51 9 Saskatoon 5 to 15 49.0 62.8 68.4 0.78 PON 2005 spring 50 15 Saskatoon 0 to 2.5 216.0 228.0 na 1.06 PON 2005 spring 50 15 Saskatoon 2.5 to 5 233.0 219.0 na 0.94 PON 2005 spring 50 15 Saskatoon 5 to 15 142.0 146.0 na 1.03 z Norwest Lab in Edmonton, Enviro-Test Lab in Calgary, Enviro-Test Lab in Saskatoon. y Alberta Agriculture and Rural Development (ARD) laboratory (ARD Edmonton lab in 2002, ARD Lethbridge lab in 2003 and 2004). x Not analyzed.
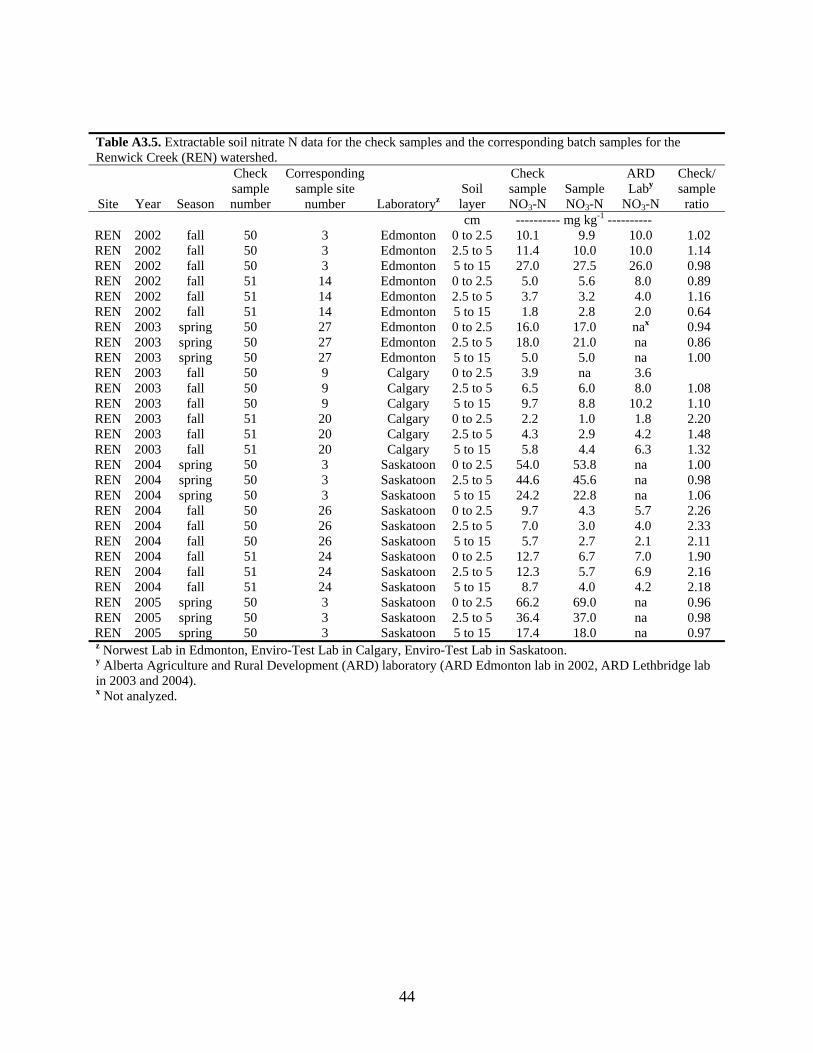
44
Table A3.5. Extractable soil nitrate N data for the check samples and the corresponding batch samples for the Renwick Creek (REN) watershed.
Site Year Season
Check sample number
Corresponding sample site
number Laboratoryz Soil layer
Check sample NO3-N
Sample NO3-N
ARD Laby
NO3-N
Check/ sample ratio
cm ---------- mg kg-1 ---------- REN 2002 fall 50 3 Edmonton 0 to 2.5 10.1 9.9 10.0 1.02 REN 2002 fall 50 3 Edmonton 2.5 to 5 11.4 10.0 10.0 1.14 REN 2002 fall 50 3 Edmonton 5 to 15 27.0 27.5 26.0 0.98 REN 2002 fall 51 14 Edmonton 0 to 2.5 5.0 5.6 8.0 0.89 REN 2002 fall 51 14 Edmonton 2.5 to 5 3.7 3.2 4.0 1.16 REN 2002 fall 51 14 Edmonton 5 to 15 1.8 2.8 2.0 0.64 REN 2003 spring 50 27 Edmonton 0 to 2.5 16.0 17.0 nax 0.94 REN 2003 spring 50 27 Edmonton 2.5 to 5 18.0 21.0 na 0.86 REN 2003 spring 50 27 Edmonton 5 to 15 5.0 5.0 na 1.00 REN 2003 fall 50 9 Calgary 0 to 2.5 3.9 na 3.6 REN 2003 fall 50 9 Calgary 2.5 to 5 6.5 6.0 8.0 1.08 REN 2003 fall 50 9 Calgary 5 to 15 9.7 8.8 10.2 1.10 REN 2003 fall 51 20 Calgary 0 to 2.5 2.2 1.0 1.8 2.20 REN 2003 fall 51 20 Calgary 2.5 to 5 4.3 2.9 4.2 1.48 REN 2003 fall 51 20 Calgary 5 to 15 5.8 4.4 6.3 1.32 REN 2004 spring 50 3 Saskatoon 0 to 2.5 54.0 53.8 na 1.00 REN 2004 spring 50 3 Saskatoon 2.5 to 5 44.6 45.6 na 0.98 REN 2004 spring 50 3 Saskatoon 5 to 15 24.2 22.8 na 1.06 REN 2004 fall 50 26 Saskatoon 0 to 2.5 9.7 4.3 5.7 2.26 REN 2004 fall 50 26 Saskatoon 2.5 to 5 7.0 3.0 4.0 2.33 REN 2004 fall 50 26 Saskatoon 5 to 15 5.7 2.7 2.1 2.11 REN 2004 fall 51 24 Saskatoon 0 to 2.5 12.7 6.7 7.0 1.90 REN 2004 fall 51 24 Saskatoon 2.5 to 5 12.3 5.7 6.9 2.16 REN 2004 fall 51 24 Saskatoon 5 to 15 8.7 4.0 4.2 2.18 REN 2005 spring 50 3 Saskatoon 0 to 2.5 66.2 69.0 na 0.96 REN 2005 spring 50 3 Saskatoon 2.5 to 5 36.4 37.0 na 0.98 REN 2005 spring 50 3 Saskatoon 5 to 15 17.4 18.0 na 0.97 z Norwest Lab in Edmonton, Enviro-Test Lab in Calgary, Enviro-Test Lab in Saskatoon. y Alberta Agriculture and Rural Development (ARD) laboratory (ARD Edmonton lab in 2002, ARD Lethbridge lab in 2003 and 2004). x Not analyzed.
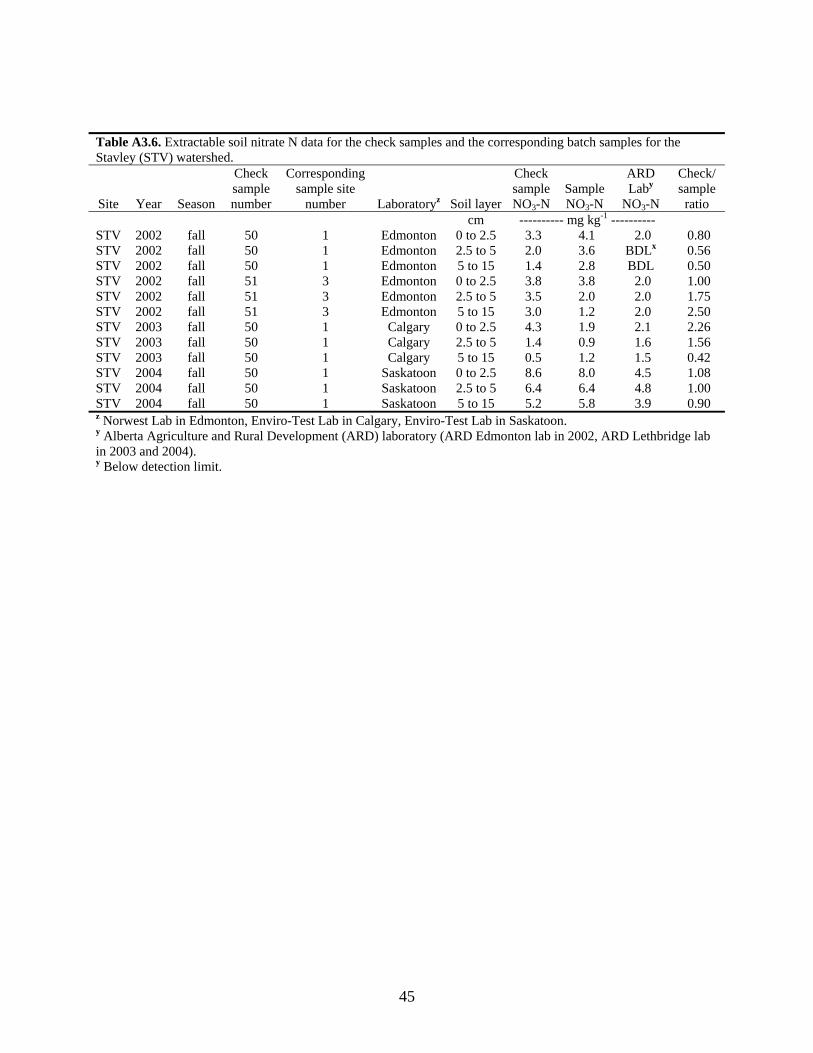
45
Table A3.6. Extractable soil nitrate N data for the check samples and the corresponding batch samples for the Stavley (STV) watershed.
Site Year Season
Check sample number
Corresponding sample site
number Laboratoryz Soil layer
Check sample NO3-N
Sample NO3-N
ARD Laby
NO3-N
Check/ sample ratio
cm ---------- mg kg-1 ---------- STV 2002 fall 50 1 Edmonton 0 to 2.5 3.3 4.1 2.0 0.80 STV 2002 fall 50 1 Edmonton 2.5 to 5 2.0 3.6 BDLx 0.56 STV 2002 fall 50 1 Edmonton 5 to 15 1.4 2.8 BDL 0.50 STV 2002 fall 51 3 Edmonton 0 to 2.5 3.8 3.8 2.0 1.00 STV 2002 fall 51 3 Edmonton 2.5 to 5 3.5 2.0 2.0 1.75 STV 2002 fall 51 3 Edmonton 5 to 15 3.0 1.2 2.0 2.50 STV 2003 fall 50 1 Calgary 0 to 2.5 4.3 1.9 2.1 2.26 STV 2003 fall 50 1 Calgary 2.5 to 5 1.4 0.9 1.6 1.56 STV 2003 fall 50 1 Calgary 5 to 15 0.5 1.2 1.5 0.42 STV 2004 fall 50 1 Saskatoon 0 to 2.5 8.6 8.0 4.5 1.08 STV 2004 fall 50 1 Saskatoon 2.5 to 5 6.4 6.4 4.8 1.00 STV 2004 fall 50 1 Saskatoon 5 to 15 5.2 5.8 3.9 0.90 z Norwest Lab in Edmonton, Enviro-Test Lab in Calgary, Enviro-Test Lab in Saskatoon. y Alberta Agriculture and Rural Development (ARD) laboratory (ARD Edmonton lab in 2002, ARD Lethbridge lab in 2003 and 2004). y Below detection limit.
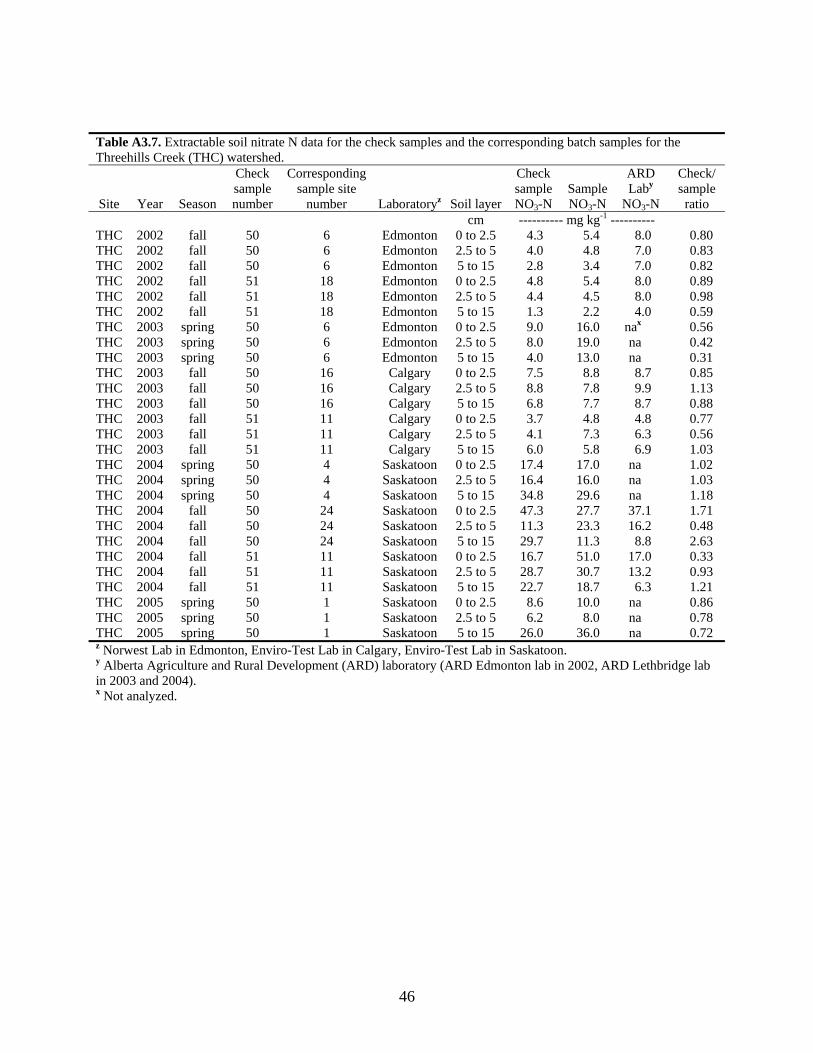
46
Table A3.7. Extractable soil nitrate N data for the check samples and the corresponding batch samples for the Threehills Creek (THC) watershed.
Site Year Season
Check sample number
Corresponding sample site
number Laboratoryz Soil layer
Check sample NO3-N
Sample NO3-N
ARD Laby
NO3-N
Check/ sample ratio
cm ---------- mg kg-1 ---------- THC 2002 fall 50 6 Edmonton 0 to 2.5 4.3 5.4 8.0 0.80 THC 2002 fall 50 6 Edmonton 2.5 to 5 4.0 4.8 7.0 0.83 THC 2002 fall 50 6 Edmonton 5 to 15 2.8 3.4 7.0 0.82 THC 2002 fall 51 18 Edmonton 0 to 2.5 4.8 5.4 8.0 0.89 THC 2002 fall 51 18 Edmonton 2.5 to 5 4.4 4.5 8.0 0.98 THC 2002 fall 51 18 Edmonton 5 to 15 1.3 2.2 4.0 0.59 THC 2003 spring 50 6 Edmonton 0 to 2.5 9.0 16.0 nax 0.56 THC 2003 spring 50 6 Edmonton 2.5 to 5 8.0 19.0 na 0.42 THC 2003 spring 50 6 Edmonton 5 to 15 4.0 13.0 na 0.31 THC 2003 fall 50 16 Calgary 0 to 2.5 7.5 8.8 8.7 0.85 THC 2003 fall 50 16 Calgary 2.5 to 5 8.8 7.8 9.9 1.13 THC 2003 fall 50 16 Calgary 5 to 15 6.8 7.7 8.7 0.88 THC 2003 fall 51 11 Calgary 0 to 2.5 3.7 4.8 4.8 0.77 THC 2003 fall 51 11 Calgary 2.5 to 5 4.1 7.3 6.3 0.56 THC 2003 fall 51 11 Calgary 5 to 15 6.0 5.8 6.9 1.03 THC 2004 spring 50 4 Saskatoon 0 to 2.5 17.4 17.0 na 1.02 THC 2004 spring 50 4 Saskatoon 2.5 to 5 16.4 16.0 na 1.03 THC 2004 spring 50 4 Saskatoon 5 to 15 34.8 29.6 na 1.18 THC 2004 fall 50 24 Saskatoon 0 to 2.5 47.3 27.7 37.1 1.71 THC 2004 fall 50 24 Saskatoon 2.5 to 5 11.3 23.3 16.2 0.48 THC 2004 fall 50 24 Saskatoon 5 to 15 29.7 11.3 8.8 2.63 THC 2004 fall 51 11 Saskatoon 0 to 2.5 16.7 51.0 17.0 0.33 THC 2004 fall 51 11 Saskatoon 2.5 to 5 28.7 30.7 13.2 0.93 THC 2004 fall 51 11 Saskatoon 5 to 15 22.7 18.7 6.3 1.21 THC 2005 spring 50 1 Saskatoon 0 to 2.5 8.6 10.0 na 0.86 THC 2005 spring 50 1 Saskatoon 2.5 to 5 6.2 8.0 na 0.78 THC 2005 spring 50 1 Saskatoon 5 to 15 26.0 36.0 na 0.72 z Norwest Lab in Edmonton, Enviro-Test Lab in Calgary, Enviro-Test Lab in Saskatoon. y Alberta Agriculture and Rural Development (ARD) laboratory (ARD Edmonton lab in 2002, ARD Lethbridge lab in 2003 and 2004). x Not analyzed.
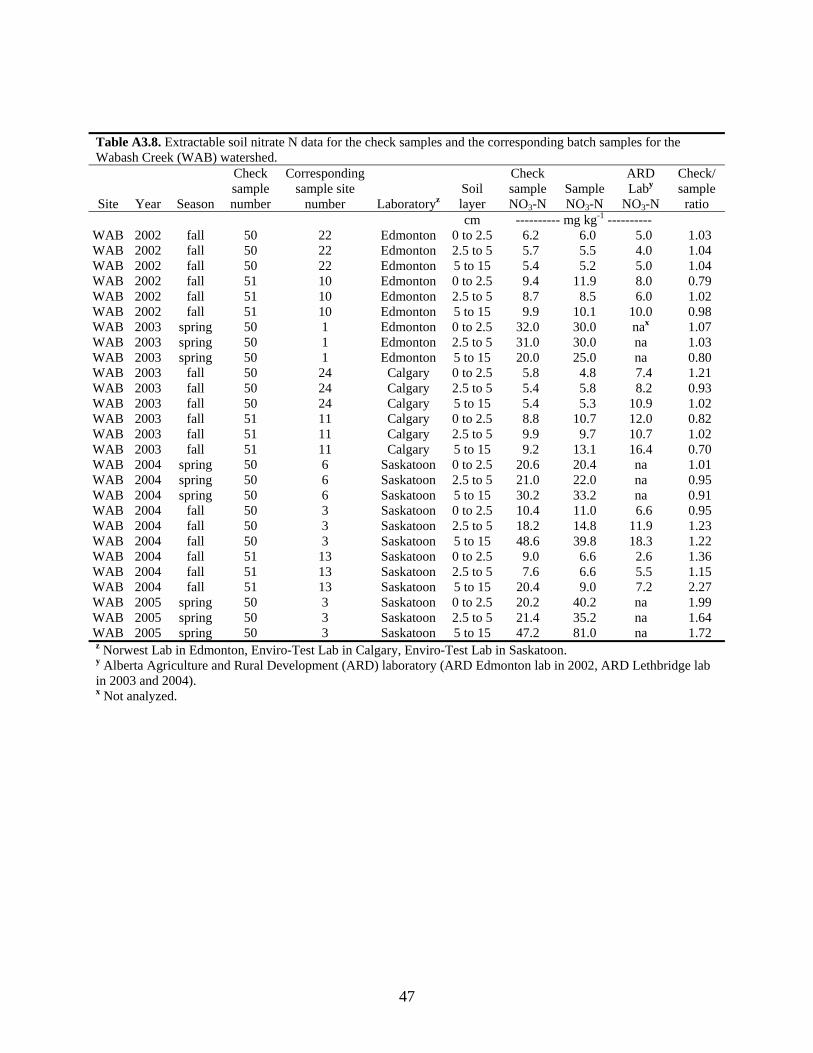
47
Table A3.8. Extractable soil nitrate N data for the check samples and the corresponding batch samples for the Wabash Creek (WAB) watershed.
Site Year Season
Check sample number
Corresponding sample site
number Laboratoryz Soil layer
Check sample NO3-N
Sample NO3-N
ARD Laby
NO3-N
Check/ sample ratio
cm ---------- mg kg-1 ---------- WAB 2002 fall 50 22 Edmonton 0 to 2.5 6.2 6.0 5.0 1.03 WAB 2002 fall 50 22 Edmonton 2.5 to 5 5.7 5.5 4.0 1.04 WAB 2002 fall 50 22 Edmonton 5 to 15 5.4 5.2 5.0 1.04 WAB 2002 fall 51 10 Edmonton 0 to 2.5 9.4 11.9 8.0 0.79 WAB 2002 fall 51 10 Edmonton 2.5 to 5 8.7 8.5 6.0 1.02 WAB 2002 fall 51 10 Edmonton 5 to 15 9.9 10.1 10.0 0.98 WAB 2003 spring 50 1 Edmonton 0 to 2.5 32.0 30.0 nax 1.07 WAB 2003 spring 50 1 Edmonton 2.5 to 5 31.0 30.0 na 1.03 WAB 2003 spring 50 1 Edmonton 5 to 15 20.0 25.0 na 0.80 WAB 2003 fall 50 24 Calgary 0 to 2.5 5.8 4.8 7.4 1.21 WAB 2003 fall 50 24 Calgary 2.5 to 5 5.4 5.8 8.2 0.93 WAB 2003 fall 50 24 Calgary 5 to 15 5.4 5.3 10.9 1.02 WAB 2003 fall 51 11 Calgary 0 to 2.5 8.8 10.7 12.0 0.82 WAB 2003 fall 51 11 Calgary 2.5 to 5 9.9 9.7 10.7 1.02 WAB 2003 fall 51 11 Calgary 5 to 15 9.2 13.1 16.4 0.70 WAB 2004 spring 50 6 Saskatoon 0 to 2.5 20.6 20.4 na 1.01 WAB 2004 spring 50 6 Saskatoon 2.5 to 5 21.0 22.0 na 0.95 WAB 2004 spring 50 6 Saskatoon 5 to 15 30.2 33.2 na 0.91 WAB 2004 fall 50 3 Saskatoon 0 to 2.5 10.4 11.0 6.6 0.95 WAB 2004 fall 50 3 Saskatoon 2.5 to 5 18.2 14.8 11.9 1.23 WAB 2004 fall 50 3 Saskatoon 5 to 15 48.6 39.8 18.3 1.22 WAB 2004 fall 51 13 Saskatoon 0 to 2.5 9.0 6.6 2.6 1.36 WAB 2004 fall 51 13 Saskatoon 2.5 to 5 7.6 6.6 5.5 1.15 WAB 2004 fall 51 13 Saskatoon 5 to 15 20.4 9.0 7.2 2.27 WAB 2005 spring 50 3 Saskatoon 0 to 2.5 20.2 40.2 na 1.99 WAB 2005 spring 50 3 Saskatoon 2.5 to 5 21.4 35.2 na 1.64 WAB 2005 spring 50 3 Saskatoon 5 to 15 47.2 81.0 na 1.72 z Norwest Lab in Edmonton, Enviro-Test Lab in Calgary, Enviro-Test Lab in Saskatoon. y Alberta Agriculture and Rural Development (ARD) laboratory (ARD Edmonton lab in 2002, ARD Lethbridge lab in 2003 and 2004). x Not analyzed.
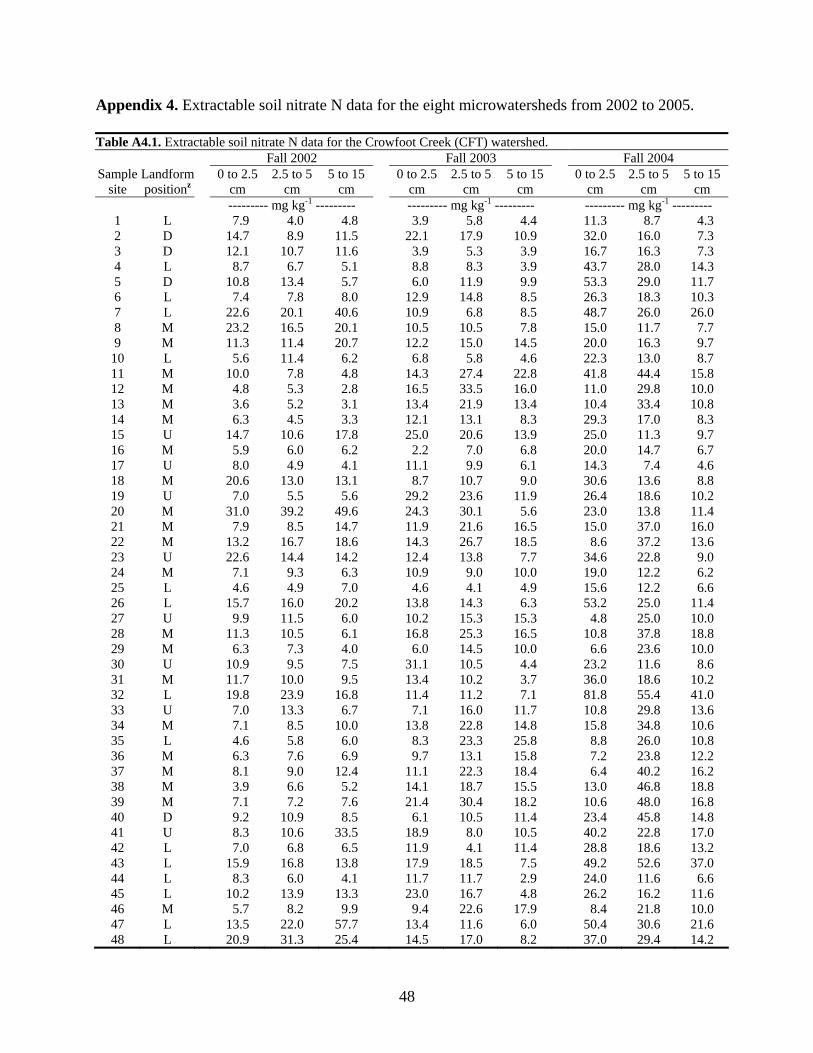
48
Appendix 4. Extractable soil nitrate N data for the eight microwatersheds from 2002 to 2005. Table A4.1. Extractable soil nitrate N data for the Crowfoot Creek (CFT) watershed.
Fall 2002 Fall 2003 Fall 2004 Sample
site Landform positionz
0 to 2.5 cm
2.5 to 5 cm
5 to 15 cm
0 to 2.5 cm
2.5 to 5 cm
5 to 15 cm
0 to 2.5 cm
2.5 to 5 cm
5 to 15 cm
--------- mg kg-1 --------- --------- mg kg-1 --------- --------- mg kg-1 --------- 1 L 7.9 4.0 4.8 3.9 5.8 4.4 11.3 8.7 4.3 2 D 14.7 8.9 11.5 22.1 17.9 10.9 32.0 16.0 7.3 3 D 12.1 10.7 11.6 3.9 5.3 3.9 16.7 16.3 7.3 4 L 8.7 6.7 5.1 8.8 8.3 3.9 43.7 28.0 14.3 5 D 10.8 13.4 5.7 6.0 11.9 9.9 53.3 29.0 11.7 6 L 7.4 7.8 8.0 12.9 14.8 8.5 26.3 18.3 10.3 7 L 22.6 20.1 40.6 10.9 6.8 8.5 48.7 26.0 26.0 8 M 23.2 16.5 20.1 10.5 10.5 7.8 15.0 11.7 7.7 9 M 11.3 11.4 20.7 12.2 15.0 14.5 20.0 16.3 9.7
10 L 5.6 11.4 6.2 6.8 5.8 4.6 22.3 13.0 8.7 11 M 10.0 7.8 4.8 14.3 27.4 22.8 41.8 44.4 15.8 12 M 4.8 5.3 2.8 16.5 33.5 16.0 11.0 29.8 10.0 13 M 3.6 5.2 3.1 13.4 21.9 13.4 10.4 33.4 10.8 14 M 6.3 4.5 3.3 12.1 13.1 8.3 29.3 17.0 8.3 15 U 14.7 10.6 17.8 25.0 20.6 13.9 25.0 11.3 9.7 16 M 5.9 6.0 6.2 2.2 7.0 6.8 20.0 14.7 6.7 17 U 8.0 4.9 4.1 11.1 9.9 6.1 14.3 7.4 4.6 18 M 20.6 13.0 13.1 8.7 10.7 9.0 30.6 13.6 8.8 19 U 7.0 5.5 5.6 29.2 23.6 11.9 26.4 18.6 10.2 20 M 31.0 39.2 49.6 24.3 30.1 5.6 23.0 13.8 11.4 21 M 7.9 8.5 14.7 11.9 21.6 16.5 15.0 37.0 16.0 22 M 13.2 16.7 18.6 14.3 26.7 18.5 8.6 37.2 13.6 23 U 22.6 14.4 14.2 12.4 13.8 7.7 34.6 22.8 9.0 24 M 7.1 9.3 6.3 10.9 9.0 10.0 19.0 12.2 6.2 25 L 4.6 4.9 7.0 4.6 4.1 4.9 15.6 12.2 6.6 26 L 15.7 16.0 20.2 13.8 14.3 6.3 53.2 25.0 11.4 27 U 9.9 11.5 6.0 10.2 15.3 15.3 4.8 25.0 10.0 28 M 11.3 10.5 6.1 16.8 25.3 16.5 10.8 37.8 18.8 29 M 6.3 7.3 4.0 6.0 14.5 10.0 6.6 23.6 10.0 30 U 10.9 9.5 7.5 31.1 10.5 4.4 23.2 11.6 8.6 31 M 11.7 10.0 9.5 13.4 10.2 3.7 36.0 18.6 10.2 32 L 19.8 23.9 16.8 11.4 11.2 7.1 81.8 55.4 41.0 33 U 7.0 13.3 6.7 7.1 16.0 11.7 10.8 29.8 13.6 34 M 7.1 8.5 10.0 13.8 22.8 14.8 15.8 34.8 10.6 35 L 4.6 5.8 6.0 8.3 23.3 25.8 8.8 26.0 10.8 36 M 6.3 7.6 6.9 9.7 13.1 15.8 7.2 23.8 12.2 37 M 8.1 9.0 12.4 11.1 22.3 18.4 6.4 40.2 16.2 38 M 3.9 6.6 5.2 14.1 18.7 15.5 13.0 46.8 18.8 39 M 7.1 7.2 7.6 21.4 30.4 18.2 10.6 48.0 16.8 40 D 9.2 10.9 8.5 6.1 10.5 11.4 23.4 45.8 14.8 41 U 8.3 10.6 33.5 18.9 8.0 10.5 40.2 22.8 17.0 42 L 7.0 6.8 6.5 11.9 4.1 11.4 28.8 18.6 13.2 43 L 15.9 16.8 13.8 17.9 18.5 7.5 49.2 52.6 37.0 44 L 8.3 6.0 4.1 11.7 11.7 2.9 24.0 11.6 6.6 45 L 10.2 13.9 13.3 23.0 16.7 4.8 26.2 16.2 11.6 46 M 5.7 8.2 9.9 9.4 22.6 17.9 8.4 21.8 10.0 47 L 13.5 22.0 57.7 13.4 11.6 6.0 50.4 30.6 21.6 48 L 20.9 31.3 25.4 14.5 17.0 8.2 37.0 29.4 14.2
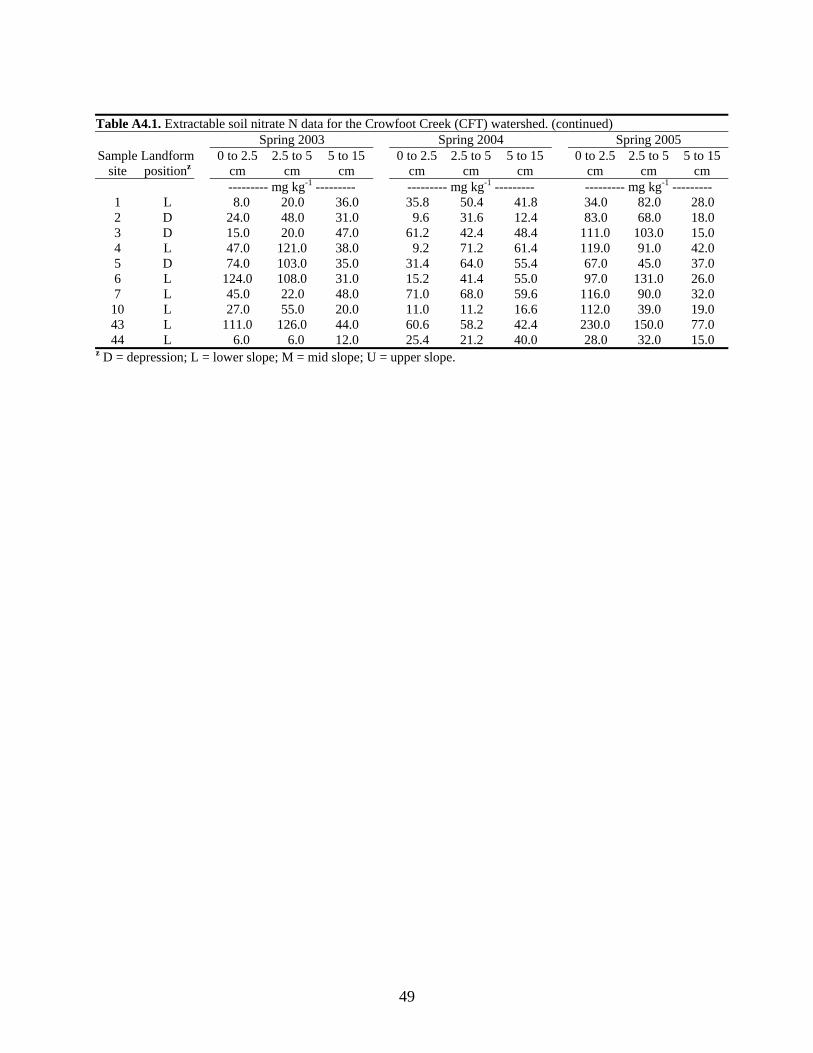
49
Table A4.1. Extractable soil nitrate N data for the Crowfoot Creek (CFT) watershed. (continued)
Spring 2003 Spring 2004 Spring 2005 Sample
site Landform positionz
0 to 2.5 cm
2.5 to 5 cm
5 to 15 cm
0 to 2.5 cm
2.5 to 5 cm
5 to 15 cm
0 to 2.5 cm
2.5 to 5 cm
5 to 15 cm
--------- mg kg-1 --------- --------- mg kg-1 --------- --------- mg kg-1 --------- 1 L 8.0 20.0 36.0 35.8 50.4 41.8 34.0 82.0 28.0 2 D 24.0 48.0 31.0 9.6 31.6 12.4 83.0 68.0 18.0 3 D 15.0 20.0 47.0 61.2 42.4 48.4 111.0 103.0 15.0 4 L 47.0 121.0 38.0 9.2 71.2 61.4 119.0 91.0 42.0 5 D 74.0 103.0 35.0 31.4 64.0 55.4 67.0 45.0 37.0 6 L 124.0 108.0 31.0 15.2 41.4 55.0 97.0 131.0 26.0 7 L 45.0 22.0 48.0 71.0 68.0 59.6 116.0 90.0 32.0
10 L 27.0 55.0 20.0 11.0 11.2 16.6 112.0 39.0 19.0 43 L 111.0 126.0 44.0 60.6 58.2 42.4 230.0 150.0 77.0 44 L 6.0 6.0 12.0 25.4 21.2 40.0 28.0 32.0 15.0
z D = depression; L = lower slope; M = mid slope; U = upper slope.
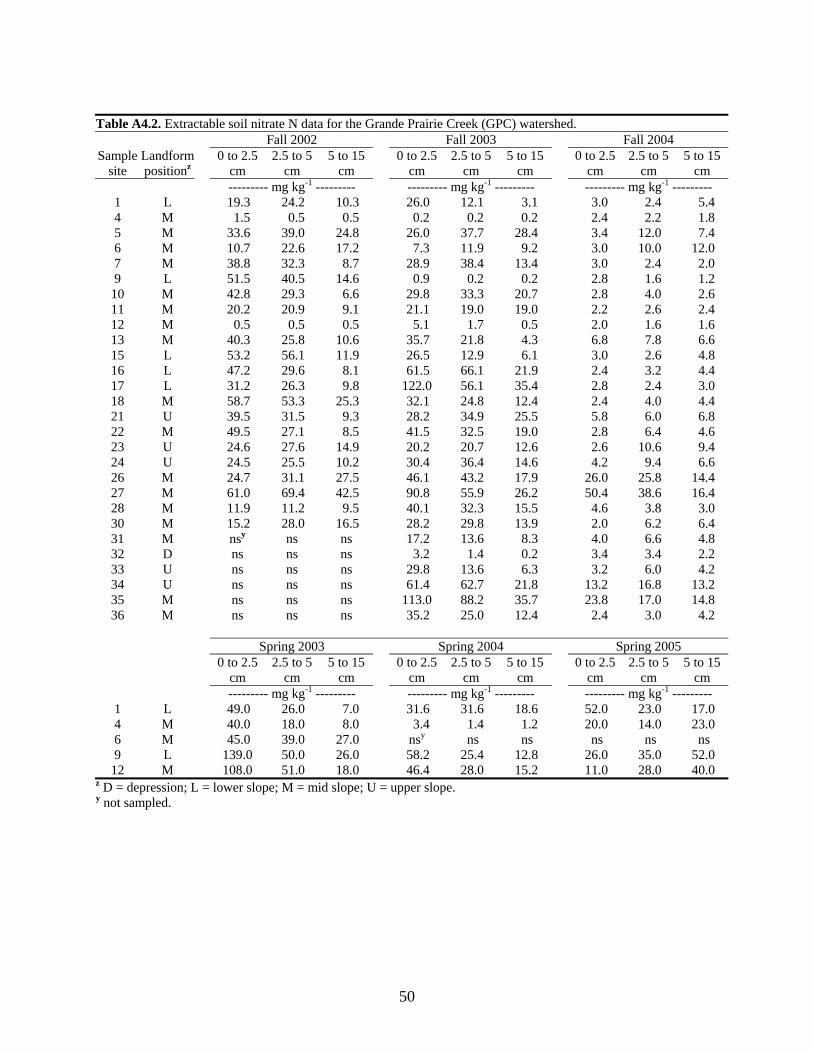
50
Table A4.2. Extractable soil nitrate N data for the Grande Prairie Creek (GPC) watershed.
Fall 2002 Fall 2003 Fall 2004 Sample
site Landform positionz
0 to 2.5 cm
2.5 to 5 cm
5 to 15 cm
0 to 2.5 cm
2.5 to 5 cm
5 to 15 cm
0 to 2.5 cm
2.5 to 5 cm
5 to 15 cm
--------- mg kg-1 --------- --------- mg kg-1 --------- --------- mg kg-1 --------- 1 L 19.3 24.2 10.3 26.0 12.1 3.1 3.0 2.4 5.4 4 M 1.5 0.5 0.5 0.2 0.2 0.2 2.4 2.2 1.8 5 M 33.6 39.0 24.8 26.0 37.7 28.4 3.4 12.0 7.4 6 M 10.7 22.6 17.2 7.3 11.9 9.2 3.0 10.0 12.0 7 M 38.8 32.3 8.7 28.9 38.4 13.4 3.0 2.4 2.0 9 L 51.5 40.5 14.6 0.9 0.2 0.2 2.8 1.6 1.2
10 M 42.8 29.3 6.6 29.8 33.3 20.7 2.8 4.0 2.6 11 M 20.2 20.9 9.1 21.1 19.0 19.0 2.2 2.6 2.4 12 M 0.5 0.5 0.5 5.1 1.7 0.5 2.0 1.6 1.6 13 M 40.3 25.8 10.6 35.7 21.8 4.3 6.8 7.8 6.6 15 L 53.2 56.1 11.9 26.5 12.9 6.1 3.0 2.6 4.8 16 L 47.2 29.6 8.1 61.5 66.1 21.9 2.4 3.2 4.4 17 L 31.2 26.3 9.8 122.0 56.1 35.4 2.8 2.4 3.0 18 M 58.7 53.3 25.3 32.1 24.8 12.4 2.4 4.0 4.4 21 U 39.5 31.5 9.3 28.2 34.9 25.5 5.8 6.0 6.8 22 M 49.5 27.1 8.5 41.5 32.5 19.0 2.8 6.4 4.6 23 U 24.6 27.6 14.9 20.2 20.7 12.6 2.6 10.6 9.4 24 U 24.5 25.5 10.2 30.4 36.4 14.6 4.2 9.4 6.6 26 M 24.7 31.1 27.5 46.1 43.2 17.9 26.0 25.8 14.4 27 M 61.0 69.4 42.5 90.8 55.9 26.2 50.4 38.6 16.4 28 M 11.9 11.2 9.5 40.1 32.3 15.5 4.6 3.8 3.0 30 M 15.2 28.0 16.5 28.2 29.8 13.9 2.0 6.2 6.4 31 M nsy ns ns 17.2 13.6 8.3 4.0 6.6 4.8 32 D ns ns ns 3.2 1.4 0.2 3.4 3.4 2.2 33 U ns ns ns 29.8 13.6 6.3 3.2 6.0 4.2 34 U ns ns ns 61.4 62.7 21.8 13.2 16.8 13.2 35 M ns ns ns 113.0 88.2 35.7 23.8 17.0 14.8 36 M ns ns ns 35.2 25.0 12.4 2.4 3.0 4.2
Spring 2003 Spring 2004 Spring 2005
0 to 2.5
cm 2.5 to 5
cm 5 to 15
cm 0 to 2.5
cm 2.5 to 5
cm 5 to 15
cm 0 to 2.5
cm 2.5 to 5
cm 5 to 15
cm --------- mg kg-1 --------- --------- mg kg-1 --------- --------- mg kg-1 ---------
1 L 49.0 26.0 7.0 31.6 31.6 18.6 52.0 23.0 17.0 4 M 40.0 18.0 8.0 3.4 1.4 1.2 20.0 14.0 23.0 6 M 45.0 39.0 27.0 nsy ns ns ns ns ns 9 L 139.0 50.0 26.0 58.2 25.4 12.8 26.0 35.0 52.0
12 M 108.0 51.0 18.0 46.4 28.0 15.2 11.0 28.0 40.0 z D = depression; L = lower slope; M = mid slope; U = upper slope. y not sampled.
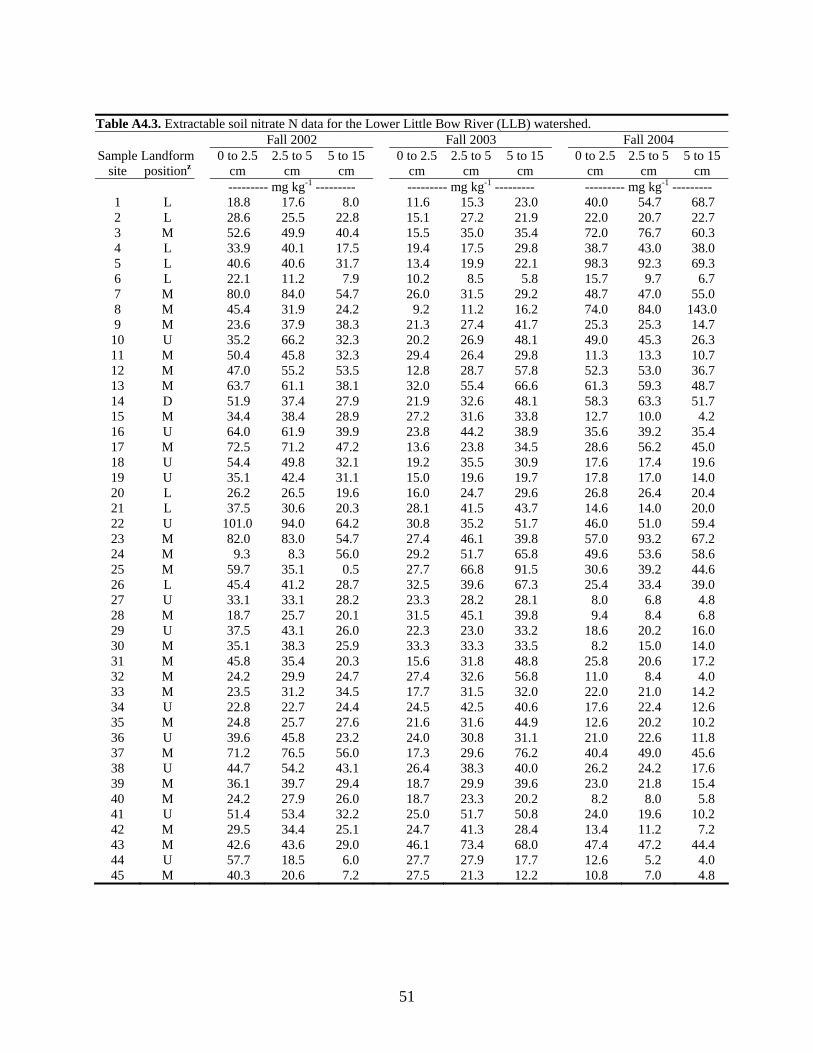
51
Table A4.3. Extractable soil nitrate N data for the Lower Little Bow River (LLB) watershed.
Fall 2002 Fall 2003 Fall 2004 Sample
site Landform positionz
0 to 2.5 cm
2.5 to 5 cm
5 to 15 cm
0 to 2.5 cm
2.5 to 5 cm
5 to 15 cm
0 to 2.5 cm
2.5 to 5 cm
5 to 15 cm
--------- mg kg-1 --------- --------- mg kg-1 --------- --------- mg kg-1 --------- 1 L 18.8 17.6 8.0 11.6 15.3 23.0 40.0 54.7 68.7 2 L 28.6 25.5 22.8 15.1 27.2 21.9 22.0 20.7 22.7 3 M 52.6 49.9 40.4 15.5 35.0 35.4 72.0 76.7 60.3 4 L 33.9 40.1 17.5 19.4 17.5 29.8 38.7 43.0 38.0 5 L 40.6 40.6 31.7 13.4 19.9 22.1 98.3 92.3 69.3 6 L 22.1 11.2 7.9 10.2 8.5 5.8 15.7 9.7 6.7 7 M 80.0 84.0 54.7 26.0 31.5 29.2 48.7 47.0 55.0 8 M 45.4 31.9 24.2 9.2 11.2 16.2 74.0 84.0 143.0 9 M 23.6 37.9 38.3 21.3 27.4 41.7 25.3 25.3 14.7
10 U 35.2 66.2 32.3 20.2 26.9 48.1 49.0 45.3 26.3 11 M 50.4 45.8 32.3 29.4 26.4 29.8 11.3 13.3 10.7 12 M 47.0 55.2 53.5 12.8 28.7 57.8 52.3 53.0 36.7 13 M 63.7 61.1 38.1 32.0 55.4 66.6 61.3 59.3 48.7 14 D 51.9 37.4 27.9 21.9 32.6 48.1 58.3 63.3 51.7 15 M 34.4 38.4 28.9 27.2 31.6 33.8 12.7 10.0 4.2 16 U 64.0 61.9 39.9 23.8 44.2 38.9 35.6 39.2 35.4 17 M 72.5 71.2 47.2 13.6 23.8 34.5 28.6 56.2 45.0 18 U 54.4 49.8 32.1 19.2 35.5 30.9 17.6 17.4 19.6 19 U 35.1 42.4 31.1 15.0 19.6 19.7 17.8 17.0 14.0 20 L 26.2 26.5 19.6 16.0 24.7 29.6 26.8 26.4 20.4 21 L 37.5 30.6 20.3 28.1 41.5 43.7 14.6 14.0 20.0 22 U 101.0 94.0 64.2 30.8 35.2 51.7 46.0 51.0 59.4 23 M 82.0 83.0 54.7 27.4 46.1 39.8 57.0 93.2 67.2 24 M 9.3 8.3 56.0 29.2 51.7 65.8 49.6 53.6 58.6 25 M 59.7 35.1 0.5 27.7 66.8 91.5 30.6 39.2 44.6 26 L 45.4 41.2 28.7 32.5 39.6 67.3 25.4 33.4 39.0 27 U 33.1 33.1 28.2 23.3 28.2 28.1 8.0 6.8 4.8 28 M 18.7 25.7 20.1 31.5 45.1 39.8 9.4 8.4 6.8 29 U 37.5 43.1 26.0 22.3 23.0 33.2 18.6 20.2 16.0 30 M 35.1 38.3 25.9 33.3 33.3 33.5 8.2 15.0 14.0 31 M 45.8 35.4 20.3 15.6 31.8 48.8 25.8 20.6 17.2 32 M 24.2 29.9 24.7 27.4 32.6 56.8 11.0 8.4 4.0 33 M 23.5 31.2 34.5 17.7 31.5 32.0 22.0 21.0 14.2 34 U 22.8 22.7 24.4 24.5 42.5 40.6 17.6 22.4 12.6 35 M 24.8 25.7 27.6 21.6 31.6 44.9 12.6 20.2 10.2 36 U 39.6 45.8 23.2 24.0 30.8 31.1 21.0 22.6 11.8 37 M 71.2 76.5 56.0 17.3 29.6 76.2 40.4 49.0 45.6 38 U 44.7 54.2 43.1 26.4 38.3 40.0 26.2 24.2 17.6 39 M 36.1 39.7 29.4 18.7 29.9 39.6 23.0 21.8 15.4 40 M 24.2 27.9 26.0 18.7 23.3 20.2 8.2 8.0 5.8 41 U 51.4 53.4 32.2 25.0 51.7 50.8 24.0 19.6 10.2 42 M 29.5 34.4 25.1 24.7 41.3 28.4 13.4 11.2 7.2 43 M 42.6 43.6 29.0 46.1 73.4 68.0 47.4 47.2 44.4 44 U 57.7 18.5 6.0 27.7 27.9 17.7 12.6 5.2 4.0 45 M 40.3 20.6 7.2 27.5 21.3 12.2 10.8 7.0 4.8
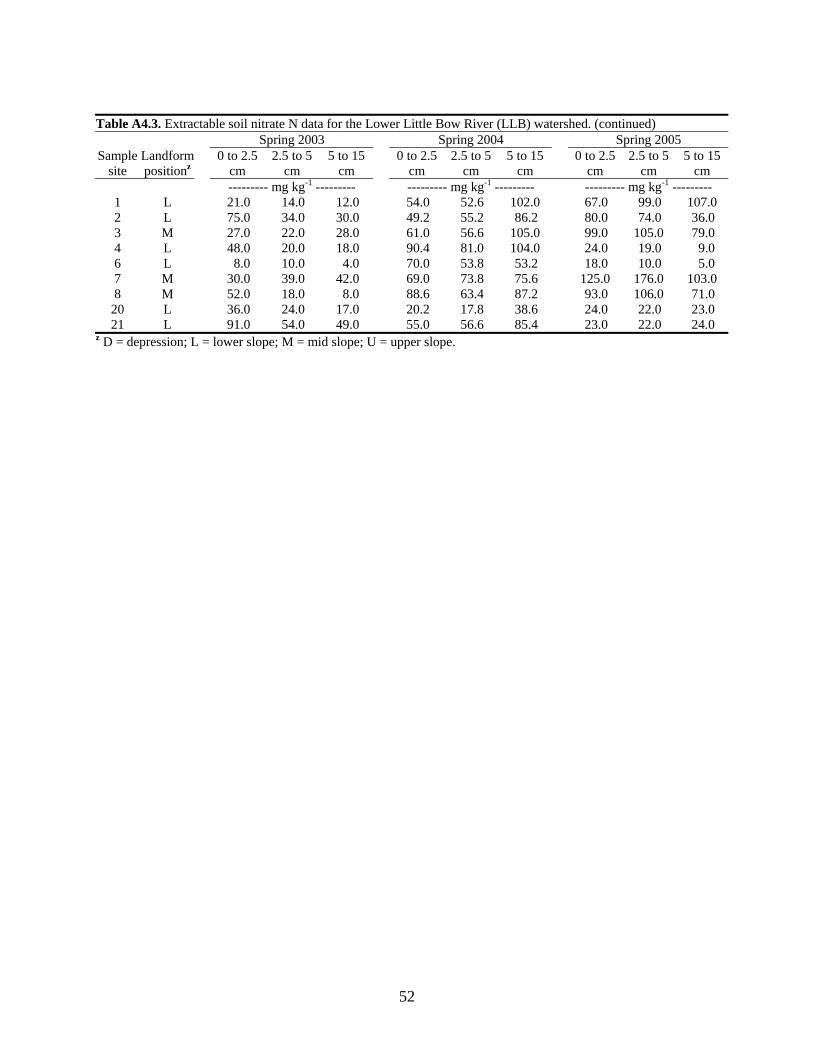
52
Table A4.3. Extractable soil nitrate N data for the Lower Little Bow River (LLB) watershed. (continued)
Spring 2003 Spring 2004 Spring 2005 Sample
site Landform positionz
0 to 2.5 cm
2.5 to 5 cm
5 to 15 cm
0 to 2.5 cm
2.5 to 5 cm
5 to 15 cm
0 to 2.5 cm
2.5 to 5 cm
5 to 15 cm
--------- mg kg-1 --------- --------- mg kg-1 --------- --------- mg kg-1 --------- 1 L 21.0 14.0 12.0 54.0 52.6 102.0 67.0 99.0 107.0 2 L 75.0 34.0 30.0 49.2 55.2 86.2 80.0 74.0 36.0 3 M 27.0 22.0 28.0 61.0 56.6 105.0 99.0 105.0 79.0 4 L 48.0 20.0 18.0 90.4 81.0 104.0 24.0 19.0 9.0 6 L 8.0 10.0 4.0 70.0 53.8 53.2 18.0 10.0 5.0 7 M 30.0 39.0 42.0 69.0 73.8 75.6 125.0 176.0 103.0 8 M 52.0 18.0 8.0 88.6 63.4 87.2 93.0 106.0 71.0
20 L 36.0 24.0 17.0 20.2 17.8 38.6 24.0 22.0 23.0 21 L 91.0 54.0 49.0 55.0 56.6 85.4 23.0 22.0 24.0
z D = depression; L = lower slope; M = mid slope; U = upper slope.
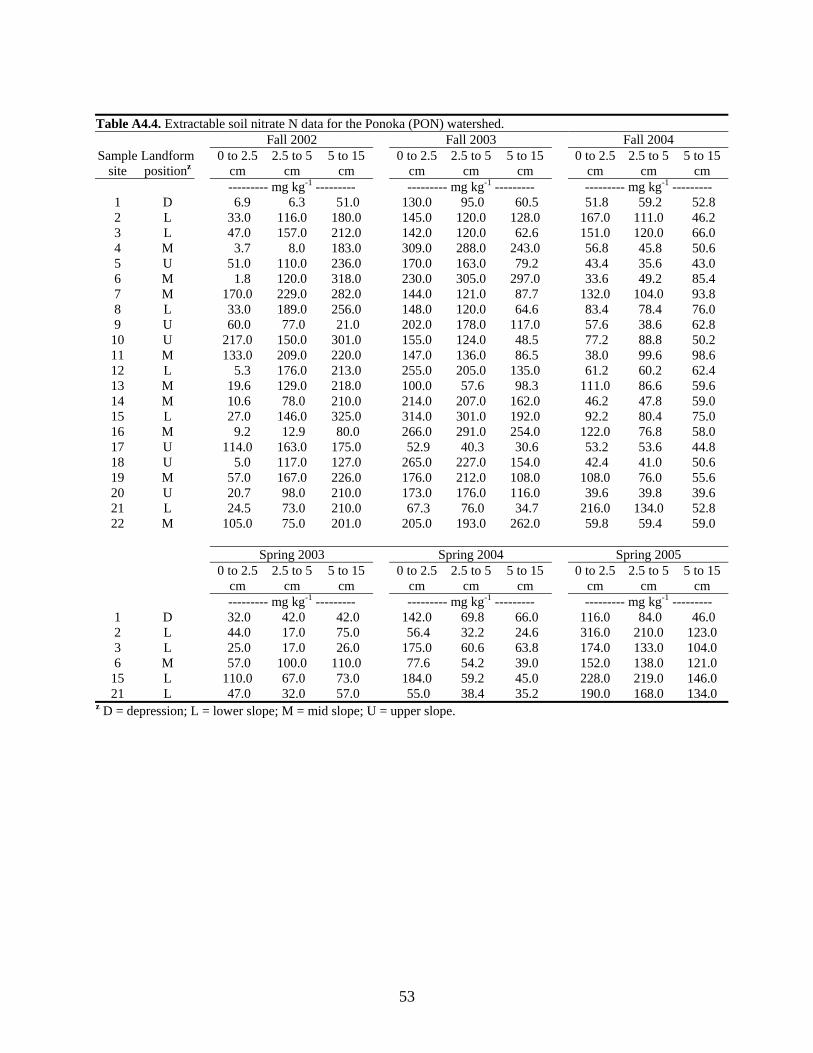
53
Table A4.4. Extractable soil nitrate N data for the Ponoka (PON) watershed.
Fall 2002 Fall 2003 Fall 2004 Sample
site Landform positionz
0 to 2.5 cm
2.5 to 5 cm
5 to 15 cm
0 to 2.5 cm
2.5 to 5 cm
5 to 15 cm
0 to 2.5 cm
2.5 to 5 cm
5 to 15 cm
--------- mg kg-1 --------- --------- mg kg-1 --------- --------- mg kg-1 --------- 1 D 6.9 6.3 51.0 130.0 95.0 60.5 51.8 59.2 52.8 2 L 33.0 116.0 180.0 145.0 120.0 128.0 167.0 111.0 46.2 3 L 47.0 157.0 212.0 142.0 120.0 62.6 151.0 120.0 66.0 4 M 3.7 8.0 183.0 309.0 288.0 243.0 56.8 45.8 50.6 5 U 51.0 110.0 236.0 170.0 163.0 79.2 43.4 35.6 43.0 6 M 1.8 120.0 318.0 230.0 305.0 297.0 33.6 49.2 85.4 7 M 170.0 229.0 282.0 144.0 121.0 87.7 132.0 104.0 93.8 8 L 33.0 189.0 256.0 148.0 120.0 64.6 83.4 78.4 76.0 9 U 60.0 77.0 21.0 202.0 178.0 117.0 57.6 38.6 62.8
10 U 217.0 150.0 301.0 155.0 124.0 48.5 77.2 88.8 50.2 11 M 133.0 209.0 220.0 147.0 136.0 86.5 38.0 99.6 98.6 12 L 5.3 176.0 213.0 255.0 205.0 135.0 61.2 60.2 62.4 13 M 19.6 129.0 218.0 100.0 57.6 98.3 111.0 86.6 59.6 14 M 10.6 78.0 210.0 214.0 207.0 162.0 46.2 47.8 59.0 15 L 27.0 146.0 325.0 314.0 301.0 192.0 92.2 80.4 75.0 16 M 9.2 12.9 80.0 266.0 291.0 254.0 122.0 76.8 58.0 17 U 114.0 163.0 175.0 52.9 40.3 30.6 53.2 53.6 44.8 18 U 5.0 117.0 127.0 265.0 227.0 154.0 42.4 41.0 50.6 19 M 57.0 167.0 226.0 176.0 212.0 108.0 108.0 76.0 55.6 20 U 20.7 98.0 210.0 173.0 176.0 116.0 39.6 39.8 39.6 21 L 24.5 73.0 210.0 67.3 76.0 34.7 216.0 134.0 52.8 22 M 105.0 75.0 201.0 205.0 193.0 262.0 59.8 59.4 59.0
Spring 2003 Spring 2004 Spring 2005
0 to 2.5
cm 2.5 to 5
cm 5 to 15
cm 0 to 2.5
cm 2.5 to 5
cm 5 to 15
cm 0 to 2.5
cm 2.5 to 5
cm 5 to 15
cm --------- mg kg-1 --------- --------- mg kg-1 --------- --------- mg kg-1 ---------
1 D 32.0 42.0 42.0 142.0 69.8 66.0 116.0 84.0 46.0 2 L 44.0 17.0 75.0 56.4 32.2 24.6 316.0 210.0 123.0 3 L 25.0 17.0 26.0 175.0 60.6 63.8 174.0 133.0 104.0 6 M 57.0 100.0 110.0 77.6 54.2 39.0 152.0 138.0 121.0
15 L 110.0 67.0 73.0 184.0 59.2 45.0 228.0 219.0 146.0 21 L 47.0 32.0 57.0 55.0 38.4 35.2 190.0 168.0 134.0
z D = depression; L = lower slope; M = mid slope; U = upper slope.
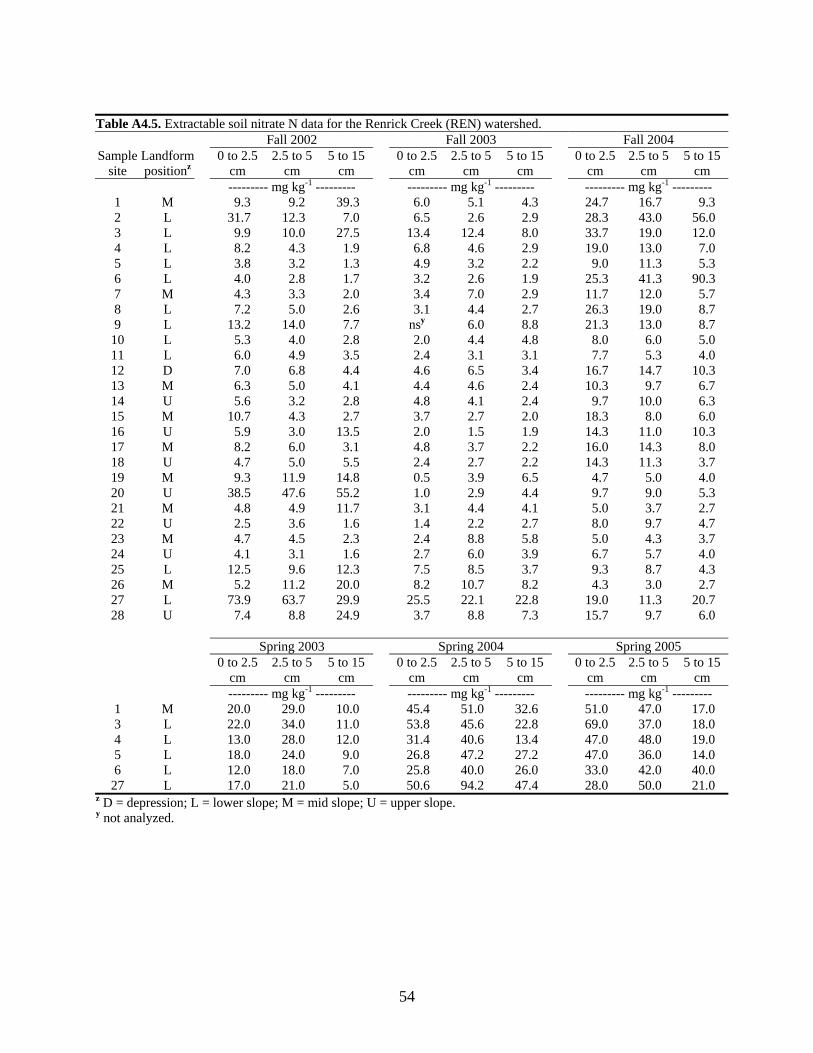
54
Table A4.5. Extractable soil nitrate N data for the Renrick Creek (REN) watershed.
Fall 2002 Fall 2003 Fall 2004 Sample
site Landform positionz
0 to 2.5 cm
2.5 to 5 cm
5 to 15 cm
0 to 2.5 cm
2.5 to 5 cm
5 to 15 cm
0 to 2.5 cm
2.5 to 5 cm
5 to 15 cm
--------- mg kg-1 --------- --------- mg kg-1 --------- --------- mg kg-1 --------- 1 M 9.3 9.2 39.3 6.0 5.1 4.3 24.7 16.7 9.3 2 L 31.7 12.3 7.0 6.5 2.6 2.9 28.3 43.0 56.0 3 L 9.9 10.0 27.5 13.4 12.4 8.0 33.7 19.0 12.0 4 L 8.2 4.3 1.9 6.8 4.6 2.9 19.0 13.0 7.0 5 L 3.8 3.2 1.3 4.9 3.2 2.2 9.0 11.3 5.3 6 L 4.0 2.8 1.7 3.2 2.6 1.9 25.3 41.3 90.3 7 M 4.3 3.3 2.0 3.4 7.0 2.9 11.7 12.0 5.7 8 L 7.2 5.0 2.6 3.1 4.4 2.7 26.3 19.0 8.7 9 L 13.2 14.0 7.7 nsy 6.0 8.8 21.3 13.0 8.7
10 L 5.3 4.0 2.8 2.0 4.4 4.8 8.0 6.0 5.0 11 L 6.0 4.9 3.5 2.4 3.1 3.1 7.7 5.3 4.0 12 D 7.0 6.8 4.4 4.6 6.5 3.4 16.7 14.7 10.3 13 M 6.3 5.0 4.1 4.4 4.6 2.4 10.3 9.7 6.7 14 U 5.6 3.2 2.8 4.8 4.1 2.4 9.7 10.0 6.3 15 M 10.7 4.3 2.7 3.7 2.7 2.0 18.3 8.0 6.0 16 U 5.9 3.0 13.5 2.0 1.5 1.9 14.3 11.0 10.3 17 M 8.2 6.0 3.1 4.8 3.7 2.2 16.0 14.3 8.0 18 U 4.7 5.0 5.5 2.4 2.7 2.2 14.3 11.3 3.7 19 M 9.3 11.9 14.8 0.5 3.9 6.5 4.7 5.0 4.0 20 U 38.5 47.6 55.2 1.0 2.9 4.4 9.7 9.0 5.3 21 M 4.8 4.9 11.7 3.1 4.4 4.1 5.0 3.7 2.7 22 U 2.5 3.6 1.6 1.4 2.2 2.7 8.0 9.7 4.7 23 M 4.7 4.5 2.3 2.4 8.8 5.8 5.0 4.3 3.7 24 U 4.1 3.1 1.6 2.7 6.0 3.9 6.7 5.7 4.0 25 L 12.5 9.6 12.3 7.5 8.5 3.7 9.3 8.7 4.3 26 M 5.2 11.2 20.0 8.2 10.7 8.2 4.3 3.0 2.7 27 L 73.9 63.7 29.9 25.5 22.1 22.8 19.0 11.3 20.7 28 U 7.4 8.8 24.9 3.7 8.8 7.3 15.7 9.7 6.0
Spring 2003 Spring 2004 Spring 2005
0 to 2.5
cm 2.5 to 5
cm 5 to 15
cm 0 to 2.5
cm 2.5 to 5
cm 5 to 15
cm 0 to 2.5
cm 2.5 to 5
cm 5 to 15
cm --------- mg kg-1 --------- --------- mg kg-1 --------- --------- mg kg-1 ---------
1 M 20.0 29.0 10.0 45.4 51.0 32.6 51.0 47.0 17.0 3 L 22.0 34.0 11.0 53.8 45.6 22.8 69.0 37.0 18.0 4 L 13.0 28.0 12.0 31.4 40.6 13.4 47.0 48.0 19.0 5 L 18.0 24.0 9.0 26.8 47.2 27.2 47.0 36.0 14.0 6 L 12.0 18.0 7.0 25.8 40.0 26.0 33.0 42.0 40.0
27 L 17.0 21.0 5.0 50.6 94.2 47.4 28.0 50.0 21.0 z D = depression; L = lower slope; M = mid slope; U = upper slope. y not analyzed.
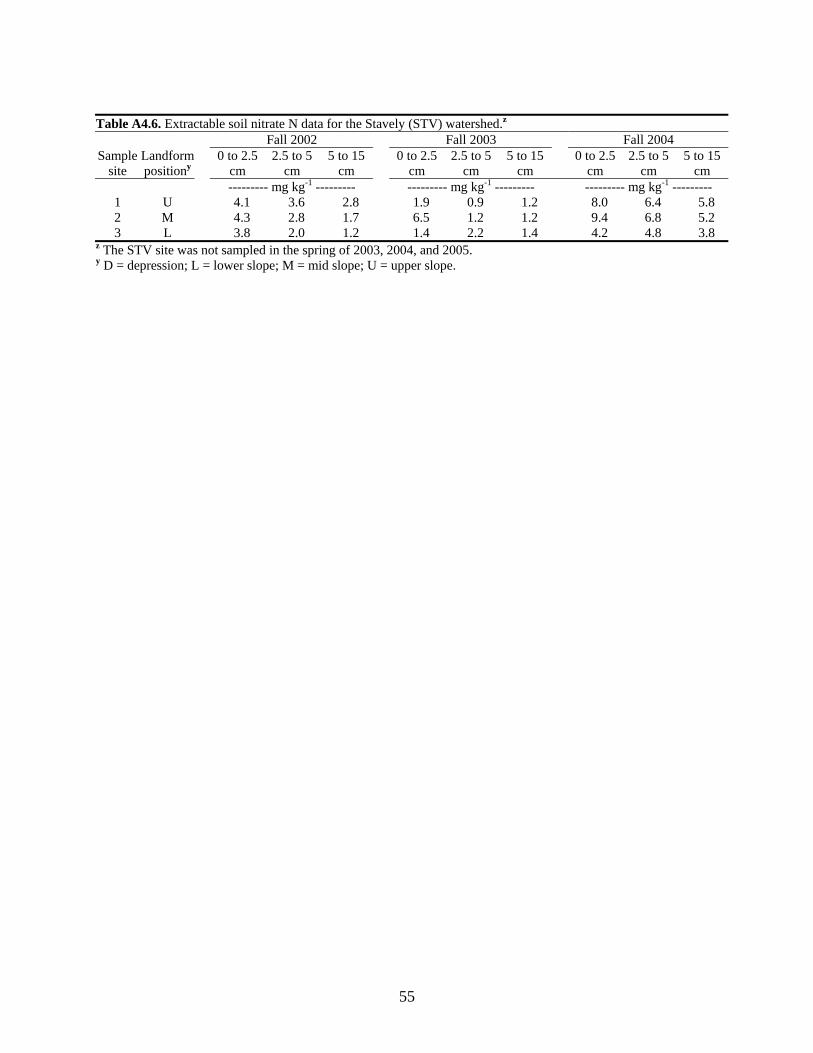
55
Table A4.6. Extractable soil nitrate N data for the Stavely (STV) watershed.z
Fall 2002 Fall 2003 Fall 2004 Sample
site Landform positiony
0 to 2.5 cm
2.5 to 5 cm
5 to 15 cm
0 to 2.5 cm
2.5 to 5 cm
5 to 15 cm
0 to 2.5 cm
2.5 to 5 cm
5 to 15 cm
--------- mg kg-1 --------- --------- mg kg-1 --------- --------- mg kg-1 --------- 1 U 4.1 3.6 2.8 1.9 0.9 1.2 8.0 6.4 5.8 2 M 4.3 2.8 1.7 6.5 1.2 1.2 9.4 6.8 5.2 3 L 3.8 2.0 1.2 1.4 2.2 1.4 4.2 4.8 3.8
z The STV site was not sampled in the spring of 2003, 2004, and 2005. y D = depression; L = lower slope; M = mid slope; U = upper slope.
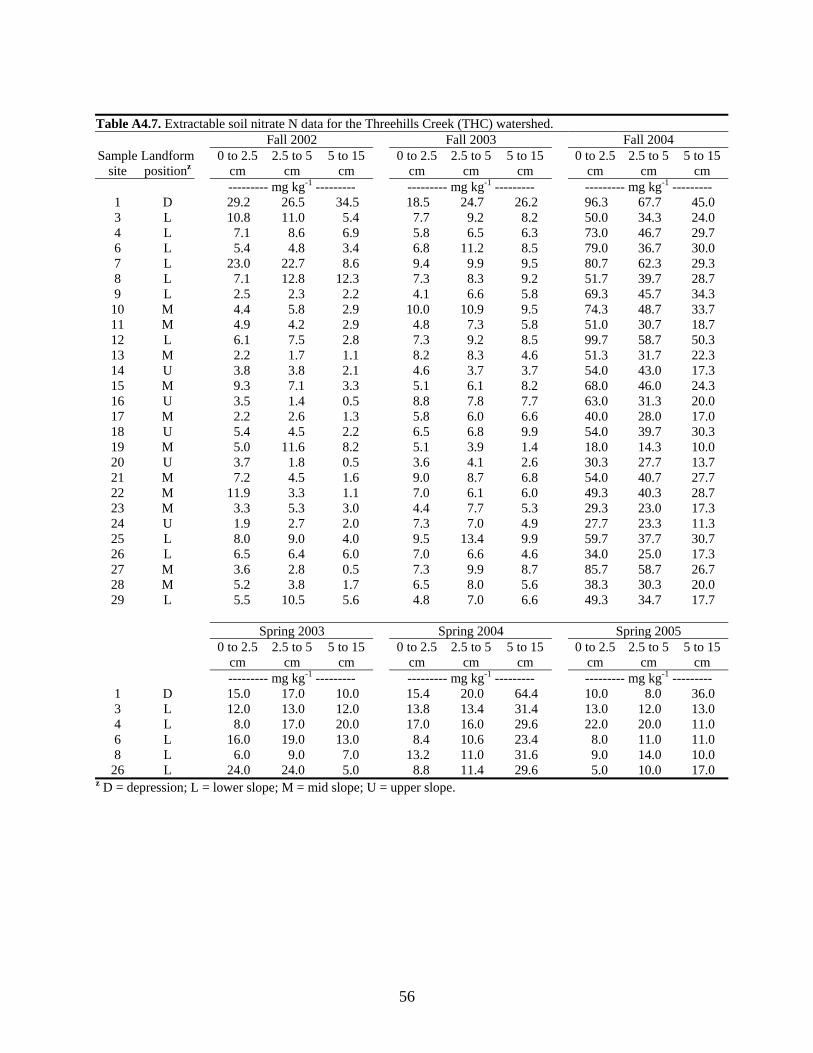
56
Table A4.7. Extractable soil nitrate N data for the Threehills Creek (THC) watershed.
Fall 2002 Fall 2003 Fall 2004 Sample
site Landform positionz
0 to 2.5 cm
2.5 to 5 cm
5 to 15 cm
0 to 2.5 cm
2.5 to 5 cm
5 to 15 cm
0 to 2.5 cm
2.5 to 5 cm
5 to 15 cm
--------- mg kg-1 --------- --------- mg kg-1 --------- --------- mg kg-1 --------- 1 D 29.2 26.5 34.5 18.5 24.7 26.2 96.3 67.7 45.0 3 L 10.8 11.0 5.4 7.7 9.2 8.2 50.0 34.3 24.0 4 L 7.1 8.6 6.9 5.8 6.5 6.3 73.0 46.7 29.7 6 L 5.4 4.8 3.4 6.8 11.2 8.5 79.0 36.7 30.0 7 L 23.0 22.7 8.6 9.4 9.9 9.5 80.7 62.3 29.3 8 L 7.1 12.8 12.3 7.3 8.3 9.2 51.7 39.7 28.7 9 L 2.5 2.3 2.2 4.1 6.6 5.8 69.3 45.7 34.3
10 M 4.4 5.8 2.9 10.0 10.9 9.5 74.3 48.7 33.7 11 M 4.9 4.2 2.9 4.8 7.3 5.8 51.0 30.7 18.7 12 L 6.1 7.5 2.8 7.3 9.2 8.5 99.7 58.7 50.3 13 M 2.2 1.7 1.1 8.2 8.3 4.6 51.3 31.7 22.3 14 U 3.8 3.8 2.1 4.6 3.7 3.7 54.0 43.0 17.3 15 M 9.3 7.1 3.3 5.1 6.1 8.2 68.0 46.0 24.3 16 U 3.5 1.4 0.5 8.8 7.8 7.7 63.0 31.3 20.0 17 M 2.2 2.6 1.3 5.8 6.0 6.6 40.0 28.0 17.0 18 U 5.4 4.5 2.2 6.5 6.8 9.9 54.0 39.7 30.3 19 M 5.0 11.6 8.2 5.1 3.9 1.4 18.0 14.3 10.0 20 U 3.7 1.8 0.5 3.6 4.1 2.6 30.3 27.7 13.7 21 M 7.2 4.5 1.6 9.0 8.7 6.8 54.0 40.7 27.7 22 M 11.9 3.3 1.1 7.0 6.1 6.0 49.3 40.3 28.7 23 M 3.3 5.3 3.0 4.4 7.7 5.3 29.3 23.0 17.3 24 U 1.9 2.7 2.0 7.3 7.0 4.9 27.7 23.3 11.3 25 L 8.0 9.0 4.0 9.5 13.4 9.9 59.7 37.7 30.7 26 L 6.5 6.4 6.0 7.0 6.6 4.6 34.0 25.0 17.3 27 M 3.6 2.8 0.5 7.3 9.9 8.7 85.7 58.7 26.7 28 M 5.2 3.8 1.7 6.5 8.0 5.6 38.3 30.3 20.0 29 L 5.5 10.5 5.6 4.8 7.0 6.6 49.3 34.7 17.7
Spring 2003 Spring 2004 Spring 2005
0 to 2.5
cm 2.5 to 5
cm 5 to 15
cm 0 to 2.5
cm 2.5 to 5
cm 5 to 15
cm 0 to 2.5
cm 2.5 to 5
cm 5 to 15
cm --------- mg kg-1 --------- --------- mg kg-1 --------- --------- mg kg-1 ---------
1 D 15.0 17.0 10.0 15.4 20.0 64.4 10.0 8.0 36.0 3 L 12.0 13.0 12.0 13.8 13.4 31.4 13.0 12.0 13.0 4 L 8.0 17.0 20.0 17.0 16.0 29.6 22.0 20.0 11.0 6 L 16.0 19.0 13.0 8.4 10.6 23.4 8.0 11.0 11.0 8 L 6.0 9.0 7.0 13.2 11.0 31.6 9.0 14.0 10.0
26 L 24.0 24.0 5.0 8.8 11.4 29.6 5.0 10.0 17.0 z D = depression; L = lower slope; M = mid slope; U = upper slope.
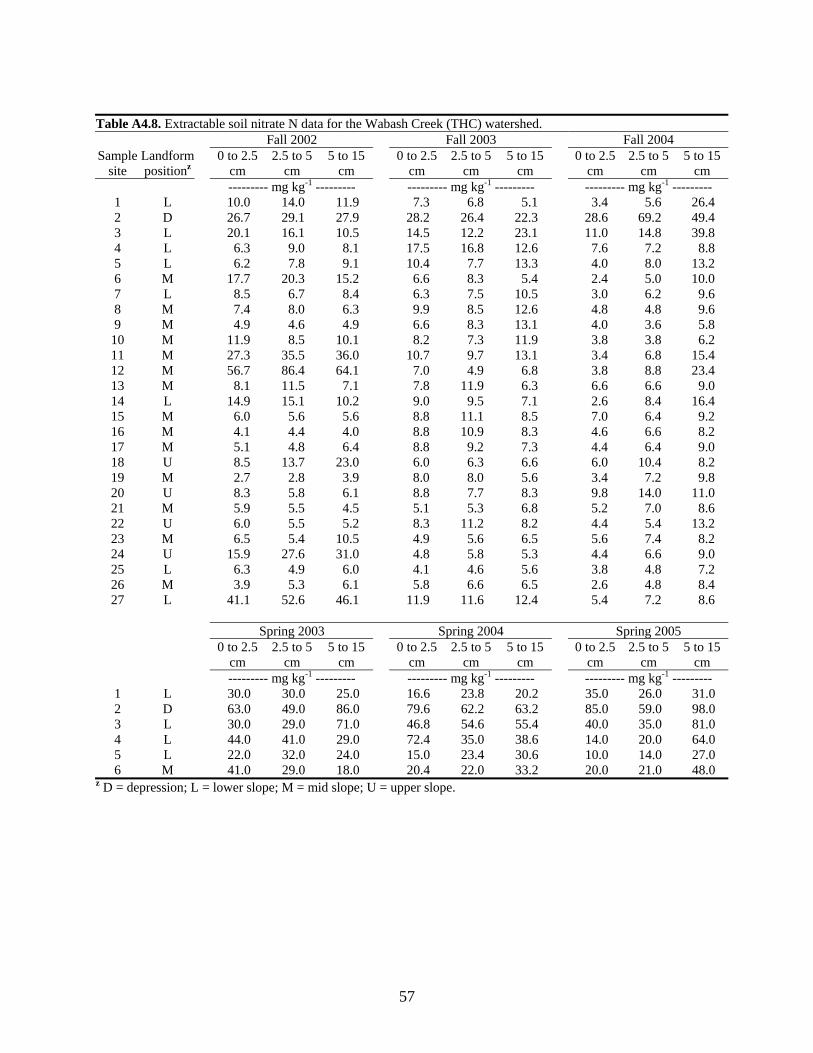
57
Table A4.8. Extractable soil nitrate N data for the Wabash Creek (THC) watershed.
Fall 2002 Fall 2003 Fall 2004 Sample
site Landform positionz
0 to 2.5 cm
2.5 to 5 cm
5 to 15 cm
0 to 2.5 cm
2.5 to 5 cm
5 to 15 cm
0 to 2.5 cm
2.5 to 5 cm
5 to 15 cm
--------- mg kg-1 --------- --------- mg kg-1 --------- --------- mg kg-1 --------- 1 L 10.0 14.0 11.9 7.3 6.8 5.1 3.4 5.6 26.4 2 D 26.7 29.1 27.9 28.2 26.4 22.3 28.6 69.2 49.4 3 L 20.1 16.1 10.5 14.5 12.2 23.1 11.0 14.8 39.8 4 L 6.3 9.0 8.1 17.5 16.8 12.6 7.6 7.2 8.8 5 L 6.2 7.8 9.1 10.4 7.7 13.3 4.0 8.0 13.2 6 M 17.7 20.3 15.2 6.6 8.3 5.4 2.4 5.0 10.0 7 L 8.5 6.7 8.4 6.3 7.5 10.5 3.0 6.2 9.6 8 M 7.4 8.0 6.3 9.9 8.5 12.6 4.8 4.8 9.6 9 M 4.9 4.6 4.9 6.6 8.3 13.1 4.0 3.6 5.8
10 M 11.9 8.5 10.1 8.2 7.3 11.9 3.8 3.8 6.2 11 M 27.3 35.5 36.0 10.7 9.7 13.1 3.4 6.8 15.4 12 M 56.7 86.4 64.1 7.0 4.9 6.8 3.8 8.8 23.4 13 M 8.1 11.5 7.1 7.8 11.9 6.3 6.6 6.6 9.0 14 L 14.9 15.1 10.2 9.0 9.5 7.1 2.6 8.4 16.4 15 M 6.0 5.6 5.6 8.8 11.1 8.5 7.0 6.4 9.2 16 M 4.1 4.4 4.0 8.8 10.9 8.3 4.6 6.6 8.2 17 M 5.1 4.8 6.4 8.8 9.2 7.3 4.4 6.4 9.0 18 U 8.5 13.7 23.0 6.0 6.3 6.6 6.0 10.4 8.2 19 M 2.7 2.8 3.9 8.0 8.0 5.6 3.4 7.2 9.8 20 U 8.3 5.8 6.1 8.8 7.7 8.3 9.8 14.0 11.0 21 M 5.9 5.5 4.5 5.1 5.3 6.8 5.2 7.0 8.6 22 U 6.0 5.5 5.2 8.3 11.2 8.2 4.4 5.4 13.2 23 M 6.5 5.4 10.5 4.9 5.6 6.5 5.6 7.4 8.2 24 U 15.9 27.6 31.0 4.8 5.8 5.3 4.4 6.6 9.0 25 L 6.3 4.9 6.0 4.1 4.6 5.6 3.8 4.8 7.2 26 M 3.9 5.3 6.1 5.8 6.6 6.5 2.6 4.8 8.4 27 L 41.1 52.6 46.1 11.9 11.6 12.4 5.4 7.2 8.6
Spring 2003 Spring 2004 Spring 2005
0 to 2.5
cm 2.5 to 5
cm 5 to 15
cm 0 to 2.5
cm 2.5 to 5
cm 5 to 15
cm 0 to 2.5
cm 2.5 to 5
cm 5 to 15
cm --------- mg kg-1 --------- --------- mg kg-1 --------- --------- mg kg-1 ---------
1 L 30.0 30.0 25.0 16.6 23.8 20.2 35.0 26.0 31.0 2 D 63.0 49.0 86.0 79.6 62.2 63.2 85.0 59.0 98.0 3 L 30.0 29.0 71.0 46.8 54.6 55.4 40.0 35.0 81.0 4 L 44.0 41.0 29.0 72.4 35.0 38.6 14.0 20.0 64.0 5 L 22.0 32.0 24.0 15.0 23.4 30.6 10.0 14.0 27.0 6 M 41.0 29.0 18.0 20.4 22.0 33.2 20.0 21.0 48.0
z D = depression; L = lower slope; M = mid slope; U = upper slope.
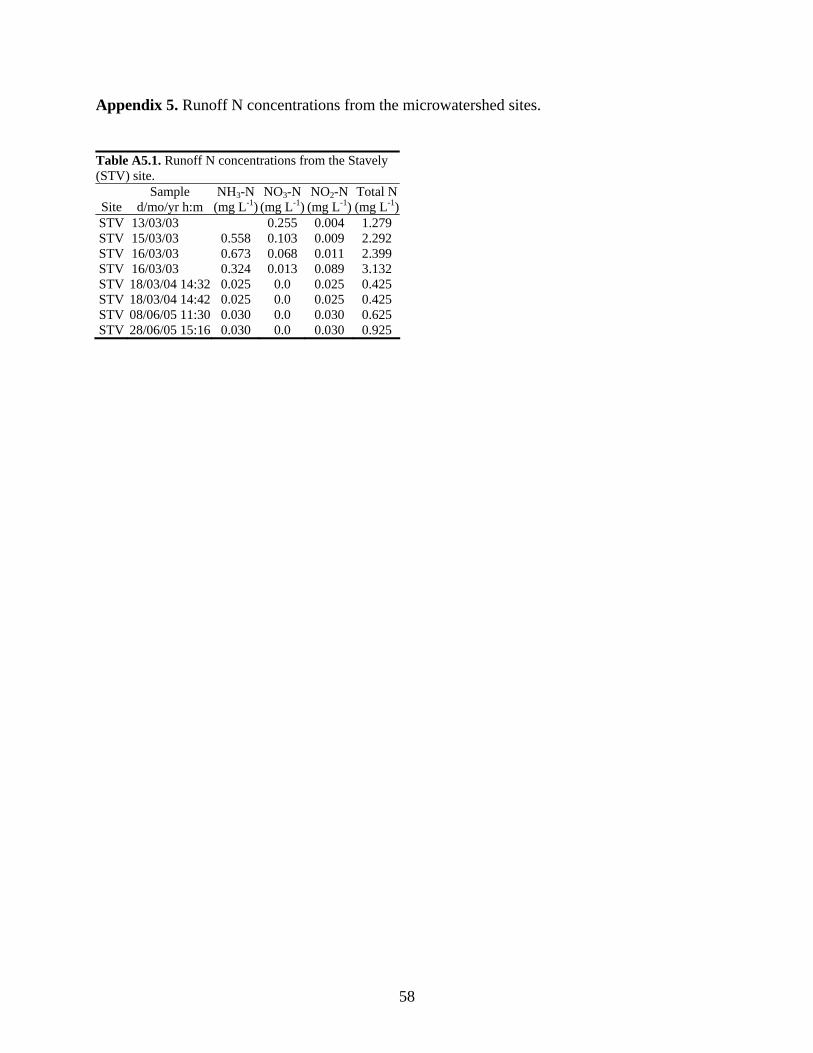
58
Appendix 5. Runoff N concentrations from the microwatershed sites. Table A5.1. Runoff N concentrations from the Stavely (STV) site.
Site Sample
d/mo/yr h:m NH3-N
(mg L-1) NO3-N
(mg L-1) NO2-N
(mg L-1)Total N(mg L-1)
STV 13/03/03 0.255 0.004 1.279 STV 15/03/03 0.558 0.103 0.009 2.292 STV 16/03/03 0.673 0.068 0.011 2.399 STV 16/03/03 0.324 0.013 0.089 3.132 STV 18/03/04 14:32 0.025 0.0 0.025 0.425 STV 18/03/04 14:42 0.025 0.0 0.025 0.425 STV 08/06/05 11:30 0.030 0.0 0.030 0.625 STV 28/06/05 15:16 0.030 0.0 0.030 0.925
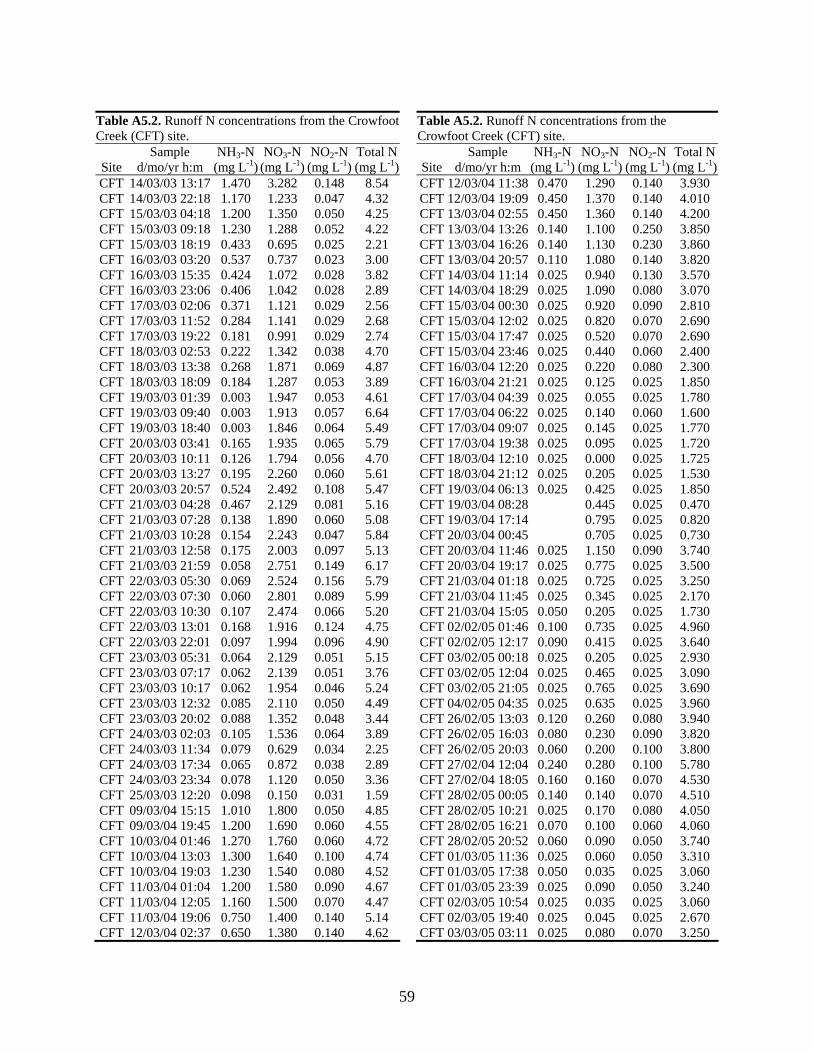
59
Table A5.2. Runoff N concentrations from the Crowfoot Creek (CFT) site.
Table A5.2. Runoff N concentrations from the Crowfoot Creek (CFT) site.
Site Sample
d/mo/yr h:m NH3-N
(mg L-1) NO3-N
(mg L-1) NO2-N
(mg L-1)Total N(mg L-1)
Site
Sample d/mo/yr h:m
NH3-N (mg L-1)
NO3-N (mg L-1)
NO2-N(mg L-1)
Total N(mg L-1)
CFT 14/03/03 13:17 1.470 3.282 0.148 8.54 CFT 12/03/04 11:38 0.470 1.290 0.140 3.930 CFT 14/03/03 22:18 1.170 1.233 0.047 4.32 CFT 12/03/04 19:09 0.450 1.370 0.140 4.010 CFT 15/03/03 04:18 1.200 1.350 0.050 4.25 CFT 13/03/04 02:55 0.450 1.360 0.140 4.200 CFT 15/03/03 09:18 1.230 1.288 0.052 4.22 CFT 13/03/04 13:26 0.140 1.100 0.250 3.850 CFT 15/03/03 18:19 0.433 0.695 0.025 2.21 CFT 13/03/04 16:26 0.140 1.130 0.230 3.860 CFT 16/03/03 03:20 0.537 0.737 0.023 3.00 CFT 13/03/04 20:57 0.110 1.080 0.140 3.820 CFT 16/03/03 15:35 0.424 1.072 0.028 3.82 CFT 14/03/04 11:14 0.025 0.940 0.130 3.570 CFT 16/03/03 23:06 0.406 1.042 0.028 2.89 CFT 14/03/04 18:29 0.025 1.090 0.080 3.070 CFT 17/03/03 02:06 0.371 1.121 0.029 2.56 CFT 15/03/04 00:30 0.025 0.920 0.090 2.810 CFT 17/03/03 11:52 0.284 1.141 0.029 2.68 CFT 15/03/04 12:02 0.025 0.820 0.070 2.690 CFT 17/03/03 19:22 0.181 0.991 0.029 2.74 CFT 15/03/04 17:47 0.025 0.520 0.070 2.690 CFT 18/03/03 02:53 0.222 1.342 0.038 4.70 CFT 15/03/04 23:46 0.025 0.440 0.060 2.400 CFT 18/03/03 13:38 0.268 1.871 0.069 4.87 CFT 16/03/04 12:20 0.025 0.220 0.080 2.300 CFT 18/03/03 18:09 0.184 1.287 0.053 3.89 CFT 16/03/04 21:21 0.025 0.125 0.025 1.850 CFT 19/03/03 01:39 0.003 1.947 0.053 4.61 CFT 17/03/04 04:39 0.025 0.055 0.025 1.780 CFT 19/03/03 09:40 0.003 1.913 0.057 6.64 CFT 17/03/04 06:22 0.025 0.140 0.060 1.600 CFT 19/03/03 18:40 0.003 1.846 0.064 5.49 CFT 17/03/04 09:07 0.025 0.145 0.025 1.770 CFT 20/03/03 03:41 0.165 1.935 0.065 5.79 CFT 17/03/04 19:38 0.025 0.095 0.025 1.720 CFT 20/03/03 10:11 0.126 1.794 0.056 4.70 CFT 18/03/04 12:10 0.025 0.000 0.025 1.725 CFT 20/03/03 13:27 0.195 2.260 0.060 5.61 CFT 18/03/04 21:12 0.025 0.205 0.025 1.530 CFT 20/03/03 20:57 0.524 2.492 0.108 5.47 CFT 19/03/04 06:13 0.025 0.425 0.025 1.850 CFT 21/03/03 04:28 0.467 2.129 0.081 5.16 CFT 19/03/04 08:28 0.445 0.025 0.470 CFT 21/03/03 07:28 0.138 1.890 0.060 5.08 CFT 19/03/04 17:14 0.795 0.025 0.820 CFT 21/03/03 10:28 0.154 2.243 0.047 5.84 CFT 20/03/04 00:45 0.705 0.025 0.730 CFT 21/03/03 12:58 0.175 2.003 0.097 5.13 CFT 20/03/04 11:46 0.025 1.150 0.090 3.740 CFT 21/03/03 21:59 0.058 2.751 0.149 6.17 CFT 20/03/04 19:17 0.025 0.775 0.025 3.500 CFT 22/03/03 05:30 0.069 2.524 0.156 5.79 CFT 21/03/04 01:18 0.025 0.725 0.025 3.250 CFT 22/03/03 07:30 0.060 2.801 0.089 5.99 CFT 21/03/04 11:45 0.025 0.345 0.025 2.170 CFT 22/03/03 10:30 0.107 2.474 0.066 5.20 CFT 21/03/04 15:05 0.050 0.205 0.025 1.730 CFT 22/03/03 13:01 0.168 1.916 0.124 4.75 CFT 02/02/05 01:46 0.100 0.735 0.025 4.960 CFT 22/03/03 22:01 0.097 1.994 0.096 4.90 CFT 02/02/05 12:17 0.090 0.415 0.025 3.640 CFT 23/03/03 05:31 0.064 2.129 0.051 5.15 CFT 03/02/05 00:18 0.025 0.205 0.025 2.930 CFT 23/03/03 07:17 0.062 2.139 0.051 3.76 CFT 03/02/05 12:04 0.025 0.465 0.025 3.090 CFT 23/03/03 10:17 0.062 1.954 0.046 5.24 CFT 03/02/05 21:05 0.025 0.765 0.025 3.690 CFT 23/03/03 12:32 0.085 2.110 0.050 4.49 CFT 04/02/05 04:35 0.025 0.635 0.025 3.960 CFT 23/03/03 20:02 0.088 1.352 0.048 3.44 CFT 26/02/05 13:03 0.120 0.260 0.080 3.940 CFT 24/03/03 02:03 0.105 1.536 0.064 3.89 CFT 26/02/05 16:03 0.080 0.230 0.090 3.820 CFT 24/03/03 11:34 0.079 0.629 0.034 2.25 CFT 26/02/05 20:03 0.060 0.200 0.100 3.800 CFT 24/03/03 17:34 0.065 0.872 0.038 2.89 CFT 27/02/04 12:04 0.240 0.280 0.100 5.780 CFT 24/03/03 23:34 0.078 1.120 0.050 3.36 CFT 27/02/04 18:05 0.160 0.160 0.070 4.530 CFT 25/03/03 12:20 0.098 0.150 0.031 1.59 CFT 28/02/05 00:05 0.140 0.140 0.070 4.510 CFT 09/03/04 15:15 1.010 1.800 0.050 4.85 CFT 28/02/05 10:21 0.025 0.170 0.080 4.050 CFT 09/03/04 19:45 1.200 1.690 0.060 4.55 CFT 28/02/05 16:21 0.070 0.100 0.060 4.060 CFT 10/03/04 01:46 1.270 1.760 0.060 4.72 CFT 28/02/05 20:52 0.060 0.090 0.050 3.740 CFT 10/03/04 13:03 1.300 1.640 0.100 4.74 CFT 01/03/05 11:36 0.025 0.060 0.050 3.310 CFT 10/03/04 19:03 1.230 1.540 0.080 4.52 CFT 01/03/05 17:38 0.050 0.035 0.025 3.060 CFT 11/03/04 01:04 1.200 1.580 0.090 4.67 CFT 01/03/05 23:39 0.025 0.090 0.050 3.240 CFT 11/03/04 12:05 1.160 1.500 0.070 4.47 CFT 02/03/05 10:54 0.025 0.035 0.025 3.060 CFT 11/03/04 19:06 0.750 1.400 0.140 5.14 CFT 02/03/05 19:40 0.025 0.045 0.025 2.670 CFT 12/03/04 02:37 0.650 1.380 0.140 4.62 CFT 03/03/05 03:11 0.025 0.080 0.070 3.250
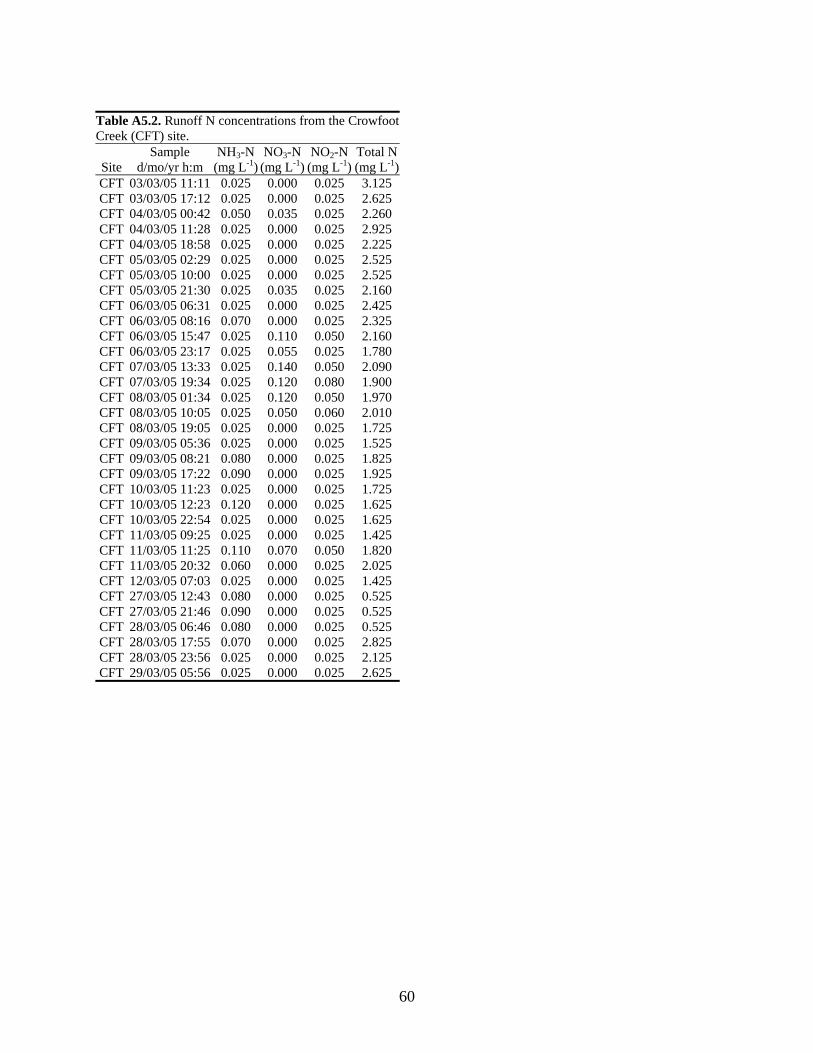
60
Table A5.2. Runoff N concentrations from the Crowfoot Creek (CFT) site.
Site Sample
d/mo/yr h:m NH3-N
(mg L-1) NO3-N
(mg L-1) NO2-N
(mg L-1)Total N(mg L-1)
CFT 03/03/05 11:11 0.025 0.000 0.025 3.125 CFT 03/03/05 17:12 0.025 0.000 0.025 2.625 CFT 04/03/05 00:42 0.050 0.035 0.025 2.260 CFT 04/03/05 11:28 0.025 0.000 0.025 2.925 CFT 04/03/05 18:58 0.025 0.000 0.025 2.225 CFT 05/03/05 02:29 0.025 0.000 0.025 2.525 CFT 05/03/05 10:00 0.025 0.000 0.025 2.525 CFT 05/03/05 21:30 0.025 0.035 0.025 2.160 CFT 06/03/05 06:31 0.025 0.000 0.025 2.425 CFT 06/03/05 08:16 0.070 0.000 0.025 2.325 CFT 06/03/05 15:47 0.025 0.110 0.050 2.160 CFT 06/03/05 23:17 0.025 0.055 0.025 1.780 CFT 07/03/05 13:33 0.025 0.140 0.050 2.090 CFT 07/03/05 19:34 0.025 0.120 0.080 1.900 CFT 08/03/05 01:34 0.025 0.120 0.050 1.970 CFT 08/03/05 10:05 0.025 0.050 0.060 2.010 CFT 08/03/05 19:05 0.025 0.000 0.025 1.725 CFT 09/03/05 05:36 0.025 0.000 0.025 1.525 CFT 09/03/05 08:21 0.080 0.000 0.025 1.825 CFT 09/03/05 17:22 0.090 0.000 0.025 1.925 CFT 10/03/05 11:23 0.025 0.000 0.025 1.725 CFT 10/03/05 12:23 0.120 0.000 0.025 1.625 CFT 10/03/05 22:54 0.025 0.000 0.025 1.625 CFT 11/03/05 09:25 0.025 0.000 0.025 1.425 CFT 11/03/05 11:25 0.110 0.070 0.050 1.820 CFT 11/03/05 20:32 0.060 0.000 0.025 2.025 CFT 12/03/05 07:03 0.025 0.000 0.025 1.425 CFT 27/03/05 12:43 0.080 0.000 0.025 0.525 CFT 27/03/05 21:46 0.090 0.000 0.025 0.525 CFT 28/03/05 06:46 0.080 0.000 0.025 0.525 CFT 28/03/05 17:55 0.070 0.000 0.025 2.825 CFT 28/03/05 23:56 0.025 0.000 0.025 2.125 CFT 29/03/05 05:56 0.025 0.000 0.025 2.625
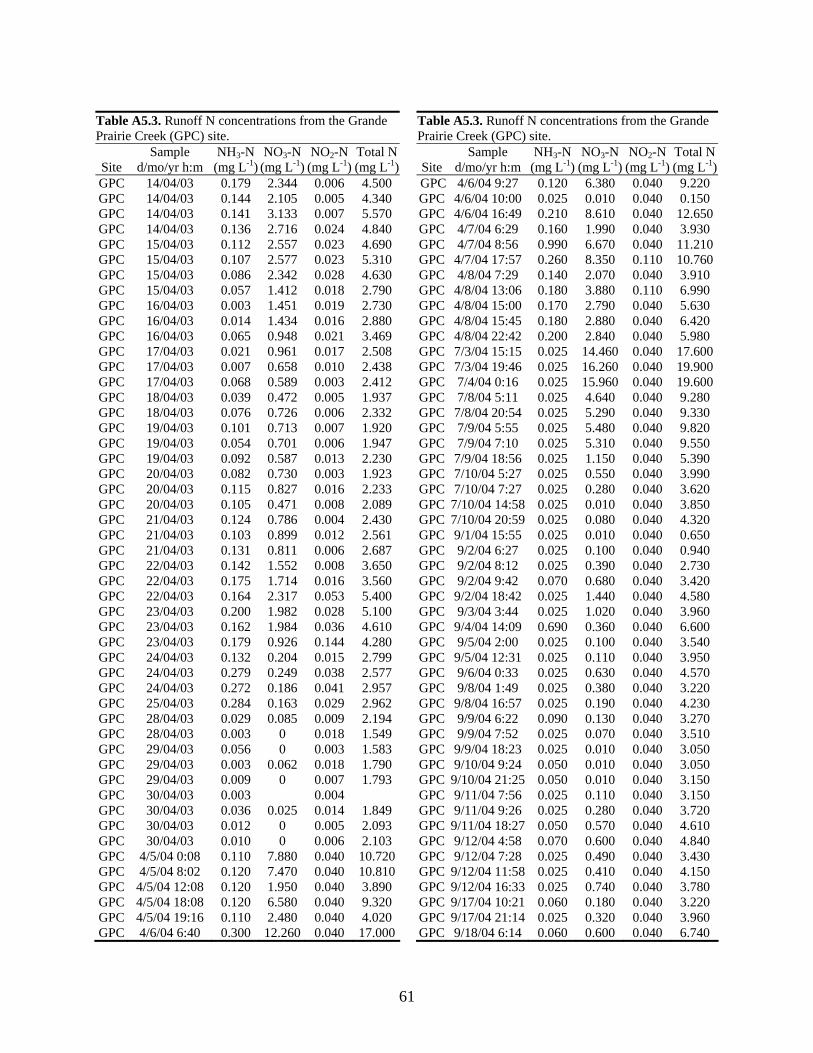
61
Table A5.3. Runoff N concentrations from the Grande Prairie Creek (GPC) site.
Table A5.3. Runoff N concentrations from the Grande Prairie Creek (GPC) site.
Site Sample
d/mo/yr h:m NH3-N
(mg L-1) NO3-N
(mg L-1) NO2-N
(mg L-1)Total N(mg L-1)
Site
Sample d/mo/yr h:m
NH3-N (mg L-1)
NO3-N (mg L-1)
NO2-N(mg L-1)
Total N(mg L-1)
GPC 14/04/03 0.179 2.344 0.006 4.500 GPC 4/6/04 9:27 0.120 6.380 0.040 9.220 GPC 14/04/03 0.144 2.105 0.005 4.340 GPC 4/6/04 10:00 0.025 0.010 0.040 0.150 GPC 14/04/03 0.141 3.133 0.007 5.570 GPC 4/6/04 16:49 0.210 8.610 0.040 12.650GPC 14/04/03 0.136 2.716 0.024 4.840 GPC 4/7/04 6:29 0.160 1.990 0.040 3.930 GPC 15/04/03 0.112 2.557 0.023 4.690 GPC 4/7/04 8:56 0.990 6.670 0.040 11.210GPC 15/04/03 0.107 2.577 0.023 5.310 GPC 4/7/04 17:57 0.260 8.350 0.110 10.760GPC 15/04/03 0.086 2.342 0.028 4.630 GPC 4/8/04 7:29 0.140 2.070 0.040 3.910 GPC 15/04/03 0.057 1.412 0.018 2.790 GPC 4/8/04 13:06 0.180 3.880 0.110 6.990 GPC 16/04/03 0.003 1.451 0.019 2.730 GPC 4/8/04 15:00 0.170 2.790 0.040 5.630 GPC 16/04/03 0.014 1.434 0.016 2.880 GPC 4/8/04 15:45 0.180 2.880 0.040 6.420 GPC 16/04/03 0.065 0.948 0.021 3.469 GPC 4/8/04 22:42 0.200 2.840 0.040 5.980 GPC 17/04/03 0.021 0.961 0.017 2.508 GPC 7/3/04 15:15 0.025 14.460 0.040 17.600GPC 17/04/03 0.007 0.658 0.010 2.438 GPC 7/3/04 19:46 0.025 16.260 0.040 19.900GPC 17/04/03 0.068 0.589 0.003 2.412 GPC 7/4/04 0:16 0.025 15.960 0.040 19.600GPC 18/04/03 0.039 0.472 0.005 1.937 GPC 7/8/04 5:11 0.025 4.640 0.040 9.280 GPC 18/04/03 0.076 0.726 0.006 2.332 GPC 7/8/04 20:54 0.025 5.290 0.040 9.330 GPC 19/04/03 0.101 0.713 0.007 1.920 GPC 7/9/04 5:55 0.025 5.480 0.040 9.820 GPC 19/04/03 0.054 0.701 0.006 1.947 GPC 7/9/04 7:10 0.025 5.310 0.040 9.550 GPC 19/04/03 0.092 0.587 0.013 2.230 GPC 7/9/04 18:56 0.025 1.150 0.040 5.390 GPC 20/04/03 0.082 0.730 0.003 1.923 GPC 7/10/04 5:27 0.025 0.550 0.040 3.990 GPC 20/04/03 0.115 0.827 0.016 2.233 GPC 7/10/04 7:27 0.025 0.280 0.040 3.620 GPC 20/04/03 0.105 0.471 0.008 2.089 GPC 7/10/04 14:58 0.025 0.010 0.040 3.850 GPC 21/04/03 0.124 0.786 0.004 2.430 GPC 7/10/04 20:59 0.025 0.080 0.040 4.320 GPC 21/04/03 0.103 0.899 0.012 2.561 GPC 9/1/04 15:55 0.025 0.010 0.040 0.650 GPC 21/04/03 0.131 0.811 0.006 2.687 GPC 9/2/04 6:27 0.025 0.100 0.040 0.940 GPC 22/04/03 0.142 1.552 0.008 3.650 GPC 9/2/04 8:12 0.025 0.390 0.040 2.730 GPC 22/04/03 0.175 1.714 0.016 3.560 GPC 9/2/04 9:42 0.070 0.680 0.040 3.420 GPC 22/04/03 0.164 2.317 0.053 5.400 GPC 9/2/04 18:42 0.025 1.440 0.040 4.580 GPC 23/04/03 0.200 1.982 0.028 5.100 GPC 9/3/04 3:44 0.025 1.020 0.040 3.960 GPC 23/04/03 0.162 1.984 0.036 4.610 GPC 9/4/04 14:09 0.690 0.360 0.040 6.600 GPC 23/04/03 0.179 0.926 0.144 4.280 GPC 9/5/04 2:00 0.025 0.100 0.040 3.540 GPC 24/04/03 0.132 0.204 0.015 2.799 GPC 9/5/04 12:31 0.025 0.110 0.040 3.950 GPC 24/04/03 0.279 0.249 0.038 2.577 GPC 9/6/04 0:33 0.025 0.630 0.040 4.570 GPC 24/04/03 0.272 0.186 0.041 2.957 GPC 9/8/04 1:49 0.025 0.380 0.040 3.220 GPC 25/04/03 0.284 0.163 0.029 2.962 GPC 9/8/04 16:57 0.025 0.190 0.040 4.230 GPC 28/04/03 0.029 0.085 0.009 2.194 GPC 9/9/04 6:22 0.090 0.130 0.040 3.270 GPC 28/04/03 0.003 0 0.018 1.549 GPC 9/9/04 7:52 0.025 0.070 0.040 3.510 GPC 29/04/03 0.056 0 0.003 1.583 GPC 9/9/04 18:23 0.025 0.010 0.040 3.050 GPC 29/04/03 0.003 0.062 0.018 1.790 GPC 9/10/04 9:24 0.050 0.010 0.040 3.050 GPC 29/04/03 0.009 0 0.007 1.793 GPC 9/10/04 21:25 0.050 0.010 0.040 3.150 GPC 30/04/03 0.003 0.004 GPC 9/11/04 7:56 0.025 0.110 0.040 3.150 GPC 30/04/03 0.036 0.025 0.014 1.849 GPC 9/11/04 9:26 0.025 0.280 0.040 3.720 GPC 30/04/03 0.012 0 0.005 2.093 GPC 9/11/04 18:27 0.050 0.570 0.040 4.610 GPC 30/04/03 0.010 0 0.006 2.103 GPC 9/12/04 4:58 0.070 0.600 0.040 4.840 GPC 4/5/04 0:08 0.110 7.880 0.040 10.720 GPC 9/12/04 7:28 0.025 0.490 0.040 3.430 GPC 4/5/04 8:02 0.120 7.470 0.040 10.810 GPC 9/12/04 11:58 0.025 0.410 0.040 4.150 GPC 4/5/04 12:08 0.120 1.950 0.040 3.890 GPC 9/12/04 16:33 0.025 0.740 0.040 3.780 GPC 4/5/04 18:08 0.120 6.580 0.040 9.320 GPC 9/17/04 10:21 0.060 0.180 0.040 3.220 GPC 4/5/04 19:16 0.110 2.480 0.040 4.020 GPC 9/17/04 21:14 0.025 0.320 0.040 3.960 GPC 4/6/04 6:40 0.300 12.260 0.040 17.000 GPC 9/18/04 6:14 0.060 0.600 0.040 6.740
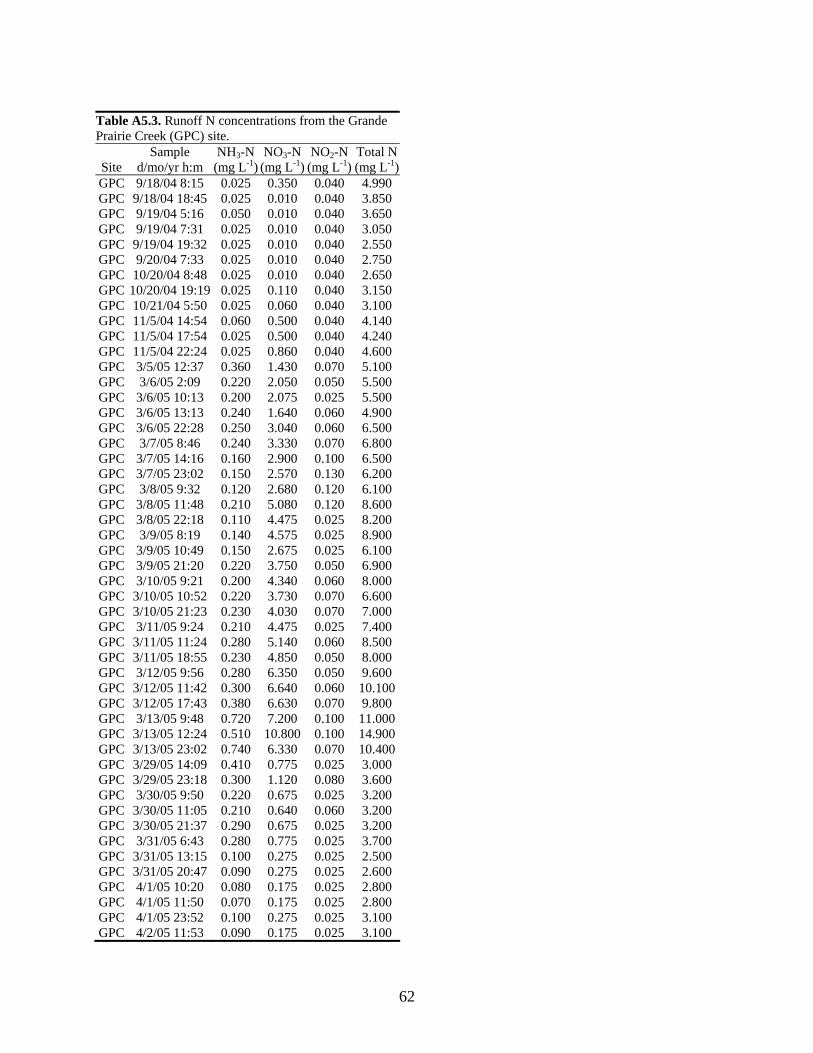
62
Table A5.3. Runoff N concentrations from the Grande Prairie Creek (GPC) site.
Site Sample
d/mo/yr h:m NH3-N
(mg L-1) NO3-N
(mg L-1) NO2-N
(mg L-1)Total N(mg L-1)
GPC 9/18/04 8:15 0.025 0.350 0.040 4.990 GPC 9/18/04 18:45 0.025 0.010 0.040 3.850 GPC 9/19/04 5:16 0.050 0.010 0.040 3.650 GPC 9/19/04 7:31 0.025 0.010 0.040 3.050 GPC 9/19/04 19:32 0.025 0.010 0.040 2.550 GPC 9/20/04 7:33 0.025 0.010 0.040 2.750 GPC 10/20/04 8:48 0.025 0.010 0.040 2.650 GPC 10/20/04 19:19 0.025 0.110 0.040 3.150 GPC 10/21/04 5:50 0.025 0.060 0.040 3.100 GPC 11/5/04 14:54 0.060 0.500 0.040 4.140 GPC 11/5/04 17:54 0.025 0.500 0.040 4.240 GPC 11/5/04 22:24 0.025 0.860 0.040 4.600 GPC 3/5/05 12:37 0.360 1.430 0.070 5.100 GPC 3/6/05 2:09 0.220 2.050 0.050 5.500 GPC 3/6/05 10:13 0.200 2.075 0.025 5.500 GPC 3/6/05 13:13 0.240 1.640 0.060 4.900 GPC 3/6/05 22:28 0.250 3.040 0.060 6.500 GPC 3/7/05 8:46 0.240 3.330 0.070 6.800 GPC 3/7/05 14:16 0.160 2.900 0.100 6.500 GPC 3/7/05 23:02 0.150 2.570 0.130 6.200 GPC 3/8/05 9:32 0.120 2.680 0.120 6.100 GPC 3/8/05 11:48 0.210 5.080 0.120 8.600 GPC 3/8/05 22:18 0.110 4.475 0.025 8.200 GPC 3/9/05 8:19 0.140 4.575 0.025 8.900 GPC 3/9/05 10:49 0.150 2.675 0.025 6.100 GPC 3/9/05 21:20 0.220 3.750 0.050 6.900 GPC 3/10/05 9:21 0.200 4.340 0.060 8.000 GPC 3/10/05 10:52 0.220 3.730 0.070 6.600 GPC 3/10/05 21:23 0.230 4.030 0.070 7.000 GPC 3/11/05 9:24 0.210 4.475 0.025 7.400 GPC 3/11/05 11:24 0.280 5.140 0.060 8.500 GPC 3/11/05 18:55 0.230 4.850 0.050 8.000 GPC 3/12/05 9:56 0.280 6.350 0.050 9.600 GPC 3/12/05 11:42 0.300 6.640 0.060 10.100 GPC 3/12/05 17:43 0.380 6.630 0.070 9.800 GPC 3/13/05 9:48 0.720 7.200 0.100 11.000 GPC 3/13/05 12:24 0.510 10.800 0.100 14.900 GPC 3/13/05 23:02 0.740 6.330 0.070 10.400 GPC 3/29/05 14:09 0.410 0.775 0.025 3.000 GPC 3/29/05 23:18 0.300 1.120 0.080 3.600 GPC 3/30/05 9:50 0.220 0.675 0.025 3.200 GPC 3/30/05 11:05 0.210 0.640 0.060 3.200 GPC 3/30/05 21:37 0.290 0.675 0.025 3.200 GPC 3/31/05 6:43 0.280 0.775 0.025 3.700 GPC 3/31/05 13:15 0.100 0.275 0.025 2.500 GPC 3/31/05 20:47 0.090 0.275 0.025 2.600 GPC 4/1/05 10:20 0.080 0.175 0.025 2.800 GPC 4/1/05 11:50 0.070 0.175 0.025 2.800 GPC 4/1/05 23:52 0.100 0.275 0.025 3.100 GPC 4/2/05 11:53 0.090 0.175 0.025 3.100
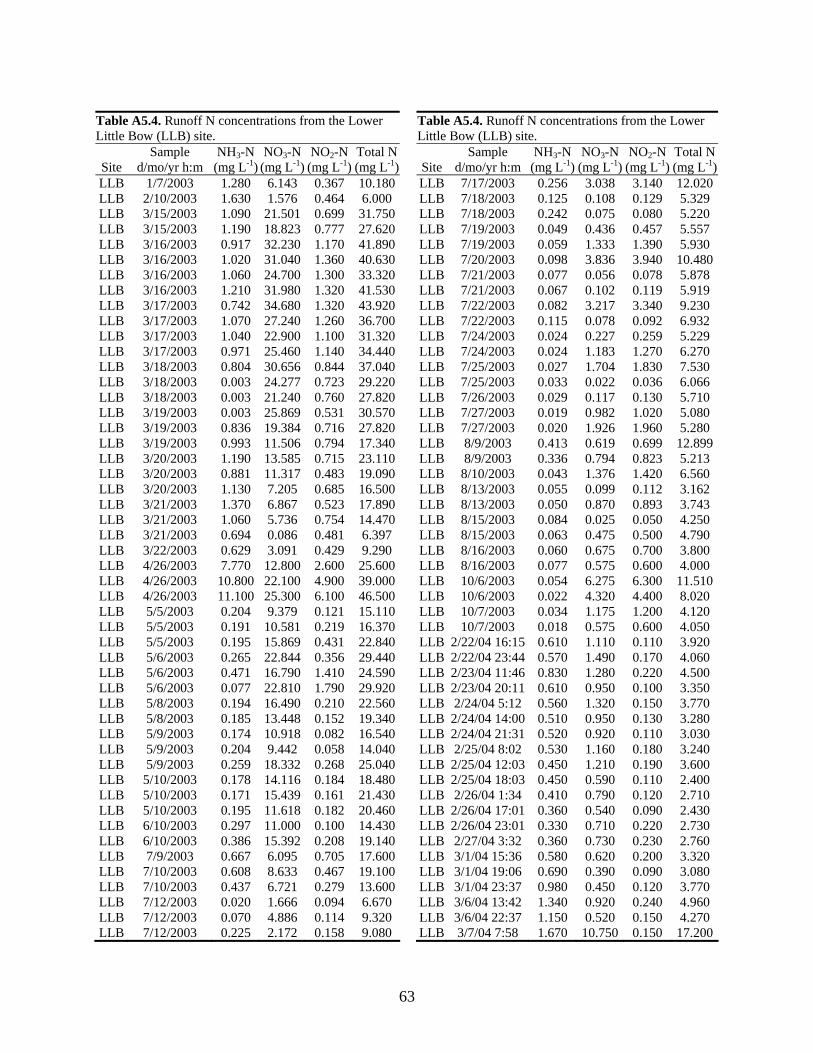
63
Table A5.4. Runoff N concentrations from the Lower Little Bow (LLB) site.
Table A5.4. Runoff N concentrations from the Lower Little Bow (LLB) site.
Site Sample
d/mo/yr h:m NH3-N
(mg L-1) NO3-N
(mg L-1) NO2-N
(mg L-1)Total N(mg L-1)
Site
Sample d/mo/yr h:m
NH3-N (mg L-1)
NO3-N (mg L-1)
NO2-N(mg L-1)
Total N(mg L-1)
LLB 1/7/2003 1.280 6.143 0.367 10.180 LLB 7/17/2003 0.256 3.038 3.140 12.020LLB 2/10/2003 1.630 1.576 0.464 6.000 LLB 7/18/2003 0.125 0.108 0.129 5.329 LLB 3/15/2003 1.090 21.501 0.699 31.750 LLB 7/18/2003 0.242 0.075 0.080 5.220 LLB 3/15/2003 1.190 18.823 0.777 27.620 LLB 7/19/2003 0.049 0.436 0.457 5.557 LLB 3/16/2003 0.917 32.230 1.170 41.890 LLB 7/19/2003 0.059 1.333 1.390 5.930 LLB 3/16/2003 1.020 31.040 1.360 40.630 LLB 7/20/2003 0.098 3.836 3.940 10.480LLB 3/16/2003 1.060 24.700 1.300 33.320 LLB 7/21/2003 0.077 0.056 0.078 5.878 LLB 3/16/2003 1.210 31.980 1.320 41.530 LLB 7/21/2003 0.067 0.102 0.119 5.919 LLB 3/17/2003 0.742 34.680 1.320 43.920 LLB 7/22/2003 0.082 3.217 3.340 9.230 LLB 3/17/2003 1.070 27.240 1.260 36.700 LLB 7/22/2003 0.115 0.078 0.092 6.932 LLB 3/17/2003 1.040 22.900 1.100 31.320 LLB 7/24/2003 0.024 0.227 0.259 5.229 LLB 3/17/2003 0.971 25.460 1.140 34.440 LLB 7/24/2003 0.024 1.183 1.270 6.270 LLB 3/18/2003 0.804 30.656 0.844 37.040 LLB 7/25/2003 0.027 1.704 1.830 7.530 LLB 3/18/2003 0.003 24.277 0.723 29.220 LLB 7/25/2003 0.033 0.022 0.036 6.066 LLB 3/18/2003 0.003 21.240 0.760 27.820 LLB 7/26/2003 0.029 0.117 0.130 5.710 LLB 3/19/2003 0.003 25.869 0.531 30.570 LLB 7/27/2003 0.019 0.982 1.020 5.080 LLB 3/19/2003 0.836 19.384 0.716 27.820 LLB 7/27/2003 0.020 1.926 1.960 5.280 LLB 3/19/2003 0.993 11.506 0.794 17.340 LLB 8/9/2003 0.413 0.619 0.699 12.899LLB 3/20/2003 1.190 13.585 0.715 23.110 LLB 8/9/2003 0.336 0.794 0.823 5.213 LLB 3/20/2003 0.881 11.317 0.483 19.090 LLB 8/10/2003 0.043 1.376 1.420 6.560 LLB 3/20/2003 1.130 7.205 0.685 16.500 LLB 8/13/2003 0.055 0.099 0.112 3.162 LLB 3/21/2003 1.370 6.867 0.523 17.890 LLB 8/13/2003 0.050 0.870 0.893 3.743 LLB 3/21/2003 1.060 5.736 0.754 14.470 LLB 8/15/2003 0.084 0.025 0.050 4.250 LLB 3/21/2003 0.694 0.086 0.481 6.397 LLB 8/15/2003 0.063 0.475 0.500 4.790 LLB 3/22/2003 0.629 3.091 0.429 9.290 LLB 8/16/2003 0.060 0.675 0.700 3.800 LLB 4/26/2003 7.770 12.800 2.600 25.600 LLB 8/16/2003 0.077 0.575 0.600 4.000 LLB 4/26/2003 10.800 22.100 4.900 39.000 LLB 10/6/2003 0.054 6.275 6.300 11.510LLB 4/26/2003 11.100 25.300 6.100 46.500 LLB 10/6/2003 0.022 4.320 4.400 8.020 LLB 5/5/2003 0.204 9.379 0.121 15.110 LLB 10/7/2003 0.034 1.175 1.200 4.120 LLB 5/5/2003 0.191 10.581 0.219 16.370 LLB 10/7/2003 0.018 0.575 0.600 4.050 LLB 5/5/2003 0.195 15.869 0.431 22.840 LLB 2/22/04 16:15 0.610 1.110 0.110 3.920 LLB 5/6/2003 0.265 22.844 0.356 29.440 LLB 2/22/04 23:44 0.570 1.490 0.170 4.060 LLB 5/6/2003 0.471 16.790 1.410 24.590 LLB 2/23/04 11:46 0.830 1.280 0.220 4.500 LLB 5/6/2003 0.077 22.810 1.790 29.920 LLB 2/23/04 20:11 0.610 0.950 0.100 3.350 LLB 5/8/2003 0.194 16.490 0.210 22.560 LLB 2/24/04 5:12 0.560 1.320 0.150 3.770 LLB 5/8/2003 0.185 13.448 0.152 19.340 LLB 2/24/04 14:00 0.510 0.950 0.130 3.280 LLB 5/9/2003 0.174 10.918 0.082 16.540 LLB 2/24/04 21:31 0.520 0.920 0.110 3.030 LLB 5/9/2003 0.204 9.442 0.058 14.040 LLB 2/25/04 8:02 0.530 1.160 0.180 3.240 LLB 5/9/2003 0.259 18.332 0.268 25.040 LLB 2/25/04 12:03 0.450 1.210 0.190 3.600 LLB 5/10/2003 0.178 14.116 0.184 18.480 LLB 2/25/04 18:03 0.450 0.590 0.110 2.400 LLB 5/10/2003 0.171 15.439 0.161 21.430 LLB 2/26/04 1:34 0.410 0.790 0.120 2.710 LLB 5/10/2003 0.195 11.618 0.182 20.460 LLB 2/26/04 17:01 0.360 0.540 0.090 2.430 LLB 6/10/2003 0.297 11.000 0.100 14.430 LLB 2/26/04 23:01 0.330 0.710 0.220 2.730 LLB 6/10/2003 0.386 15.392 0.208 19.140 LLB 2/27/04 3:32 0.360 0.730 0.230 2.760 LLB 7/9/2003 0.667 6.095 0.705 17.600 LLB 3/1/04 15:36 0.580 0.620 0.200 3.320 LLB 7/10/2003 0.608 8.633 0.467 19.100 LLB 3/1/04 19:06 0.690 0.390 0.090 3.080 LLB 7/10/2003 0.437 6.721 0.279 13.600 LLB 3/1/04 23:37 0.980 0.450 0.120 3.770 LLB 7/12/2003 0.020 1.666 0.094 6.670 LLB 3/6/04 13:42 1.340 0.920 0.240 4.960 LLB 7/12/2003 0.070 4.886 0.114 9.320 LLB 3/6/04 22:37 1.150 0.520 0.150 4.270 LLB 7/12/2003 0.225 2.172 0.158 9.080 LLB 3/7/04 7:58 1.670 10.750 0.150 17.200
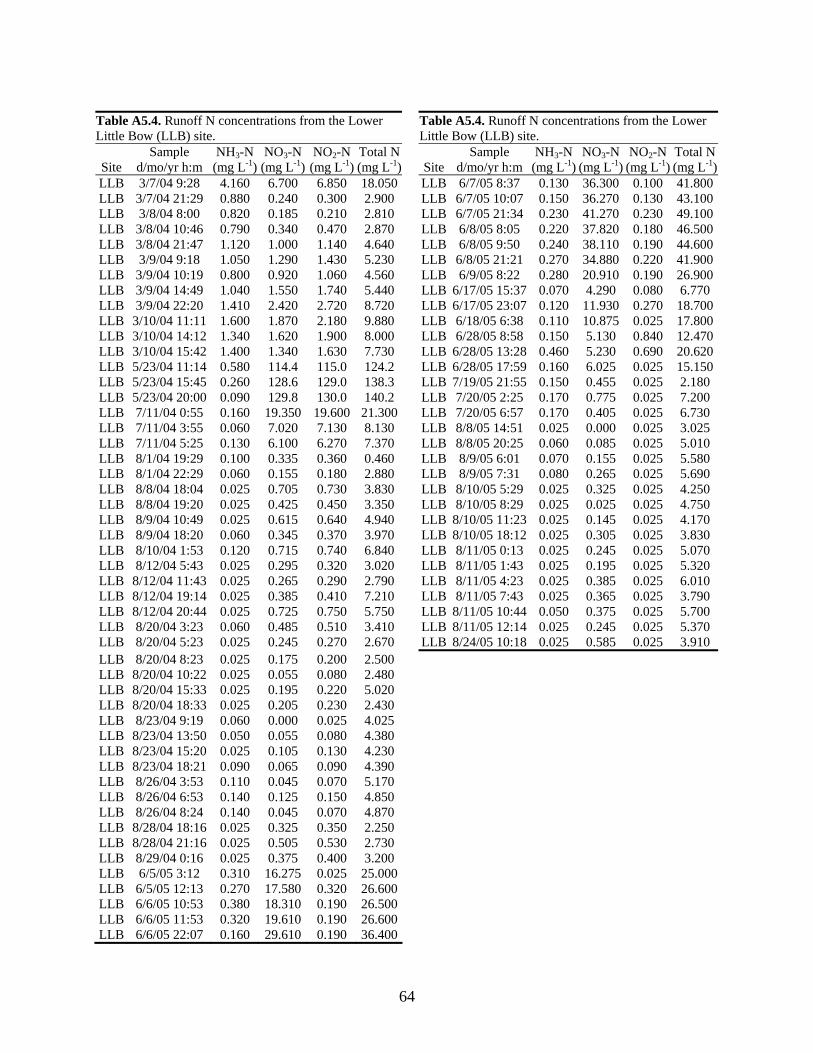
64
Table A5.4. Runoff N concentrations from the Lower Little Bow (LLB) site.
Table A5.4. Runoff N concentrations from the Lower Little Bow (LLB) site.
Site Sample
d/mo/yr h:m NH3-N
(mg L-1) NO3-N
(mg L-1) NO2-N
(mg L-1)Total N(mg L-1)
Site
Sample d/mo/yr h:m
NH3-N (mg L-1)
NO3-N (mg L-1)
NO2-N(mg L-1)
Total N(mg L-1)
LLB 3/7/04 9:28 4.160 6.700 6.850 18.050 LLB 6/7/05 8:37 0.130 36.300 0.100 41.800LLB 3/7/04 21:29 0.880 0.240 0.300 2.900 LLB 6/7/05 10:07 0.150 36.270 0.130 43.100LLB 3/8/04 8:00 0.820 0.185 0.210 2.810 LLB 6/7/05 21:34 0.230 41.270 0.230 49.100LLB 3/8/04 10:46 0.790 0.340 0.470 2.870 LLB 6/8/05 8:05 0.220 37.820 0.180 46.500LLB 3/8/04 21:47 1.120 1.000 1.140 4.640 LLB 6/8/05 9:50 0.240 38.110 0.190 44.600LLB 3/9/04 9:18 1.050 1.290 1.430 5.230 LLB 6/8/05 21:21 0.270 34.880 0.220 41.900LLB 3/9/04 10:19 0.800 0.920 1.060 4.560 LLB 6/9/05 8:22 0.280 20.910 0.190 26.900LLB 3/9/04 14:49 1.040 1.550 1.740 5.440 LLB 6/17/05 15:37 0.070 4.290 0.080 6.770 LLB 3/9/04 22:20 1.410 2.420 2.720 8.720 LLB 6/17/05 23:07 0.120 11.930 0.270 18.700LLB 3/10/04 11:11 1.600 1.870 2.180 9.880 LLB 6/18/05 6:38 0.110 10.875 0.025 17.800LLB 3/10/04 14:12 1.340 1.620 1.900 8.000 LLB 6/28/05 8:58 0.150 5.130 0.840 12.470LLB 3/10/04 15:42 1.400 1.340 1.630 7.730 LLB 6/28/05 13:28 0.460 5.230 0.690 20.620LLB 5/23/04 11:14 0.580 114.4 115.0 124.2 LLB 6/28/05 17:59 0.160 6.025 0.025 15.150LLB 5/23/04 15:45 0.260 128.6 129.0 138.3 LLB 7/19/05 21:55 0.150 0.455 0.025 2.180 LLB 5/23/04 20:00 0.090 129.8 130.0 140.2 LLB 7/20/05 2:25 0.170 0.775 0.025 7.200 LLB 7/11/04 0:55 0.160 19.350 19.600 21.300 LLB 7/20/05 6:57 0.170 0.405 0.025 6.730 LLB 7/11/04 3:55 0.060 7.020 7.130 8.130 LLB 8/8/05 14:51 0.025 0.000 0.025 3.025 LLB 7/11/04 5:25 0.130 6.100 6.270 7.370 LLB 8/8/05 20:25 0.060 0.085 0.025 5.010 LLB 8/1/04 19:29 0.100 0.335 0.360 0.460 LLB 8/9/05 6:01 0.070 0.155 0.025 5.580 LLB 8/1/04 22:29 0.060 0.155 0.180 2.880 LLB 8/9/05 7:31 0.080 0.265 0.025 5.690 LLB 8/8/04 18:04 0.025 0.705 0.730 3.830 LLB 8/10/05 5:29 0.025 0.325 0.025 4.250 LLB 8/8/04 19:20 0.025 0.425 0.450 3.350 LLB 8/10/05 8:29 0.025 0.025 0.025 4.750 LLB 8/9/04 10:49 0.025 0.615 0.640 4.940 LLB 8/10/05 11:23 0.025 0.145 0.025 4.170 LLB 8/9/04 18:20 0.060 0.345 0.370 3.970 LLB 8/10/05 18:12 0.025 0.305 0.025 3.830 LLB 8/10/04 1:53 0.120 0.715 0.740 6.840 LLB 8/11/05 0:13 0.025 0.245 0.025 5.070 LLB 8/12/04 5:43 0.025 0.295 0.320 3.020 LLB 8/11/05 1:43 0.025 0.195 0.025 5.320 LLB 8/12/04 11:43 0.025 0.265 0.290 2.790 LLB 8/11/05 4:23 0.025 0.385 0.025 6.010 LLB 8/12/04 19:14 0.025 0.385 0.410 7.210 LLB 8/11/05 7:43 0.025 0.365 0.025 3.790 LLB 8/12/04 20:44 0.025 0.725 0.750 5.750 LLB 8/11/05 10:44 0.050 0.375 0.025 5.700 LLB 8/20/04 3:23 0.060 0.485 0.510 3.410 LLB 8/11/05 12:14 0.025 0.245 0.025 5.370 LLB 8/20/04 5:23 0.025 0.245 0.270 2.670 LLB 8/24/05 10:18 0.025 0.585 0.025 3.910 LLB 8/20/04 8:23 0.025 0.175 0.200 2.500 LLB 8/20/04 10:22 0.025 0.055 0.080 2.480 LLB 8/20/04 15:33 0.025 0.195 0.220 5.020 LLB 8/20/04 18:33 0.025 0.205 0.230 2.430 LLB 8/23/04 9:19 0.060 0.000 0.025 4.025 LLB 8/23/04 13:50 0.050 0.055 0.080 4.380 LLB 8/23/04 15:20 0.025 0.105 0.130 4.230 LLB 8/23/04 18:21 0.090 0.065 0.090 4.390 LLB 8/26/04 3:53 0.110 0.045 0.070 5.170 LLB 8/26/04 6:53 0.140 0.125 0.150 4.850 LLB 8/26/04 8:24 0.140 0.045 0.070 4.870 LLB 8/28/04 18:16 0.025 0.325 0.350 2.250 LLB 8/28/04 21:16 0.025 0.505 0.530 2.730 LLB 8/29/04 0:16 0.025 0.375 0.400 3.200 LLB 6/5/05 3:12 0.310 16.275 0.025 25.000 LLB 6/5/05 12:13 0.270 17.580 0.320 26.600 LLB 6/6/05 10:53 0.380 18.310 0.190 26.500 LLB 6/6/05 11:53 0.320 19.610 0.190 26.600 LLB 6/6/05 22:07 0.160 29.610 0.190 36.400
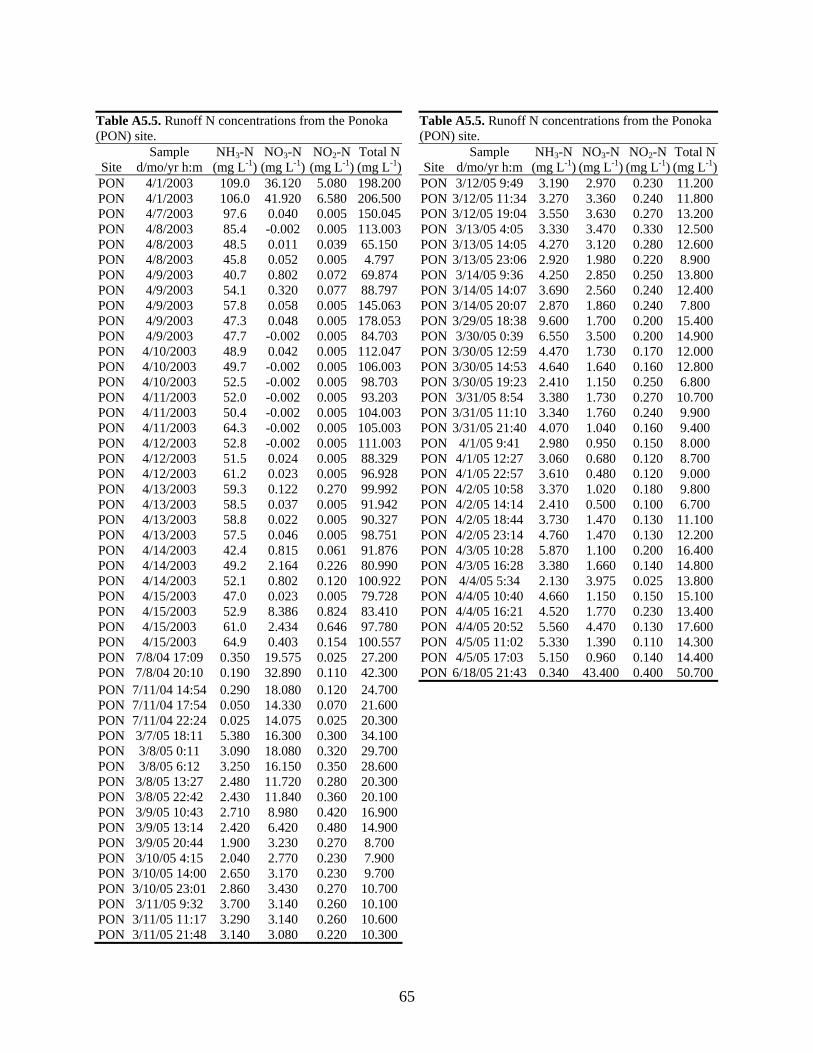
65
Table A5.5. Runoff N concentrations from the Ponoka (PON) site.
Table A5.5. Runoff N concentrations from the Ponoka (PON) site.
Site Sample
d/mo/yr h:m NH3-N
(mg L-1) NO3-N
(mg L-1) NO2-N
(mg L-1)Total N(mg L-1)
Site
Sample d/mo/yr h:m
NH3-N (mg L-1)
NO3-N (mg L-1)
NO2-N(mg L-1)
Total N(mg L-1)
PON 4/1/2003 109.0 36.120 5.080 198.200 PON 3/12/05 9:49 3.190 2.970 0.230 11.200PON 4/1/2003 106.0 41.920 6.580 206.500 PON 3/12/05 11:34 3.270 3.360 0.240 11.800PON 4/7/2003 97.6 0.040 0.005 150.045 PON 3/12/05 19:04 3.550 3.630 0.270 13.200PON 4/8/2003 85.4 -0.002 0.005 113.003 PON 3/13/05 4:05 3.330 3.470 0.330 12.500PON 4/8/2003 48.5 0.011 0.039 65.150 PON 3/13/05 14:05 4.270 3.120 0.280 12.600PON 4/8/2003 45.8 0.052 0.005 4.797 PON 3/13/05 23:06 2.920 1.980 0.220 8.900 PON 4/9/2003 40.7 0.802 0.072 69.874 PON 3/14/05 9:36 4.250 2.850 0.250 13.800PON 4/9/2003 54.1 0.320 0.077 88.797 PON 3/14/05 14:07 3.690 2.560 0.240 12.400PON 4/9/2003 57.8 0.058 0.005 145.063 PON 3/14/05 20:07 2.870 1.860 0.240 7.800 PON 4/9/2003 47.3 0.048 0.005 178.053 PON 3/29/05 18:38 9.600 1.700 0.200 15.400PON 4/9/2003 47.7 -0.002 0.005 84.703 PON 3/30/05 0:39 6.550 3.500 0.200 14.900PON 4/10/2003 48.9 0.042 0.005 112.047 PON 3/30/05 12:59 4.470 1.730 0.170 12.000PON 4/10/2003 49.7 -0.002 0.005 106.003 PON 3/30/05 14:53 4.640 1.640 0.160 12.800PON 4/10/2003 52.5 -0.002 0.005 98.703 PON 3/30/05 19:23 2.410 1.150 0.250 6.800 PON 4/11/2003 52.0 -0.002 0.005 93.203 PON 3/31/05 8:54 3.380 1.730 0.270 10.700PON 4/11/2003 50.4 -0.002 0.005 104.003 PON 3/31/05 11:10 3.340 1.760 0.240 9.900 PON 4/11/2003 64.3 -0.002 0.005 105.003 PON 3/31/05 21:40 4.070 1.040 0.160 9.400 PON 4/12/2003 52.8 -0.002 0.005 111.003 PON 4/1/05 9:41 2.980 0.950 0.150 8.000 PON 4/12/2003 51.5 0.024 0.005 88.329 PON 4/1/05 12:27 3.060 0.680 0.120 8.700 PON 4/12/2003 61.2 0.023 0.005 96.928 PON 4/1/05 22:57 3.610 0.480 0.120 9.000 PON 4/13/2003 59.3 0.122 0.270 99.992 PON 4/2/05 10:58 3.370 1.020 0.180 9.800 PON 4/13/2003 58.5 0.037 0.005 91.942 PON 4/2/05 14:14 2.410 0.500 0.100 6.700 PON 4/13/2003 58.8 0.022 0.005 90.327 PON 4/2/05 18:44 3.730 1.470 0.130 11.100PON 4/13/2003 57.5 0.046 0.005 98.751 PON 4/2/05 23:14 4.760 1.470 0.130 12.200PON 4/14/2003 42.4 0.815 0.061 91.876 PON 4/3/05 10:28 5.870 1.100 0.200 16.400PON 4/14/2003 49.2 2.164 0.226 80.990 PON 4/3/05 16:28 3.380 1.660 0.140 14.800PON 4/14/2003 52.1 0.802 0.120 100.922 PON 4/4/05 5:34 2.130 3.975 0.025 13.800PON 4/15/2003 47.0 0.023 0.005 79.728 PON 4/4/05 10:40 4.660 1.150 0.150 15.100PON 4/15/2003 52.9 8.386 0.824 83.410 PON 4/4/05 16:21 4.520 1.770 0.230 13.400PON 4/15/2003 61.0 2.434 0.646 97.780 PON 4/4/05 20:52 5.560 4.470 0.130 17.600PON 4/15/2003 64.9 0.403 0.154 100.557 PON 4/5/05 11:02 5.330 1.390 0.110 14.300PON 7/8/04 17:09 0.350 19.575 0.025 27.200 PON 4/5/05 17:03 5.150 0.960 0.140 14.400PON 7/8/04 20:10 0.190 32.890 0.110 42.300 PON 6/18/05 21:43 0.340 43.400 0.400 50.700PON 7/11/04 14:54 0.290 18.080 0.120 24.700 PON 7/11/04 17:54 0.050 14.330 0.070 21.600 PON 7/11/04 22:24 0.025 14.075 0.025 20.300 PON 3/7/05 18:11 5.380 16.300 0.300 34.100 PON 3/8/05 0:11 3.090 18.080 0.320 29.700 PON 3/8/05 6:12 3.250 16.150 0.350 28.600 PON 3/8/05 13:27 2.480 11.720 0.280 20.300 PON 3/8/05 22:42 2.430 11.840 0.360 20.100 PON 3/9/05 10:43 2.710 8.980 0.420 16.900 PON 3/9/05 13:14 2.420 6.420 0.480 14.900 PON 3/9/05 20:44 1.900 3.230 0.270 8.700 PON 3/10/05 4:15 2.040 2.770 0.230 7.900 PON 3/10/05 14:00 2.650 3.170 0.230 9.700 PON 3/10/05 23:01 2.860 3.430 0.270 10.700 PON 3/11/05 9:32 3.700 3.140 0.260 10.100 PON 3/11/05 11:17 3.290 3.140 0.260 10.600 PON 3/11/05 21:48 3.140 3.080 0.220 10.300
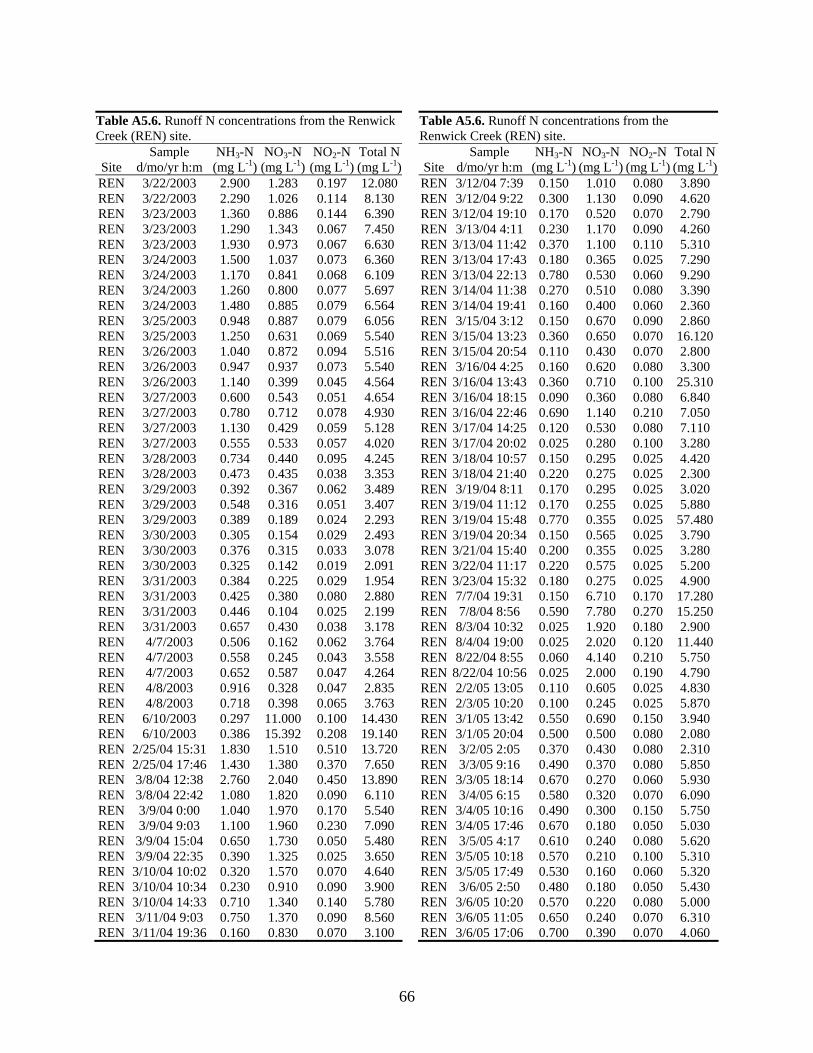
66
Table A5.6. Runoff N concentrations from the Renwick Creek (REN) site.
Table A5.6. Runoff N concentrations from the Renwick Creek (REN) site.
Site Sample
d/mo/yr h:m NH3-N
(mg L-1) NO3-N
(mg L-1) NO2-N
(mg L-1)Total N(mg L-1)
Site
Sample d/mo/yr h:m
NH3-N (mg L-1)
NO3-N (mg L-1)
NO2-N(mg L-1)
Total N(mg L-1)
REN 3/22/2003 2.900 1.283 0.197 12.080 REN 3/12/04 7:39 0.150 1.010 0.080 3.890 REN 3/22/2003 2.290 1.026 0.114 8.130 REN 3/12/04 9:22 0.300 1.130 0.090 4.620 REN 3/23/2003 1.360 0.886 0.144 6.390 REN 3/12/04 19:10 0.170 0.520 0.070 2.790 REN 3/23/2003 1.290 1.343 0.067 7.450 REN 3/13/04 4:11 0.230 1.170 0.090 4.260 REN 3/23/2003 1.930 0.973 0.067 6.630 REN 3/13/04 11:42 0.370 1.100 0.110 5.310 REN 3/24/2003 1.500 1.037 0.073 6.360 REN 3/13/04 17:43 0.180 0.365 0.025 7.290 REN 3/24/2003 1.170 0.841 0.068 6.109 REN 3/13/04 22:13 0.780 0.530 0.060 9.290 REN 3/24/2003 1.260 0.800 0.077 5.697 REN 3/14/04 11:38 0.270 0.510 0.080 3.390 REN 3/24/2003 1.480 0.885 0.079 6.564 REN 3/14/04 19:41 0.160 0.400 0.060 2.360 REN 3/25/2003 0.948 0.887 0.079 6.056 REN 3/15/04 3:12 0.150 0.670 0.090 2.860 REN 3/25/2003 1.250 0.631 0.069 5.540 REN 3/15/04 13:23 0.360 0.650 0.070 16.120REN 3/26/2003 1.040 0.872 0.094 5.516 REN 3/15/04 20:54 0.110 0.430 0.070 2.800 REN 3/26/2003 0.947 0.937 0.073 5.540 REN 3/16/04 4:25 0.160 0.620 0.080 3.300 REN 3/26/2003 1.140 0.399 0.045 4.564 REN 3/16/04 13:43 0.360 0.710 0.100 25.310REN 3/27/2003 0.600 0.543 0.051 4.654 REN 3/16/04 18:15 0.090 0.360 0.080 6.840 REN 3/27/2003 0.780 0.712 0.078 4.930 REN 3/16/04 22:46 0.690 1.140 0.210 7.050 REN 3/27/2003 1.130 0.429 0.059 5.128 REN 3/17/04 14:25 0.120 0.530 0.080 7.110 REN 3/27/2003 0.555 0.533 0.057 4.020 REN 3/17/04 20:02 0.025 0.280 0.100 3.280 REN 3/28/2003 0.734 0.440 0.095 4.245 REN 3/18/04 10:57 0.150 0.295 0.025 4.420 REN 3/28/2003 0.473 0.435 0.038 3.353 REN 3/18/04 21:40 0.220 0.275 0.025 2.300 REN 3/29/2003 0.392 0.367 0.062 3.489 REN 3/19/04 8:11 0.170 0.295 0.025 3.020 REN 3/29/2003 0.548 0.316 0.051 3.407 REN 3/19/04 11:12 0.170 0.255 0.025 5.880 REN 3/29/2003 0.389 0.189 0.024 2.293 REN 3/19/04 15:48 0.770 0.355 0.025 57.480REN 3/30/2003 0.305 0.154 0.029 2.493 REN 3/19/04 20:34 0.150 0.565 0.025 3.790 REN 3/30/2003 0.376 0.315 0.033 3.078 REN 3/21/04 15:40 0.200 0.355 0.025 3.280 REN 3/30/2003 0.325 0.142 0.019 2.091 REN 3/22/04 11:17 0.220 0.575 0.025 5.200 REN 3/31/2003 0.384 0.225 0.029 1.954 REN 3/23/04 15:32 0.180 0.275 0.025 4.900 REN 3/31/2003 0.425 0.380 0.080 2.880 REN 7/7/04 19:31 0.150 6.710 0.170 17.280REN 3/31/2003 0.446 0.104 0.025 2.199 REN 7/8/04 8:56 0.590 7.780 0.270 15.250REN 3/31/2003 0.657 0.430 0.038 3.178 REN 8/3/04 10:32 0.025 1.920 0.180 2.900 REN 4/7/2003 0.506 0.162 0.062 3.764 REN 8/4/04 19:00 0.025 2.020 0.120 11.440REN 4/7/2003 0.558 0.245 0.043 3.558 REN 8/22/04 8:55 0.060 4.140 0.210 5.750 REN 4/7/2003 0.652 0.587 0.047 4.264 REN 8/22/04 10:56 0.025 2.000 0.190 4.790 REN 4/8/2003 0.916 0.328 0.047 2.835 REN 2/2/05 13:05 0.110 0.605 0.025 4.830 REN 4/8/2003 0.718 0.398 0.065 3.763 REN 2/3/05 10:20 0.100 0.245 0.025 5.870 REN 6/10/2003 0.297 11.000 0.100 14.430 REN 3/1/05 13:42 0.550 0.690 0.150 3.940 REN 6/10/2003 0.386 15.392 0.208 19.140 REN 3/1/05 20:04 0.500 0.500 0.080 2.080 REN 2/25/04 15:31 1.830 1.510 0.510 13.720 REN 3/2/05 2:05 0.370 0.430 0.080 2.310 REN 2/25/04 17:46 1.430 1.380 0.370 7.650 REN 3/3/05 9:16 0.490 0.370 0.080 5.850 REN 3/8/04 12:38 2.760 2.040 0.450 13.890 REN 3/3/05 18:14 0.670 0.270 0.060 5.930 REN 3/8/04 22:42 1.080 1.820 0.090 6.110 REN 3/4/05 6:15 0.580 0.320 0.070 6.090 REN 3/9/04 0:00 1.040 1.970 0.170 5.540 REN 3/4/05 10:16 0.490 0.300 0.150 5.750 REN 3/9/04 9:03 1.100 1.960 0.230 7.090 REN 3/4/05 17:46 0.670 0.180 0.050 5.030 REN 3/9/04 15:04 0.650 1.730 0.050 5.480 REN 3/5/05 4:17 0.610 0.240 0.080 5.620 REN 3/9/04 22:35 0.390 1.325 0.025 3.650 REN 3/5/05 10:18 0.570 0.210 0.100 5.310 REN 3/10/04 10:02 0.320 1.570 0.070 4.640 REN 3/5/05 17:49 0.530 0.160 0.060 5.320 REN 3/10/04 10:34 0.230 0.910 0.090 3.900 REN 3/6/05 2:50 0.480 0.180 0.050 5.430 REN 3/10/04 14:33 0.710 1.340 0.140 5.780 REN 3/6/05 10:20 0.570 0.220 0.080 5.000 REN 3/11/04 9:03 0.750 1.370 0.090 8.560 REN 3/6/05 11:05 0.650 0.240 0.070 6.310 REN 3/11/04 19:36 0.160 0.830 0.070 3.100 REN 3/6/05 17:06 0.700 0.390 0.070 4.060

67
Table A5.6. Runoff N concentrations from the Renwick Creek (REN) site.
Site Sample
d/mo/yr h:m NH3-N
(mg L-1) NO3-N
(mg L-1) NO2-N
(mg L-1)Total N(mg L-1)
REN 3/6/05 23:07 0.850 0.510 0.070 5.480 REN 3/7/05 10:31 0.810 0.570 0.100 6.470 REN 3/7/05 19:49 0.610 0.460 0.110 5.970 REN 3/8/05 10:53 0.650 0.830 0.170 6.700 REN 3/8/05 14:16 1.010 0.270 0.070 4.940 REN 3/9/05 7:00 0.800 0.980 0.160 5.340 REN 3/9/05 13:38 1.050 0.400 0.060 4.660 REN 3/25/05 18:31 1.910 1.050 0.090 6.940 REN 3/27/05 1:29 0.880 0.610 0.100 6.110 REN 3/28/05 0:11 0.230 1.180 0.080 5.960 REN 3/28/05 13:55 0.550 0.880 0.070 5.250 REN 3/28/05 15:10 0.580 1.350 0.080 5.830 REN 3/28/05 16:47 0.770 1.690 0.090 6.880 REN 6/8/05 8:23 0.130 2.160 0.130 10.790 REN 6/13/05 19:02 0.380 3.850 0.070 12.920 REN 6/17/05 14:02 0.250 4.380 0.190 27.970 REN 6/17/05 22:25 0.110 1.500 0.190 6.390 REN 6/18/05 7:33 0.230 0.940 0.160 3.300 REN 8/17/05 7:02 0.140 1.985 0.025 5.310 REN 8/17/05 8:41 0.070 1.345 0.025 3.770 REN 8/23/05 9:17 0.120 3.085 0.025 8.710 REN 8/24/05 5:59 0.025 0.405 0.025 1.930 REN 8/24/05 10:34 0.025 0.425 0.025 2.350 REN 8/24/05 12:05 0.060 0.285 0.025 3.110 REN 8/24/05 16:35 0.025 0.095 0.025 1.820 REN 8/24/05 21:05 0.025 0.025 0.025 1.050
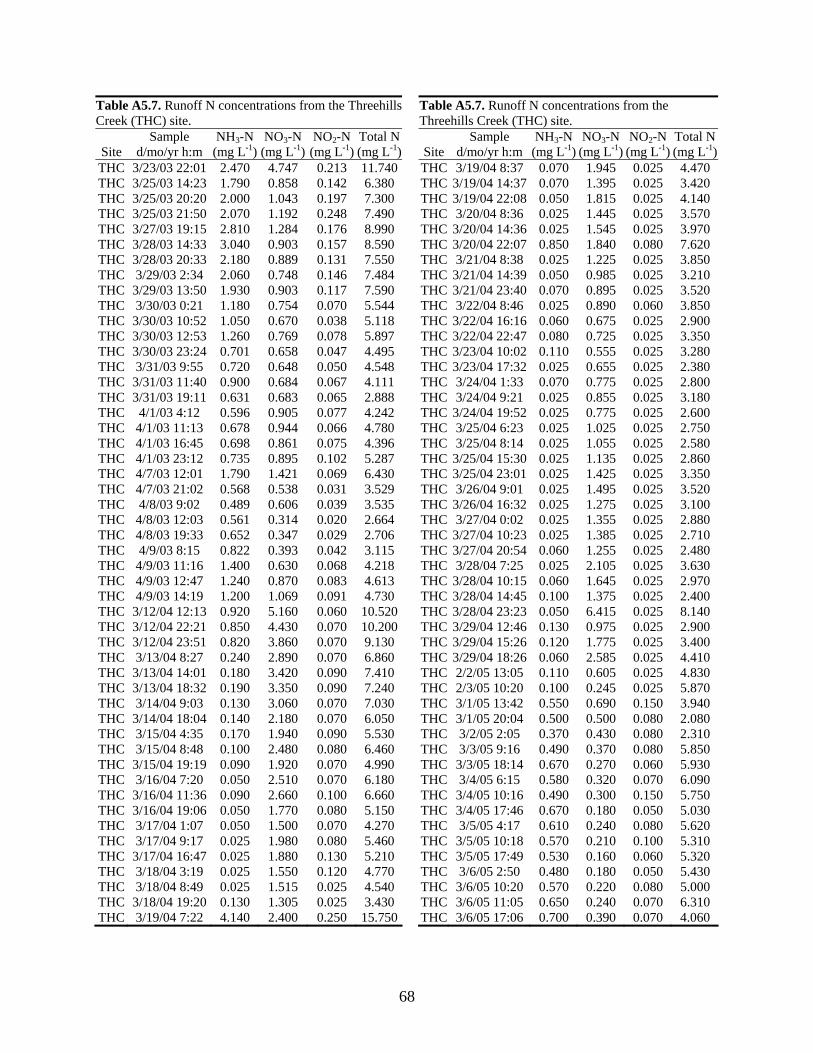
68
Table A5.7. Runoff N concentrations from the Threehills Creek (THC) site.
Table A5.7. Runoff N concentrations from the Threehills Creek (THC) site.
Site Sample
d/mo/yr h:m NH3-N
(mg L-1) NO3-N
(mg L-1) NO2-N
(mg L-1)Total N(mg L-1)
Site
Sample d/mo/yr h:m
NH3-N (mg L-1)
NO3-N (mg L-1)
NO2-N(mg L-1)
Total N(mg L-1)
THC 3/23/03 22:01 2.470 4.747 0.213 11.740 THC 3/19/04 8:37 0.070 1.945 0.025 4.470 THC 3/25/03 14:23 1.790 0.858 0.142 6.380 THC 3/19/04 14:37 0.070 1.395 0.025 3.420 THC 3/25/03 20:20 2.000 1.043 0.197 7.300 THC 3/19/04 22:08 0.050 1.815 0.025 4.140 THC 3/25/03 21:50 2.070 1.192 0.248 7.490 THC 3/20/04 8:36 0.025 1.445 0.025 3.570 THC 3/27/03 19:15 2.810 1.284 0.176 8.990 THC 3/20/04 14:36 0.025 1.545 0.025 3.970 THC 3/28/03 14:33 3.040 0.903 0.157 8.590 THC 3/20/04 22:07 0.850 1.840 0.080 7.620 THC 3/28/03 20:33 2.180 0.889 0.131 7.550 THC 3/21/04 8:38 0.025 1.225 0.025 3.850 THC 3/29/03 2:34 2.060 0.748 0.146 7.484 THC 3/21/04 14:39 0.050 0.985 0.025 3.210 THC 3/29/03 13:50 1.930 0.903 0.117 7.590 THC 3/21/04 23:40 0.070 0.895 0.025 3.520 THC 3/30/03 0:21 1.180 0.754 0.070 5.544 THC 3/22/04 8:46 0.025 0.890 0.060 3.850 THC 3/30/03 10:52 1.050 0.670 0.038 5.118 THC 3/22/04 16:16 0.060 0.675 0.025 2.900 THC 3/30/03 12:53 1.260 0.769 0.078 5.897 THC 3/22/04 22:47 0.080 0.725 0.025 3.350 THC 3/30/03 23:24 0.701 0.658 0.047 4.495 THC 3/23/04 10:02 0.110 0.555 0.025 3.280 THC 3/31/03 9:55 0.720 0.648 0.050 4.548 THC 3/23/04 17:32 0.025 0.655 0.025 2.380 THC 3/31/03 11:40 0.900 0.684 0.067 4.111 THC 3/24/04 1:33 0.070 0.775 0.025 2.800 THC 3/31/03 19:11 0.631 0.683 0.065 2.888 THC 3/24/04 9:21 0.025 0.855 0.025 3.180 THC 4/1/03 4:12 0.596 0.905 0.077 4.242 THC 3/24/04 19:52 0.025 0.775 0.025 2.600 THC 4/1/03 11:13 0.678 0.944 0.066 4.780 THC 3/25/04 6:23 0.025 1.025 0.025 2.750 THC 4/1/03 16:45 0.698 0.861 0.075 4.396 THC 3/25/04 8:14 0.025 1.055 0.025 2.580 THC 4/1/03 23:12 0.735 0.895 0.102 5.287 THC 3/25/04 15:30 0.025 1.135 0.025 2.860 THC 4/7/03 12:01 1.790 1.421 0.069 6.430 THC 3/25/04 23:01 0.025 1.425 0.025 3.350 THC 4/7/03 21:02 0.568 0.538 0.031 3.529 THC 3/26/04 9:01 0.025 1.495 0.025 3.520 THC 4/8/03 9:02 0.489 0.606 0.039 3.535 THC 3/26/04 16:32 0.025 1.275 0.025 3.100 THC 4/8/03 12:03 0.561 0.314 0.020 2.664 THC 3/27/04 0:02 0.025 1.355 0.025 2.880 THC 4/8/03 19:33 0.652 0.347 0.029 2.706 THC 3/27/04 10:23 0.025 1.385 0.025 2.710 THC 4/9/03 8:15 0.822 0.393 0.042 3.115 THC 3/27/04 20:54 0.060 1.255 0.025 2.480 THC 4/9/03 11:16 1.400 0.630 0.068 4.218 THC 3/28/04 7:25 0.025 2.105 0.025 3.630 THC 4/9/03 12:47 1.240 0.870 0.083 4.613 THC 3/28/04 10:15 0.060 1.645 0.025 2.970 THC 4/9/03 14:19 1.200 1.069 0.091 4.730 THC 3/28/04 14:45 0.100 1.375 0.025 2.400 THC 3/12/04 12:13 0.920 5.160 0.060 10.520 THC 3/28/04 23:23 0.050 6.415 0.025 8.140 THC 3/12/04 22:21 0.850 4.430 0.070 10.200 THC 3/29/04 12:46 0.130 0.975 0.025 2.900 THC 3/12/04 23:51 0.820 3.860 0.070 9.130 THC 3/29/04 15:26 0.120 1.775 0.025 3.400 THC 3/13/04 8:27 0.240 2.890 0.070 6.860 THC 3/29/04 18:26 0.060 2.585 0.025 4.410 THC 3/13/04 14:01 0.180 3.420 0.090 7.410 THC 2/2/05 13:05 0.110 0.605 0.025 4.830 THC 3/13/04 18:32 0.190 3.350 0.090 7.240 THC 2/3/05 10:20 0.100 0.245 0.025 5.870 THC 3/14/04 9:03 0.130 3.060 0.070 7.030 THC 3/1/05 13:42 0.550 0.690 0.150 3.940 THC 3/14/04 18:04 0.140 2.180 0.070 6.050 THC 3/1/05 20:04 0.500 0.500 0.080 2.080 THC 3/15/04 4:35 0.170 1.940 0.090 5.530 THC 3/2/05 2:05 0.370 0.430 0.080 2.310 THC 3/15/04 8:48 0.100 2.480 0.080 6.460 THC 3/3/05 9:16 0.490 0.370 0.080 5.850 THC 3/15/04 19:19 0.090 1.920 0.070 4.990 THC 3/3/05 18:14 0.670 0.270 0.060 5.930 THC 3/16/04 7:20 0.050 2.510 0.070 6.180 THC 3/4/05 6:15 0.580 0.320 0.070 6.090 THC 3/16/04 11:36 0.090 2.660 0.100 6.660 THC 3/4/05 10:16 0.490 0.300 0.150 5.750 THC 3/16/04 19:06 0.050 1.770 0.080 5.150 THC 3/4/05 17:46 0.670 0.180 0.050 5.030 THC 3/17/04 1:07 0.050 1.500 0.070 4.270 THC 3/5/05 4:17 0.610 0.240 0.080 5.620 THC 3/17/04 9:17 0.025 1.980 0.080 5.460 THC 3/5/05 10:18 0.570 0.210 0.100 5.310 THC 3/17/04 16:47 0.025 1.880 0.130 5.210 THC 3/5/05 17:49 0.530 0.160 0.060 5.320 THC 3/18/04 3:19 0.025 1.550 0.120 4.770 THC 3/6/05 2:50 0.480 0.180 0.050 5.430 THC 3/18/04 8:49 0.025 1.515 0.025 4.540 THC 3/6/05 10:20 0.570 0.220 0.080 5.000 THC 3/18/04 19:20 0.130 1.305 0.025 3.430 THC 3/6/05 11:05 0.650 0.240 0.070 6.310 THC 3/19/04 7:22 4.140 2.400 0.250 15.750 THC 3/6/05 17:06 0.700 0.390 0.070 4.060
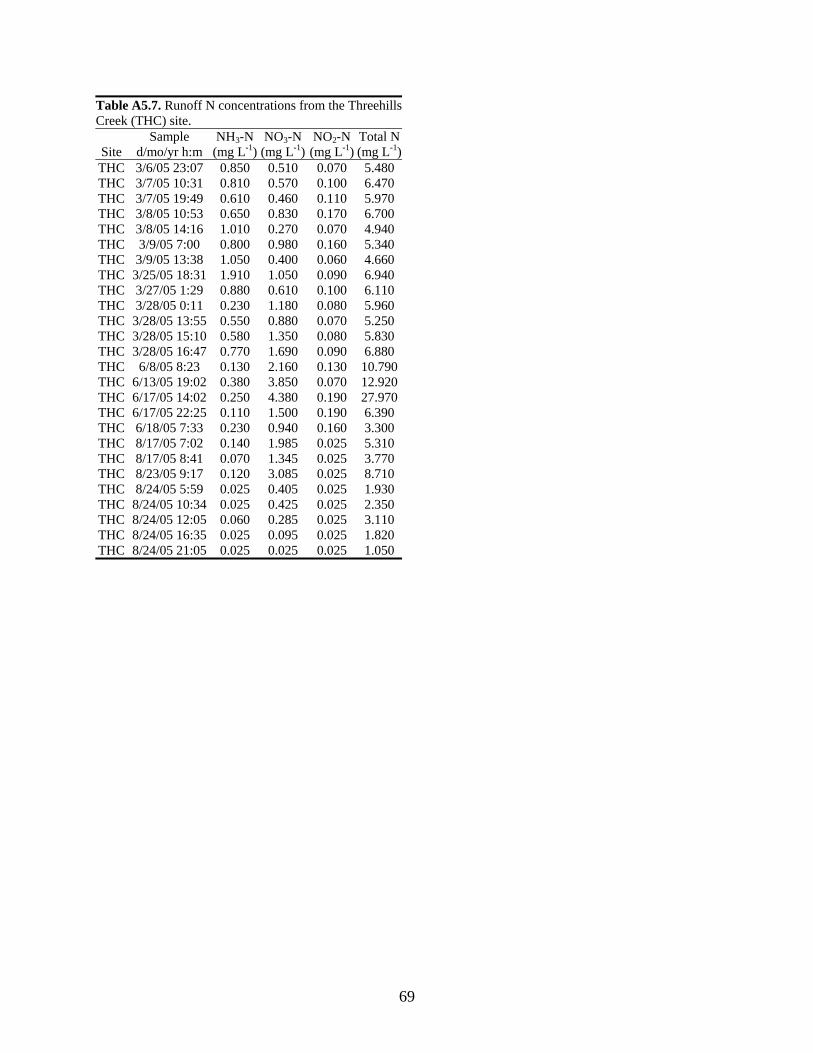
69
Table A5.7. Runoff N concentrations from the Threehills Creek (THC) site.
Site Sample
d/mo/yr h:m NH3-N
(mg L-1) NO3-N
(mg L-1) NO2-N
(mg L-1)Total N(mg L-1)
THC 3/6/05 23:07 0.850 0.510 0.070 5.480 THC 3/7/05 10:31 0.810 0.570 0.100 6.470 THC 3/7/05 19:49 0.610 0.460 0.110 5.970 THC 3/8/05 10:53 0.650 0.830 0.170 6.700 THC 3/8/05 14:16 1.010 0.270 0.070 4.940 THC 3/9/05 7:00 0.800 0.980 0.160 5.340 THC 3/9/05 13:38 1.050 0.400 0.060 4.660 THC 3/25/05 18:31 1.910 1.050 0.090 6.940 THC 3/27/05 1:29 0.880 0.610 0.100 6.110 THC 3/28/05 0:11 0.230 1.180 0.080 5.960 THC 3/28/05 13:55 0.550 0.880 0.070 5.250 THC 3/28/05 15:10 0.580 1.350 0.080 5.830 THC 3/28/05 16:47 0.770 1.690 0.090 6.880 THC 6/8/05 8:23 0.130 2.160 0.130 10.790 THC 6/13/05 19:02 0.380 3.850 0.070 12.920 THC 6/17/05 14:02 0.250 4.380 0.190 27.970 THC 6/17/05 22:25 0.110 1.500 0.190 6.390 THC 6/18/05 7:33 0.230 0.940 0.160 3.300 THC 8/17/05 7:02 0.140 1.985 0.025 5.310 THC 8/17/05 8:41 0.070 1.345 0.025 3.770 THC 8/23/05 9:17 0.120 3.085 0.025 8.710 THC 8/24/05 5:59 0.025 0.405 0.025 1.930 THC 8/24/05 10:34 0.025 0.425 0.025 2.350 THC 8/24/05 12:05 0.060 0.285 0.025 3.110 THC 8/24/05 16:35 0.025 0.095 0.025 1.820 THC 8/24/05 21:05 0.025 0.025 0.025 1.050
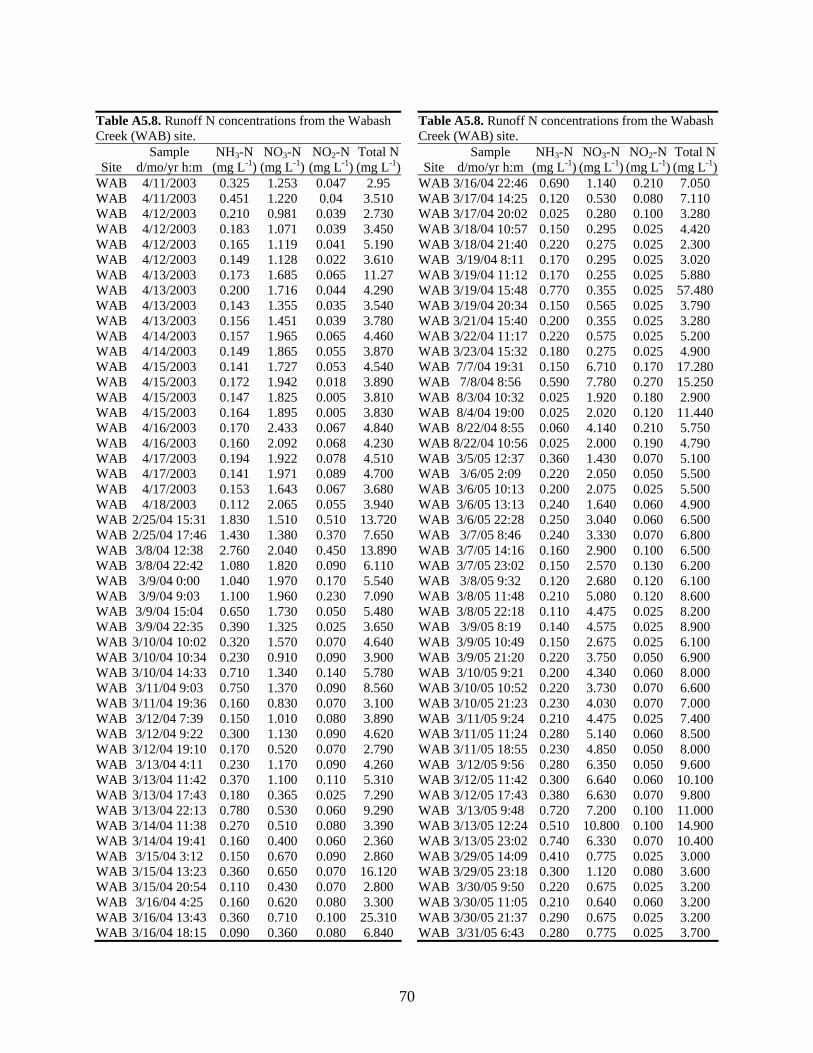
70
Table A5.8. Runoff N concentrations from the Wabash Creek (WAB) site.
Table A5.8. Runoff N concentrations from the Wabash Creek (WAB) site.
Site Sample
d/mo/yr h:m NH3-N
(mg L-1) NO3-N
(mg L-1) NO2-N
(mg L-1)Total N(mg L-1)
Site
Sample d/mo/yr h:m
NH3-N (mg L-1)
NO3-N (mg L-1)
NO2-N(mg L-1)
Total N(mg L-1)
WAB 4/11/2003 0.325 1.253 0.047 2.95 WAB 3/16/04 22:46 0.690 1.140 0.210 7.050 WAB 4/11/2003 0.451 1.220 0.04 3.510 WAB 3/17/04 14:25 0.120 0.530 0.080 7.110 WAB 4/12/2003 0.210 0.981 0.039 2.730 WAB 3/17/04 20:02 0.025 0.280 0.100 3.280 WAB 4/12/2003 0.183 1.071 0.039 3.450 WAB 3/18/04 10:57 0.150 0.295 0.025 4.420 WAB 4/12/2003 0.165 1.119 0.041 5.190 WAB 3/18/04 21:40 0.220 0.275 0.025 2.300 WAB 4/12/2003 0.149 1.128 0.022 3.610 WAB 3/19/04 8:11 0.170 0.295 0.025 3.020 WAB 4/13/2003 0.173 1.685 0.065 11.27 WAB 3/19/04 11:12 0.170 0.255 0.025 5.880 WAB 4/13/2003 0.200 1.716 0.044 4.290 WAB 3/19/04 15:48 0.770 0.355 0.025 57.480WAB 4/13/2003 0.143 1.355 0.035 3.540 WAB 3/19/04 20:34 0.150 0.565 0.025 3.790 WAB 4/13/2003 0.156 1.451 0.039 3.780 WAB 3/21/04 15:40 0.200 0.355 0.025 3.280 WAB 4/14/2003 0.157 1.965 0.065 4.460 WAB 3/22/04 11:17 0.220 0.575 0.025 5.200 WAB 4/14/2003 0.149 1.865 0.055 3.870 WAB 3/23/04 15:32 0.180 0.275 0.025 4.900 WAB 4/15/2003 0.141 1.727 0.053 4.540 WAB 7/7/04 19:31 0.150 6.710 0.170 17.280WAB 4/15/2003 0.172 1.942 0.018 3.890 WAB 7/8/04 8:56 0.590 7.780 0.270 15.250WAB 4/15/2003 0.147 1.825 0.005 3.810 WAB 8/3/04 10:32 0.025 1.920 0.180 2.900 WAB 4/15/2003 0.164 1.895 0.005 3.830 WAB 8/4/04 19:00 0.025 2.020 0.120 11.440WAB 4/16/2003 0.170 2.433 0.067 4.840 WAB 8/22/04 8:55 0.060 4.140 0.210 5.750 WAB 4/16/2003 0.160 2.092 0.068 4.230 WAB 8/22/04 10:56 0.025 2.000 0.190 4.790 WAB 4/17/2003 0.194 1.922 0.078 4.510 WAB 3/5/05 12:37 0.360 1.430 0.070 5.100 WAB 4/17/2003 0.141 1.971 0.089 4.700 WAB 3/6/05 2:09 0.220 2.050 0.050 5.500 WAB 4/17/2003 0.153 1.643 0.067 3.680 WAB 3/6/05 10:13 0.200 2.075 0.025 5.500 WAB 4/18/2003 0.112 2.065 0.055 3.940 WAB 3/6/05 13:13 0.240 1.640 0.060 4.900 WAB 2/25/04 15:31 1.830 1.510 0.510 13.720 WAB 3/6/05 22:28 0.250 3.040 0.060 6.500 WAB 2/25/04 17:46 1.430 1.380 0.370 7.650 WAB 3/7/05 8:46 0.240 3.330 0.070 6.800 WAB 3/8/04 12:38 2.760 2.040 0.450 13.890 WAB 3/7/05 14:16 0.160 2.900 0.100 6.500 WAB 3/8/04 22:42 1.080 1.820 0.090 6.110 WAB 3/7/05 23:02 0.150 2.570 0.130 6.200 WAB 3/9/04 0:00 1.040 1.970 0.170 5.540 WAB 3/8/05 9:32 0.120 2.680 0.120 6.100 WAB 3/9/04 9:03 1.100 1.960 0.230 7.090 WAB 3/8/05 11:48 0.210 5.080 0.120 8.600 WAB 3/9/04 15:04 0.650 1.730 0.050 5.480 WAB 3/8/05 22:18 0.110 4.475 0.025 8.200 WAB 3/9/04 22:35 0.390 1.325 0.025 3.650 WAB 3/9/05 8:19 0.140 4.575 0.025 8.900 WAB 3/10/04 10:02 0.320 1.570 0.070 4.640 WAB 3/9/05 10:49 0.150 2.675 0.025 6.100 WAB 3/10/04 10:34 0.230 0.910 0.090 3.900 WAB 3/9/05 21:20 0.220 3.750 0.050 6.900 WAB 3/10/04 14:33 0.710 1.340 0.140 5.780 WAB 3/10/05 9:21 0.200 4.340 0.060 8.000 WAB 3/11/04 9:03 0.750 1.370 0.090 8.560 WAB 3/10/05 10:52 0.220 3.730 0.070 6.600 WAB 3/11/04 19:36 0.160 0.830 0.070 3.100 WAB 3/10/05 21:23 0.230 4.030 0.070 7.000 WAB 3/12/04 7:39 0.150 1.010 0.080 3.890 WAB 3/11/05 9:24 0.210 4.475 0.025 7.400 WAB 3/12/04 9:22 0.300 1.130 0.090 4.620 WAB 3/11/05 11:24 0.280 5.140 0.060 8.500 WAB 3/12/04 19:10 0.170 0.520 0.070 2.790 WAB 3/11/05 18:55 0.230 4.850 0.050 8.000 WAB 3/13/04 4:11 0.230 1.170 0.090 4.260 WAB 3/12/05 9:56 0.280 6.350 0.050 9.600 WAB 3/13/04 11:42 0.370 1.100 0.110 5.310 WAB 3/12/05 11:42 0.300 6.640 0.060 10.100WAB 3/13/04 17:43 0.180 0.365 0.025 7.290 WAB 3/12/05 17:43 0.380 6.630 0.070 9.800 WAB 3/13/04 22:13 0.780 0.530 0.060 9.290 WAB 3/13/05 9:48 0.720 7.200 0.100 11.000WAB 3/14/04 11:38 0.270 0.510 0.080 3.390 WAB 3/13/05 12:24 0.510 10.800 0.100 14.900WAB 3/14/04 19:41 0.160 0.400 0.060 2.360 WAB 3/13/05 23:02 0.740 6.330 0.070 10.400WAB 3/15/04 3:12 0.150 0.670 0.090 2.860 WAB 3/29/05 14:09 0.410 0.775 0.025 3.000 WAB 3/15/04 13:23 0.360 0.650 0.070 16.120 WAB 3/29/05 23:18 0.300 1.120 0.080 3.600 WAB 3/15/04 20:54 0.110 0.430 0.070 2.800 WAB 3/30/05 9:50 0.220 0.675 0.025 3.200 WAB 3/16/04 4:25 0.160 0.620 0.080 3.300 WAB 3/30/05 11:05 0.210 0.640 0.060 3.200 WAB 3/16/04 13:43 0.360 0.710 0.100 25.310 WAB 3/30/05 21:37 0.290 0.675 0.025 3.200 WAB 3/16/04 18:15 0.090 0.360 0.080 6.840 WAB 3/31/05 6:43 0.280 0.775 0.025 3.700
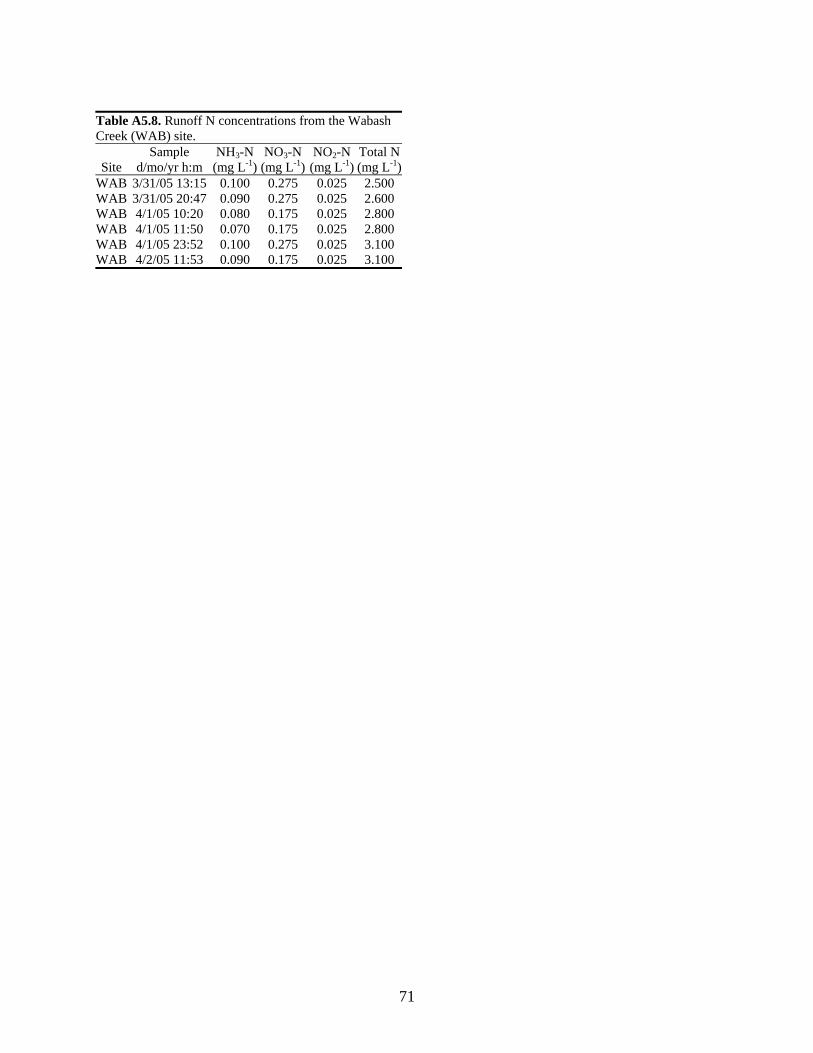
71
Table A5.8. Runoff N concentrations from the Wabash Creek (WAB) site.
Site Sample
d/mo/yr h:m NH3-N
(mg L-1) NO3-N
(mg L-1) NO2-N
(mg L-1)Total N(mg L-1)
WAB 3/31/05 13:15 0.100 0.275 0.025 2.500 WAB 3/31/05 20:47 0.090 0.275 0.025 2.600 WAB 4/1/05 10:20 0.080 0.175 0.025 2.800 WAB 4/1/05 11:50 0.070 0.175 0.025 2.800 WAB 4/1/05 23:52 0.100 0.275 0.025 3.100 WAB 4/2/05 11:53 0.090 0.175 0.025 3.100