Embed Size (px)
Citation preview
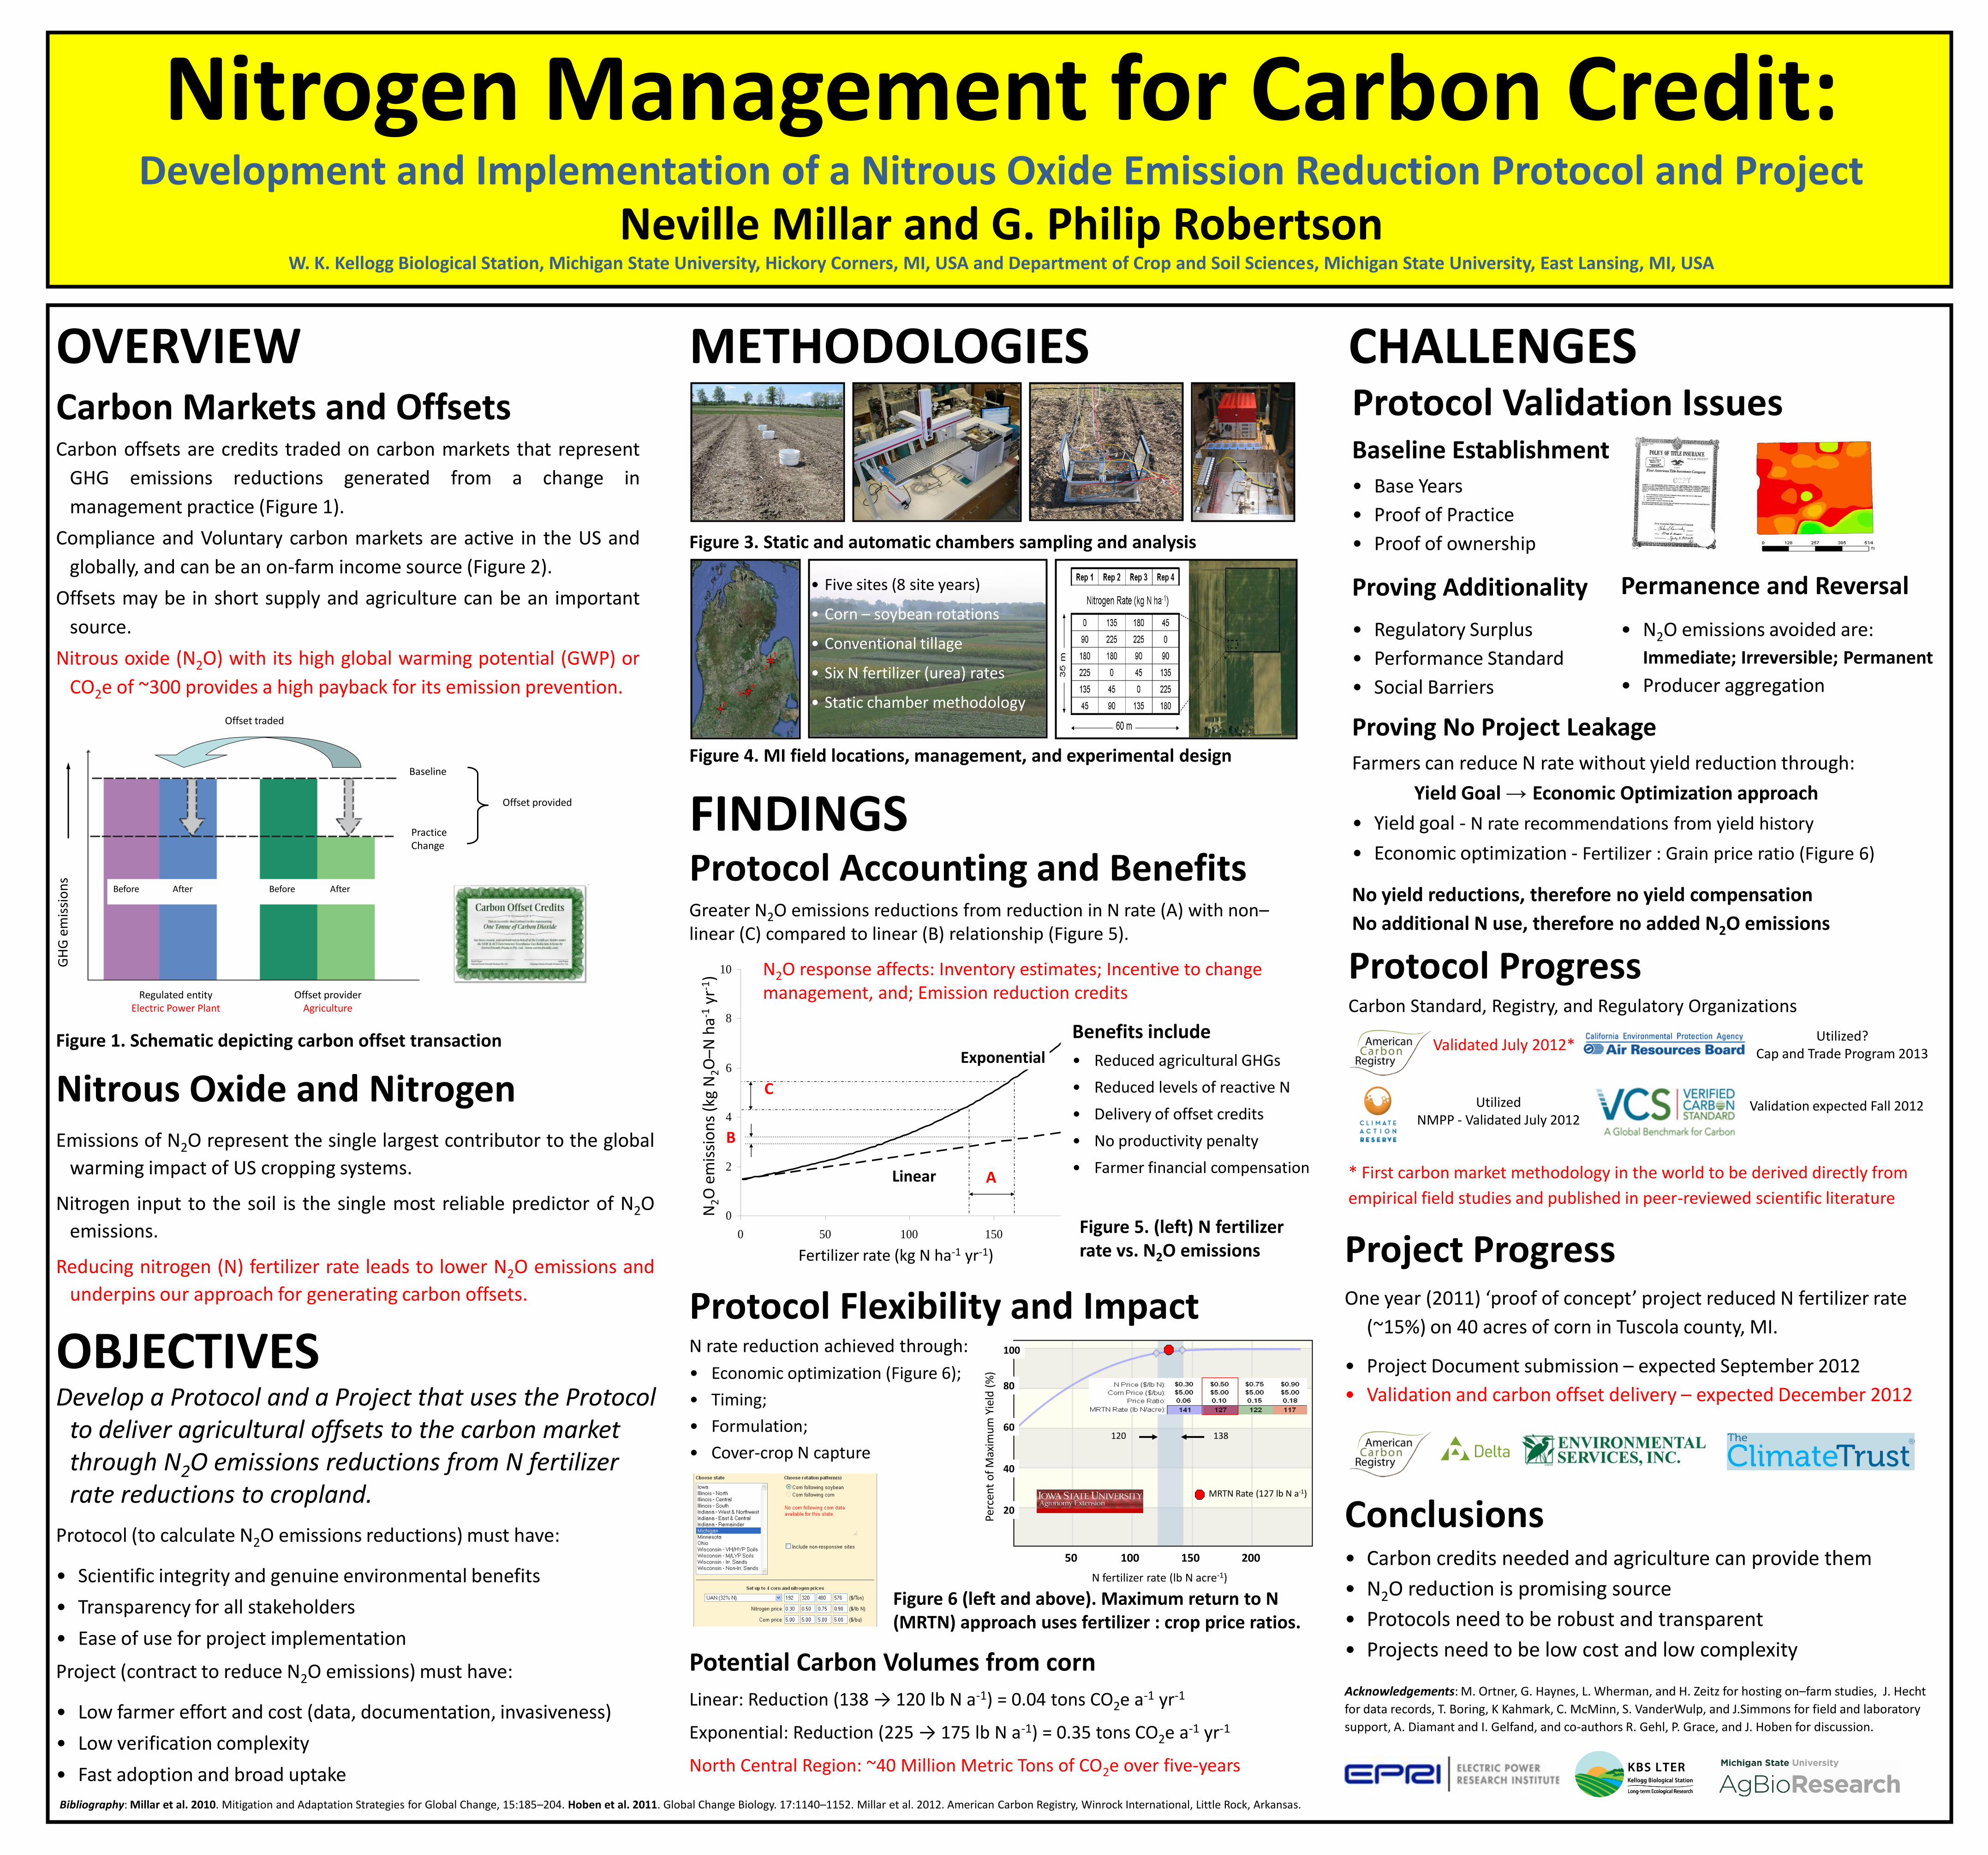
Nitrogen Management for Carbon Credit: Development and Implementation of a Nitrous Oxide Emission Reduction Protocol and Project
Neville Millar and G. Philip Robertson W. K. Kellogg Biological Station, Michigan State University, Hickory Corners, MI, USA and Department of Crop and Soil Sciences, Michigan State University, East Lansing, MI, USA
Bibliography: Millar et al. 2010. Mitigation and Adaptation Strategies for Global Change, 15:185–204. Hoben et al. 2011. Global Change Biology. 17:1140–1152. Millar et al. 2012. American Carbon Registry, Winrock International, Little Rock, Arkansas.
Emissions of N2O represent the single largest contributor to the global
warming impact of US cropping systems.
Nitrogen input to the soil is the single most reliable predictor of N2O
emissions.
Reducing nitrogen (N) fertilizer rate leads to lower N2O emissions and
underpins our approach for generating carbon offsets.
Nitrous Oxide and Nitrogen
Carbon offsets are credits traded on carbon markets that represent
GHG emissions reductions generated from a change in
management practice (Figure 1).
Compliance and Voluntary carbon markets are active in the US and
globally, and can be an on-farm income source (Figure 2).
Offsets may be in short supply and agriculture can be an important
source.
Nitrous oxide (N2O) with its high global warming potential (GWP) or
CO2e of ~300 provides a high payback for its emission prevention.
Carbon Markets and Offsets
OVERVIEW
Regulated entity Electric Power Plant
Offset provider Agriculture
Baseline
Practice Change
Offset provided
Before Before After After
GH
G e
mis
sio
ns
Offset traded
Figure 1. Schematic depicting carbon offset transaction
Protocol (to calculate N2O emissions reductions) must have:
• Scientific integrity and genuine environmental benefits
• Transparency for all stakeholders
• Ease of use for project implementation
Project (contract to reduce N2O emissions) must have:
• Low farmer effort and cost (data, documentation, invasiveness)
• Low verification complexity
• Fast adoption and broad uptake
OBJECTIVES Develop a Protocol and a Project that uses the Protocol
to deliver agricultural offsets to the carbon market through N2O emissions reductions from N fertilizer rate reductions to cropland.
Benefits include
• Reduced agricultural GHGs
• Reduced levels of reactive N
• Delivery of offset credits
• No productivity penalty
• Farmer financial compensation
Figure 5. (left) N fertilizer rate vs. N2O emissions
• Five sites (8 site years)
• Corn – soybean rotations
• Conventional tillage
• Six N fertilizer (urea) rates
• Static chamber methodology
Figure 4. MI field locations, management, and experimental design
Figure 3. Static and automatic chambers sampling and analysis
METHODOLOGIES
Protocol Accounting and Benefits
Potential Carbon Volumes from corn
Linear: Reduction (138 → 120 lb N a-1) = 0.04 tons CO2e a-1 yr-1
Exponential: Reduction (225 → 175 lb N a-1) = 0.35 tons CO2e a-1 yr-1
North Central Region: ~40 Million Metric Tons of CO2e over five-years
Greater N2O emissions reductions from reduction in N rate (A) with non–linear (C) compared to linear (B) relationship (Figure 5).
Tier 2
N2O emissions = 1.47 * [exp (0.0082 * Fertilizer N rate)]
Tier 1
N2O emissions = 1.47 + (0.01 * Fertilizer N rate)
0
2
4
6
8
10
0 50 100 150 200
Fertilizer N rate (kg ha-1
yr-1
)
N2O
em
issi
on
s (k
g N
2O
-N h
a-1
yr-1
)
B
Exponential
A
C
Linear
B
Fertilizer rate (kg N ha-1 yr-1)
N2O
em
issi
on
s (k
g N
2O
–N h
a-1 y
r-1)
FINDINGS
Figure 6 (left and above). Maximum return to N (MRTN) approach uses fertilizer : crop price ratios.
Protocol Flexibility and Impact N rate reduction achieved through:
• Economic optimization (Figure 6);
• Timing;
• Formulation;
• Cover-crop N capture 120 138
MRTN Rate (127 lb N a-1)
N fertilizer rate (lb N acre-1)
50 100 150 200
20
40
60
80
100
Perc
ent
of
Max
imu
m Y
ield
(%
)
N2O response affects: Inventory estimates; Incentive to change management, and; Emission reduction credits
Acknowledgements: M. Ortner, G. Haynes, L. Wherman, and H. Zeitz for hosting on–farm studies, J. Hecht
for data records, T. Boring, K Kahmark, C. McMinn, S. VanderWulp, and J.Simmons for field and laboratory
support, A. Diamant and I. Gelfand, and co-authors R. Gehl, P. Grace, and J. Hoben for discussion.
Permanence and Reversal
• N2O emissions avoided are:
Immediate; Irreversible; Permanent
• Producer aggregation
Carbon Standard, Registry, and Regulatory Organizations
Validation expected Fall 2012
Validated July 2012*
Utilized NMPP - Validated July 2012
Utilized? Cap and Trade Program 2013
Protocol Validation Issues
Protocol Progress
Baseline Establishment
• Base Years
• Proof of Practice
• Proof of ownership
Proving Additionality
Proving No Project Leakage
• Regulatory Surplus
• Performance Standard
• Social Barriers
Farmers can reduce N rate without yield reduction through:
Yield Goal → Economic Optimization approach
• Yield goal - N rate recommendations from yield history
• Economic optimization - Fertilizer : Grain price ratio (Figure 6)
No yield reductions, therefore no yield compensation
No additional N use, therefore no added N2O emissions
• Carbon credits needed and agriculture can provide them
• N2O reduction is promising source
• Protocols need to be robust and transparent
• Projects need to be low cost and low complexity
* First carbon market methodology in the world to be derived directly from
empirical field studies and published in peer-reviewed scientific literature
Project Progress One year (2011) ‘proof of concept’ project reduced N fertilizer rate
(~15%) on 40 acres of corn in Tuscola county, MI.
• Project Document submission – expected September 2012
• Validation and carbon offset delivery – expected December 2012
Conclusions
CHALLENGES