Embed Size (px)
Citation preview
Biogeosciences, 3, 607–619, 2006www.biogeosciences.net/3/607/2006/© Author(s) 2006. This work is licensedunder a Creative Commons License.
Biogeosciences
Nitrous oxide in the North Atlantic Ocean
S. Walter1,*, H. W. Bange1, U. Breitenbach1, and D. W. R. Wallace1
1Forschungsbereich Marine Biogeochemie, IFM-GEOMAR, Leibniz-Institut fur Meereswissenschaften, Kiel, Germany* now at: Institute for Marine and Atmospheric Research Utrecht, Utrecht University, Utrecht, The Netherlands
Received: 2 May 2006 – Published in Biogeosciences Discuss.: 17 July 2006Revised: 10 November 2006 – Accepted: 21 November 2006 – Published: 1 December 2006
Abstract. In order to get a comprehensive picture of thedistribution of nitrous oxide (N2O) in the North AtlanticOcean, measurements of dissolved nitrous oxide were madeduring three cruises in the tropical, subtropical and cold-temperate North Atlantic Ocean in October/November 2002,March/April 2004, and May 2002, respectively. To accountfor the history of atmospheric N2O, we suggest a new depth-dependent calculation of excess N2O (1N2O). N2O depthprofiles showed supersaturation throughout the water col-umn with a distinct increasing trend from the cold-temperateto the tropical region. Lowest nitrous oxide concentrations,near equilibrium and with an average of 11.0±1.7 nmol L−1,were found in the cold-temperate North Atlantic where theprofiles showed no clear maxima. Highest values up to37.3 nmol L−1 occurred in the tropical North Atlantic withclear maxima at approximately 400 m. A positive correlationof nitrous oxide with nitrate, as well as excess nitrous oxidewith the apparent oxygen utilization (AOU), was only ob-served in the subtropical and tropical regions. Therefore, weconclude that the formation of nitrous oxide via nitrificationoccurs in the tropical region rather than in the cold-temperateregion of the North Atlantic Ocean
1 Introduction
Nitrous oxide (N2O) is an important atmospheric trace gasdue to its influence on the Earth’s climate. In the tropo-sphere N2O acts as a greenhouse gas whereas in the strato-sphere it is involved in the depletion of ozone by providingNO-radicals (Prather et al., 2001). Since the beginning ofthe industrial revolution the global mean tropospheric N2Omole fraction has risen rapidly from 270 ppb up to 314 ppbin 1998 (Prather et al., 2001). About 24% of the natural
Correspondence to:S. Walter([email protected])
sources of atmospheric N2O are contributed by the oceans(Prather et al., 2001; Seitzinger et al., 2000). Nitrous ox-ide is an important component of the oceanic nitrogen cycle,mainly formed by the microbial processes of nitrification anddenitrification (Codispoti et al., 2001; Goreau et al., 1980):Nitrification is an aerobic two-step process in which ammo-nium is oxidized to nitrate (NH+4 →NH2OH→NO−
2 →NO−
3 )by two different groups of microbes. In this process nitrousoxide is assumed to be a by-product, however the exact path-way for N2O production remains unclear. In suboxic habitatsnitrate can be reduced by denitrification to molecular nitro-gen (NO−
3 →NO−
2 →NO→N2O→N2), here nitrous oxide isan intermediate product. Especially at oxic/suboxic bound-aries N2O is produced by coupled nitrification and denitrifi-cation, due to the transfer of common intermediates (Yoshi-nari et al., 1997). Another possibility is aerobic denitrifica-tion, whereby under fully aerobic conditions organisms con-vert ammonia into nitrogen gas without the intermediary ac-cumulation of nitrite (Robertson et al., 1988). All processesdepend on oxygen concentrations, as well as the availabil-ity of substrates such as ammonium and nitrate. Many or-ganisms are able to switch between different pathways de-pending on environmental conditions, and also the yield ofN2O during a process depends on environmental conditions(Goreau et al., 1980; Poth and Focht, 1985; Richardson,2000). Positive correlations of N2O with apparent oxygenutilization (AOU) or nitrate are interpreted as production ofnitrous oxide by nitrification (Yoshinari, 1976; Cohen andGordon, 1978; Yoshida et al., 1989). However, the dom-inant production pathway for N2O on the global scale andthe contribution of different pathways still remains unclear(Codispoti et al., 2001; Popp et al., 2002). Information onthe vertical N2O distribution in the North Atlantic is sparse,only a few profiles are available. The first vertical profilesfor the North Atlantic were published by Junge and Hahn(1971) and Yoshinari (1976), additional data were collectedby Butler et al. (1995), and recently data from a transect at
Published by Copernicus GmbH on behalf of the European Geosciences Union.
608 S. Walter et al.: Nitrous oxide in the North Atlantic Ocean
Figures
f01
f02
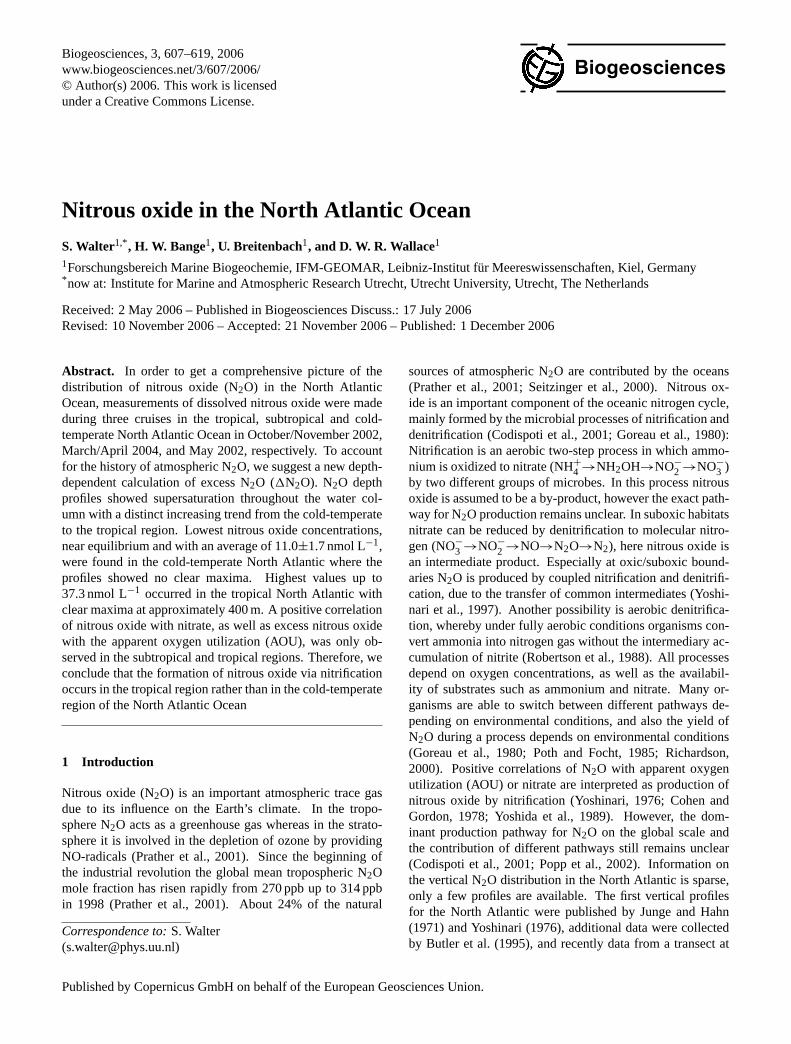
Fig. 1. Cruise tracks for “Gauss 384-1” (cold-temperate North Atlantic, 16th May to 14th June 2002), “Meteor 60-5” (subtropical NorthAtlantic, 9th March to 14th April 2004) and “Meteor 55” (tropical North Atlantic, 13th October to 16th November 2002). Numbers are givenfor stations where N2O profiles were measured.
7◦30′ N were reported by Oudot et al. (2002). In this pa-per we present a comprehensive set of 73 vertical profiles ofnitrous oxide from three trans-Atlantic cruises, covering thecold-temperate North Atlantic, the subtropical and the trop-ical North Atlantic. Based on these new data, we examinethe regional differences of the N2O distribution and its re-lationship with parameters closely related to the productionpathways of N2O.
2 Study area
2.1 Research cruises
Samples from the three cruises were collected over the periodfrom May 2002 to April 2004 (see Fig. 1).
The first cruise, to the cold-temperate North Atlantic(May/June 2002), started in Hamburg, Germany with theGerman research vessel “Gauss”. The cruise track followedthe WOCE-A2 transect to Halifax, Canada. Depth profiles of
N2O were measured at 16 stations. The WOCE-A2 transectis located between 42◦ N and 49◦ N.
The subtropical North Atlantic was investigated duringMarch/April 2004 onboard the research vessel “Meteor”.The cruise started in Fort de France, Martinique (French An-tilles) in the western part of the Atlantic and ended in Lisbon(Portugal). Samples were taken at 37 stations. Most sta-tions were co-located with stations where samples were takenduring the Transient Tracers in the Ocean Program (TTO) in1982.
The tropical North Atlantic samples were taken duringthe M55-SOLAS cruise (Wallace and Bange, 2004) in Oc-tober/November 2002, again with the German research ves-sel “Meteor”. This cruise started in the western tropicalNorth Atlantic in Willemstad, Curacao (Netherlands An-tilles) and followed a cruise track along 10–11◦ N to Douala(Cameroon). The track included a transect to the equatorbetween 26◦ W and 23.5◦ W. N2O profiles were taken at20 stations.
Biogeosciences, 3, 607–619, 2006 www.biogeosciences.net/3/607/2006/
S. Walter et al.: Nitrous oxide in the North Atlantic Ocean 609
Figures
f01
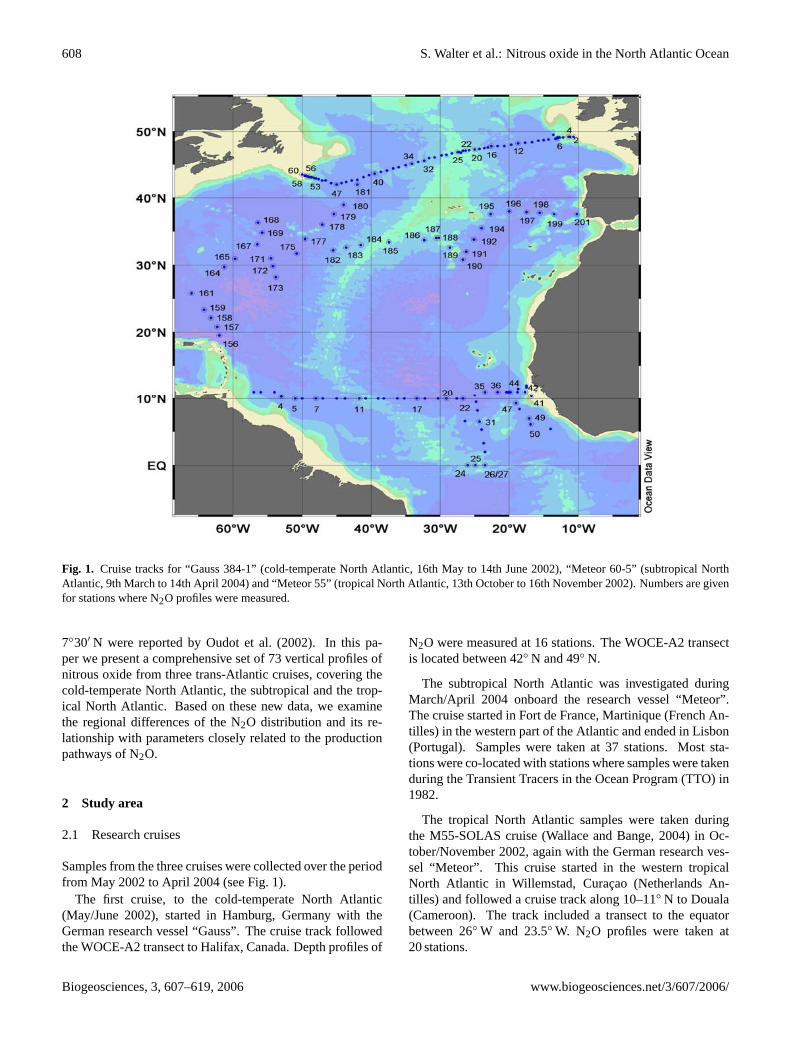
f02 Fig. 2. T-S-diagram of the North Atlantic;(a) T-S-diagram with data from all three cruises;(b) T-S-diagram in Fig. 2a framed by box.;
AW: Amazon Water; STMW: Subtropical Mode Water; MW: Mediterranean Water; SACW: South Atlantic Central Water; NACW: NorthAtlantic Central Water; AAIW: Antarctic Intermediate Water, AABW: Antarctic Bottom Water; lNADW: lower North Atlantic Deep Water;uNADW: upper North Atlantic Deep Water; LSW: Labrador Sea Water.
2.2 Hydrography
Several water masses in the North Atlantic can be identifiedin the T-S-diagram based on data from the three cruises (seeFig. 2). The main Atlantic water masses were identified ac-cording to commonly used classification schemes (Tomczak,1999; Alvarez et al., 2004; Aiken et al., 2000; Joyce et al.,2001; Poole and Tomczak, 1999).
The WOCE A2 transect (Gauss 384-1 cruise), is locatedat the boundary region between the subpolar gyre (Gor-don, 1986) and the subtropical gyre (Krauss, 1996). Thisregion is highly variable, characterized by the exchange ofupper-ocean water between the gyres mainly via the NorthAtlantic Current, and the Labrador Current. One of themost important water masses here is the Labrador Sea Wa-ter (LSW). These water masses provide the major part ofthe North Atlantic Intermediate Water in combination withthe outflow of Mediterranean Sea Water (MW), which is de-tected in the eastern basin of the subtropical Atlantic Oceannear the Strait of Gibraltar (Richardson et al., 2000) andthe Antarctic Intermediate Water (AAIW) from the south(Lorbacher, 2000). Additional water masses of the south-ern hemisphere that penetrate into the North Atlantic are theSouth Atlantic Central Water (SACW) and the Antarctic Bot-tom Water (AABW). SACW flows northwards, and mixeswith the North Atlantic Central Water (NACW) at approxi-mately 15◦ N in the western and 20◦ N in the eastern basin(Poole and Tomczak, 1999; Aiken et al., 2000).
A typical freshwater influence was found during the Me-teor 55 cruise in the western tropical North Atlantic. Water ofthe Amazon was detected in the surface water, identified by
high temperatures and low salinity. These plumes of fresh-water are transported northwards by the North Brazil Currentand eastwards by the equatorial current system (Fratantoniand Glickson, 2002).
3 Material and methods
Water samples for N2O analysis were collected in triplicatefrom various depths, taken with a 24-Niskin-bottle rosette,equipped with a CTD-sensor. The analytical method ap-plied is a modification of the method described by Bange etal. (2001). Bubble free samples were taken immediately fol-lowing oxygen sampling in 24 mL glass vials, sealed directlywith butyl rubber stoppers and crimped with aluminium caps.To prevent microbial activity, samples were poisoned with500µL of 2 mM mercury (II) chloride solution. 10 mL ofsample were then replaced with a helium headspace foreach vial, and the samples were then allowed to equili-brate for at least two hours at room temperature (tempera-ture was recorded continuously). A 9 mL subsample from theheadspace was used to flush a 2 mL sample loop after pass-ing through a moisture trap (filled with Sicapent®, MerckGermany). Gaschromatographic separation was performedat 190◦C on a packed molecular sieve column (6ft×1/8”SS,5A, mesh 80/100, Alltech GmbH, Germany). The N2O wasdetected with an electron capture detector. A mixture of ar-gon with 5% by volume methane was used as carrier gas witha flow of 21 mL min−1. For the two-point calibration pro-cedure we used standard gas mixtures with 311.8± 0.2 ppband 346.5± 0.2 ppb N2O in synthetic air (Deuste Steininger
www.biogeosciences.net/3/607/2006/ Biogeosciences, 3, 607–619, 2006
610 S. Walter et al.: Nitrous oxide in the North Atlantic Ocean
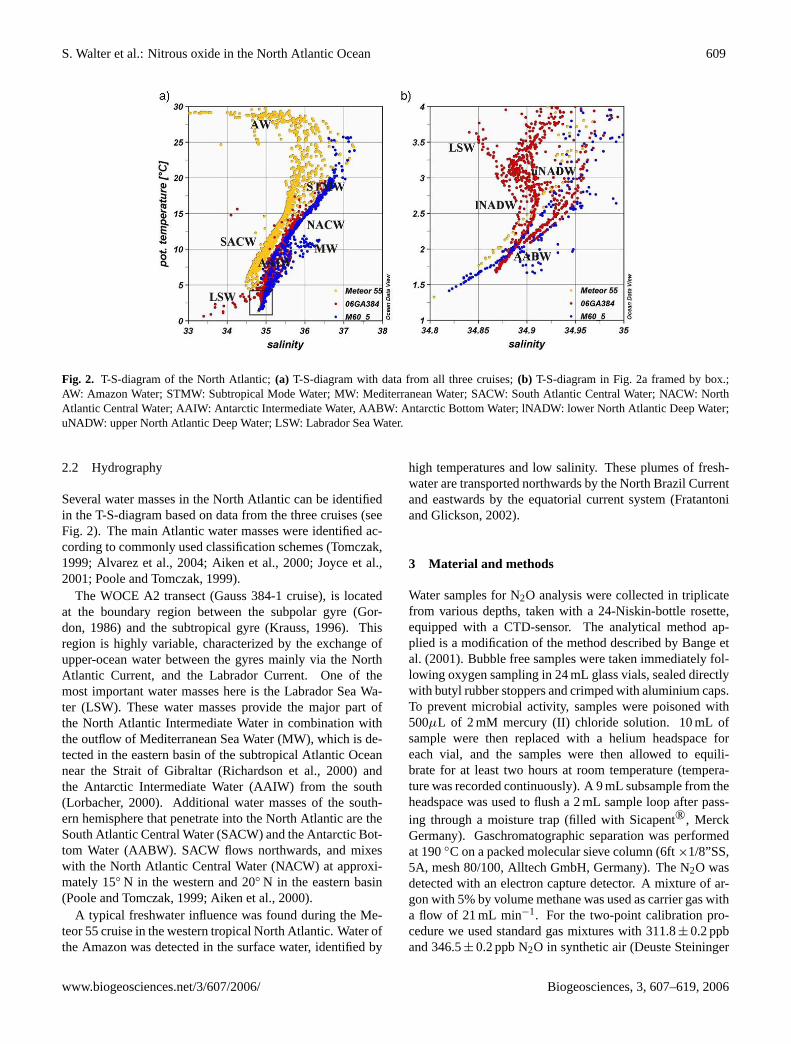
Fig. 3. Measured N2O concentration in comparison with the N2Oequilibrium concentration based on a uniform mole fraction of318 ppb and the depth-dependent N2O equilibrium concentrationbased on mole fractions of 318 ppb, 294 ppb and 270 ppb. Data arefrom station 4 of cruise Meteor 55 in the tropical North Atlantic.
GmbH, Muhlhausen Germany). The standard mixtures havebeen calibrated against the NOAA (National Oceanic and At-mospheric Administration, Boulder, Co.) standard scale inthe laboratories of the Air Chemistry Division of the MaxPlanck Institute for Chemistry, Mainz, Germany.
3.1 Calculations
N2O water concentrations (CN2O) were calculated as fol-lows:
CN2O
[nmol L−1
]=
(β x P Vwp +
x P
R TVhs
)/Vwp (1)
whereβ stands for the Bunsen solubility in nmol L−1 atm−1
(Weiss and Price, 1980), x is the dry gas mole fraction ofN2O in the headspace in ppb, P is the atmospheric pressurein atm, Vwp and Vhs stand for the volumes of the waterand headspace phases, respectively. R is the gas constant(8.2054 10−2 L atm mol−1 K−1) and T is the temperatureduring equilibration. The salinity was measured by the CTD-Sensor during water sample collection. The overall relativemean analytical error was estimated to be±1.8 %.
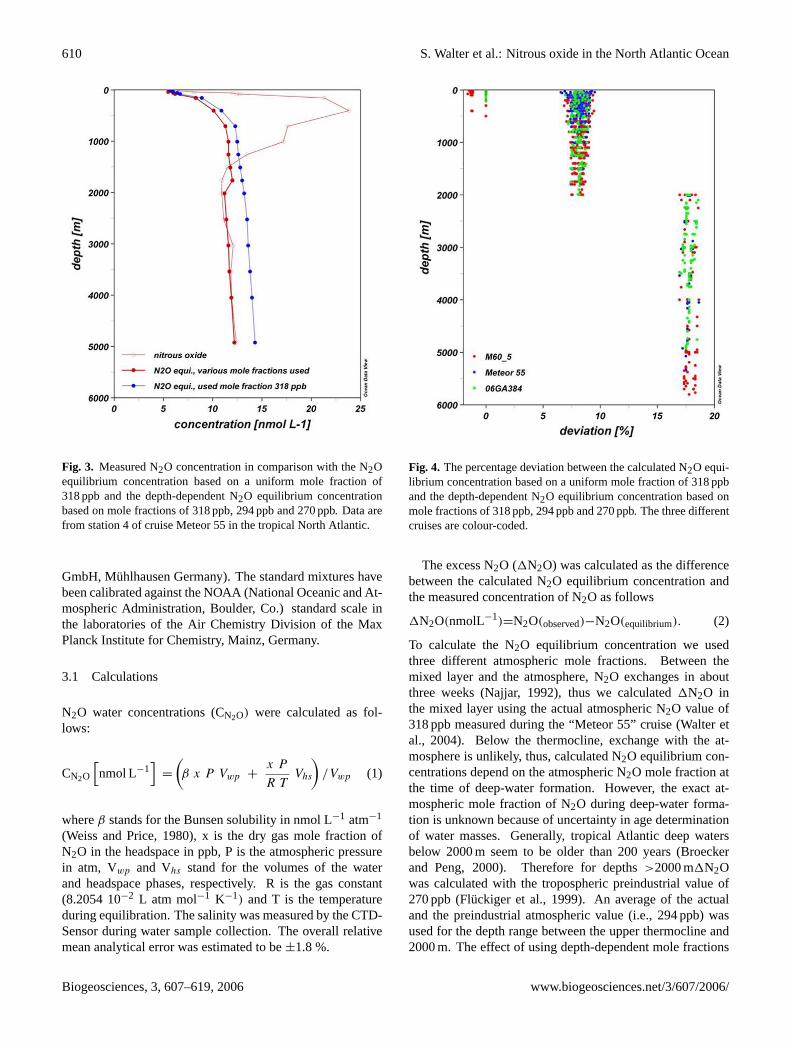
Fig. 4. The percentage deviation between the calculated N2O equi-librium concentration based on a uniform mole fraction of 318 ppband the depth-dependent N2O equilibrium concentration based onmole fractions of 318 ppb, 294 ppb and 270 ppb. The three differentcruises are colour-coded.
The excess N2O (1N2O) was calculated as the differencebetween the calculated N2O equilibrium concentration andthe measured concentration of N2O as follows
1N2O(nmolL−1)=N2O(observed)−N2O(equilibrium). (2)
To calculate the N2O equilibrium concentration we usedthree different atmospheric mole fractions. Between themixed layer and the atmosphere, N2O exchanges in aboutthree weeks (Najjar, 1992), thus we calculated1N2O inthe mixed layer using the actual atmospheric N2O value of318 ppb measured during the “Meteor 55” cruise (Walter etal., 2004). Below the thermocline, exchange with the at-mosphere is unlikely, thus, calculated N2O equilibrium con-centrations depend on the atmospheric N2O mole fraction atthe time of deep-water formation. However, the exact at-mospheric mole fraction of N2O during deep-water forma-tion is unknown because of uncertainty in age determinationof water masses. Generally, tropical Atlantic deep watersbelow 2000 m seem to be older than 200 years (Broeckerand Peng, 2000). Therefore for depths>2000 m1N2Owas calculated with the tropospheric preindustrial value of270 ppb (Fluckiger et al., 1999). An average of the actualand the preindustrial atmospheric value (i.e., 294 ppb) wasused for the depth range between the upper thermocline and2000 m. The effect of using depth-dependent mole fractions
Biogeosciences, 3, 607–619, 2006 www.biogeosciences.net/3/607/2006/
S. Walter et al.: Nitrous oxide in the North Atlantic Ocean 611
f05
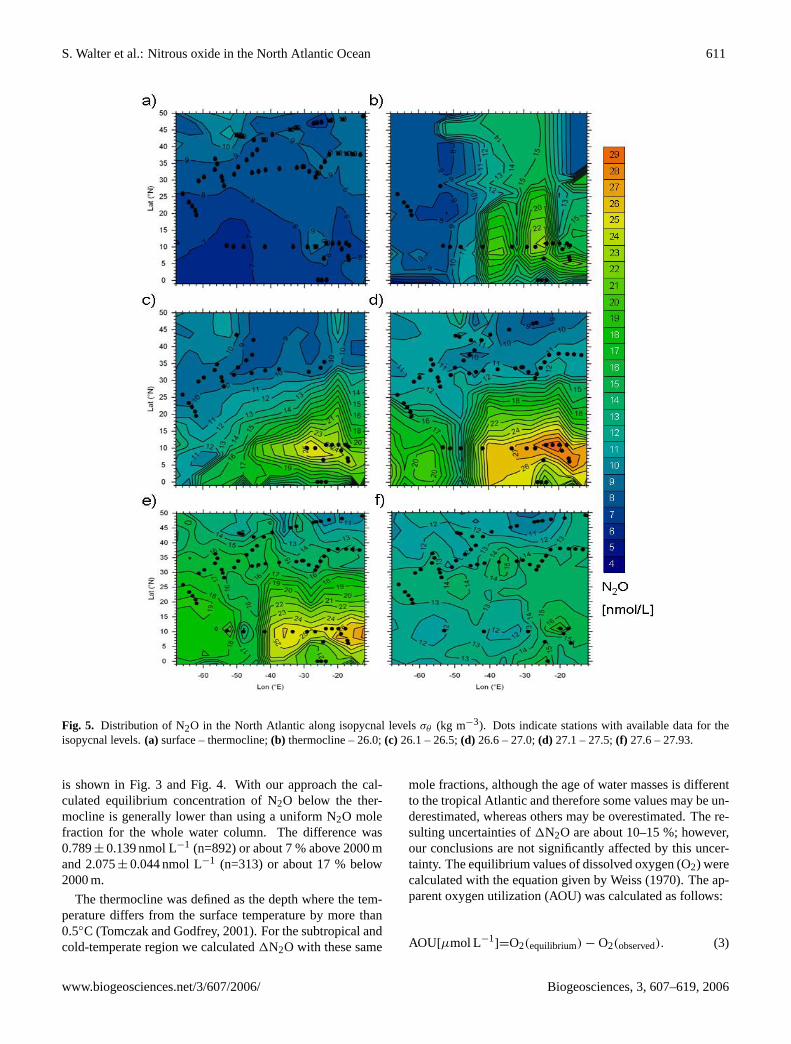
Fig. 5. Distribution of N2O in the North Atlantic along isopycnal levelsσθ (kg m−3). Dots indicate stations with available data for theisopycnal levels.(a) surface – thermocline;(b) thermocline – 26.0;(c) 26.1 – 26.5;(d) 26.6 – 27.0;(d) 27.1 – 27.5;(f) 27.6 – 27.93.
is shown in Fig. 3 and Fig. 4. With our approach the cal-culated equilibrium concentration of N2O below the ther-mocline is generally lower than using a uniform N2O molefraction for the whole water column. The difference was0.789± 0.139 nmol L−1 (n=892) or about 7 % above 2000 mand 2.075± 0.044 nmol L−1 (n=313) or about 17 % below2000 m.
The thermocline was defined as the depth where the tem-perature differs from the surface temperature by more than0.5◦C (Tomczak and Godfrey, 2001). For the subtropical andcold-temperate region we calculated1N2O with these same
mole fractions, although the age of water masses is differentto the tropical Atlantic and therefore some values may be un-derestimated, whereas others may be overestimated. The re-sulting uncertainties of1N2O are about 10–15 %; however,our conclusions are not significantly affected by this uncer-tainty. The equilibrium values of dissolved oxygen (O2) werecalculated with the equation given by Weiss (1970). The ap-parent oxygen utilization (AOU) was calculated as follows:
AOU[µmol L−1]=O2(equilibrium) − O2(observed). (3)
www.biogeosciences.net/3/607/2006/ Biogeosciences, 3, 607–619, 2006
612 S. Walter et al.: Nitrous oxide in the North Atlantic Ocean
f06
f07
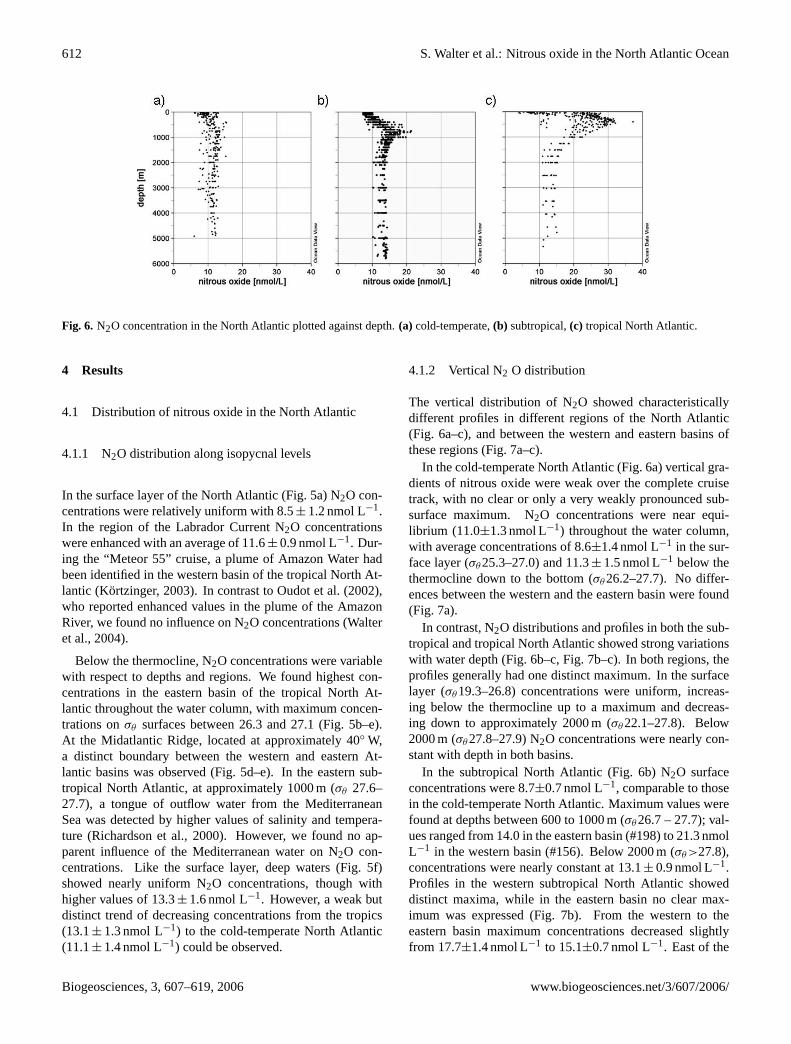
Fig. 6. N2O concentration in the North Atlantic plotted against depth.(a) cold-temperate,(b) subtropical,(c) tropical North Atlantic.
4 Results
4.1 Distribution of nitrous oxide in the North Atlantic
4.1.1 N2O distribution along isopycnal levels
In the surface layer of the North Atlantic (Fig. 5a) N2O con-centrations were relatively uniform with 8.5± 1.2 nmol L−1.In the region of the Labrador Current N2O concentrationswere enhanced with an average of 11.6± 0.9 nmol L−1. Dur-ing the “Meteor 55” cruise, a plume of Amazon Water hadbeen identified in the western basin of the tropical North At-lantic (Kortzinger, 2003). In contrast to Oudot et al. (2002),who reported enhanced values in the plume of the AmazonRiver, we found no influence on N2O concentrations (Walteret al., 2004).
Below the thermocline, N2O concentrations were variablewith respect to depths and regions. We found highest con-centrations in the eastern basin of the tropical North At-lantic throughout the water column, with maximum concen-trations onσθ surfaces between 26.3 and 27.1 (Fig. 5b–e).At the Midatlantic Ridge, located at approximately 40◦ W,a distinct boundary between the western and eastern At-lantic basins was observed (Fig. 5d–e). In the eastern sub-tropical North Atlantic, at approximately 1000 m (σθ 27.6–27.7), a tongue of outflow water from the MediterraneanSea was detected by higher values of salinity and tempera-ture (Richardson et al., 2000). However, we found no ap-parent influence of the Mediterranean water on N2O con-centrations. Like the surface layer, deep waters (Fig. 5f)showed nearly uniform N2O concentrations, though withhigher values of 13.3± 1.6 nmol L−1. However, a weak butdistinct trend of decreasing concentrations from the tropics(13.1± 1.3 nmol L−1) to the cold-temperate North Atlantic(11.1± 1.4 nmol L−1) could be observed.
4.1.2 Vertical N2 O distribution
The vertical distribution of N2O showed characteristicallydifferent profiles in different regions of the North Atlantic(Fig. 6a–c), and between the western and eastern basins ofthese regions (Fig. 7a–c).
In the cold-temperate North Atlantic (Fig. 6a) vertical gra-dients of nitrous oxide were weak over the complete cruisetrack, with no clear or only a very weakly pronounced sub-surface maximum. N2O concentrations were near equi-librium (11.0±1.3 nmol L−1) throughout the water column,with average concentrations of 8.6±1.4 nmol L−1 in the sur-face layer (σθ25.3–27.0) and 11.3± 1.5 nmol L−1 below thethermocline down to the bottom (σθ26.2–27.7). No differ-ences between the western and the eastern basin were found(Fig. 7a).
In contrast, N2O distributions and profiles in both the sub-tropical and tropical North Atlantic showed strong variationswith water depth (Fig. 6b–c, Fig. 7b–c). In both regions, theprofiles generally had one distinct maximum. In the surfacelayer (σθ19.3–26.8) concentrations were uniform, increas-ing below the thermocline up to a maximum and decreas-ing down to approximately 2000 m (σθ22.1–27.8). Below2000 m (σθ27.8–27.9) N2O concentrations were nearly con-stant with depth in both basins.
In the subtropical North Atlantic (Fig. 6b) N2O surfaceconcentrations were 8.7±0.7 nmol L−1, comparable to thosein the cold-temperate North Atlantic. Maximum values werefound at depths between 600 to 1000 m (σθ26.7 – 27.7); val-ues ranged from 14.0 in the eastern basin (#198) to 21.3 nmolL−1 in the western basin (#156). Below 2000 m (σθ>27.8),concentrations were nearly constant at 13.1± 0.9 nmol L−1.Profiles in the western subtropical North Atlantic showeddistinct maxima, while in the eastern basin no clear max-imum was expressed (Fig. 7b). From the western to theeastern basin maximum concentrations decreased slightlyfrom 17.7±1.4 nmol L−1 to 15.1±0.7 nmol L−1. East of the
Biogeosciences, 3, 607–619, 2006 www.biogeosciences.net/3/607/2006/
S. Walter et al.: Nitrous oxide in the North Atlantic Ocean 613
f06
f07
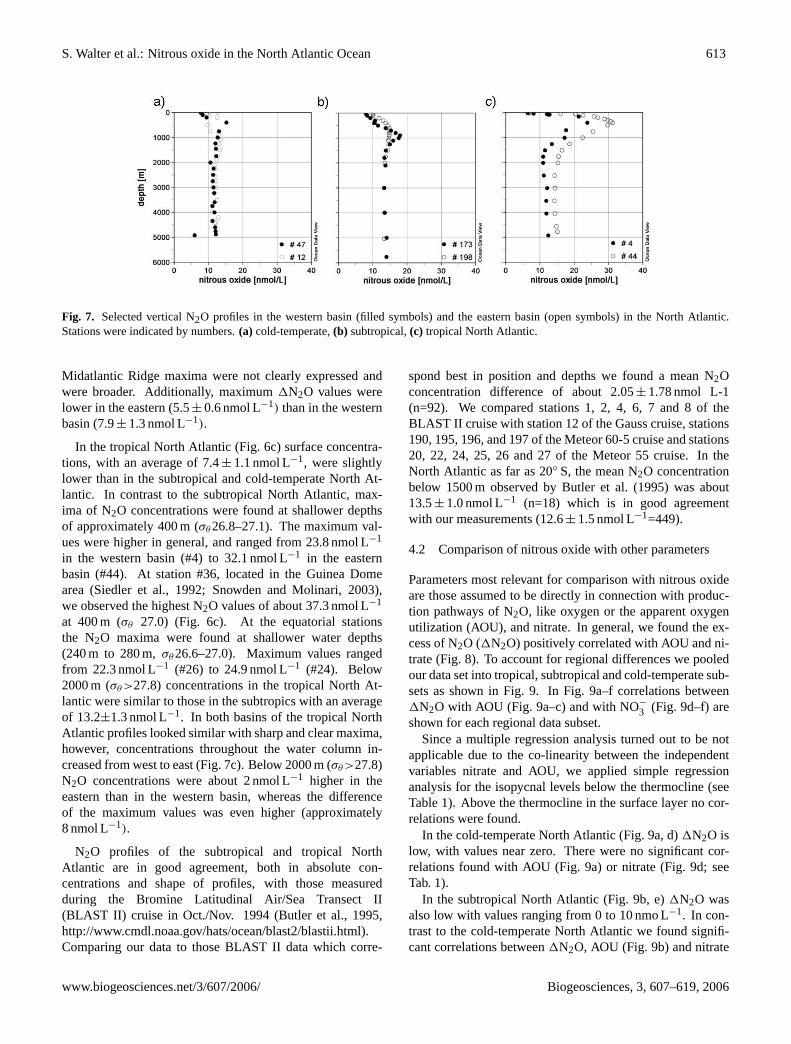
Fig. 7. Selected vertical N2O profiles in the western basin (filled symbols) and the eastern basin (open symbols) in the North Atlantic.Stations were indicated by numbers.(a) cold-temperate,(b) subtropical,(c) tropical North Atlantic.
Midatlantic Ridge maxima were not clearly expressed andwere broader. Additionally, maximum1N2O values werelower in the eastern (5.5± 0.6 nmol L−1) than in the westernbasin (7.9± 1.3 nmol L−1).
In the tropical North Atlantic (Fig. 6c) surface concentra-tions, with an average of 7.4± 1.1 nmol L−1, were slightlylower than in the subtropical and cold-temperate North At-lantic. In contrast to the subtropical North Atlantic, max-ima of N2O concentrations were found at shallower depthsof approximately 400 m (σθ26.8–27.1). The maximum val-ues were higher in general, and ranged from 23.8 nmol L−1
in the western basin (#4) to 32.1 nmol L−1 in the easternbasin (#44). At station #36, located in the Guinea Domearea (Siedler et al., 1992; Snowden and Molinari, 2003),we observed the highest N2O values of about 37.3 nmol L−1
at 400 m (σθ 27.0) (Fig. 6c). At the equatorial stationsthe N2O maxima were found at shallower water depths(240 m to 280 m,σθ26.6–27.0). Maximum values rangedfrom 22.3 nmol L−1 (#26) to 24.9 nmol L−1 (#24). Below2000 m (σθ>27.8) concentrations in the tropical North At-lantic were similar to those in the subtropics with an averageof 13.2±1.3 nmol L−1. In both basins of the tropical NorthAtlantic profiles looked similar with sharp and clear maxima,however, concentrations throughout the water column in-creased from west to east (Fig. 7c). Below 2000 m (σθ>27.8)N2O concentrations were about 2 nmol L−1 higher in theeastern than in the western basin, whereas the differenceof the maximum values was even higher (approximately8 nmol L−1).
N2O profiles of the subtropical and tropical NorthAtlantic are in good agreement, both in absolute con-centrations and shape of profiles, with those measuredduring the Bromine Latitudinal Air/Sea Transect II(BLAST II) cruise in Oct./Nov. 1994 (Butler et al., 1995,http://www.cmdl.noaa.gov/hats/ocean/blast2/blastii.html).Comparing our data to those BLAST II data which corre-
spond best in position and depths we found a mean N2Oconcentration difference of about 2.05± 1.78 nmol L-1(n=92). We compared stations 1, 2, 4, 6, 7 and 8 of theBLAST II cruise with station 12 of the Gauss cruise, stations190, 195, 196, and 197 of the Meteor 60-5 cruise and stations20, 22, 24, 25, 26 and 27 of the Meteor 55 cruise. In theNorth Atlantic as far as 20◦ S, the mean N2O concentrationbelow 1500 m observed by Butler et al. (1995) was about13.5± 1.0 nmol L−1 (n=18) which is in good agreementwith our measurements (12.6± 1.5 nmol L−1=449).
4.2 Comparison of nitrous oxide with other parameters
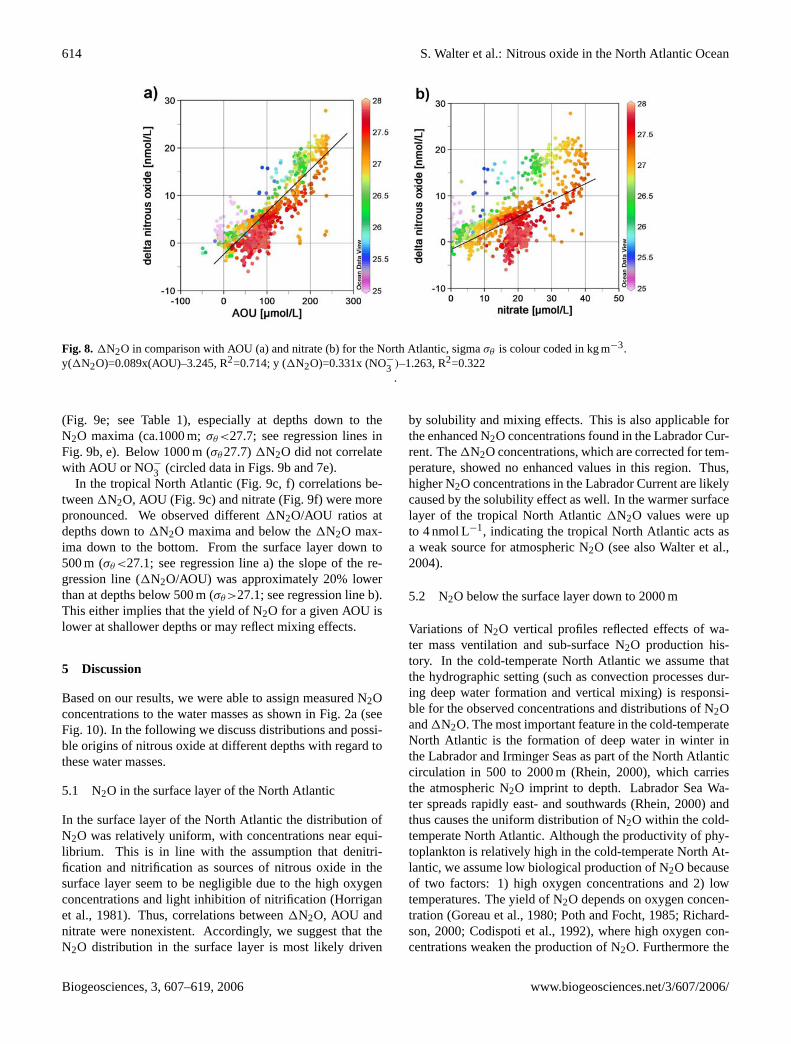
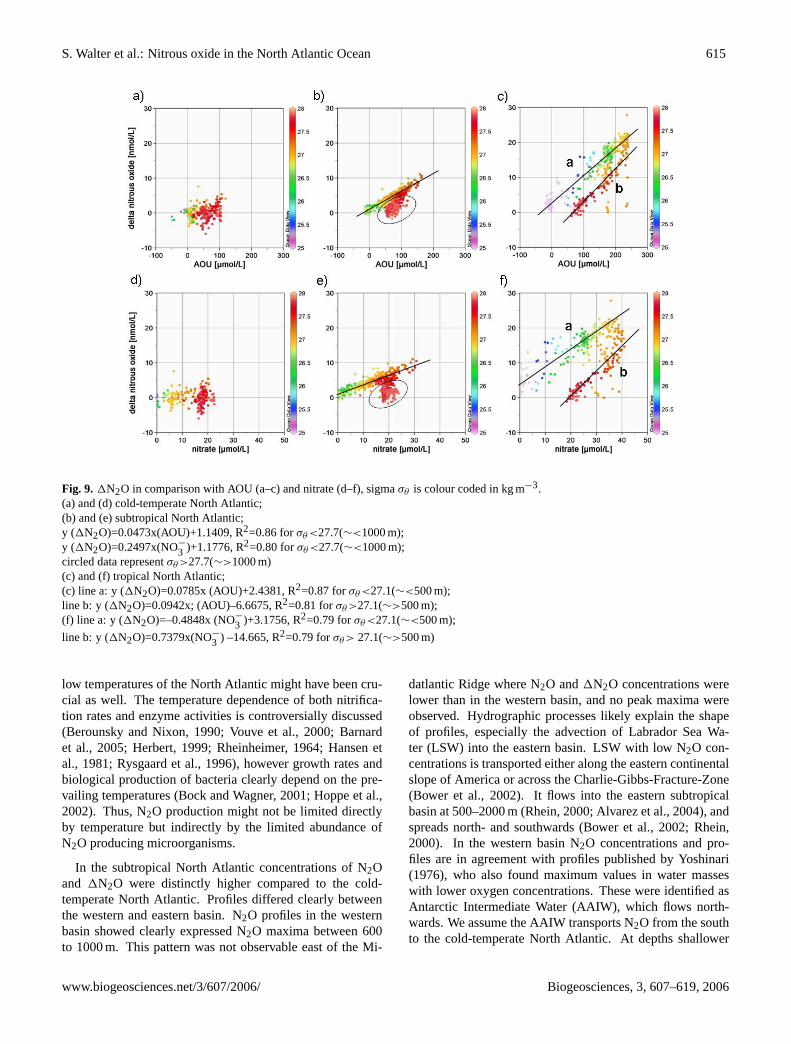
Parameters most relevant for comparison with nitrous oxideare those assumed to be directly in connection with produc-tion pathways of N2O, like oxygen or the apparent oxygenutilization (AOU), and nitrate. In general, we found the ex-cess of N2O (1N2O) positively correlated with AOU and ni-trate (Fig. 8). To account for regional differences we pooledour data set into tropical, subtropical and cold-temperate sub-sets as shown in Fig. 9. In Fig. 9a–f correlations between1N2O with AOU (Fig. 9a–c) and with NO−3 (Fig. 9d–f) areshown for each regional data subset.
Since a multiple regression analysis turned out to be notapplicable due to the co-linearity between the independentvariables nitrate and AOU, we applied simple regressionanalysis for the isopycnal levels below the thermocline (seeTable 1). Above the thermocline in the surface layer no cor-relations were found.
In the cold-temperate North Atlantic (Fig. 9a, d)1N2O islow, with values near zero. There were no significant cor-relations found with AOU (Fig. 9a) or nitrate (Fig. 9d; seeTab. 1).
In the subtropical North Atlantic (Fig. 9b, e)1N2O wasalso low with values ranging from 0 to 10 nmo L−1. In con-trast to the cold-temperate North Atlantic we found signifi-cant correlations between1N2O, AOU (Fig. 9b) and nitrate
www.biogeosciences.net/3/607/2006/ Biogeosciences, 3, 607–619, 2006
614 S. Walter et al.: Nitrous oxide in the North Atlantic Ocean
f08
f09
Fig. 8. 1N2O in comparison with AOU (a) and nitrate (b) for the North Atlantic, sigmaσθ is colour coded in kg m−3.y(1N2O)=0.089x(AOU)–3.245, R2=0.714; y (1N2O)=0.331x (NO−3 )–1.263, R2=0.322
.
(Fig. 9e; see Table 1), especially at depths down to theN2O maxima (ca.1000 m;σθ<27.7; see regression lines inFig. 9b, e). Below 1000 m (σθ27.7)1N2O did not correlatewith AOU or NO−
3 (circled data in Figs. 9b and 7e).In the tropical North Atlantic (Fig. 9c, f) correlations be-
tween1N2O, AOU (Fig. 9c) and nitrate (Fig. 9f) were morepronounced. We observed different1N2O/AOU ratios atdepths down to1N2O maxima and below the1N2O max-ima down to the bottom. From the surface layer down to500 m (σθ<27.1; see regression line a) the slope of the re-gression line (1N2O/AOU) was approximately 20% lowerthan at depths below 500 m (σθ>27.1; see regression line b).This either implies that the yield of N2O for a given AOU islower at shallower depths or may reflect mixing effects.
5 Discussion
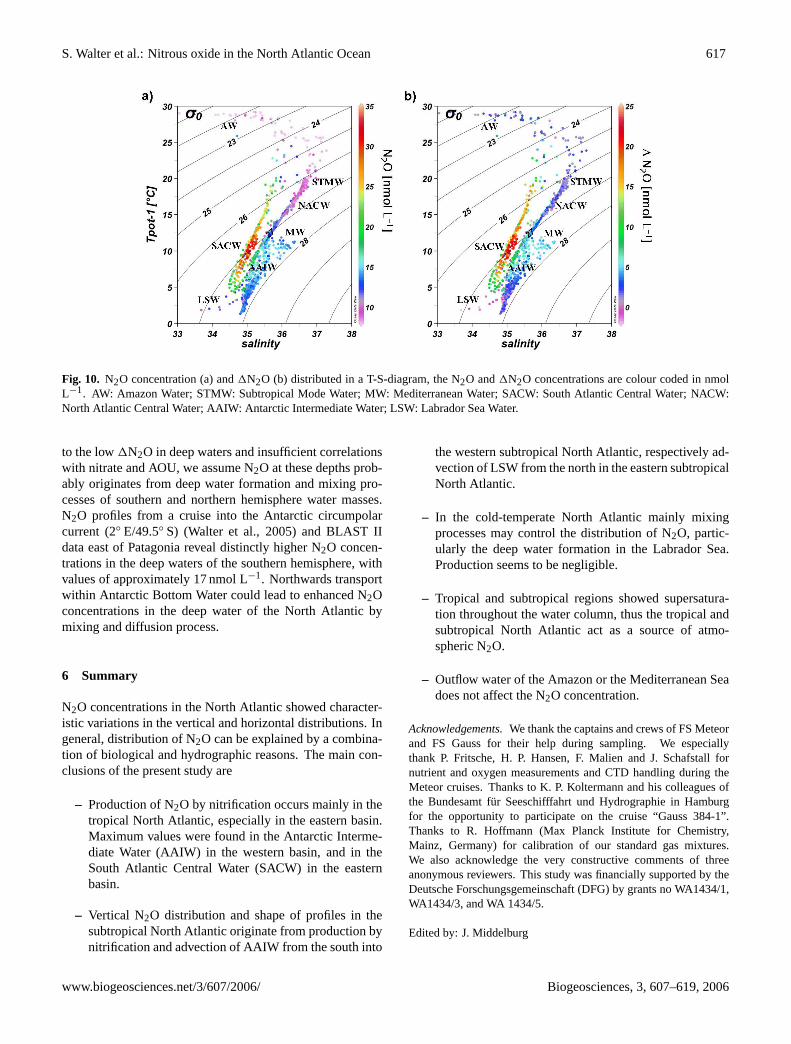
Based on our results, we were able to assign measured N2Oconcentrations to the water masses as shown in Fig. 2a (seeFig. 10). In the following we discuss distributions and possi-ble origins of nitrous oxide at different depths with regard tothese water masses.
5.1 N2O in the surface layer of the North Atlantic
In the surface layer of the North Atlantic the distribution ofN2O was relatively uniform, with concentrations near equi-librium. This is in line with the assumption that denitri-fication and nitrification as sources of nitrous oxide in thesurface layer seem to be negligible due to the high oxygenconcentrations and light inhibition of nitrification (Horriganet al., 1981). Thus, correlations between1N2O, AOU andnitrate were nonexistent. Accordingly, we suggest that theN2O distribution in the surface layer is most likely driven
by solubility and mixing effects. This is also applicable forthe enhanced N2O concentrations found in the Labrador Cur-rent. The1N2O concentrations, which are corrected for tem-perature, showed no enhanced values in this region. Thus,higher N2O concentrations in the Labrador Current are likelycaused by the solubility effect as well. In the warmer surfacelayer of the tropical North Atlantic1N2O values were upto 4 nmol L−1, indicating the tropical North Atlantic acts asa weak source for atmospheric N2O (see also Walter et al.,2004).
5.2 N2O below the surface layer down to 2000 m
Variations of N2O vertical profiles reflected effects of wa-ter mass ventilation and sub-surface N2O production his-tory. In the cold-temperate North Atlantic we assume thatthe hydrographic setting (such as convection processes dur-ing deep water formation and vertical mixing) is responsi-ble for the observed concentrations and distributions of N2Oand1N2O. The most important feature in the cold-temperateNorth Atlantic is the formation of deep water in winter inthe Labrador and Irminger Seas as part of the North Atlanticcirculation in 500 to 2000 m (Rhein, 2000), which carriesthe atmospheric N2O imprint to depth. Labrador Sea Wa-ter spreads rapidly east- and southwards (Rhein, 2000) andthus causes the uniform distribution of N2O within the cold-temperate North Atlantic. Although the productivity of phy-toplankton is relatively high in the cold-temperate North At-lantic, we assume low biological production of N2O becauseof two factors: 1) high oxygen concentrations and 2) lowtemperatures. The yield of N2O depends on oxygen concen-tration (Goreau et al., 1980; Poth and Focht, 1985; Richard-son, 2000; Codispoti et al., 1992), where high oxygen con-centrations weaken the production of N2O. Furthermore the
Biogeosciences, 3, 607–619, 2006 www.biogeosciences.net/3/607/2006/
S. Walter et al.: Nitrous oxide in the North Atlantic Ocean 615
f08
f09
Fig. 9. 1N2O in comparison with AOU (a–c) and nitrate (d–f), sigmaσθ is colour coded in kg m−3.(a) and (d) cold-temperate North Atlantic;(b) and (e) subtropical North Atlantic;y (1N2O)=0.0473x(AOU)+1.1409, R2=0.86 forσθ<27.7(∼<1000 m);y (1N2O)=0.2497x(NO−3 )+1.1776, R2=0.80 forσθ<27.7(∼<1000 m);circled data representσθ>27.7(∼>1000 m)(c) and (f) tropical North Atlantic;(c) line a: y (1N2O)=0.0785x (AOU)+2.4381, R2=0.87 forσθ<27.1(∼<500 m);line b: y (1N2O)=0.0942x; (AOU)–6.6675, R2=0.81 forσθ>27.1(∼>500 m);(f) line a: y (1N2O)=–0.4848x (NO−3 )+3.1756, R2=0.79 forσθ<27.1(∼<500 m);
line b: y (1N2O)=0.7379x(NO−3 ) –14.665, R2=0.79 forσθ> 27.1(∼>500 m)
low temperatures of the North Atlantic might have been cru-cial as well. The temperature dependence of both nitrifica-tion rates and enzyme activities is controversially discussed(Berounsky and Nixon, 1990; Vouve et al., 2000; Barnardet al., 2005; Herbert, 1999; Rheinheimer, 1964; Hansen etal., 1981; Rysgaard et al., 1996), however growth rates andbiological production of bacteria clearly depend on the pre-vailing temperatures (Bock and Wagner, 2001; Hoppe et al.,2002). Thus, N2O production might not be limited directlyby temperature but indirectly by the limited abundance ofN2O producing microorganisms.
In the subtropical North Atlantic concentrations of N2Oand 1N2O were distinctly higher compared to the cold-temperate North Atlantic. Profiles differed clearly betweenthe western and eastern basin. N2O profiles in the westernbasin showed clearly expressed N2O maxima between 600to 1000 m. This pattern was not observable east of the Mi-
datlantic Ridge where N2O and1N2O concentrations werelower than in the western basin, and no peak maxima wereobserved. Hydrographic processes likely explain the shapeof profiles, especially the advection of Labrador Sea Wa-ter (LSW) into the eastern basin. LSW with low N2O con-centrations is transported either along the eastern continentalslope of America or across the Charlie-Gibbs-Fracture-Zone(Bower et al., 2002). It flows into the eastern subtropicalbasin at 500–2000 m (Rhein, 2000; Alvarez et al., 2004), andspreads north- and southwards (Bower et al., 2002; Rhein,2000). In the western basin N2O concentrations and pro-files are in agreement with profiles published by Yoshinari(1976), who also found maximum values in water masseswith lower oxygen concentrations. These were identified asAntarctic Intermediate Water (AAIW), which flows north-wards. We assume the AAIW transports N2O from the southto the cold-temperate North Atlantic. At depths shallower
www.biogeosciences.net/3/607/2006/ Biogeosciences, 3, 607–619, 2006
616 S. Walter et al.: Nitrous oxide in the North Atlantic Ocean
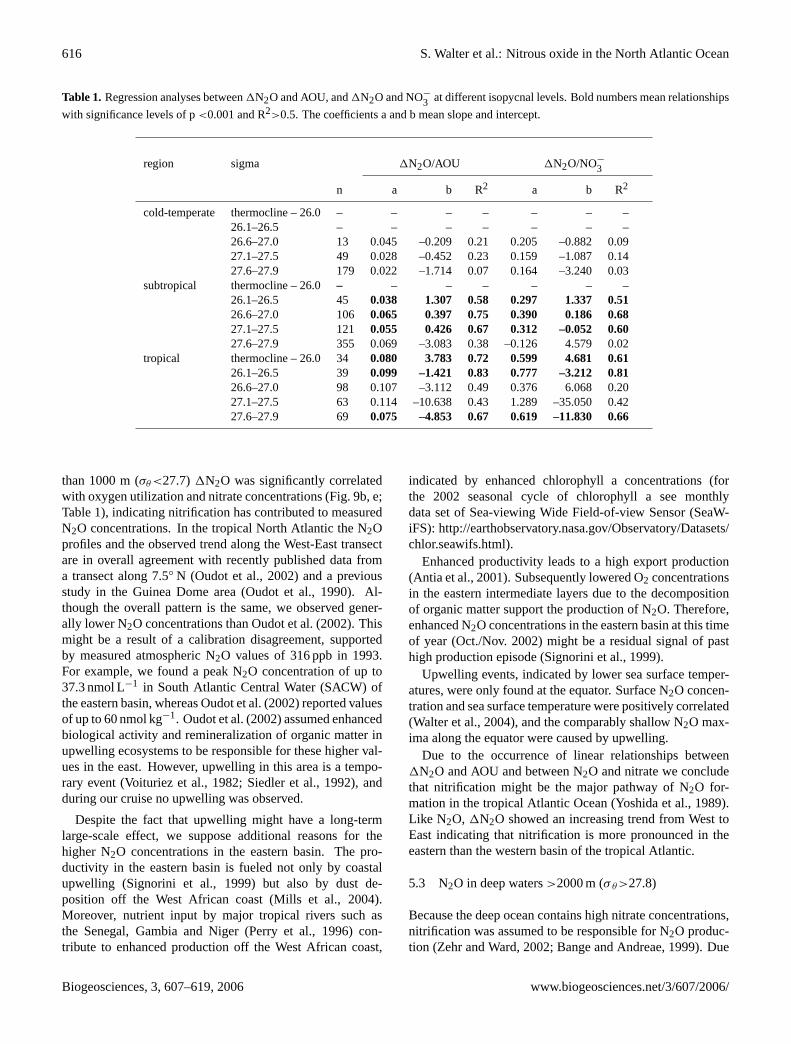
Table 1. Regression analyses between1N2O and AOU, and1N2O and NO−
3 at different isopycnal levels. Bold numbers mean relationships
with significance levels of p<0.001 and R2>0.5. The coefficients a and b mean slope and intercept.
region sigma 1N2O/AOU 1N2O/NO−
3
n a b R2 a b R2
cold-temperate thermocline – 26.0 – – – – – – –26.1–26.5 – – – – – – –26.6–27.0 13 0.045 –0.209 0.21 0.205 –0.882 0.0927.1–27.5 49 0.028 –0.452 0.23 0.159 –1.087 0.1427.6–27.9 179 0.022 –1.714 0.07 0.164 –3.240 0.03
subtropical thermocline – 26.0 – – – – – – –26.1–26.5 45 0.038 1.307 0.58 0.297 1.337 0.5126.6–27.0 106 0.065 0.397 0.75 0.390 0.186 0.6827.1–27.5 121 0.055 0.426 0.67 0.312 –0.052 0.6027.6–27.9 355 0.069 –3.083 0.38 –0.126 4.579 0.02
tropical thermocline – 26.0 34 0.080 3.783 0.72 0.599 4.681 0.6126.1–26.5 39 0.099 –1.421 0.83 0.777 –3.212 0.8126.6–27.0 98 0.107 –3.112 0.49 0.376 6.068 0.2027.1–27.5 63 0.114 –10.638 0.43 1.289 –35.050 0.4227.6–27.9 69 0.075 –4.853 0.67 0.619 –11.830 0.66
than 1000 m (σθ<27.7)1N2O was significantly correlatedwith oxygen utilization and nitrate concentrations (Fig. 9b, e;Table 1), indicating nitrification has contributed to measuredN2O concentrations. In the tropical North Atlantic the N2Oprofiles and the observed trend along the West-East transectare in overall agreement with recently published data froma transect along 7.5◦ N (Oudot et al., 2002) and a previousstudy in the Guinea Dome area (Oudot et al., 1990). Al-though the overall pattern is the same, we observed gener-ally lower N2O concentrations than Oudot et al. (2002). Thismight be a result of a calibration disagreement, supportedby measured atmospheric N2O values of 316 ppb in 1993.For example, we found a peak N2O concentration of up to37.3 nmol L−1 in South Atlantic Central Water (SACW) ofthe eastern basin, whereas Oudot et al. (2002) reported valuesof up to 60 nmol kg−1. Oudot et al. (2002) assumed enhancedbiological activity and remineralization of organic matter inupwelling ecosystems to be responsible for these higher val-ues in the east. However, upwelling in this area is a tempo-rary event (Voituriez et al., 1982; Siedler et al., 1992), andduring our cruise no upwelling was observed.
Despite the fact that upwelling might have a long-termlarge-scale effect, we suppose additional reasons for thehigher N2O concentrations in the eastern basin. The pro-ductivity in the eastern basin is fueled not only by coastalupwelling (Signorini et al., 1999) but also by dust de-position off the West African coast (Mills et al., 2004).Moreover, nutrient input by major tropical rivers such asthe Senegal, Gambia and Niger (Perry et al., 1996) con-tribute to enhanced production off the West African coast,
indicated by enhanced chlorophyll a concentrations (forthe 2002 seasonal cycle of chlorophyll a see monthlydata set of Sea-viewing Wide Field-of-view Sensor (SeaW-iFS): http://earthobservatory.nasa.gov/Observatory/Datasets/chlor.seawifs.html).
Enhanced productivity leads to a high export production(Antia et al., 2001). Subsequently lowered O2 concentrationsin the eastern intermediate layers due to the decompositionof organic matter support the production of N2O. Therefore,enhanced N2O concentrations in the eastern basin at this timeof year (Oct./Nov. 2002) might be a residual signal of pasthigh production episode (Signorini et al., 1999).
Upwelling events, indicated by lower sea surface temper-atures, were only found at the equator. Surface N2O concen-tration and sea surface temperature were positively correlated(Walter et al., 2004), and the comparably shallow N2O max-ima along the equator were caused by upwelling.
Due to the occurrence of linear relationships between1N2O and AOU and between N2O and nitrate we concludethat nitrification might be the major pathway of N2O for-mation in the tropical Atlantic Ocean (Yoshida et al., 1989).Like N2O, 1N2O showed an increasing trend from West toEast indicating that nitrification is more pronounced in theeastern than the western basin of the tropical Atlantic.
5.3 N2O in deep waters>2000 m (σ θ>27.8)
Because the deep ocean contains high nitrate concentrations,nitrification was assumed to be responsible for N2O produc-tion (Zehr and Ward, 2002; Bange and Andreae, 1999). Due
Biogeosciences, 3, 607–619, 2006 www.biogeosciences.net/3/607/2006/
S. Walter et al.: Nitrous oxide in the North Atlantic Ocean 617
f010
Fig. 10. N2O concentration (a) and1N2O (b) distributed in a T-S-diagram, the N2O and1N2O concentrations are colour coded in nmolL−1. AW: Amazon Water; STMW: Subtropical Mode Water; MW: Mediterranean Water; SACW: South Atlantic Central Water; NACW:North Atlantic Central Water; AAIW: Antarctic Intermediate Water; LSW: Labrador Sea Water.
to the low1N2O in deep waters and insufficient correlationswith nitrate and AOU, we assume N2O at these depths prob-ably originates from deep water formation and mixing pro-cesses of southern and northern hemisphere water masses.N2O profiles from a cruise into the Antarctic circumpolarcurrent (2◦ E/49.5◦ S) (Walter et al., 2005) and BLAST IIdata east of Patagonia reveal distinctly higher N2O concen-trations in the deep waters of the southern hemisphere, withvalues of approximately 17 nmol L−1. Northwards transportwithin Antarctic Bottom Water could lead to enhanced N2Oconcentrations in the deep water of the North Atlantic bymixing and diffusion process.
6 Summary
N2O concentrations in the North Atlantic showed character-istic variations in the vertical and horizontal distributions. Ingeneral, distribution of N2O can be explained by a combina-tion of biological and hydrographic reasons. The main con-clusions of the present study are
– Production of N2O by nitrification occurs mainly in thetropical North Atlantic, especially in the eastern basin.Maximum values were found in the Antarctic Interme-diate Water (AAIW) in the western basin, and in theSouth Atlantic Central Water (SACW) in the easternbasin.
– Vertical N2O distribution and shape of profiles in thesubtropical North Atlantic originate from production bynitrification and advection of AAIW from the south into
the western subtropical North Atlantic, respectively ad-vection of LSW from the north in the eastern subtropicalNorth Atlantic.
– In the cold-temperate North Atlantic mainly mixingprocesses may control the distribution of N2O, partic-ularly the deep water formation in the Labrador Sea.Production seems to be negligible.
– Tropical and subtropical regions showed supersatura-tion throughout the water column, thus the tropical andsubtropical North Atlantic act as a source of atmo-spheric N2O.
– Outflow water of the Amazon or the Mediterranean Seadoes not affect the N2O concentration.
Acknowledgements.We thank the captains and crews of FS Meteorand FS Gauss for their help during sampling. We especiallythank P. Fritsche, H. P. Hansen, F. Malien and J. Schafstall fornutrient and oxygen measurements and CTD handling during theMeteor cruises. Thanks to K. P. Koltermann and his colleagues ofthe Bundesamt fur Seeschifffahrt und Hydrographie in Hamburgfor the opportunity to participate on the cruise “Gauss 384-1”.Thanks to R. Hoffmann (Max Planck Institute for Chemistry,Mainz, Germany) for calibration of our standard gas mixtures.We also acknowledge the very constructive comments of threeanonymous reviewers. This study was financially supported by theDeutsche Forschungsgemeinschaft (DFG) by grants no WA1434/1,WA1434/3, and WA 1434/5.
Edited by: J. Middelburg
www.biogeosciences.net/3/607/2006/ Biogeosciences, 3, 607–619, 2006
618 S. Walter et al.: Nitrous oxide in the North Atlantic Ocean
References
Aiken, J., Rees, N., Hooker, S., Holligan, P., Bale, A., Robins, D.,Moore, G., Harris, R., and Pilgrim, D.: The Atlantic MeridionalTransect: overview and synthesis of data, Prog. Oceanogr., 45(3–4), 257–312, 2000.
Alvarez, M., Perez, F. F., Bryden, H., and Rios, A. F.: Physicaland biogeochemical transports structure in the North Atlanticsubpolar gyre, J. Geophys. Res.-Oceans, 109(C3), 109, C03027,doi:10.1029/2003JC002015, 2004.
Antia, A. N., Koeve, W., Fischer, G., Blanz, T., Schulz-Bull,D., Scholten, J., Neuer, S., Kremling, K., Kuss, J., Peinert,R., Hebbeln, D., Bathmann, U., Conte, M., Fehner, U., andZeitzschel, B.: Basin-wide particulate carbon flux in the AtlanticOcean: Regional export patterns and potential for atmosphericCO2 sequestration, Glob. Biogeochem. Cycles, 15(4), 845–862,2001.
Bange, H. W., and Andreae, M.O.: Nitrous oxide in the deep watersof the world’s oceans, Glob. Biogeochem. Cycles, 13(4), 1127–1135, 1999.
Bange, H. W., Rapsomanikis, S., and Andreae, M. O.: Nitrous oxidecycling in the Arabian Sea, J. Geophys. Res.-Oceans, 106(C1),1053–1065, 2001.
Barnard, R., Leadley, P. W., and Hungate, B. A.: Global change,nitrification, and denitrification: A review, Glob. Biogeochem.Cycles, 19, doi:10.1029/2004GB002282, 2005.
Berounsky, V. M., and Nixon, S. W.: Temperature and the an-nual cycle of nitrification in waters of Narragansett Bay, Limnol.Oceanogr., 35(7), 1610–1617, 1990.
Bock, E. and Wagner, M.: Oxidation of inorganic nitrogen com-pounds as an energy source, in: The Prokaryotes: An Evolv-ing Electronic Resource for the Microbiological Community, 3rd
edition, release 3.7, Springer Verlag, New York, 2001.Bower, A. S., Le Cann, B.,. Rossby, T., Zenk, W., Gould, J., Speer,
K., Richardson, P. L., Prater, M. D., and Zhang, H. M.: Di-rectly measured mid-depth circulation in the northeastern NorthAtlantic Ocean, Nature, 419(6907), 603–607, 2002.
Broecker, W. S. and Peng, T.-H.: Comparison of39Ar and14C agesfor waters in the deep ocean, Nucl. Instrum. Meth. B, 172, 473–478, 2000.
Butler, J. H., Lobert, J. M., Yvon, S. A., and Geller, L. S.: Thedistribution and cycling of halogenated trace gases, in: Reportson Polar Research No. 168 - The expedition ANTARKTIS XIIof RV “Polarstern” in 1994/95: Reports of legs ANT XII/1 and2, edited by: Kattner, G. and Futterer, D. K., pp. 33–40, AlfredWegener Institute for Polar and Marine Research, Bremerhaven,1995.
Codispoti, L. A., Brandes, J. A., Christensen, J. P., Devol, A. H.,Naqvi, S. W. A., Paerl, H. W., and Yoshinari, T.: The oceanicfixed nitrogen and nitrous oxide budgets: Moving targets as weenter the anthropocene?, Sci. Mar., 65(Suppl. 2), 85–105, 2001.
Codispoti, L. A., Elkins, J. W., Yoshinari, T., Friederich, G. E.,Sakamoto, C. M., and Packard, T. T.: On the nitrous oxide fluxfrom productive regions that contain low oxygen waters, 271–284 pp., Oxford and IBH, New Delhi (India), 1992.
Cohen, Y. and Gordon, L. I.: Nitrous oxide in the oxygen mini-mum of the eastern tropical North Pacific: evidence for its con-sumption during denitrification and possible mechanisms for itsproduction, Deep-Sea Res., 25(6), 509–524, 1978.
Fluckiger, J., Dallenbach, A., Blunier, T., Stauffer, B., Stocker, T.
F., Raynaud, D., and Barnola, J. M.: Variations in atmosphericN2O concentration during abrupt climatic changes, Science, 285,5425, 227–230, 1999.
Fratantoni, D. M. and Glickson, D. A.: North Brazil currentring generation and evolution observed with SeaWiFS, J. Phys.Oceanogr., 32, 3, 1058–1074, 2002.
Gordon, A. L.: Interocean exchange of thermohaline water, J. Geo-phys. Res., 91, 5037–5047, 1986.
Goreau, T. J., Kaplan, W. A., Wofsy, S. C., McElroy, M. B., Val-ois, F. W., and Watson, S. W.: Production of NO−
2 and N2Oby nitrifying bacteria at reduced concentrations of oxygen, Appl.Environ. Microbiol., 40, 3, 526–532, 1980.
Hansen, J. I., Blackburn, T. H., and Henriksen, K.: Seasonal dis-tribution of nitrifying bacteria and rates of nitrification in coastalmarine sediments, Microb. Ecol., 7, 4, 297–304, 1981.
Herbert, R. A.: Nitrogen cycling in coastal marine ecosystems,FEMS Microbiol. Rev., 23, 563–590, 1999.
Hoppe, H. G., Gocke, K., Koppe, R., and Begler, C.: Bacterialgrowth and primary production along a north-south transect ofthe Atlantic Ocean, Nature, 416(6877), 168–171, 2002.
Horrigan, S. G., Carlucci, A. F., and Williams, P. M.: Light inhi-bition of nitrification in sea-surface films, J. Mar. Res., 39, 3,557–565, 1981.
Joyce, T. M., Hernandez-Guerra, A., and Smethie, W. M.: Zonalcirculation in the NW Atlantic and Caribbean from a merid-ional World Ocean Circulation Experiment hydrographic sectionat 66◦ W, J. Geophys. Res.-Oceans, 106(C10), 22 095–22 113,2001.
Junge, C. and Hahn, J.: N2O measurements in the North Atlantic,J. Geophys. Res., 76(33), 8143–8146, 1971.
Kortzinger, A.: A significant CO2 sink in the tropical AtlanticOcean associated with the Amazon River plume, Geophys. Res.Lett., 30, 24, 2287, doi: 10.1029/2003GL018841, 2003.
Krauss, W.: Comments on the development of our knowledge of thegeneral circulation of the North Atlantic Ocean, The Warmwater-sphere of the North Atlantic Ocean, edited by: Krauss, W., 1–31,Gebruder Borntraeger, Berlin-Stuttgart, 1996.
Lorbacher, K.: Niederfrequente Variabilitat meridionaler Trans-porte in der Divergenzzone des nordatlantischen Subtropen- undSubpolarwirbels - Der WOCE-Schnitt A2, Bericht des Bunde-samtes fur Seeschifffahrt und Hydrographie, 22, 156, 2000.
Mills, M. M., Ridame, C., Davey, M., La Roche, J., and Geider, R.J.: Iron and phosphorus co-limit nitrogen fixation in the easternNorth Atlantic, Nature, 429, 292–294, 2004.
Najjar, R. G.: Marine biogeochemistry, in: Climate System Model-ing, edited by: Trenberth, K. E., pp. 241–280, Cambridge Uni-versity Press, Cambridge, 1992.
Oudot, C., Andrie, C., and Montel, Y.: Nitrous oxide productionin the tropical Atlantic Ocean, Deep-Sea Res. I, 37(2), 183–202,1990.
Oudot, C., Jean-Baptiste, P., Fourre, E., Mormiche, C., Guevel, M.,Ternon, J.-F., and Le Corre, P.: Transatlantic equatorial distribu-tion of nitrous oxide and methane, Deep-Sea Res.I, 49, 1175–1193, 2002.
Perry, G. D., Duffy, P. B., and Miller, N. L.: An extended data setof river discharges for validation of general circulation models,J. Geophys. Res., 101(D16), 21 339–21 349, 1996.
Poole, R. and Tomczak, M.: Optimum multiparameter analysisof the water mass structure in the Atlantic Ocean thermocline,
Biogeosciences, 3, 607–619, 2006 www.biogeosciences.net/3/607/2006/
S. Walter et al.: Nitrous oxide in the North Atlantic Ocean 619
Deep-Sea Res.I-Oceanographic Research Papers, 46(11), 1895–1921, 1999.
Popp, B. N., Westley, M. B., Toyoda, S., Miwa, T., Dore, J. E.,Yoshida, N., Rust, T. M., Sansone, F. J., Russ, M. E., Ostrom,N. E., and Ostrom, P. H.: Nitrogen and oxygen isotopomericconstraints on the origins and sea-to-air flux of N2O in the olig-otrophic subtropical North Pacific gyre, Glob. Biogeochem. Cy-cles, 16(4), doi: 10.1029/2001GB001806, 2002.
Poth, M. and Focht, D. D.:15N kinetic analysis of N2O productionby Nitrosomonas europaea- an examination of nitrifier denitrifi-cation, Appl. Environ. Microbiol., 49(5), 1134–1141, 1985.
Prather, M., Ehhalt, D., Dentener, F., Derwent, R., Dlugokencky,E., Holland, E., Isaksen, I., Katima, J., Kirchhoff, V., Matson, P.,Midgley, P., and Wang, M.: Atmospheric chemistry and green-house gases, in: Climate Change 2001: The Scientific Basis.Contribution of Working Group I to the Third Assessment Re-port of the Intergovernmental Panel on Climate Change, editedby: Houghton, J. T., Ding, Y., Griggs, D. J., Noguer, M., Van derLinden, P. J., Dai, X., Maskell, K., and Johnson, C. A., 239–287,Cambridge University Press, Cambridge, UK, 2001.
Rhein, M.: Oceanography – Drifters reveal deep circulation, Na-ture, 407(6800), 30–31, 2000.
Rheinheimer, G.: Untersuchungenuber den Einfluß der Temperaturauf die Nitrifikation im Elbe-Aestuar, Arch. Mikrobiol., 49, 283–290, 1964.
Richardson, D. J.: Bacterial respiration: a flexible process for achanging environment, Microbiol., 146, 551–571, 2000.
Richardson, P. L., Bower, A. S., and Zenk, W.: A census of Meddiestracked by floats, Prog. Oceanogr., 45(2), 209–250, 2000.
Robertson, L. A., van Niel, E. W. J., Torremans, R. A. M., andKuenen, J. G.: Simultaneous nitrification and denitrification inaerobic chemostat cultures ofThiosphaera pantotropha, Appl.Environ. Microbiol., 54(11), 2812–2818, 1988.
Rysgaard, S., Finster, K., and Dahlgaard, H.: Primary production,nutrient dynamics and mineralisation in a northeastern Green-land fjord during the summer thaw, Polar Biol., 16(7), 497–506,1996.
Seitzinger, S. P., Kroeze, C., and Styles, R. V.: Global distributionof N2O emissions from aquatic systems: Natural emissions andanthropogenic effects, Chemosphere: Global Change Sci., 2(3),267–279, 2000.
Siedler, G., Zangenberg, N., and Onken, R.: Seasonal changes inthe tropical Atlantic circulation – Observation and simulation ofthe Guinea Dome, J. Geophys. Res.-Oceans, 97(C1), 703–715,1992.
Signorini, S. R., Murtugudde, R. G., McClain, C. R., Christian, J.R., Picaut, J., and Busalacchi, A. J.: Biological and physical sig-natures in the tropical and subtropical Atlantic, J. Geophys. Res.-Oceans, 104(C8), 18 367–18 382, 1999.
Snowden, D. P. and Molinari, R. L.: Subtropical cells in the AtlanticOcean: An observational summary, in: Interhemispheric Wa-ter Exchange in the Atlantic Ocean, edited by: Goni, G. J., andMalanotte-Rizzoli, P., pp. 287–312, Elsevier, New York, 2003.
Tomczak, M.: Some historical, theoretical and applied aspects ofqualitative water mass analysis, J. Mar. Res., 57, 275–303, 1999.
Tomczak, M. and Godfrey, J. S.: Regional Oceanography: An In-troduction, 391, 2001.
Voituriez, B., Herbland, A., and Leborgne, R.: Equatorial upwellingin the eastern Atlantic during FGGE, Oceanol. Acta, 5(3), 301–314, 1982.
Vouve, F., Guiraud, G., Marol, C., Girard, M., Richard, P., andLaima, M. J. C.: NH+4 turnover in intertidal sediments ofMarennes-Oleron Bay (France): effect of sediment temperature,Oceanol. Acta, 23(5), 575–584, 2000.
Wallace, D. W. R. and Bange, H. W.: Introduction to special section:Results of the Meteor 55: Tropical SOLAS Expedition, Geophys.Res. Lett., 31(L23S01), 1–4, 2004.
Walter, S., Bange, H. W., and Wallace, D. W. R.: Nitrous oxidein the surface layer of the tropical North Atlantic Ocean alonga west to east transect, Geophys. Res. Lett., 31(23), L23S07,doi:10.1029/2004GL019937, 2004.
Walter, S., Peeken, I., Lochte, K., and Bange, H. W.: Nitrous ox-ide measurements during EIFEX, the European Iron FertilisationExperiment in the subpolar South Atlantic Ocean, Geophys. Res.Lett., 32, L23613,doi: 10.1029/2005GL024619, 2005.
Weiss, R. F.: The solubility of nitrogen, oxygen and argon in waterand seawater, Deep-Sea Res., 17, 721–735, 1970.
Weiss, R. F. and Price, B. A.: Nitrous oxide solubility in water andseawater, Mar. Chem., 8, 347–359, 1980.
Yoshida, N., Morimoto, H., Hirano, M., Koike, I., Matsuo, S.,Wada, E., Saino, T., and Hattori, A.: Nitrification rates and15Nabundances of N2O and NO−
3 in the western North Pacific, Na-ture, 342, 895–897, 1989.
Yoshinari, T.: Nitrous oxide in the sea, Mar. Chem., 4, 189–202,1976.
Yoshinari, T., Altabet, M. A., Naqvi, S. W. A., Codispoti, L.,Jayakumar, A., Kuhland, M., and Devol, A.: Nitrogen and oxy-gen isotopic composition of N2O from suboxic waters of theeastern tropical North Pacific and the Arabian Sea - Measure-ment by continuous-flow isotope-ratio monitoring, Mar. Chem.,56(3–4), 253–264, 1997.
Zehr, J. P. and Ward, B. B.: Nitrogen cycling in the ocean: Newperspectives on processes and paradigms, Appl. Environ. Micro-biol., 68(3), 1015–1024, 2002.
www.biogeosciences.net/3/607/2006/ Biogeosciences, 3, 607–619, 2006