Embed Size (px)
Citation preview
NOAA Technical Memorandum NWS NHC-6 THE DEADLIEST, COSTLIEST, AND MOST INTENSE UNITED STATES TROPICAL CYCLONES FROM 1851 TO 2010 (AND OTHER FREQUENTLY REQUESTED HURRICANE FACTS) Eric S. Blake Christopher W. Landsea NHC Miami Ethan J. Gibney I.M. Systems Group NCDC Asheville National Weather Service National Hurricane Center Miami, Florida August 2011
PREFACE This version of the Deadliest, Costliest, and Most Intense United States Tropical Cyclones extends the work of Blake et al. (2007) to include 2007-2010 and revised hurricane best track data from the period 1915-1930. In addition, estimates from several storms are updated to correct errors as well as to include a more standardized methodology. In most storms since 1995, estimates of flood damage from the National Flood Insurance Program are included in the total damage estimates for a more realistic total. The technical memorandum also continues the methodology of Pielke et al. (2008) to produce an estimate of the monetary loss that historical hurricanes could exact on the current property-at-risk in the same location.
1
THE DEADLIEST, COSTLIEST, AND MOST INTENSE UNITED STATES TROPICAL CYCLONES FROM 1851 TO 2010
(AND OTHER FREQUENTLY REQUESTED HURRICANE FACTS)
by
Eric S. Blake and Christopher W. Landsea NOAA/NWS/NCEP/National Hurricane Center
Miami, Florida
Ethan J. Gibney I.M. Systems Group
NOAA/NCDC Asheville, North Carolina
ABSTRACT This technical memorandum lists the deadliest tropical cyclones in the United States during 1851-2010 and the costliest tropical cyclones in the United States during 1900-2010. The compilation ranks damage, as expressed by monetary losses, in three ways: 1) contemporaneous estimates; 2) contemporaneous estimates adjusted by inflation to 2010 dollars; and 3) contemporaneous estimates adjusted for inflation and the growth of population and personal wealth (Pielke et al. 2008) to 2010 dollars. In addition, the most intense (i.e., major1 ) hurricanes to make landfall in the United States during the 160-year period are listed. Also presented are some additional statistics on United States hurricanes and tropical cyclones in general.
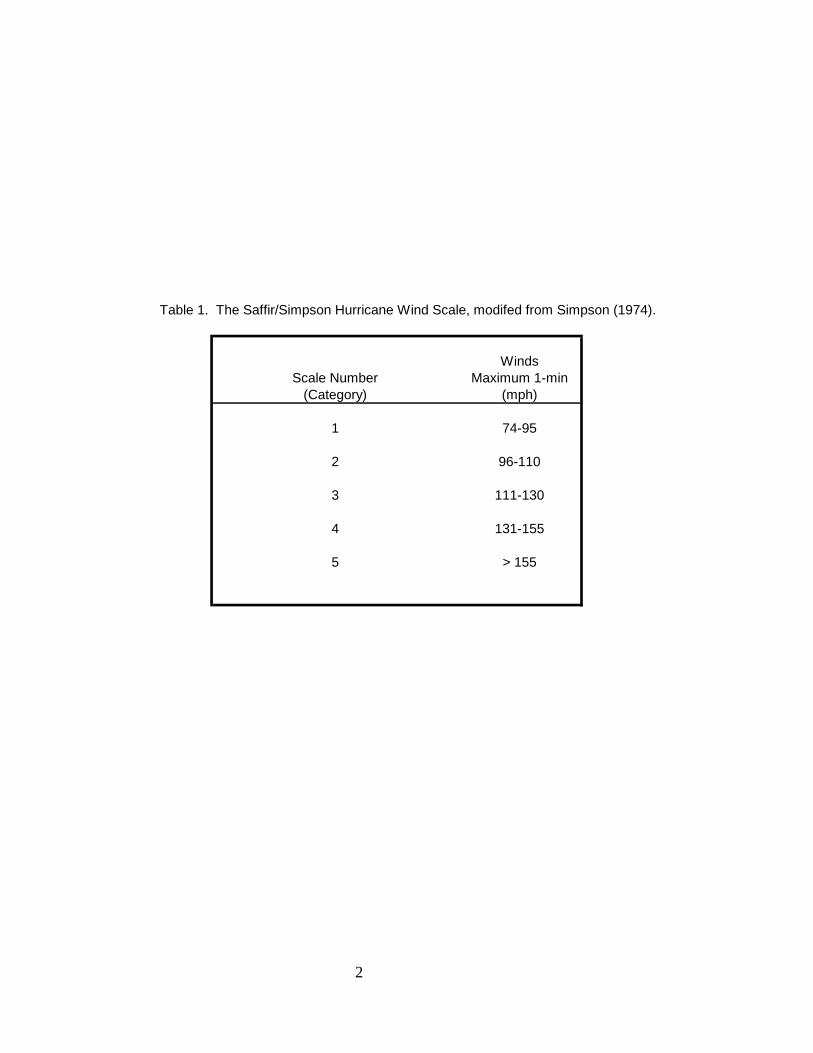
1. INTRODUCTION The National Hurricane Center (NHC) receives numerous requests for statistical information on deaths and damage incurred during tropical cyclones (including tropical depression, tropical storms, subtropical storms and hurricanes) affecting the United States. Information about tropical cyclone intensity (i.e., maximum 1-min surface wind) is also frequently of interest. Estimates of these measures vary in the literature and our goal is to present the best compilation of currently available estimates. In some instances, data in our lists represent revised estimates based on more complete information received since earlier publications including previous versions of this technical memorandum. There are also other frequently asked questions about hurricanes, and these questions are answered in Section 3. _____________________________________ 1 A major hurricane is a category 3, 4, or 5 hurricane on the Saffir/Simpson Hurricane Wind Scale (see Table 1).
2
WindsScale Number Maximum 1-min
(Category) (mph)
1 74-95 2 96-110 3 111-130 4 131-155 5 > 155
Table 1. The Saffir/Simpson Hurricane Wind Scale, modifed from Simpson (1974).
3
2. BACKGROUND AND DEFINITIONS The Saffir/Simpson Hurricane Wind Scale (SSHWS, Table 1) provides specific wind values for each hurricane category. It is important to note that the original Saffir/Simpson hurricane scale category assignment of U.S. hurricanes was based on a combination of wind, central pressure and storm surge values (Hebert and Taylor 1975). Since about 1990, however, the NHC has assigned the SSHWS category on the basis of the maximum one-minute sustained wind speed only. Thus, there is an inconsistency in the Atlantic hurricane database (HURDAT) that will be rectified as the Atlantic best-track reanalysis project is completed (Landsea et al. 2004). Currently, the SSHWS category assignment is based on wind speed from 1851-1930 and 1990-2010 and on a combination of wind, pressure and storm surge from 1931-1989. Heavy rainfall associated with a hurricane was not one of the criteria used in the categorization. The process of assigning a SSHWS category number to a hurricane in any location is subjective, and it is made on a county-by-county basis. In this study, we use criteria for direct hit as described in the work by Jarrell et al. (1992).
Direct Hit - Using "R" as the radius of maximum winds in a hurricane (the distance in miles from the storm's center to the circle of maximum winds around the center), all or parts of coastal counties falling within approximately 2R to the right and R to the left of a storm's track were considered to have received a direct hit. (This assumes an observer at sea looking toward the shore. If there was no landfall, the closest point of approach was used in place of the landfall point). On average, this direct hit zone extended about 50 miles along the coastline (corresponding to an average value of R of 15 miles). Of course, some hurricanes were smaller than this and some, particularly at higher latitudes, were much larger. Cases were judged individually, and many borderline situations had to be resolved.
In this document, the term strike is designated to mean one of two things:
1) During the years 1851-1930 and 1990 to 2010, a hurricane strike is defined to be the occurrence of sustained hurricane force winds on the coastline or inland. This does not require the center to make landfall in the area of hurricane-force winds. Such an event occurred with Hurricane Ophelia in 2005, which remained offshore of the North Carolina coast but still brought sustained hurricane-force winds to the coastline.
2) During the years 1931 to 1989, a hurricane strike is defined as one whose center passes within the direct hit definition area provided above. The best-track reanalysis project is working to change the definition to be strictly determined by the winds, but for now the regional effects catalogued by HURDAT are in a transition period that could last several more years.
Statistics on tropical storm and hurricane activity in the North Atlantic Ocean (which includes the Gulf of Mexico and the Caribbean Sea) can also be found in McAdie et al. (2009). A stratification of hurricanes by SSHWS category which have affected coastal counties of the Gulf of Mexico and North Atlantic Ocean can be found in Jarrell et al. (1992) and also at the NOAA Coastal Services Center (http://csc.noaa.gov/hurricanes/) updated through 2010. Additional information about the
4
impact of hurricanes can be found in annual hurricane season summary articles in Monthly Weather Review, Storm Data and Mariner’s Weather Log. A continuing feature for this update is the inclusion of estimated inland wind impacts of some hurricanes. These cyclones are indicated with an “I” before the state abbreviation in the HURDAT database and this symbol is exclusively used for hurricane wind impacts that are felt in a state, but not at the coastal areas (see Appendix A). One example of this occurrence is Hurricane Dennis (2005). After landfall, Dennis produced category one hurricane winds over inland areas of Alabama, but these effects were not felt along the coast of Alabama. Thus an “I” is added in front of the state designation, to be IAL 1. If a hurricane primarily impacts the coastal areas of a state, inland effects are not listed separately. The goal of this listing is to indicate only the most significant impact to that state. Because of the geography of Florida, any effects in the state are considered coastal. It is important to note the changing derivation of damage estimates at NHC. Death and damage totals for the period 1915-1965 were taken from Gentry (1966), which gave figures adjusted to 1957-59 costs as a base for the period 1915-1965. From 1966-1994, damages were obtained from Monthly Weather Review. However, the Monthly Weather Review estimates represented a highly variable and subjective combination of losses from the American Red Cross, the U.S. Office of Emergency Preparedness, insurance companies and press reports. After 1994, except for a few cases involving significant flooding, most of the Monthly Weather Review damage estimates were determined by doubling the private insurance losses reported by the Property Claim Service or the American Insurance Institute. These insurance loss figures do not include flood losses from the National Flood Insurance Program (NFIP), which have only been included since Hurricane Ike of 2008. A standardized methodology for calculating total losses, including NFIP figures, has been developed and utilized for each storm that made landfall after 1994 in the mainland United States. In this document, for almost all storms that occurred beginning in the 1995 season, the final NHC damage estimate is the sum of double the insured loss estimate, plus an adjusted estimate of flood losses from NFIP. Because of the highly variable rates of flood insurance along the coast, it is improper to simply double the flood losses for an estimate of total flood damage. Instead, the county NFIP losses are multiplied by the estimated county penetration rates for the highest flood risk area using the Federal Emergency Management Agency (FEMA) special flood hazard area (SFHA, e.g. the 100-year base flood plain) for a more accurate measure. This estimate should still be conservative for total flood damages because most homeowner’s policies are capped at $250,000 and areas outside of the SFHA can be affecting in a significant flood. Note that this calculation adds a significant amount of damage to previous estimates after 1994 (e.g. Allison 2001 rises from $5 billion to $9 billion). See Appendix B for other significant changes to several U.S. tropical cyclones private insurance damages estimates.
5
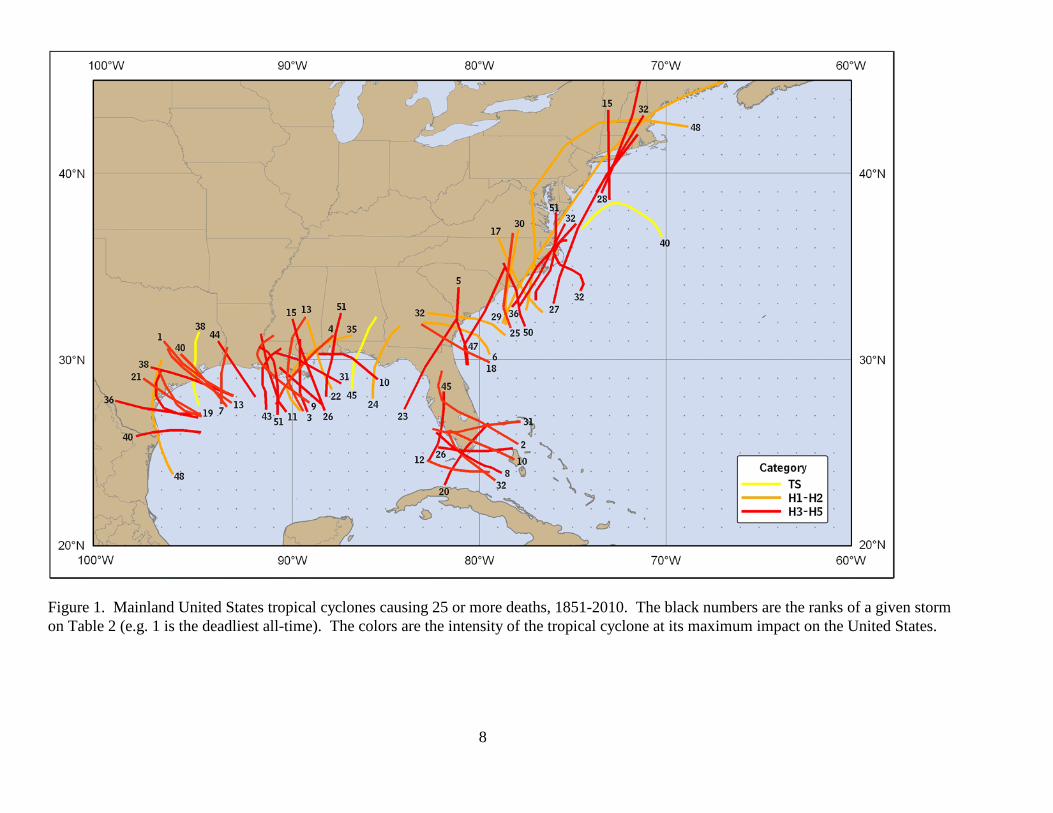
3. FAQ Part I The remainder of this memorandum provides answers to some of the most frequently asked questions about the characteristics and effects of the tropical cyclones in the United States from 1851-2010. Part I deals with the deadliest, costliest and most intense United States tropical cyclones. (1) What have been the deadliest tropical cyclones in the United States? Table 2 lists the tropical cyclones that have caused at least 25 deaths on the U.S. mainland during the period 1851-2010. There have been no additions to this list since 2005. The Galveston Hurricane of 1900 was responsible for at least 8000 deaths and remains first on the list. A revision was made to Hurricane Katrina of 2005 to remove confirmed indirect deaths from the original total of 1500 based on recent research (Brunkard et al. 2008, Jonkman et al. 2009). The latest NHC estimate is that Katrina was directly responsible for about 1200 deaths and it remains the third deadliest hurricane to strike the United States. Figure 1 shows the paths of these deadly cyclones. Although these systems are spread out over most of the coast, there is a clustering of tracks on the coasts of Texas, southeastern Louisiana, south Florida, North Carolina and New England. (2) What have been the costliest tropical cyclones in the United States? Table 3a lists the 30 costliest tropical cyclones to strike the U.S. mainland from 1900-2010. No monetary estimates are available before 1900. Amounts in the tables are not adjusted for inflation and include adjusted NFIP flood damage amounts beginning in 1995. Hurricane Ike of 2008 was the second- costliest hurricane on record and was the most significant addition to the list. Hurricane Katrina of 2005 was responsible for at least $108 billion of property damage and is by far the costliest hurricane to ever strike the United States. It is of note that the last ten hurricane seasons have produced 14 out of the 30 costliest systems to affect the United States. Figure 2 displays the near- landfall portion of these tropical cyclone tracks and shows concentrations of costly hurricanes along the central Gulf Coast, south Florida and the Carolinas. Table 3b re-orders Table 3a and the historical database after adjusting to 2010 dollars2, which adds several other hurricanes. Since 2000, even after accounting for inflation, the United States has experienced 11 out of the 30 costliest tropical cyclones. Hawaiian, Puerto Rican and Virgin Island tropical cyclones since 1900 are listed as addenda to Tables 3a and 3b. Table 3b also lists the 30 costliest hurricanes (see also Figure 3) assuming that a hurricane having the same track, size and intensity as noted in the historical record would strike the area with today’s population and property-at-risk. After this normalization to today’s societal vulnerability, the last decade still accounts for eight of the top 30 tropical cyclones. (3) What have been the most intense hurricanes to strike the United States? Table 4 lists the most intense major hurricanes to strike the U.S. mainland during the period 1851-2010. In this study, the major hurricanes have been ranked by estimating central pressure at time of landfall. We have used central pressure as a proxy for intensity due to the uncertainties in maximum wind speed estimates for many historical hurricanes. Hurricane Katrina had the third lowest pressure ever noted at landfall, behind the 1935 Florida Keys hurricane and Hurricane Camille in 1969. 2 Adjusted to 2010 dollars on the basis of U.S. Department of Commerce Implicit Price Deflator for Construction. Available index numbers are rounded to the nearest tenth. This rounding can result in slight changes in the adjusted damage of one hurricane relative to another.
6
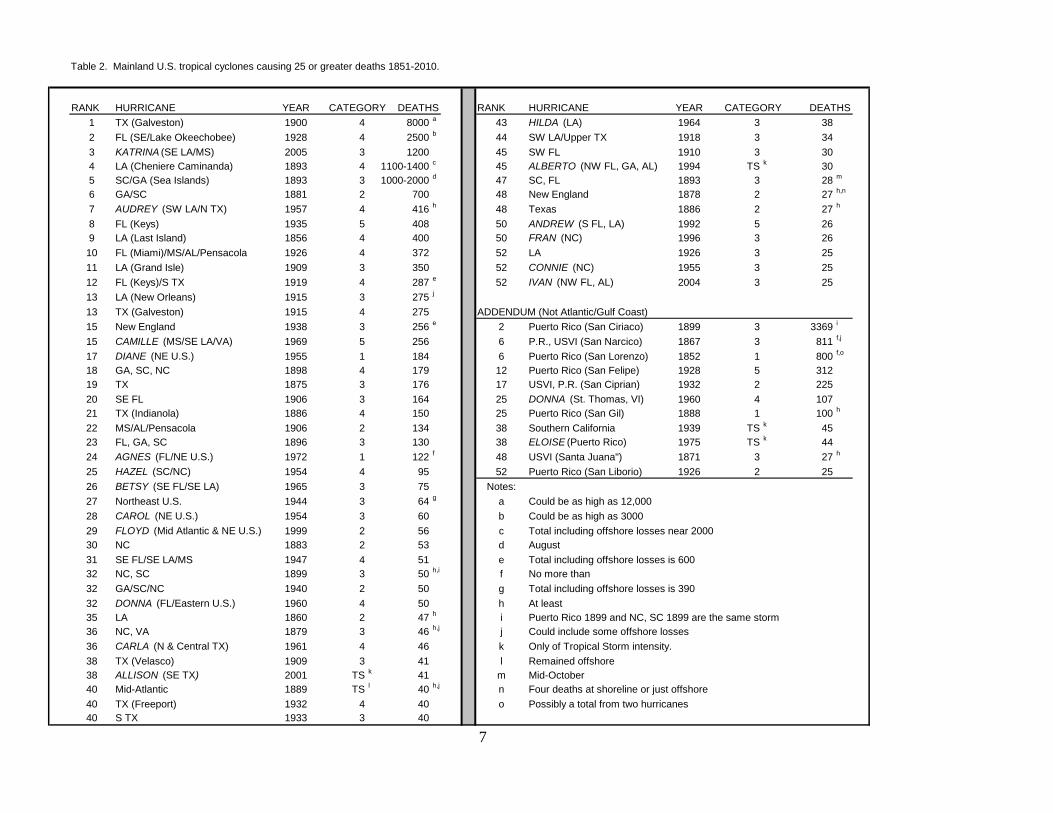
Although Hurricane Ike had a landfall pressure of 950 mb, it was not a major hurricane at landfall. Moreover, no major hurricanes hit the United States during the past 5 years. Figure 4 shows where these major hurricanes struck the coast. Puerto Rican and Virgin Island hurricanes are listed as addenda to Table 4. A look at the lists of deadliest and costliest hurricanes reveals several striking facts: (1) Fourteen out of the fifteen deadliest hurricanes were of category 3 or higher intensity. (2) Large death totals were primarily a result of the 10 feet or greater rise of the ocean (storm surge) associated with many of these major hurricanes. Katrina of 2005 typifies this point. (3) A large portion of the damage in some of costliest tropical cyclones (Table 3a) resulted from inland floods caused by torrential rain (e.g. Agnes of 1972). (4) One-third of the 30 deadliest hurricanes were category 4 or higher. (5) Only seven of the deadliest hurricanes occurred during the past 25 years, while over two-thirds of the costliest hurricanes occurred during the same period. Katrina provided a grim reminder of what can happen in a hurricane landfall. Sociologists estimate, however, that people only remember the worst effects of a hurricane for about seven years (B. Morrow, personal communication). One of the greatest concerns of the National Weather Service's (NWS) hurricane preparedness officials is that people will think that no more large loss of life will occur in a hurricane because of our advanced technology and improved hurricane forecasts. Bill Read, current Director of NHC, as well as former NHC Directors, have repeatedly emphasized the great danger of a catastrophic loss of life in a future hurricane if proper preparedness plans for vulnerable areas are not formulated, maintained and executed. The study by Jarrell et al. (1992) used 1990 census data to show that 85% of U.S. coastal residents from Texas to Maine had never experienced a direct hit by a major hurricane. This risk is higher today as an estimated 50 million residents have moved to coastal sections during the past twenty-five years. The experience gained through the landfall of 7 major hurricanes during the past 7 years has not lessened an ever-growing concern brought by the continued increase in coastal populations.
Continued coastal growth and inflation will almost certainly result in every future major landfalling hurricane (and even weaker hurricanes and tropical storms) replacing one of the current costliest hurricanes. For example, all three of the U.S. hurricane landfalls of 2008 made the top 30 list, despite none of them being major hurricanes at landfall. If warnings are heeded and preparedness plans developed, the death toll can be minimized. However, large property losses are inevitable in the absence of a significant change of attitude, policy, or laws governing building practices (codes and location) near the ocean.
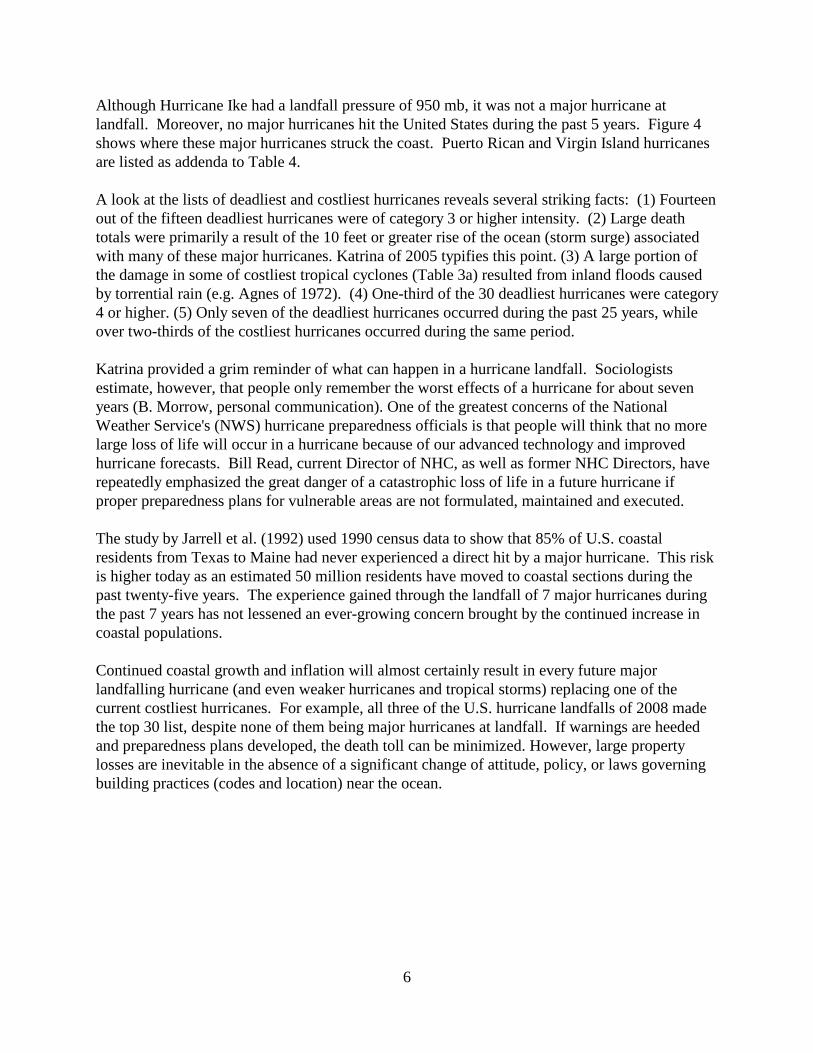
7
RANK HURRICANE YEAR RANK HURRICANE YEAR1 TX (Galveston) 1900 4 8000 a 43 HILDA (LA) 1964 3 382 FL (SE/Lake Okeechobee) 1928 4 2500 b 44 SW LA/Upper TX 1918 3 343 KATRINA (SE LA/MS) 2005 3 1200 45 SW FL 1910 3 304 LA (Cheniere Caminanda) 1893 4 1100-1400 c 45 ALBERTO (NW FL, GA, AL) 1994 TS k 305 SC/GA (Sea Islands) 1893 3 1000-2000 d 47 SC, FL 1893 3 28 m
6 GA/SC 1881 2 700 48 New England 1878 2 27 h,n
7 AUDREY (SW LA/N TX) 1957 4 416 h 48 Texas 1886 2 27 h
8 FL (Keys) 1935 5 408 50 ANDREW (S FL, LA) 1992 5 269 LA (Last Island) 1856 4 400 50 FRAN (NC) 1996 3 2610 FL (Miami)/MS/AL/Pensacola 1926 4 372 52 LA 1926 3 2511 LA (Grand Isle) 1909 3 350 52 CONNIE (NC) 1955 3 2512 FL (Keys)/S TX 1919 4 287 e 52 IVAN (NW FL, AL) 2004 3 2513 LA (New Orleans) 1915 3 275 j 13 TX (Galveston) 1915 4 275 ADDENDUM (Not Atlantic/Gulf Coast)15 New England 1938 3 256 e 2 Puerto Rico (San Ciriaco) 1899 3 3369 i
15 CAMILLE (MS/SE LA/VA) 1969 5 256 6 P.R., USVI (San Narcico) 1867 3 811 f,j
17 DIANE (NE U.S.) 1955 1 184 6 Puerto Rico (San Lorenzo) 1852 1 800 f,o
18 GA, SC, NC 1898 4 179 12 Puerto Rico (San Felipe) 1928 5 312
19 TX 1875 3 176 17 USVI, P.R. (San Ciprian) 1932 2 225
20 SE FL 1906 3 164 25 DONNA (St. Thomas, VI) 1960 4 10721 TX (Indianola) 1886 4 150 25 Puerto Rico (San Gil) 1888 1 100 h
22 MS/AL/Pensacola 1906 2 134 38 Southern California 1939 TS k 4523 FL, GA, SC 1896 3 130 38 ELOISE (Puerto Rico) 1975 TS k 4424 AGNES (FL/NE U.S.) 1972 1 122 f 48 USVI (Santa Juana") 1871 3 27 h
25 HAZEL (SC/NC) 1954 4 95 52 Puerto Rico (San Liborio) 1926 2 2526 BETSY (SE FL/SE LA) 1965 3 75 Notes:27 Northeast U.S. 1944 3 64 g a Could be as high as 12,00028 CAROL (NE U.S.) 1954 3 60 b Could be as high as 300029 FLOYD (Mid Atlantic & NE U.S.) 1999 2 56 c Total including offshore losses near 200030 NC 1883 2 53 d August31 SE FL/SE LA/MS 1947 4 51 e Total including offshore losses is 60032 NC, SC 1899 3 50 h,i f No more than32 GA/SC/NC 1940 2 50 g Total including offshore losses is 39032 DONNA (FL/Eastern U.S.) 1960 4 50 h At least35 LA 1860 2 47 h i Puerto Rico 1899 and NC, SC 1899 are the same storm36 NC, VA 1879 3 46 h,j j Could include some offshore losses36 CARLA (N & Central TX) 1961 4 46 k Only of Tropical Storm intensity.38 TX (Velasco) 1909 3 41 l Remained offshore38 ALLISON (SE TX) 2001 TS k 41 m Mid-October40 Mid-Atlantic 1889 TS l 40 h,j n Four deaths at shoreline or just offshore40 TX (Freeport) 1932 4 40 o Possibly a total from two hurricanes40 S TX 1933 3 40
DEATHS
Table 2. Mainland U.S. tropical cyclones causing 25 or greater deaths 1851-2010.
CATEGORY DEATHS CATEGORY
8
Figure 1. Mainland United States tropical cyclones causing 25 or more deaths, 1851-2010. The black numbers are the ranks of a given storm on Table 2 (e.g. 1 is the deadliest all-time). The colors are the intensity of the tropical cyclone at its maximum impact on the United States.
9
RANK TROPICAL CYCLONE YEAR CATEGORY DAMAGE (U.S.)1 KATRINA (SE FL, LA, MS) 2005 3 $108,000,000,0002 IKE (TX, LA) 2008 2 29,520,000,0003 ANDREW (SE FL/LA) 1992 5 26,500,000,0004 WILMA (S FL) 2005 3 21,007,000,0005 IVAN (AL/NW FL) 2004 3 18,820,000,0006 CHARLEY (SW FL) 2004 4 15,113,000,0007 RITA (SW LA, N TX) 2005 3 12,037,000,0008 FRANCES (FL) 2004 2 9,507,000,0009 ALLISON (N TX) 2001 TS 9,000,000,00010 JEANNE (FL) 2004 3 7,660,000,00011 HUGO (SC) 1989 4 7,000,000,00012 FLOYD (Mid-Atlantic & NE U.S.) 1999 2 6,900,000,00013 ISABEL (Mid-Atlantic) 2003 2 5,370,000,00014 OPAL (NW FL/AL) 1995 3 5,142,000,00015 GUSTAV (LA) 2008 2 4,618,000,00016 FRAN (NC) 1996 3 4,160,000,00017 GEORGES (FL Keys, MS, AL) 1998 2 2,765,000,00018 DENNIS (NW FL) 2005 3 2,545,000,00019 FREDERIC (AL/MS) 1979 3 2,300,000,00020 AGNES (FL/NE U.S.) 1972 1 2,100,000,00021 ALICIA (N TX) 1983 3 2,000,000,00022 BOB (NC, NE U.S) 1991 2 1,500,000,00022 JUAN (LA) 1985 1 1,500,000,00024 CAMILLE (MS/SE LA/VA) 1969 5 1,420,700,00025 BETSY (SE FL/SE LA) 1965 3 1,420,500,00026 ELENA (MS/AL/NW FL) 1985 3 1,250,000,00027 DOLLY (S TX) 2008 1 1,050,000,00028 CELIA (S TX) 1970 3 930,000,00029 LILI (SC LA) 2002 1 925,000,00030 GLORIA (Eastern U.S.) 1985 3 900,000,000
ADDENDUM (Rank is independent of other events in group)17 GEORGES (USVI,PR) 1998 3 3,600,000,00022 INIKI (Kauai, HI) 1992 3 1,800,000,00022 MARILYN (USVI, PR) 1995 2 1,500,000,00028 HUGO (USVI, PR) 1989 4 1,000,000,000
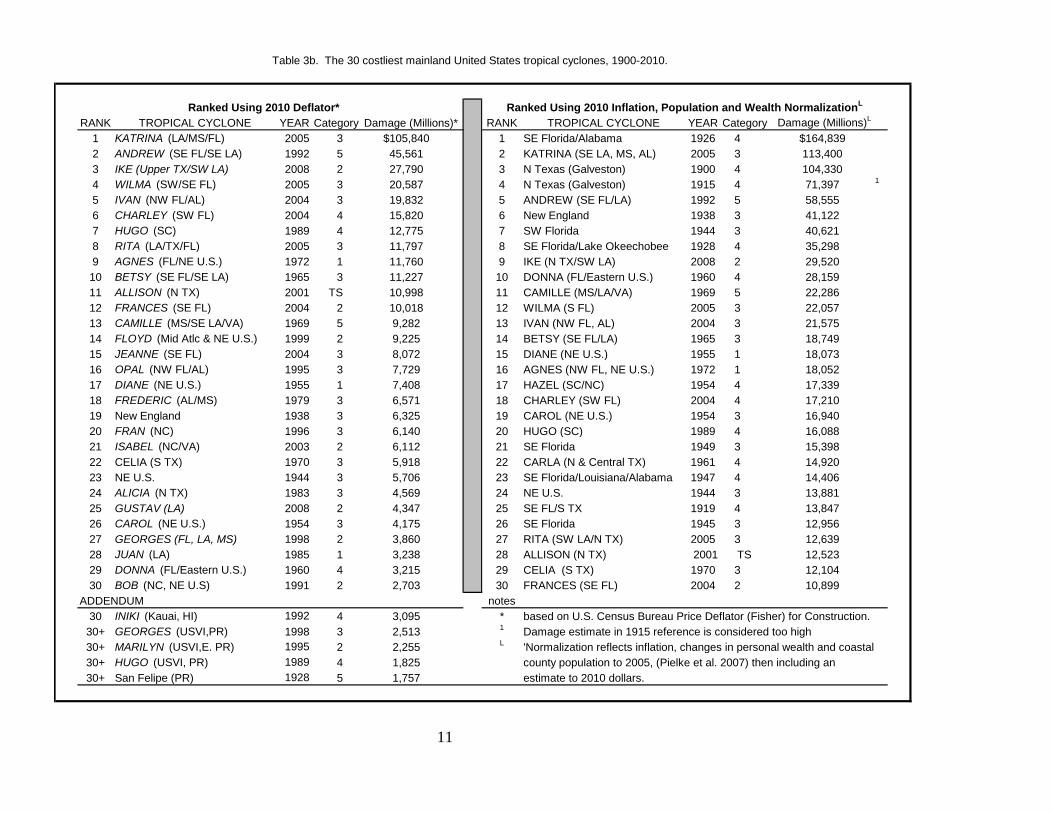
Table 3a. The 30 costliest mainland United States tropical cyclones, 1900-2010, (not adjusted for inflation).
10
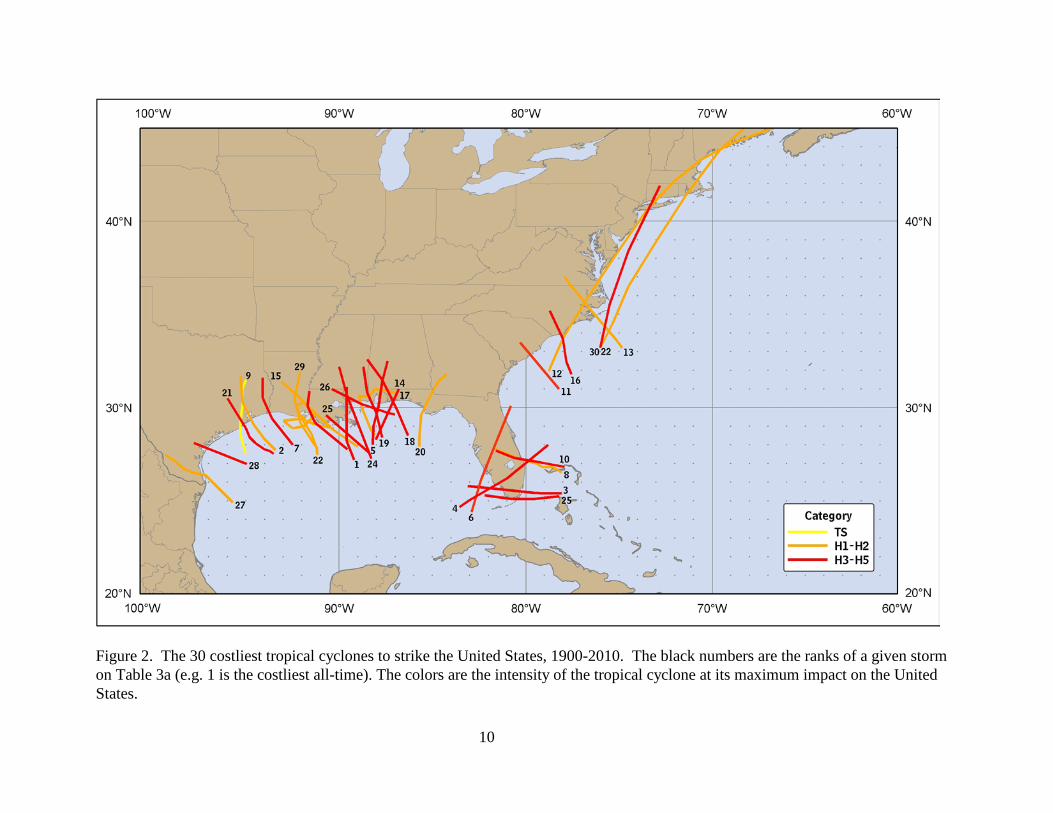
Figure 2. The 30 costliest tropical cyclones to strike the United States, 1900-2010. The black numbers are the ranks of a given storm on Table 3a (e.g. 1 is the costliest all-time). The colors are the intensity of the tropical cyclone at its maximum impact on the United States.
11
RANK TROPICAL CYCLONE YEAR Category Damage (Millions)* RANK TROPICAL CYCLONE YEAR Damage (Millions)L
1 KATRINA (LA/MS/FL) 2005 3 $105,840 1 SE Florida/Alabama 1926 4 $164,8392 ANDREW (SE FL/SE LA) 1992 5 45,561 2 KATRINA (SE LA, MS, AL) 2005 3 113,4003 IKE (Upper TX/SW LA) 2008 2 27,790 3 N Texas (Galveston) 1900 4 104,330
4 WILMA (SW/SE FL) 2005 3 20,587 4 N Texas (Galveston) 1915 4 71,397 1
5 IVAN (NW FL/AL) 2004 3 19,832 5 ANDREW (SE FL/LA) 1992 5 58,5556 CHARLEY (SW FL) 2004 4 15,820 6 New England 1938 3 41,1227 HUGO (SC) 1989 4 12,775 7 SW Florida 1944 3 40,6218 RITA (LA/TX/FL) 2005 3 11,797 8 SE Florida/Lake Okeechobee 1928 4 35,2989 AGNES (FL/NE U.S.) 1972 1 11,760 9 IKE (N TX/SW LA) 2008 2 29,52010 BETSY (SE FL/SE LA) 1965 3 11,227 10 DONNA (FL/Eastern U.S.) 1960 4 28,15911 ALLISON (N TX) 2001 TS 10,998 11 CAMILLE (MS/LA/VA) 1969 5 22,28612 FRANCES (SE FL) 2004 2 10,018 12 WILMA (S FL) 2005 3 22,05713 CAMILLE (MS/SE LA/VA) 1969 5 9,282 13 IVAN (NW FL, AL) 2004 3 21,57514 FLOYD (Mid Atlc & NE U.S.) 1999 2 9,225 14 BETSY (SE FL/LA) 1965 3 18,74915 JEANNE (SE FL) 2004 3 8,072 15 DIANE (NE U.S.) 1955 1 18,07316 OPAL (NW FL/AL) 1995 3 7,729 16 AGNES (NW FL, NE U.S.) 1972 1 18,05217 DIANE (NE U.S.) 1955 1 7,408 17 HAZEL (SC/NC) 1954 4 17,33918 FREDERIC (AL/MS) 1979 3 6,571 18 CHARLEY (SW FL) 2004 4 17,21019 New England 1938 3 6,325 19 CAROL (NE U.S.) 1954 3 16,94020 FRAN (NC) 1996 3 6,140 20 HUGO (SC) 1989 4 16,08821 ISABEL (NC/VA) 2003 2 6,112 21 SE Florida 1949 3 15,39822 CELIA (S TX) 1970 3 5,918 22 CARLA (N & Central TX) 1961 4 14,92023 NE U.S. 1944 3 5,706 23 SE Florida/Louisiana/Alabama 1947 4 14,40624 ALICIA (N TX) 1983 3 4,569 24 NE U.S. 1944 3 13,88125 GUSTAV (LA) 2008 2 4,347 25 SE FL/S TX 1919 4 13,84726 CAROL (NE U.S.) 1954 3 4,175 26 SE Florida 1945 3 12,95627 GEORGES (FL, LA, MS) 1998 2 3,860 27 RITA (SW LA/N TX) 2005 3 12,63928 JUAN (LA) 1985 1 3,238 28 ALLISON (N TX) 2001 TS 12,52329 DONNA (FL/Eastern U.S.) 1960 4 3,215 29 CELIA (S TX) 1970 3 12,10430 BOB (NC, NE U.S) 1991 2 2,703 30 FRANCES (SE FL) 2004 2 10,899
ADDENDUM notes30 INIKI (Kauai, HI) 1992 4 3,095 * based on U.S. Census Bureau Price Deflator (Fisher) for Construction.
30+ GEORGES (USVI,PR) 1998 3 2,513 1 Damage estimate in 1915 reference is considered too high30+ MARILYN (USVI,E. PR) 1995 2 2,255 L 'Normalization reflects inflation, changes in personal wealth and coastal 30+ HUGO (USVI, PR) 1989 4 1,825
30+ San Felipe (PR) 1928 5 1,757 estimate to 2010 dollars.
Table 3b. The 30 costliest mainland United States tropical cyclones, 1900-2010.
county population to 2005, (Pielke et al. 2007) then including an
CategoryRanked Using 2010 Deflator* Ranked Using 2010 Inflation, Population and Wealth NormalizationL
12
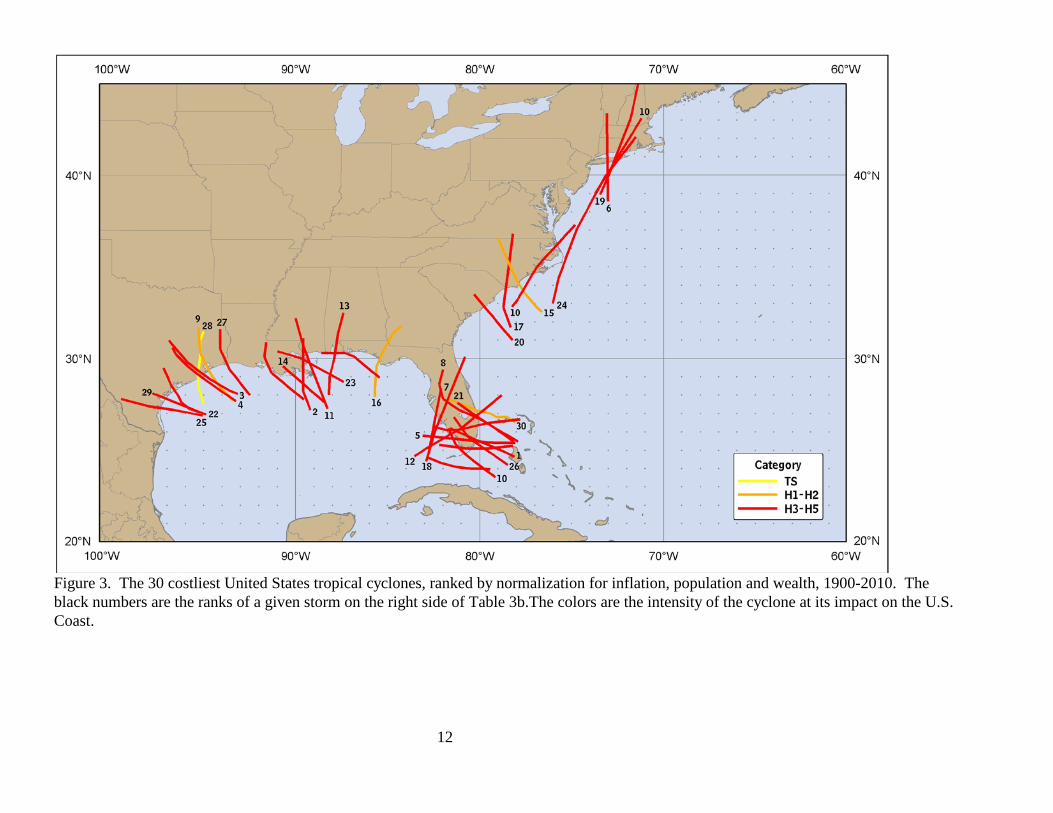
Figure 3. The 30 costliest United States tropical cyclones, ranked by normalization for inflation, population and wealth, 1900-2010. The black numbers are the ranks of a given storm on the right side of Table 3b.The colors are the intensity of the cyclone at its impact on the U.S. Coast.
13
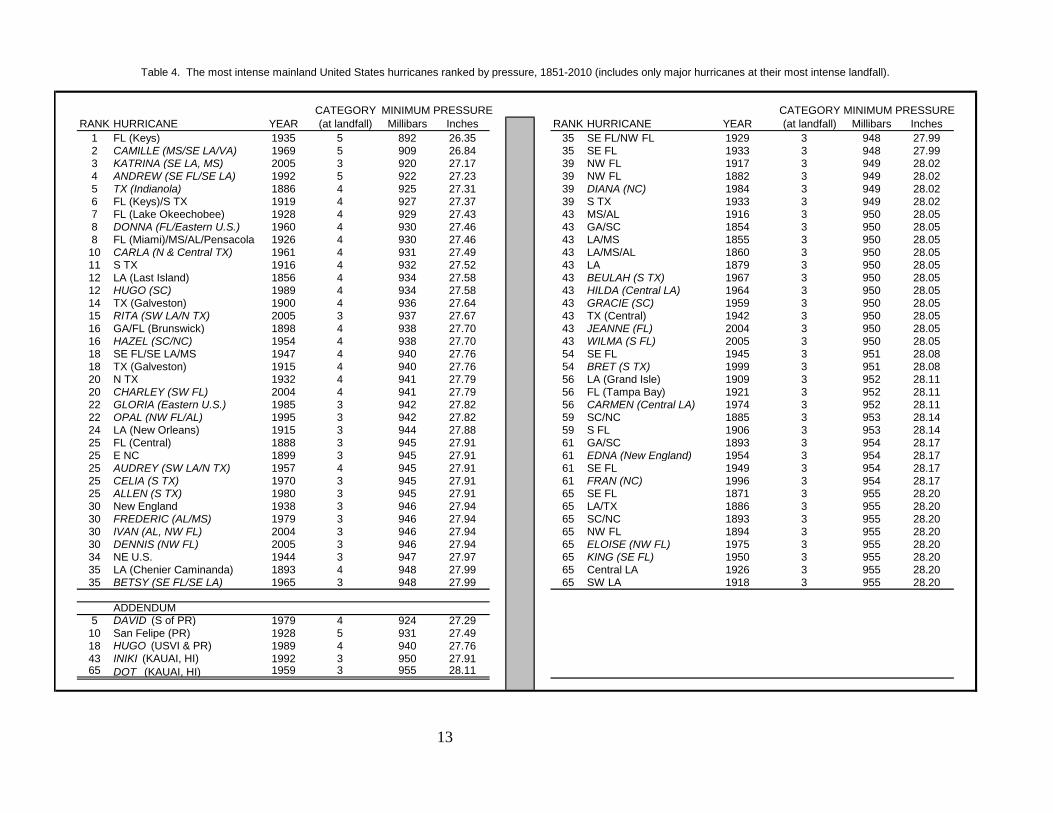
CATEGORY MINIMUM PRESSURE CATEGORY MINIMUM PRESSURERANK HURRICANE YEAR (at landfall) Millibars Inches RANK HURRICANE YEAR (at landfall) Millibars Inches
1 FL (Keys) 1935 5 892 26.35 35 SE FL/NW FL 1929 3 948 27.992 CAMILLE (MS/SE LA/VA) 1969 5 909 26.84 35 SE FL 1933 3 948 27.993 KATRINA (SE LA, MS) 2005 3 920 27.17 39 NW FL 1917 3 949 28.024 ANDREW (SE FL/SE LA) 1992 5 922 27.23 39 NW FL 1882 3 949 28.025 TX (Indianola) 1886 4 925 27.31 39 DIANA (NC) 1984 3 949 28.026 FL (Keys)/S TX 1919 4 927 27.37 39 S TX 1933 3 949 28.027 FL (Lake Okeechobee) 1928 4 929 27.43 43 MS/AL 1916 3 950 28.058 DONNA (FL/Eastern U.S.) 1960 4 930 27.46 43 GA/SC 1854 3 950 28.058 FL (Miami)/MS/AL/Pensacola 1926 4 930 27.46 43 LA/MS 1855 3 950 28.0510 CARLA (N & Central TX) 1961 4 931 27.49 43 LA/MS/AL 1860 3 950 28.0511 S TX 1916 4 932 27.52 43 LA 1879 3 950 28.0512 LA (Last Island) 1856 4 934 27.58 43 BEULAH (S TX) 1967 3 950 28.0512 HUGO (SC) 1989 4 934 27.58 43 HILDA (Central LA) 1964 3 950 28.0514 TX (Galveston) 1900 4 936 27.64 43 GRACIE (SC) 1959 3 950 28.0515 RITA (SW LA/N TX) 2005 3 937 27.67 43 TX (Central) 1942 3 950 28.0516 GA/FL (Brunswick) 1898 4 938 27.70 43 JEANNE (FL) 2004 3 950 28.0516 HAZEL (SC/NC) 1954 4 938 27.70 43 WILMA (S FL) 2005 3 950 28.0518 SE FL/SE LA/MS 1947 4 940 27.76 54 SE FL 1945 3 951 28.0818 TX (Galveston) 1915 4 940 27.76 54 BRET (S TX) 1999 3 951 28.0820 N TX 1932 4 941 27.79 56 LA (Grand Isle) 1909 3 952 28.1120 CHARLEY (SW FL) 2004 4 941 27.79 56 FL (Tampa Bay) 1921 3 952 28.1122 GLORIA (Eastern U.S.) 1985 3 942 27.82 56 CARMEN (Central LA) 1974 3 952 28.1122 OPAL (NW FL/AL) 1995 3 942 27.82 59 SC/NC 1885 3 953 28.1424 LA (New Orleans) 1915 3 944 27.88 59 S FL 1906 3 953 28.1425 FL (Central) 1888 3 945 27.91 61 GA/SC 1893 3 954 28.1725 E NC 1899 3 945 27.91 61 EDNA (New England) 1954 3 954 28.1725 AUDREY (SW LA/N TX) 1957 4 945 27.91 61 SE FL 1949 3 954 28.1725 CELIA (S TX) 1970 3 945 27.91 61 FRAN (NC) 1996 3 954 28.1725 ALLEN (S TX) 1980 3 945 27.91 65 SE FL 1871 3 955 28.2030 New England 1938 3 946 27.94 65 LA/TX 1886 3 955 28.2030 FREDERIC (AL/MS) 1979 3 946 27.94 65 SC/NC 1893 3 955 28.2030 IVAN (AL, NW FL) 2004 3 946 27.94 65 NW FL 1894 3 955 28.2030 DENNIS (NW FL) 2005 3 946 27.94 65 ELOISE (NW FL) 1975 3 955 28.2034 NE U.S. 1944 3 947 27.97 65 KING (SE FL) 1950 3 955 28.2035 LA (Chenier Caminanda) 1893 4 948 27.99 65 Central LA 1926 3 955 28.2035 BETSY (SE FL/SE LA) 1965 3 948 27.99 65 SW LA 1918 3 955 28.20
ADDENDUM5 DAVID (S of PR) 1979 4 924 27.2910 San Felipe (PR) 1928 5 931 27.4918 HUGO (USVI & PR) 1989 4 940 27.7643 INIKI (KAUAI, HI) 1992 3 950 27.9165 DOT (KAUAI, HI) 1959 3 955 28.11
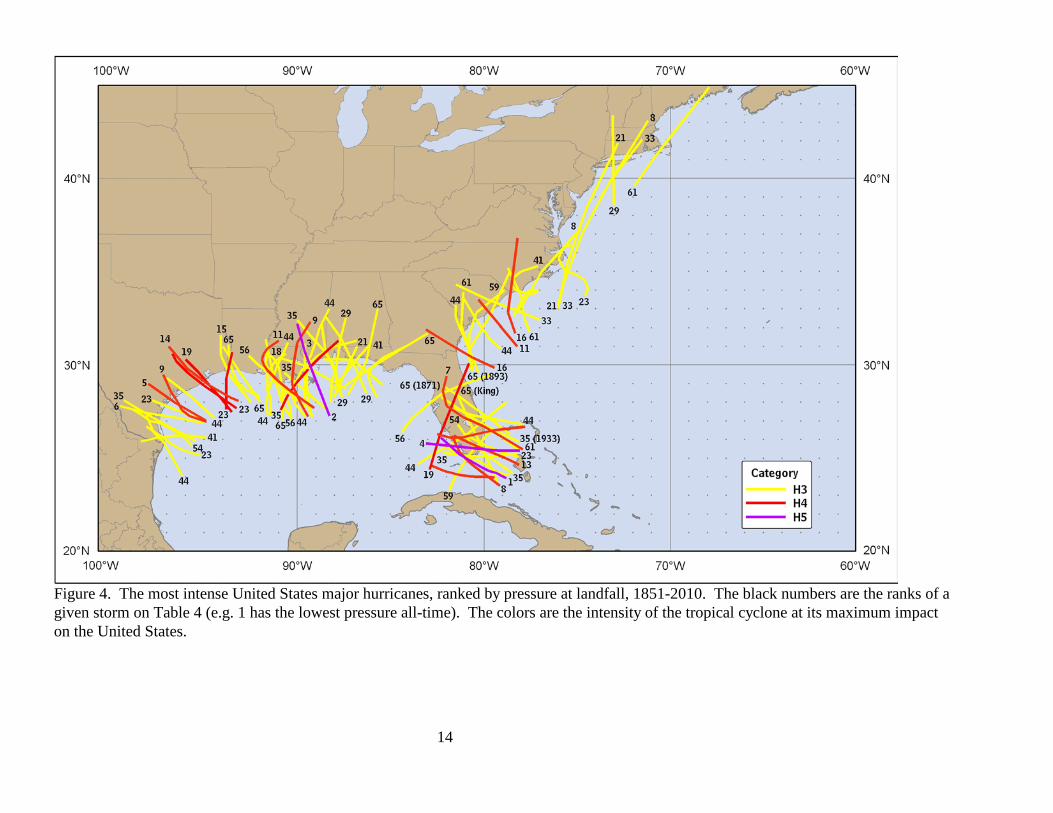
Table 4. The most intense mainland United States hurricanes ranked by pressure, 1851-2010 (includes only major hurricanes at their most intense landfall).
14
Figure 4. The most intense United States major hurricanes, ranked by pressure at landfall, 1851-2010. The black numbers are the ranks of a given storm on Table 4 (e.g. 1 has the lowest pressure all-time). The colors are the intensity of the tropical cyclone at its maximum impact on the United States.
15
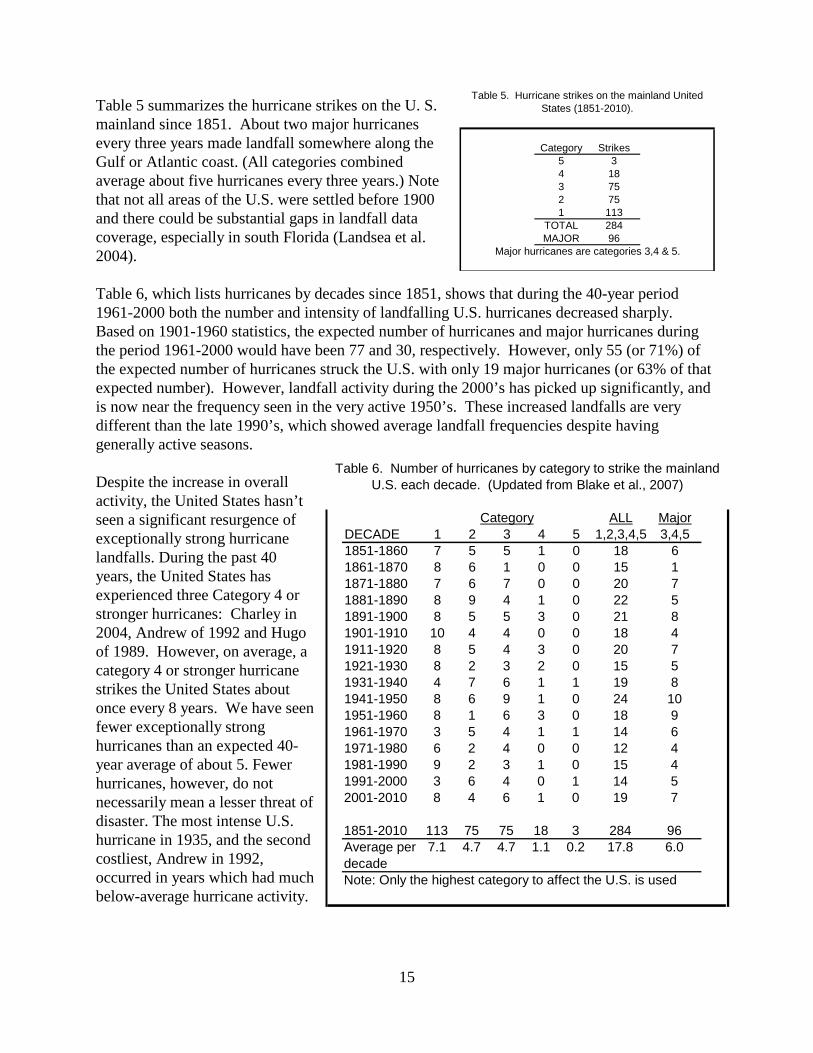
Table 5 summarizes the hurricane strikes on the U. S. mainland since 1851. About two major hurricanes every three years made landfall somewhere along the Gulf or Atlantic coast. (All categories combined average about five hurricanes every three years.) Note that not all areas of the U.S. were settled before 1900 and there could be substantial gaps in landfall data coverage, especially in south Florida (Landsea et al. 2004). Table 6, which lists hurricanes by decades since 1851, shows that during the 40-year period 1961-2000 both the number and intensity of landfalling U.S. hurricanes decreased sharply. Based on 1901-1960 statistics, the expected number of hurricanes and major hurricanes during the period 1961-2000 would have been 77 and 30, respectively. However, only 55 (or 71%) of the expected number of hurricanes struck the U.S. with only 19 major hurricanes (or 63% of that expected number). However, landfall activity during the 2000’s has picked up significantly, and is now near the frequency seen in the very active 1950’s. These increased landfalls are very different than the late 1990’s, which showed average landfall frequencies despite having generally active seasons. Despite the increase in overall activity, the United States hasn’t seen a significant resurgence of exceptionally strong hurricane landfalls. During the past 40 years, the United States has experienced three Category 4 or stronger hurricanes: Charley in 2004, Andrew of 1992 and Hugo of 1989. However, on average, a category 4 or stronger hurricane strikes the United States about once every 8 years. We have seen fewer exceptionally strong hurricanes than an expected 40-year average of about 5. Fewer hurricanes, however, do not necessarily mean a lesser threat of disaster. The most intense U.S. hurricane in 1935, and the second costliest, Andrew in 1992, occurred in years which had much below-average hurricane activity.
Category Strikes5 34 183 752 751 113
TOTAL 284MAJOR 96
Major hurricanes are categories 3,4 & 5.
Table 5. Hurricane strikes on the mainland United States (1851-2010).
Category ALL MajorDECADE 1 2 3 4 5 1,2,3,4,5 3,4,51851-1860 7 5 5 1 0 18 61861-1870 8 6 1 0 0 15 11871-1880 7 6 7 0 0 20 71881-1890 8 9 4 1 0 22 51891-1900 8 5 5 3 0 21 81901-1910 10 4 4 0 0 18 41911-1920 8 5 4 3 0 20 71921-1930 8 2 3 2 0 15 51931-1940 4 7 6 1 1 19 81941-1950 8 6 9 1 0 24 101951-1960 8 1 6 3 0 18 91961-1970 3 5 4 1 1 14 61971-1980 6 2 4 0 0 12 41981-1990 9 2 3 1 0 15 41991-2000 3 6 4 0 1 14 52001-2010 8 4 6 1 0 19 7
1851-2010 113 75 75 18 3 284 96Average per 7.1 4.7 4.7 1.1 0.2 17.8 6.0decadeNote: Only the highest category to affect the U.S. is used
Table 6. Number of hurricanes by category to strike the mainland U.S. each decade. (Updated from Blake et al., 2007)
16
Part II
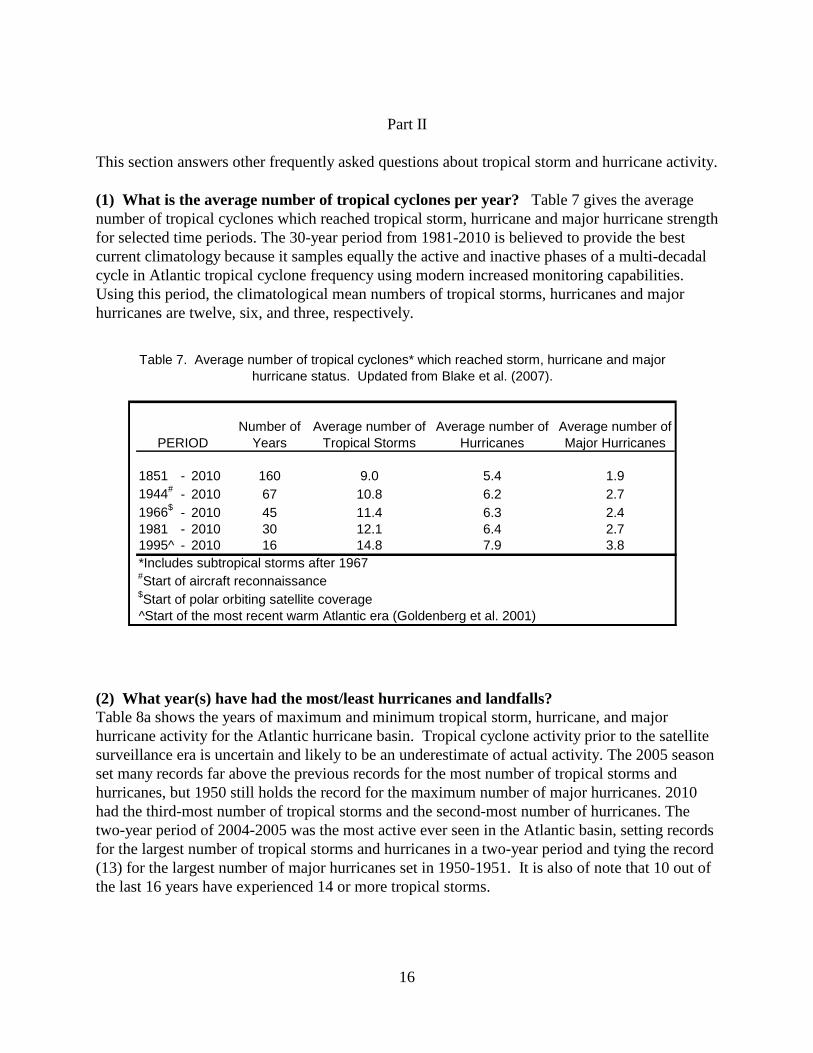
This section answers other frequently asked questions about tropical storm and hurricane activity. (1) What is the average number of tropical cyclones per year? Table 7 gives the average number of tropical cyclones which reached tropical storm, hurricane and major hurricane strength for selected time periods. The 30-year period from 1981-2010 is believed to provide the best current climatology because it samples equally the active and inactive phases of a multi-decadal cycle in Atlantic tropical cyclone frequency using modern increased monitoring capabilities. Using this period, the climatological mean numbers of tropical storms, hurricanes and major hurricanes are twelve, six, and three, respectively.
(2) What year(s) have had the most/least hurricanes and landfalls? Table 8a shows the years of maximum and minimum tropical storm, hurricane, and major hurricane activity for the Atlantic hurricane basin. Tropical cyclone activity prior to the satellite surveillance era is uncertain and likely to be an underestimate of actual activity. The 2005 season set many records far above the previous records for the most number of tropical storms and hurricanes, but 1950 still holds the record for the maximum number of major hurricanes. 2010 had the third-most number of tropical storms and the second-most number of hurricanes. The two-year period of 2004-2005 was the most active ever seen in the Atlantic basin, setting records for the largest number of tropical storms and hurricanes in a two-year period and tying the record (13) for the largest number of major hurricanes set in 1950-1951. It is also of note that 10 out of the last 16 years have experienced 14 or more tropical storms.
Number of Average number of Average number of Average number ofPERIOD Years Tropical Storms Hurricanes Major Hurricanes
1851 - 2010 160 9.0 5.4 1.91944# - 2010 67 10.8 6.2 2.71966$ - 2010 45 11.4 6.3 2.41981 - 2010 30 12.1 6.4 2.71995^ - 2010 16 14.8 7.9 3.8*Includes subtropical storms after 1967#Start of aircraft reconnaissance$Start of polar orbiting satellite coverage^Start of the most recent warm Atlantic era (Goldenberg et al. 2001)
Table 7. Average number of tropical cyclones* which reached storm, hurricane and major hurricane status. Updated from Blake et al. (2007).
17
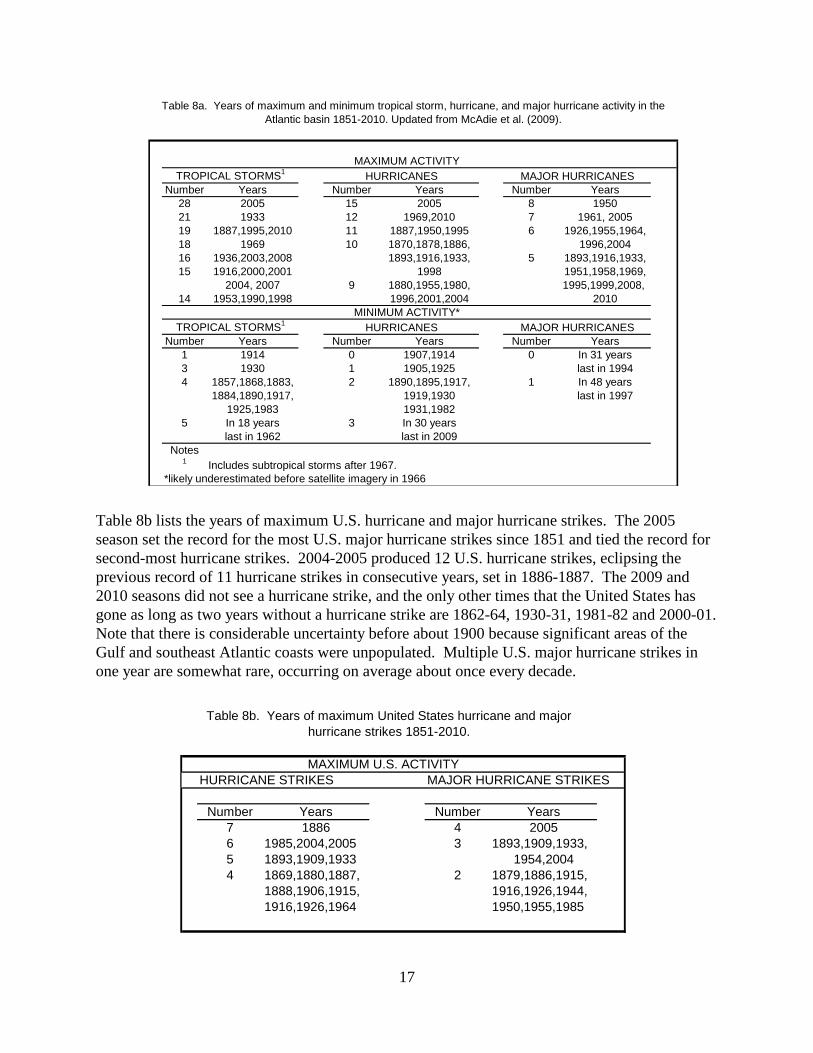
Table 8b lists the years of maximum U.S. hurricane and major hurricane strikes. The 2005 season set the record for the most U.S. major hurricane strikes since 1851 and tied the record for second-most hurricane strikes. 2004-2005 produced 12 U.S. hurricane strikes, eclipsing the previous record of 11 hurricane strikes in consecutive years, set in 1886-1887. The 2009 and 2010 seasons did not see a hurricane strike, and the only other times that the United States has gone as long as two years without a hurricane strike are 1862-64, 1930-31, 1981-82 and 2000-01. Note that there is considerable uncertainty before about 1900 because significant areas of the Gulf and southeast Atlantic coasts were unpopulated. Multiple U.S. major hurricane strikes in one year are somewhat rare, occurring on average about once every decade.
MAXIMUM ACTIVITYTROPICAL STORMS1 HURRICANES MAJOR HURRICANES
Number Years Number Years Number Years28 2005 15 2005 8 195021 1933 12 1969,2010 7 1961, 200519 1887,1995,2010 11 1887,1950,1995 6 1926,1955,1964,18 1969 10 1870,1878,1886, 1996,200416 1936,2003,2008 1893,1916,1933, 5 1893,1916,1933,15 1916,2000,2001 1998 1951,1958,1969, 2004, 2007 9 1880,1955,1980, 1995,1999,2008,
14 1953,1990,1998 1996,2001,2004 2010MINIMUM ACTIVITY*
TROPICAL STORMS1 HURRICANES MAJOR HURRICANESNumber Years Number Years Number Years
1 1914 0 1907,1914 0 In 31 years3 1930 1 1905,1925 last in 19944 1857,1868,1883, 2 1890,1895,1917, 1 In 48 years 1884,1890,1917, 1919,1930 last in 1997
1925,1983 1931,1982 5 In 18 years 3 In 30 years
last in 1962 last in 2009 Notes
1 Includes subtropical storms after 1967. *likely underestimated before satellite imagery in 1966
Table 8a. Years of maximum and minimum tropical storm, hurricane, and major hurricane activity in the Atlantic basin 1851-2010. Updated from McAdie et al. (2009).
MAXIMUM U.S. ACTIVITY HURRICANE STRIKES MAJOR HURRICANE STRIKES
Number Years Number Years7 1886 4 20056 1985,2004,2005 3 1893,1909,1933,5 1893,1909,1933 1954,20044 1869,1880,1887, 2 1879,1886,1915, 1888,1906,1915, 1916,1926,1944, 1916,1926,1964 1950,1955,1985
Table 8b. Years of maximum United States hurricane and major hurricane strikes 1851-2010.
18
(3) When were the earliest and latest hurricane formations? The Atlantic hurricane season is defined as June 1 through November 30. The earliest observed hurricane formation occurred on March 7, 1908, while the latest observed formation was on December 31, 1954 (the second “Alice” of that year which persisted as a hurricane until January 5, 1955). Zeta of 2005 was the second latest tropical cyclone to form, just six hours ahead of Alice in 1954. The earliest hurricane to strike the United States was Alma which struck northwest Florida on June 9, 1966. Hurricane Kate was the latest hurricane to strike the United States on November 21, 1985. Note that a previously analyzed hurricane landfall on December 1, 1925 near Tampa, Florida has been recently re-analyzed to be a tropical storm landfall. (4) What were the longest-lived and shortest-lived hurricanes? The third tropical cyclone of 1899 holds the record for most days as a tropical storm (28) and as major hurricane (11.5), while Ginger in 1971 holds the record for the most days as a hurricane (20). There have been many tropical cyclones that remained at hurricane intensity for 12 hours or less, the most recent of which was Karen of 2007. (5) What was the hurricane with the lowest central pressure in the Atlantic basin? Wilma in 2005 had an estimated pressure of 882 millibars in the northwestern Caribbean Sea, breaking the previous record of 888 millibars held by Gilbert of 1988. The 1935 Labor Day hurricane in the Florida Keys had the lowest central pressure in any hurricane to strike the United States since 1851, with a pressure of 892 millibars. (6) What were the strongest and weakest hurricanes in terms of maximum sustained winds? Different methodologies have been used to arrive at wind estimates in HURDAT during different time periods. The Atlantic re-analysis project is undergoing an extensive overhaul of the best track database at this time to standardize the methodology. Right now, this reanalysis of wind estimates is only available for the years 1851-1930. Substantial changes to the wind record are expected during the period 1931-1989. After this project is complete, NHC will publish a list of the strongest hurricanes in terms of winds. Numerous hurricanes have made landfall in the United States with minimal (75 mph) hurricane force winds, most recently Cindy of 2005. (7) What was the most number of hurricanes occurring in the Atlantic basin at the same time? Four hurricanes occurred simultaneously on two occasions. The first occasion was August 22, 1893, and one of these hurricanes eventually killed 1,000-2,000 people in Georgia and South Carolina. The second occurrence was from September 25-27, 1998, when Georges, Ivan, Jeanne and Karl all existed at hurricane strength. In 1971 from September 10 to 12, there were five tropical cyclones at the same time; however, while most of these ultimately achieved hurricane intensity, there were never more than two hurricanes at any one time.
19
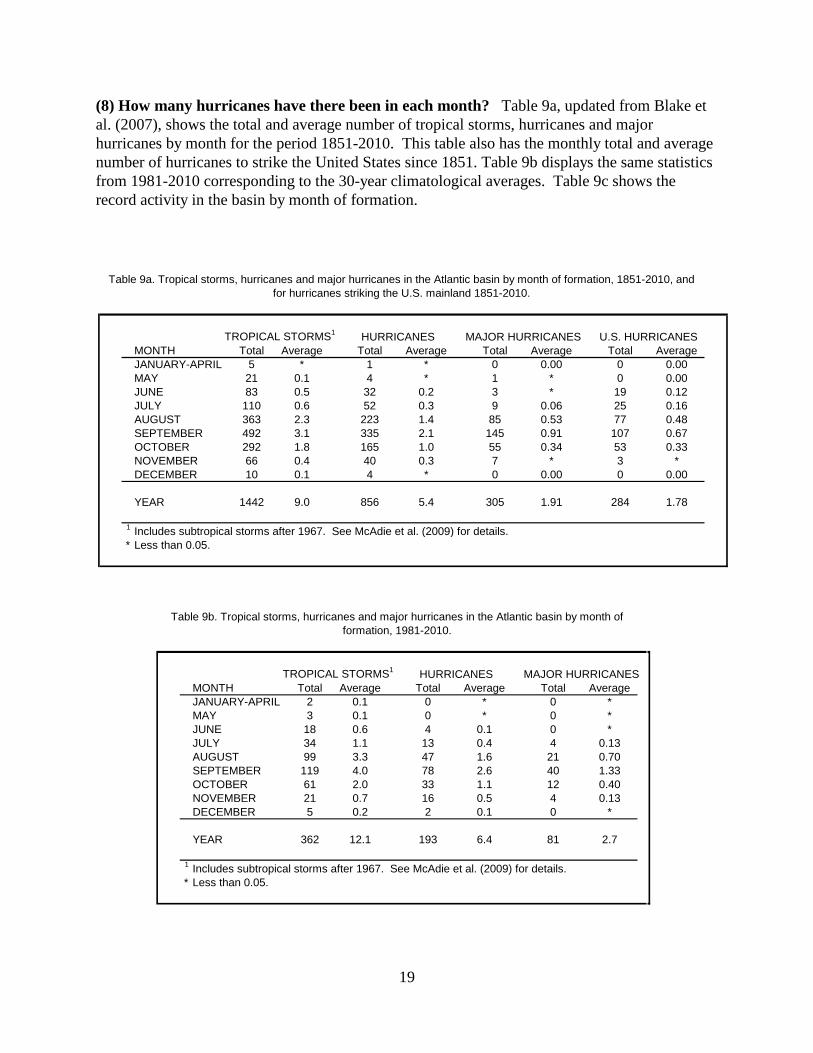
(8) How many hurricanes have there been in each month? Table 9a, updated from Blake et al. (2007), shows the total and average number of tropical storms, hurricanes and major hurricanes by month for the period 1851-2010. This table also has the monthly total and average number of hurricanes to strike the United States since 1851. Table 9b displays the same statistics from 1981-2010 corresponding to the 30-year climatological averages. Table 9c shows the record activity in the basin by month of formation.
TROPICAL STORMS1 HURRICANES MAJOR HURRICANES U.S. HURRICANESMONTH Total Average Total Average Total Average Total AverageJANUARY-APRIL 5 * 1 * 0 0.00 0 0.00MAY 21 0.1 4 * 1 * 0 0.00JUNE 83 0.5 32 0.2 3 * 19 0.12JULY 110 0.6 52 0.3 9 0.06 25 0.16AUGUST 363 2.3 223 1.4 85 0.53 77 0.48SEPTEMBER 492 3.1 335 2.1 145 0.91 107 0.67OCTOBER 292 1.8 165 1.0 55 0.34 53 0.33NOVEMBER 66 0.4 40 0.3 7 * 3 *DECEMBER 10 0.1 4 * 0 0.00 0 0.00
YEAR 1442 9.0 856 5.4 305 1.91 284 1.78
1 Includes subtropical storms after 1967. See McAdie et al. (2009) for details.* Less than 0.05.
Table 9a. Tropical storms, hurricanes and major hurricanes in the Atlantic basin by month of formation, 1851-2010, and for hurricanes striking the U.S. mainland 1851-2010.
TROPICAL STORMS1 HURRICANES MAJOR HURRICANESMONTH Total Average Total Average Total AverageJANUARY-APRIL 2 0.1 0 * 0 *MAY 3 0.1 0 * 0 *JUNE 18 0.6 4 0.1 0 *JULY 34 1.1 13 0.4 4 0.13AUGUST 99 3.3 47 1.6 21 0.70SEPTEMBER 119 4.0 78 2.6 40 1.33OCTOBER 61 2.0 33 1.1 12 0.40NOVEMBER 21 0.7 16 0.5 4 0.13DECEMBER 5 0.2 2 0.1 0 *
YEAR 362 12.1 193 6.4 81 2.7
1 Includes subtropical storms after 1967. See McAdie et al. (2009) for details.* Less than 0.05.
Table 9b. Tropical storms, hurricanes and major hurricanes in the Atlantic basin by month of formation, 1981-2010.
20
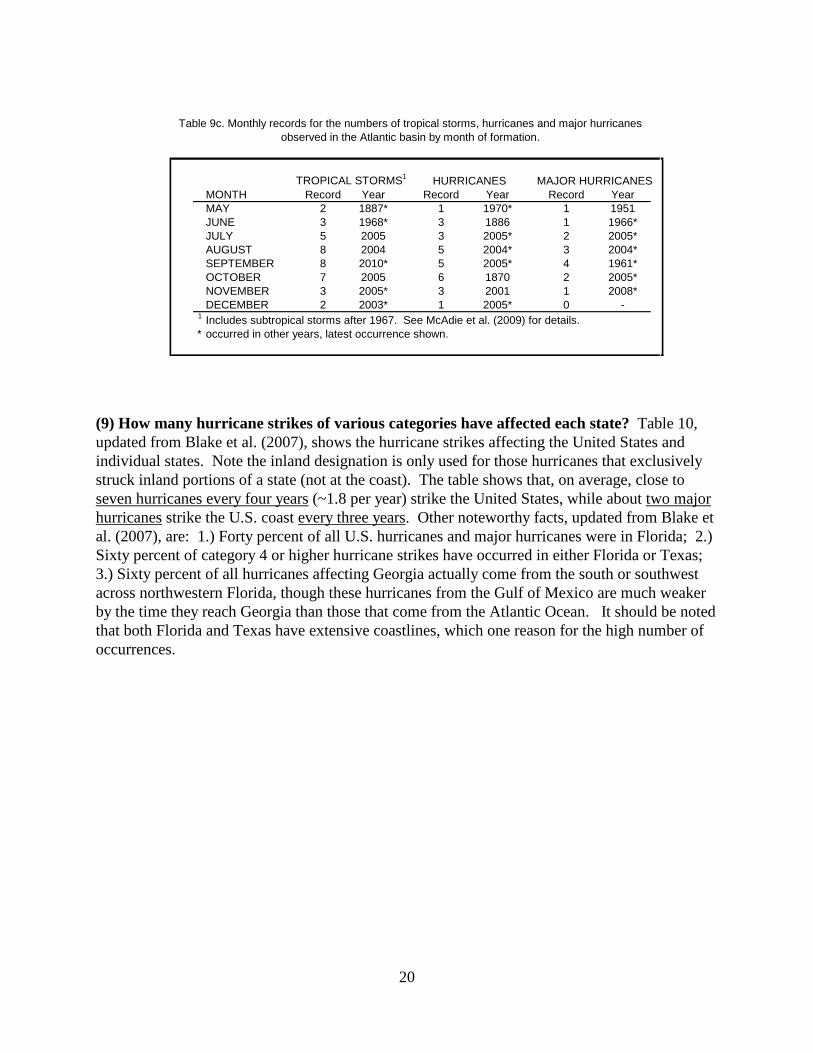
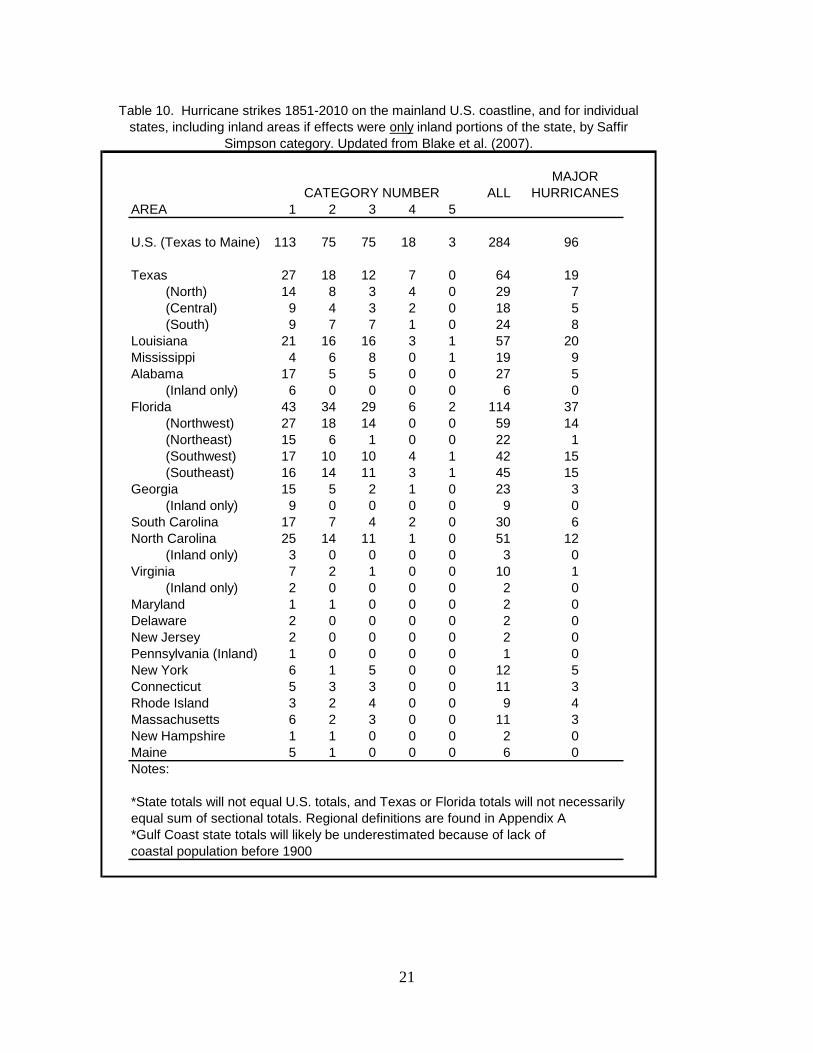
(9) How many hurricane strikes of various categories have affected each state? Table 10, updated from Blake et al. (2007), shows the hurricane strikes affecting the United States and individual states. Note the inland designation is only used for those hurricanes that exclusively struck inland portions of a state (not at the coast). The table shows that, on average, close to seven hurricanes every four years (~1.8 per year) strike the United States, while about two major hurricanes strike the U.S. coast every three years. Other noteworthy facts, updated from Blake et al. (2007), are: 1.) Forty percent of all U.S. hurricanes and major hurricanes were in Florida; 2.) Sixty percent of category 4 or higher hurricane strikes have occurred in either Florida or Texas; 3.) Sixty percent of all hurricanes affecting Georgia actually come from the south or southwest across northwestern Florida, though these hurricanes from the Gulf of Mexico are much weaker by the time they reach Georgia than those that come from the Atlantic Ocean. It should be noted that both Florida and Texas have extensive coastlines, which one reason for the high number of occurrences.
TROPICAL STORMS1 HURRICANES MAJOR HURRICANESMONTH Record Year Record Year Record YearMAY 2 1887* 1 1970* 1 1951JUNE 3 1968* 3 1886 1 1966*JULY 5 2005 3 2005* 2 2005*AUGUST 8 2004 5 2004* 3 2004*SEPTEMBER 8 2010* 5 2005* 4 1961*OCTOBER 7 2005 6 1870 2 2005*NOVEMBER 3 2005* 3 2001 1 2008*DECEMBER 2 2003* 1 2005* 0 -
1 Includes subtropical storms after 1967. See McAdie et al. (2009) for details.* occurred in other years, latest occurrence shown.
Table 9c. Monthly records for the numbers of tropical storms, hurricanes and major hurricanes observed in the Atlantic basin by month of formation.
21
MAJORCATEGORY NUMBER ALL HURRICANES
AREA 1 2 3 4 5
U.S. (Texas to Maine) 113 75 75 18 3 284 96
Texas 27 18 12 7 0 64 19(North) 14 8 3 4 0 29 7(Central) 9 4 3 2 0 18 5(South) 9 7 7 1 0 24 8
Louisiana 21 16 16 3 1 57 20Mississippi 4 6 8 0 1 19 9Alabama 17 5 5 0 0 27 5
(Inland only) 6 0 0 0 0 6 0Florida 43 34 29 6 2 114 37
(Northwest) 27 18 14 0 0 59 14(Northeast) 15 6 1 0 0 22 1(Southwest) 17 10 10 4 1 42 15(Southeast) 16 14 11 3 1 45 15
Georgia 15 5 2 1 0 23 3(Inland only) 9 0 0 0 0 9 0
South Carolina 17 7 4 2 0 30 6North Carolina 25 14 11 1 0 51 12
(Inland only) 3 0 0 0 0 3 0Virginia 7 2 1 0 0 10 1
(Inland only) 2 0 0 0 0 2 0Maryland 1 1 0 0 0 2 0Delaware 2 0 0 0 0 2 0New Jersey 2 0 0 0 0 2 0Pennsylvania (Inland) 1 0 0 0 0 1 0New York 6 1 5 0 0 12 5 Connecticut 5 3 3 0 0 11 3 Rhode Island 3 2 4 0 0 9 4 Massachusetts 6 2 3 0 0 11 3 New Hampshire 1 1 0 0 0 2 0Maine 5 1 0 0 0 6 0Notes:
*State totals will not equal U.S. totals, and Texas or Florida totals will not necessarilyequal sum of sectional totals. Regional definitions are found in Appendix A*Gulf Coast state totals will likely be underestimated because of lack ofcoastal population before 1900
Table 10. Hurricane strikes 1851-2010 on the mainland U.S. coastline, and for individual states, including inland areas if effects were only inland portions of the state, by Saffir
Simpson category. Updated from Blake et al. (2007).
22
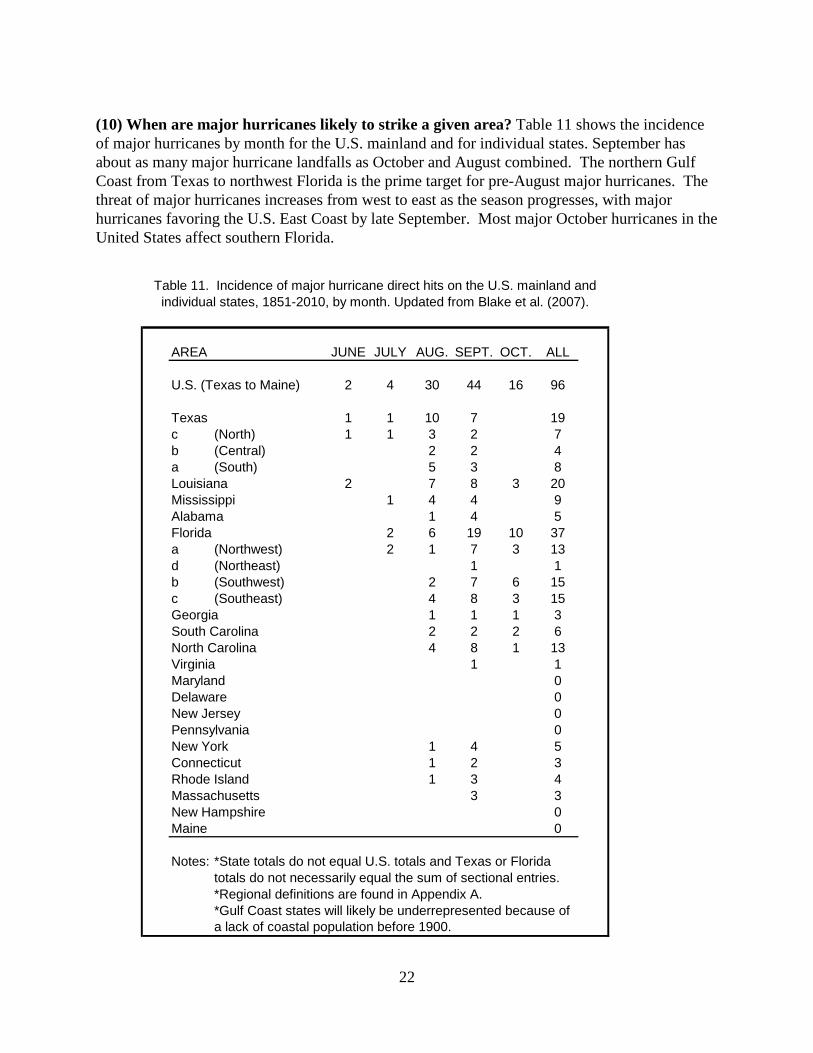
(10) When are major hurricanes likely to strike a given area? Table 11 shows the incidence of major hurricanes by month for the U.S. mainland and for individual states. September has about as many major hurricane landfalls as October and August combined. The northern Gulf Coast from Texas to northwest Florida is the prime target for pre-August major hurricanes. The threat of major hurricanes increases from west to east as the season progresses, with major hurricanes favoring the U.S. East Coast by late September. Most major October hurricanes in the United States affect southern Florida.
AREA JUNE JULY AUG. SEPT. OCT. ALL
U.S. (Texas to Maine) 2 4 30 44 16 96
Texas 1 1 10 7 19c (North) 1 1 3 2 7b (Central) 2 2 4a (South) 5 3 8Louisiana 2 7 8 3 20Mississippi 1 4 4 9Alabama 1 4 5Florida 2 6 19 10 37a (Northwest) 2 1 7 3 13d (Northeast) 1 1b (Southwest) 2 7 6 15c (Southeast) 4 8 3 15Georgia 1 1 1 3South Carolina 2 2 2 6North Carolina 4 8 1 13Virginia 1 1Maryland 0Delaware 0New Jersey 0Pennsylvania 0New York 1 4 5Connecticut 1 2 3Rhode Island 1 3 4Massachusetts 3 3New Hampshire 0Maine 0
Notes: *State totals do not equal U.S. totals and Texas or Florida totals do not necessarily equal the sum of sectional entries.*Regional definitions are found in Appendix A.*Gulf Coast states will likely be underrepresented because ofa lack of coastal population before 1900.
Table 11. Incidence of major hurricane direct hits on the U.S. mainland and individual states, 1851-2010, by month. Updated from Blake et al. (2007).
23
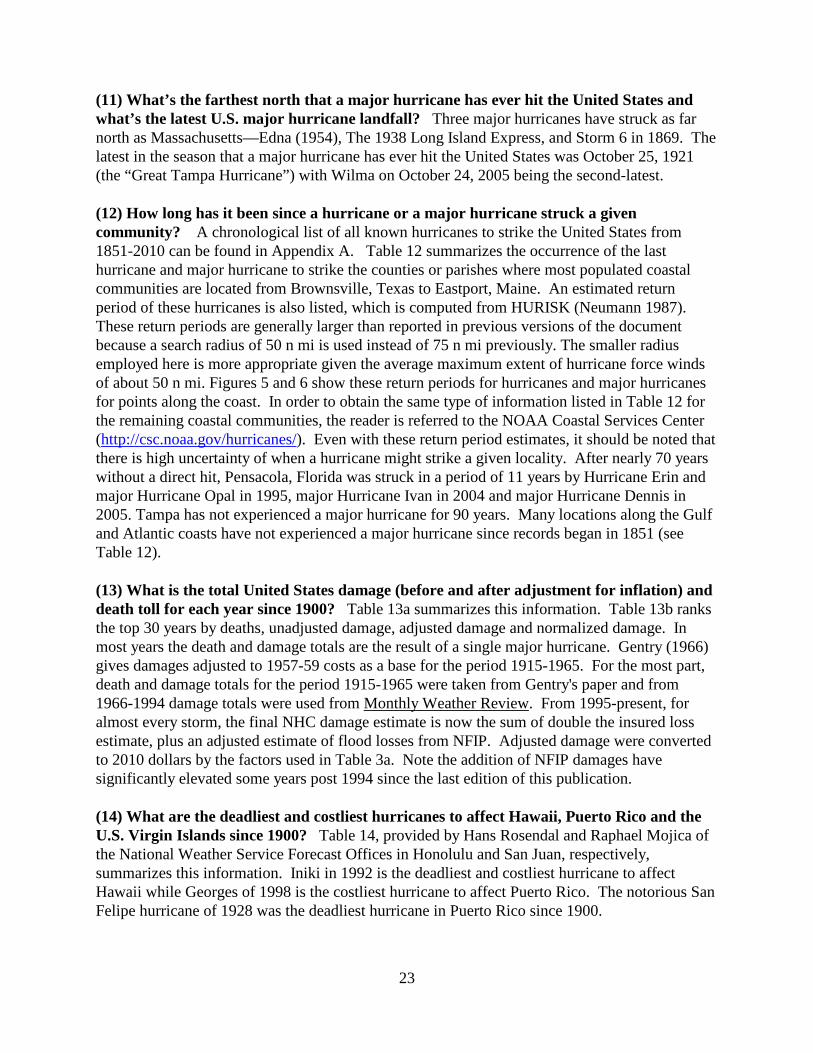
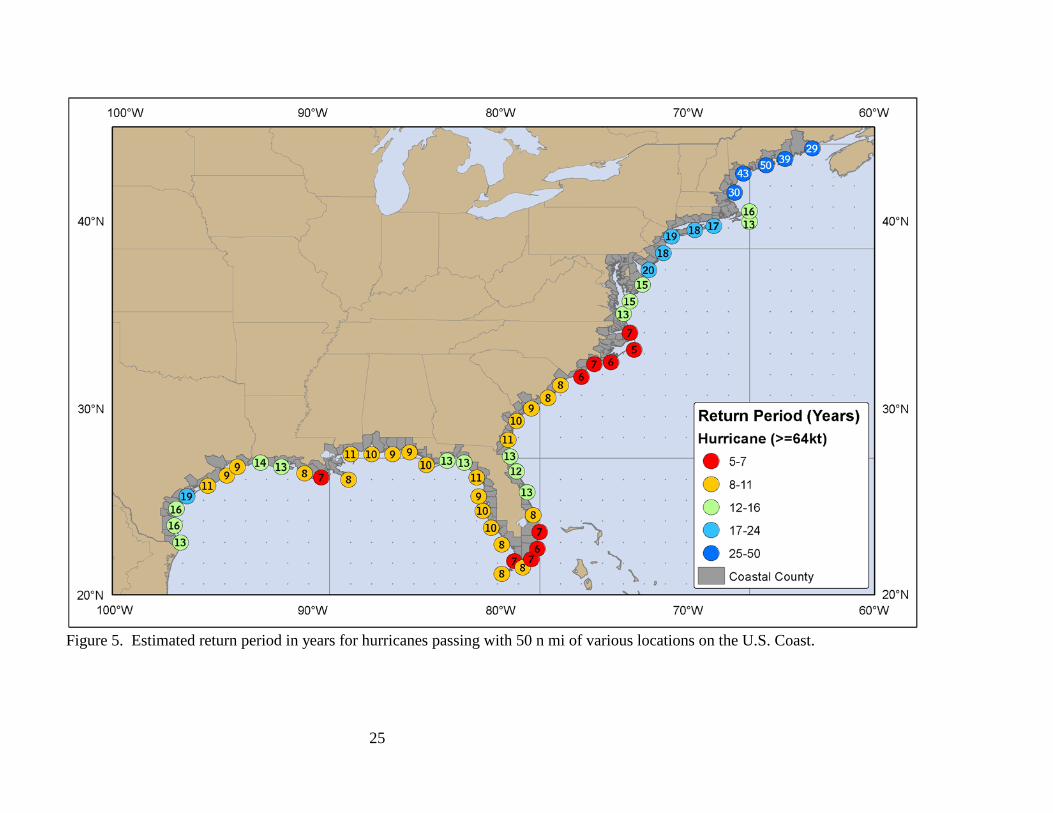
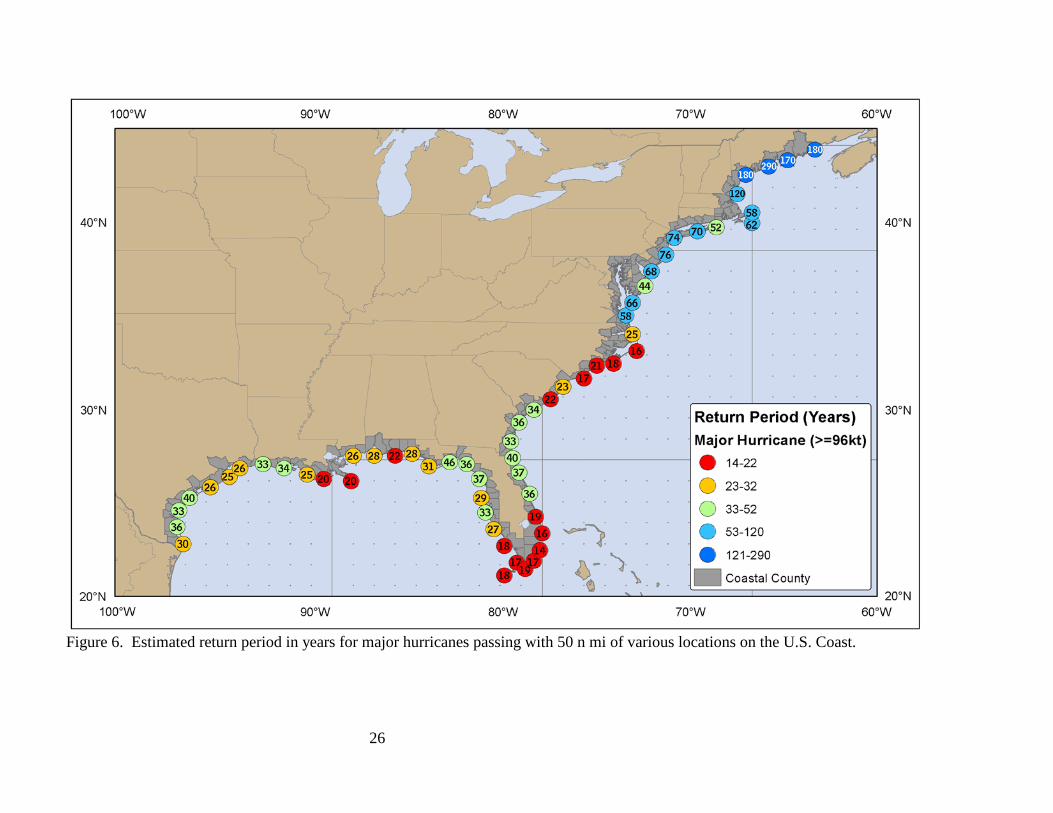
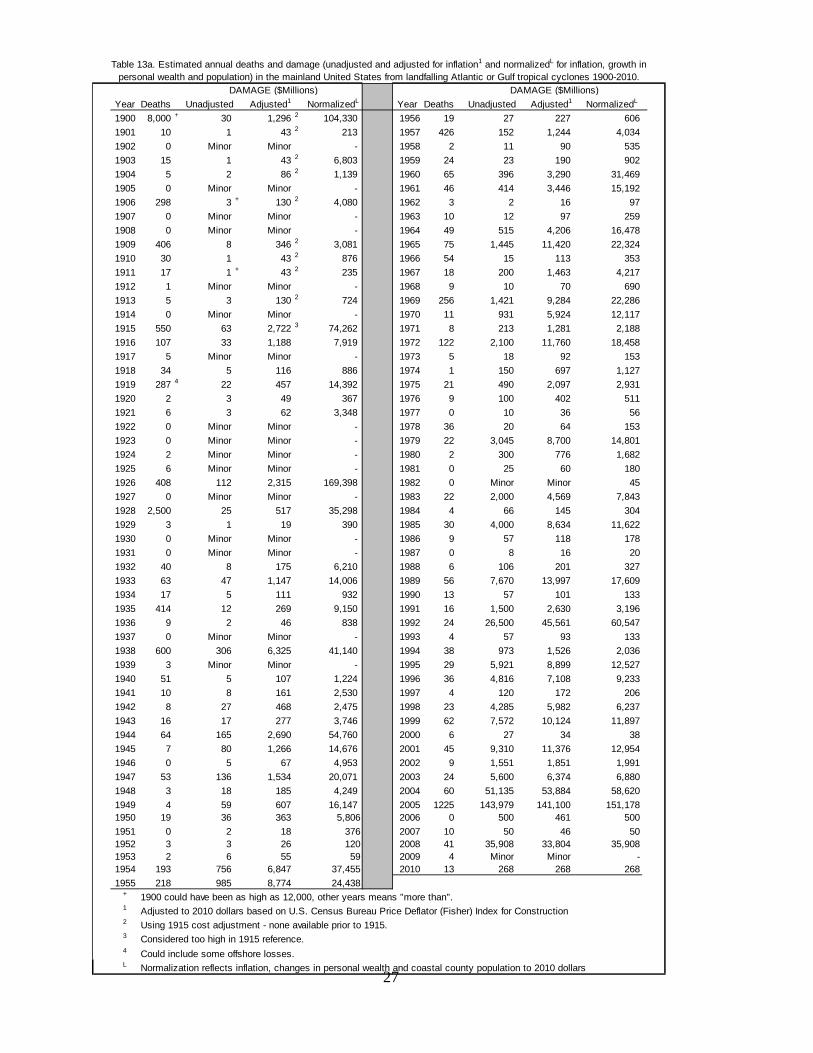
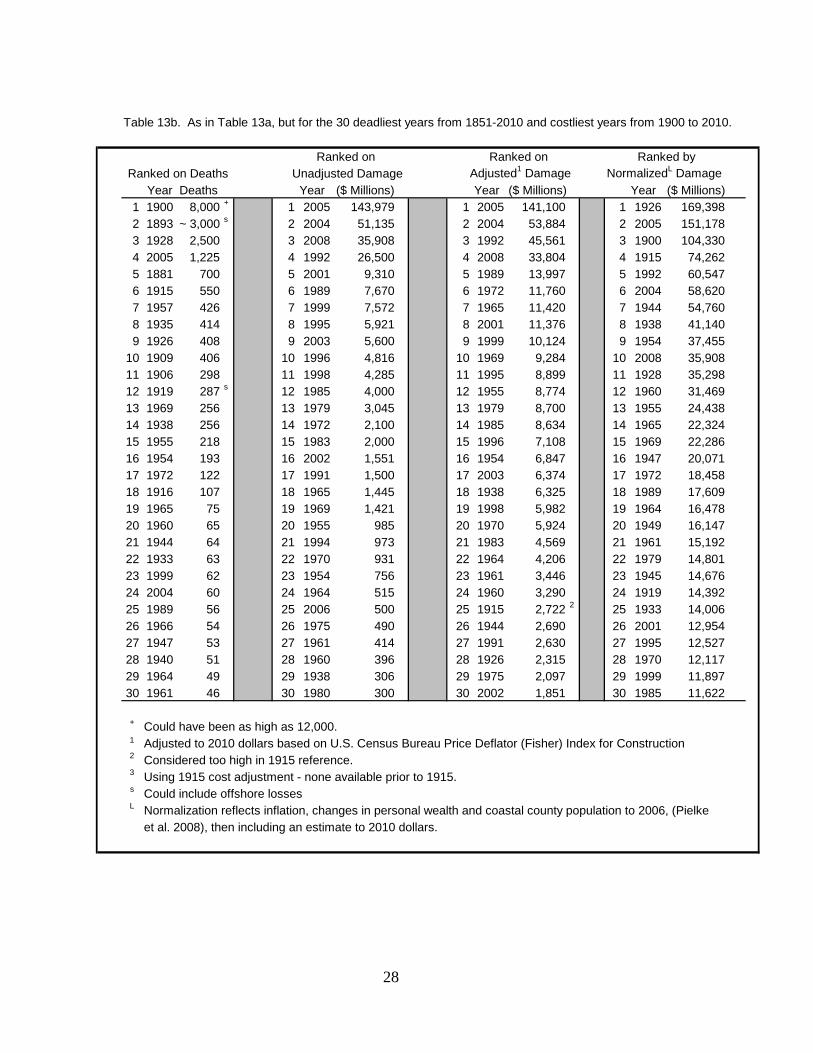
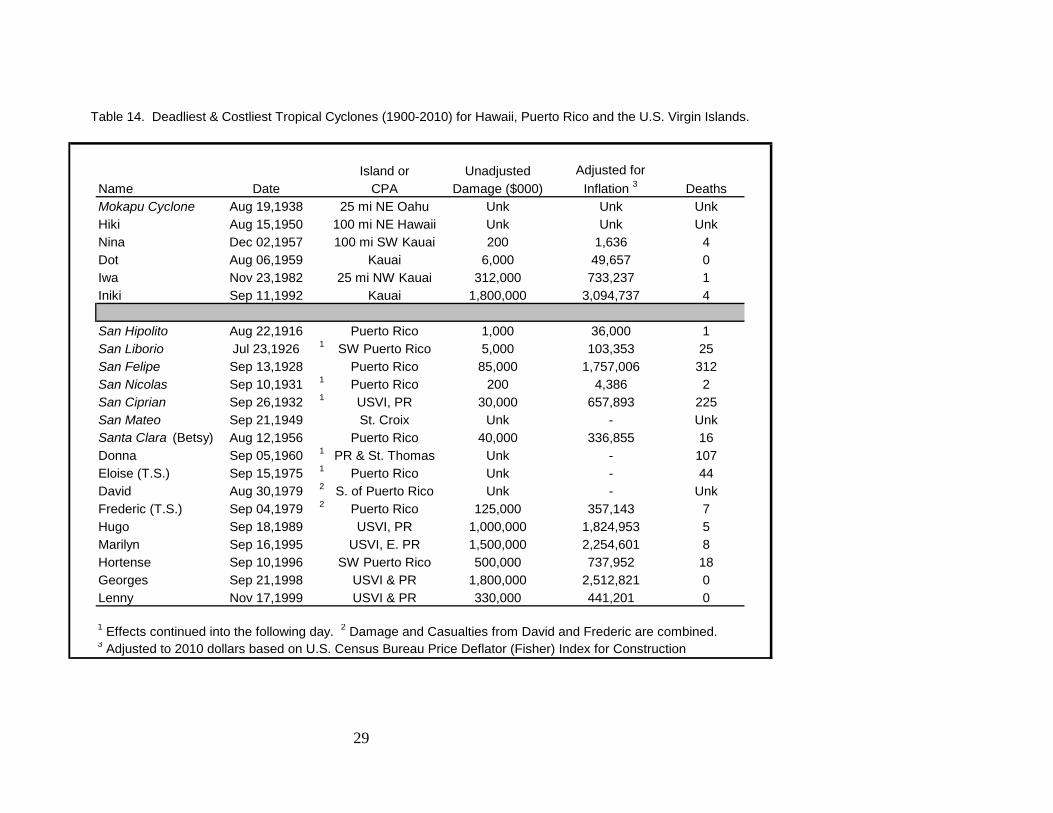
(11) What’s the farthest north that a major hurricane has ever hit the United States and what’s the latest U.S. major hurricane landfall? Three major hurricanes have struck as far north as Massachusetts—Edna (1954), The 1938 Long Island Express, and Storm 6 in 1869. The latest in the season that a major hurricane has ever hit the United States was October 25, 1921 (the “Great Tampa Hurricane”) with Wilma on October 24, 2005 being the second-latest. (12) How long has it been since a hurricane or a major hurricane struck a given community? A chronological list of all known hurricanes to strike the United States from 1851-2010 can be found in Appendix A. Table 12 summarizes the occurrence of the last hurricane and major hurricane to strike the counties or parishes where most populated coastal communities are located from Brownsville, Texas to Eastport, Maine. An estimated return period of these hurricanes is also listed, which is computed from HURISK (Neumann 1987). These return periods are generally larger than reported in previous versions of the document because a search radius of 50 n mi is used instead of 75 n mi previously. The smaller radius employed here is more appropriate given the average maximum extent of hurricane force winds of about 50 n mi. Figures 5 and 6 show these return periods for hurricanes and major hurricanes for points along the coast. In order to obtain the same type of information listed in Table 12 for the remaining coastal communities, the reader is referred to the NOAA Coastal Services Center (http://csc.noaa.gov/hurricanes/). Even with these return period estimates, it should be noted that there is high uncertainty of when a hurricane might strike a given locality. After nearly 70 years without a direct hit, Pensacola, Florida was struck in a period of 11 years by Hurricane Erin and major Hurricane Opal in 1995, major Hurricane Ivan in 2004 and major Hurricane Dennis in 2005. Tampa has not experienced a major hurricane for 90 years. Many locations along the Gulf and Atlantic coasts have not experienced a major hurricane since records began in 1851 (see Table 12). (13) What is the total United States damage (before and after adjustment for inflation) and death toll for each year since 1900? Table 13a summarizes this information. Table 13b ranks the top 30 years by deaths, unadjusted damage, adjusted damage and normalized damage. In most years the death and damage totals are the result of a single major hurricane. Gentry (1966) gives damages adjusted to 1957-59 costs as a base for the period 1915-1965. For the most part, death and damage totals for the period 1915-1965 were taken from Gentry's paper and from 1966-1994 damage totals were used from Monthly Weather Review. From 1995-present, for almost every storm, the final NHC damage estimate is now the sum of double the insured loss estimate, plus an adjusted estimate of flood losses from NFIP. Adjusted damage were converted to 2010 dollars by the factors used in Table 3a. Note the addition of NFIP damages have significantly elevated some years post 1994 since the last edition of this publication. (14) What are the deadliest and costliest hurricanes to affect Hawaii, Puerto Rico and the U.S. Virgin Islands since 1900? Table 14, provided by Hans Rosendal and Raphael Mojica of the National Weather Service Forecast Offices in Honolulu and San Juan, respectively, summarizes this information. Iniki in 1992 is the deadliest and costliest hurricane to affect Hawaii while Georges of 1998 is the costliest hurricane to affect Puerto Rico. The notorious San Felipe hurricane of 1928 was the deadliest hurricane in Puerto Rico since 1900.
24
MAJOR HURRICANE MAJOR HURRICANEReturn Return Return Return
State City (County/Parish) Period By County Period By County State City (County) Period By County Period By CountyTexas Brownsville (Cameron) 30 yrs 1980(3) Allen 13 yrs 2008(1) Dolly Florida Vero Beach (Indian River) 20 yrs 2004(3) Jeanne 9 yrs 2004(3) Jeanne
Corpus Christi (Nueces) 36 1970(3) Celia 16 1971(1) Fern Cocoa Beach (Brevard) 34 2004(3) Jeanne 12 2004(3) JeannePort Aransas (Aransas) 33 1970(3) Celia 16 1971(1) Fern Daytona Beach (Volusia) 37 <1880 12 1960(2) DonnaMatagorda (Matagorda) 40 1961(4) Carla 19 2003(1) Claudette St. Augustine (St. Johns) 40 <1880 13 1964(2) DoraFreeport (Brazoria) 26 1983(3) Alicia 11 2008(2) Ike Jacksonville (Duval) 39 <1880 13 1964(2) DoraGalveston (Galveston) 25 1983(3) Alicia 9 2008(2) Ike Fernandina Beach (Nassau) 33 <1880 11 1928(2)Houston (Harris) 31 1941(3) 16 2008(2) Ike Georgia Brunswick (Camden) 34 1898(4) 11 1928(1)Beaumont (Jefferson) 35 2005(3) Rita 16 2008(2) Ike Savannah (Chatham) 36 1893(3) 10 1979(2) David
Louisiana Cameron (Cameron) 33 2005(3) Rita 14 2008(1) Ike S. Carolina Hilton Head (Beaufort) 34 1959(3) Gracie 9 1979(2) DavidMorgan City (St. Mary) 25 1992(3) Andrew 8 2008(2) Gustav Charleston (Charleston) 22 1989(4) Hugo 8 2004(1) GastonHouma (Terrebonne) 20 1992(3) Andrew 8 2008(2) Gustav Myrtle Beach (Horry) 23 1954(4) Hazel 8 2004(1) CharleyNew Orleans (Orleans) 23 2005(3) Katrina 10 2005(3) Katrina N. Carolina Wilmington (New Hanover) 18 1996(3) Fran 7 2005(1) Ophelia
Mississippi Bay St. Louis (Hancock) 28 2005(3) Katrina 13 2005(3) Katrina Morehead City (Carteret) 18 1996(3) Fran 6 2005(1) OpheliaBiloxi (Harrison) 26 2005(3) Katrina 11 2005(3) Katrina Cape Hatteras (Dare) 16 1993(3) Emily 5 2003(2) IsabelPascagoula (Jackson) 22 2005(3) Katrina 11 2005(3) Katrina Virginia Virginia Beach (Virginia Beach) 58 1944(3) 13 2003(1) Isabel
Alabama Mobile (Mobile) 28 2004(3) Ivan 10 2004(3) Ivan Norfolk (Norfolk) 65 <1851 15 2003(1) IsabelGulf Shores (Baldwin) 25 2004(3) Ivan 9 2004(3) Ivan Maryland Ocean City (Worcester) 44 <1851 15 1878(1)
Florida Pensacola (Escambia) 22 2005(3) Dennis 9 2005(3) Dennis Baltimore (Baltimore) >200 <1851 75 1878(1)Destin (Okaloosa) 23 1995(3) Opal 9 1995(3) Opal Delaware Rehoboth Beach (Sussex) 50 <1851 17 1903(1)Panama City (Bay) 26 1995(3) Opal 9 1995(3) Opal Wilmington (New Castle) >200 <1851 45 1878(1)Apalachicola (Franklin) 31 1985(3) Elena 10 1998(2) Earl New Jersey Cape May (Cape May) 68 <1851 20 1903(1)Homosassa (Citrus) 37 1950(3) Easy 11 1968(2) Gladys Atlantic City (Atlantic) 76 <1851 18 1903(1)St. Petersburg (Pinellas) 33 1921(3) 10 1946(1) New York New York City (New York) 175 <1851 25 1903(1)Tampa (Hillsboro) 36 1921(3) 11 1946(1) Westhampton (Suffolk) 70 1985(3) Gloria 18 1985(3) GloriaSarasota (Sarasota) 30 1944(3) 10 1946(1) Connecticut New London (New London) 74 1938(3) 20 1991(2) BobFort Myers (Lee) 27 2004(4) Charley 10 2004(4) Charley New Haven (New Haven) 105 1938(3) 25 1985(2) GloriaNaples (Collier) 18 2005(3) Wilma 8 2005(3) Wilma Bridgeport (Fairfield) 110 1954(3) Carol 26 1985(2) GloriaKey West (Monroe) 18 2005(3) Wilma 8 2005(3) Wilma Rhode Island Providence (Providence) 94 1954(3) Carol 24 1991(2) BobMiami (Miami-Dade) 14 1992(5) Andrew 6 2005(2) Wilma Mass. Cape Cod (Barnstable) 58 1954(3) Edna 16 1991(2) BobFort Lauderdale (Broward) 16 1950(3) King 7 2005(2) Wilma Boston (Suffolk) >200 1869(3) 30 1960(1) DonnaW. Palm Beach (Palm Beach 18 2004(3) Jeanne 8 2005(2) Wilma N. Hampshire Portsmouth (Rockingham) >200 <1851 35 1985(2) GloriaStuart (Martin) 19 2004(3) Jeanne 8 2005(2) Wilma Maine Portland (Cumberland) 180 <1851 43 1985(1) GloriaFort Pierce (St. Lucie) 19 2004(3) Jeanne 8 2004(3) Jeanne Eastport (Washington) 180 <1851 29 1969(1) Gerda
Notes: <1900 means before 1900 etc.
Table 12. Last strike and mean return period (Neumann 1987) of a major hurricane or hurricane by county/parish within 50 n mi for certain populated coastal communities. Category in parenthesis.
HURRICANE HURRICANELast Strike Last Strike Last Strike Last Strike
25
Figure 5. Estimated return period in years for hurricanes passing with 50 n mi of various locations on the U.S. Coast.
26
Figure 6. Estimated return period in years for major hurricanes passing with 50 n mi of various locations on the U.S. Coast.
27
Year Deaths Unadjusted Adjusted1 NormalizedL Year Deaths Unadjusted Adjusted1 NormalizedL
1900 8,000 + 30 1,296 2 104,330 1956 19 27 227 6061901 10 1 43 2 213 1957 426 152 1,244 4,0341902 0 Minor Minor - 1958 2 11 90 5351903 15 1 43 2 6,803 1959 24 23 190 9021904 5 2 86 2 1,139 1960 65 396 3,290 31,4691905 0 Minor Minor - 1961 46 414 3,446 15,1921906 298 3 + 130 2 4,080 1962 3 2 16 971907 0 Minor Minor - 1963 10 12 97 2591908 0 Minor Minor - 1964 49 515 4,206 16,4781909 406 8 346 2 3,081 1965 75 1,445 11,420 22,3241910 30 1 43 2 876 1966 54 15 113 3531911 17 1 + 43 2 235 1967 18 200 1,463 4,2171912 1 Minor Minor - 1968 9 10 70 6901913 5 3 130 2 724 1969 256 1,421 9,284 22,2861914 0 Minor Minor - 1970 11 931 5,924 12,1171915 550 63 2,722 3 74,262 1971 8 213 1,281 2,1881916 107 33 1,188 7,919 1972 122 2,100 11,760 18,4581917 5 Minor Minor - 1973 5 18 92 1531918 34 5 116 886 1974 1 150 697 1,1271919 287 4 22 457 14,392 1975 21 490 2,097 2,9311920 2 3 49 367 1976 9 100 402 5111921 6 3 62 3,348 1977 0 10 36 561922 0 Minor Minor - 1978 36 20 64 1531923 0 Minor Minor - 1979 22 3,045 8,700 14,8011924 2 Minor Minor - 1980 2 300 776 1,6821925 6 Minor Minor - 1981 0 25 60 1801926 408 112 2,315 169,398 1982 0 Minor Minor 451927 0 Minor Minor - 1983 22 2,000 4,569 7,8431928 2,500 25 517 35,298 1984 4 66 145 3041929 3 1 19 390 1985 30 4,000 8,634 11,6221930 0 Minor Minor - 1986 9 57 118 1781931 0 Minor Minor - 1987 0 8 16 201932 40 8 175 6,210 1988 6 106 201 3271933 63 47 1,147 14,006 1989 56 7,670 13,997 17,6091934 17 5 111 932 1990 13 57 101 1331935 414 12 269 9,150 1991 16 1,500 2,630 3,1961936 9 2 46 838 1992 24 26,500 45,561 60,5471937 0 Minor Minor - 1993 4 57 93 1331938 600 306 6,325 41,140 1994 38 973 1,526 2,0361939 3 Minor Minor - 1995 29 5,921 8,899 12,5271940 51 5 107 1,224 1996 36 4,816 7,108 9,2331941 10 8 161 2,530 1997 4 120 172 2061942 8 27 468 2,475 1998 23 4,285 5,982 6,2371943 16 17 277 3,746 1999 62 7,572 10,124 11,8971944 64 165 2,690 54,760 2000 6 27 34 381945 7 80 1,266 14,676 2001 45 9,310 11,376 12,9541946 0 5 67 4,953 2002 9 1,551 1,851 1,9911947 53 136 1,534 20,071 2003 24 5,600 6,374 6,8801948 3 18 185 4,249 2004 60 51,135 53,884 58,6201949 4 59 607 16,147 2005 1225 143,979 141,100 151,1781950 19 36 363 5,806 2006 0 500 461 5001951 0 2 18 376 2007 10 50 46 501952 3 3 26 120 2008 41 35,908 33,804 35,9081953 2 6 55 59 2009 4 Minor Minor -1954 193 756 6,847 37,455 2010 13 268 268 2681955 218 985 8,774 24,438
+
1
2 Using 1915 cost adjustment - none available prior to 1915.3 Considered too high in 1915 reference.4
L Normalization reflects inflation, changes in personal wealth and coastal county population to 2010 dollars
Adjusted to 2010 dollars based on U.S. Census Bureau Price Deflator (Fisher) Index for Construction
Table 13a. Estimated annual deaths and damage (unadjusted and adjusted for inflation1 and normalizedL for inflation, growth in personal wealth and population) in the mainland United States from landfalling Atlantic or Gulf tropical cyclones 1900-2010.
DAMAGE ($Millions) DAMAGE ($Millions)
Could include some offshore losses.
1900 could have been as high as 12,000, other years means "more than".
28
Ranked on Ranked on
Unadjusted Damage Adjusted1 Damage NormalizedL DamageYear Deaths Year ($ Millions) Year ($ Millions) Year ($ Millions)
1 1900 8,000 + 1 2005 143,979 1 2005 141,100 1 1926 169,3982 1893 ~ 3,000 s 2 2004 51,135 2 2004 53,884 2 2005 151,1783 1928 2,500 3 2008 35,908 3 1992 45,561 3 1900 104,3304 2005 1,225 4 1992 26,500 4 2008 33,804 4 1915 74,2625 1881 700 5 2001 9,310 5 1989 13,997 5 1992 60,5476 1915 550 6 1989 7,670 6 1972 11,760 6 2004 58,6207 1957 426 7 1999 7,572 7 1965 11,420 7 1944 54,7608 1935 414 8 1995 5,921 8 2001 11,376 8 1938 41,1409 1926 408 9 2003 5,600 9 1999 10,124 9 1954 37,455
10 1909 406 10 1996 4,816 10 1969 9,284 10 2008 35,90811 1906 298 11 1998 4,285 11 1995 8,899 11 1928 35,29812 1919 287 s 12 1985 4,000 12 1955 8,774 12 1960 31,46913 1969 256 13 1979 3,045 13 1979 8,700 13 1955 24,43814 1938 256 14 1972 2,100 14 1985 8,634 14 1965 22,32415 1955 218 15 1983 2,000 15 1996 7,108 15 1969 22,28616 1954 193 16 2002 1,551 16 1954 6,847 16 1947 20,07117 1972 122 17 1991 1,500 17 2003 6,374 17 1972 18,45818 1916 107 18 1965 1,445 18 1938 6,325 18 1989 17,609
19 1965 75 19 1969 1,421 19 1998 5,982 19 1964 16,47820 1960 65 20 1955 985 20 1970 5,924 20 1949 16,14721 1944 64 21 1994 973 21 1983 4,569 21 1961 15,19222 1933 63 22 1970 931 22 1964 4,206 22 1979 14,80123 1999 62 23 1954 756 23 1961 3,446 23 1945 14,67624 2004 60 24 1964 515 24 1960 3,290 24 1919 14,39225 1989 56 25 2006 500 25 1915 2,722 2 25 1933 14,00626 1966 54 26 1975 490 26 1944 2,690 26 2001 12,954
27 1947 53 27 1961 414 27 1991 2,630 27 1995 12,52728 1940 51 28 1960 396 28 1926 2,315 28 1970 12,11729 1964 49 29 1938 306 29 1975 2,097 29 1999 11,89730 1961 46 30 1980 300 30 2002 1,851 30 1985 11,622
+ Could have been as high as 12,000.1
2 Considered too high in 1915 reference.3 Using 1915 cost adjustment - none available prior to 1915.s Could include offshore lossesL
et al. 2008), then including an estimate to 2010 dollars.Normalization reflects inflation, changes in personal wealth and coastal county population to 2006, (Pielke
Adjusted to 2010 dollars based on U.S. Census Bureau Price Deflator (Fisher) Index for Construction
Table 13b. As in Table 13a, but for the 30 deadliest years from 1851-2010 and costliest years from 1900 to 2010.
Ranked on DeathsRanked by
29
Island or UnadjustedName Date CPA Damage ($000) DeathsMokapu Cyclone Aug 19,1938 25 mi NE Oahu Unk Unk UnkHiki Aug 15,1950 100 mi NE Hawaii Unk Unk UnkNina Dec 02,1957 100 mi SW Kauai 200 1,636 4Dot Aug 06,1959 Kauai 6,000 49,657 0Iwa Nov 23,1982 25 mi NW Kauai 312,000 733,237 1Iniki Sep 11,1992 Kauai 1,800,000 3,094,737 4
San Hipolito Aug 22,1916 Puerto Rico 1,000 36,000 1San Liborio Jul 23,1926 1 SW Puerto Rico 5,000 103,353 25San Felipe Sep 13,1928 Puerto Rico 85,000 1,757,006 312San Nicolas Sep 10,1931 1 Puerto Rico 200 4,386 2San Ciprian Sep 26,1932 1 USVI, PR 30,000 657,893 225San Mateo Sep 21,1949 St. Croix Unk - UnkSanta Clara (Betsy) Aug 12,1956 Puerto Rico 40,000 336,855 16Donna Sep 05,1960 1 PR & St. Thomas Unk - 107Eloise (T.S.) Sep 15,1975 1 Puerto Rico Unk - 44David Aug 30,1979 2 S. of Puerto Rico Unk - UnkFrederic (T.S.) Sep 04,1979 2 Puerto Rico 125,000 357,143 7Hugo Sep 18,1989 USVI, PR 1,000,000 1,824,953 5Marilyn Sep 16,1995 USVI, E. PR 1,500,000 2,254,601 8Hortense Sep 10,1996 SW Puerto Rico 500,000 737,952 18Georges Sep 21,1998 USVI & PR 1,800,000 2,512,821 0Lenny Nov 17,1999 USVI & PR 330,000 441,201 0
1 Effects continued into the following day. 2 Damage and Casualties from David and Frederic are combined.
Table 14. Deadliest & Costliest Tropical Cyclones (1900-2010) for Hawaii, Puerto Rico and the U.S. Virgin Islands.
Adjusted for Inflation 3
3 Adjusted to 2010 dollars based on U.S. Census Bureau Price Deflator (Fisher) Index for Construction
30
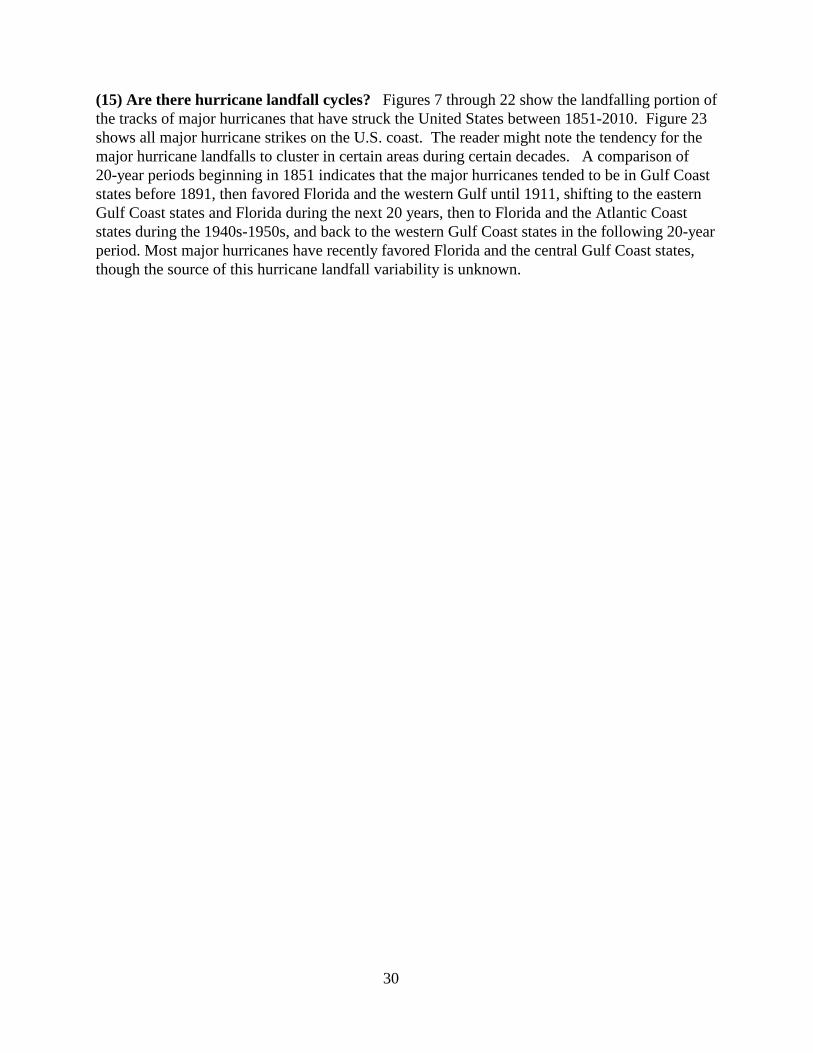
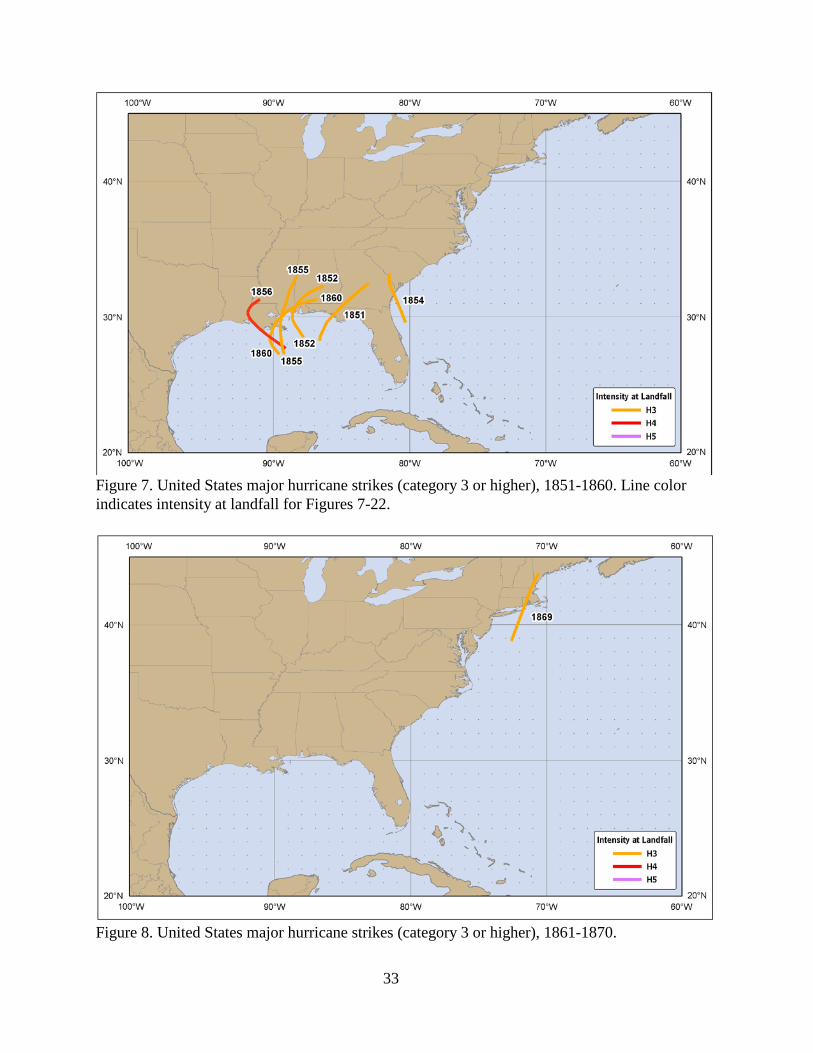
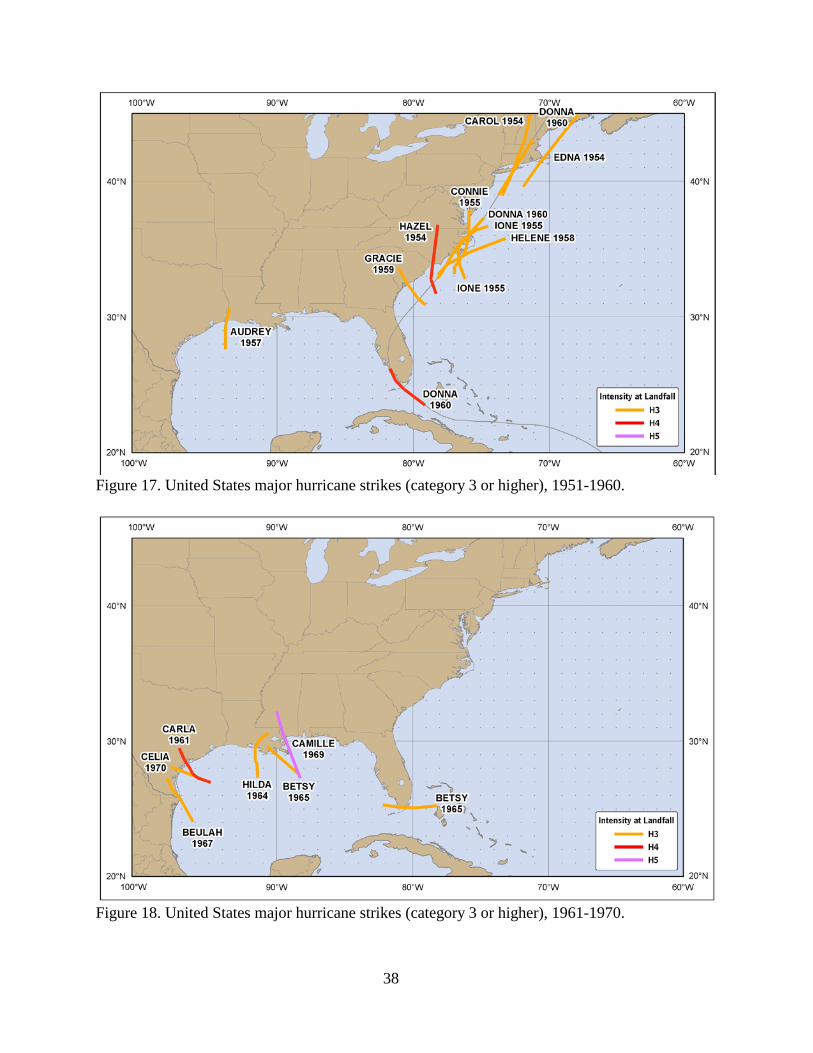
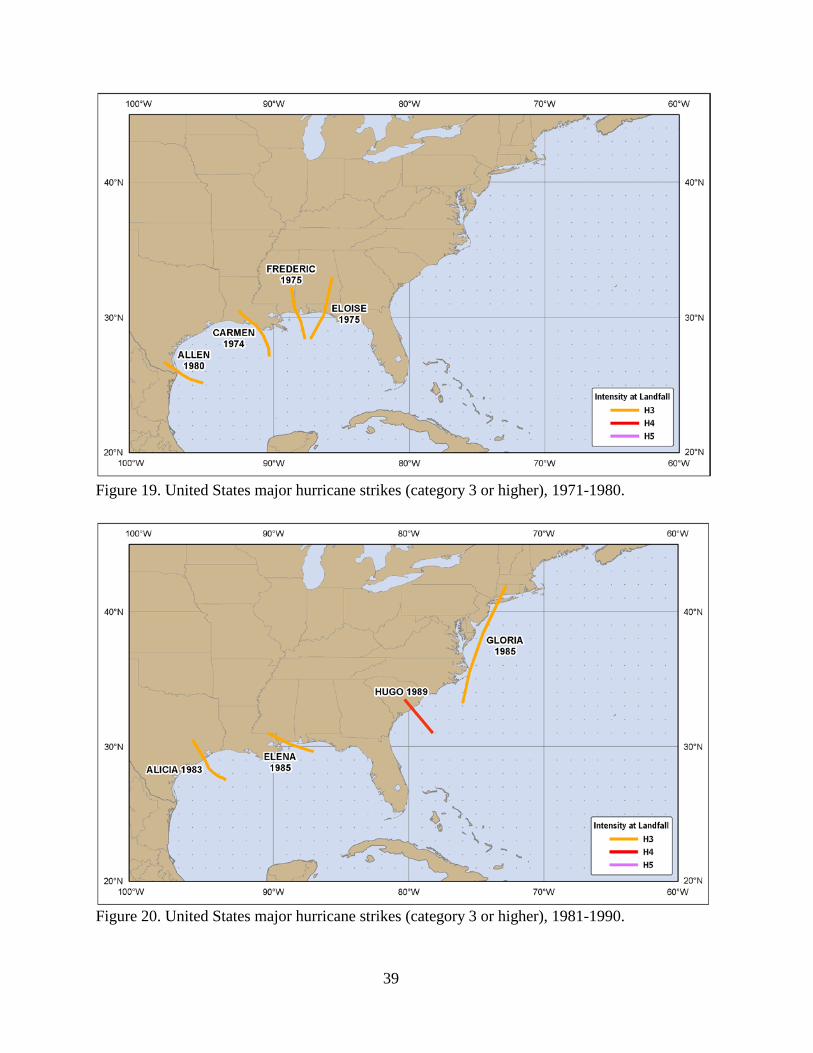
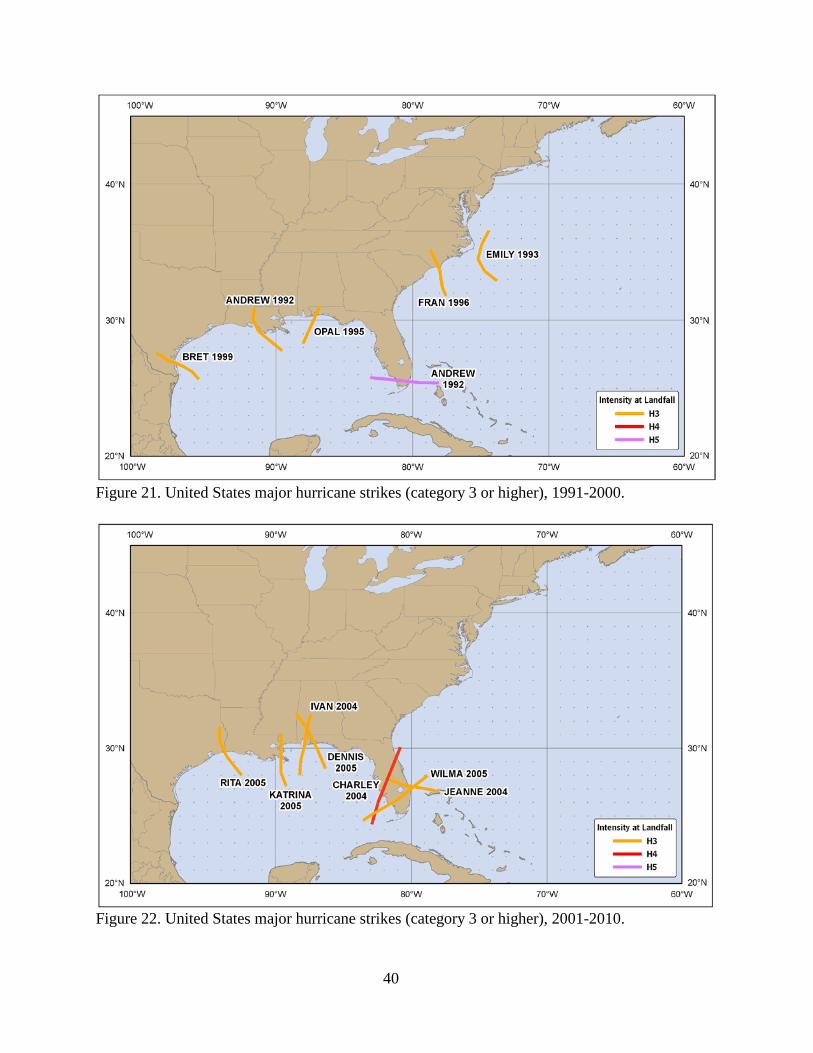
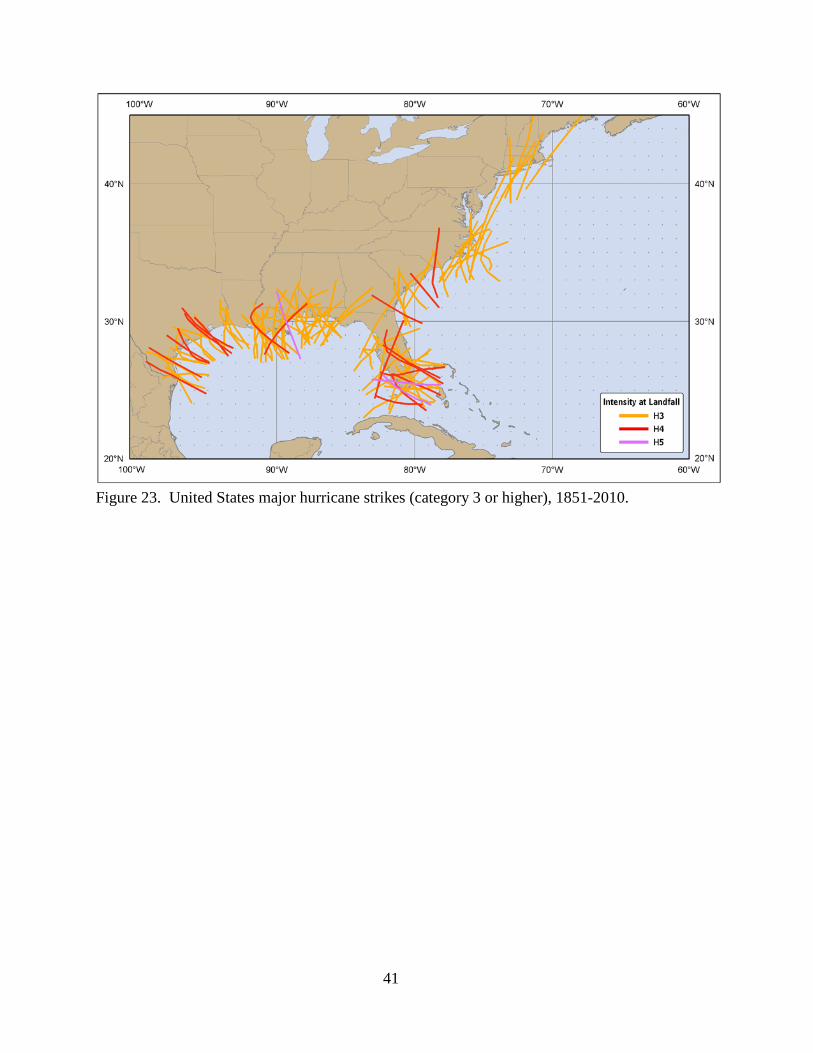
(15) Are there hurricane landfall cycles? Figures 7 through 22 show the landfalling portion of the tracks of major hurricanes that have struck the United States between 1851-2010. Figure 23 shows all major hurricane strikes on the U.S. coast. The reader might note the tendency for the major hurricane landfalls to cluster in certain areas during certain decades. A comparison of 20-year periods beginning in 1851 indicates that the major hurricanes tended to be in Gulf Coast states before 1891, then favored Florida and the western Gulf until 1911, shifting to the eastern Gulf Coast states and Florida during the next 20 years, then to Florida and the Atlantic Coast states during the 1940s-1950s, and back to the western Gulf Coast states in the following 20-year period. Most major hurricanes have recently favored Florida and the central Gulf Coast states, though the source of this hurricane landfall variability is unknown.
31
CONCLUSIONS
In virtually every coastal city from Texas to Maine, the present National Hurricane Center Director (Bill Read) and former directors have stated that the United States is vulnerable to another hurricane disaster. Hurricanes Katrina and Ike are sad reminders of the exposure of the United States to hurricanes. The areas along the United States Gulf and Atlantic coasts where most of this country’s hurricane-related fatalities have occurred are also experiencing the most significant growth in population. The lack of coastal readiness for a hurricane, as suggested by Hebert et al. (1975), Jarrell et al. (1992) and Table 12, is a serious problem and could lead to future disasters. This situation, in combination with continued building along the coast, will lead to dangerous problems for many areas in hurricanes. The message to coastal residents is this: Become familiar with what hurricanes can do, develop a hurricane plan, and when a hurricane threatens your area, increase your chances of survival by executing your plan. The largest loss of life can occur in the storm surge, so coastal residents should prepare to move away from the water until the hurricane has passed! Unless this message is clearly understood by coastal residents through a thorough and continuing preparedness effort, a future disastrous loss of life is inevitable. Acknowledgments: Paul Hebert, Glenn Taylor, Bob Case, Max Mayfield, Jerry Jarrell and Ed Rappaport, co-authors of previous versions of this paper, are recognized for their enduring contributions to this work. Andy Neal of FEMA was critical in supplying data and feedback on the use of NFIP flood data.
32
REFERENCES Blake, E.S., E.N. Rappaport and C.W. Landsea, 2007: The Deadliest, Costliest and Most Intense United States Tropical Cyclones from 1851-2006 (and Other Frequently Requested Hurricane Facts). NOAA, Technical Memorandum NWS-TPC-5, 43 pp. Brunkard J., Namulanda, G., and R. Ratard, 2008: Hurricane Katrina Deaths, Louisiana, 2005. Disaster Med Public Health Preparedness 2 (2008): 215-223. Web. May 18, 2011. Gentry, R.C., 1966: Nature and Scope of Hurricane Damage. American Society for Oceanography, Hurricane Symposium, Publication Number One, 344 pp. Goldenberg, S.B., C.W. Landsea, A.M. Mestas-Nuñez and W.M. Gray, 2001: The Recent Increase in Atlantic Hurricane Activity: Causes and Implications. Science, 293, 474-479. Hebert, P.J. and J.G. Taylor, 1975: Hurricane Experience Levels of Coastal County Populations- Texas to Maine. Special Report, NWS Community Preparedness Staff and SR, July, 153 pp. Hebert, P.J., J.G. Taylor and R.A. Case, 1984: Hurricane Experience Levels of Coastal County Populations – Texas to Maine. NOAA, Technical Memorandum NWS-TPC-24, 127 pp. Jarrell, J.D., P.J. Hebert, and B.M. Mayfield, 1992: Hurricane Experience Levels of Coastal County Populations - Texas to Maine. NOAA, Technical Memorandum NWS-NHC-46, 152 pp. Jonkman, S.N., Maaskant, B., Boyd, E., and M. L. Levitan, 2009: Loss of Life Caused by the Flooding of New Orleans After Hurricane Katrina: Analysis of the Relationship Between Flood Characteristics and Mortality. Risk Analysis 29.5 (2009): 615-781. Wiley. Web. May 18, 2011. Landsea, C.W., C. Anderson, N. Charles, G. Clark, J. Dunion, J. Fernandez-Partagas, P. Hungerford, C. Neumann and M. Zimmer, 2004: The Atlantic Hurricane Database Reanalysis Project. Documentation for 1851-1910 alterations and additions to HURDAT. Hurricanes and Typhoons: Past, Present and Future, R.J. Murnane and K.B. Liu, Eds., Columbia University Press, 177-221. McAdie, C.J., C.W. Landsea, C.J. Neumann, J.E. David, E.S. Blake, and G.R. Hammer, 2009: Tropical Cyclones of the North Atlantic Ocean, 1851-2006. Historical Climatology Series Vol. 6-2. National Climatic Data Center, Asheville, NC, 238 pp. Neumann, C. J., 1987: The National Hurricane Center Risk Analysis Program (HURISK). NOAA Technical Memorandum, NWS NHC 38, 56 pp. Pielke, Jr., R.A., J. Gratz, C.W. Landsea, D. Collins, M. Saunders, and R. Musulin, 2008: Normalized Hurricane Damages in the U.S.: 1900-2005. Natural Hazards Review, 9, 29-42. Simpson, R.H., 1974: The hurricane disaster potential scale. Weatherwise, Vol. 27, 169 & 186.
33
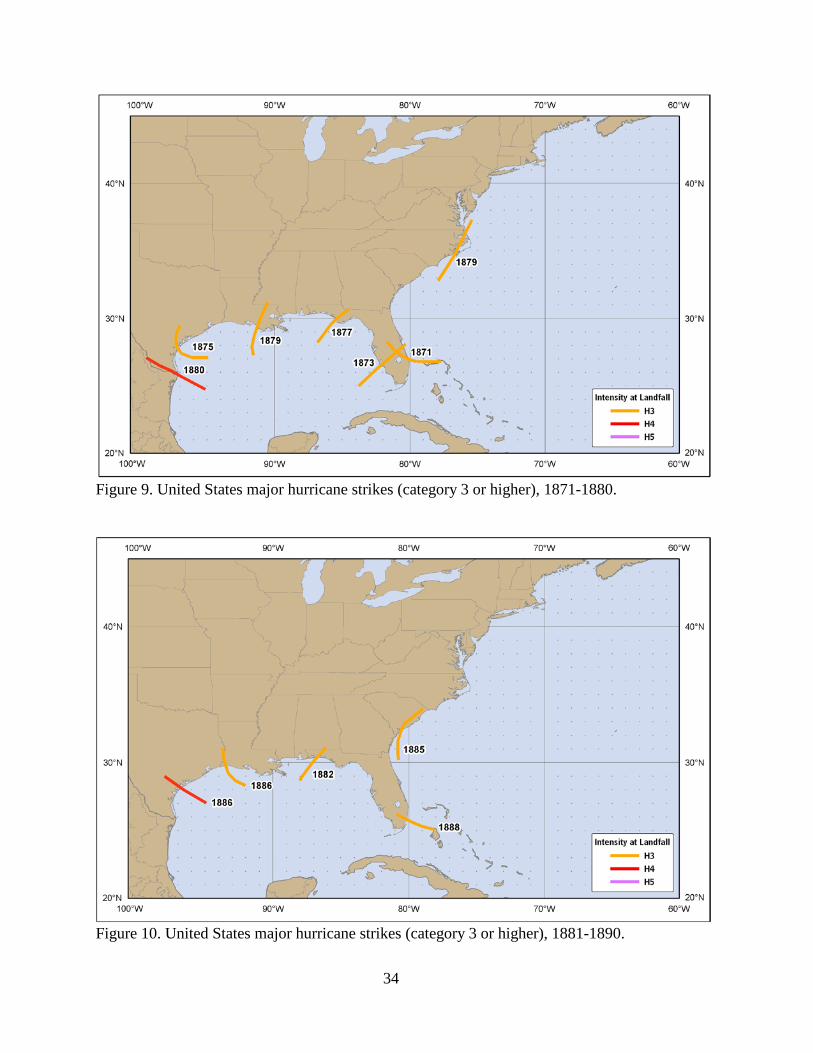
Figure 7. United States major hurricane strikes (category 3 or higher), 1851-1860. Line color indicates intensity at landfall for Figures 7-22.
Figure 8. United States major hurricane strikes (category 3 or higher), 1861-1870.
34
Figure 9. United States major hurricane strikes (category 3 or higher), 1871-1880.
Figure 10. United States major hurricane strikes (category 3 or higher), 1881-1890.
35
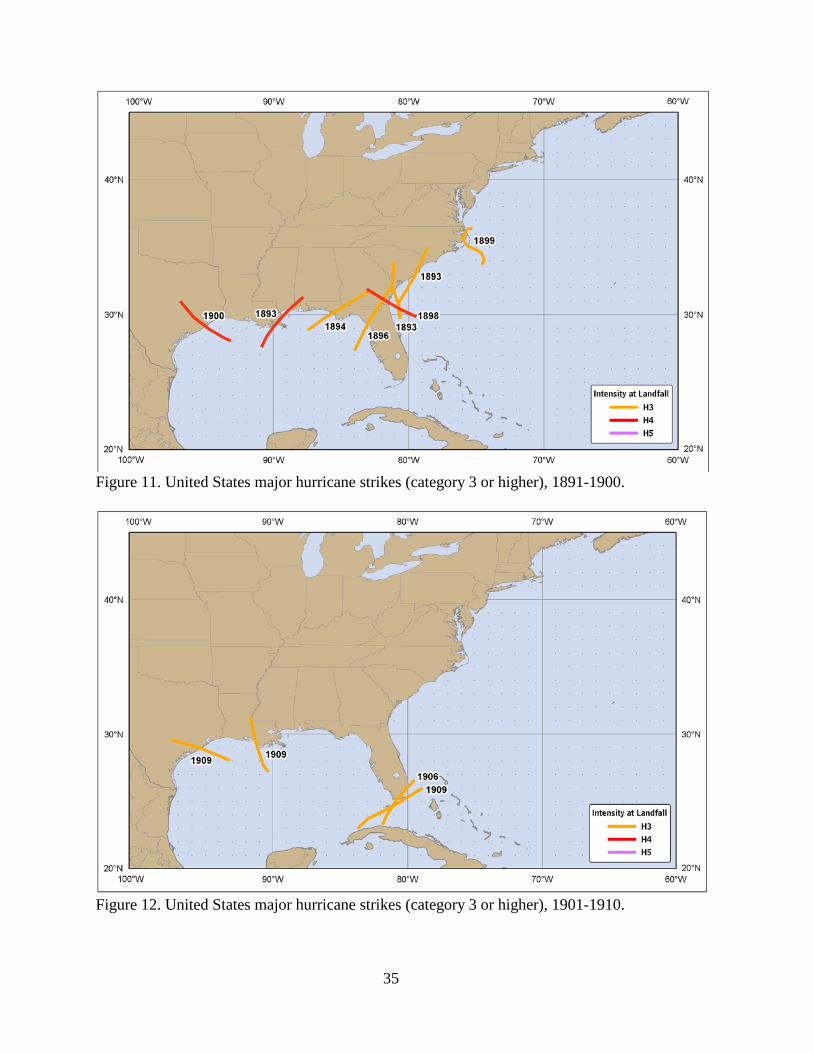
Figure 11. United States major hurricane strikes (category 3 or higher), 1891-1900.
Figure 12. United States major hurricane strikes (category 3 or higher), 1901-1910.
36
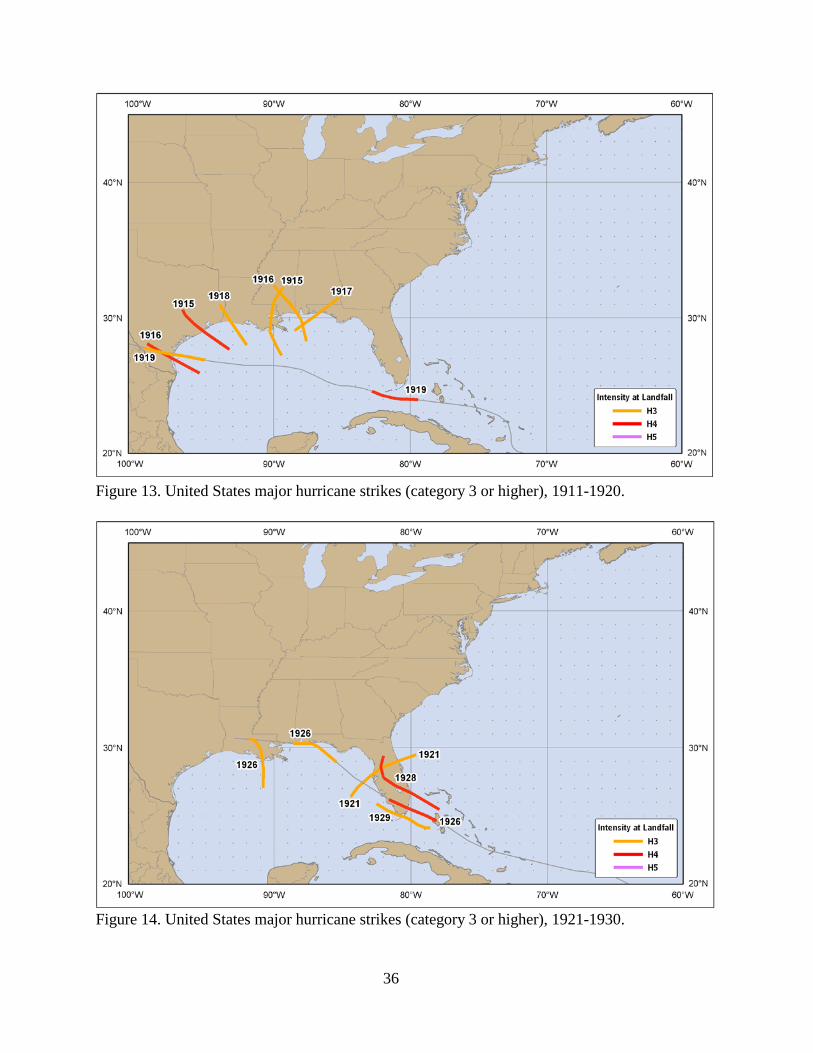
Figure 13. United States major hurricane strikes (category 3 or higher), 1911-1920.
Figure 14. United States major hurricane strikes (category 3 or higher), 1921-1930.
37
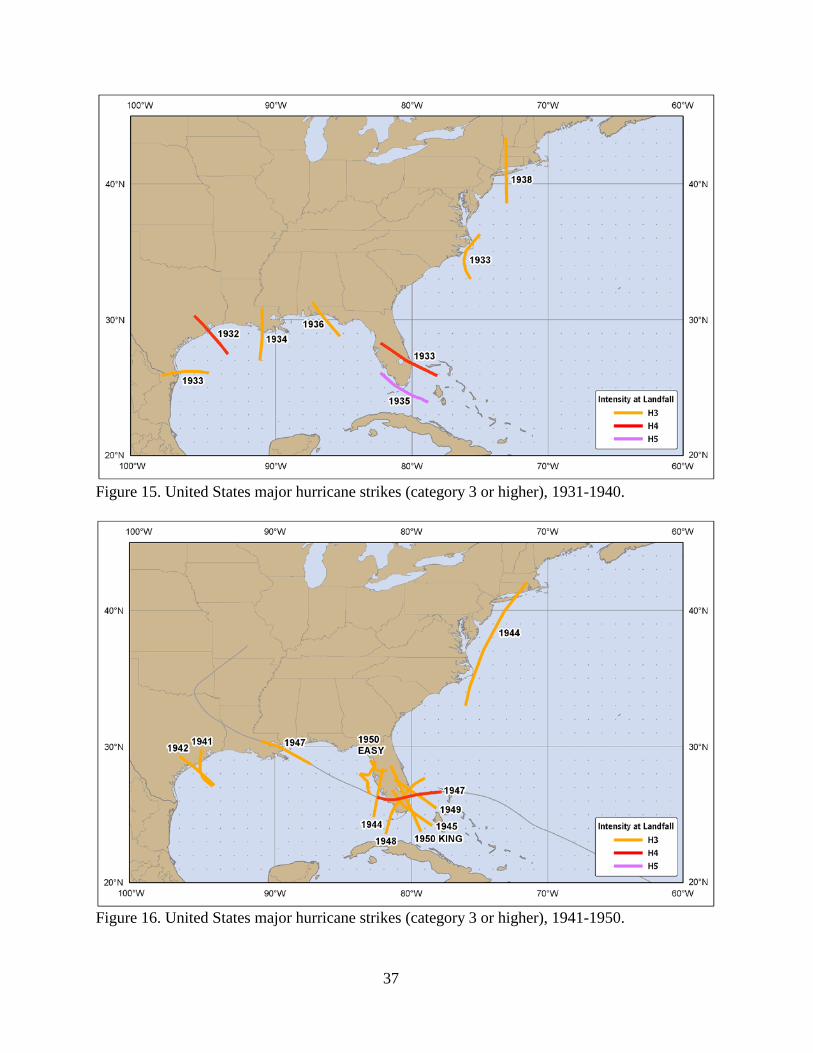
Figure 15. United States major hurricane strikes (category 3 or higher), 1931-1940.
Figure 16. United States major hurricane strikes (category 3 or higher), 1941-1950.
38
Figure 17. United States major hurricane strikes (category 3 or higher), 1951-1960.
Figure 18. United States major hurricane strikes (category 3 or higher), 1961-1970.
39
Figure 19. United States major hurricane strikes (category 3 or higher), 1971-1980.
Figure 20. United States major hurricane strikes (category 3 or higher), 1981-1990.
40
Figure 21. United States major hurricane strikes (category 3 or higher), 1991-2000.
Figure 22. United States major hurricane strikes (category 3 or higher), 2001-2010.
41
Figure 23. United States major hurricane strikes (category 3 or higher), 1851-2010.
42
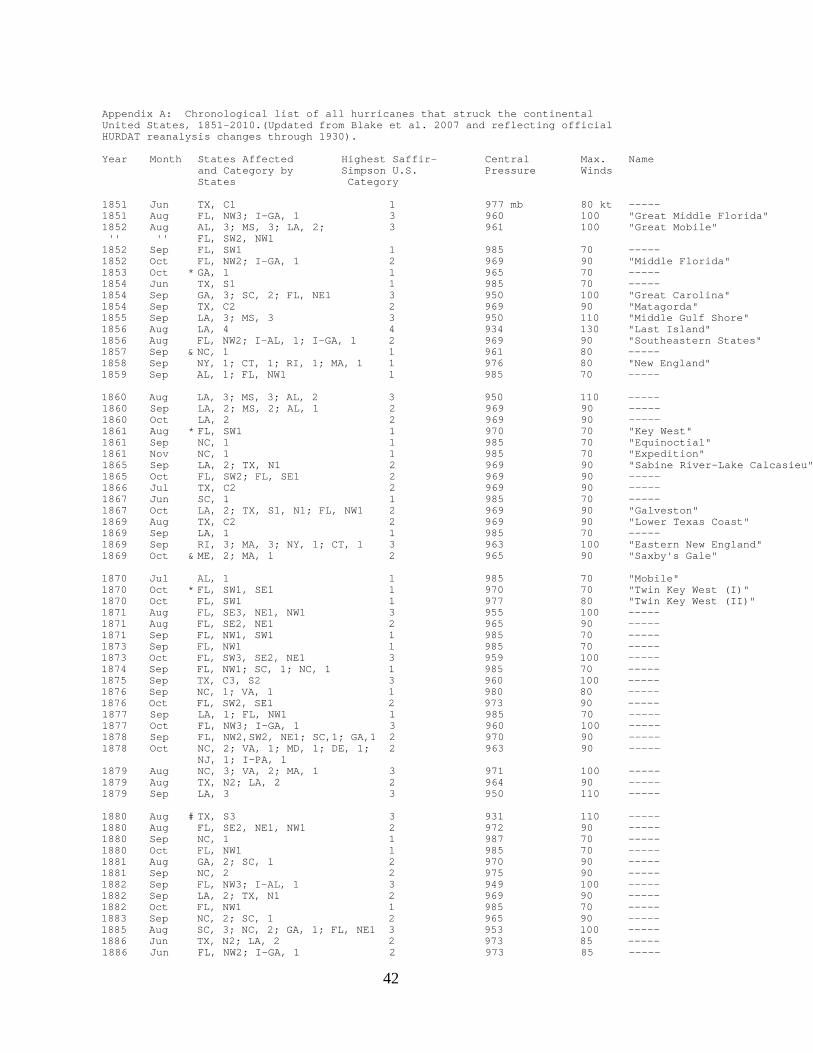
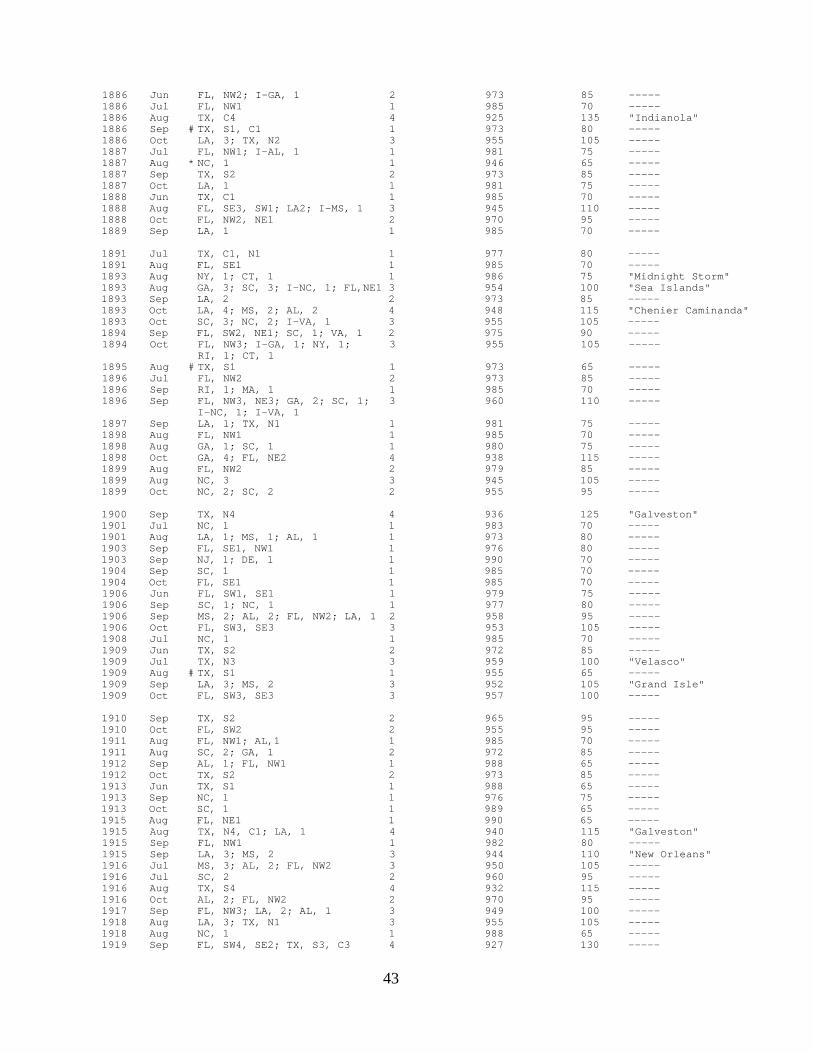
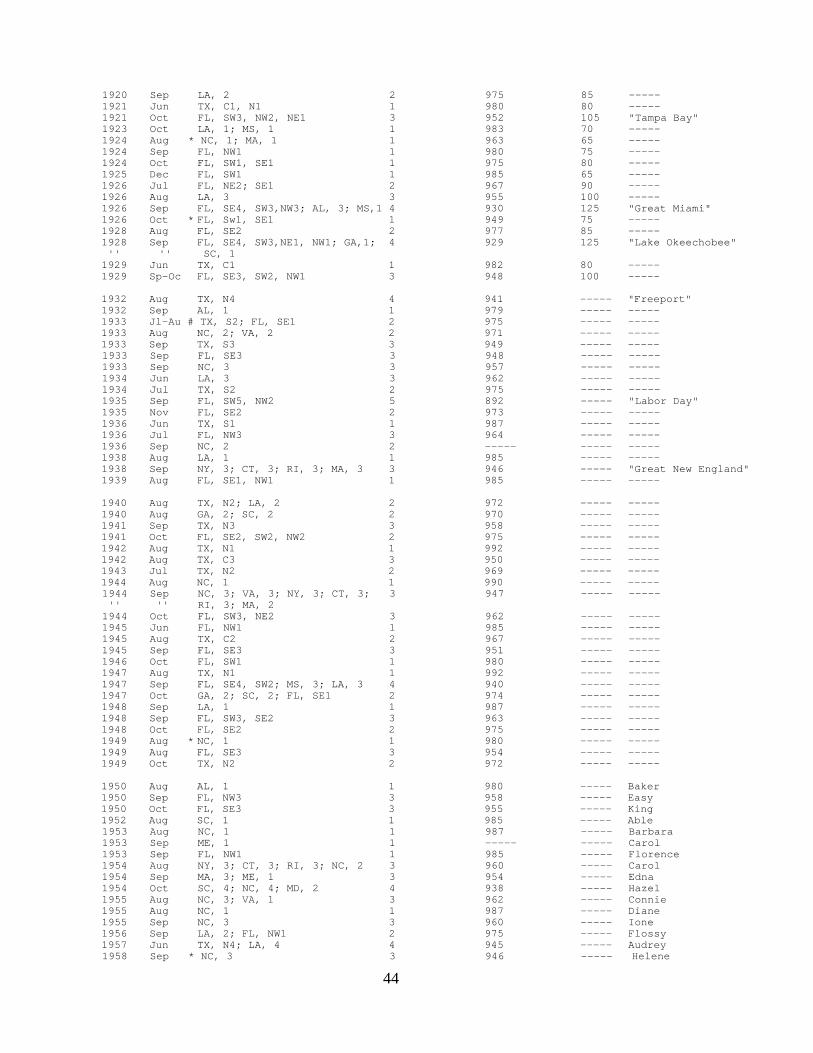
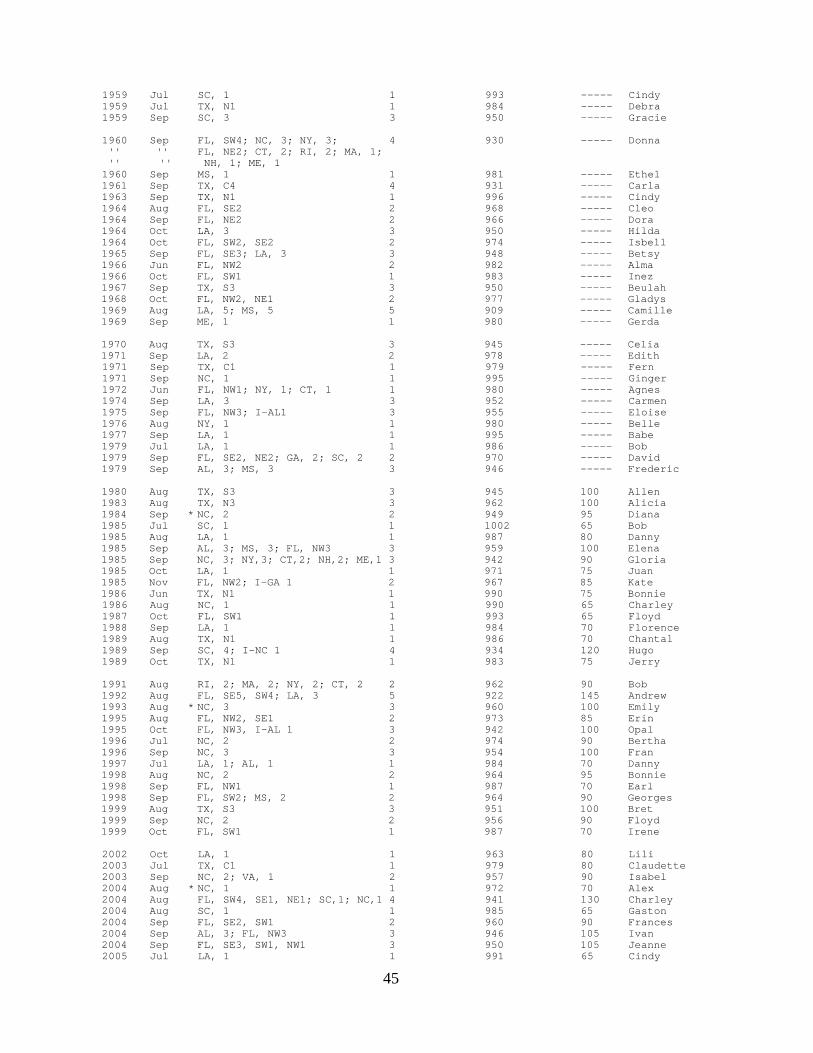
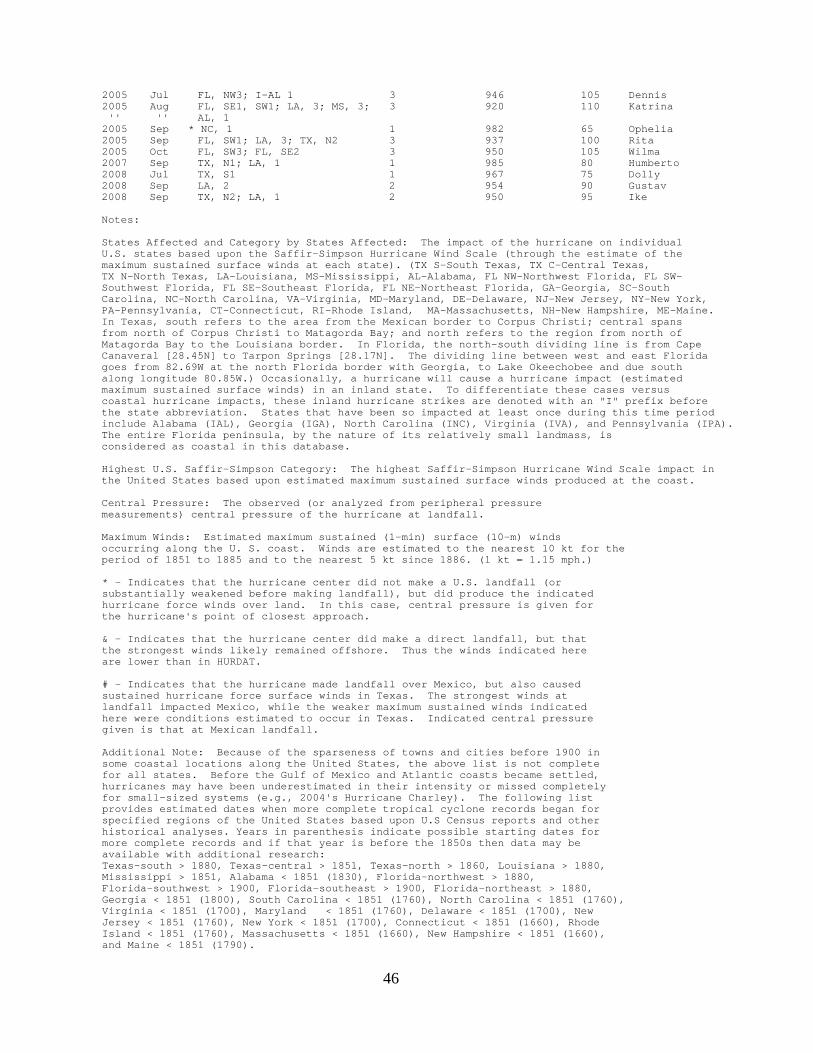
Appendix A: Chronological list of all hurricanes that struck the continental United States, 1851-2010.(Updated from Blake et al. 2007 and reflecting official HURDAT reanalysis changes through 1930). Year Month States Affected Highest Saffir- Central Max. Name and Category by Simpson U.S. Pressure Winds States Category 1851 Jun TX, C1 1 977 mb 80 kt ----- 1851 Aug FL, NW3; I-GA, 1 3 960 100 "Great Middle Florida" 1852 Aug AL, 3; MS, 3; LA, 2; 3 961 100 "Great Mobile" '' '' FL, SW2, NW1 1852 Sep FL, SW1 1 985 70 ----- 1852 Oct FL, NW2; I-GA, 1 2 969 90 "Middle Florida" 1853 Oct * GA, 1 1 965 70 ----- 1854 Jun TX, S1 1 985 70 ----- 1854 Sep GA, 3; SC, 2; FL, NE1 3 950 100 "Great Carolina" 1854 Sep TX, C2 2 969 90 "Matagorda" 1855 Sep LA, 3; MS, 3 3 950 110 "Middle Gulf Shore" 1856 Aug LA, 4 4 934 130 "Last Island" 1856 Aug FL, NW2; I-AL, 1; I-GA, 1 2 969 90 "Southeastern States" 1857 Sep & NC, 1 1 961 80 ----- 1858 Sep NY, 1; CT, 1; RI, 1; MA, 1 1 976 80 "New England" 1859 Sep AL, 1; FL, NW1 1 985 70 ----- 1860 Aug LA, 3; MS, 3; AL, 2 3 950 110 ----- 1860 Sep LA, 2; MS, 2; AL, 1 2 969 90 ----- 1860 Oct LA, 2 2 969 90 ----- 1861 Aug * FL, SW1 1 970 70 "Key West" 1861 Sep NC, 1 1 985 70 "Equinoctial" 1861 Nov NC, 1 1 985 70 "Expedition" 1865 Sep LA, 2; TX, N1 2 969 90 "Sabine River-Lake Calcasieu" 1865 Oct FL, SW2; FL, SE1 2 969 90 ----- 1866 Jul TX, C2 2 969 90 ----- 1867 Jun SC, 1 1 985 70 ----- 1867 Oct LA, 2; TX, S1, N1; FL, NW1 2 969 90 "Galveston" 1869 Aug TX, C2 2 969 90 "Lower Texas Coast" 1869 Sep LA, 1 1 985 70 ----- 1869 Sep RI, 3; MA, 3; NY, 1; CT, 1 3 963 100 "Eastern New England" 1869 Oct & ME, 2; MA, 1 2 965 90 "Saxby's Gale" 1870 Jul AL, 1 1 985 70 "Mobile" 1870 Oct * FL, SW1, SE1 1 970 70 "Twin Key West (I)" 1870 Oct FL, SW1 1 977 80 "Twin Key West (II)" 1871 Aug FL, SE3, NE1, NW1 3 955 100 ----- 1871 Aug FL, SE2, NE1 2 965 90 ----- 1871 Sep FL, NW1, SW1 1 985 70 ----- 1873 Sep FL, NW1 1 985 70 ----- 1873 Oct FL, SW3, SE2, NE1 3 959 100 ----- 1874 Sep FL, NW1; SC, 1; NC, 1 1 985 70 ----- 1875 Sep TX, C3, S2 3 960 100 ----- 1876 Sep NC, 1; VA, 1 1 980 80 ----- 1876 Oct FL, SW2, SE1 2 973 90 ----- 1877 Sep LA, 1; FL, NW1 1 985 70 ----- 1877 Oct FL, NW3; I-GA, 1 3 960 100 ----- 1878 Sep FL, NW2,SW2, NE1; SC,1; GA,1 2 970 90 ----- 1878 Oct NC, 2; VA, 1; MD, 1; DE, 1; 2 963 90 ----- NJ, 1; I-PA, 1 1879 Aug NC, 3; VA, 2; MA, 1 3 971 100 ----- 1879 Aug TX, N2; LA, 2 2 964 90 ----- 1879 Sep LA, 3 3 950 110 ----- 1880 Aug # TX, S3 3 931 110 ----- 1880 Aug FL, SE2, NE1, NW1 2 972 90 ----- 1880 Sep NC, 1 1 987 70 ----- 1880 Oct FL, NW1 1 985 70 ----- 1881 Aug GA, 2; SC, 1 2 970 90 ----- 1881 Sep NC, 2 2 975 90 ----- 1882 Sep FL, NW3; I-AL, 1 3 949 100 ----- 1882 Sep LA, 2; TX, N1 2 969 90 ----- 1882 Oct FL, NW1 1 985 70 ----- 1883 Sep NC, 2; SC, 1 2 965 90 ----- 1885 Aug SC, 3; NC, 2; GA, 1; FL, NE1 3 953 100 ----- 1886 Jun TX, N2; LA, 2 2 973 85 ----- 1886 Jun FL, NW2; I-GA, 1 2 973 85 -----
43
1886 Jun FL, NW2; I-GA, 1 2 973 85 ----- 1886 Jul FL, NW1 1 985 70 ----- 1886 Aug TX, C4 4 925 135 "Indianola" 1886 Sep # TX, S1, C1 1 973 80 ----- 1886 Oct LA, 3; TX, N2 3 955 105 ----- 1887 Jul FL, NW1; I-AL, 1 1 981 75 ----- 1887 Aug * NC, 1 1 946 65 ----- 1887 Sep TX, S2 2 973 85 ----- 1887 Oct LA, 1 1 981 75 ----- 1888 Jun TX, C1 1 985 70 ----- 1888 Aug FL, SE3, SW1; LA2; I-MS, 1 3 945 110 ----- 1888 Oct FL, NW2, NE1 2 970 95 ----- 1889 Sep LA, 1 1 985 70 ----- 1891 Jul TX, C1, N1 1 977 80 ----- 1891 Aug FL, SE1 1 985 70 ----- 1893 Aug NY, 1; CT, 1 1 986 75 "Midnight Storm" 1893 Aug GA, 3; SC, 3; I-NC, 1; FL,NE1 3 954 100 "Sea Islands" 1893 Sep LA, 2 2 973 85 ----- 1893 Oct LA, 4; MS, 2; AL, 2 4 948 115 "Chenier Caminanda" 1893 Oct SC, 3; NC, 2; I-VA, 1 3 955 105 ----- 1894 Sep FL, SW2, NE1; SC, 1; VA, 1 2 975 90 ----- 1894 Oct FL, NW3; I-GA, 1; NY, 1; 3 955 105 ----- RI, 1; CT, 1 1895 Aug # TX, S1 1 973 65 ----- 1896 Jul FL, NW2 2 973 85 ----- 1896 Sep RI, 1; MA, 1 1 985 70 ----- 1896 Sep FL, NW3, NE3; GA, 2; SC, 1; 3 960 110 ----- I-NC, 1; I-VA, 1 1897 Sep LA, 1; TX, N1 1 981 75 ----- 1898 Aug FL, NW1 1 985 70 ----- 1898 Aug GA, 1; SC, 1 1 980 75 ----- 1898 Oct GA, 4; FL, NE2 4 938 115 ----- 1899 Aug FL, NW2 2 979 85 ----- 1899 Aug NC, 3 3 945 105 ----- 1899 Oct NC, 2; SC, 2 2 955 95 ----- 1900 Sep TX, N4 4 936 125 "Galveston" 1901 Jul NC, 1 1 983 70 ----- 1901 Aug LA, 1; MS, 1; AL, 1 1 973 80 ----- 1903 Sep FL, SE1, NW1 1 976 80 ----- 1903 Sep NJ, 1; DE, 1 1 990 70 ----- 1904 Sep SC, 1 1 985 70 ----- 1904 Oct FL, SE1 1 985 70 ----- 1906 Jun FL, SW1, SE1 1 979 75 ----- 1906 Sep SC, 1; NC, 1 1 977 80 ----- 1906 Sep MS, 2; AL, 2; FL, NW2; LA, 1 2 958 95 ----- 1906 Oct FL, SW3, SE3 3 953 105 ----- 1908 Jul NC, 1 1 985 70 ----- 1909 Jun TX, S2 2 972 85 ----- 1909 Jul TX, N3 3 959 100 "Velasco" 1909 Aug # TX, S1 1 955 65 ----- 1909 Sep LA, 3; MS, 2 3 952 105 "Grand Isle" 1909 Oct FL, SW3, SE3 3 957 100 ----- 1910 Sep TX, S2 2 965 95 ----- 1910 Oct FL, SW2 2 955 95 ----- 1911 Aug FL, NW1; AL,1 1 985 70 ----- 1911 Aug SC, 2; GA, 1 2 972 85 ----- 1912 Sep AL, 1; FL, NW1 1 988 65 ----- 1912 Oct TX, S2 2 973 85 ----- 1913 Jun TX, S1 1 988 65 ----- 1913 Sep NC, 1 1 976 75 ----- 1913 Oct SC, 1 1 989 65 ----- 1915 Aug FL, NE1 1 990 65 ----- 1915 Aug TX, N4, C1; LA, 1 4 940 115 "Galveston" 1915 Sep FL, NW1 1 982 80 ----- 1915 Sep LA, 3; MS, 2 3 944 110 "New Orleans" 1916 Jul MS, 3; AL, 2; FL, NW2 3 950 105 ----- 1916 Jul SC, 2 2 960 95 ----- 1916 Aug TX, S4 4 932 115 ----- 1916 Oct AL, 2; FL, NW2 2 970 95 ----- 1917 Sep FL, NW3; LA, 2; AL, 1 3 949 100 ----- 1918 Aug LA, 3; TX, N1 3 955 105 ----- 1918 Aug NC, 1 1 988 65 ----- 1919 Sep FL, SW4, SE2; TX, S3, C3 4 927 130 -----
44
1920 Sep LA, 2 2 975 85 ----- 1921 Jun TX, C1, N1 1 980 80 ----- 1921 Oct FL, SW3, NW2, NE1 3 952 105 "Tampa Bay" 1923 Oct LA, 1; MS, 1 1 983 70 ----- 1924 Aug * NC, 1; MA, 1 1 963 65 ----- 1924 Sep FL, NW1 1 980 75 ----- 1924 Oct FL, SW1, SE1 1 975 80 ----- 1925 Dec FL, SW1 1 985 65 ----- 1926 Jul FL, NE2; SE1 2 967 90 ----- 1926 Aug LA, 3 3 955 100 ----- 1926 Sep FL, SE4, SW3,NW3; AL, 3; MS,1 4 930 125 "Great Miami" 1926 Oct * FL, Sw1, SE1 1 949 75 ----- 1928 Aug FL, SE2 2 977 85 ----- 1928 Sep FL, SE4, SW3,NE1, NW1; GA,1; 4 929 125 "Lake Okeechobee" '' '' SC, 1 1929 Jun TX, C1 1 982 80 ----- 1929 Sp-Oc FL, SE3, SW2, NW1 3 948 100 ----- 1932 Aug TX, N4 4 941 ----- "Freeport" 1932 Sep AL, 1 1 979 ----- ----- 1933 Jl-Au # TX, S2; FL, SE1 2 975 ----- ----- 1933 Aug NC, 2; VA, 2 2 971 ----- ----- 1933 Sep TX, S3 3 949 ----- ----- 1933 Sep FL, SE3 3 948 ----- ----- 1933 Sep NC, 3 3 957 ----- ----- 1934 Jun LA, 3 3 962 ----- ----- 1934 Jul TX, S2 2 975 ----- ----- 1935 Sep FL, SW5, NW2 5 892 ----- "Labor Day" 1935 Nov FL, SE2 2 973 ----- ----- 1936 Jun TX, S1 1 987 ----- ----- 1936 Jul FL, NW3 3 964 ----- ----- 1936 Sep NC, 2 2 ----- ----- ----- 1938 Aug LA, 1 1 985 ----- ----- 1938 Sep NY, 3; CT, 3; RI, 3; MA, 3 3 946 ----- "Great New England" 1939 Aug FL, SE1, NW1 1 985 ----- ----- 1940 Aug TX, N2; LA, 2 2 972 ----- ----- 1940 Aug GA, 2; SC, 2 2 970 ----- ----- 1941 Sep TX, N3 3 958 ----- ----- 1941 Oct FL, SE2, SW2, NW2 2 975 ----- ----- 1942 Aug TX, N1 1 992 ----- ----- 1942 Aug TX, C3 3 950 ----- ----- 1943 Jul TX, N2 2 969 ----- ----- 1944 Aug NC, 1 1 990 ----- ----- 1944 Sep NC, 3; VA, 3; NY, 3; CT, 3; 3 947 ----- ----- '' '' RI, 3; MA, 2 1944 Oct FL, SW3, NE2 3 962 ----- ----- 1945 Jun FL, NW1 1 985 ----- ----- 1945 Aug TX, C2 2 967 ----- ----- 1945 Sep FL, SE3 3 951 ----- ----- 1946 Oct FL, SW1 1 980 ----- ----- 1947 Aug TX, N1 1 992 ----- ----- 1947 Sep FL, SE4, SW2; MS, 3; LA, 3 4 940 ----- ----- 1947 Oct GA, 2; SC, 2; FL, SE1 2 974 ----- ----- 1948 Sep LA, 1 1 987 ----- ----- 1948 Sep FL, SW3, SE2 3 963 ----- ----- 1948 Oct FL, SE2 2 975 ----- ----- 1949 Aug * NC, 1 1 980 ----- ----- 1949 Aug FL, SE3 3 954 ----- ----- 1949 Oct TX, N2 2 972 ----- ----- 1950 Aug AL, 1 1 980 ----- Baker 1950 Sep FL, NW3 3 958 ----- Easy 1950 Oct FL, SE3 3 955 ----- King 1952 Aug SC, 1 1 985 ----- Able 1953 Aug NC, 1 1 987 ----- Barbara 1953 Sep ME, 1 1 ----- ----- Carol 1953 Sep FL, NW1 1 985 ----- Florence 1954 Aug NY, 3; CT, 3; RI, 3; NC, 2 3 960 ----- Carol 1954 Sep MA, 3; ME, 1 3 954 ----- Edna 1954 Oct SC, 4; NC, 4; MD, 2 4 938 ----- Hazel 1955 Aug NC, 3; VA, 1 3 962 ----- Connie 1955 Aug NC, 1 1 987 ----- Diane 1955 Sep NC, 3 3 960 ----- Ione 1956 Sep LA, 2; FL, NW1 2 975 ----- Flossy 1957 Jun TX, N4; LA, 4 4 945 ----- Audrey 1958 Sep * NC, 3 3 946 ----- Helene
45
1959 Jul SC, 1 1 993 ----- Cindy 1959 Jul TX, N1 1 984 ----- Debra 1959 Sep SC, 3 3 950 ----- Gracie 1960 Sep FL, SW4; NC, 3; NY, 3; 4 930 ----- Donna '' '' FL, NE2; CT, 2; RI, 2; MA, 1; '' '' NH, 1; ME, 1 1960 Sep MS, 1 1 981 ----- Ethel 1961 Sep TX, C4 4 931 ----- Carla 1963 Sep TX, N1 1 996 ----- Cindy 1964 Aug FL, SE2 2 968 ----- Cleo 1964 Sep FL, NE2 2 966 ----- Dora 1964 Oct LA, 3 3 950 ----- Hilda 1964 Oct FL, SW2, SE2 2 974 ----- Isbell 1965 Sep FL, SE3; LA, 3 3 948 ----- Betsy 1966 Jun FL, NW2 2 982 ----- Alma 1966 Oct FL, SW1 1 983 ----- Inez 1967 Sep TX, S3 3 950 ----- Beulah 1968 Oct FL, NW2, NE1 2 977 ----- Gladys 1969 Aug LA, 5; MS, 5 5 909 ----- Camille 1969 Sep ME, 1 1 980 ----- Gerda 1970 Aug TX, S3 3 945 ----- Celia 1971 Sep LA, 2 2 978 ----- Edith 1971 Sep TX, C1 1 979 ----- Fern 1971 Sep NC, 1 1 995 ----- Ginger 1972 Jun FL, NW1; NY, 1; CT, 1 1 980 ----- Agnes 1974 Sep LA, 3 3 952 ----- Carmen 1975 Sep FL, NW3; I-AL1 3 955 ----- Eloise 1976 Aug NY, 1 1 980 ----- Belle 1977 Sep LA, 1 1 995 ----- Babe 1979 Jul LA, 1 1 986 ----- Bob 1979 Sep FL, SE2, NE2; GA, 2; SC, 2 2 970 ----- David 1979 Sep AL, 3; MS, 3 3 946 ----- Frederic 1980 Aug TX, S3 3 945 100 Allen 1983 Aug TX, N3 3 962 100 Alicia 1984 Sep * NC, 2 2 949 95 Diana 1985 Jul SC, 1 1 1002 65 Bob 1985 Aug LA, 1 1 987 80 Danny 1985 Sep AL, 3; MS, 3; FL, NW3 3 959 100 Elena 1985 Sep NC, 3; NY,3; CT,2; NH,2; ME,1 3 942 90 Gloria 1985 Oct LA, 1 1 971 75 Juan 1985 Nov FL, NW2; I-GA 1 2 967 85 Kate 1986 Jun TX, N1 1 990 75 Bonnie 1986 Aug NC, 1 1 990 65 Charley 1987 Oct FL, SW1 1 993 65 Floyd 1988 Sep LA, 1 1 984 70 Florence 1989 Aug TX, N1 1 986 70 Chantal 1989 Sep SC, 4; I-NC 1 4 934 120 Hugo 1989 Oct TX, N1 1 983 75 Jerry 1991 Aug RI, 2; MA, 2; NY, 2; CT, 2 2 962 90 Bob 1992 Aug FL, SE5, SW4; LA, 3 5 922 145 Andrew 1993 Aug * NC, 3 3 960 100 Emily 1995 Aug FL, NW2, SE1 2 973 85 Erin 1995 Oct FL, NW3, I-AL 1 3 942 100 Opal 1996 Jul NC, 2 2 974 90 Bertha 1996 Sep NC, 3 3 954 100 Fran 1997 Jul LA, 1; AL, 1 1 984 70 Danny 1998 Aug NC, 2 2 964 95 Bonnie 1998 Sep FL, NW1 1 987 70 Earl 1998 Sep FL, SW2; MS, 2 2 964 90 Georges 1999 Aug TX, S3 3 951 100 Bret 1999 Sep NC, 2 2 956 90 Floyd 1999 Oct FL, SW1 1 987 70 Irene 2002 Oct LA, 1 1 963 80 Lili 2003 Jul TX, C1 1 979 80 Claudette 2003 Sep NC, 2; VA, 1 2 957 90 Isabel 2004 Aug * NC, 1 1 972 70 Alex 2004 Aug FL, SW4, SE1, NE1; SC,1; NC,1 4 941 130 Charley 2004 Aug SC, 1 1 985 65 Gaston 2004 Sep FL, SE2, SW1 2 960 90 Frances 2004 Sep AL, 3; FL, NW3 3 946 105 Ivan 2004 Sep FL, SE3, SW1, NW1 3 950 105 Jeanne 2005 Jul LA, 1 1 991 65 Cindy
46
2005 Jul FL, NW3; I-AL 1 3 946 105 Dennis 2005 Aug FL, SE1, SW1; LA, 3; MS, 3; 3 920 110 Katrina '' '' AL, 1 2005 Sep * NC, 1 1 982 65 Ophelia 2005 Sep FL, SW1; LA, 3; TX, N2 3 937 100 Rita 2005 Oct FL, SW3; FL, SE2 3 950 105 Wilma 2007 Sep TX, N1; LA, 1 1 985 80 Humberto 2008 Jul TX, S1 1 967 75 Dolly 2008 Sep LA, 2 2 954 90 Gustav 2008 Sep TX, N2; LA, 1 2 950 95 Ike Notes: States Affected and Category by States Affected: The impact of the hurricane on individual U.S. states based upon the Saffir-Simpson Hurricane Wind Scale (through the estimate of the maximum sustained surface winds at each state). (TX S-South Texas, TX C-Central Texas, TX N-North Texas, LA-Louisiana, MS-Mississippi, AL-Alabama, FL NW-Northwest Florida, FL SW- Southwest Florida, FL SE-Southeast Florida, FL NE-Northeast Florida, GA-Georgia, SC-South Carolina, NC-North Carolina, VA-Virginia, MD-Maryland, DE-Delaware, NJ-New Jersey, NY-New York, PA-Pennsylvania, CT-Connecticut, RI-Rhode Island, MA-Massachusetts, NH-New Hampshire, ME-Maine. In Texas, south refers to the area from the Mexican border to Corpus Christi; central spans from north of Corpus Christi to Matagorda Bay; and north refers to the region from north of Matagorda Bay to the Louisiana border. In Florida, the north-south dividing line is from Cape Canaveral [28.45N] to Tarpon Springs [28.17N]. The dividing line between west and east Florida goes from 82.69W at the north Florida border with Georgia, to Lake Okeechobee and due south along longitude 80.85W.) Occasionally, a hurricane will cause a hurricane impact (estimated maximum sustained surface winds) in an inland state. To differentiate these cases versus coastal hurricane impacts, these inland hurricane strikes are denoted with an "I" prefix before the state abbreviation. States that have been so impacted at least once during this time period include Alabama (IAL), Georgia (IGA), North Carolina (INC), Virginia (IVA), and Pennsylvania (IPA). The entire Florida peninsula, by the nature of its relatively small landmass, is considered as coastal in this database. Highest U.S. Saffir-Simpson Category: The highest Saffir-Simpson Hurricane Wind Scale impact in the United States based upon estimated maximum sustained surface winds produced at the coast. Central Pressure: The observed (or analyzed from peripheral pressure measurements) central pressure of the hurricane at landfall. Maximum Winds: Estimated maximum sustained (1-min) surface (10-m) winds occurring along the U. S. coast. Winds are estimated to the nearest 10 kt for the period of 1851 to 1885 and to the nearest 5 kt since 1886. (1 kt = 1.15 mph.) * - Indicates that the hurricane center did not make a U.S. landfall (or substantially weakened before making landfall), but did produce the indicated hurricane force winds over land. In this case, central pressure is given for the hurricane's point of closest approach. & - Indicates that the hurricane center did make a direct landfall, but that the strongest winds likely remained offshore. Thus the winds indicated here are lower than in HURDAT. # - Indicates that the hurricane made landfall over Mexico, but also caused sustained hurricane force surface winds in Texas. The strongest winds at landfall impacted Mexico, while the weaker maximum sustained winds indicated here were conditions estimated to occur in Texas. Indicated central pressure given is that at Mexican landfall. Additional Note: Because of the sparseness of towns and cities before 1900 in some coastal locations along the United States, the above list is not complete for all states. Before the Gulf of Mexico and Atlantic coasts became settled, hurricanes may have been underestimated in their intensity or missed completely for small-sized systems (e.g., 2004's Hurricane Charley). The following list provides estimated dates when more complete tropical cyclone records began for specified regions of the United States based upon U.S Census reports and other historical analyses. Years in parenthesis indicate possible starting dates for more complete records and if that year is before the 1850s then data may be available with additional research: Texas-south > 1880, Texas-central > 1851, Texas-north > 1860, Louisiana > 1880, Mississippi > 1851, Alabama < 1851 (1830), Florida-northwest > 1880, Florida-southwest > 1900, Florida-southeast > 1900, Florida-northeast > 1880, Georgia < 1851 (1800), South Carolina < 1851 (1760), North Carolina < 1851 (1760), Virginia < 1851 (1700), Maryland < 1851 (1760), Delaware < 1851 (1700), New Jersey < 1851 (1760), New York < 1851 (1700), Connecticut < 1851 (1660), Rhode Island < 1851 (1760), Massachusetts < 1851 (1660), New Hampshire < 1851 (1660), and Maine < 1851 (1790).
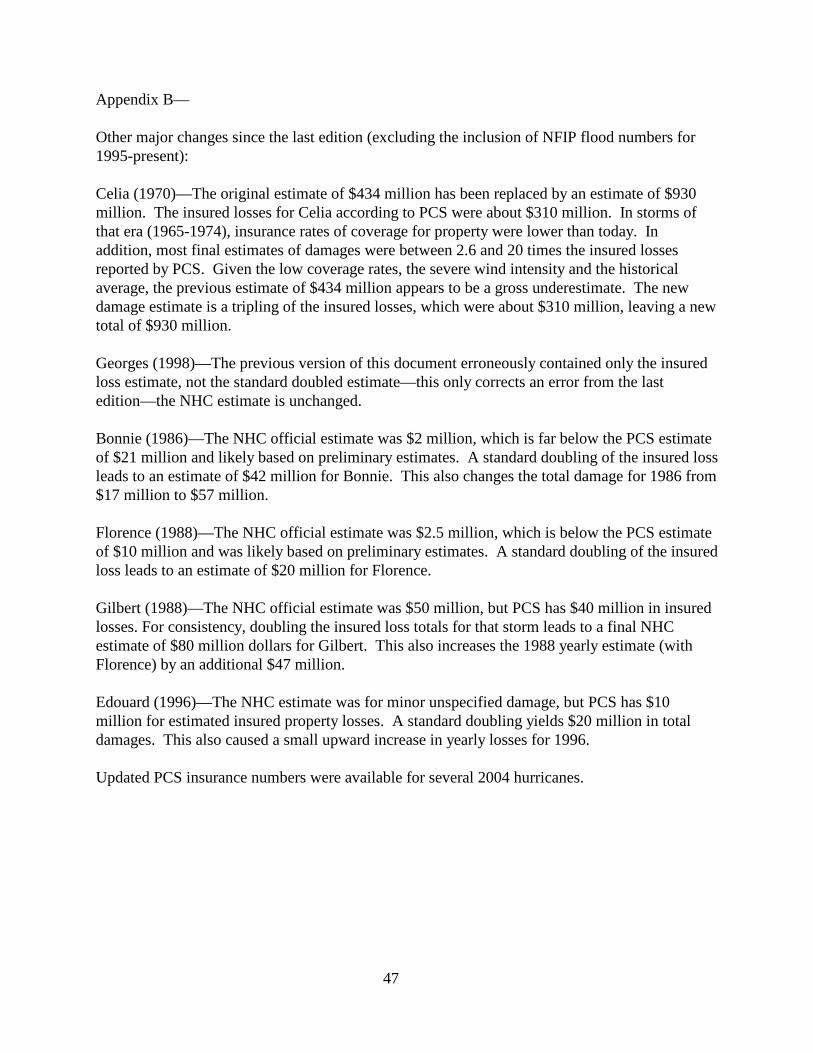
47
Appendix B— Other major changes since the last edition (excluding the inclusion of NFIP flood numbers for 1995-present): Celia (1970)—The original estimate of $434 million has been replaced by an estimate of $930 million. The insured losses for Celia according to PCS were about $310 million. In storms of that era (1965-1974), insurance rates of coverage for property were lower than today. In addition, most final estimates of damages were between 2.6 and 20 times the insured losses reported by PCS. Given the low coverage rates, the severe wind intensity and the historical average, the previous estimate of $434 million appears to be a gross underestimate. The new damage estimate is a tripling of the insured losses, which were about $310 million, leaving a new total of $930 million. Georges (1998)—The previous version of this document erroneously contained only the insured loss estimate, not the standard doubled estimate—this only corrects an error from the last edition—the NHC estimate is unchanged. Bonnie (1986)—The NHC official estimate was $2 million, which is far below the PCS estimate of $21 million and likely based on preliminary estimates. A standard doubling of the insured loss leads to an estimate of $42 million for Bonnie. This also changes the total damage for 1986 from $17 million to $57 million. Florence (1988)—The NHC official estimate was $2.5 million, which is below the PCS estimate of $10 million and was likely based on preliminary estimates. A standard doubling of the insured loss leads to an estimate of $20 million for Florence. Gilbert (1988)—The NHC official estimate was $50 million, but PCS has $40 million in insured losses. For consistency, doubling the insured loss totals for that storm leads to a final NHC estimate of $80 million dollars for Gilbert. This also increases the 1988 yearly estimate (with Florence) by an additional $47 million. Edouard (1996)—The NHC estimate was for minor unspecified damage, but PCS has $10 million for estimated insured property losses. A standard doubling yields $20 million in total damages. This also caused a small upward increase in yearly losses for 1996. Updated PCS insurance numbers were available for several 2004 hurricanes.