Embed Size (px)
Citation preview
Biochimica et Biophysica Acta, 735 (1983) 35-39 35 Elsevier
BBA 71854
NON-ELECTROLYTE DIFFUSION ACROSS THE FROG GASTRIC MUCOSA UNDER OSMOTIC GRADIENTS
LEOPOLDO VILLEGAS *
Centro de Biofisica y Bioquimica, Instituto Venezolano de lnvestigaciones Cientificas, IVIC, Apartado 1827, Caracas 1010,4 (Venezuela)
(Received May 6th, 1983)
Key words: Non-electrolyte transport; Water diffusion," Osmotic gradient; (Frog gastric mucosa)
Serosal-to-mucosal and mucosai-to-serosal diffusion of 14 C-labelled inulin, sucrose, erythritol and propiona- mide was compared with 3HHO diffusion in mucosae incubated with isosmotic solutions at both surfaces, as well as isosmotic solution at serosal surface and hyperosmotic solution at the mucosal surface. The use of a hyperosmotic solution at the mucosal surface significantly increases unidirectional diffusion fluxes of inulin and of sucrose. To a nonsignificant extent, it affects the fluxes of erythritol and propionamide and significantly reduces the 3H]-IO diffusion. A size increment of the diffusion path utilized by the larger molecules is proposed.
Introduction
The apical border of the oxyntic cells in the stomach is the site of active transport and there- fore the locus of the endogenous osmotic gradient responsible for the spontaneous net water flow [1]. This endogenous osmotic gradient is accessible to the external solution, at least in frog gastric mucosa [2].
If active transport and osmotic flows are dis- tributed uniformly over this apical surface, a mod- est osmotic gradient should be sufficient to drive the observed spontaneous net water flux [3-5]. In addition, the fluxes obtained in response to posi- tive or negative osmotic gradients occur in the direction predicted by the tonicity of the solutions [6] and are asymmetric in magnitude [7]. Simulta- neously with these osmotic fluxes, changes in the tonicity of the solutions alter the cell water con- tent, the spontaneous net water fluxes [8] and also
* The author is also Professor at the Instituto Internacional de Estudios Avanzados, Caracas, Venezuela.
0005-2736/83/$03.00 © 1983 Elsevier Science Publishers B.V.
the transmucosal electrical conductance of the frog gastric mucosa [9].
The main aim of the present series of experi- ments is to investigate to what extent changes in the osmolality of the solution at the mucosal surface alter the permeability of mucosa to graded-size, low-lipid-soluble non-electrolytes.
Methods
Frogs, Rana pipiens, were used in the experi- ments. Diffusion of 14C-labelled inulin ( M r = 5000-5500), sucrose, erythritol and propionamide was measured by placing the isolated mucosa be- tween two chambers. The volume of each chamber was 4 ml. The area of the mucosa exposed between the chambers was 1.13 cm 2. After 15 rain equi- libration in isosmotic buffered solution [1], diffu- sion fluxes were measured over two successive 90 min periods. To measure the unidirectional diffu- sion fluxes, one of the chambers was filled with radioactive solution prepared with 0.5 #Ci of 14C- labelled molecule per ml of solution. The solution in the other chamber was removed every 10 min
36
thereafter for 90 min and counted for 14C activity. Initial and final 10 /~1 samples from the labelled solution were counted in each period. In some of the experiments of each group, carrier-free tracer was used. The final concentration ranged from 0.11 mM for erythritol to 0.21 mM for sucrose. In other experiments, carrier was added to a final concentration of 1 raM. No significant relation was observed between tracer concentration and diffusion, and, consequently, results were pooled for each test molecule. Isosmotic (220 mosmol /kg water) solutions were used in both chambers dur- ing the initial 90 min period. During the second period, the osmolarlity of the solution in contact with the mucosal surface was increased to 520 mosmol /kg water by adding sucrose to the iso- smotic solution. Isosmotic solution was used at the serosal surface also during the second period. The solutions in both chambers were always oxygenated and stirred by bubbling with O2/CO 2 (95/5, v/v) . Simultaneously, the transmucosal electrical poten- tial difference was continously recorded through two calomel electrodes connected by 3% agar buffered close to the mucosa. The means of the potentials obtained were not significantly different from those previously reported [7].
Results
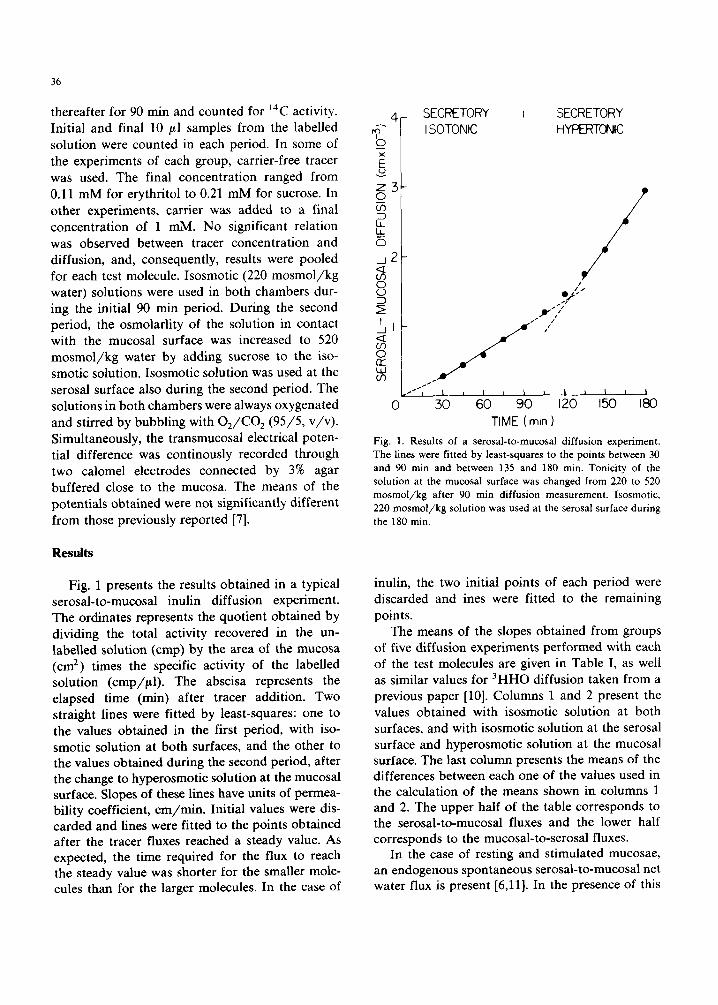
Fig. 1 presents the results obtained in a typical serosal-to-mucosal inulin diffusion experiment. The ordinates represents the quotient obtained by dividing the total activity recovered in the un- labelled solution (cmp) by the area of the mucosa (cm 2) times the specific activity of the labelled solution (cmp/#l) . The abscisa represents the elapsed time (min) after tracer addition. Two straight lines were fitted by least-squares: one to the values obtained in the first period, with iso- smotic solution at both surfaces, and the other to the values obtained during the second period, after the change to hyperosmotic solution at the mucosal surface. Slopes of these lines have units of permea- bility coefficient, cm/min . Initial values were dis- carded and lines were fitted to the points obtained after the tracer fluxes reached a steady value. As expected, the time required for the flux to reach the steady value was shorter for the smaller mole- cules than for the larger molecules. In the case of
0
Z 0
it_ LI_
._J < [ (/3 0 £..)
1 ._] <£ o9 0 135 i , i o9
4 SECRETORY ISOTONIC
3
2
SECRETORY HYPERTONIC
/ 0
/
, j . - I
- ' , I i I i I l I ~ t l I
30 60 90 120 150 180 TIME ( min )
Fig. 1. Results of a serosal-to-mucosal diffusion experiment. The lines were fitted by least-squares to the points between 30 and 90 min and between 135 and 180 rain. Tonicity of the solution at the mucosal surface was changed from 220 to 520 m o s m o l / k g after 90 rain diffusion measurement, lsosmotic, 220 m o s m o l / k g solution was used at the serosal surface during the 180 min.
inulin, the two initial points of each period were discarded and ines were fitted to the remaining points.
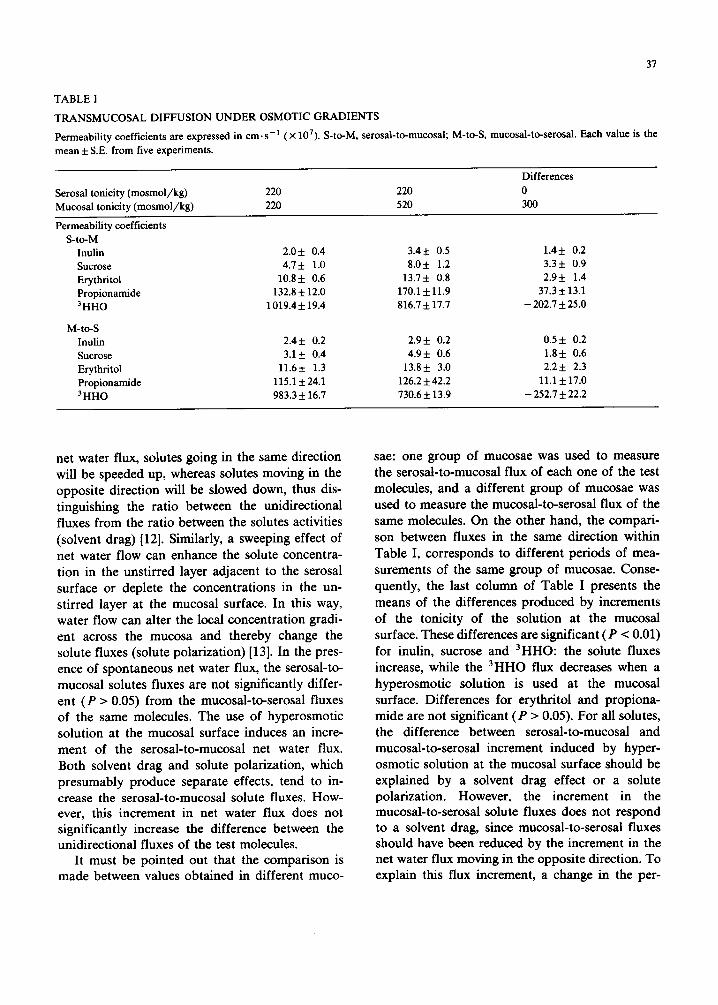
The means of the slopes obtained from groups of five diffusion experiments performed with each of the test molecules are given in Table I, as well as similar values for 3 HHO diffusion taken from a previous paper [10]. Columns 1 and 2 present the values obtained with isosmotic solution at both surfaces, and with isosmotic solution at the serosal surface and hyperosmotic solution at the mucosal surface. The last column presents the means of the differences between each one of the values used in the calculation of the means shown in columns 1 and 2. The upper half of the table corresponds to the serosal-to-mucosal fluxes and the lower half corresponds to the mucosal-to-serosal fluxes.
In the case of resting and stimulated mucosae, an endogenous spontaneous serosal-to-mucosal net water flux is present [6,11]. In the presence of this
37
TABLE I
TRANSMUCOSAL DIFFUSION U N D E R OSMOTIC GRADIENTS
Permeability coefficients are expressed in cm-s-1 (× 107). S-to-M, serosal-to-mucosai; M-to-S, mucosal-to-serosal. Each value is the
mean 5: S.E. from five experiments.
Serosal tonicity (mosmol/kg) Mucosal tonicity (mosmol/kg)
Differences 220 220 0 220 520 300
Permeability coefficients S-to-M
Inulin 2 .05:0 .4 3.4+ 0.5 1.4+ 0.2 Sucrose 4.7 + 1.0 8.0 + 1.2 3.3 + 0.9 Erythritol 10.8+ 0.6 13.7+ 0.8 2.9+ 1.4 Propionamide 132.8 5:12.0 170.1 -t- 11.9 37.3 + 13.1 3 HHO 1019.4 + 19.4 816.7 + 17.7 - 202.7 + 25.0
M-to-S Inulin 2.4+ 0.2 2.9+ 0.2 0.5+ 0.2 Sucrose 3.1+ 0.4 4.9+ 0.6 1.8+ 0.6 Erythritol 11.6+ 1.3 13.8+ 3.0 2.2+ 2.3 Propionamide 115.1 + 24.1 126.2 5:42.2 11.1 5:17.0 3HHO 983.3 5:16.7 730.6 5:13.9 - 252.7 5:22.2
net water flux, solutes going in the same direction will be speeded up, whereas solutes moving in the opposite direction will be slowed down, thus dis- tinguishing the ratio between the unidirectional fluxes from the ratio between the solutes activities (solvent drag) [12]. Similarly, a sweeping effect of net water flow can enhance the solute concentra- tion in the unstirred layer adjacent to the serosal surface or deplete the concentrations in the un- stirred layer at the mucosal surface. In this way, water flow can alter the local concentration gradi- ent across the mucosa and thereby change the solute fluxes (solute polarization) [13]. In the pres- ence of spontaneous net water flux, the serosal-to- mucosal solutes fluxes are not significantly differ- ent ( P > 0.05) from the mucosal-to-serosal fluxes of the same molecules. The use of hyperosmotic solution at the mucosal surface induces an incre- ment of the serosal-to-mucosal net water flux. Both solvent drag and solute polarization, which presumably produce separate effects, tend to in- crease the serosal-to-mucosal solute fluxes. How- ever, this increment in net water flux does not significantly increase the difference between the unidirectional fluxes of the test molecules.
It must be pointed out that the comparison is made between values obtained in different muco-
sae: one group of mucosae was used to measure the serosal-to-mucosal flux of each one of the test molecules, and a different group of mucosae was used to measure the mucosal-to-serosal flux of the same molecules. On the other hand, the compari- son between fluxes in the same direction within Table I, corresponds to different periods of mea- surements of the same group of mucosae. Conse- quently, the last column of Table I presents the means of the differences produced by increments of the tonicity of the solution at the mucosal surface. These differences are significant (P < 0.01) for inulin, sucrose and 3HHO: the solute fluxes increase, while the 3HHO flux decreases when a hyperosmotic solution is used at the mucosal surface. Differences for erythritol and propiona- mide are not significant (P > 0.05). For all solutes, the difference between serosal-to-mucosal and mucosal-to-serosal increment induced by hyper- osmotic solution at the mucosal surface should be explained by a solvent drag effect or a solute polarization. However, the increment in the mucosal-to-serosal solute fluxes does not respond to a solvent drag, since mucosal-to-serosal fluxes should have been reduced by the increment in the net water flux moving in the opposite direction. To explain this flux increment, a change in the per-
38
TABLE II
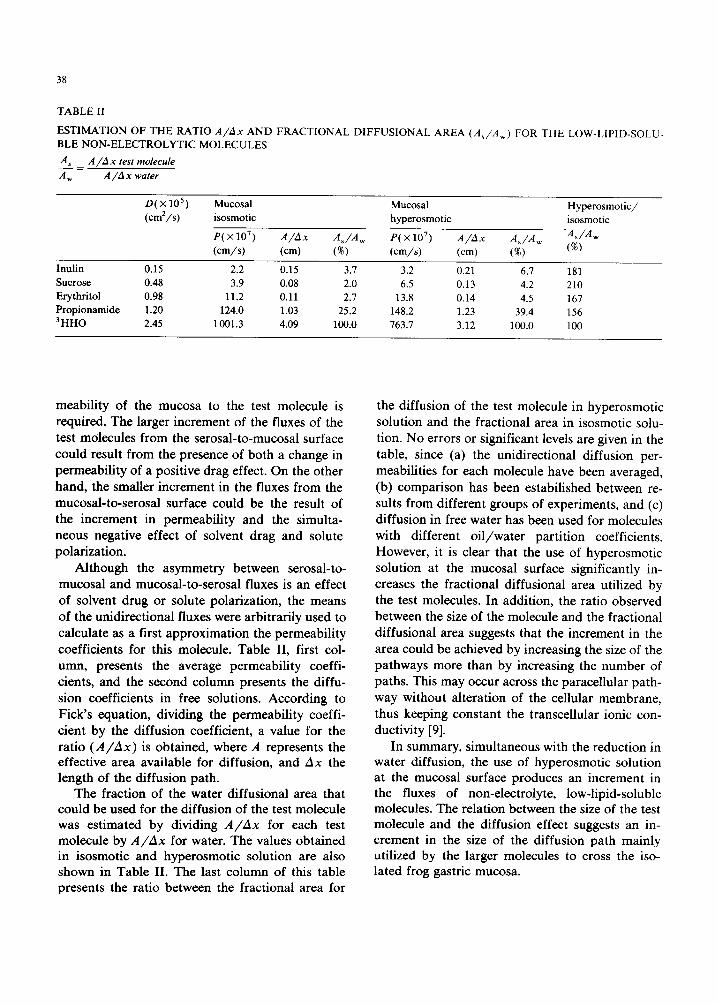
ESTIMATION OF THE RATIO A / A x AND FRACTIONAL DIFFUSIONAL AREA ( As /Aw) FOR THE LOW-LIPID-SOLU- BLE NON-ELECTROLYTIC MOLECULES
A_...Ls = A/ lAx test molecule
A w A / A x water
D ( × 105 ) Mucosal Mucosal Hyperosmotic/ (cm2/s) isosmotic hyperosmotic isosmotic
P(×107) A / A x A s / A w p(×107) A / A x A~/A w -As/Aw
(cm/s) (cm) (%) (cm/s) (cm) (%) (%)
Inulin 0.15 2.2 0.15 3.7 3.2 0.21 6.7 181 Sucrose 0.48 3.9 0.08 2.0 6.5 0.13 4.2 210 Erythritol 0.98 11.2 0.11 2.7 13.8 0.14 4.5 167 Propionamide 1.20 124.0 1.03 25.2 148.2 1.23 39.4 156 3HHO 2.45 1001.3 4.09 100.0 763.7 3.12 100.0 100
meability of the mucosa to the test molecule is required. The larger increment of the fluxes of the test molecules from the serosal-to-mucosal surface could result from the presence of both a change in permeability of a positive drag effect. On the other hand, the smaller increment in the fluxes from the mucosal-to-serosal surface could be the result of the increment in permeability and the simulta- neous negative effect of solvent drag and solute polarization.
Although the asymmetry between serosal-to- mucosal and mucosal-to-serosal fluxes is an effect of solvent drug or solute polarization, the means of the unidirectional fluxes were arbitrarily used to calculate as a first approximation the permeability coefficients for this molecule. Table II, first col- umn, presents the average permeability coeffi- cients, and the second column presents the diffu- sion coefficients in free solutions. According to Fick's equation, dividing the permeability coeffi- cient by the diffusion coefficient, a value for the ratio (A/Ax) is obtained, where A represents the effective area available for diffusion, and Ax the length of the diffusion path.
The fraction of the water diffusional area that could be used for the diffusion of the test molecule was estimated by dividing A/Ax for each test molecule by A/Ax for water. The values obtained in isosmotic and hyperosmotic solution are also shown in Table II. The last column of this table presents the ratio between the fractional area for
the diffusion of the test molecule in hyperosmotic solution and the fractional area in isosmotic solu- tion. No errors or significant levels are given in the table, since (a) the unidirectional diffusion per- meabilities for each molecule have been averaged, (b) comparison has been estabilished between re- suits from different groups of experiments, and (c) diffusion in free water has been used for molecules with different oi l /water partition coefficients. However, it is clear that the use of hyperosmotic solution at the mucosal surface significantly in- creases the fractional diffusional area utilized by the test molecules. In addition, the ratio observed between the size of the molecule and the fractional diffusional area suggests that the increment in the area could be achieved by increasing the size of the pathways more than by increasing the number of paths. This may occur across the paracellular path- way without alteration of the cellular membrane, thus keeping constant the transcellular ionic con- ductivity [9].
In summary, simultaneous with the reduction in water diffusion, the use of hyperosmotic solution at the mucosal surface produces an increment in the fluxes of non-electrolyte, low-lipid-soluble molecules. The relation between the size of the test molecule and the diffusion effect suggests an in- crement in the size of the diffusion path mainly utilized by the larger molecules to cross the iso- lated frog gastric mucosa.
Acknowledgements
The author thanks Dr. G. Whittembury for his comments on the manuscript and Dr. Laura Sananes for her co-operation in the completion of the experiments. The valuable technical assistance of Mrs. Aurora Vila-Rios is appreciated.
References
1 Villegas, L. (1962) Biochim. Biophys. Acta 64, 359-367 2 Durbin, R.P. (1979) Am. J. Physiol. 236, E63-E69 3 Helander, H.F. and Hirsehowitz, B.I. (1972) Gastroenterol-
ogy 63, 951-961
39
4 Durbin, R.P. and Helander, H.F. (1978) Biochim. Biophys. Acta 513, 179-181
5 Helander, H.F. (1977) Gastroenterology 73, 956-957 6 Durbin, R.P., Frank, H. and Solomon, A.K. (1956) J. Gen.
Physiol. 39, 535-551 7 Villegas, L. (1980) Am. J. Physiol. 238, G298-G302 8 Villegas, L. (1975) Am. J. Physiol. 228, 738-741 9 Villegas, L. (1983) in Ion and Water Transport (Vasileseu,
V., ed.), Plenum, London, in the press 10 Villegas, L. (1982) Biochim. Biophys. Acta 685, 249-252 11 Rehm, W.S., Butler, C.F., Spangler, S.G. and Sanders, S.S.
(1970) J. Theoret. Biol. 27, 443-453 12 Andersen, B. and Ussing, H.H. (1957) Acta Physiol. Stand.
39, 228-239 13 Smulders, A.P., Tormey, J.McD. and Wright, E.M. (1972) J.
Membrane Biol. 7, 164-197