Embed Size (px)
Citation preview
51182 Basal-Bolus C 5/7/2010 12:43 PM
1
Non – Insulin Pharmacological Treatment of
Type 2 Diabetes
Vivian Fonseca, MD
Disclosure InformationVivian A. Fonseca, MD
Research Support: American Diabetes Association, AstraZeneca, Daiichi-Sankyo, Eli Lilly, GlaxoSmithKline, NIH, Novartis, Novo Nordisk, Pfizer, Takeda, sanofi-aventis
Honoraria (Consulting and Lectures): AstraZeneca, Bristol-Myers Squibb, Daiichi-Sankyo, Eli Lilly, GlaxoSmithKline, Novartis, Novo Nordisk, Takeda, Pan American Laboratories, sanofi-aventis
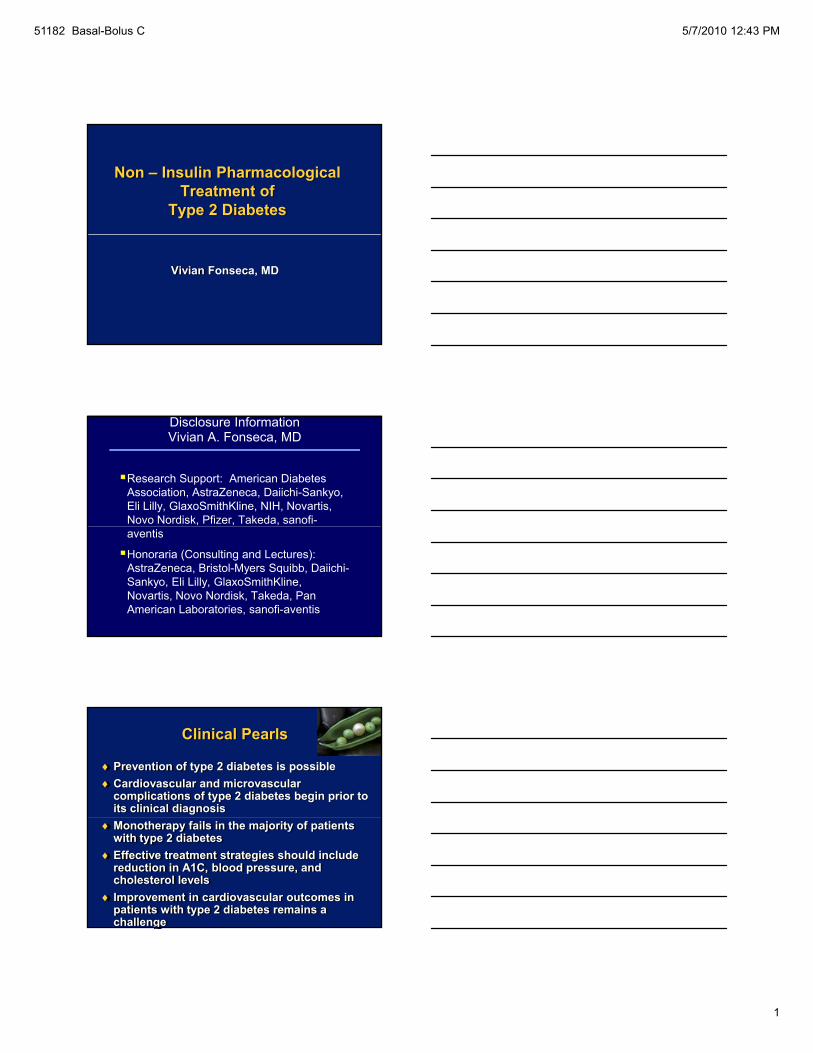
Clinical Pearls
♦ Prevention of type 2 diabetes is possible♦ Cardiovascular and microvascular
complications of type 2 diabetes begin prior to its clinical diagnosis
♦ Monotherapy fails in the majority of patients with type 2 diabetes
♦ Effective treatment strategies should include reduction in A1C, blood pressure, and cholesterol levels
♦ Improvement in cardiovascular outcomes in patients with type 2 diabetes remains a challenge
51182 Basal-Bolus C 5/7/2010 12:43 PM
2
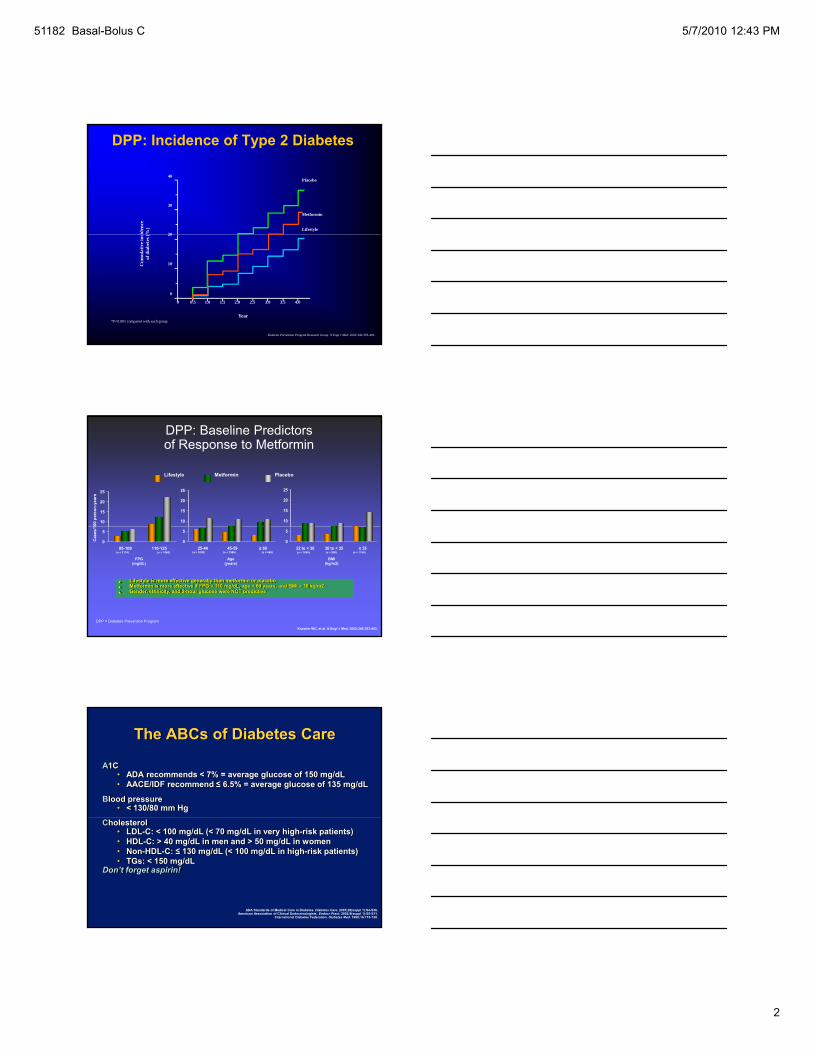
DPP: Incidence of Type 2 Diabetesci
denc
e(%
)
40
30
20
Placebo
Metformin
Lifestyle
Cum
ulat
ive i
ncof
dia
bete
s (
Year
20
10
0
0 0.5 1.0 1.5 2.0 2.5 3.0 3.5 4.0
Diabetes Prevention Program Research Group. N Engl J Med. 2002;346:393-403.
*P<0.001 compared with each group
DPP: Baseline Predictors of Response to Metformin
10
15
20
25
00 p
erso
n-ye
ars
10
15
20
25
10
15
20
25
Lifestyle Metformin Placebo
• Lifestyle is more effective generally than metformin or placebo• Metformin is more effective if FPG > 110 mg/dL, age < 60 years, and BMI > 30 kg/m2 • Gender, ethnicity, and 2-hour glucose were NOT predictive
Knowler WC, et al. N Engl J Med. 2002;346:393-403.
DPP = Diabetes Prevention Program
0
5
95-109 110-125
Cas
es/1
FPG(mg/dL)
0
5
25-44 45-59 ≥ 60
Age(years)
BMI(kg/m2)
0
5
22 to < 30 30 to < 35 ≥ 35(n = 2174) (n = 1060) (n = 1000) (n = 1586) (n = 648) (n = 1045) (n = 995) (n = 1194)
The ABCs of Diabetes Care
A1C• ADA recommends < 7% = average glucose of 150 mg/dL• AACE/IDF recommend ≤ 6.5% = average glucose of 135 mg/dL
Blood pressure• < 130/80 mm Hg
ADA Standards of Medical Care in Diabetes. Diabetes Care. 2005;28(suppl 1):S4-S36.American Association of Clinical Endocrinologists. Endocr Pract. 2002;8(suppl 1):S5-S11.
International Diabetes Federation. Diabetes Med. 1999;16:716-730.
Cholesterol• LDL-C: < 100 mg/dL (< 70 mg/dL in very high-risk patients)• HDL-C: > 40 mg/dL in men and > 50 mg/dL in women• Non-HDL-C: ≤ 130 mg/dL (< 100 mg/dL in high-risk patients)• TGs: < 150 mg/dL
Don’t forget aspirin!
51182 Basal-Bolus C 5/7/2010 12:43 PM
3
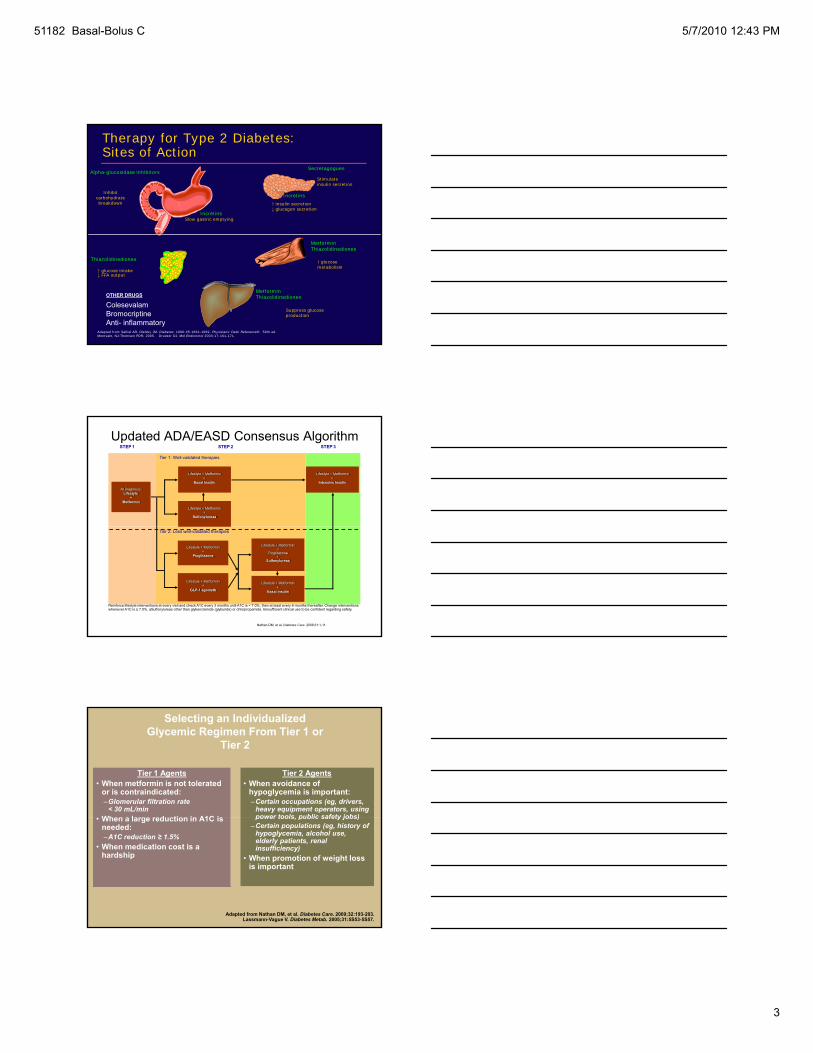
Therapy for Type 2 Diabetes: Sites of Action
Inhibitcarbohydrate breakdown
Alpha-glucosidase inhibitorsSecretagogues
Stimulate insulin secretion
Incretins Slow gastric emptying
Incretins
↑ insulin secretion↓ glucagon secretion
Adapted from Saltiel AR, Olefsky JM. Diabetes. 1996:45:1661-1669. Physicians' Desk Reference®. 59th ed. Montvale, NJ:Thomson PDR; 2005. Drucker DJ. Mol Endocrinol 2003;17:161-171.
MetforminThiazolidinediones
↑ glucosemetabolism
MetforminThiazolidinediones
↑ glucose intake ↓ FFA output
Thiazolidinediones
Suppress glucoseproduction
OTHER DRUGS
ColesevalamBromocriptineAnti- inflammatory
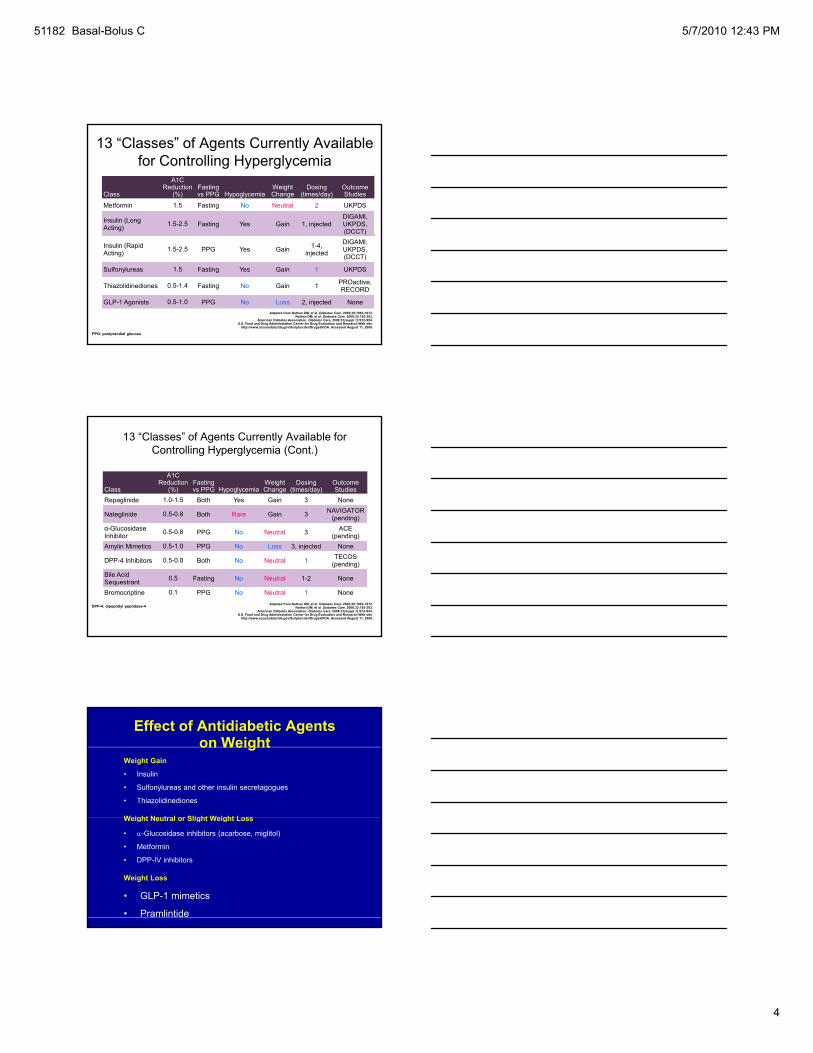
Updated ADA/EASD Consensus Algorithm
At Diagnosis:Lifestyle
+Metformin
Lifestyle + Metformin+
Sulfonylureaa
Lifestyle + Metformin+
Basal Insulin
Lifestyle + Metformin+
Intensive Insulin
STEP 1 STEP 2 STEP 3
Tier 1: Well-validated therapies
Nathan DM, et al. Diabetes Care. 2008;31:1-11.
Lifestyle + Metformin+
Pioglitazone
Lifestyle + Metformin+
GLP-1 agonistb
Lifestyle + Metformin+
Basal Insulin
Lifestyle + Metformin+
Pioglitazone+
Sulfonylureaa
Tier 2: Less well-validated therapies
Reinforce lifestyle interventions at every visit and check A1C every 3 months until A1C is < 7.0%, then at least every 6 months thereafter. Change interventions whenever A1C is ≥ 7.0%. aSulfonylureas other than glybenclamide (glyburide) or chlorpropamide. bInsufficient clinical use to be confident regarding safety.
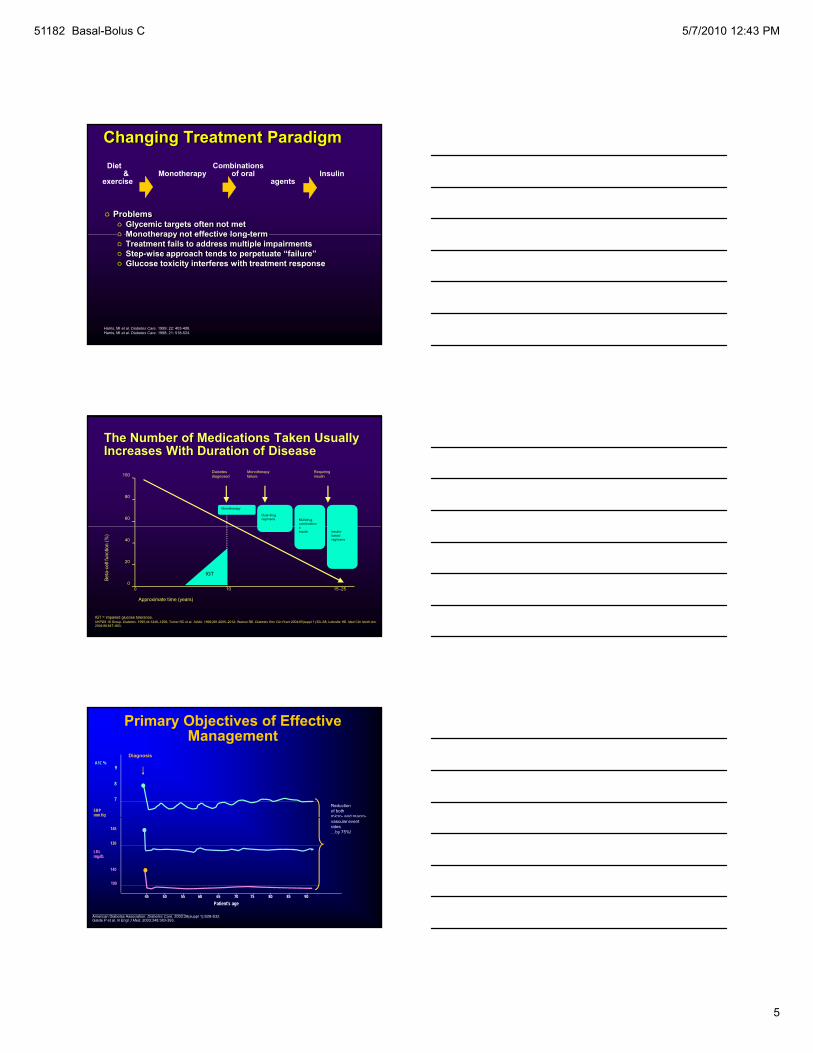
Selecting an Individualized Glycemic Regimen From Tier 1 or
Tier 2
Tier 1 Agents• When metformin is not tolerated
or is contraindicated:–Glomerular filtration rate
< 30 mL/min• When a large reduction in A1C is
Tier 2 Agents• When avoidance of
hypoglycemia is important:–Certain occupations (eg, drivers,
heavy equipment operators, using power tools public safety jobs)• When a large reduction in A1C is
needed:–A1C reduction ≥ 1.5%
• When medication cost is a hardship
power tools, public safety jobs)–Certain populations (eg, history of
hypoglycemia, alcohol use, elderly patients, renal insufficiency)
• When promotion of weight loss is important
Adapted from Nathan DM, et al. Diabetes Care. 2009;32:193-203. Lassmann-Vague V. Diabetes Metab. 2005;31:5S53-5S57.
51182 Basal-Bolus C 5/7/2010 12:43 PM
4
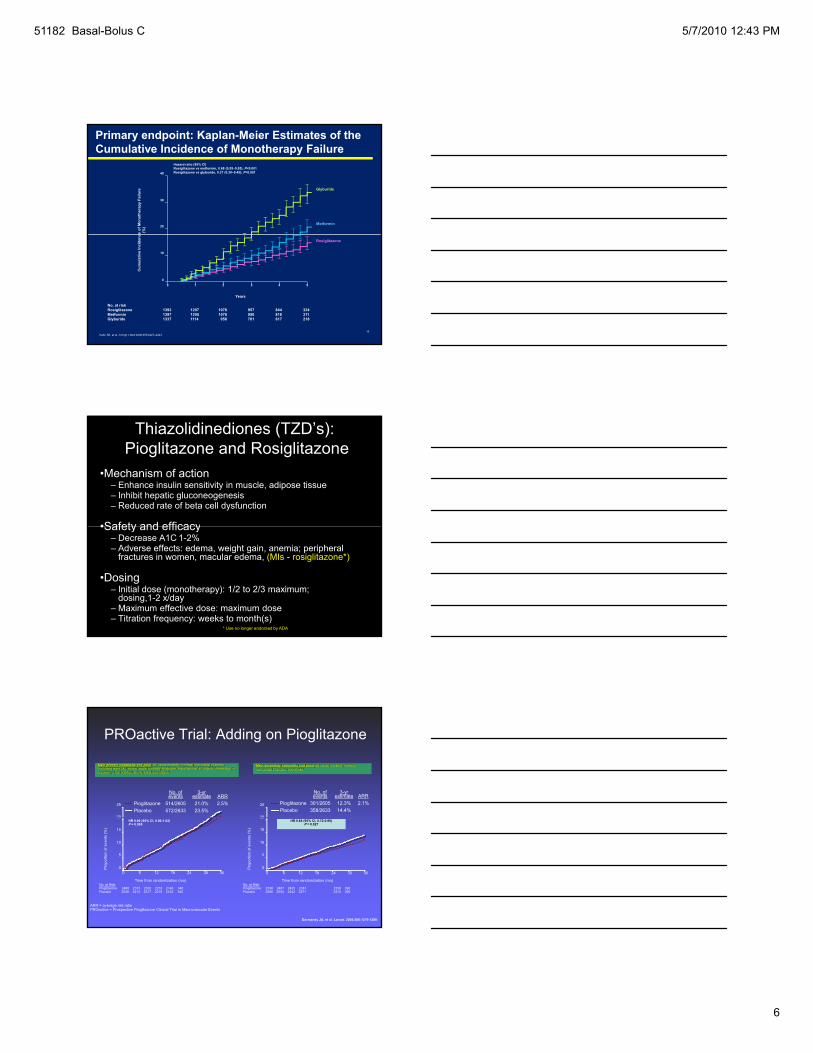
13 “Classes” of Agents Currently Available for Controlling Hyperglycemia
Class
A1CReduction
(%)Fastingvs PPG Hypoglycemia
WeightChange
Dosing(times/day)
OutcomeStudies
Metformin 1.5 Fasting No Neutral 2 UKPDS
Insulin (Long Acting) 1.5-2.5 Fasting Yes Gain 1, injected
DIGAMI, UKPDS, (DCCT)( )
Insulin (Rapid Acting) 1.5-2.5 PPG Yes Gain 1-4,
injected
DIGAMI, UKPDS, (DCCT)
Sulfonylureas 1.5 Fasting Yes Gain 1 UKPDS
Thiazolidinediones 0.5-1.4 Fasting No Gain 1 PROactive,RECORD
GLP-1 Agonists 0.5-1.0 PPG No Loss 2, injected NoneAdapted from Nathan DM, et al. Diabetes Care. 2006;29:1963-1972.
Nathan DM, et al. Diabetes Care. 2009;32:193-203. American Diabetes Association. Diabetes Care. 2008;31(suppl 1):S12-S54.
U.S. Food and Drug Administration Center for Drug Evaluation and Research Web site. http://www.accessdata.fda.gov/Scripts/cder/DrugsatFDA. Accessed August 11, 2009.
PPG: postprandial glucose
Class
A1CReduction
(%)Fastingvs PPG Hypoglycemia
WeightChange
Dosing(times/day)
OutcomeStudies
Repaglinide 1.0-1.5 Both Yes Gain 3 None
Nateglinide 0.5-0.8 Both Rare Gain 3 NAVIGATOR (pending)
Gl id ACE
13 “Classes” of Agents Currently Available for Controlling Hyperglycemia (Cont.)
α-Glucosidase Inhibitor 0.5-0.8 PPG No Neutral 3 ACE
(pending)Amylin Mimetics 0.5-1.0 PPG No Loss 3, injected None
DPP-4 Inhibitors 0.5-0.8 Both No Neutral 1 TECOS (pending)
Bile AcidSequestrant 0.5 Fasting No Neutral 1-2 None
Bromocriptine 0.1 PPG No Neutral 1 NoneAdapted from Nathan DM, et al. Diabetes Care. 2006;29:1963-1972.
Nathan DM, et al. Diabetes Care. 2009;32:193-203. American Diabetes Association. Diabetes Care. 2008;31(suppl 1):S12-S54.
U.S. Food and Drug Administration Center for Drug Evaluation and Research Web site. http://www.accessdata.fda.gov/Scripts/cder/DrugsatFDA. Accessed August 11, 2009.
DPP-4: dipeptidyl peptidase-4
Effect of Antidiabetic Agents on Weight
Weight Gain
• Insulin
• Sulfonylureas and other insulin secretagogues
• Thiazolidinediones
Weight Neutral or Slight Weight LossWeight Neutral or Slight Weight Loss
• α-Glucosidase inhibitors (acarbose, miglitol)
• Metformin
• DPP-IV inhibitors
Weight Loss
• GLP-1 mimetics
• Pramlintide
51182 Basal-Bolus C 5/7/2010 12:43 PM
5
Changing Treatment Paradigm
ProblemsGlycemic targets often not met Monotherapy not effective long-term
Diet Combinations& Monotherapy of oral Insulin
exercise agents
Monotherapy not effective long-termTreatment fails to address multiple impairments Step-wise approach tends to perpetuate “failure”Glucose toxicity interferes with treatment response
Harris, MI et al. Diabetes Care. 1999; 22: 403-408. Harris, MI et al. Diabetes Care. 1998; 21: 518-524.
The Number of Medications Taken Usually Increases With Duration of Disease
100Diabetesdiagnosed
Requiring insulin
Monotherapyfailure
Multidrugcombination
Dual-drugregimens
Monotherapy
80
60
0
Beta
-cel
l fun
ctio
n (%
)
0 10 15–25
Insulin-basedregimens
±insulin
Approximate time (years)
40
20
IGT
IGT = impaired glucose tolerance.UKPDS 16 Group. Diabetes. 1995;44:1249–1258; Turner RC et al. JAMA. 1999;281:2005–2012; Warren RE. Diabetes Res Clin Pract 2004;65(suppl 1):S3–S8; Lebovitz HE. Med Clin North Am. 2004;88:847–863.
Primary Objectives of Effective Management
A1C %
SBPmm Hg
9
Diagnosis
8
7Reduction of both micro- and macro-
LDLmg/dL
45 50 55 60 65 70 75 80 85 90
130
100
145
140
Patient’s age
vascular event rates …by 75%!
American Diabetes Association. Diabetes Care. 2003:26(suppl 1):S28-S32.Gæde P et al. N Engl J Med. 2003;348:383-393.
51182 Basal-Bolus C 5/7/2010 12:43 PM
6
Primary endpoint: Kaplan-Meier Estimates of the Cumulative Incidence of Monotherapy Failure
40
20
30
ce o
f Mon
othe
rapy
Fai
lure
(%
)
Glyburide
Metformin
Hazard ratio (95% CI)Rosiglitazone vs metformin, 0.68 (0.55–0.85); P<0.001Rosiglitazone vs glyburide, 0.37 (0.30–0.45); P<0.001
16Kahn SE, et al. N Engl J Med 2006;355:2427–2443.
Years
1 2 3 4 50
10
0
Cum
ulat
ive
Inci
denc
No. at riskRosiglitazone 1393 1207 1078 957 844 324Metformin 1397 1205 1076 950 818 311Glyburide 1337 1114 958 781 617 218
Rosiglitazone
Thiazolidinediones (TZD’s):Pioglitazone and Rosiglitazone
•Mechanism of action– Enhance insulin sensitivity in muscle, adipose tissue– Inhibit hepatic gluconeogenesis– Reduced rate of beta cell dysfunction
•Safety and efficacy•Safety and efficacy– Decrease A1C 1-2%– Adverse effects: edema, weight gain, anemia; peripheral
fractures in women, macular edema, (MIs - rosiglitazone*)
•Dosing– Initial dose (monotherapy): 1/2 to 2/3 maximum;
dosing,1-2 x/day– Maximum effective dose: maximum dose– Titration frequency: weeks to month(s)
* Use no longer endorsed by ADA
PROactive Trial: Adding on Pioglitazone
No. of events
3-yr estimate ARR
Pioglitazone 301/2605 12.3% 2.1%Placebo 358/2633 14.4%
20
25
Main secondary composite end point: all-cause mortality, nonfatal myocardial infarction, and stroke
No. of events
3-yr estimate ARR
Pioglitazone 514/2605 21.0% 2.5%Placebo 572/2633 23.5%
20
25
Main primary composite end point: all-cause mortality, nonfatal myocardial infarction (including silent MI), stroke, acute coronary syndrome, endovascular or surgical intervention in coronary or leg arteries, above-ankle amputation
Dormandy JA, et al. Lancet. 2005;366:1279-1289.
No. at Risk:Pioglitazone 2536 2487 2435 2381 2336 396Placebo 2566 2504 2442 2371 2315 390
Pro
porti
on o
f eve
nts
(%)
20
Time from randomization (mo)
0
5
10
15
0 6 12 18 24 30 36
HR 0.84 (95% CI, 0.72-0.98)P = 0.027
No. at Risk:Pioglitazone 2488 2373 2302 2218 2146 348Placebo 2530 2413 2317 2215 2122 345
Time from randomization (mo)
6 12 18 24 30 36
HR 0.90 (95% CI, 0.80-1.02)P = 0.095
Pro
porti
on o
f eve
nts
(%)
0
5
10
15
20
0
ARR = average risk ratioPROactive = Prospective Pioglitazone Clinical Trial in Macrovascular Events
51182 Basal-Bolus C 5/7/2010 12:43 PM
7
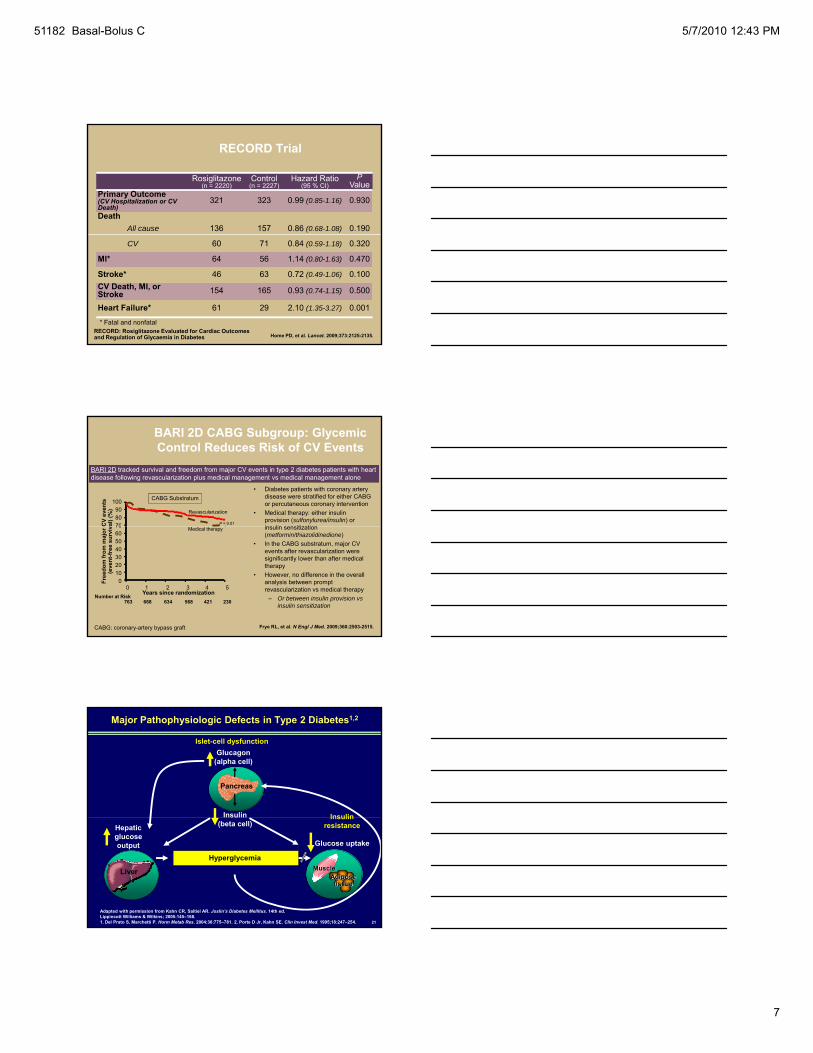
Rosiglitazone(n = 2220)
Control(n = 2227)
Hazard Ratio(95 % CI)
PValue
Primary Outcome (CV Hospitalization or CV Death)
321 323 0.99 (0.85-1.16) 0.930
DeathAll cause 136 157 0.86 (0.68-1.08) 0.190
RECORD Trial
CV 60 71 0.84 (0.59-1.18) 0.320
MI* 64 56 1.14 (0.80-1.63) 0.470
Stroke* 46 63 0.72 (0.49-1.06) 0.100CV Death, MI, or Stroke 154 165 0.93 (0.74-1.15) 0.500
Heart Failure* 61 29 2.10 (1.35-3.27) 0.001
Home PD, et al. Lancet. 2009;373:2125-2135.
* Fatal and nonfatalRECORD: Rosiglitazone Evaluated for Cardiac Outcomes and Regulation of Glycaemia in Diabetes
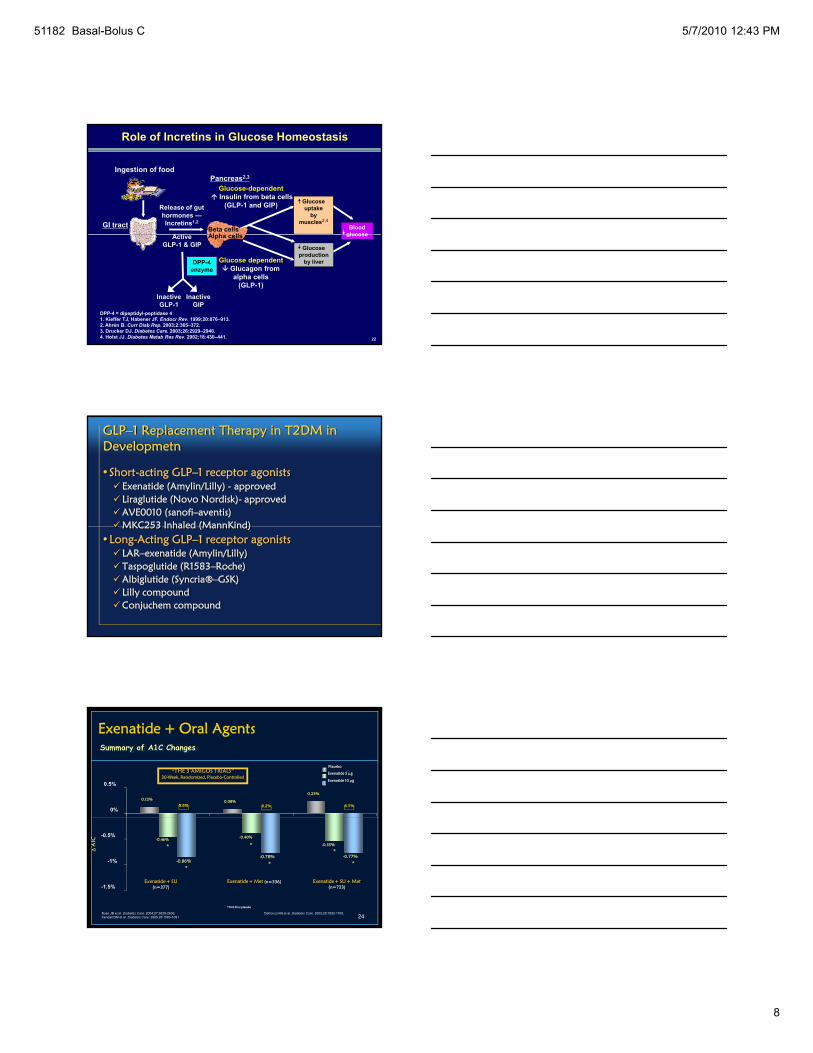
BARI 2D CABG Subgroup: Glycemic Control Reduces Risk of CV Events
• Diabetes patients with coronary artery disease were stratified for either CABG or percutaneous coronary intervention
• Medical therapy: either insulin provision (sulfonylurea/insulin) or i li iti ti
100908070C
V ev
ents
al) (
%) Revascularization
P = 0.01
CABG Substratum
BARI 2D tracked survival and freedom from major CV events in type 2 diabetes patients with heart disease following revascularization plus medical management vs medical management alone
insulin sensitization (metformin/thiazolidinedione)
• In the CABG substratum, major CV events after revascularization were significantly lower than after medical therapy
• However, no difference in the overall analysis between prompt revascularization vs medical therapy
– Or between insulin provision vs insulin sensitization
Frye RL, et al. N Engl J Med. 2009;360:2503-2515.
0 1 2 3 4 5Years since randomization
706050403020100Fr
eedo
m fr
om m
ajor
C(e
vent
-free
sur
viv Medical therapy
Number at Risk 763 668 634 568 421 230
CABG: coronary-artery bypass graft
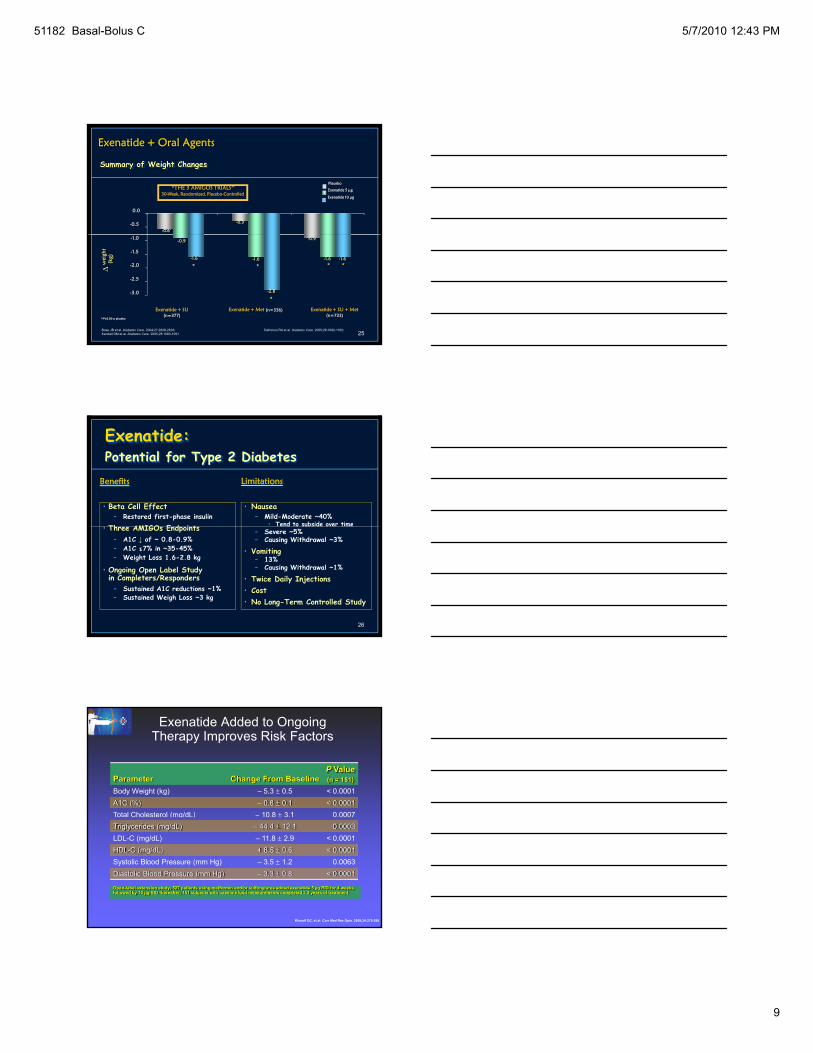
Insulin
Glucagon(alpha cell)
Insulin
Pancreas
Islet-cell dysfunction
Major Pathophysiologic Defects in Type 2 Diabetes1,2
21
Hepatic glucoseoutput
Insulin resistance
Glucose uptake
(beta cell)
Liver
Hyperglycemia
Adapted with permission from Kahn CR, Saltiel AR. Joslin’s Diabetes Mellitus. 14th ed. Lippincott Williams & Wilkins; 2005:145–168.1. Del Prato S, Marchetti P. Horm Metab Res. 2004;36:775–781. 2. Porte D Jr, Kahn SE. Clin Invest Med. 1995;18:247–254.
MuscleAdipose tissue
51182 Basal-Bolus C 5/7/2010 12:43 PM
8
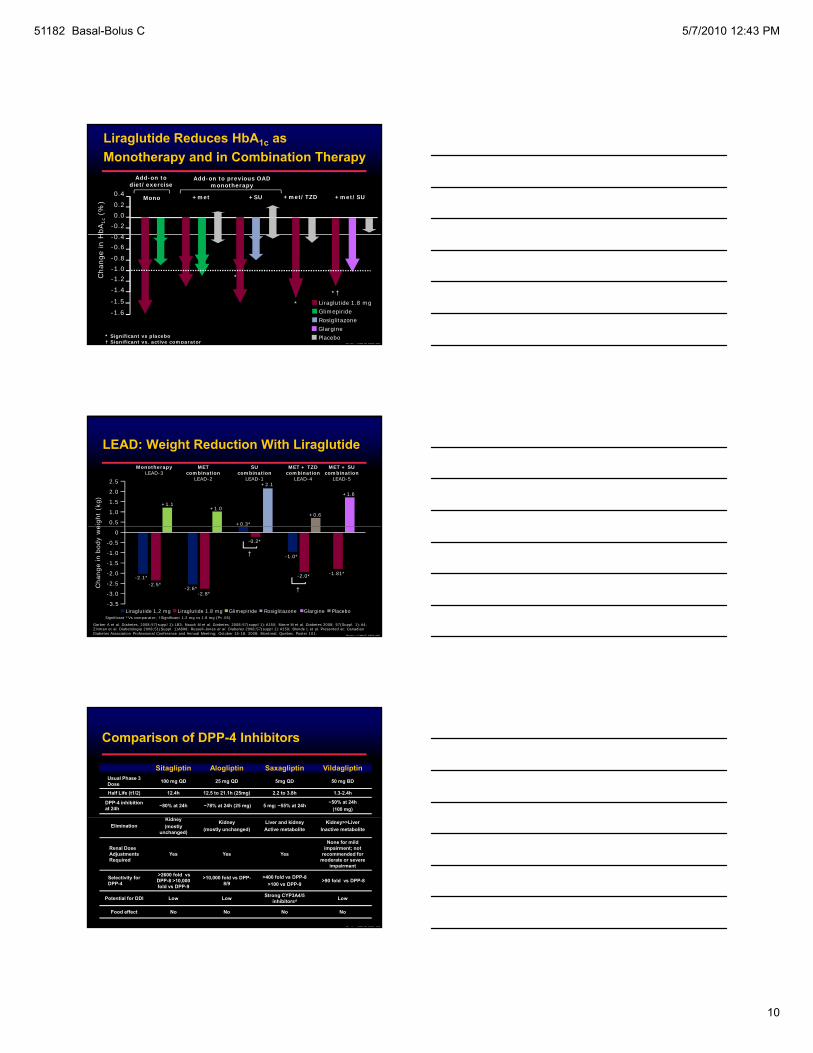
Role of Incretins in Glucose Homeostasis
Ingestion of food
Beta cellsAl h ll
Release of gut hormones —Incretins1,2
Pancreas2,3
Glucose-dependentInsulin from beta cells
(GLP-1 and GIP) Glucose uptake
by muscles2,4
Blood glucose
GI tractA ti
22
DPP-4 = dipeptidyl-peptidase 41. Kieffer TJ, Habener JF. Endocr Rev. 1999;20:876–913.2. Ahrén B. Curr Diab Rep. 2003;2:365–372.3. Drucker DJ. Diabetes Care. 2003;26:2929–2940.4. Holst JJ. Diabetes Metab Res Rev. 2002;18:430–441.
Alpha cells
Glucose production
by liver
glucose
Glucose dependentGlucagon fromalpha cells
(GLP-1)
ActiveGLP-1 & GIP
DPP-4 enzyme
InactiveGIP
InactiveGLP-1
GLP–1 Replacement Therapy in T2DM in Developmetn
•Short-acting GLP–1 receptor agonistsExenatide (Amylin/Lilly) - approvedLiraglutide (Novo Nordisk)- approvedAVE0010 (sanofi–aventis)MKC253 Inhaled (MannKind)MKC253 Inhaled (MannKind)
•Long-Acting GLP–1 receptor agonistsLAR–exenatide (Amylin/Lilly)Taspoglutide (R1583–Roche)Albiglutide (Syncria®–GSK)Lilly compoundConjuchem compound
Exenatide + Oral Agents
Placebo
0.12% 0.08%
0.23%
0%
0.5%
“THE 3 AMIGOS TRIALS”30-Week, Randomized, Placebo-Controlled
Exenatide 5 μg
Exenatide 10 μg
Summary of A1C Changes
8.6% 8.2% 8.5%
24Buse JB et al. Diabetes Care. 2004;27:2628-2635; Defronzo RA et al. Diabetes Care. 2005;28:1092-1100; Kendall DM et al. Diabetes Care. 2005;28:1083-1091
Exenatide + SU + Met(n=733)
Exenatide + SU(n=377)
Exenatide + Met (n=336)
*P<0.01 vs placebo
* **Δ
A1C
*-0.78%
*-0.77%
-0.55%
-0.40%-0.46%
-1.5%
-1%
-0.5%
*-0.86%
51182 Basal-Bolus C 5/7/2010 12:43 PM
9
-0.5
0.0
-0.6
-0.3
Exenatide + Oral Agents
Summary of Weight Changes
Placebo“THE 3 AMIGOS TRIALS”
30-Week, Randomized, Placebo-ControlledExenatide 5 μg
Exenatide 10 μg
25
-3.0
-2.5
-2.0
-1.5
-1.0
Exenatide + SU + Met(n=733)
Exenatide + SU(n=377)
Exenatide + Met (n=336)
-0.9
*P<0.05 vs placebo
* *Δw
eigh
t(k
g) -1.6
*
-2.8
-1.6
-0.9
*-1.6
Buse JB et al. Diabetes Care. 2004;27:2628-2635; Defronzo RA et al. Diabetes Care. 2005;28:1092-1100; Kendall DM et al. Diabetes Care. 2005;28:1083-1091
-1.6
*
Exenatide:Potential for Type 2 Diabetes
• Beta Cell Effect– Restored first-phase insulin
Th AMIGO E d i t
• Nausea– Mild-Moderate ~40%
• Tend to subside over time
Benefits Limitations
26
• Three AMIGOs Endpoints – A1C ↓ of ~ 0.8-0.9% – A1C ≤7% in ~35-45% – Weight Loss 1.6-2.8 kg
• Ongoing Open Label Study in Completers/Responders – Sustained A1C reductions ~1%– Sustained Weigh Loss ~3 kg
Tend to subside over time– Severe ~5%– Causing Withdrawal ~3%
• Vomiting – 13% – Causing Withdrawal ~1%
• Twice Daily Injections• Cost • No Long-Term Controlled Study
Exenatide Added to Ongoing Therapy Improves Risk Factors
Parameter Change From BaselineP Value(n = 151)
Body Weight (kg) – 5.3 ± 0.5 < 0.0001A1C (%) – 0.8 ± 0.1 < 0.0001Total Cholesterol (mg/dL) – 10.8 ± 3.1 0.0007( g )Triglycerides (mg/dL) – 44.4 ± 12.1 0.0003LDL-C (mg/dL) – 11.8 ± 2.9 < 0.0001HDL-C (mg/dL) + 8.5 ± 0.6 < 0.0001Systolic Blood Pressure (mm Hg) – 3.5 ± 1.2 0.0063Diastolic Blood Pressure (mm Hg) – 3.3 ± 0.8 < 0.0001
Open-label extension study; 527 patients using metformin and/or sulfonylurea added exenatide 5 µg BID for 4 weeks followed by 10 µg BID thereafter; 151 subjects with baseline lipid measurements completed 3.5 years of treatment
Klonoff DC, et al. Curr Med Res Opin. 2008;24:275-286.
51182 Basal-Bolus C 5/7/2010 12:43 PM
10
0.20.0
-0.2
0 4
0.4
HbA
1c(%
) Mono +SU+met +met/TZD +met/SU
Add-on to diet/exercise
Add-on to previous OAD monotherapy
Liraglutide Reduces HbA1c as Monotherapy and in Combination Therapy
Pratley CMHC 08Oct09
-0.4-0.6
-1.0-1.2
-1.4
-0.8
Cha
nge
in H
-1.5 Liraglutide 1.8 mgGlimepiride
Placebo
RosiglitazoneGlargine
* Significant vs placebo† Significant vs. active comparator
† *†*
**†
-1.6
LEAD: Weight Reduction With Liraglutide
eigh
t (k
g) +1.1
+1.6
2.5
2.0
1.5
1.0
0.5
+1.0
SU combination
LEAD-1
MET combination
LEAD-2
MET + TZD combination
LEAD-4
MET + SU combination
LEAD-5
MonotherapyLEAD-3
+0.6
+0.3*
+2.1
Pratley CMHC 08Oct09
Cha
nge
in b
ody
we
0
-0.5
-1.0
-1.5
-2.0-2.1*
-2.5*
-1.81*
-2.5
-3.0
-3.5
-2.6*-2.8*
PlaceboLiraglutide 1.8 mgLiraglutide 1.2 mg Glimepiride Rosiglitazone Glargine
Garber A et al. Diabetes. 2008;57(suppl 1):LB3; Nauck M et al. Diabetes. 2008;57(suppl 1):A150; Marre M et al. Diabetes 2008; 57(Suppl. 1):A4; Zinman et al. Diabetologia 2008;51(Suppl. 1)A898; Russell-Jones et al. Diabetes 2008;57(suppl 1):A159; Blonde L et al. Presented at: Canadian Diabetes Association Professional Conference and Annual Meeting; October 15-18, 2008; Montreal, Quebec. Poster 101.
Significant *Vs comparator; †Significant 1.2 mg vs 1.8 mg (P<.05)
-2.0*
-1.0*
†
-0.2*
†
Comparison of DPP-4 Inhibitors
Sitagliptin Alogliptin Saxagliptin VildagliptinUsual Phase 3 Dose 100 mg QD 25 mg QD 5mg QD 50 mg BD
Half Life (t1/2) 12.4h 12.5 to 21.1h (25mg) 2.2 to 3.8h 1.3-2.4h
DPP-4 inhibition at 24h ~80% at 24h ~78% at 24h (25 mg) 5 mg: ~55% at 24h
~50% at 24h(100 mg)
Kid
Pratley CMHC 08Oct09
EliminationKidney(mostly
unchanged)
Kidney(mostly unchanged)
Liver and kidneyActive metabolite
Kidney>>LiverInactive metabolite
Renal Dose Adjustments Required
Yes Yes Yes
None for mild impairment; not
recommended for moderate or severe
impairment
Selectivity for DPP-4
>2600 fold vs DPP-8 >10,000 fold vs DPP-9
>10,000 fold vs DPP-8/9
>400 fold vs DPP-8>100 vs DPP-9
>90 fold vs DPP-8
Potential for DDI Low Low Strong CYP3A4/5 inhibitorsd Low
Food effect No No No No
51182 Basal-Bolus C 5/7/2010 12:43 PM
11
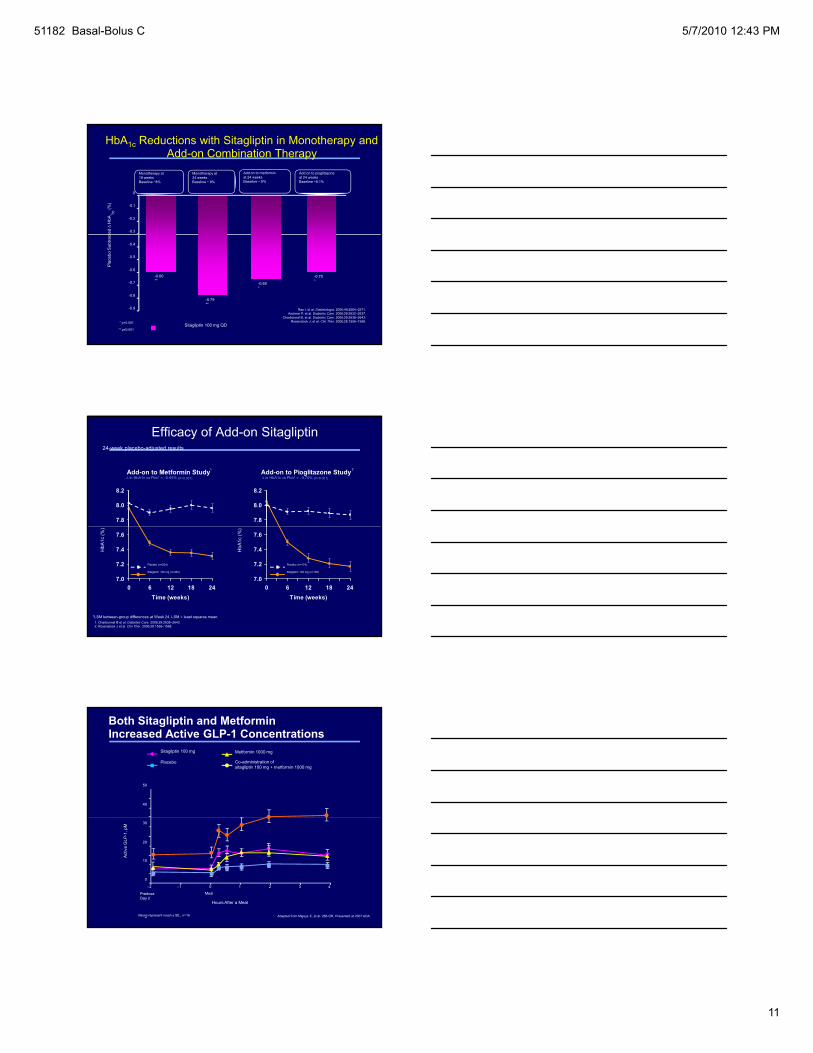
Add on to pioglitazoneat 24 weeksBaseline ~8.1%
HbA1c Reductions with Sitagliptin in Monotherapy and Add-on Combination Therapy
ted ∆
HbA
1c(%
)
Monotherapy at 18 weeksBaseline ~8%
Monotherapy at24 weeksBaseline ~ 8%
Add on to metforminat 24 weeksBaseline ~ 8%
-0.3
-0.2
-0.1
0
Sitagliptin 100 mg QD
Raz I, et al. Diabetologia. 2006;49:2564–2571.Aschner P, et al. Diabetes Care. 2006;29:2632–2637.
Charbonnel B, et al. Diabetes Care. 2006;29:2638–2643.Rosenstock J, et al. Clin Ther. 2006;28:1556–1568.
-0.65*
-0.70*
Pla
cebo
Sub
tract
-0.60**
-0.79**
* p<0.001
** p≤0.001
-0.9
-0.8
-0.7
-0.6
-0.5
-0.4
Add-on to Metformin Study
7.8
8.0
8.2
Add-on to Pioglitazone Study
7.8
8.0
8.2
Efficacy of Add-on Sitagliptin24-week placebo-adjusted results
Δ in HbA1c vs Pbo* = –0.65% (P<0.001) Δ in HbA1c vs Pbo* = –0.70% (P<0.001)
1 2
7.0
7.2
7.4
7.6
0 6 12 18 24Time (weeks)
7.0
7.2
7.4
7.6
0 6 12 18 24Time (weeks)
*LSM between-group differences at Week 24. LSM = least squares mean.1. Charbonnel B et al. Diabetes Care. 2006;29:2638–2643.2. Rosenstock J et al. Clin Ther. 2006;28:1556–1568.
Placebo (n=224)
Sitagliptin 100 mg (n=453)
Placebo (n=174)
Sitagliptin 100 mg (n=163)
HbA
1c (%
)
HbA
1c (%
)
Both Sitagliptin and Metformin Increased Active GLP-1 Concentrations
40
50
Placebo
Metformin 1000 mg Sitagliptin 100 mg
Co-administration of sitagliptin 100 mg + metformin 1000 mg
0
10
20
30
–2 –1 0 1 2 3 4
Hours After a Meal
Act
ive
GLP
-1, p
M
PredoseDay 2
Meal
Values represent mean ± SE., n=16 Adapted from Migoya E, et al. 286-OR, Presented at 2007 ADA.
51182 Basal-Bolus C 5/7/2010 12:43 PM
12
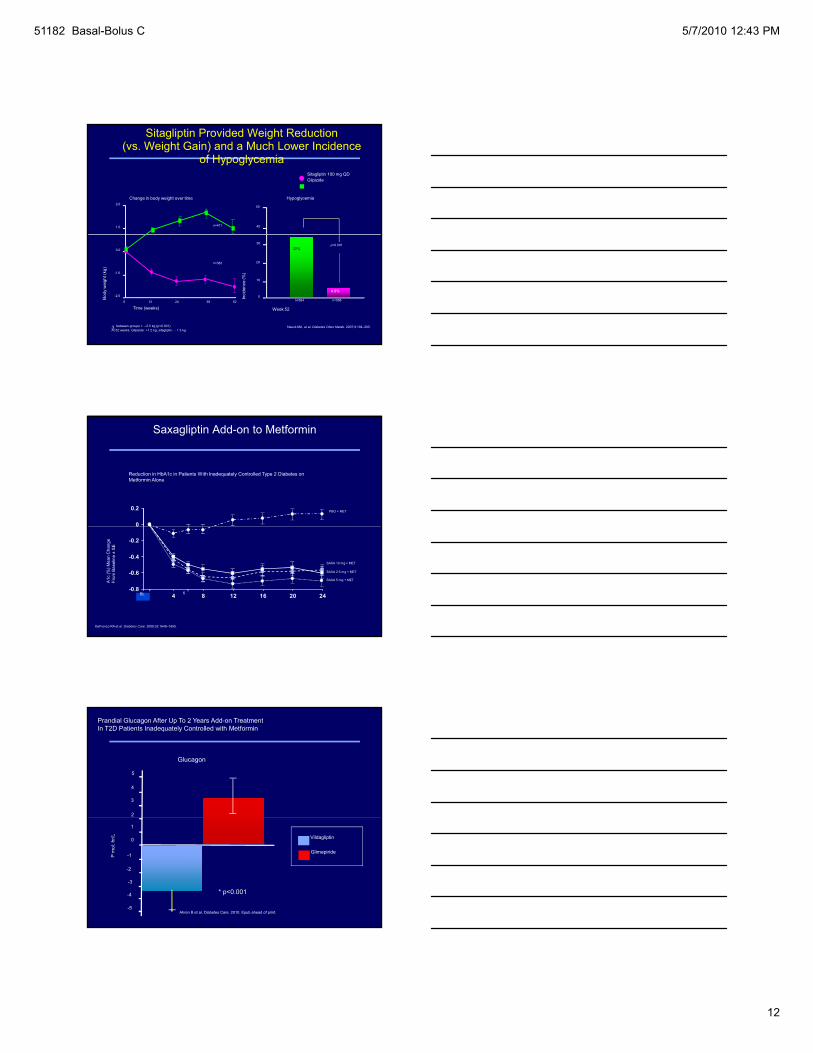
Sitagliptin Provided Weight Reduction (vs. Weight Gain) and a Much Lower Incidence
of HypoglycemiaSitagliptin 100 mg QDGlipizide
2.0
1.0
Change in body weight over time Hypoglycemia
50
40n=411
Nauck MA, et al. Diabetes Obes Metab. 2007;9:194–205.
Time (weeks)0 12 24 38 52
0.0
-1.0
-2.0 Inci
denc
e (%
)
10
20
30
0
32%
4.9%
p<0.001
n=382
n=588n=584
Δ between groups = –2.5 kg (p<0.001)At 52 weeks: Glipizide: +1.2 kg; sitagliptin: – 1.3 kg
Bod
y w
eigh
t (kg
)
Week 52
0
0.2
Saxagliptin Add-on to Metformin
Reduction in HbA1c in Patients With Inadequately Controlled Type 2 Diabetes on Metformin Alone
PBO + MET
-0.8
-0.6
-0.4
-0.2
0
BL 4 8 12 16 20 24
DeFronzo RA et al. Diabetes Care. 2009;32:1649–1655.
BL
A1c
(%) M
ean
Cha
nge
From
Bas
elin
e ±
SE
SAXA 5 mg + MET
SAXA 2.5 mg + MET
SAXA 10 mg + MET
6
2
3
4
5
Glucagon
Prandial Glucagon After Up To 2 Years Add-on TreatmentIn T2D Patients Inadequately Controlled with Metformin
0
1
-1
-2
-3
-4
-5
Vildagliptin
Glimepiride
P m
ol. h
r/L
*
* p<0.001
Ahren B et al. Diabetes Care. 2010. Epub ahead of print.
51182 Basal-Bolus C 5/7/2010 12:43 PM
13
4
5
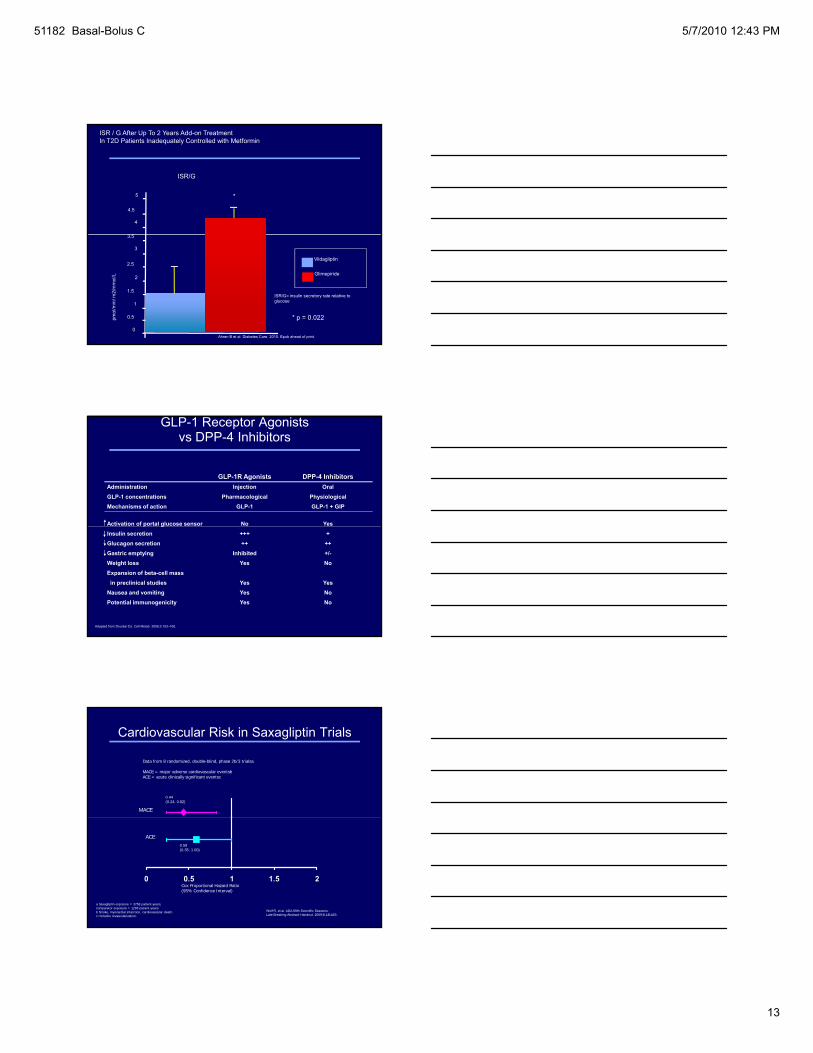
ISR/G
3 5
4.5
*
ISR / G After Up To 2 Years Add-on TreatmentIn T2D Patients Inadequately Controlled with Metformin
3
0.5
0
Vildagliptin
Glimepiride
pmol
/min
/ m2/
mm
ol/L
1.5
2.5
3.5
2
1
ISR/G= insulin secretory rate relative to glucose
* p = 0.022
Ahren B et al. Diabetes Care. 2010. Epub ahead of print.
GLP-1 Receptor Agonists vs DPP-4 Inhibitors
GLP-1R Agonists DPP-4 InhibitorsAdministration Injection OralGLP-1 concentrations Pharmacological PhysiologicalMechanisms of action GLP-1 GLP-1 + GIP
Activation of portal glucose sensor No Yesp gInsulin secretion +++ +Glucagon secretion ++ ++Gastric emptying Inhibited +/-Weight loss Yes NoExpansion of beta-cell massin preclinical studies Yes Yes
Nausea and vomiting Yes NoPotential immunogenicity Yes No
Adapted from Drucker DJ. Cell Metab. 2006;3:153–165.
Cardiovascular Risk in Saxagliptin Trials
Data from 8 randomized, double-blind, phase 2b/3 trialsa
MACE = major adverse cardiovascular eventsbACE = acute clinically significant eventsc
0.44(0.24, 0.82)
MACE
Wolf R, et al. ADA 69th Scientific Sessions. Late Breaking Abstract Handout. 2009;8-LB:LB3.
a Saxagliptin exposure = 3758 patient-years, comparator exposure = 1293 patient-years.b Stroke, myocardial infarction, cardiovascular death.c Includes revascularization.
0 0.5 1 1.5 2
0.59 (0.35, 1.00)
ACE
Cox Proportional Hazard Ratio(95% Confidence Interval)
51182 Basal-Bolus C 5/7/2010 12:43 PM
14
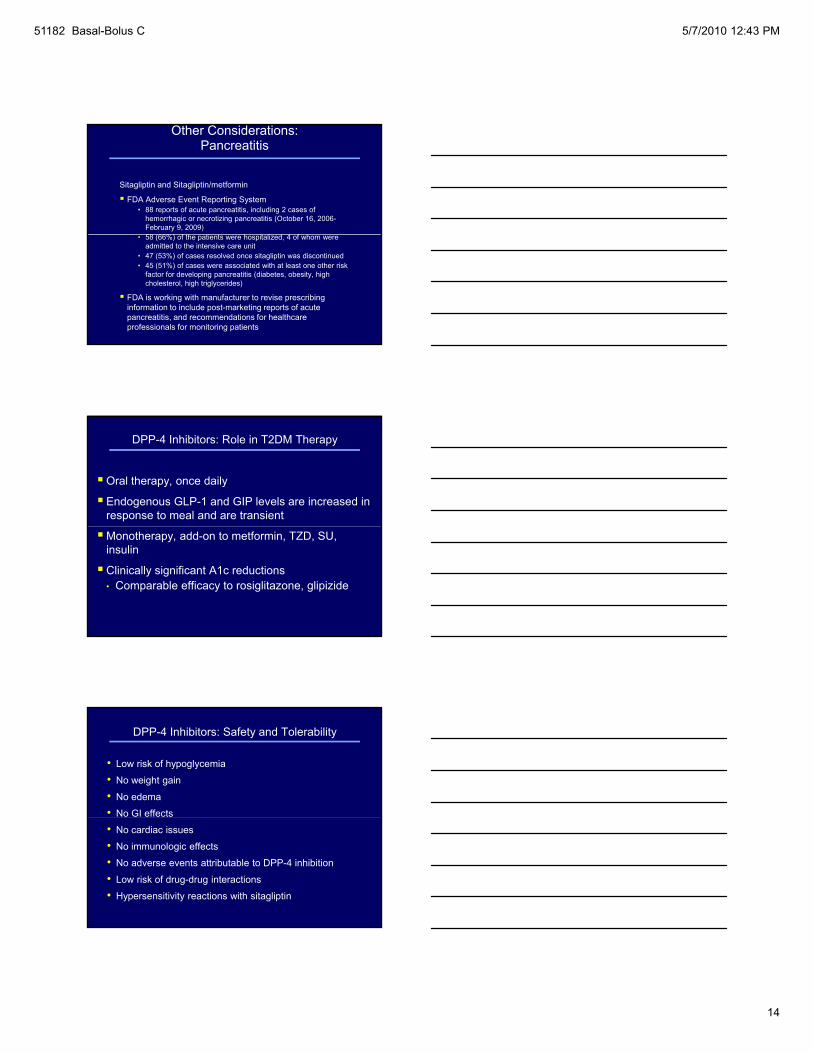
Other Considerations:Pancreatitis
Sitagliptin and Sitagliptin/metformin
FDA Adverse Event Reporting System• 88 reports of acute pancreatitis, including 2 cases of
hemorrhagic or necrotizing pancreatitis (October 16, 2006-February 9, 2009)58 (66%) f th ti t h it li d 4 f h• 58 (66%) of the patients were hospitalized, 4 of whom were admitted to the intensive care unit
• 47 (53%) of cases resolved once sitagliptin was discontinued• 45 (51%) of cases were associated with at least one other risk
factor for developing pancreatitis (diabetes, obesity, high cholesterol, high triglycerides)
FDA is working with manufacturer to revise prescribing information to include post-marketing reports of acute pancreatitis, and recommendations for healthcare professionals for monitoring patients
DPP-4 Inhibitors: Role in T2DM Therapy
Oral therapy, once daily
Endogenous GLP-1 and GIP levels are increased in response to meal and are transient
Monotherapy, add-on to metformin, TZD, SU, insulin
Clinically significant A1c reductions• Comparable efficacy to rosiglitazone, glipizide
DPP-4 Inhibitors: Safety and Tolerability
• Low risk of hypoglycemia
• No weight gain
• No edema
• No GI effects
• No cardiac issues
• No immunologic effects
• No adverse events attributable to DPP-4 inhibition
• Low risk of drug-drug interactions
• Hypersensitivity reactions with sitagliptin
51182 Basal-Bolus C 5/7/2010 12:43 PM
15
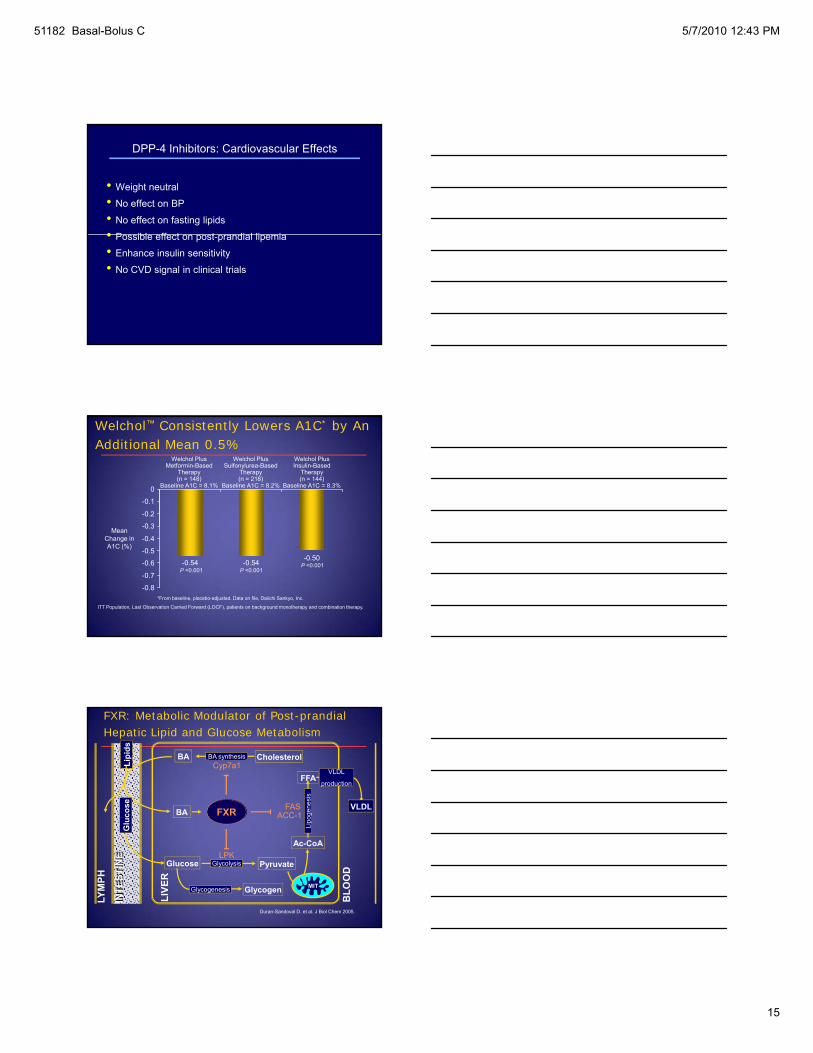
DPP-4 Inhibitors: Cardiovascular Effects
• Weight neutral
• No effect on BP
• No effect on fasting lipids
• P ibl ff t t di l li i• Possible effect on post-prandial lipemia
• Enhance insulin sensitivity
• No CVD signal in clinical trials
0 3
-0.2
-0.1
0
Welchol™ Consistently Lowers A1C* by An Additional Mean 0.5%
Welchol PlusMetformin-Based
Therapy(n = 148)
Baseline A1C = 8.1%
Welchol PlusSulfonylurea-Based
Therapy(n = 218)
Baseline A1C = 8.2%
Welchol PlusInsulin-Based
Therapy(n = 144)
Baseline A1C = 8.3%
-0.50-0.54-0.54
-0.8
-0.7
-0.6
-0.5
-0.4
-0.3
*From baseline, placebo-adjusted. Data on file, Daiichi Sankyo, Inc.
ITT Population, Last Observation Carried Forward (LOCF), patients on background monotherapy and combination therapy.
P <0.001P <0.001
P <0.001
Mean Change in A1C (%)
CholesterolBA synthesis
FXR
Cyp7a1
FASACC-1 og
enes
is
BA
BA
cose
Lipi
ds
FFAVLDL
production
VLDL
FXR: Metabolic Modulator of Post-prandial Hepatic Lipid and Glucose Metabolism
Pyruvate
Glycogen
Glycolysis
Glycogenesis
BLO
OD
LPK
ACC 1
Ac-CoA
Lipo
MIT
Glucose
INTE
STIN
EG
lu
LYM
PH
LIVE
R
Duran-Sandoval D. et al. J Biol Chem 2005.
51182 Basal-Bolus C 5/7/2010 12:43 PM
16
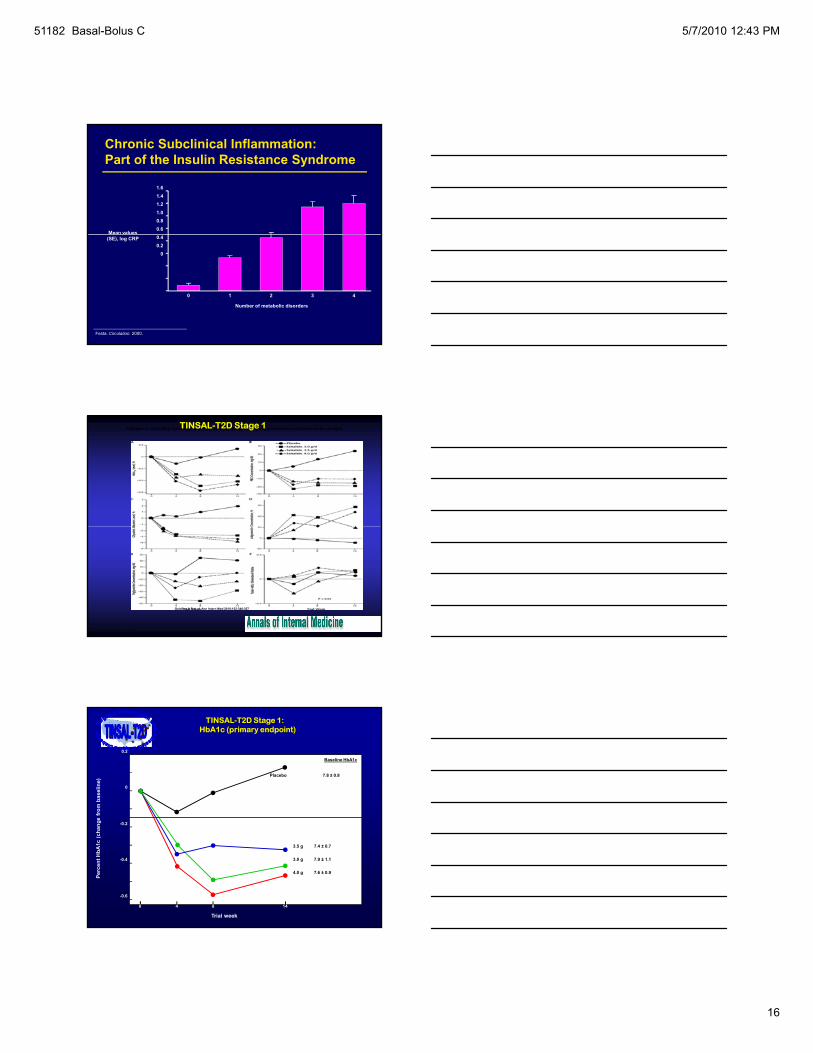
1.61.41.21.00.80.6
Mean values
Chronic Subclinical Inflammation:Part of the Insulin Resistance Syndrome
Festa. Circulation. 2000.
0.40.2
0
(SE), log CRP
Number of metabolic disorders
0 1 2 3 4
Changes in circulating metabolic measures, by study group.All data are provided as unadjusted mean changes.TINSAL-T2D Stage 1
Goldfine A B et al. Ann Intern Med 2010;152:346-357
©2010 by American College of Physicians
e fr
om b
asel
ine)
0
Baseline HbA1c
0.2
7.8 ± 0.8Placebo
TINSAL-T2D Stage 1: HbA1c (primary endpoint)
Perc
ent H
bA1c
(cha
nge
3.5 g 7.4 ± 0.7
3.0 g 7.9 ± 1.1
4.0 g 7.6 ± 0.9
-0.4
-0.6
-0.2
140 4 8
Trial week
51182 Basal-Bolus C 5/7/2010 12:43 PM
17
SUMMARY
TYPE 2 DIABETES IS A COMPLEX DISEASE
MULTIPLE NEW TARGETS FOR TYPE 2 DIABETESMULTIPLE NEW TARGETS FOR TYPE 2 DIABETES
WHICH TREATMENT WILL PROVIDE VALUE?