Embed Size (px)
Citation preview
Non-Life Insurance Pricing using RDeploying advanced analytics in the Insurance industry
64 Squares and CYBAEASuresh Gangam ([email protected])Allan Engelhardt ([email protected])
11 July 2013 Copyright © 2013 CYBAEA Limited (www.cybaea.net) and 64 Squares (www.64sqs.com). 2
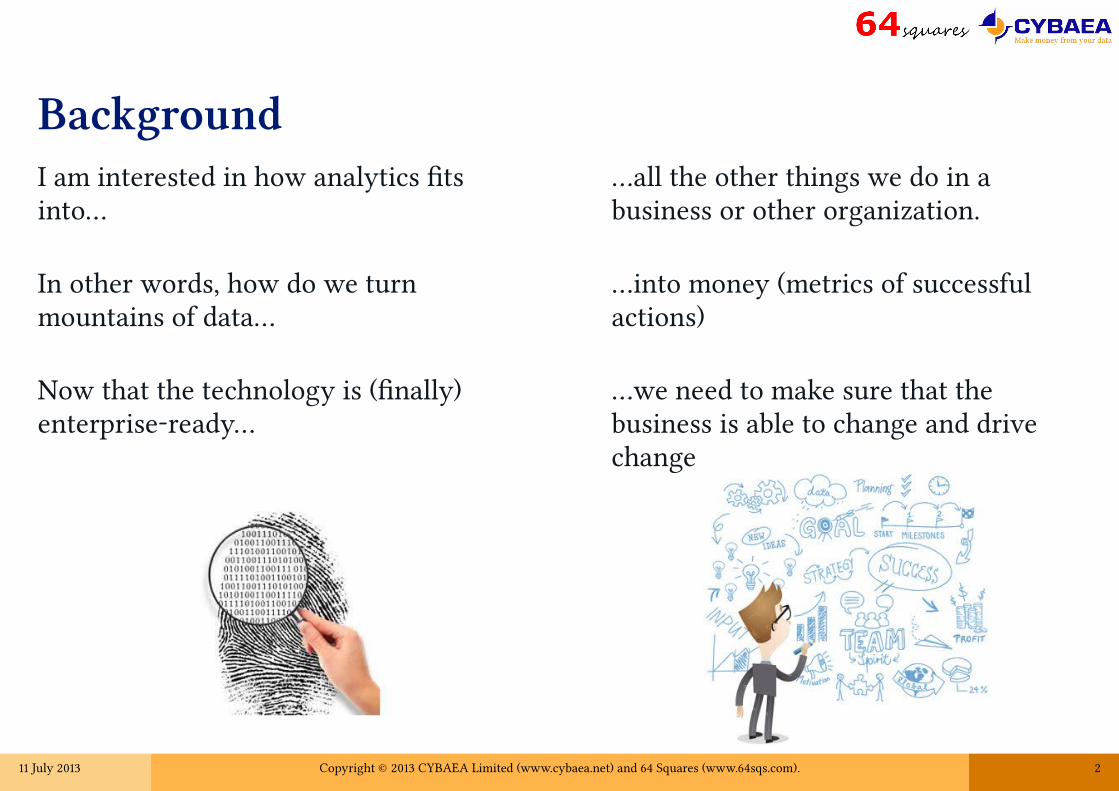
I am interested in how analytics fts into…
In other words, how do we turn mountains of data…
Now that the technology is (fnally) enterprise-ready…
…all the other things we do in a business or other organization.
…into money (metrics of successful actions)
…we need to make sure that the business is able to change and drive change
Background
11 July 2013 Copyright © 2013 CYBAEA Limited (www.cybaea.net) and 64 Squares (www.64sqs.com). 4
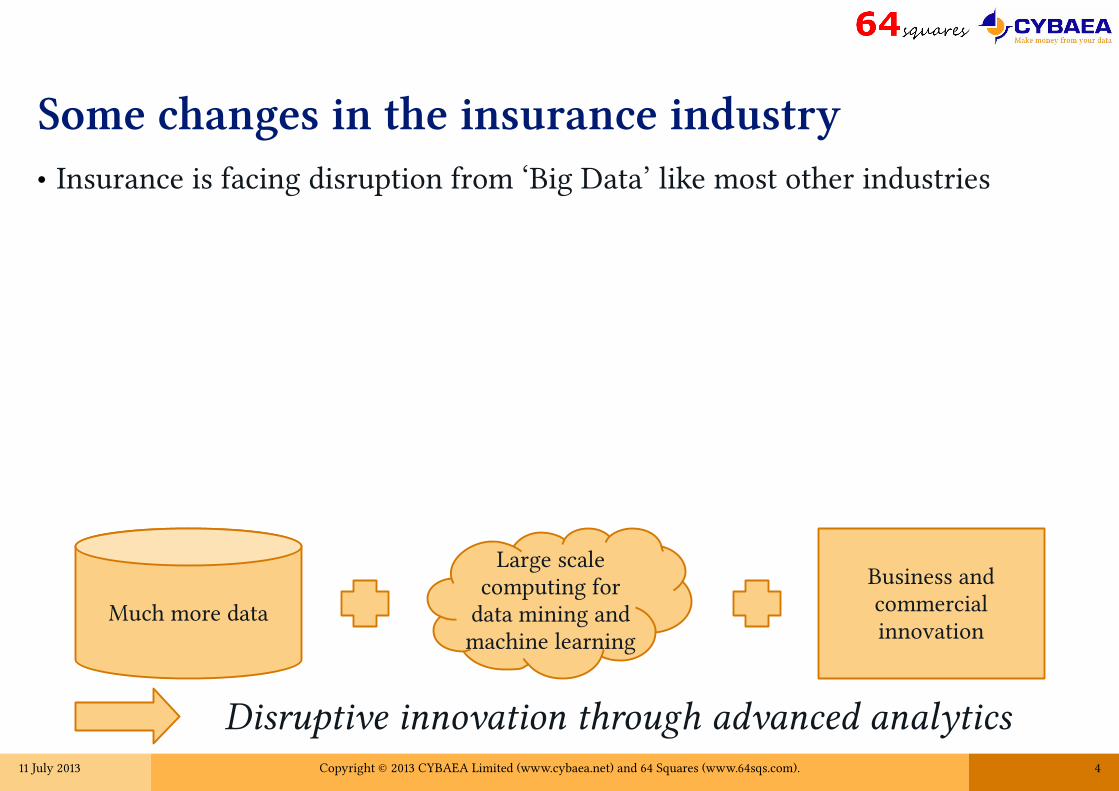
Some changes in the insurance industry● Insurance is facing disruption from ‘Big Data’ like most other industries
Much more data
Business and commercial innovation
Large scale computing for
data mining and machine learning
Disruptive innovation through advanced analytics
11 July 2013 Copyright © 2013 CYBAEA Limited (www.cybaea.net) and 64 Squares (www.64sqs.com). 5
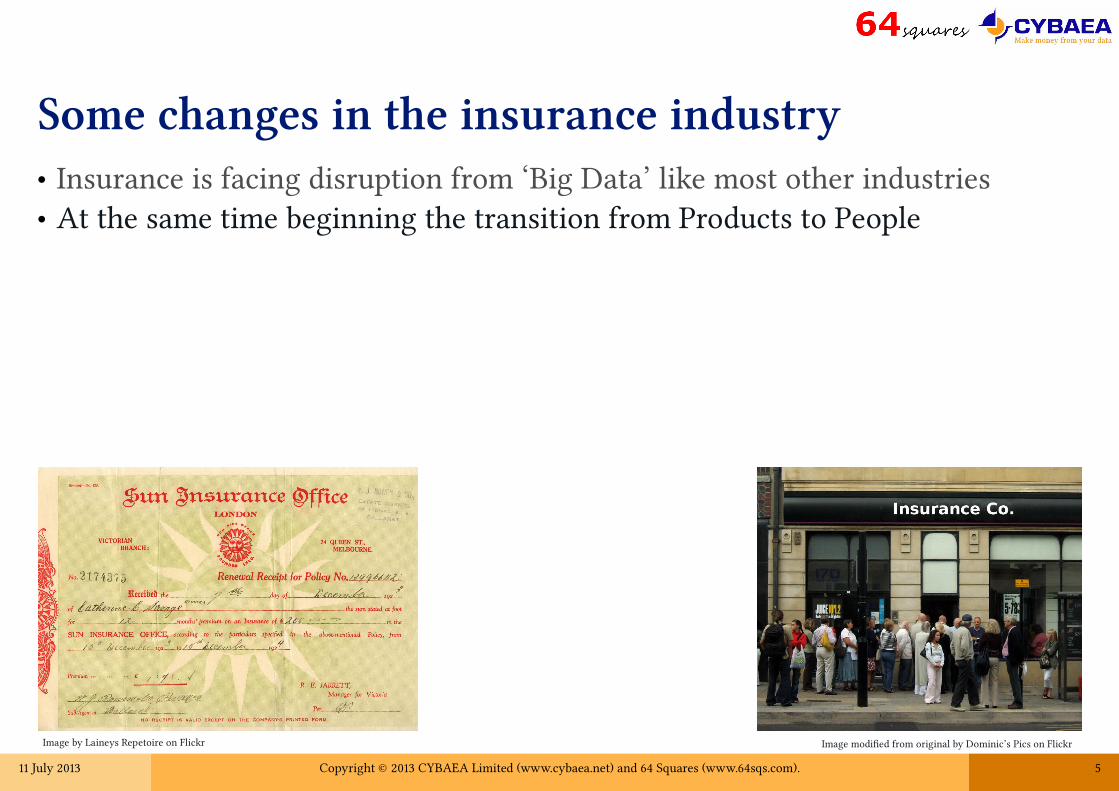
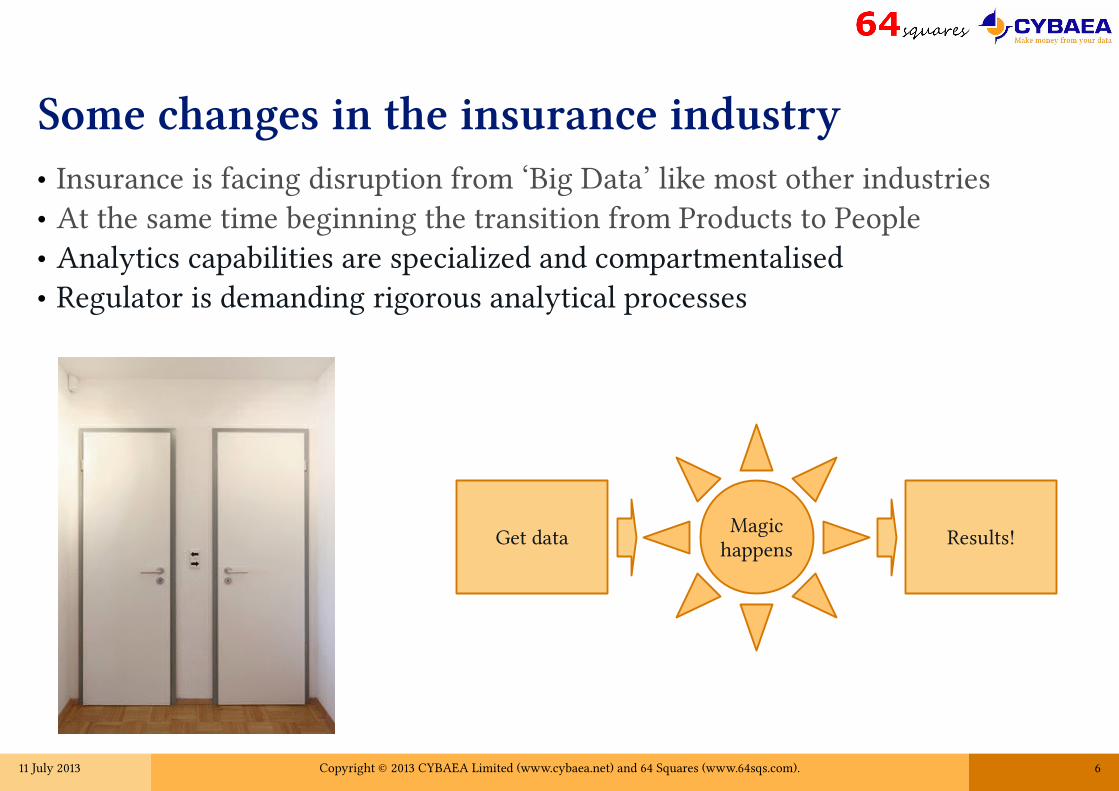
Some changes in the insurance industry● Insurance is facing disruption from ‘Big Data’ like most other industries● At the same time beginning the transition from Products to People
Image by Laineys Repetoire on Flickr Image modifed from original by Dominic’s Pics on Flickr
11 July 2013 Copyright © 2013 CYBAEA Limited (www.cybaea.net) and 64 Squares (www.64sqs.com). 6
Some changes in the insurance industry● Insurance is facing disruption from ‘Big Data’ like most other industries● At the same time beginning the transition from Products to People● Analytics capabilities are specialized and compartmentalised● Regulator is demanding rigorous analytical processes
Get dataMagic
happens Results!
11 July 2013 Copyright © 2013 CYBAEA Limited (www.cybaea.net) and 64 Squares (www.64sqs.com). 7
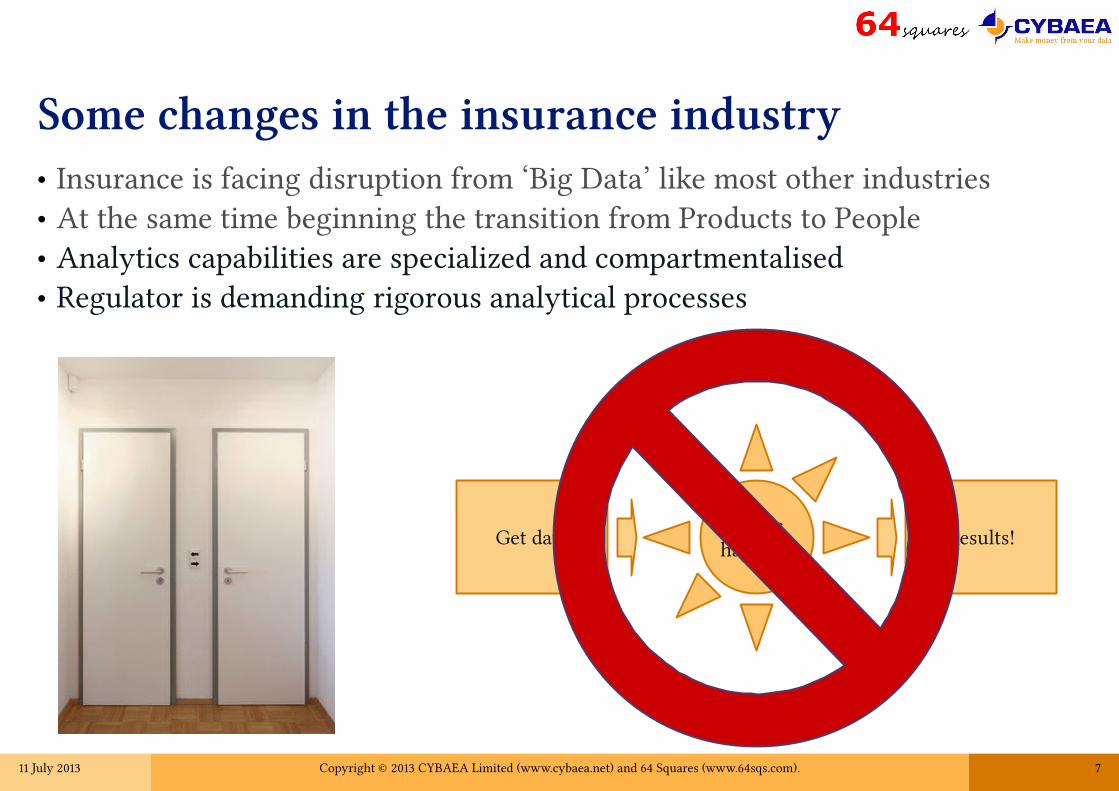
Some changes in the insurance industry● Insurance is facing disruption from ‘Big Data’ like most other industries● At the same time beginning the transition from Products to People● Analytics capabilities are specialized and compartmentalised● Regulator is demanding rigorous analytical processes
Get dataMagic
happens Results!
11 July 2013 Copyright © 2013 CYBAEA Limited (www.cybaea.net) and 64 Squares (www.64sqs.com). 8
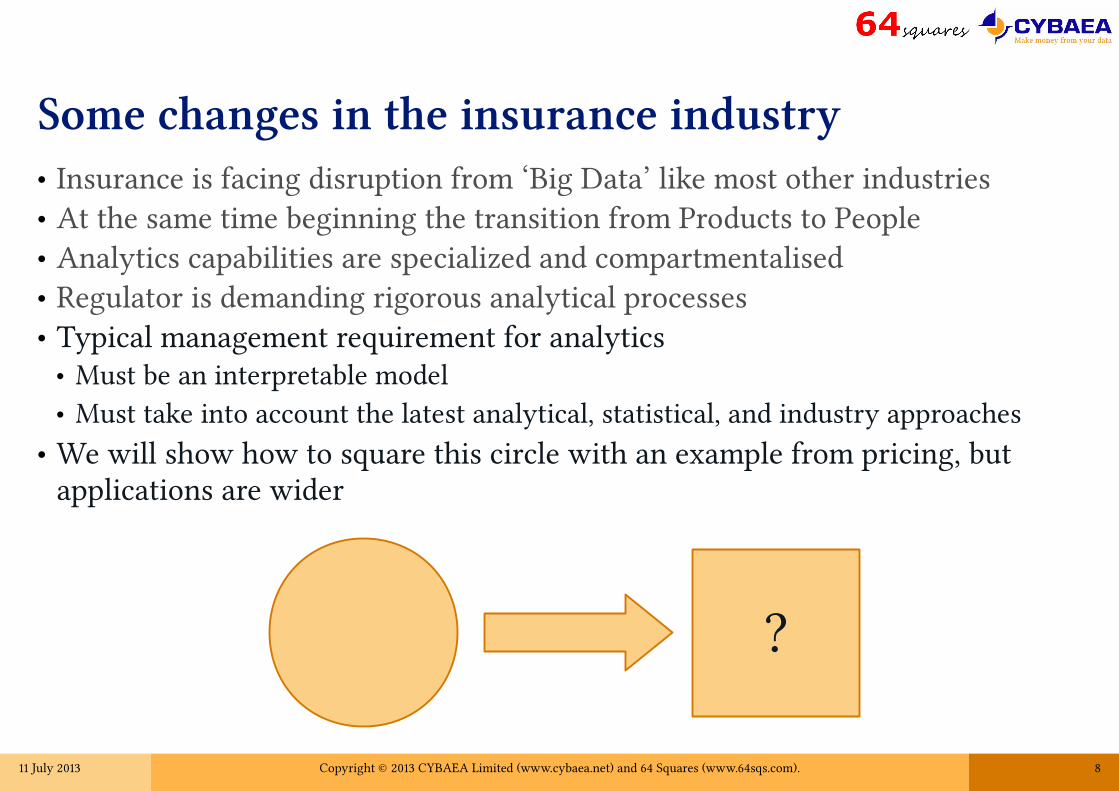
Some changes in the insurance industry● Insurance is facing disruption from ‘Big Data’ like most other industries● At the same time beginning the transition from Products to People● Analytics capabilities are specialized and compartmentalised● Regulator is demanding rigorous analytical processes● Typical management requirement for analytics
● Must be an interpretable model● Must take into account the latest analytical, statistical, and industry approaches
● We will show how to square this circle with an example from pricing, but applications are wider
?

11 July 2013 Copyright © 2013 CYBAEA Limited (www.cybaea.net) and 64 Squares (www.64sqs.com). 9
Very brief introduction tonon-life insurance pricing● Te question we are considering is tarif analysis: how much to charge an
individual policyholder within an insurance portfolio (given an overall premium level for the book).
● Te usual approach is to model using generalized linear models (GLM) a number of key ratios as dependent on a set of rating factors.● For personal lines the key ratios are ofen claim frequency and claim severity (cost
per claim) while for commercial lines we may consider the loss ratio (claim costs per earned premium).
● Rating factors are grouped into classes (i.e. factor variables) and may include● Information about policyholder: age, gender, line of business, etc.● Information about the insured risk: age and model of car, type of building, etc.● Geographic and demographic information: population density, income levels, etc.
● A given value for the rating factors is called a tarif cell.
11 July 2013 Copyright © 2013 CYBAEA Limited (www.cybaea.net) and 64 Squares (www.64sqs.com). 10
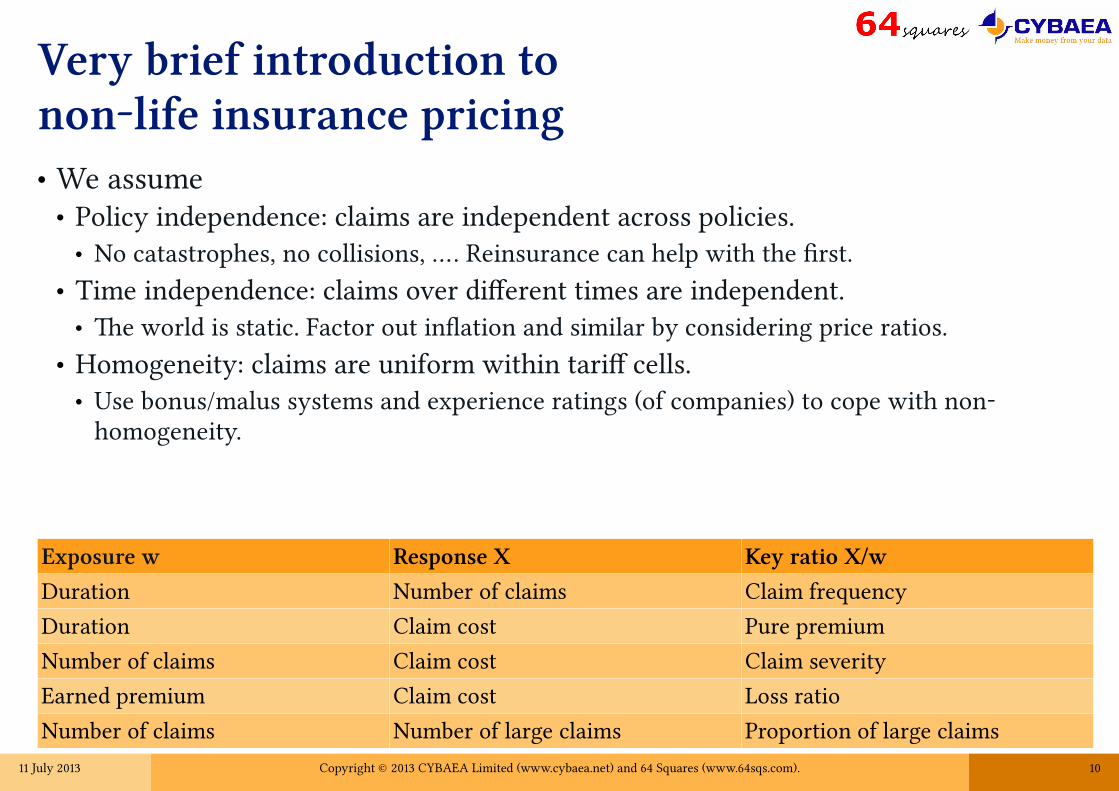
Very brief introduction tonon-life insurance pricing● We assume
● Policy independence: claims are independent across policies.● No catastrophes, no collisions, …. Reinsurance can help with the frst.
● Time independence: claims over diferent times are independent.● Te world is static. Factor out infation and similar by considering price ratios.
● Homogeneity: claims are uniform within tarif cells.● Use bonus/malus systems and experience ratings (of companies) to cope with non-
homogeneity.
Exposure w Response X Key ratio X/w
Duration Number of claims Claim frequency
Duration Claim cost Pure premium
Number of claims Claim cost Claim severity
Earned premium Claim cost Loss ratio
Number of claims Number of large claims Proportion of large claims
11 July 2013 Copyright © 2013 CYBAEA Limited (www.cybaea.net) and 64 Squares (www.64sqs.com). 11
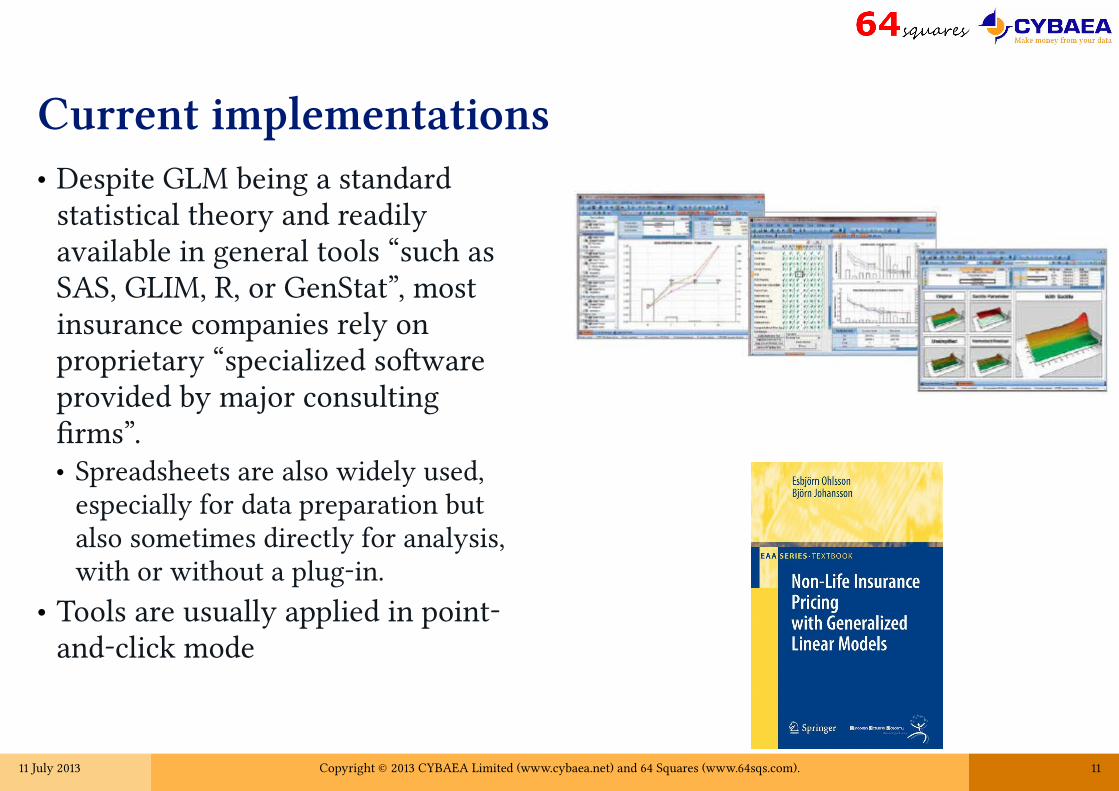
Current implementations● Despite GLM being a standard
statistical theory and readily available in general tools “such as SAS, GLIM, R, or GenStat”, most insurance companies rely on proprietary “specialized sofware provided by major consulting frms”.● Spreadsheets are also widely used,
especially for data preparation but also sometimes directly for analysis, with or without a plug-in.
● Tools are usually applied in point-and-click mode
11 July 2013 Copyright © 2013 CYBAEA Limited (www.cybaea.net) and 64 Squares (www.64sqs.com). 12
Some challenges● Not integrated with anything else and yet pricing is one key component of the
overall data usage landscape● Moving from managing Products to People means more data sources, more data
types, and using diferent analytical approaches● ‘Big Data’ challenges demands integrated analytics across enterprise data and
including external data● Difcult to extend the modelling approaches
● Only does one thing● What about the “take into account the latest ... approaches” requirement?
● Difcult to ensure reproducible results● Tere are some support in commercial tools, but if it is point and click with Excel
front and back then not easy
11 July 2013 Copyright © 2013 CYBAEA Limited (www.cybaea.net) and 64 Squares (www.64sqs.com). 13
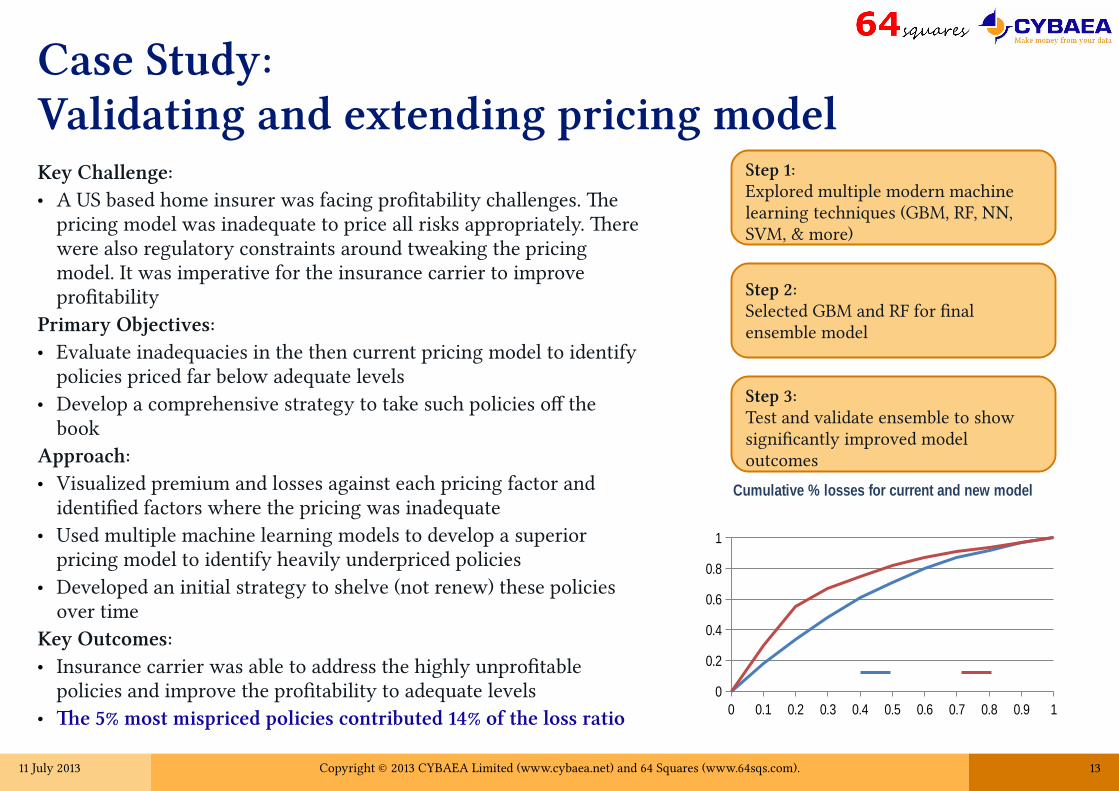
Case Study:Validating and extending pricing modelKey Challenge:● A US based home insurer was facing proftability challenges. Te
pricing model was inadequate to price all risks appropriately. Tere were also regulatory constraints around tweaking the pricing model. It was imperative for the insurance carrier to improve proftability
Primary Objectives:● Evaluate inadequacies in the then current pricing model to identify
policies priced far below adequate levels● Develop a comprehensive strategy to take such policies of the
bookApproach:● Visualized premium and losses against each pricing factor and
identifed factors where the pricing was inadequate● Used multiple machine learning models to develop a superior
pricing model to identify heavily underpriced policies● Developed an initial strategy to shelve (not renew) these policies
over timeKey Outcomes:● Insurance carrier was able to address the highly unproftable
policies and improve the proftability to adequate levels● Te 5% most mispriced policies contributed 14% of the loss ratio 0 0.1 0.2 0.3 0.4 0.5 0.6 0.7 0.8 0.9 1
0
0.2
0.4
0.6
0.8
1
Cumulative % losses for current and new model
Step 1:Explored multiple modern machine learning techniques (GBM, RF, NN, SVM, & more)
Step 2:Selected GBM and RF for fnal ensemble model
Step 3:Test and validate ensemble to show signifcantly improved model outcomes
11 July 2013 Copyright © 2013 CYBAEA Limited (www.cybaea.net) and 64 Squares (www.64sqs.com). 14
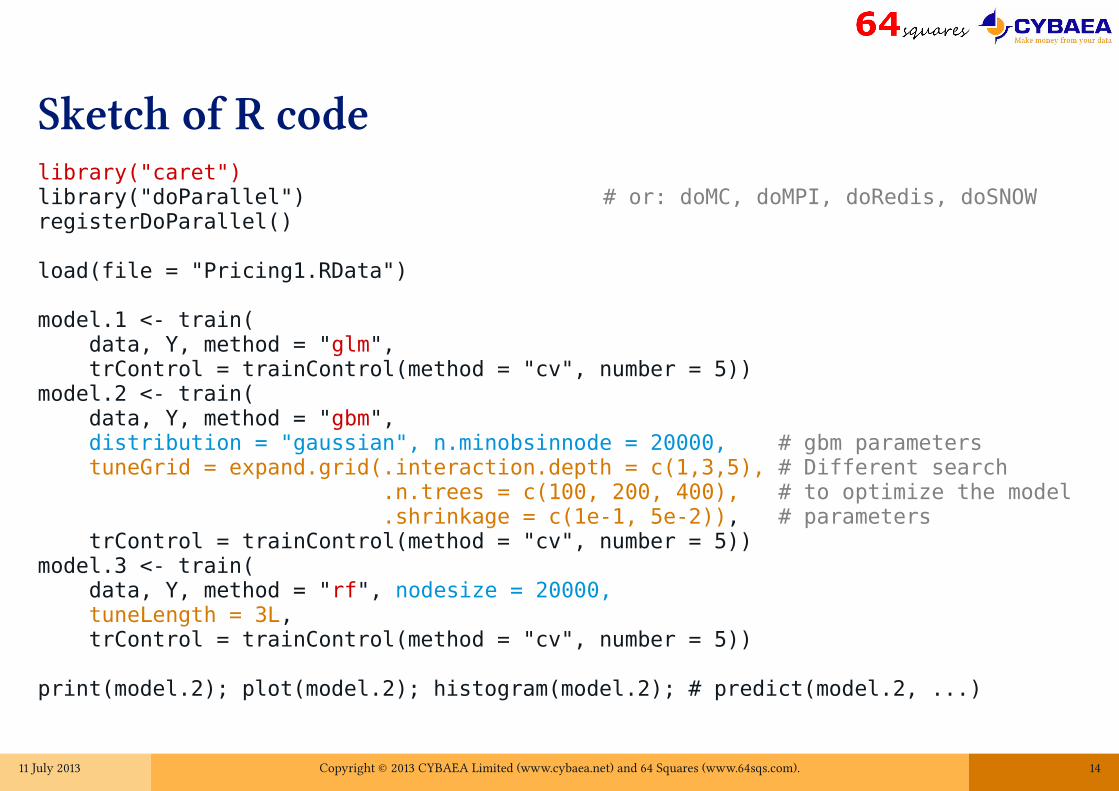
Sketch of R codelibrary("caret")library("doParallel") # or: doMC, doMPI, doRedis, doSNOWregisterDoParallel()
load(file = "Pricing1.RData")
model.1 <- train( data, Y, method = "glm", trControl = trainControl(method = "cv", number = 5))model.2 <- train( data, Y, method = "gbm", distribution = "gaussian", n.minobsinnode = 20000, # gbm parameters tuneGrid = expand.grid(.interaction.depth = c(1,3,5), # Different search .n.trees = c(100, 200, 400), # to optimize the model .shrinkage = c(1e-1, 5e-2)), # parameters trControl = trainControl(method = "cv", number = 5))model.3 <- train( data, Y, method = "rf", nodesize = 20000, tuneLength = 3L, trControl = trainControl(method = "cv", number = 5))
print(model.2); plot(model.2); histogram(model.2); # predict(model.2, ...)
11 July 2013 Copyright © 2013 CYBAEA Limited (www.cybaea.net) and 64 Squares (www.64sqs.com). 15
What we gained from R● Robust process that is almost trivial to extend to diferent modelling
approaches● Tank you Max Kuhn and caret
● Perfectly reproducible models by creating and saving virtual image ● Scriptable language is a key● Open source is probably essential for this approach
● A general language and tool that applies across the enterprise● Archive data warehouse (Greenplum, Oracle Data Appliance, Teradata Aster, ...)● Real-time data store (SAP HANA)● Enterprise data bus (supposedly coming at some point)● “Model factory” (R, Revolutions, …, or in the data warehouse)● Dashboards (Tibco Spotfre, Shiny), and reports (R)● Interactive analytics (R, Revolutions, R Studio, SPSS, …)● Real-time decisioning (uhm., sort of—but not completely there…)
11 July 2013 Copyright © 2013 CYBAEA Limited (www.cybaea.net) and 64 Squares (www.64sqs.com). 16
Our approach in summary1. Supplement the existing model approach with more modern techniques
● Restrict the validity domain of the classical model
● Create new variables inspired by new model that extends the validity of the old
● Easy to extend model to consider continuous rating factors and longitudinal data● Tough you may need to reshape
your input data
11 July 2013 Copyright © 2013 CYBAEA Limited (www.cybaea.net) and 64 Squares (www.64sqs.com). 17
Our approach in summary2. Tis enables incremental business change
● Risk we do not understand and therefore will not insure
● Understanding complex risk● Creating new variables for GLM● Consider GAM, GLMM, and beyond
11 July 2013 Copyright © 2013 CYBAEA Limited (www.cybaea.net) and 64 Squares (www.64sqs.com). 18
Our approach in summary3. Use as a stepping stone to a more data-driven enterprise (“Big Data”)
● Keep models reproducible and refreshed by using an appropriate language (instead of point-and-click) on a suitable infrastructure (cloud)
● Establish the processes and teams around regular model refresh (“model factory”)
● Extend the models to customer view: per customer proftability and pricing (and other activities) impact on loyalty & deploy customer centric models widely
● Tie in channel performance and sales/marketing campaigns
● And you are nearly there: Keep showing value at each incremental step
11 July 2013 Copyright © 2013 CYBAEA Limited (www.cybaea.net) and 64 Squares (www.64sqs.com). 19
Our approach in summary1.
Supplement the existing model
2.Aim for incremental business change
3.Use incremental change as stepping stones, delivering value at each step

11 July 2013 Copyright © 2013 CYBAEA Limited (www.cybaea.net) and 64 Squares (www.64sqs.com). 20
Thank you!I hope this whas useful.Qestions? Comments?