Embed Size (px)
Citation preview

Chapter 7
Nonlinear Relationships
Prepared by Vera Tabakova, East Carolina University
Chapter 7: Nonlinear Relationships
7.1 Polynomials
7.2 Dummy Variables
7.3 Applying Dummy Variables
7.4 Interactions Between Continuous Variables
7.5 Log-Linear Models
Slide 7-2Principles of Econometrics, 3rd Edition
7.1 Polynomials
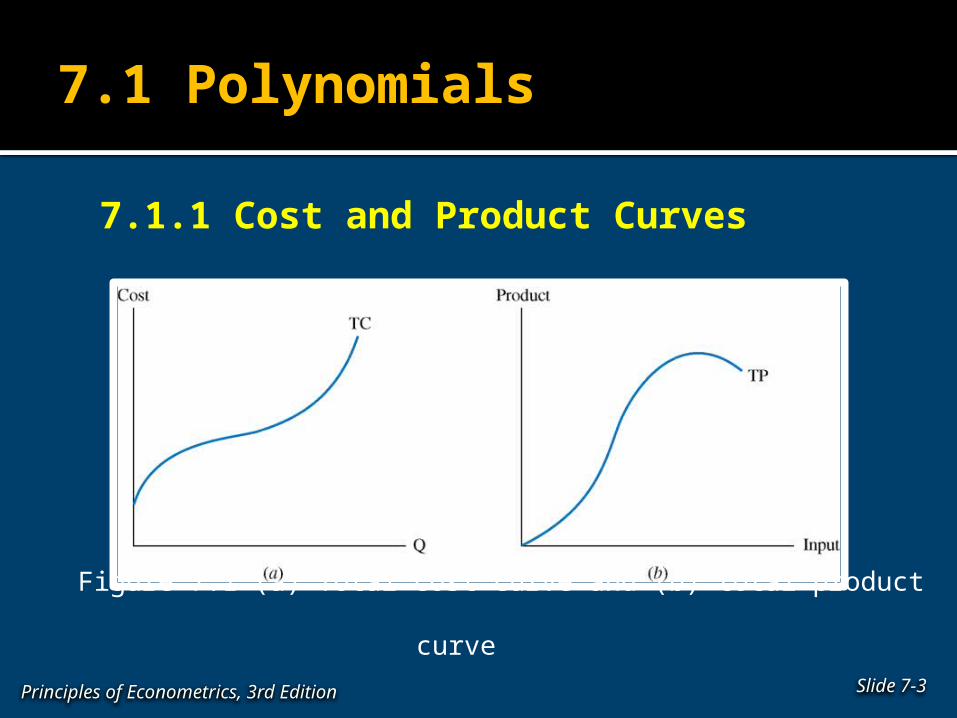
7.1.1 Cost and Product Curves
Figure 7.1 (a) Total cost curve and (b) total product curve
Slide 7-3Principles of Econometrics, 3rd Edition
7.1 Polynomials
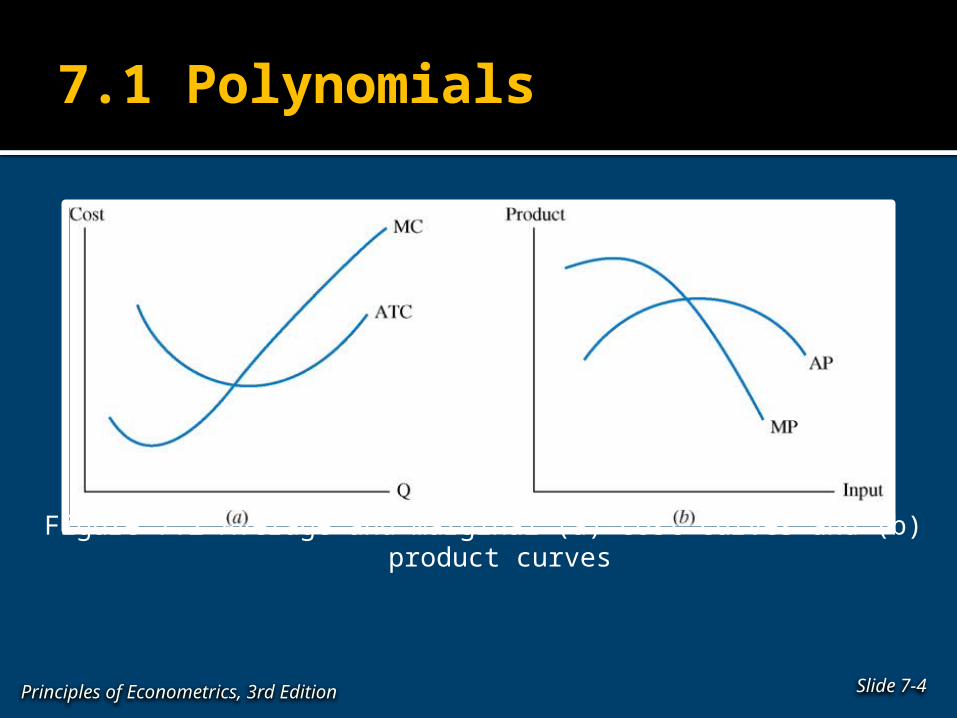
Figure 7.2 Average and marginal (a) cost curves and (b) product curves
Slide 7-4Principles of Econometrics, 3rd Edition
7.1 Polynomials
Slide 7-5Principles of Econometrics, 3rd Edition
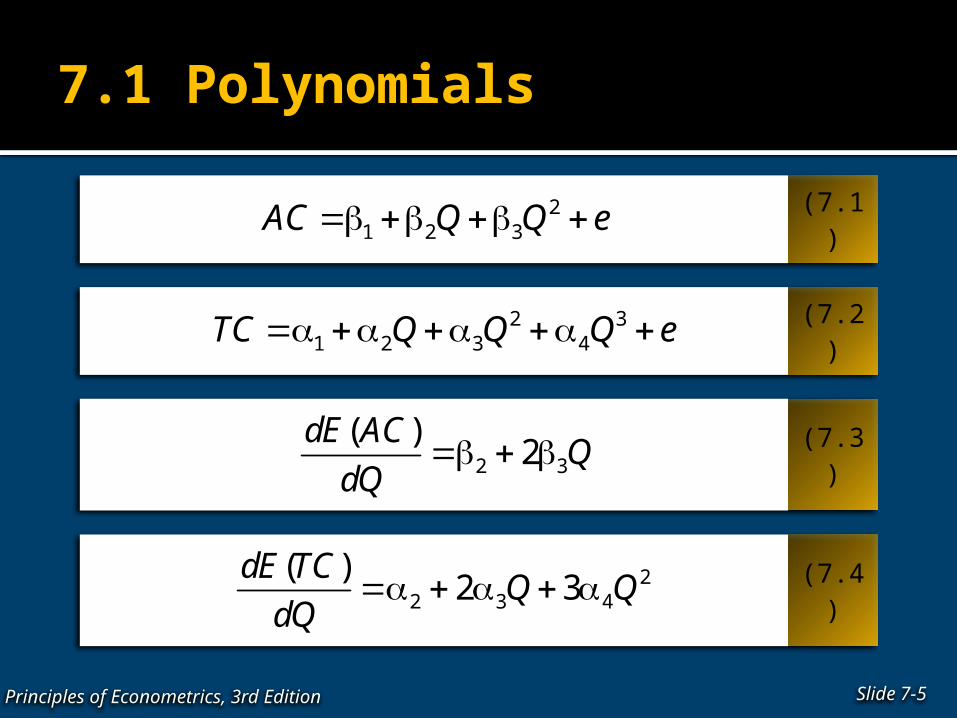
(7.1)
(7.2)
(7.3)
21 2 3AC Q Q e
2 31 2 3 4TC Q Q Q e
2 3
( )2
dE ACQ
dQ
(7.4)2
2 3 4
( )2 3
dE TCQ Q
dQ
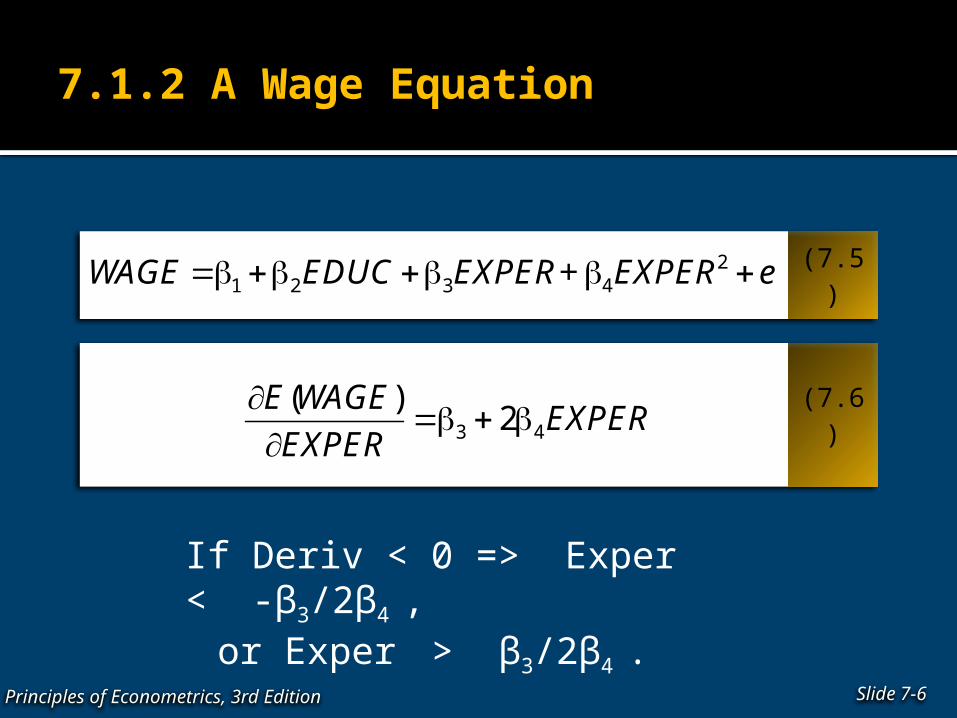
7.1.2 A Wage Equation
Slide 7-6Principles of Econometrics, 3rd Edition
(7.5)
(7.6)
1 2 3WAGE EDUC EXPER+ EXPER e 24
3 4
( )2
E WAGEEXPER
EXPER
If Deriv < 0 => Exper < -β3/2β4 , or Exper > β3/2β4 .
7.1.2 A Wage Equation
Slide 7-7Principles of Econometrics, 3rd Edition
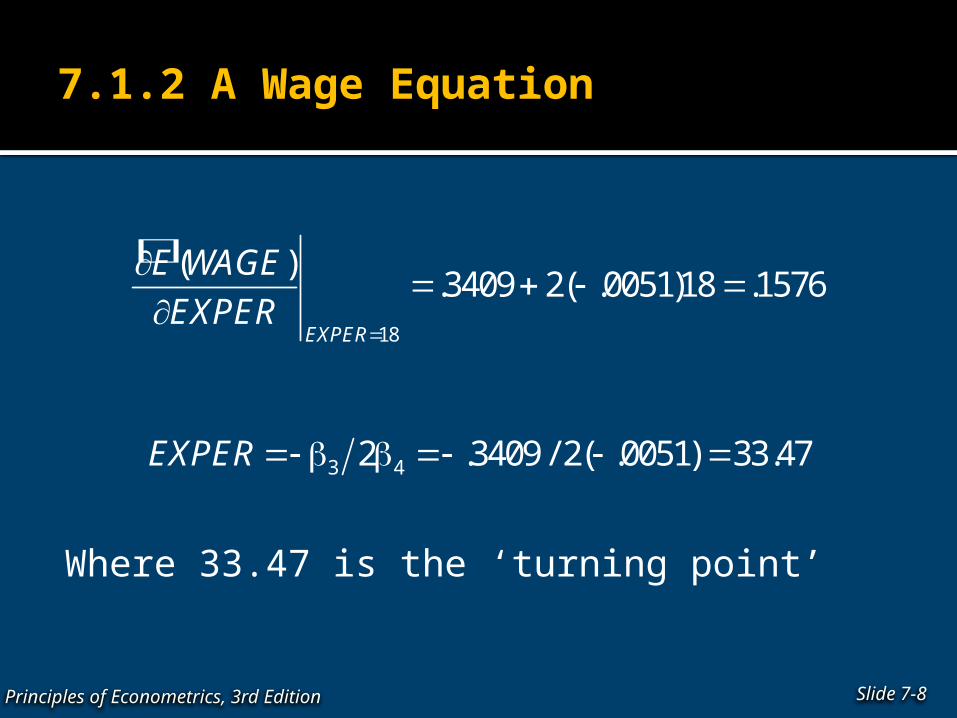
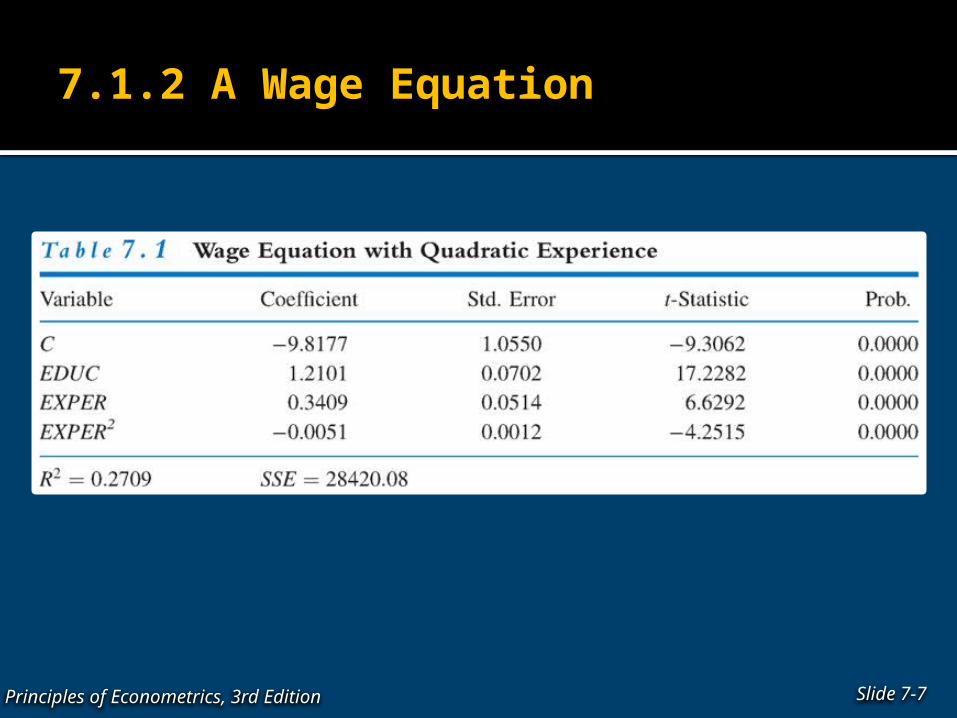
7.1.2 A Wage Equation
Slide 7-8Principles of Econometrics, 3rd Edition
18
( ).3409 2( .0051)18 .1576
EXPER
E WAGE
EXPER
3 42 .3409 / 2( .0051) 33.47EXPER
Where 33.47 is the ‘turning point’
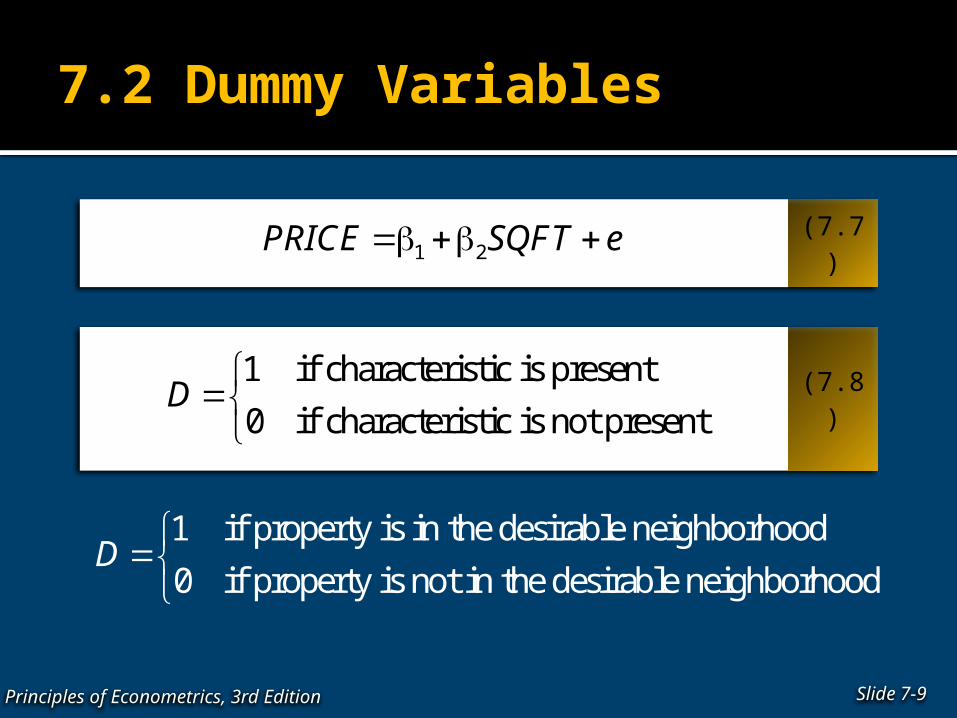
7.2 Dummy Variables
Slide 7-9Principles of Econometrics, 3rd Edition
(7.7)
(7.8)
1 2PRICE SQFT e
1 if characteristic is present
0 if characteristic is not presentD
1 if property is in the desirable neighborhood
0 if property is not in the desirable neighborhoodD
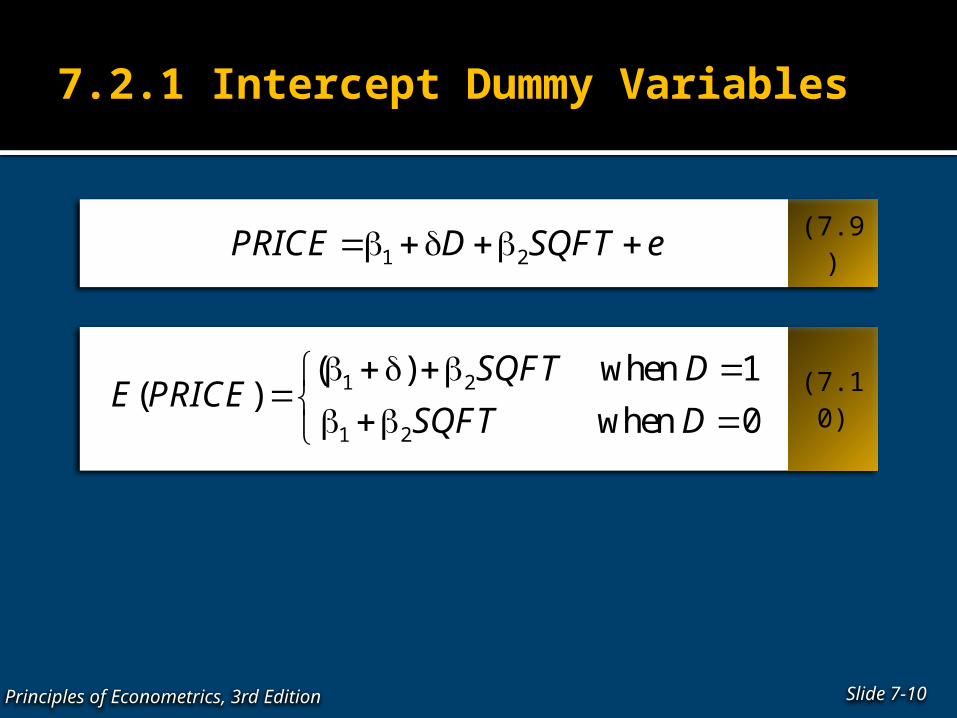
7.2.1 Intercept Dummy Variables
Slide 7-10Principles of Econometrics, 3rd Edition
(7.9)
(7.10)
1 2PRICE D SQFT e
1 2
1 2
( ) when 1( )
when 0
SQFT DE PRICE
SQFT D
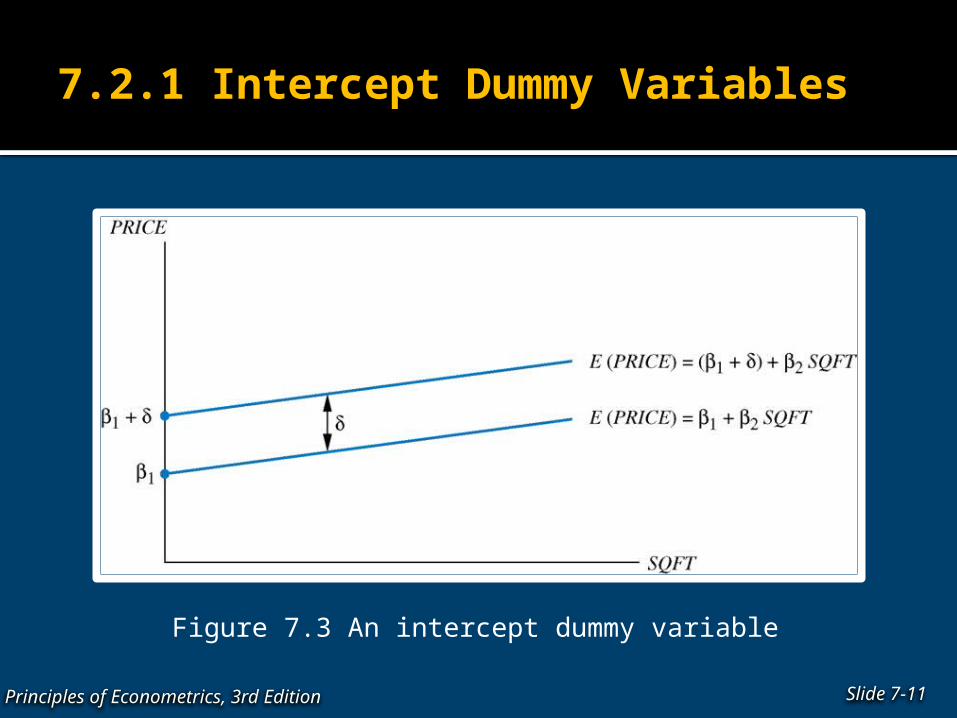
7.2.1 Intercept Dummy Variables
Figure 7.3 An intercept dummy variable
Slide 7-11Principles of Econometrics, 3rd Edition
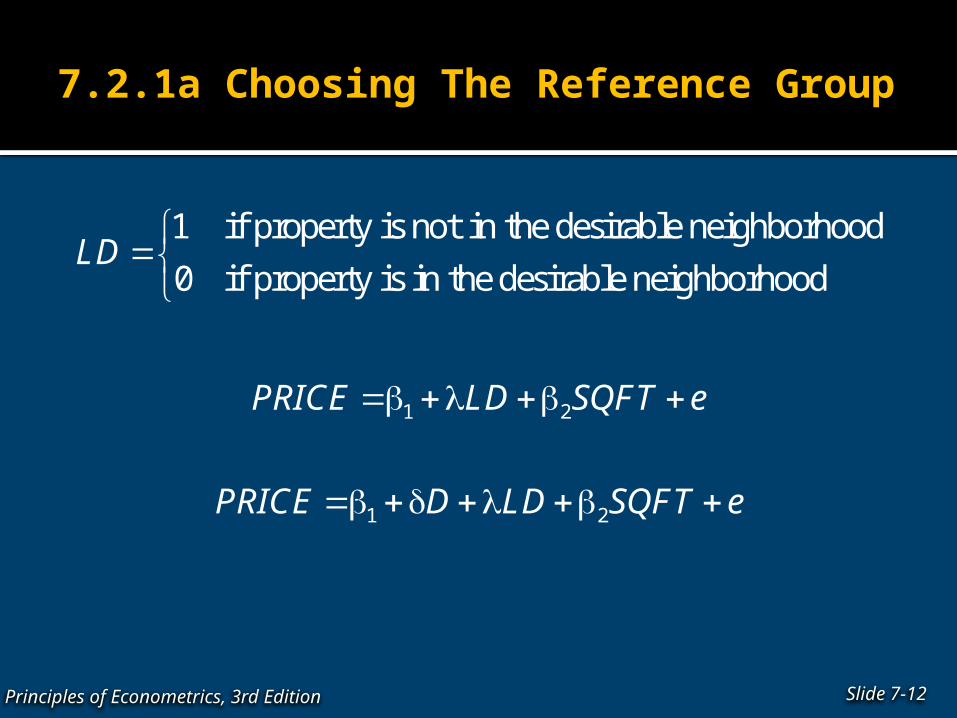
7.2.1a Choosing The Reference Group
Slide 7-12Principles of Econometrics, 3rd Edition
1 if property is not in the desirable neighborhood
0 if property is in the desirable neighborhoodLD
1 2PRICE LD SQFT e
1 2PRICE D LD SQFT e
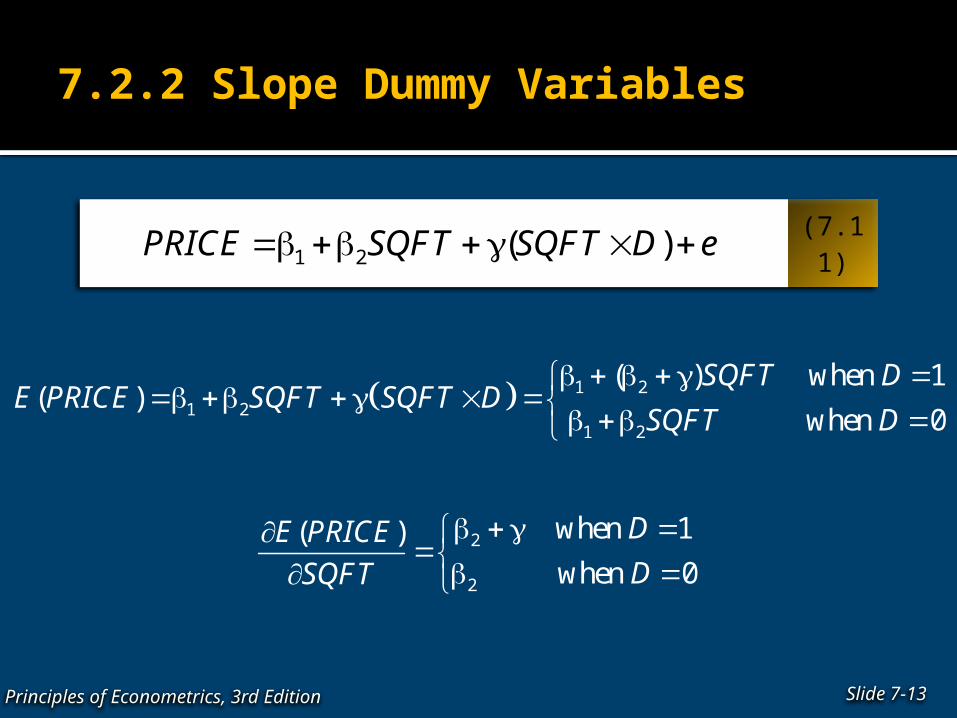
7.2.2 Slope Dummy Variables
Slide 7-13Principles of Econometrics, 3rd Edition
(7.11)1 2 ( )PRICE SQFT SQFT D e
1 21 2
1 2
( ) when 1( )
when 0
SQFT DE PRICE SQFT SQFT D
SQFT D
2
2
when 1 ( ) when 0
DE PRICEDSQFT
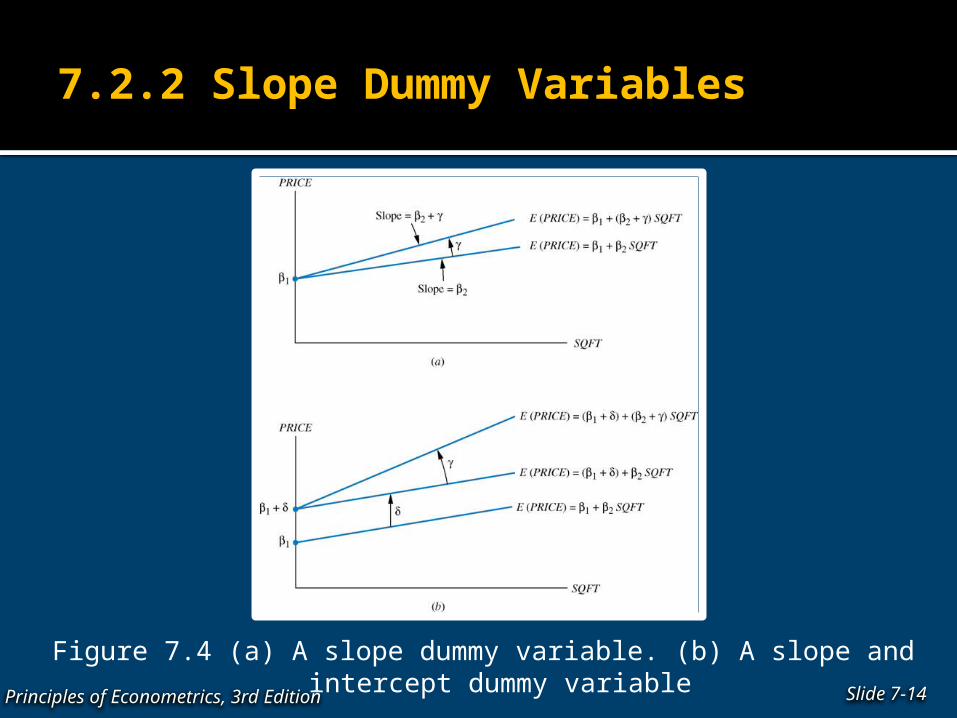
7.2.2 Slope Dummy Variables
Figure 7.4 (a) A slope dummy variable. (b) A slope and intercept dummy variable
Slide 7-14Principles of Econometrics, 3rd Edition
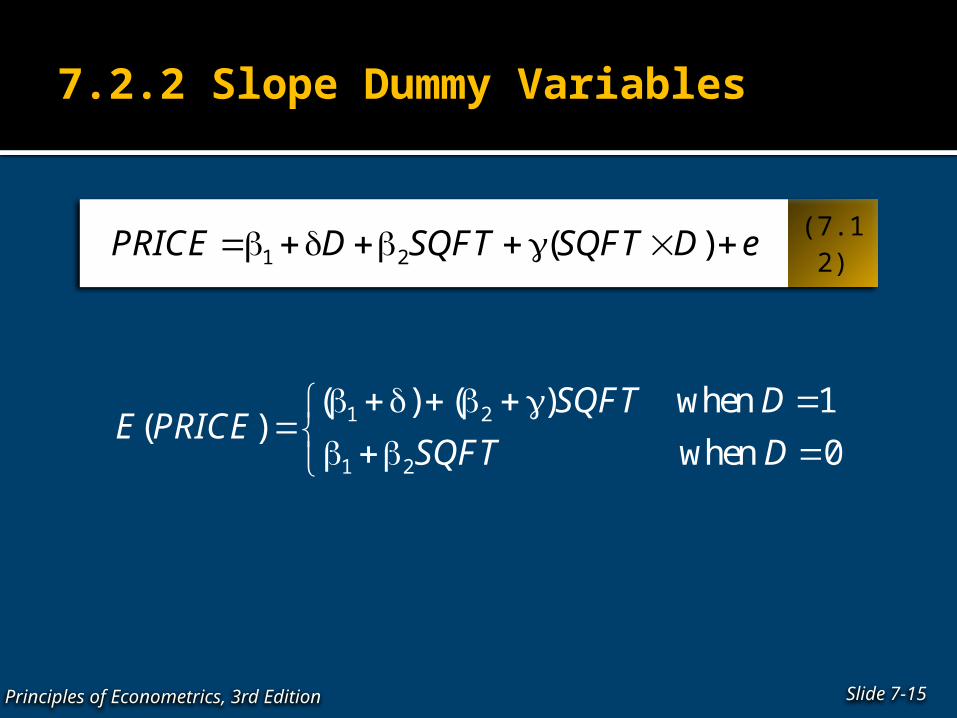
7.2.2 Slope Dummy Variables
Slide 7-15Principles of Econometrics, 3rd Edition
(7.12)1 2 ( )PRICE D SQFT SQFT D e
1 2
1 2
( ) ( ) when 1 ( )
when 0
SQFT DE PRICE
SQFT D
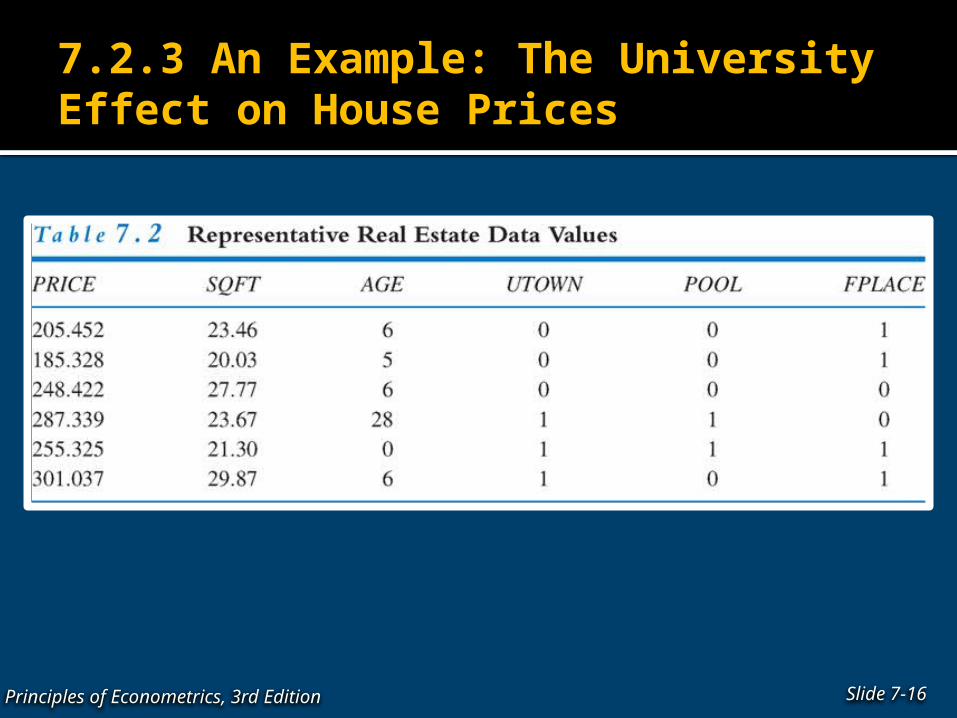
7.2.3 An Example: The University Effect on House Prices
Slide 7-16Principles of Econometrics, 3rd Edition
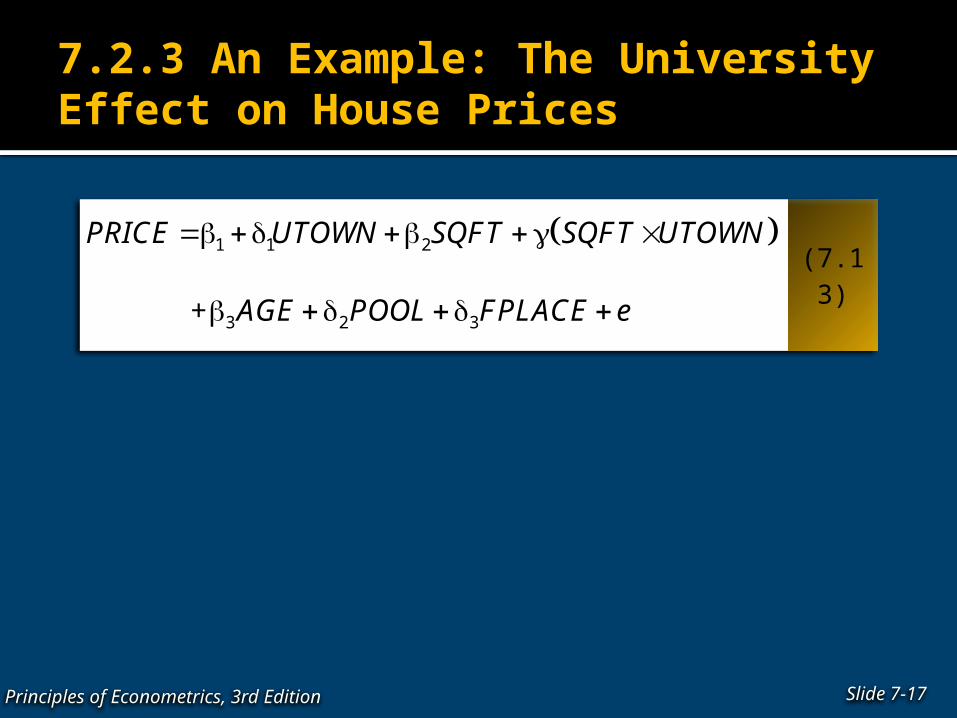
7.2.3 An Example: The University Effect on House Prices
Slide 7-17Principles of Econometrics, 3rd Edition
(7.13)
1 1 2
3 2 3 +
PRICE UTOWN SQFT SQFT UTOWN
AGE POOL FPLACE e
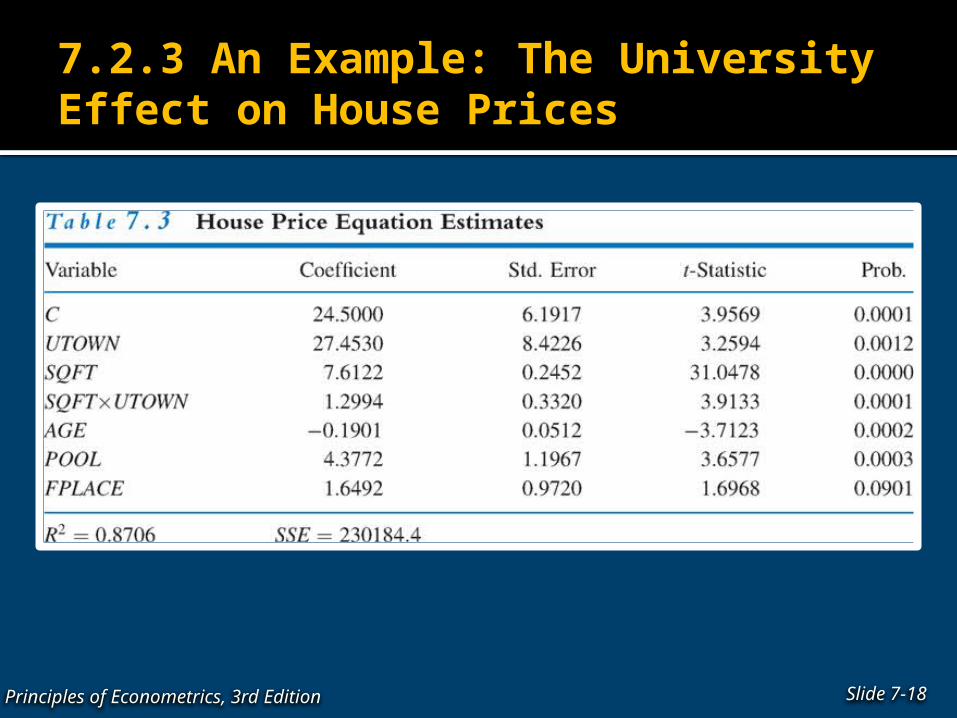
7.2.3 An Example: The University Effect on House Prices
Slide 7-18Principles of Econometrics, 3rd Edition
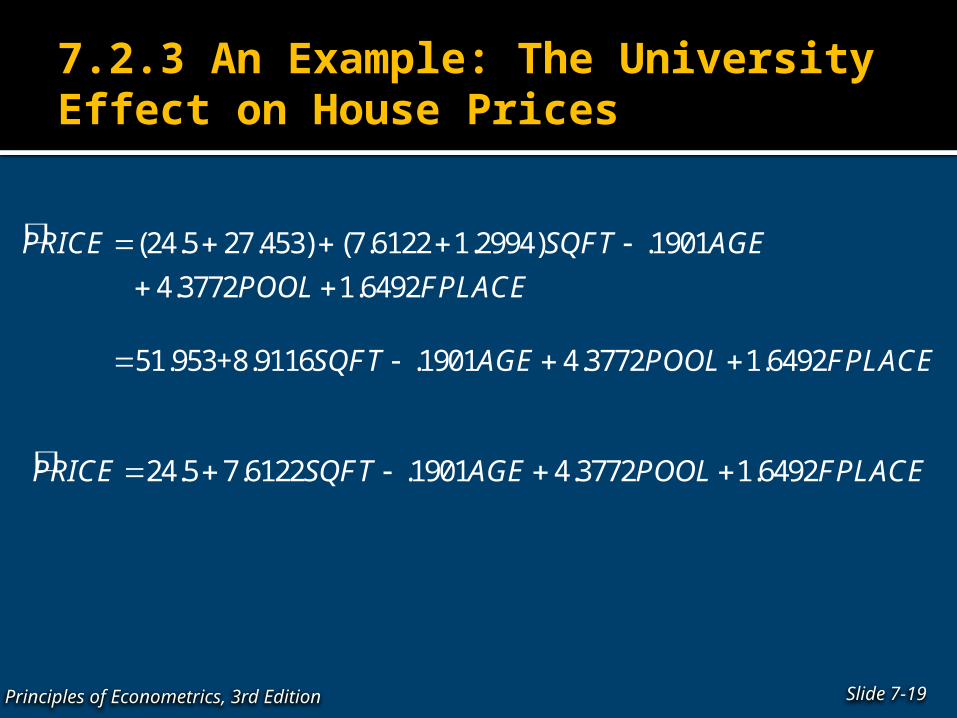
7.2.3 An Example: The University Effect on House Prices
Slide 7-19Principles of Econometrics, 3rd Edition
(24.5 27.453) (7.6122 1.2994) .1901
4.3772 1.6492
51.953+8.9116 .1901 4.3772 1.6492
PRICE SQFT AGE
POOL FPLACE
SQFT AGE POOL FPLACE
24.5 7.6122 .1901 4.3772 1.6492PRICE SQFT AGE POOL FPLACE
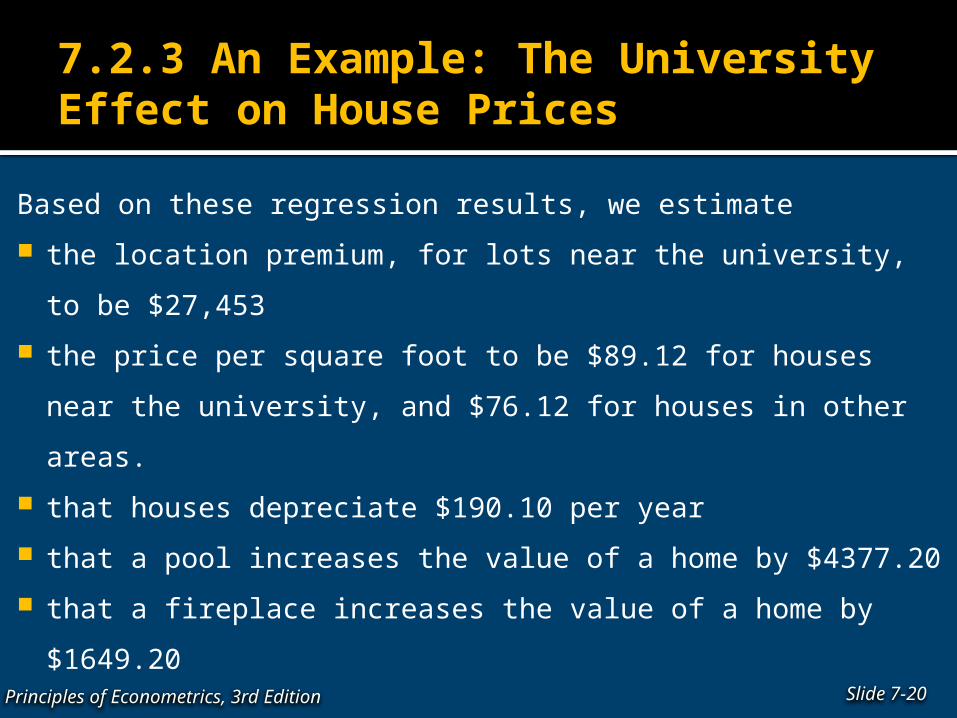
7.2.3 An Example: The University Effect on House Prices
Based on these regression results, we estimate
the location premium, for lots near the university, to be $27,453
the price per square foot to be $89.12 for houses near the university,
and $76.12 for houses in other areas.
that houses depreciate $190.10 per year
that a pool increases the value of a home by $4377.20
that a fireplace increases the value of a home by $1649.20
Slide 7-20Principles of Econometrics, 3rd Edition
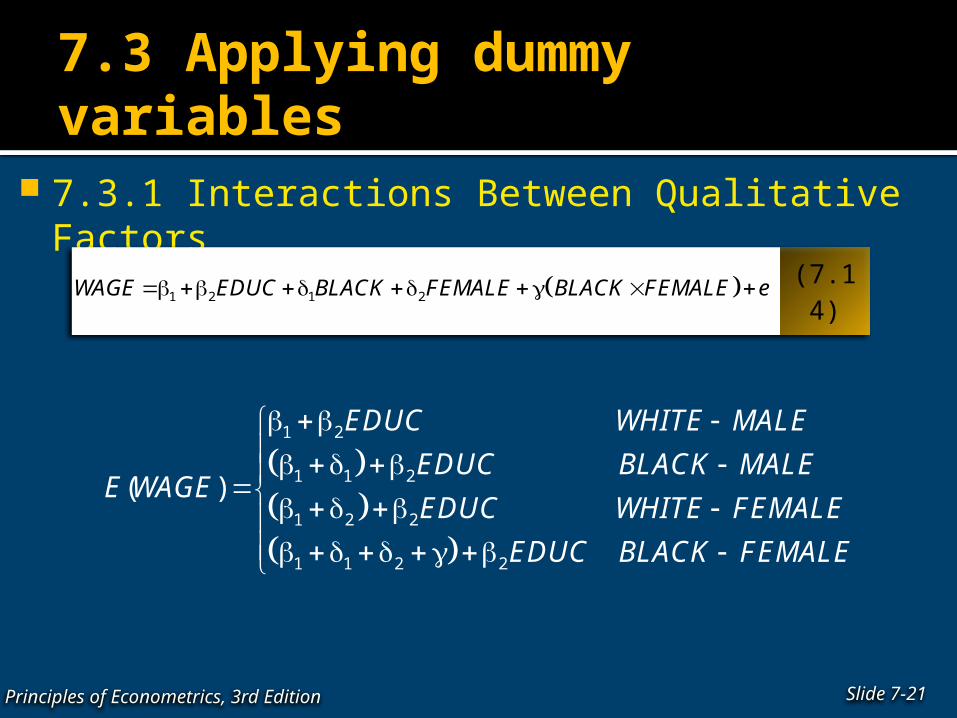
7.3 Applying dummy variables
7.3.1 Interactions Between Qualitative Factors
Slide 7-21Principles of Econometrics, 3rd Edition
(7.14) 1 2 1 2WAGE EDUC BLACK FEMALE BLACK FEMALE e
1 2
1 1 2
1 2 2
1 1 2 2
( )
EDUC WHITE MALE
EDUC BLACK MALEE WAGE
EDUC WHITE FEMALE
EDUC BLACK FEMALE
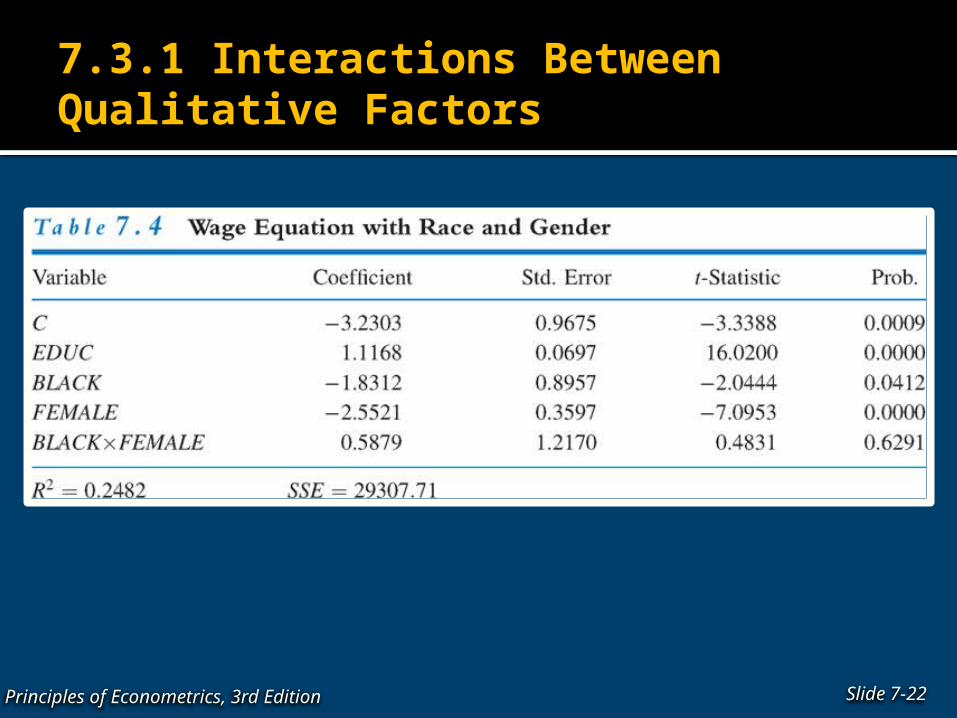
7.3.1 Interactions Between Qualitative Factors
Slide 7-22Principles of Econometrics, 3rd Edition
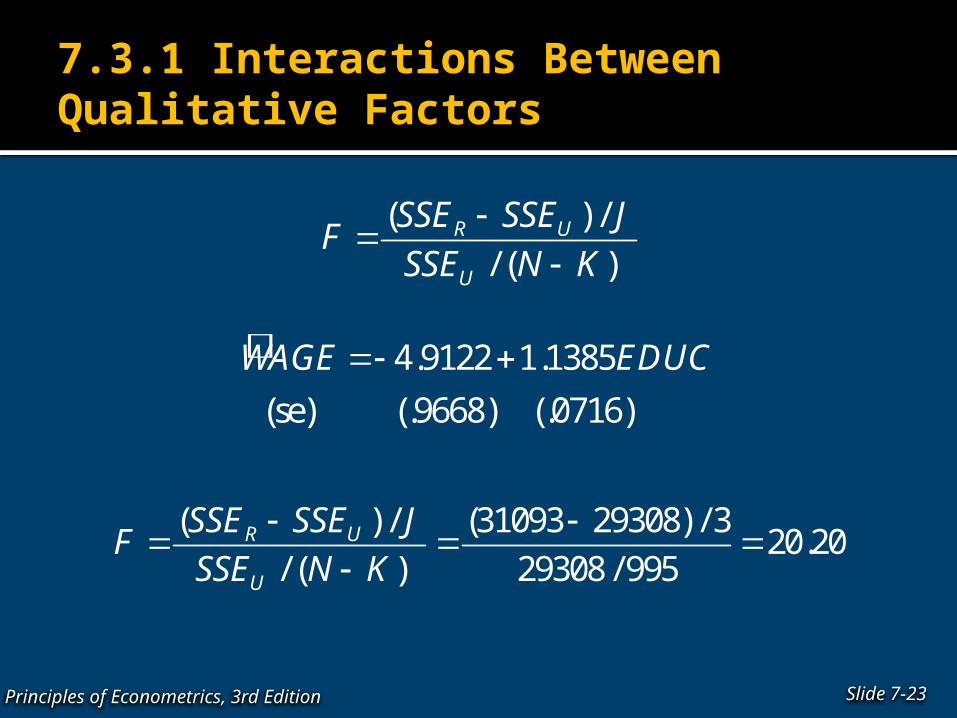
7.3.1 Interactions Between Qualitative Factors
Slide 7-23Principles of Econometrics, 3rd Edition
( ) /
/ ( )R U
U
SSE SSE JF
SSE N K
4.9122 1.1385
(se) (.9668) (.0716)
WAGE EDUC
( ) / (31093 29308) / 320.20
/ ( ) 29308 / 995R U
U
SSE SSE JF
SSE N K
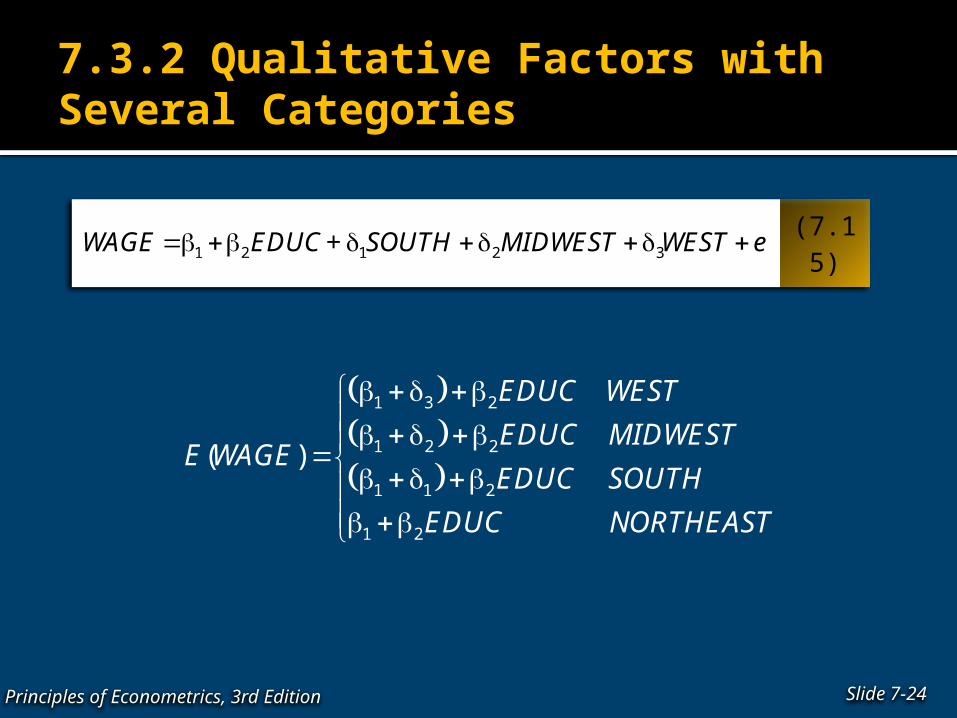
7.3.2 Qualitative Factors with Several Categories
Slide 7-24Principles of Econometrics, 3rd Edition
(7.15)1 2 1 2 3WAGE EDUC + SOUTH MIDWEST WEST e
1 3 2
1 2 2
1 1 2
1 2
( )
EDUC WEST
EDUC MIDWESTE WAGE
EDUC SOUTH
EDUC NORTHEAST
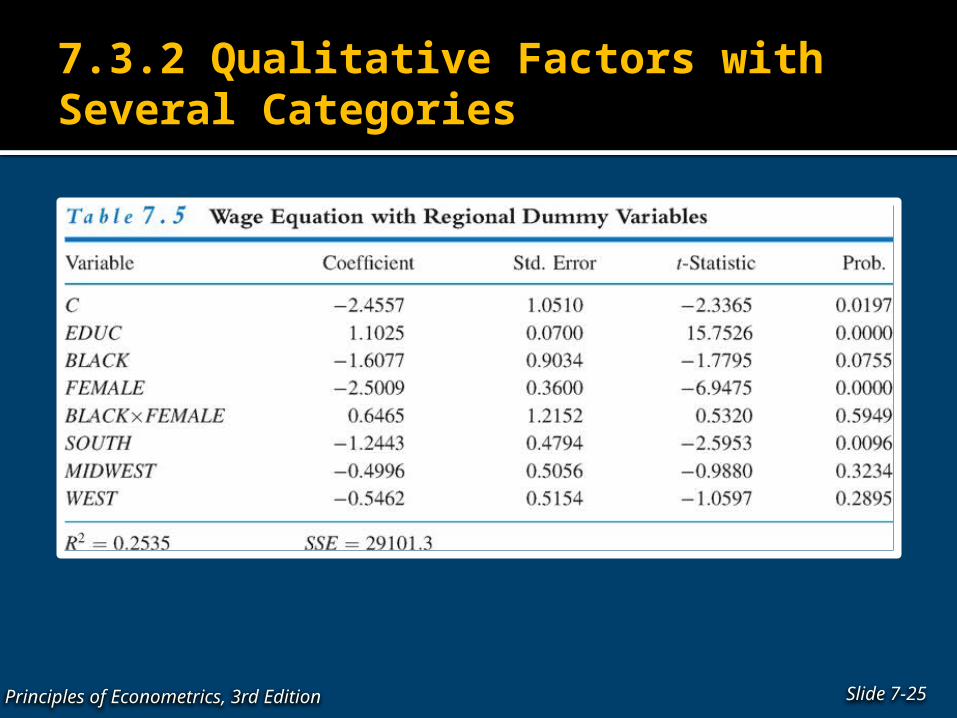
7.3.2 Qualitative Factors with Several Categories
Slide 7-25Principles of Econometrics, 3rd Edition
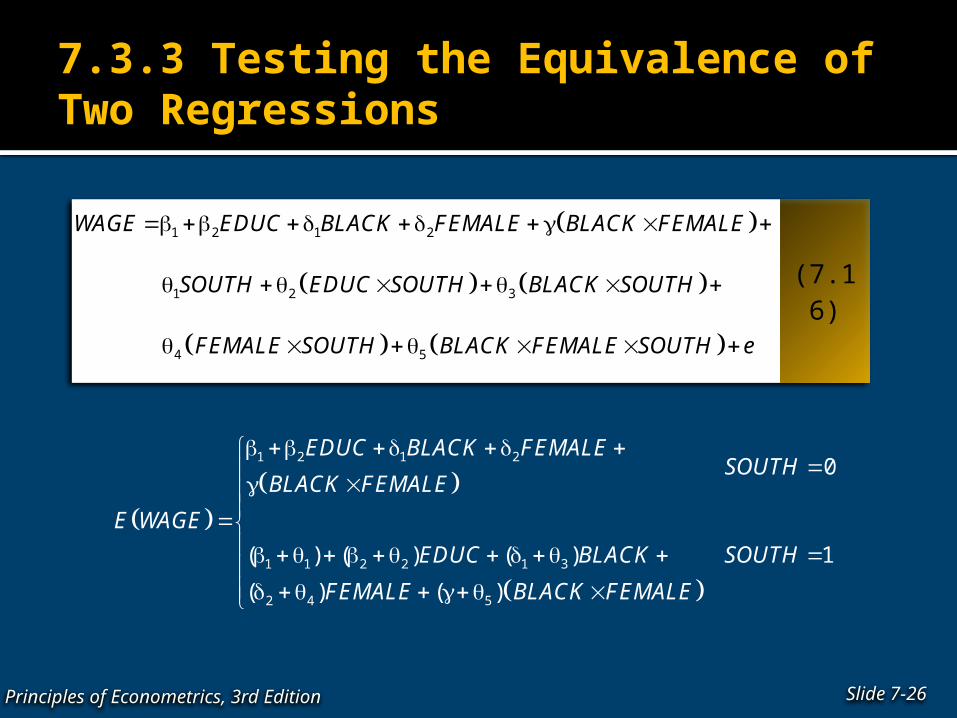
7.3.3 Testing the Equivalence of Two Regressions
Slide 7-26Principles of Econometrics, 3rd Edition
(7.16)
1 2 1 2
1 2 3
4 5
WAGE EDUC BLACK FEMALE BLACK FEMALE
SOUTH EDUC SOUTH BLACK SOUTH
FEMALE SOUTH BLACK FEMALE SOUTH e
1 2 1 2
1 1 2 2 1 3
2 4 5
0
( ) ( ) ( ) 1
( ) ( )
EDUC BLACK FEMALESOUTH
BLACK FEMALE
E WAGE
EDUC BLACK SOUTH
FEMALE BLACK FEMALE
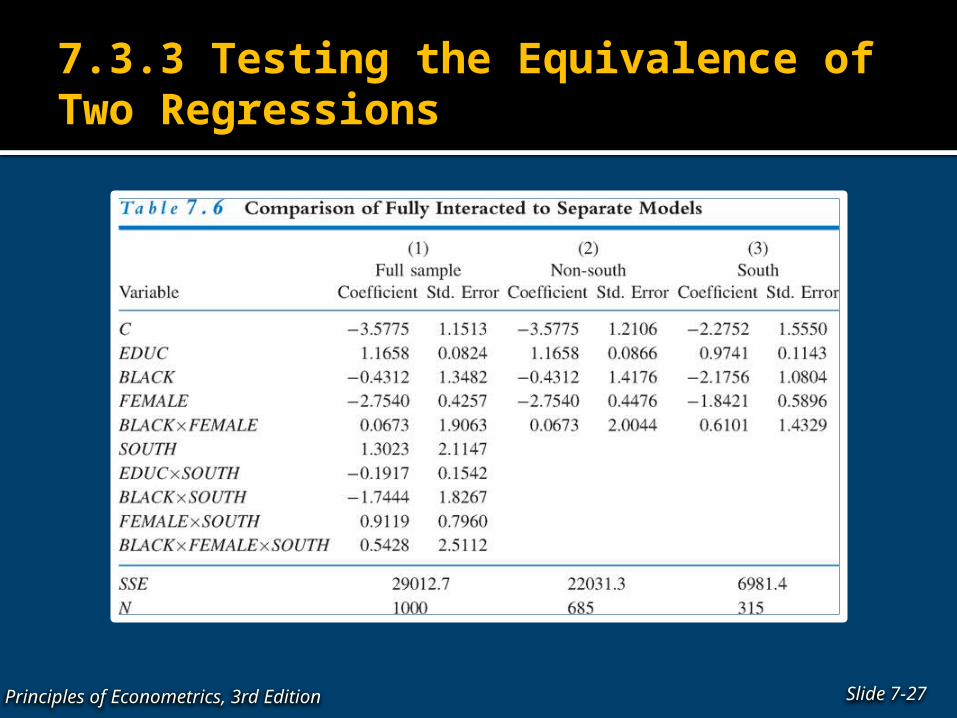
7.3.3 Testing the Equivalence of Two Regressions
Slide 7-27Principles of Econometrics, 3rd Edition
7.3.3 Testing the Equivalence of Two Regressions
Slide 7-28Principles of Econometrics, 3rd Edition
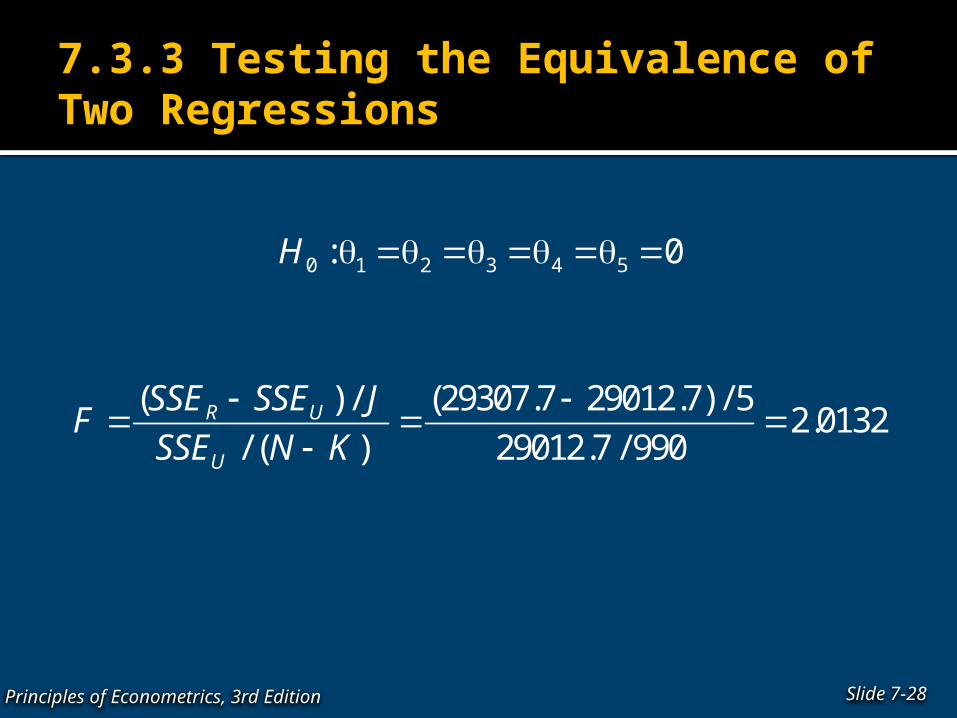
0 1 2 3 4 5: 0H
( ) / (29307.7 29012.7) / 52.0132
/ ( ) 29012.7 / 990R U
U
SSE SSE JF
SSE N K
7.3.3 Testing the Equivalence of Two Regressions
Slide 7-29Principles of Econometrics, 3rd Edition
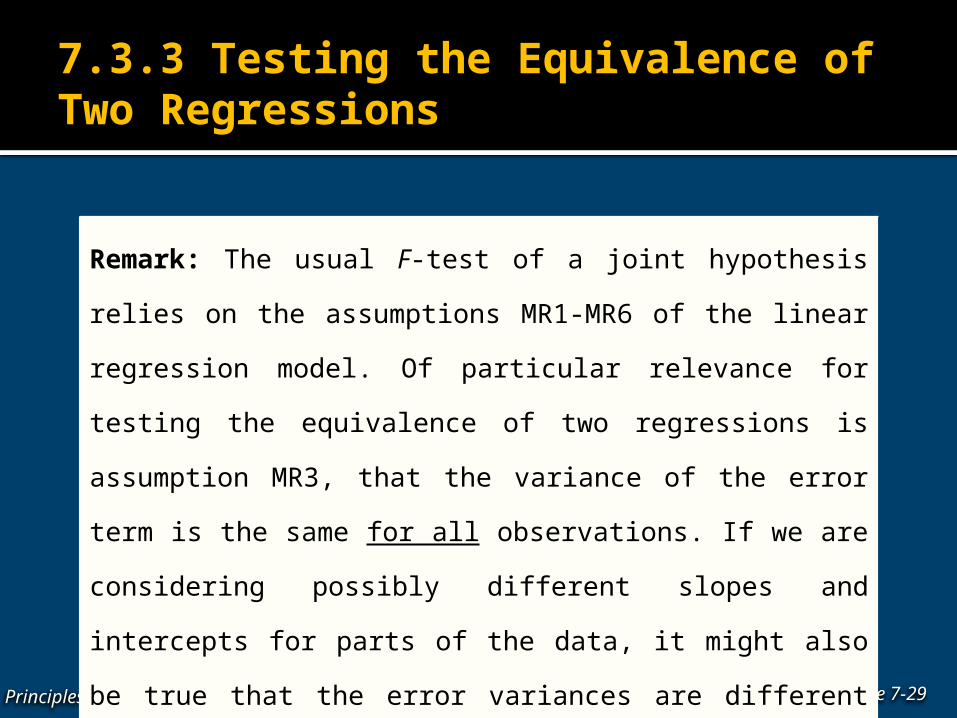
Remark: The usual F-test of a joint hypothesis relies on the
assumptions MR1-MR6 of the linear regression model. Of particular
relevance for testing the equivalence of two regressions is assumption
MR3, that the variance of the error term is the same for all observations.
If we are considering possibly different slopes and intercepts for parts of
the data, it might also be true that the error variances are different in the
two parts of the data. In such a case the usual F-test is not valid.
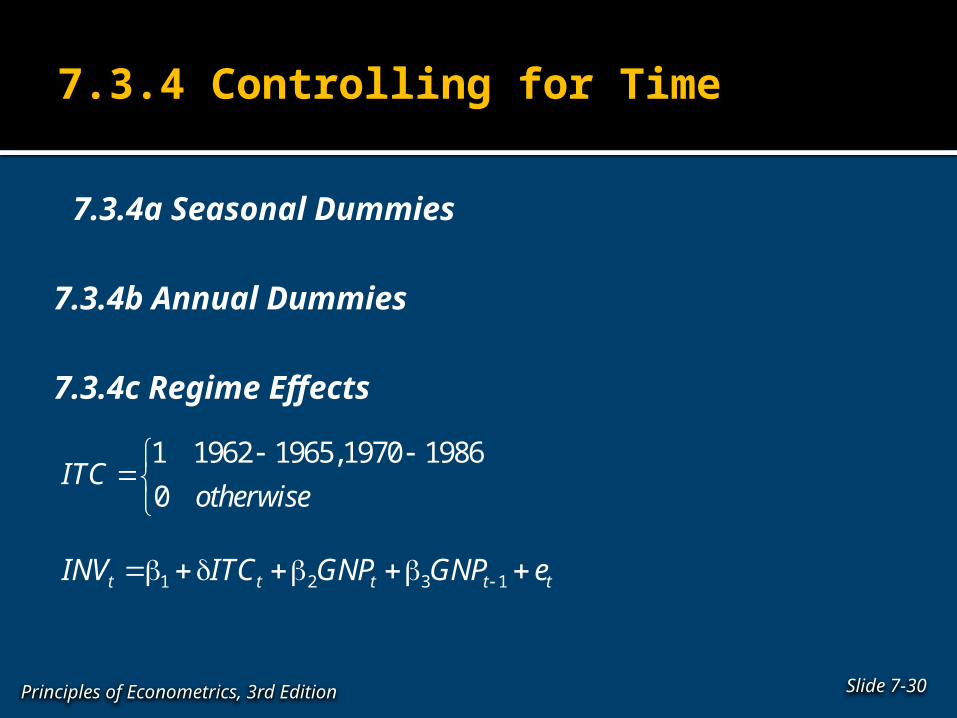
7.3.4 Controlling for Time
7.3.4a Seasonal Dummies
7.3.4b Annual Dummies
7.3.4c Regime Effects
Slide 7-30Principles of Econometrics, 3rd Edition
1 1962 1965,1970 1986
0ITC
otherwise
1 2 3 1t t t t tINV ITC GNP GNP e
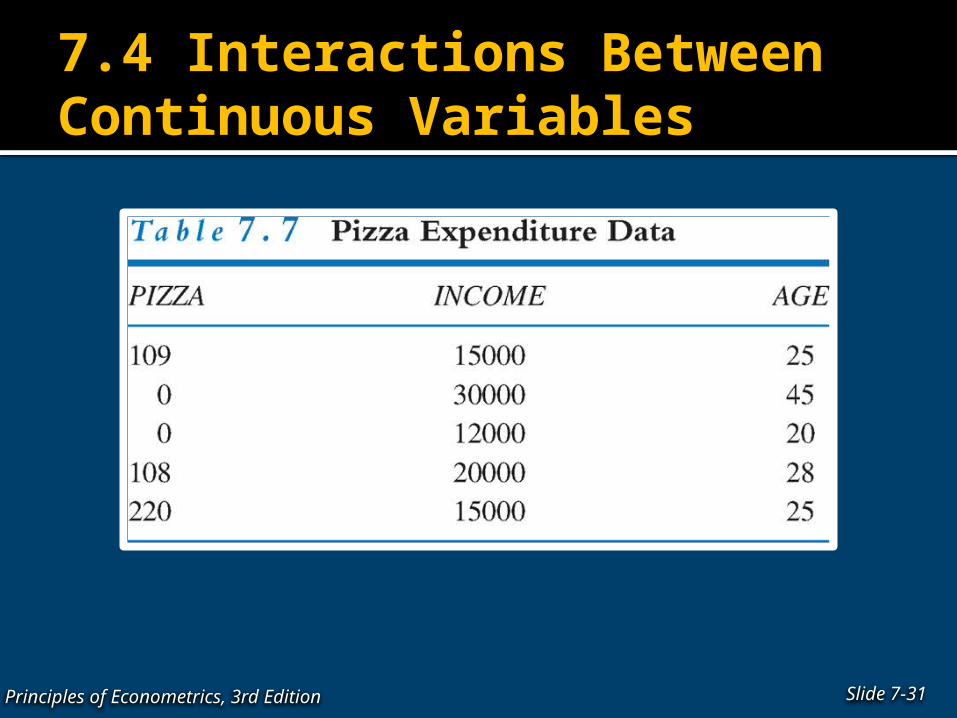
7.4 Interactions Between Continuous Variables
Slide 7-31Principles of Econometrics, 3rd Edition
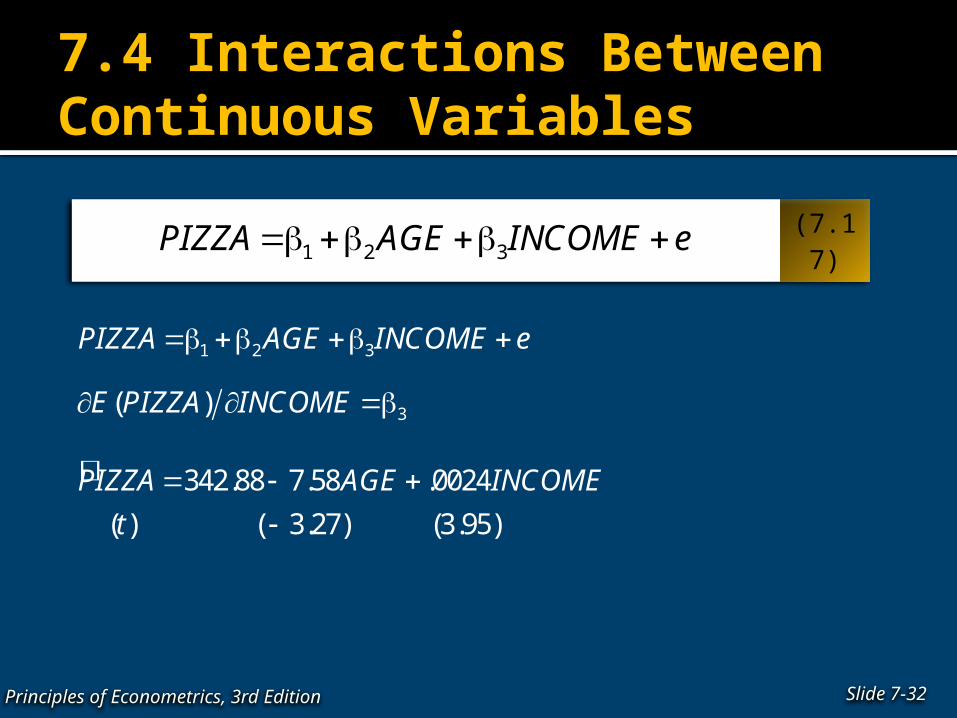
7.4 Interactions Between Continuous Variables
Slide 7-32Principles of Econometrics, 3rd Edition
(7.17)1 2 3PIZZA AGE INCOME e
1 2 3PIZZA AGE INCOME e
3( )E PIZZA INCOME
342.88 7.58 .0024
( ) ( 3.27) (3.95)
PIZZA AGE INCOME
t
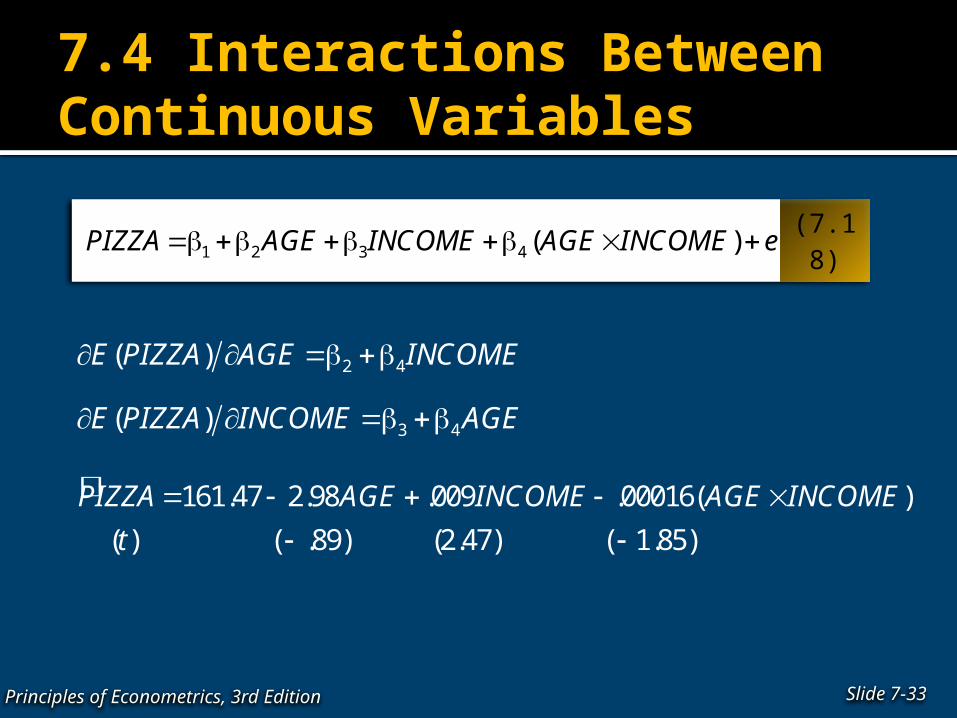
7.4 Interactions Between Continuous Variables
Slide 7-33Principles of Econometrics, 3rd Edition
(7.18)1 2 3 4 ( )PIZZA AGE INCOME AGE INCOME e
2 4( )E PIZZA AGE INCOME
3 4( )E PIZZA INCOME AGE
161.47 2.98 .009 .00016( )
( ) ( .89) (2.47) ( 1.85)
PIZZA AGE INCOME AGE INCOME
t
7.4 Interactions Between Continuous Variables
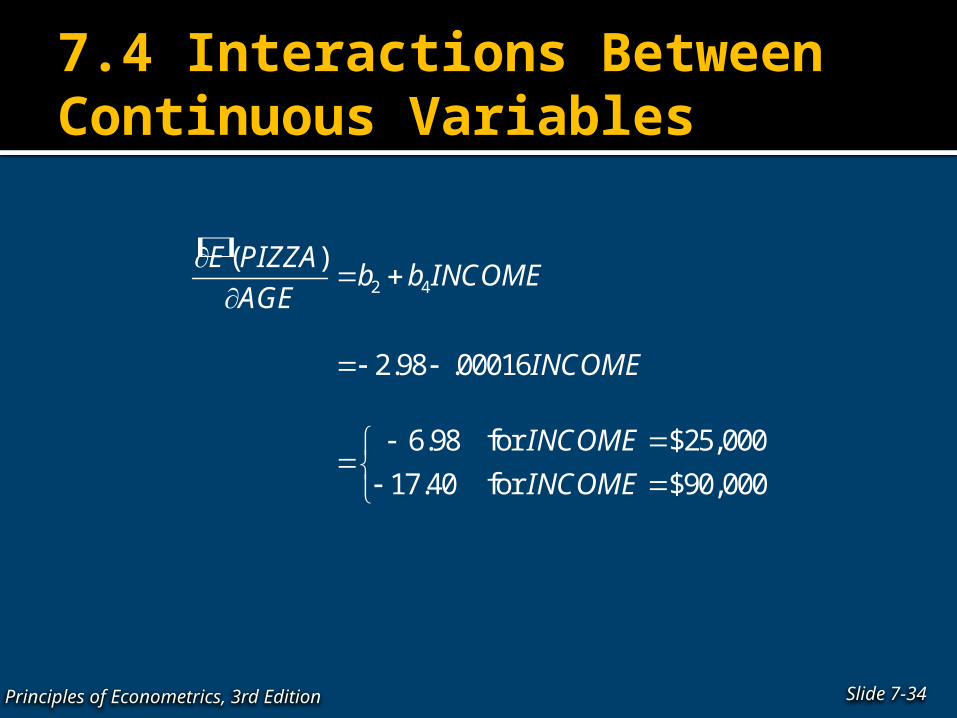
Slide 7-34Principles of Econometrics, 3rd Edition
2 4
( )
2.98 .00016
6.98 for $25,000
17.40 for $90,000
E PIZZAb b INCOME
AGE
INCOME
INCOME
INCOME
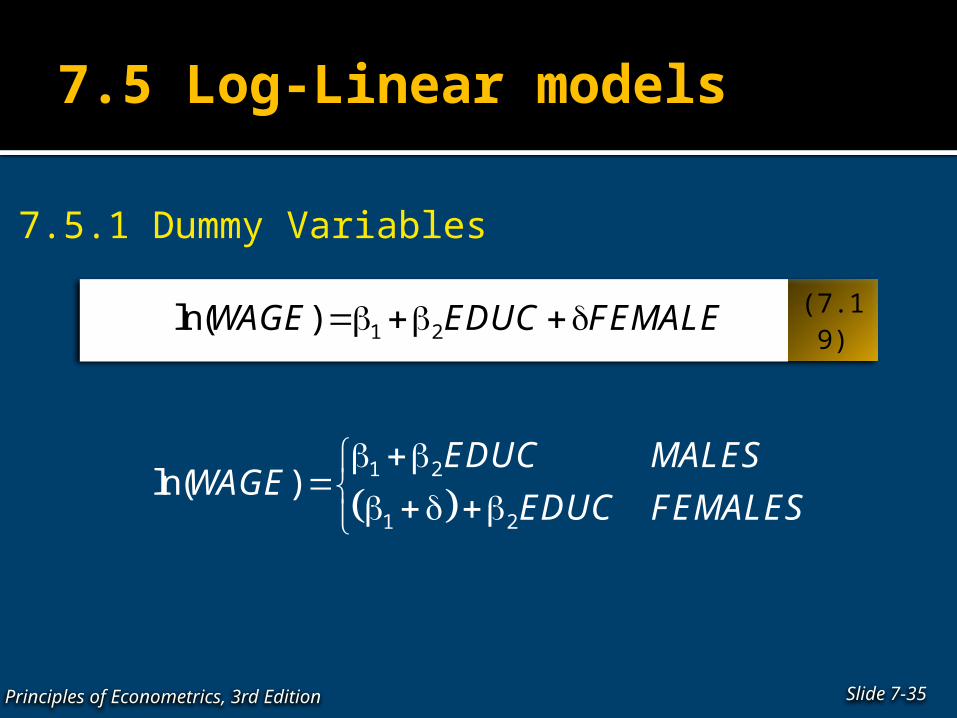
7.5 Log-Linear models
7.5.1 Dummy Variables
Slide 7-35Principles of Econometrics, 3rd Edition
(7.19)1 2ln( )WAGE EDUC FEMALE
1 2
1 2
ln( )EDUC MALES
WAGEEDUC FEMALES
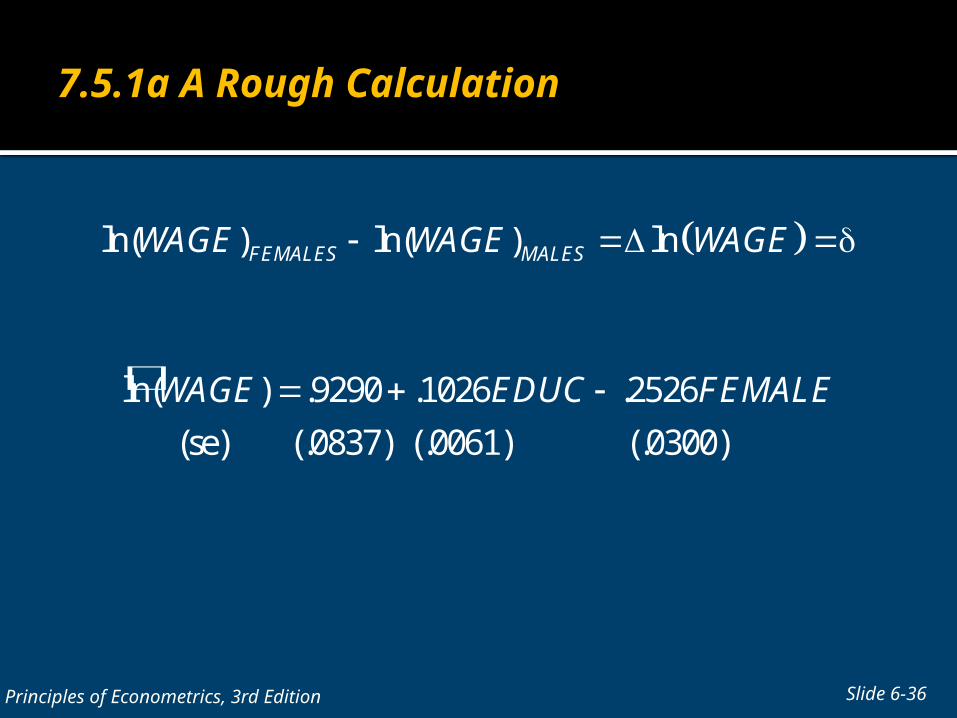
7.5.1a A Rough Calculation
Slide 6-36Principles of Econometrics, 3rd Edition
ln( ) ln( ) lnFEMALES MALESWAGE WAGE WAGE
ln( ) .9290 .1026 .2526
(se) (.0837) (.0061) (.0300)
WAGE EDUC FEMALE
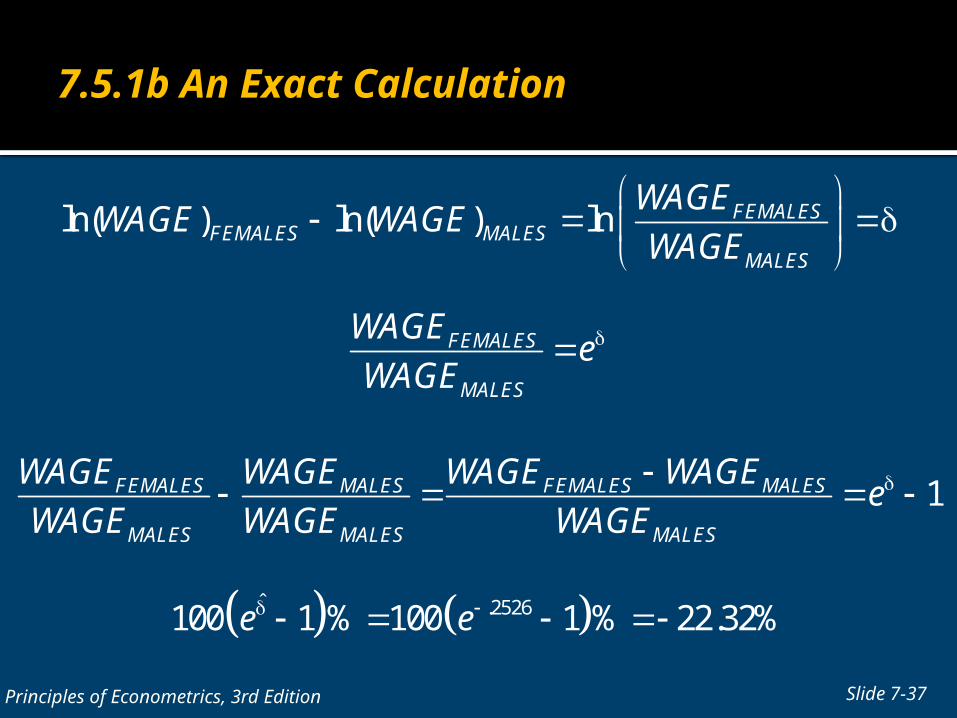
7.5.1b An Exact Calculation
Slide 7-37Principles of Econometrics, 3rd Edition
ln( ) ln( ) ln FEMALESFEMALES MALES
MALES
WAGEWAGE WAGE
WAGE
FEMALES
MALES
WAGEe
WAGE
1FEMALES MALES FEMALES MALES
MALES MALES MALES
WAGE WAGE WAGE WAGEe
WAGE WAGE WAGE
ˆ .2526100 1 % 100 1 % 22.32%e e
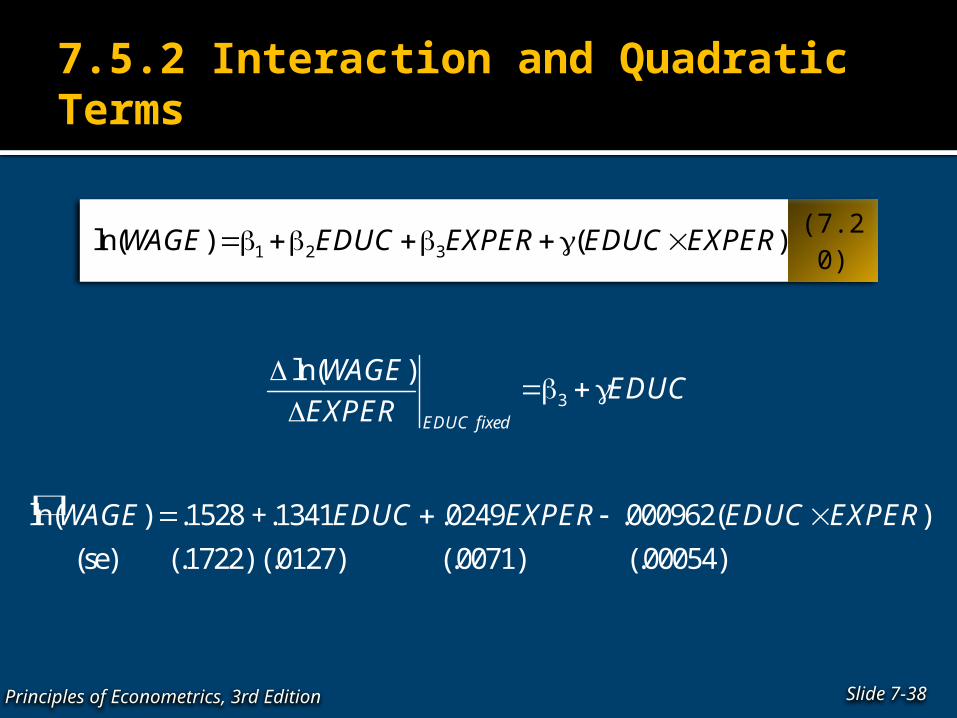
7.5.2 Interaction and Quadratic Terms
Slide 7-38Principles of Econometrics, 3rd Edition
(7.20)1 2 3ln( ) ( )WAGE EDUC EXPER EDUC EXPER
3
ln( )
EDUC fixed
WAGEEDUC
EXPER
ln( ) .1528 +.1341 .0249 .000962( )
(se) (.1722) (.0127) (.0071) (.00054)
WAGE EDUC EXPER EDUC EXPER
7.5.2 Interaction and Quadratic Terms
Slide 7-39Principles of Econometrics, 3rd Edition
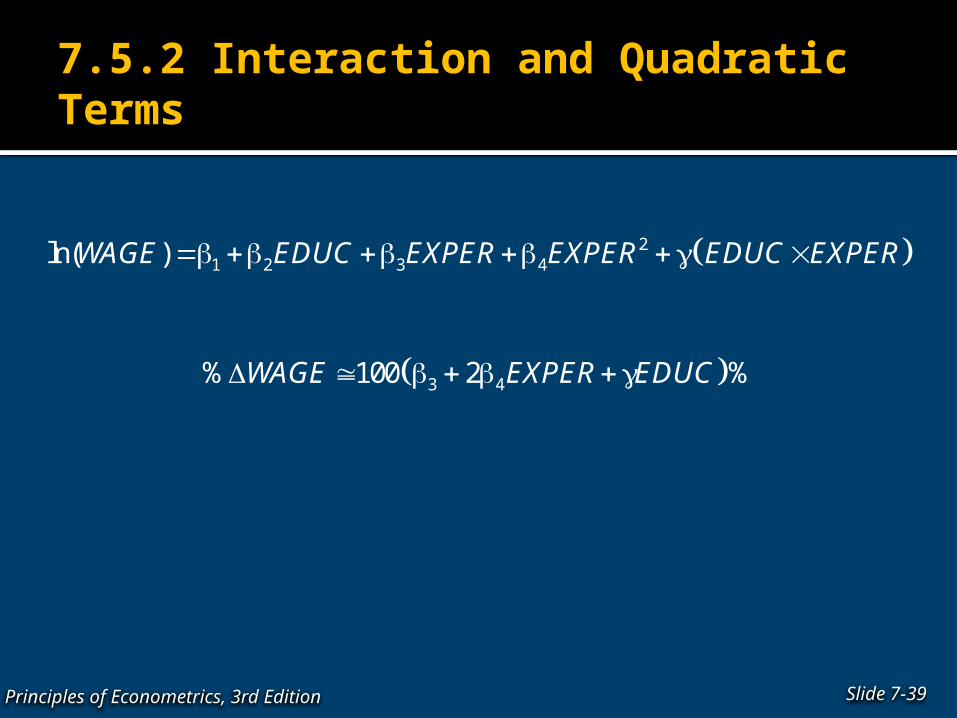
21 2 3 4ln( )WAGE EDUC EXPER EXPER EDUC EXPER
3 4% 100 2 %WAGE EXPER EDUC
Keywords
Slide 7-40Principles of Econometrics, 3rd Edition
annual dummy variables binary variable Chow test collinearity dichotomous variable dummy variable dummy variable trap exact collinearity hedonic model interaction variable intercept dummy variable log-linear models nonlinear relationship polynomial
reference group regional dummy variable seasonal dummy variables slope dummy variable
Chapter 7 Appendix
Slide 7-41Principles of Econometrics, 3rd Edition
Appendix 7 Details of log-linear model
interpretation
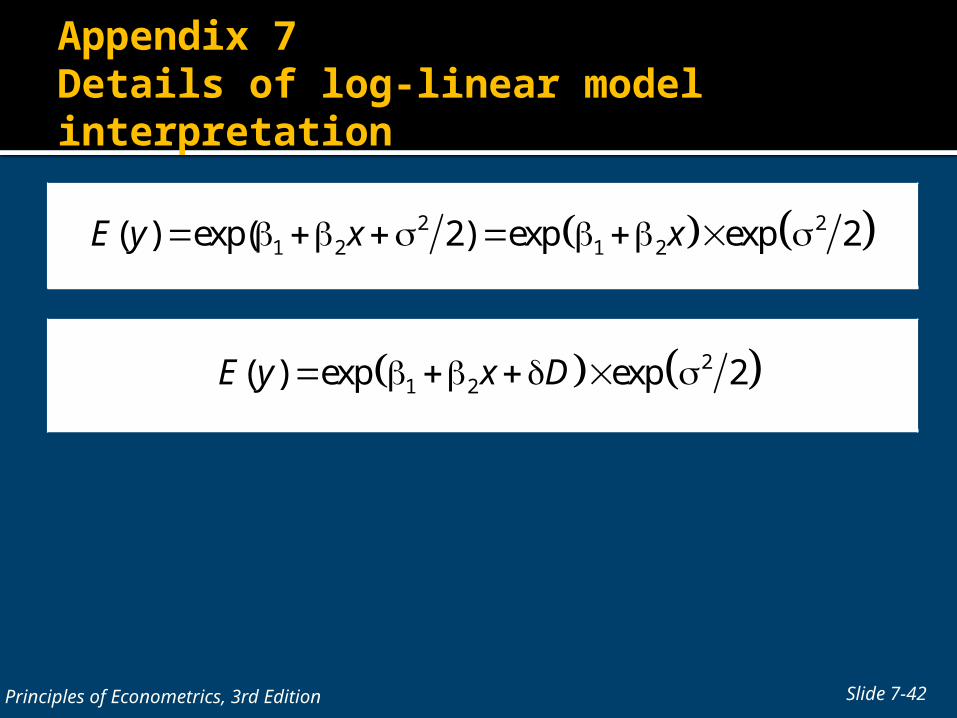
Appendix 7 Details of log-linear model interpretation
Slide 7-42Principles of Econometrics, 3rd Edition
2 21 2 1 2( ) exp( 2) exp exp 2E y x x
21 2( ) exp exp 2E y x D
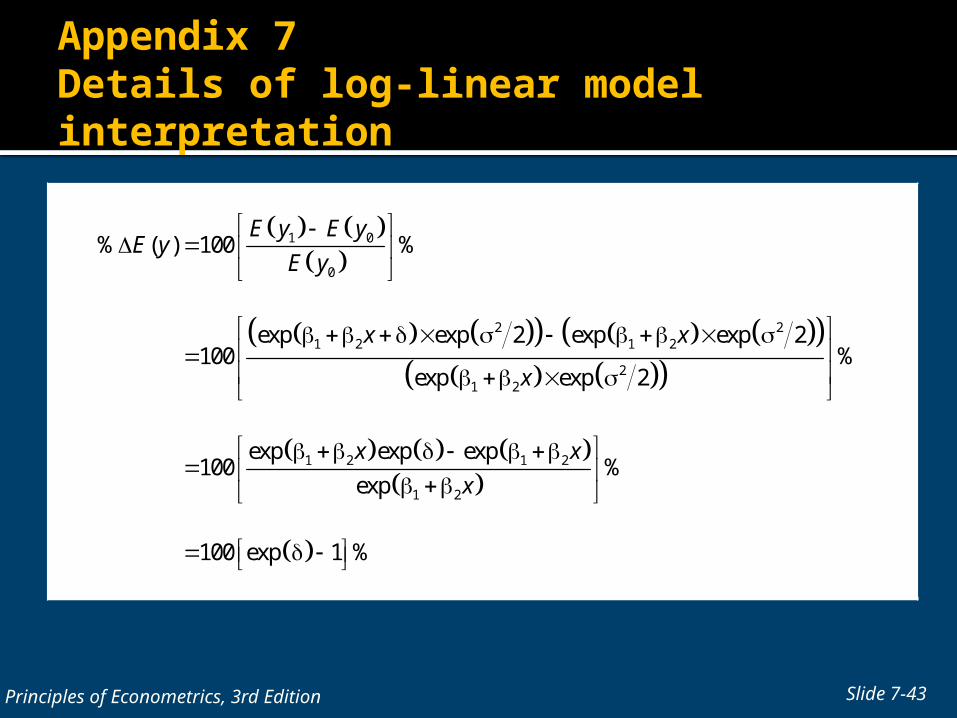
Appendix 7 Details of log-linear model interpretation
Slide 7-43Principles of Econometrics, 3rd Edition
1 0
0
2 21 2 1 2
21 2
1 2 1 2
1 2
% ( ) 100 %
exp exp 2 exp exp 2100 %
exp exp 2
exp exp exp100 %
exp
100 exp 1 %
E y E yE y
E y
x x
x
x x
x
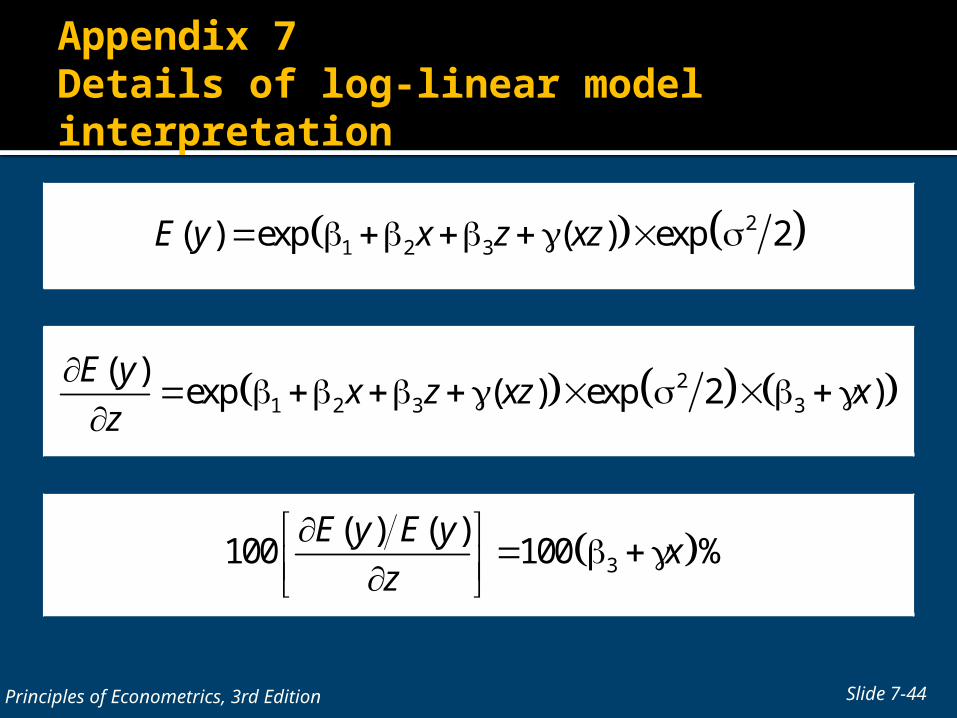
Appendix 7 Details of log-linear model interpretation
Slide 7-44Principles of Econometrics, 3rd Edition
21 2 3( ) exp ( ) exp 2E y x z xz
21 2 3 3
( )exp ( ) exp 2 )
E yx z xz x
z
3
( ) ( )100 100 %
E y E yx
z