Embed Size (px)
Citation preview

2010 -2011F I S C A L Y E A R
North Carolina Department of State TreasurerT H E S TAT E T R E A S U R E R ’ S A N N U A L R E P O R T T O T H E P E O P L E O F N O R T H C A R O L I N A
S t A t E t R E A S u R E R J A n E t C o w E L L

Dear Fellow Citizens,
I am pleased to provide you with the 2010-2011 Annual Report, which summarizes key activities and outcomes for the Department of State Treasurer.
This past year has represented the culmination of much of the due diligence and planning that has taken place in the Department since I took office in January 2009. At that time, we began work establishing our key goals, which included protecting the pension fund, maintaining the state’s AAA credit rating, promoting ethics and accountability, advancing financial literacy throughout the state, and improving operational efficiency.
This year, we are seeing the fulfillment of many of our essential goals. During the 2011 legislative session, the Department succeeded in getting legislation passed that allows additional investment flexibility in the pension portfolio for maximizing returns and minimizing risk. Despite the slow economic recovery, the pension fund returned over 18 percent for the 2010-2011 fiscal year.
Thanks to our conservative debt management and strong oversight of state agencies and local governments, the state maintained its AAA rating from all three major credit rating agencies.
Another of our central goals is to ensure that North Carolina citizens of all ages have the tools and resources they need to make sound financial decisions. To that end, the Department partnered with the N.C. Department of Public Instruction to integrate financial literacy education into the K-12 social studies curriculum at North Carolina’s public schools beginning in the 2012-2013 school year.
I recognize the tremendous responsibility vested in me as State Treasurer, and I am grateful for the trust you have placed in me. I am also grateful to the professional staff within the Department of State Treasurer, as well as the financial and other expert partners who help the Department achieve solid results for the benefit of North Carolina’s citizens.
Thank you for your interest in the Department of State Treasurer and for taking time to read our Annual Report. I look forward to continuing to work with you in the coming years to serve the state’s citizens and build and maintain a fiscally sound and prosperous North Carolina.
Sincerely,
Janet CowellNorth Carolina State Treasurer
325 NORTH SALISBURY STREET
RALEIGH, NORTH CAROLINA
27603-1385
WWW.NCTREASURER.COM
noRtH CARoLInA StAtE tREASuRER’S AnnuAL REPoRt 2
Investment Management
Division
noRtH CARoLInA StAtE tREASuRER’S AnnuAL REPoRt 3noRtH CARoLInA StAtE tREASuRER’S AnnuAL REPoRt 3
North CarolinaState Treasurer’s
annual reporttable of contents
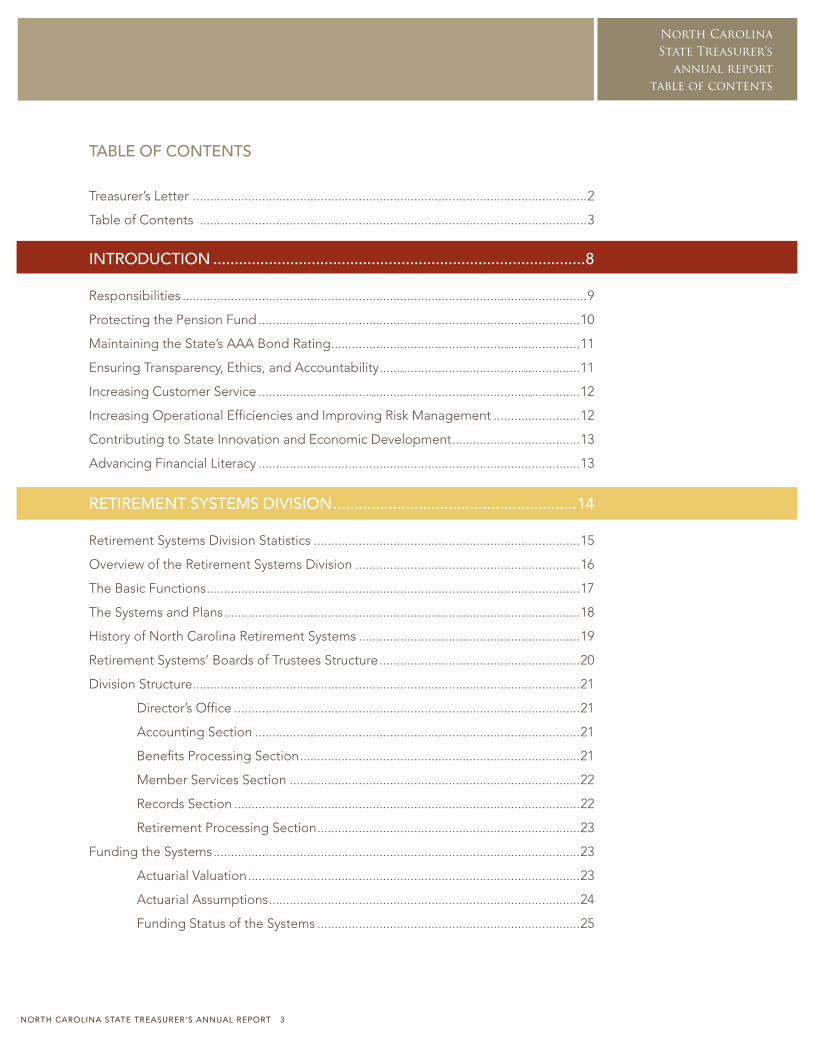
TABLE Of CONTENTS
treasurer’s Letter ..................................................................................................................2
table of Contents ................................................................................................................3
INTROdUCTION .......................................................................................8
Responsibilities .....................................................................................................................9
Protecting the Pension Fund .............................................................................................10
Maintaining the State’s AAA Bond Rating ........................................................................11
Ensuring transparency, Ethics, and Accountability ..........................................................11
Increasing Customer Service .............................................................................................12
Increasing operational Efficiencies and Improving Risk Management .........................12
Contributing to State Innovation and Economic Development .....................................13
Advancing Financial Literacy .............................................................................................13
RETIREMENT SYSTEMS dIvISION .........................................................14
Retirement Systems Division Statistics .............................................................................15
overview of the Retirement Systems Division .................................................................16
the Basic Functions ............................................................................................................17
the Systems and Plans .......................................................................................................18
History of north Carolina Retirement Systems ................................................................19
Retirement Systems’ Boards of trustees Structure ..........................................................20
Division Structure ................................................................................................................21
Director’s office ....................................................................................................21
Accounting Section ..............................................................................................21
Benefits Processing Section .................................................................................21
Member Services Section ....................................................................................22
Records Section ....................................................................................................22
Retirement Processing Section ............................................................................23
Funding the Systems ..........................................................................................................23
Actuarial Valuation ................................................................................................23
Actuarial Assumptions ..........................................................................................24
Funding Status of the Systems ............................................................................25
Investment Management Division
noRtH CARoLInA StAtE tREASuRER’S AnnuAL REPoRt 4noRtH CARoLInA StAtE tREASuRER’S AnnuAL REPoRt 4
North CarolinaState Treasurer’sannual reporttable of contents
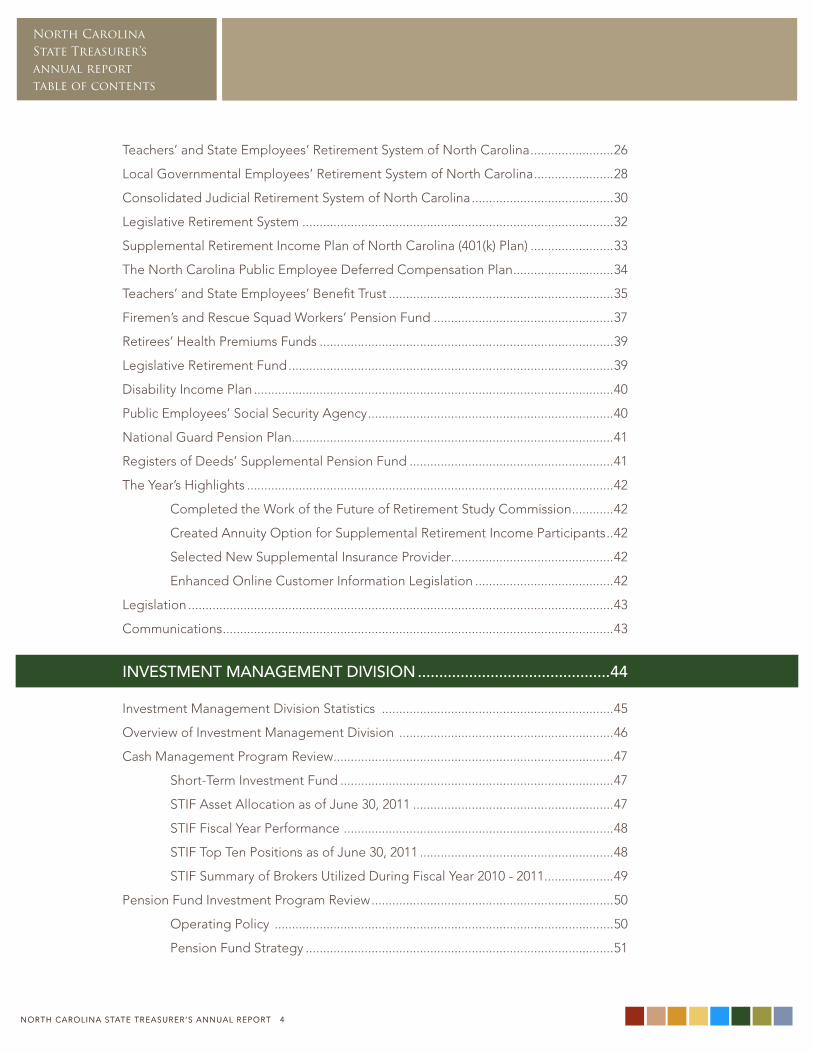
teachers’ and State Employees’ Retirement System of north Carolina ........................26
Local Governmental Employees’ Retirement System of north Carolina .......................28
Consolidated Judicial Retirement System of north Carolina .........................................30
Legislative Retirement System ..........................................................................................32
Supplemental Retirement Income Plan of north Carolina (401(k) Plan) ........................33
the north Carolina Public Employee Deferred Compensation Plan .............................34
teachers’ and State Employees’ Benefit trust .................................................................35
Firemen’s and Rescue Squad workers’ Pension Fund ....................................................37
Retirees’ Health Premiums Funds .....................................................................................39
Legislative Retirement Fund ..............................................................................................39
Disability Income Plan ........................................................................................................40
Public Employees’ Social Security Agency .......................................................................40
national Guard Pension Plan .............................................................................................41
Registers of Deeds’ Supplemental Pension Fund ...........................................................41
the Year’s Highlights ..........................................................................................................42
Completed the work of the Future of Retirement Study Commission ............42
Created Annuity option for Supplemental Retirement Income Participants ..42
Selected new Supplemental Insurance Provider ...............................................42
Enhanced online Customer Information Legislation ........................................42
Legislation ...........................................................................................................................43
Communications .................................................................................................................43
INvESTMENT MANAGEMENT dIvISION .............................................44
Investment Management Division Statistics ...................................................................45
overview of Investment Management Division ..............................................................46
Cash Management Program Review .................................................................................47
Short-term Investment Fund ...............................................................................47
StIF Asset Allocation as of June 30, 2011 ..........................................................47
StIF Fiscal Year Performance ..............................................................................48
StIF top ten Positions as of June 30, 2011 ........................................................48
StIF Summary of Brokers utilized During Fiscal Year 2010 - 2011 ....................49
Pension Fund Investment Program Review ......................................................................50
operating Policy ..................................................................................................50
Pension Fund Strategy .........................................................................................51
noRtH CARoLInA StAtE tREASuRER’S AnnuAL REPoRt 4
Investment Management
Division
noRtH CARoLInA StAtE tREASuRER’S AnnuAL REPoRt 5noRtH CARoLInA StAtE tREASuRER’S AnnuAL REPoRt 5
North CarolinaState Treasurer’s
annual reporttable of contents
national Average Returns and Exposure to Risk ...............................................51
Fiscal Year Review .................................................................................................51
total Pension Fund Structure ...............................................................................52
Current and Historical Strategic targets ............................................................52
Pension Fund Asset Allocation as of June 30, 2011 ...........................................52
total Fund Performance .......................................................................................53
Corporate Governance ......................................................................................................55
Financial Regulatory Reform ................................................................................55
Diversity .................................................................................................................55
Company Engagement – Massey Energy ...........................................................55
Fixed Income ......................................................................................................................56
Core Fixed Income Structure ...............................................................................56
Fixed Income Market overview ..........................................................................57
Core Fixed Income Performance.........................................................................58
non-Core Fixed Income Structure ......................................................................59
non-Core Fixed Income Performance ................................................................59
Global Equity ......................................................................................................................60
Global Equity Structure ........................................................................................60
Global Equity Market overview ...........................................................................62
Global Equity Performance ..................................................................................62
Global Equity Portfolio Investment Advisors......................................................63
non-u.S. Global Equity Portfolio Investment Advisors .....................................64
Hedged Strategies .............................................................................................................66
Hedged Strategies Structure ...............................................................................66
Hedged Strategies Performance .........................................................................67
Hedged Strategies Investment Advisors ............................................................67
Real Estate ...........................................................................................................................68
Real Estate Structure ............................................................................................68
Real Estate Market overview ...............................................................................71
Real Estate Performance ......................................................................................71
Real Estate Investment Advisors .........................................................................73
Private Equity ......................................................................................................................75
Private Equity Structure ........................................................................................75
Private Equity Market overview ..........................................................................76
Private Equity Performance ..................................................................................76
Investment Management Division
North CarolinaState Treasurer’sannual reporttable of contents
Private Equity Investment Advisors .....................................................................77
Credit Strategies .................................................................................................................79
Credit Structure .....................................................................................................79
Credit Market overview .......................................................................................79
Credit Strategies Performance ............................................................................80
Credit Strategies Investment Advisors ................................................................80
Inflation Protection .............................................................................................................81
Inflation Protection Structure ...............................................................................81
Inflation Market overview ....................................................................................81
Inflation Protection Performance .........................................................................81
Inflation Protection Investment Advisors ............................................................82
Ancillary Investment Programs Review .............................................................................83
Escheat Investment Program ...............................................................................83
unC and Public Hospitals..................................................................................................84
other Post-Employment Benefits Fund ............................................................................85
other non-Pension Long-term Investment Portfolio Participants .................................85
STATE & LOCAL GOvERNMENT fINANCE dIvISION .........................86
State & Local Government Finance Division Statistics ....................................................87
State & Local Government Finance Division overview ...................................................88
History of State & Local Government Finance .................................................................88
the Local Government Commission.................................................................................88
the north Carolina Capital Facilities Finance Agency ....................................................89
the north Carolina Infrastructure Finance Corporation .................................................89
Debt Management .............................................................................................................89
Fiscal Management ............................................................................................................92
outreach and Communication ..........................................................................................92
other Highlights .................................................................................................................93
Federal Stimulus Legislation and Bonds ............................................................93
Fiscal Analysis Dashboard Project .......................................................................94
Audit Review and Invoice Approval Process ......................................................94
noRtH CARoLInA StAtE tREASuRER’S AnnuAL REPoRt 6
Investment Management
Division
North CarolinaState Treasurer’s
annual reporttable of contents
UNCLAIMEd PROPERTY ANd ESCHEATS dIvISION ...........................97
unclaimed Property and Escheats Division Statistics ......................................................98
unclaimed Property and Escheats Division overview .....................................................99
History of unclaimed Property ........................................................................................100
unclaimed Property Facts ................................................................................................100
fINANCIAL OPERATIONS dIvISION ...................................................101
Financial operations Division Statistics ..........................................................................102
Financial operations Division overview .........................................................................103
History of Financial operations .......................................................................................103
Banking operations .........................................................................................................104
Bank Reconciliation unit ..................................................................................................104
Statewide Accounting operations ..................................................................................104
Departmental Accounting ...............................................................................................104
STATISTICAL TABLES ............................................................................105
noRtH CARoLInA StAtE tREASuRER’S AnnuAL REPoRt 7
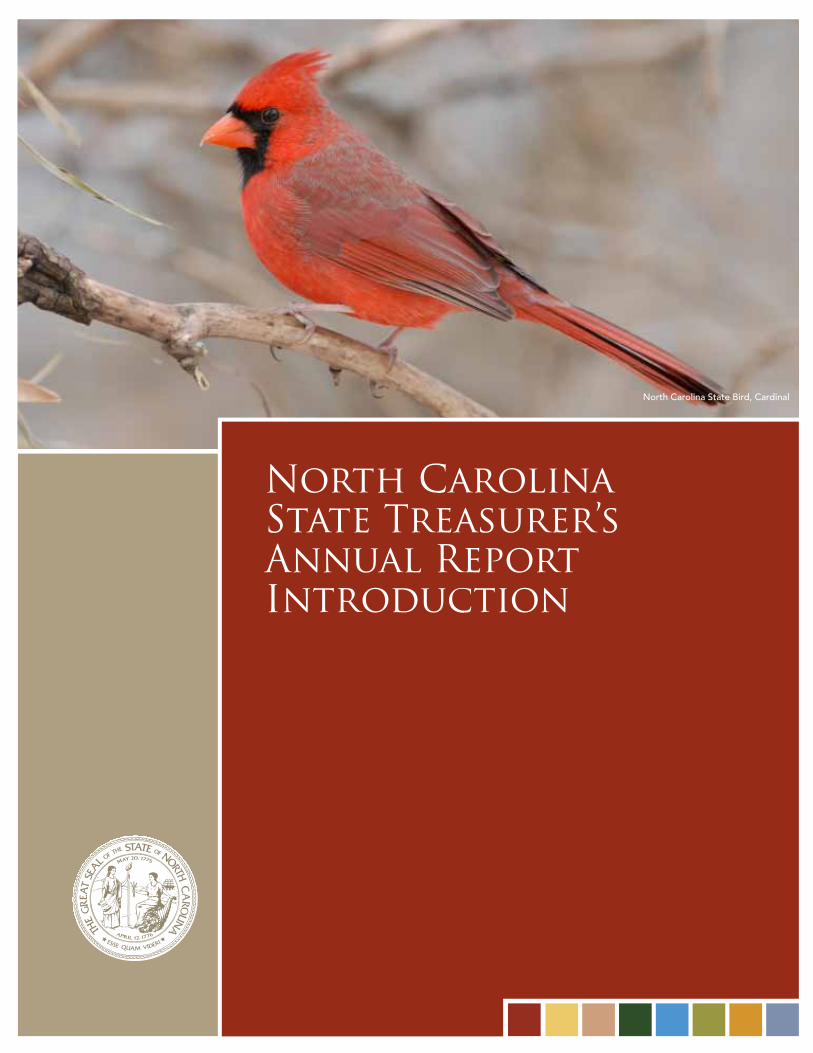
North Carolina State Bird, Cardinal
North CarolinaState Treasurer’sAnnual ReportIntroduction
N O R T H C A R O L I N A S TAT E T R E A S U R E R ’ S
A N N U A L R E P O R T
noRtH CARoLInA StAtE tREASuRER’S AnnuAL REPoRt 9
North CarolinaState Treasurer’s
Annual Report Introduction
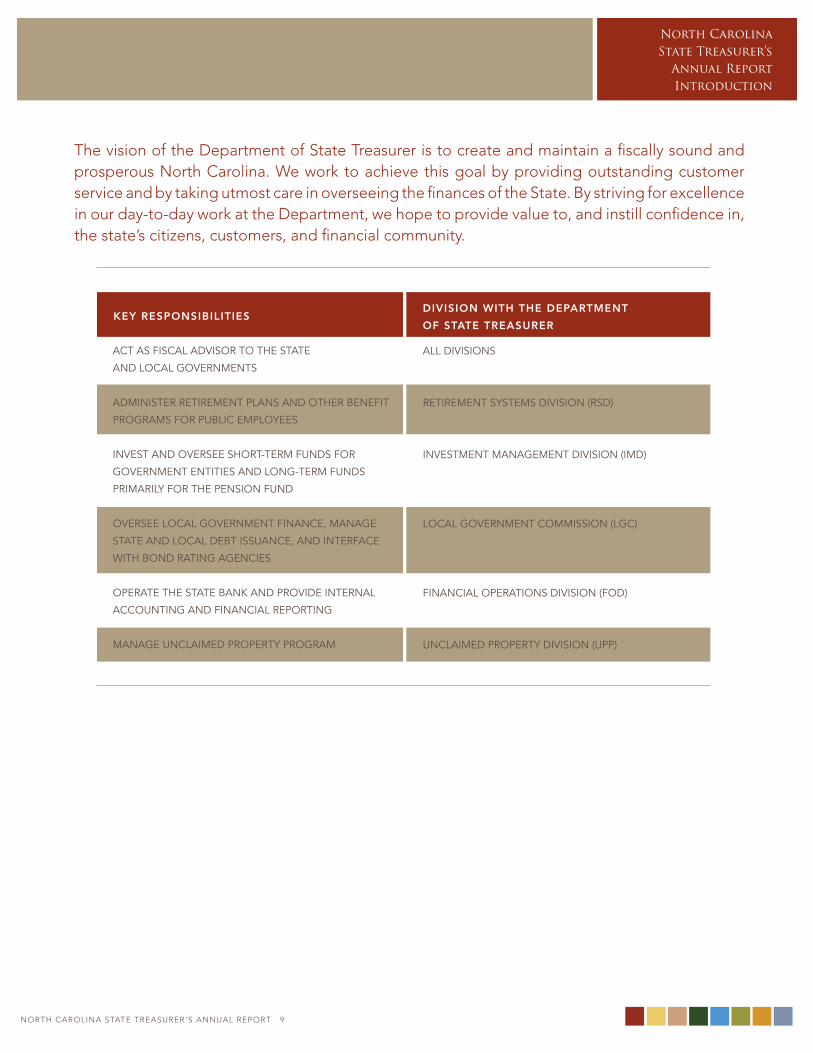
the vision of the Department of State treasurer is to create and maintain a fiscally sound and prosperous north Carolina. we work to achieve this goal by providing outstanding customer service and by taking utmost care in overseeing the finances of the State. By striving for excellence in our day-to-day work at the Department, we hope to provide value to, and instill confidence in, the state’s citizens, customers, and financial community.
All DIvISIoNS
ReTIRemeNT SySTemS DIvISIoN (RSD)
INveSTmeNT mANAgemeNT DIvISIoN (ImD)
loCAl goveRNmeNT CommISSIoN (lgC)
FINANCIAl oPeRATIoNS DIvISIoN (FoD)
UNClAImeD PRoPeRTy DIvISIoN (UPP)
ACT AS FISCAl ADvISoR To The STATe
AND loCAl goveRNmeNTS
ADmINISTeR ReTIRemeNT PlANS AND oTheR beNeFIT
PRogRAmS FoR PUblIC emPloyeeS
INveST AND oveRSee ShoRT-TeRm FUNDS FoR
goveRNmeNT eNTITIeS AND loNg-TeRm FUNDS
PRImARIly FoR The PeNSIoN FUND
oveRSee loCAl goveRNmeNT FINANCe, mANAge
STATe AND loCAl DebT ISSUANCe, AND INTeRFACe
wITh boND RATINg AgeNCIeS
oPeRATe The STATe bANK AND PRovIDe INTeRNAl
ACCoUNTINg AND FINANCIAl RePoRTINg
mANAge UNClAImeD PRoPeRTy PRogRAm
Key ResponsibilitiesDivision with the DepaRtment
of state tReasuReR
noRtH CARoLInA StAtE tREASuRER’S AnnuAL REPoRt 10
North CarolinaState Treasurer’sAnnual Report Introduction
At the heart of the Department’s work are its core values, which are implemented consistently at all levels and across all Divisions. These include: maintaining a high level of integrity and ethics, promoting trust and accountability by conducting all work in an open and transparent manner, recruiting employees with the highest levels of expertise, providing superior customer service, encouraging diverse ideas and perspectives, and keeping a long-term view.
In the interest of promoting these core values, the Department identified its highest priorities and outlined detailed plans for their achievement. The Department has taken decisive steps toward accomplishing these goals during the last several years. During the 2010-2011 fiscal year, many of these key goals are coming to fruition.
• Protecting the Pension Fund • maintaining the State’s AAA bond Rating • ensuring Transparency, ethics, and Accountability • Increasing Customer Service • Increasing operational efficiencies and Improving
Risk management • Contributing to State Innovation and
economic Development • Advancing Financial literacy across North Carolina
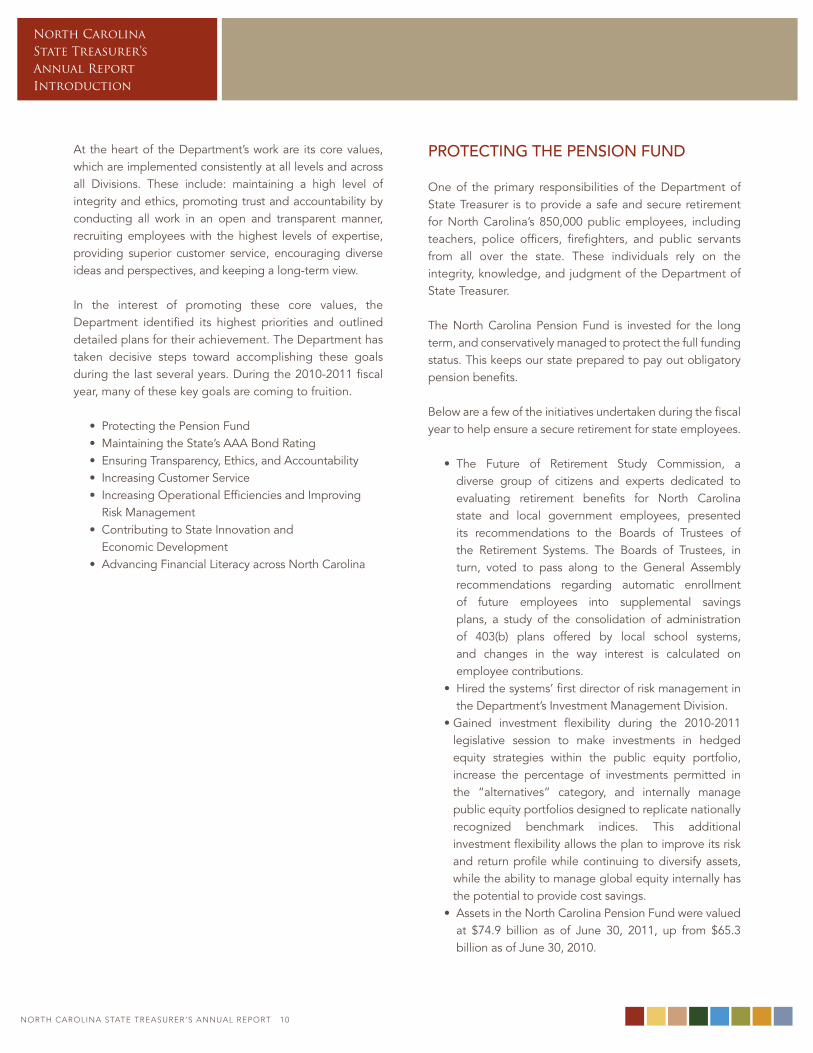
PROTECTING THE PENSION fUNd
one of the primary responsibilities of the Department of State Treasurer is to provide a safe and secure retirement for North Carolina’s 850,000 public employees, including teachers, police officers, firefighters, and public servants from all over the state. These individuals rely on the integrity, knowledge, and judgment of the Department of State Treasurer.
The North Carolina Pension Fund is invested for the long term, and conservatively managed to protect the full funding status. This keeps our state prepared to pay out obligatory pension benefits.
below are a few of the initiatives undertaken during the fiscal year to help ensure a secure retirement for state employees.
• The Future of Retirement Study Commission, a diverse group of citizens and experts dedicated to evaluating retirement benefits for North Carolina state and local government employees, presented its recommendations to the boards of Trustees of the Retirement Systems. The boards of Trustees, in turn, voted to pass along to the general Assembly recommendations regarding automatic enrollment of future employees into supplemental savings plans, a study of the consolidation of administration of 403(b) plans offered by local school systems, and changes in the way interest is calculated on employee contributions.
• hired the systems’ first director of risk management in the Department’s Investment management Division.
• gained investment flexibility during the 2010-2011 legislative session to make investments in hedged equity strategies within the public equity portfolio, increase the percentage of investments permitted in the “alternatives” category, and internally manage public equity portfolios designed to replicate nationally recognized benchmark indices. This additional investment flexibility allows the plan to improve its risk and return profile while continuing to diversify assets, while the ability to manage global equity internally has the potential to provide cost savings.
• Assets in the North Carolina Pension Fund were valued at $74.9 billion as of June 30, 2011, up from $65.3 billion as of June 30, 2010.
noRtH CARoLInA StAtE tREASuRER’S AnnuAL REPoRt 10 noRtH CARoLInA StAtE tREASuRER’S AnnuAL REPoRt 11
North CarolinaState Treasurer’s
Annual Report Introduction
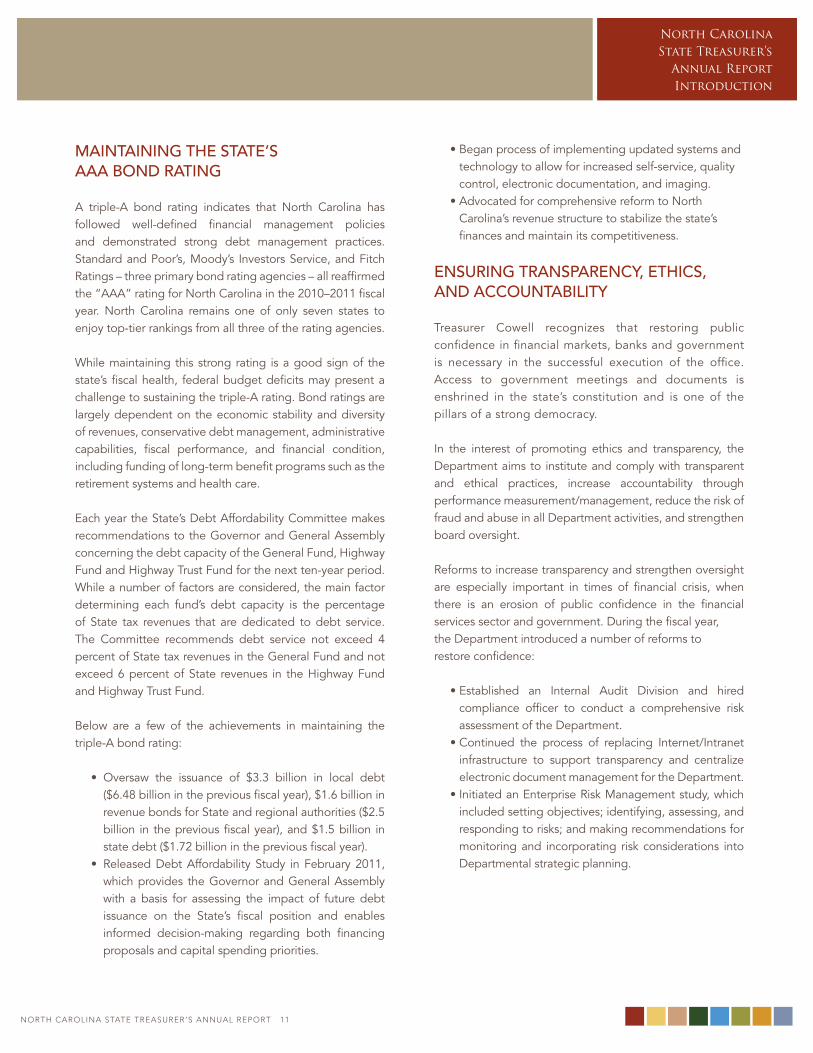
MAINTAINING THE STATE’S AAA BONd RATING
A triple-A bond rating indicates that North Carolina has followed well-defined financial management policies and demonstrated strong debt management practices. Standard and Poor’s, moody’s Investors Service, and Fitch Ratings – three primary bond rating agencies – all reaffirmed the “AAA” rating for North Carolina in the 2010–2011 fiscal year. North Carolina remains one of only seven states to enjoy top-tier rankings from all three of the rating agencies.
while maintaining this strong rating is a good sign of the state’s fiscal health, federal budget deficits may present a challenge to sustaining the triple-A rating. bond ratings are largely dependent on the economic stability and diversity of revenues, conservative debt management, administrative capabilities, fiscal performance, and financial condition, including funding of long-term benefit programs such as the retirement systems and health care.
each year the State’s Debt Affordability Committee makes recommendations to the governor and general Assembly concerning the debt capacity of the general Fund, highway Fund and highway Trust Fund for the next ten-year period. while a number of factors are considered, the main factor determining each fund’s debt capacity is the percentage of State tax revenues that are dedicated to debt service. The Committee recommends debt service not exceed 4 percent of State tax revenues in the general Fund and not exceed 6 percent of State revenues in the highway Fund and highway Trust Fund.
below are a few of the achievements in maintaining the triple-A bond rating:
• oversaw the issuance of $3.3 billion in local debt ($6.48 billion in the previous fiscal year), $1.6 billion in revenue bonds for State and regional authorities ($2.5 billion in the previous fiscal year), and $1.5 billion in state debt ($1.72 billion in the previous fiscal year).
• Released Debt Affordability Study in February 2011, which provides the governor and general Assembly with a basis for assessing the impact of future debt issuance on the State’s fiscal position and enables informed decision-making regarding both financing proposals and capital spending priorities.
• began process of implementing updated systems and technology to allow for increased self-service, quality control, electronic documentation, and imaging.
• Advocated for comprehensive reform to North Carolina’s revenue structure to stabilize the state’s finances and maintain its competitiveness.
ENSURING TRANSPARENCY, ETHICS, ANd ACCOUNTABILITY
Treasurer Cowell recognizes that restoring public confidence in financial markets, banks and government is necessary in the successful execution of the office. Access to government meetings and documents is enshrined in the state’s constitution and is one of the pillars of a strong democracy.
In the interest of promoting ethics and transparency, the Department aims to institute and comply with transparent and ethical practices, increase accountability through performance measurement/management, reduce the risk of fraud and abuse in all Department activities, and strengthen board oversight.
Reforms to increase transparency and strengthen oversight are especially important in times of financial crisis, when there is an erosion of public confidence in the financial services sector and government. During the fiscal year, the Department introduced a number of reforms to restore confidence:
• established an Internal Audit Division and hired compliance officer to conduct a comprehensive risk assessment of the Department.
• Continued the process of replacing Internet/Intranet infrastructure to support transparency and centralize electronic document management for the Department.
• Initiated an enterprise Risk management study, which included setting objectives; identifying, assessing, and responding to risks; and making recommendations for monitoring and incorporating risk considerations into Departmental strategic planning.
noRtH CARoLInA StAtE tREASuRER’S AnnuAL REPoRt 12
North CarolinaState Treasurer’sAnnual Report Introduction
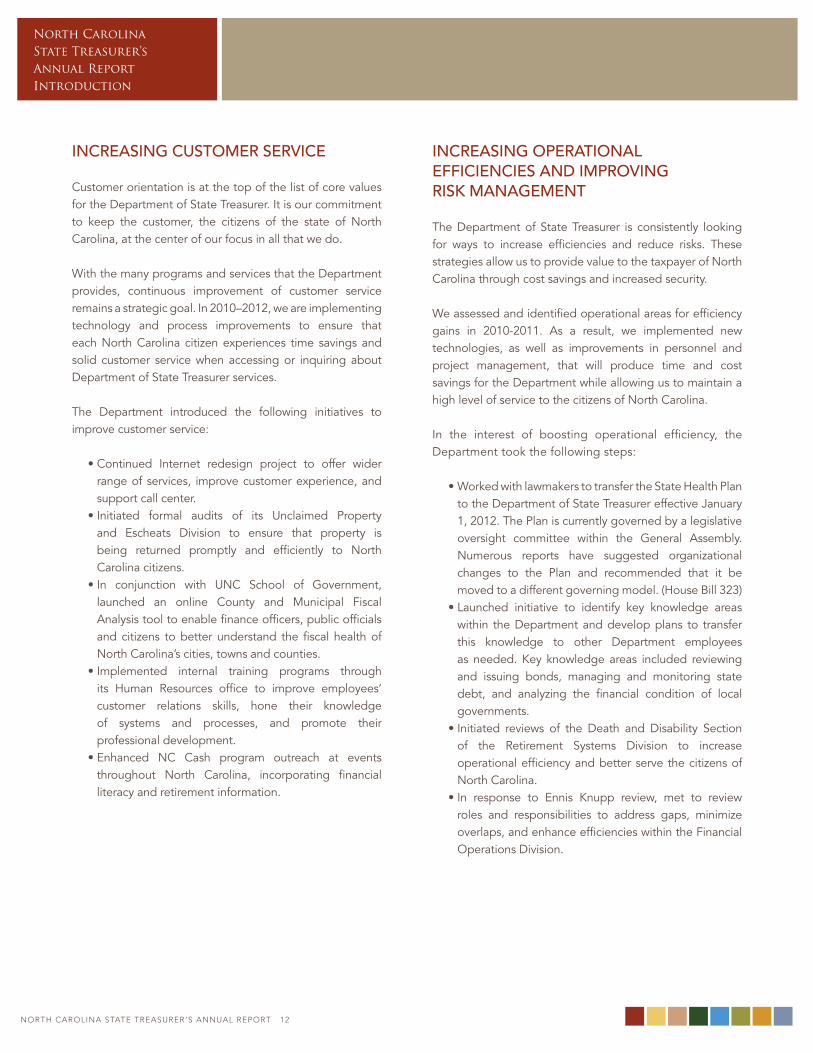
INCREASING CUSTOMER SERvICE
Customer orientation is at the top of the list of core values for the Department of State Treasurer. It is our commitment to keep the customer, the citizens of the state of North Carolina, at the center of our focus in all that we do.
with the many programs and services that the Department provides, continuous improvement of customer service remains a strategic goal. In 2010–2012, we are implementing technology and process improvements to ensure that each North Carolina citizen experiences time savings and solid customer service when accessing or inquiring about Department of State Treasurer services.
The Department introduced the following initiatives to improve customer service:
• Continued Internet redesign project to offer wider range of services, improve customer experience, and support call center.
• Initiated formal audits of its Unclaimed Property and escheats Division to ensure that property is being returned promptly and efficiently to North Carolina citizens.
• In conjunction with UNC School of government, launched an online County and municipal Fiscal Analysis tool to enable finance officers, public officials and citizens to better understand the fiscal health of North Carolina’s cities, towns and counties.
• Implemented internal training programs through its human Resources office to improve employees’ customer relations skills, hone their knowledge of systems and processes, and promote their professional development.
• enhanced NC Cash program outreach at events throughout North Carolina, incorporating financial literacy and retirement information.
INCREASING OPERATIONAL EffICIENCIES ANd IMPROvING RISk MANAGEMENT
The Department of State Treasurer is consistently looking for ways to increase efficiencies and reduce risks. These strategies allow us to provide value to the taxpayer of North Carolina through cost savings and increased security.
we assessed and identified operational areas for efficiency gains in 2010-2011. As a result, we implemented new technologies, as well as improvements in personnel and project management, that will produce time and cost savings for the Department while allowing us to maintain a high level of service to the citizens of North Carolina.
In the interest of boosting operational efficiency, the Department took the following steps:
• worked with lawmakers to transfer the State health Plan to the Department of State Treasurer effective January 1, 2012. The Plan is currently governed by a legislative oversight committee within the general Assembly. Numerous reports have suggested organizational changes to the Plan and recommended that it be moved to a different governing model. (house bill 323)
• launched initiative to identify key knowledge areas within the Department and develop plans to transfer this knowledge to other Department employees as needed. Key knowledge areas included reviewing and issuing bonds, managing and monitoring state debt, and analyzing the financial condition of local governments.
• Initiated reviews of the Death and Disability Section of the Retirement Systems Division to increase operational efficiency and better serve the citizens of North Carolina.
• In response to ennis Knupp review, met to review roles and responsibilities to address gaps, minimize overlaps, and enhance efficiencies within the Financial operations Division.
noRtH CARoLInA StAtE tREASuRER’S AnnuAL REPoRt 12 noRtH CARoLInA StAtE tREASuRER’S AnnuAL REPoRt 13
North CarolinaState Treasurer’s
Annual Report Introduction
CONTRIBUTING TO STATE INNOvATION ANd ECONOMIC dEvELOPMENT
Treasurer Cowell recognizes the importance of economic development in building and maintaining a financially strong and prosperous North Carolina. In addition, the Treasurer realizes that state innovation plays a significant role in driving economic development.
In order to encourage innovation and economic development throughout North Carolina, the Department:
• Committed $60 million in investments through the $232 million N.C. Innovation Fund, which was established in march 2010 to achieve returns for the pension fund while helping North Carolina-based businesses expand their operations and create new jobs.
• established leadership, goals, and objectives for its Diversity Council, which promotes diversity in race, culture, and ideas throughout the Department. The Council seeks to recruit and retain ethnic minorities for employment and internships, as well as ensure that diverse perspectives are considered in Departmental decision-making.
• encouraged greater ethnic and gender diversity on corporate boards by asking lawmakers, business executives, and minority leaders to participate in the Director Diversity Initiative (DDI), a joint project of the Center for banking and Finance and the Center for Civil Rights at the University of North Carolina School of law.
AdvANCING fINANCIAL LITERACY
The Department of State Treasurer is committed to helping North Carolina families increase their understanding of finances and ability to grow personal wealth. Financial literacy helps provide citizens of all ages with the information and resources to manage their finances and make important financial decisions.
The Department is engaged in a number of programs that offer financial counseling and education for all age groups, with a focus on adult financial literacy.
below are a few of the efforts that we launched in the 2010-2011 fiscal year.
• Teamed with NC ReAl (North Carolina Rural entrepreneurship through Action learning) to launch a Student entrepreneurship Tour to promote business innovation in colleges and universities throughout North Carolina.
• Partnered with vITA (volunteer Income Tax Assistance) coalitions throughout the state to promote its programs, which offer free tax preparation services, assistance with opening bank accounts, credit counseling, and financial literacy/asset building assistance to North Carolina citizens.
• Co-sponsored the second annual Financial literacy Summit with JumpStart Coalition for Financial literacy to provide training and resources to help K-12 teachers educate their students on financial management and improve their own personal financial literacy.
• Partnered with the North Carolina office of State Personnel to offer resources for displaced workers on the Financial literacy section of the Department’s website, including ways to budget after a layoff, avoid foreclosure, and find new employment.
Oak Island, North Carolina
Retirement Systems
Division
N O R T H C A R O L I N A S TAT E T R E A S U R E R ’ S
A N N U A L R E P O R T
RetirementSystems
Division
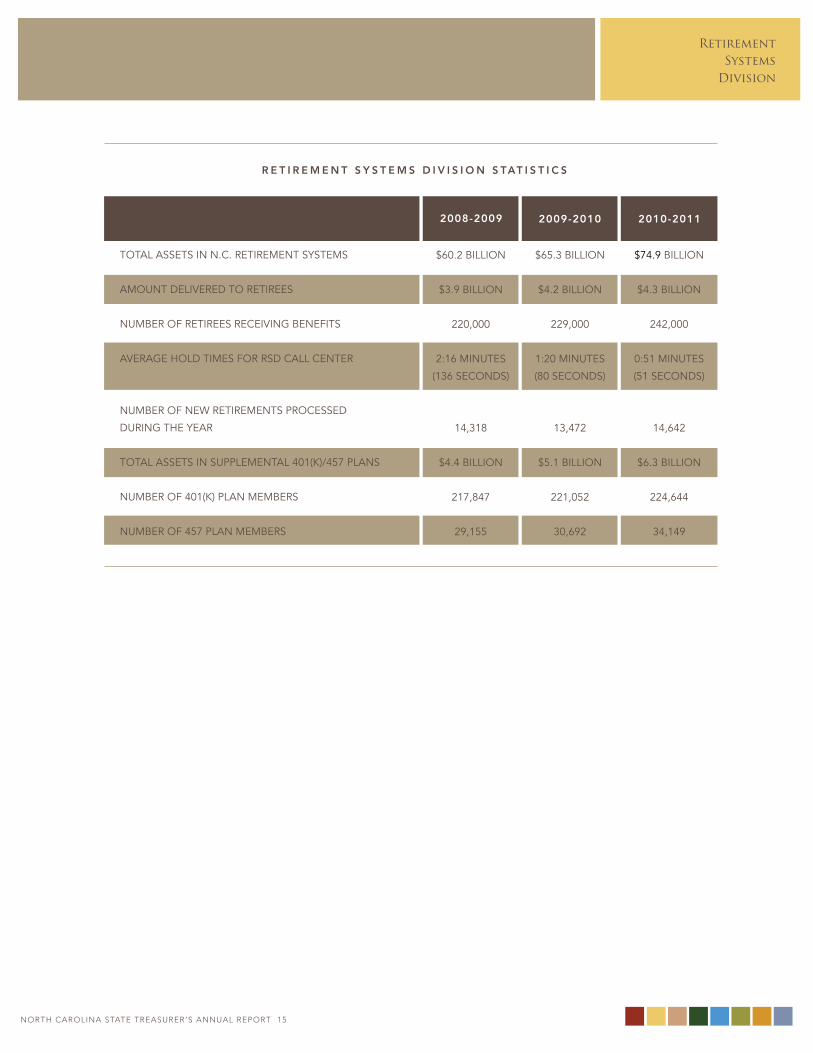
noRtH CARoLInA StAtE tREASuRER’S AnnuAL REPoRt 15
R e t i R e m e n t s y s t e m s D i v i s i o n s tat i s t i c s
$60.2 bIllIoN
$3.9 bIllIoN
220,000
2:16 mINUTeS
(136 SeCoNDS)
14,318
$4.4 bIllIoN
217,847
29,155
$65.3 bIllIoN
$4.2 bIllIoN
229,000
1:20 mINUTeS
(80 SeCoNDS)
13,472
$5.1 bIllIoN
221,052
30,692
$74.9 bIllIoN
$4.3 bIllIoN
242,000
0:51 mINUTeS
(51 SeCoNDS)
14,642
$6.3 bIllIoN
224,644
34,149
2008-2009 2009-2010 2010-2011
ToTAl ASSeTS IN N.C. ReTIRemeNT SySTemS
AmoUNT DelIveReD To ReTIReeS
NUmbeR oF ReTIReeS ReCeIvINg beNeFITS
AveRAge holD TImeS FoR RSD CAll CeNTeR
NUmbeR oF New ReTIRemeNTS PRoCeSSeD
DURINg The yeAR
ToTAl ASSeTS IN SUPPlemeNTAl 401(K)/457 PlANS
NUmbeR oF 401(K) PlAN membeRS
NUmbeR oF 457 PlAN membeRS
noRtH CARoLInA StAtE tREASuRER’S AnnuAL REPoRt 16
RetirementSystemsDivision
the Retirement Systems Division (“RSD”) of the Department of State treasurer administers the retirement and benefit plans that cover the vast majority of public employees in the state. the Division administers both the public pension plans and the nC Supplemental Retirement Plans.
The North Carolina public pension plans provide benefits for more than 850,000 North Carolinians, including:
• Teachers • State employees • Firefighters • Police officers • other public workers
The North Carolina Retirement Systems (“Systems”) is the 32nd largest pension fund in the world and the 11th largest public pension fund in the United States. RSD administers the retirement and fringe benefit plans created under state law for active and retired public employees who are members of the Systems. Staff continuously reviews features and options within the defined benefit programs to ensure that plans and benefits are sustainable over time and are an efficient use of employees’ and taxpayers’ contributions.
RSD also administers additional benefit plans, including the NC 401(k) and Deferred Compensation (NC 457) Plans, Disability, Death and certain benefits unique to law enforcement officers.
A key purpose of the retirement systems and benefit plans is to assist the public employers in the state in recruiting and retaining skilled employees for careers in public service by providing valuable post-employment benefits, including replacement income at retirement, as well as disability or survivor benefits.
The Systems’ assets, referred to as the North Carolina Pension Fund, were valued at $74.9 billion at the end of the fiscal year, an increase of $9.6 billion from the previous fiscal year.
noRtH CARoLInA StAtE tREASuRER’S AnnuAL REPoRt 16
RetirementSystems
Division
noRtH CARoLInA StAtE tREASuRER’S AnnuAL REPoRt 17
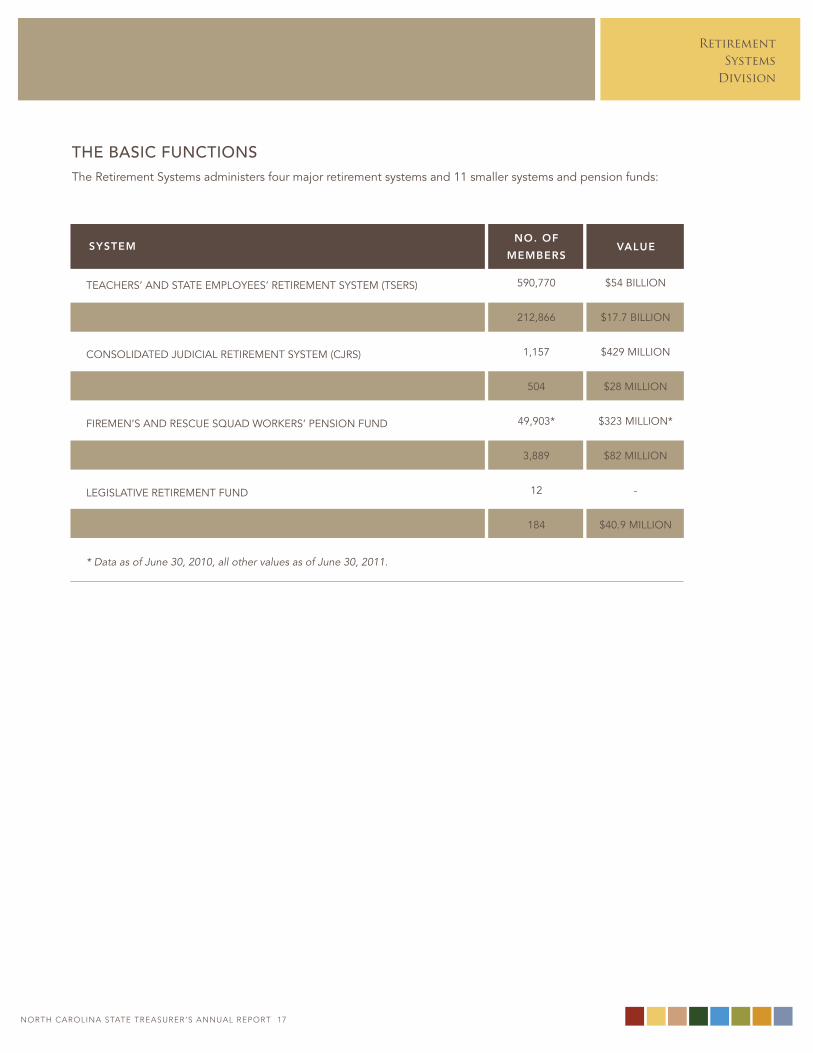
TeACheRS’ AND STATe emPloyeeS’ ReTIRemeNT SySTem (TSeRS)
loCAl goveRNmeNTAl emPloyeeS’ ReTIRemeNT SySTem (lgeRS)
CoNSolIDATeD JUDICIAl ReTIRemeNT SySTem (CJRS)
legISlATIve ReTIRemeNT SySTem (lRS)
FIRemeN’S AND ReSCUe SqUAD woRKeRS’ PeNSIoN FUND
NATIoNAl gUARD PeNSIoN PlAN
legISlATIve ReTIRemeNT FUND
RegISTeRS oF DeeDS’ SUPPlemeNTAl PeNSIoN FUND
* Data as of June 30, 2010, all other values as of June 30, 2011.
$54 bIllIoN
$17.7 bIllIoN
$429 mIllIoN
$28 mIllIoN
$323 mIllIoN*
$82 mIllIoN
-
$40.9 mIllIoN
systemno. of
membeRsvalue
590,770
212,866
1,157
504
49,903*
3,889
12
184
THE BASIC fUNCTIONSThe Retirement Systems administers four major retirement systems and 11 smaller systems and pension funds:
noRtH CARoLInA StAtE tREASuRER’S AnnuAL REPoRt 18
RetirementSystemsDivision
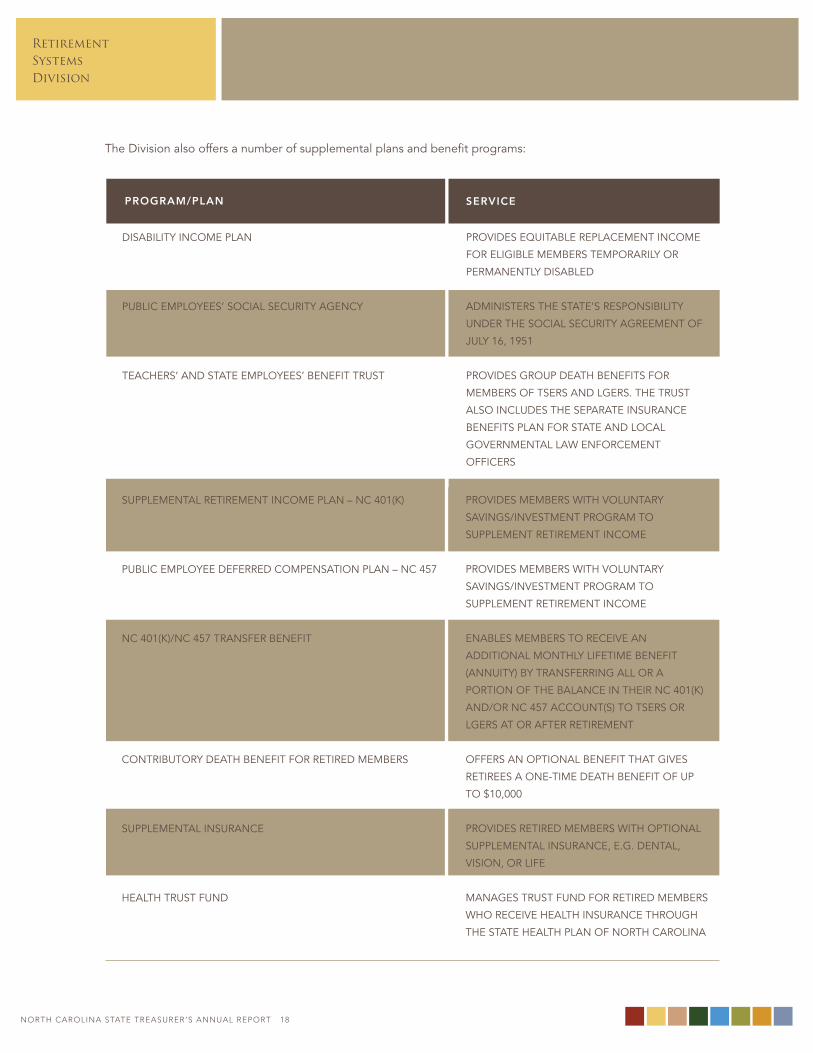
SUPPlemeNTAl ReTIRemeNT INCome PlAN – NC 401(K)
PUblIC emPloyee DeFeRReD ComPeNSATIoN PlAN – NC 457
NC 401(K)/NC 457 TRANSFeR beNeFIT
CoNTRIbUToRy DeATh beNeFIT FoR ReTIReD membeRS
SUPPlemeNTAl INSURANCe
heAlTh TRUST FUND
PRovIDeS membeRS wITh volUNTARy
SAvINgS/INveSTmeNT PRogRAm To
SUPPlemeNT ReTIRemeNT INCome
PRovIDeS membeRS wITh volUNTARy
SAvINgS/INveSTmeNT PRogRAm To
SUPPlemeNT ReTIRemeNT INCome
eNAbleS membeRS To ReCeIve AN
ADDITIoNAl moNThly lIFeTIme beNeFIT
(ANNUITy) by TRANSFeRRINg All oR A
PoRTIoN oF The bAlANCe IN TheIR NC 401(K)
AND/oR NC 457 ACCoUNT(S) To TSeRS oR
lgeRS AT oR AFTeR ReTIRemeNT
oFFeRS AN oPTIoNAl beNeFIT ThAT gIveS
ReTIReeS A oNe-TIme DeATh beNeFIT oF UP
To $10,000
PRovIDeS ReTIReD membeRS wITh oPTIoNAl
SUPPlemeNTAl INSURANCe, e.g. DeNTAl,
vISIoN, oR lIFe
mANAgeS TRUST FUND FoR ReTIReD membeRS
who ReCeIve heAlTh INSURANCe ThRoUgh
The STATe heAlTh PlAN oF NoRTh CARolINA
pRogRam/plan seRvice
DISAbIlITy INCome PlAN
PUblIC emPloyeeS’ SoCIAl SeCURITy AgeNCy
TeACheRS’ AND STATe emPloyeeS’ beNeFIT TRUST
PRovIDeS eqUITAble RePlACemeNT INCome
FoR elIgIble membeRS TemPoRARIly oR
PeRmANeNTly DISAbleD
ADmINISTeRS The STATe’S ReSPoNSIbIlITy
UNDeR The SoCIAl SeCURITy AgReemeNT oF
JUly 16, 1951
PRovIDeS gRoUP DeATh beNeFITS FoR
membeRS oF TSeRS AND lgeRS. The TRUST
AlSo INClUDeS The SePARATe INSURANCe
beNeFITS PlAN FoR STATe AND loCAl
goveRNmeNTAl lAw eNFoRCemeNT
oFFICeRS
The Division also offers a number of supplemental plans and benefit programs:
noRtH CARoLInA StAtE tREASuRER’S AnnuAL REPoRt 18
RetirementSystems
Division
noRtH CARoLInA StAtE tREASuRER’S AnnuAL REPoRt 19
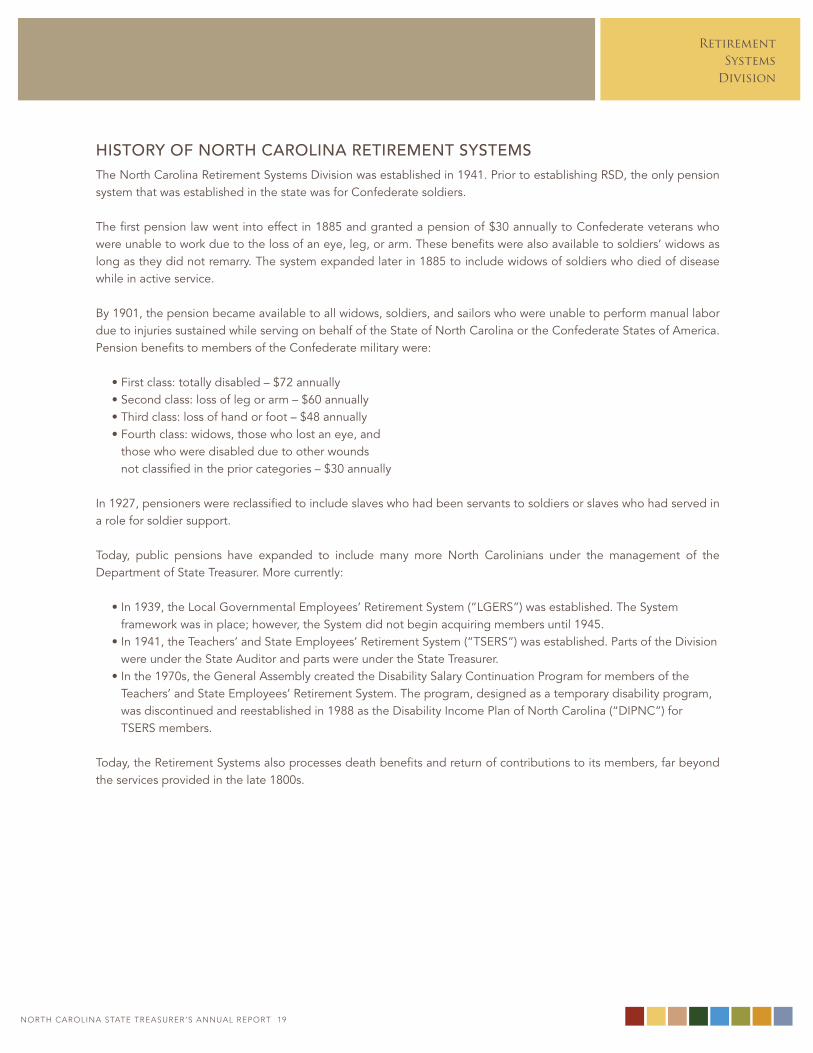
HISTORY Of NORTH CAROLINA RETIREMENT SYSTEMSThe North Carolina Retirement Systems Division was established in 1941. Prior to establishing RSD, the only pension system that was established in the state was for Confederate soldiers.
The first pension law went into effect in 1885 and granted a pension of $30 annually to Confederate veterans who were unable to work due to the loss of an eye, leg, or arm. These benefits were also available to soldiers’ widows as long as they did not remarry. The system expanded later in 1885 to include widows of soldiers who died of disease while in active service.
by 1901, the pension became available to all widows, soldiers, and sailors who were unable to perform manual labor due to injuries sustained while serving on behalf of the State of North Carolina or the Confederate States of America. Pension benefits to members of the Confederate military were:
• First class: totally disabled – $72 annually • Second class: loss of leg or arm – $60 annually • Third class: loss of hand or foot – $48 annually • Fourth class: widows, those who lost an eye, and
those who were disabled due to other wounds not classified in the prior categories – $30 annually
In 1927, pensioners were reclassified to include slaves who had been servants to soldiers or slaves who had served in a role for soldier support.
Today, public pensions have expanded to include many more North Carolinians under the management of the Department of State Treasurer. more currently:
• In 1939, the local governmental employees’ Retirement System (“lgeRS”) was established. The System framework was in place; however, the System did not begin acquiring members until 1945.
• In 1941, the Teachers’ and State employees’ Retirement System (“TSeRS”) was established. Parts of the Division were under the State Auditor and parts were under the State Treasurer.
• In the 1970s, the general Assembly created the Disability Salary Continuation Program for members of the Teachers’ and State employees’ Retirement System. The program, designed as a temporary disability program, was discontinued and reestablished in 1988 as the Disability Income Plan of North Carolina (“DIPNC”) for TSeRS members.
Today, the Retirement Systems also processes death benefits and return of contributions to its members, far beyond the services provided in the late 1800s.
noRtH CARoLInA StAtE tREASuRER’S AnnuAL REPoRt 20
RetirementSystemsDivision
teacheRs’ anD state employees’ RetiRement system
local goveRnmental employees’ RetiRement system
consoliDateD JuDicial RetiRement system
supplemental RetiRement income plans
fiRemen’s anD Rescue squaD woRKeRs’ pension funD
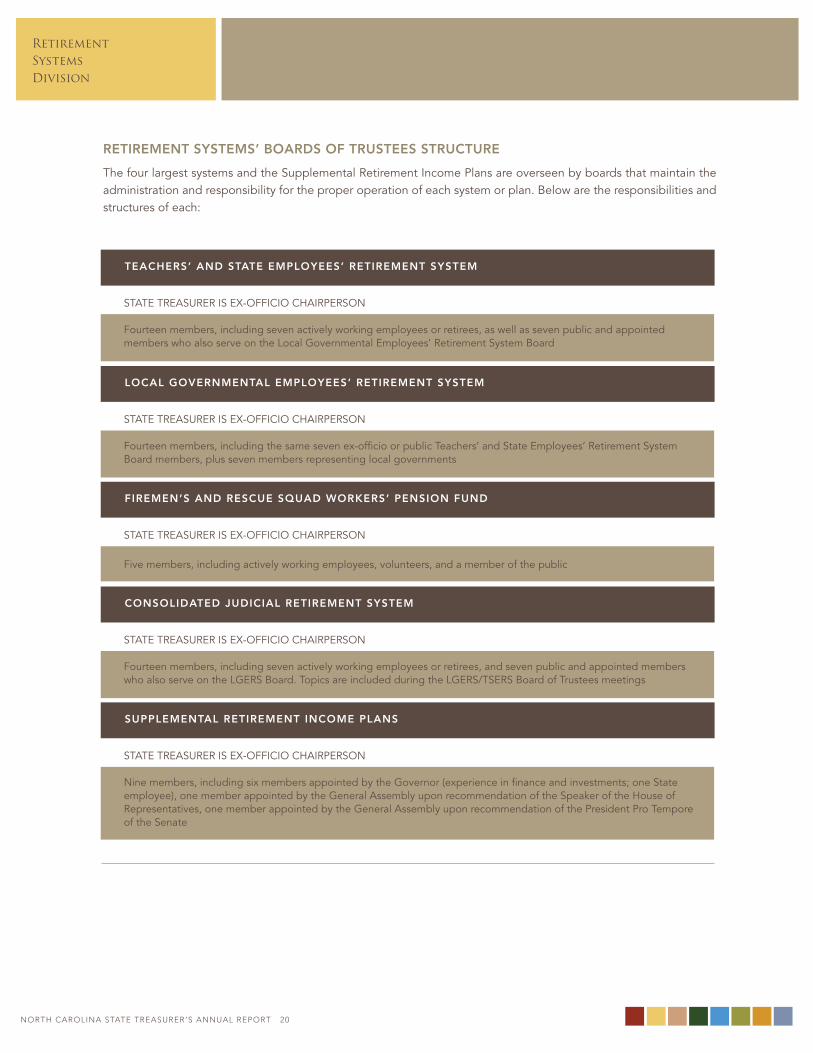
STATe TReASUReR IS ex-oFFICIo ChAIRPeRSoN
Fourteen members, including seven actively working employees or retirees, as well as seven public and appointed members who also serve on the local governmental employees’ Retirement System board
STATe TReASUReR IS ex-oFFICIo ChAIRPeRSoN
Fourteen members, including the same seven ex-officio or public Teachers’ and State employees’ Retirement System board members, plus seven members representing local governments
STATe TReASUReR IS ex-oFFICIo ChAIRPeRSoN
Fourteen members, including seven actively working employees or retirees, and seven public and appointed members who also serve on the lgeRS board. Topics are included during the lgeRS/TSeRS board of Trustees meetings
STATe TReASUReR IS ex-oFFICIo ChAIRPeRSoN
Nine members, including six members appointed by the governor (experience in finance and investments; one State employee), one member appointed by the general Assembly upon recommendation of the Speaker of the house of Representatives, one member appointed by the general Assembly upon recommendation of the President Pro Tempore of the Senate
STATe TReASUReR IS ex-oFFICIo ChAIRPeRSoN
Five members, including actively working employees, volunteers, and a member of the public
RetiRement systems’ boaRDs of tRustees stRuctuRe
The four largest systems and the Supplemental Retirement Income Plans are overseen by boards that maintain the administration and responsibility for the proper operation of each system or plan. below are the responsibilities and structures of each:
noRtH CARoLInA StAtE tREASuRER’S AnnuAL REPoRt 20
RetirementSystems
Division
noRtH CARoLInA StAtE tREASuRER’S AnnuAL REPoRt 21
dIvISION STRUCTURE Staff efforts are devoted to accurate and timely benefit distribution in the most efficient and cost-effective manner possible. In order to optimize its administration efforts, the Retirement Systems Division is divided into six working groups:
• The Director’s office • The Accounting Section • The benefits Processing Section • The member Services Section • The Records Section • The Retirement Processing Section
DiRectoR’s office
The Director’s staff is responsible for the overall operation of the Division and carrying out the policies and directives of the State Treasurer and the governing boards. They provide assistance to legislators and committees of the general Assembly, including:
• Drafting proposed legislation and acquiring actuarial notes for introduced bills
• managing action and administrative appeals by individual members of the Retirement Systems
• maintaining a working relationship with associations and organizations of employees and employers
• Providing information to state agencies, institutions, and local governments
Division operations include processing applications for retirement; processing applications to receive benefits such as contribution refunds, disability or death benefits; maintaining retirement accounts and data; and providing customer service to all active and retired employees.
accounting section
The main function of the Accounting Section is to provide on-time benefit payment services to qualified payees of the Systems in a customer-service driven environment. In addition, the section is responsible for maintaining accurate financial records for all payees, tracking records, and balancing payroll contribution reports from more than 1,200 participating public sector employers.
During the 2010-2011 fiscal year, the Accounting Section:
• Processed and balanced contribution information from employers’ payroll reports submitted each month to individual accounts in oRbIT (online Retirement benefits through Integrated Technology). The employer payroll information identifies the percentage each employee contributes to his or her retirement every pay period. by the end of the fiscal year, 418,169 members’ accounts were posted.
• enrolled 46,334 new members during the fiscal year • Distributed $4.4 billion in benefits for the fiscal year
benefits pRocessing section
The main function of the benefits Processing Section is to ensure prompt delivery of disability and death benefits for qualified employees, retirees, and their beneficiaries in an effective and efficient manner.
Staff in this section is also responsible for calculation and payment of requested refunds of accumulated employee contributions for qualified members who terminate employment. members who terminate employment with their public sector employer can apply to have their six percent of contributions made to the Retirement System refunded no sooner than 60 days after termination of employment.
This Section also manages the various death benefit programs related to the Systems and the Separate Insurance benefits Fund (“SIbF”). Responsibilities include the calculation and payment of death benefits, survivors’ alternate benefits, and other lump-sum payments.
The staff works closely with the Retirement System’s medical Review board to:
• Determine and administer both disability retirement benefits under lgeRS and TSeRS and disability benefits under the provisions of the Disability Income Plan for teachers and state employees
• Determine eligibility for disability benefits from the other retirement systems
noRtH CARoLInA StAtE tREASuRER’S AnnuAL REPoRt 22
RetirementSystemsDivision
Additional responsibilities of this Section include the calculation and payment of monthly disability benefits, as well as the calculation and payment of reimbursements for short-term disability benefits paid by the various employers under the provisions of the Disability Income Plan.
For the period of July 2010 through June 2011, the benefits Processing Section:
• Provided disability reimbursements to employers totaling $16.6 million
• Processed 7,055 death notifications • Refunded 16,592 payments for return of accumulated
contributions • Presented 3,428 new disability applications to the
medical board, a nearly eight percent increase from the previous fiscal year
• Reviewed 1,677 re-examinations for determination of continued disability benefits by the medical board
membeR seRvices section
The main function of the member Services Section is to provide public service employees and employers with accurate and timely information and to provide education about plan provisions, benefits, and available services within the Systems in a manner intended to advance partnerships and relationships.
The staff accomplish these functions by replying to letters of request, responding to incoming member calls and making on-site visitors’ counseling available to all participants in the Systems.
During the 2010-2011 fiscal year, member Services:
• Responded to 20,997 letters, e-mails, and faxes • Answered 267,860 telephone calls through the Call
Center, with an average hold time of 51 seconds, reducing the hold time by more than half compared to the previous fiscal year
• met with 2,903 members in the visitors’ office • Conducted 206 retirement planning conferences,
reaching more than 11,754 members
• Provided 18 employer education seminars, many of which included a newly developed employer disability curriculum
• enrolled five local government employers with 17 new members in the local governmental employees’ Retirement System
RecoRDs section
The main function of the Records Section is to secure incoming mail to assist with timely and accurate processing. Processes include accurately scanning, indexing, and routing documents, and electronically storing and protecting member information for the purpose of delivering benefits.
During the 2010-2011 fiscal year, the Records Section:
• Processed 69,312 membership support documents, a decrease of more than 16 percent compared to last fiscal year
• Processed 51,424 new beneficiary designation forms, an increase of almost 10 percent compared to last fiscal year
• electronically distributed more than 760,000 pages to operational staff
• Created, maintained, and stored electronic files for individuals who are currently, or have been at one time, members of any of the state-administered Retirement Systems
• maintained 20 million documents in an electronic document imaging system
noRtH CARoLInA StAtE tREASuRER’S AnnuAL REPoRt 22
RetirementSystems
Division
noRtH CARoLInA StAtE tREASuRER’S AnnuAL REPoRt 23
RetiRement pRocessing section
The main function of the Retirement Processing Section is to calculate retirement estimates for eligible members and process retirement applications for continuing benefits in a prompt, accurate, and efficient manner.
The Retirement Processing Section is responsible for:
• Determining eligibility for monthly retirement allowances
• Processing payment of benefits for all retirement systems governed by the boards of Trustees and administered by the Department
• Performing service credit purchase cost calculations for the various Retirement Systems
For the period July 2010 through June 2011, the Retirement Processing Section:
• Implemented the new NC 401(k)/NC 457 Transfer benefit option for retiring members, processing 46 applications for a lifetime monthly benefit (annuity)
• Set up 14,642 new retirements for payment, an eight percent increase from the previous fiscal year
• monitored more than 145,000 service purchase estimates through the Service Purchase estimator in members’ oRbIT accounts
• Calculated 6,551 service purchase cost calculations • estimated 6,778 retirement benefits • monitored almost 60,000 Transfer benefit estimates
through the online Transfer benefits estimator in members’ oRbIT accounts. The Transfer benefits estimator was established in December 2010.
• monitored more than one million benefit estimates through the online benefits estimators on the Department of State Treasurer’s website and in members’ oRbIT accounts. This represents a staggering 195 percent increase from the previous fiscal year. In addition to the online estimates, Division staff received member requests to complete 6,778 manually calculated benefit estimates, a three percent increase from the previous fiscal year.
fUNdING THE SYSTEMSactuaRial valuation
An actuarial valuation is prepared by an actuary to assess the funding progress of each retirement system and to determine the contribution rates necessary to sustain the system. An actuarial valuation is an inventory of the assets and liabilities of a retirement system at a specific point in time. Information collected covers all the active (both in-service and terminated) members and all the retired members and other beneficiaries who are receiving benefit payments. everyone who has been promised a benefit from the system is included in the actuarial calculations to determine the present value of the system’s liabilities.
These liabilities are then compared to the system’s assets, and calculations are made to determine what contribution rate is needed to fund the uncovered liabilities in the time period originally established. Annual valuations are made to permit gradual changes in the contribution level and/or funding period and keep the funding on a proper course.
The annual valuation also is used by the actuary to compare actual separation, compensation, and investment experience with the actuarial assumptions used in the valuation of the liabilities of the system. The actuarial valuation balance sheets for each retirement system are included with the tables that follow.
noRtH CARoLInA StAtE tREASuRER’S AnnuAL REPoRt 24
RetirementSystemsDivision
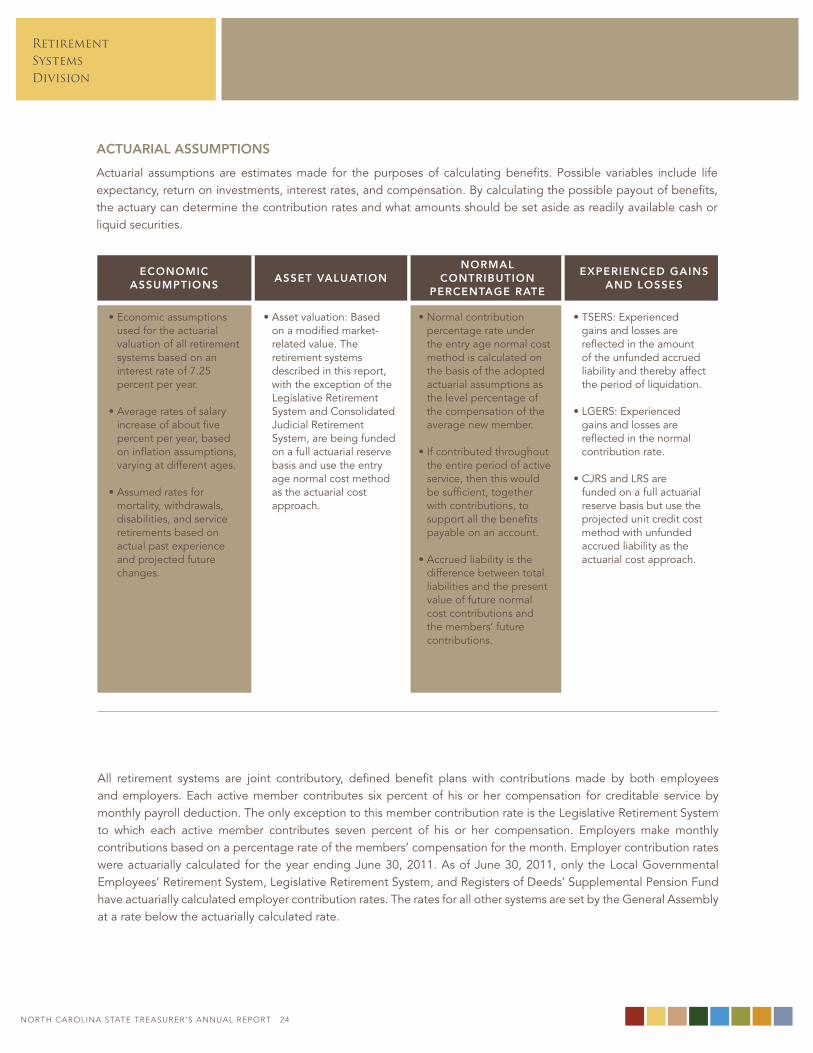
actuaRial assumptions
Actuarial assumptions are estimates made for the purposes of calculating benefits. Possible variables include life expectancy, return on investments, interest rates, and compensation. by calculating the possible payout of benefits, the actuary can determine the contribution rates and what amounts should be set aside as readily available cash or liquid securities.
economic assumptions
asset valuationnoRmal
contRibution peRcentage Rate
expeRienceD gains anD losses
• economic assumptions used for the actuarial valuation of all retirement systems based on an interest rate of 7.25 percent per year.
• Average rates of salary increase of about five percent per year, based on inflation assumptions, varying at different ages.
• Assumed rates for mortality, withdrawals, disabilities, and service retirements based on actual past experience and projected future changes.
• Asset valuation: based on a modified market-related value. The retirement systems described in this report, with the exception of the legislative Retirement System and Consolidated Judicial Retirement System, are being funded on a full actuarial reserve basis and use the entry age normal cost method as the actuarial cost approach.
• Normal contribution percentage rate under the entry age normal cost method is calculated on the basis of the adopted actuarial assumptions as the level percentage of the compensation of the average new member.
• If contributed throughout the entire period of active service, then this would be sufficient, together with contributions, to support all the benefits payable on an account.
• Accrued liability is the difference between total liabilities and the present value of future normal cost contributions and the members’ future contributions.
• TSeRS: experienced gains and losses are reflected in the amount of the unfunded accrued liability and thereby affect the period of liquidation.
• lgeRS: experienced gains and losses are reflected in the normal contribution rate.
• CJRS and lRS are funded on a full actuarial reserve basis but use the projected unit credit cost method with unfunded accrued liability as the actuarial cost approach.
All retirement systems are joint contributory, defined benefit plans with contributions made by both employees and employers. each active member contributes six percent of his or her compensation for creditable service by monthly payroll deduction. The only exception to this member contribution rate is the legislative Retirement System to which each active member contributes seven percent of his or her compensation. employers make monthly contributions based on a percentage rate of the members’ compensation for the month. employer contribution rates were actuarially calculated for the year ending June 30, 2011. As of June 30, 2011, only the local governmental employees’ Retirement System, legislative Retirement System, and Registers of Deeds’ Supplemental Pension Fund have actuarially calculated employer contribution rates. The rates for all other systems are set by the general Assembly at a rate below the actuarially calculated rate.
noRtH CARoLInA StAtE tREASuRER’S AnnuAL REPoRt 24
RetirementSystems
Division
noRtH CARoLInA StAtE tREASuRER’S AnnuAL REPoRt 25
funDing status of the systems
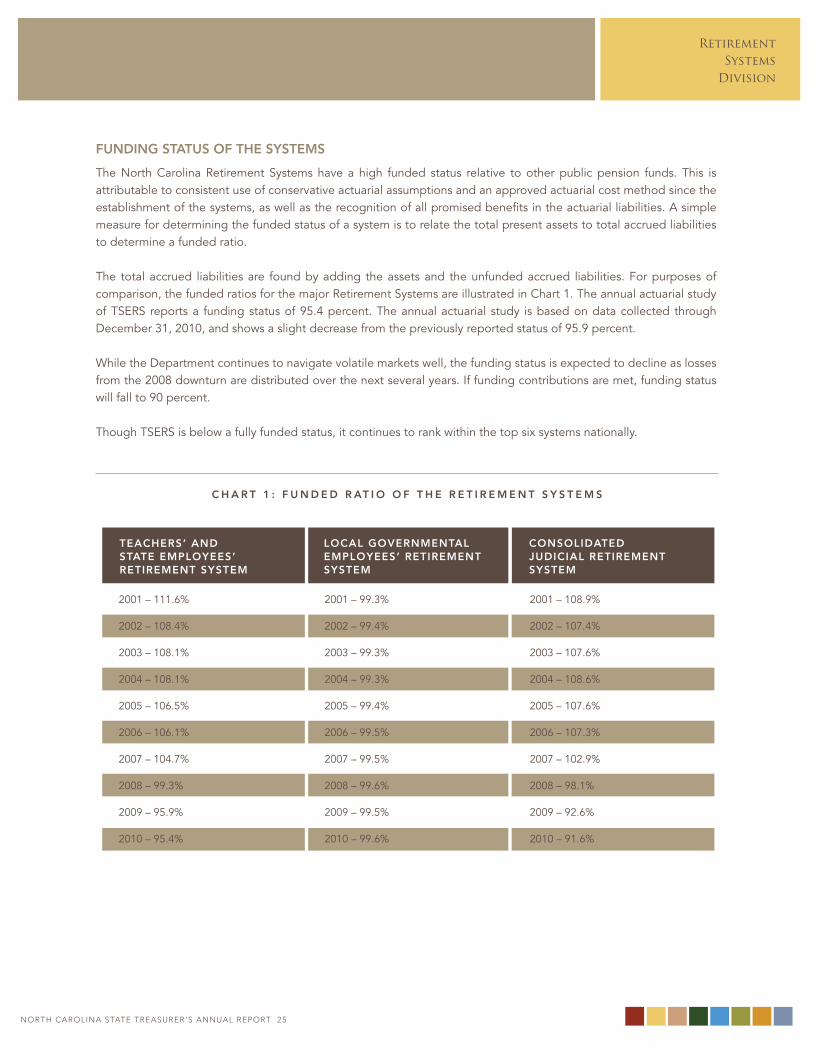
The North Carolina Retirement Systems have a high funded status relative to other public pension funds. This is attributable to consistent use of conservative actuarial assumptions and an approved actuarial cost method since the establishment of the systems, as well as the recognition of all promised benefits in the actuarial liabilities. A simple measure for determining the funded status of a system is to relate the total present assets to total accrued liabilities to determine a funded ratio.
The total accrued liabilities are found by adding the assets and the unfunded accrued liabilities. For purposes of comparison, the funded ratios for the major Retirement Systems are illustrated in Chart 1. The annual actuarial study of TSeRS reports a funding status of 95.4 percent. The annual actuarial study is based on data collected through December 31, 2010, and shows a slight decrease from the previously reported status of 95.9 percent.
while the Department continues to navigate volatile markets well, the funding status is expected to decline as losses from the 2008 downturn are distributed over the next several years. If funding contributions are met, funding status will fall to 90 percent.
Though TSeRS is below a fully funded status, it continues to rank within the top six systems nationally.
2001 – 111.6%
2002 – 108.4%
2003 – 108.1%
2004 – 108.1%
2005 – 106.5%
2006 – 106.1%
2007 – 104.7%
2008 – 99.3%
2009 – 95.9%
2010 – 95.4%
2001 – 99.3%
2002 – 99.4%
2003 – 99.3%
2004 – 99.3%
2005 – 99.4%
2006 – 99.5%
2007 – 99.5%
2008 – 99.6%
2009 – 99.5%
2010 – 99.6%
2001 – 108.9%
2002 – 107.4%
2003 – 107.6%
2004 – 108.6%
2005 – 107.6%
2006 – 107.3%
2007 – 102.9%
2008 – 98.1%
2009 – 92.6%
2010 – 91.6%
c h a R t 1 : f u n D e D R at i o o f t h e R e t i R e m e n t s y s t e m s
teacheRs’ anD state employees’ RetiRement system
local goveRnmental employees’ RetiRement system
consoliDateD JuDicial RetiRement system
noRtH CARoLInA StAtE tREASuRER’S AnnuAL REPoRt 26
RetirementSystemsDivision
teacheRs’ anD state employees’ RetiRement system of noRth caRolina n.c.g.s. §§ 135-1 thRough 135-18.5
The Teachers’ and State employees’ Retirement System (“TSeRS”) provides benefits to all full-time teachers and state employees in all public school systems, universities, departments, institutions, and agencies of the state.
TSeRS began operations with a membership of 42,878 teachers and state employees, and with appropriations from the state of $1.8 million. The membership has grown over the years in proportion to the growth in size and complexity of the public schools and state government.
Invested assets at market value amounted to $54 billion. For more information about investments for the NC Retirement Systems, please see the Investment management Division section of this Annual Report.
operations of TSeRS during calendar year 2010 resulted in:
• Total receipts of $7,093,424,384 • Total expenditures of $3,367,841,562
The latest Actuary’s valuation balance Sheet for TSeRS, as of December 31, 2010, is shown in Table T10 in the Statistical Tables Section. based on the latest actuary’s report, the general Assembly set the employer contribution rate at 4.93 percent of covered payroll, effective July 1, 2010, and at 7.44 percent of covered payroll, effective July 1, 2011. on this basis, the total of employee and employer rates of contribution is adequate to fund all future benefits presently authorized, based on current service, and to fund, over a period of nine years from January 1, 2011, the remaining accrued liability for past service.
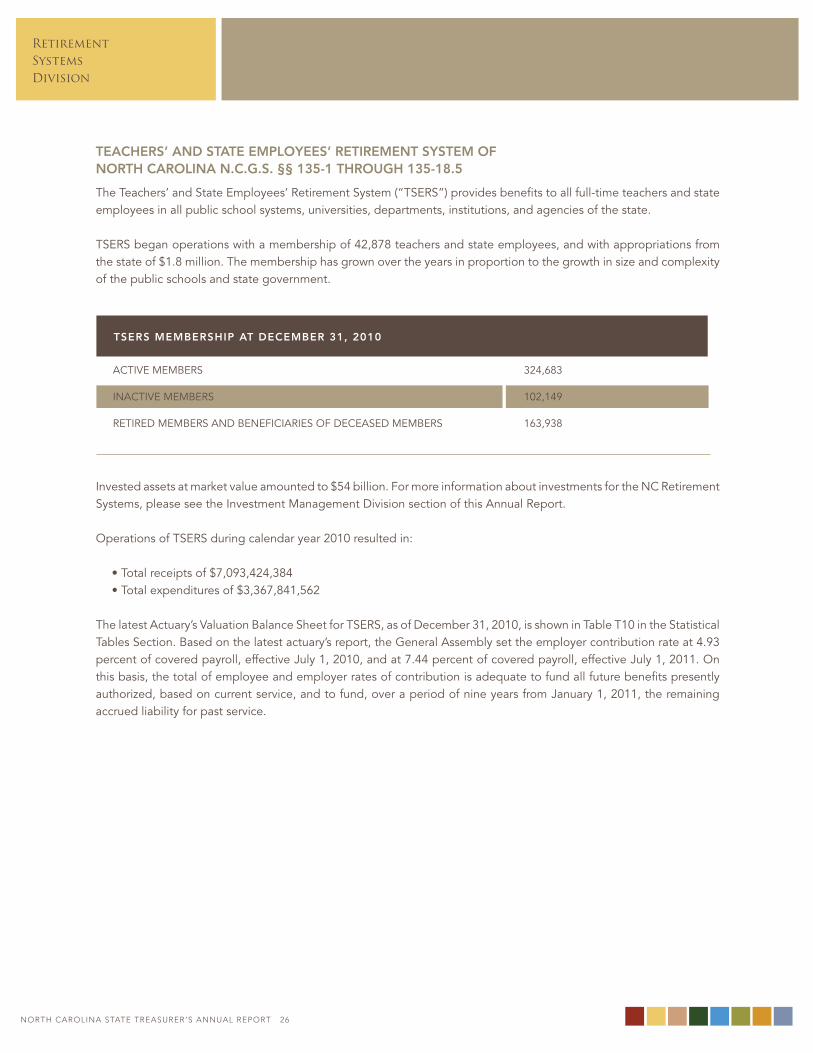
ACTIve membeRS
INACTIve membeRS
ReTIReD membeRS AND beNeFICIARIeS oF DeCeASeD membeRS
324,683
102,149
163,938
tseRs membeRship at DecembeR 31, 2010
noRtH CARoLInA StAtE tREASuRER’S AnnuAL REPoRt 26
RetirementSystems
Division
noRtH CARoLInA StAtE tREASuRER’S AnnuAL REPoRt 27
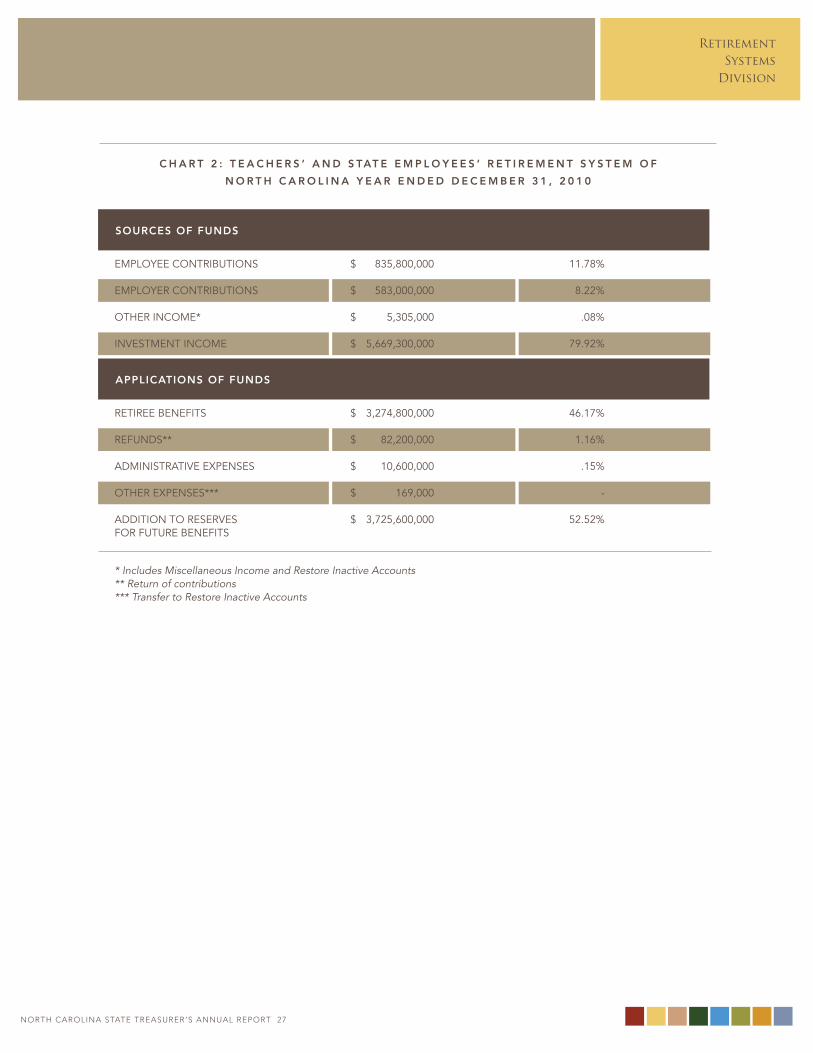
emPloyee CoNTRIbUTIoNS
emPloyeR CoNTRIbUTIoNS
oTheR INCome*
INveSTmeNT INCome
ReTIRee beNeFITS
ReFUNDS**
ADmINISTRATIve exPeNSeS
oTheR exPeNSeS***
ADDITIoN To ReSeRveS FoR FUTURe beNeFITS
* Includes Miscellaneous Income and Restore Inactive Accounts ** Return of contributions*** Transfer to Restore Inactive Accounts
$ 835,800,000
$ 583,000,000
$ 5,305,000
$ 5,669,300,000
$ 3,274,800,000
$ 82,200,000
$ 10,600,000
$ 169,000
$ 3,725,600,000
11.78%
8.22%
.08%
79.92%
46.17%
1.16%
.15%
-
52.52%
c h a R t 2 : t e a c h e R s ’ a n D s tat e e m p l o y e e s ’ R e t i R e m e n t s y s t e m o f
n o R t h c a R o l i n a y e a R e n D e D D e c e m b e R 3 1 , 2 0 1 0
souRces of funDs
applications of funDs
noRtH CARoLInA StAtE tREASuRER’S AnnuAL REPoRt 28
RetirementSystemsDivision
local goveRnmental employees’ RetiRement system of noRth caRolinan.c.g.s. §§ 128-21 thRough 128-38
The local governmental employees’ Retirement System (“lgeRS”) is maintained for the employees of cities, towns, counties, boards, commissions, and other entities of local government in North Carolina.
because initial participation by local governments is voluntary, the operation of lgeRS is dependent upon the initial acceptance and continuing financial support of the governing bodies and employees of local governments. Approval and acceptance are evidenced by the fact that, as of December 31, 2010, a total of 889 cities, towns, counties, and local commissions were participating in lgeRS.
lgeRS began operations in 1945 with 18 participating local governments, 2,102 members and assets of $178,053.
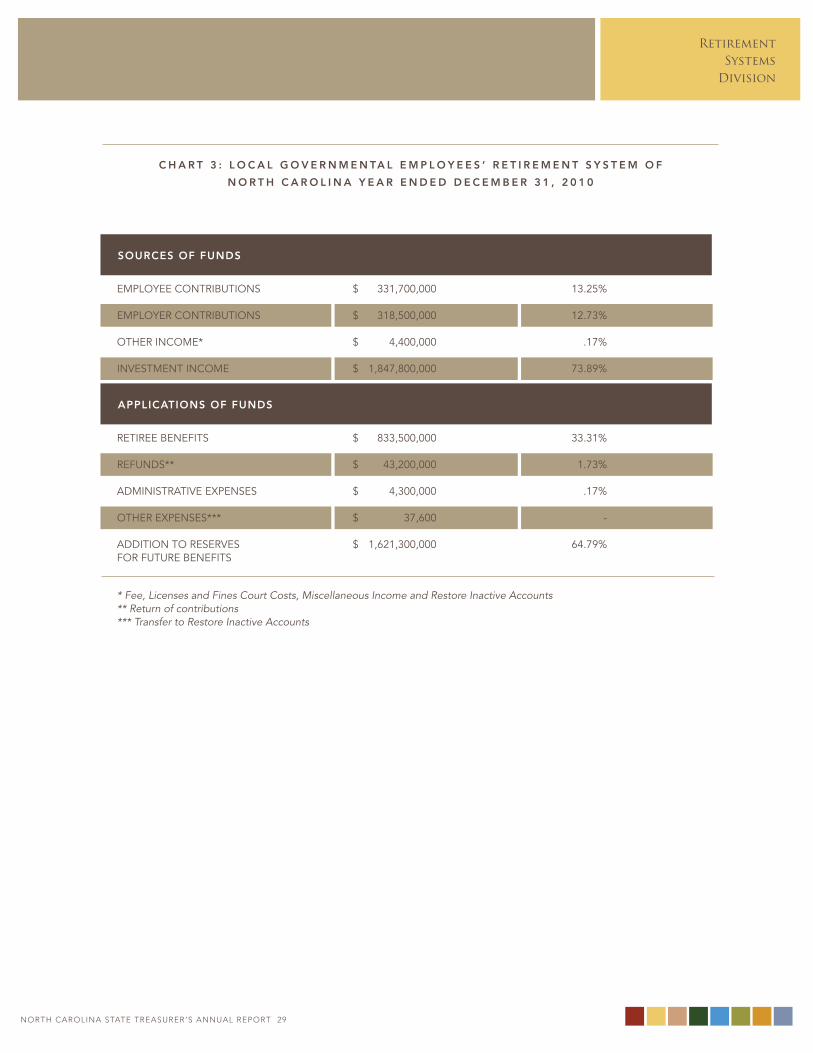
Invested assets at market value amounted to $17.7 billion. For more information about investments for the NC Retirement Systems, please see the Investment management Division section of this report.
operations of lgeRS during the calendar year 2010 resulted in:
• Total receipts of $2,502,336,289 • Total expenditures of $881,058,983
The latest Actuary’s valuation balance Sheet for lgeRS, as of December 31, 2010, is shown in Table T11 in the Statistical Tables Section. based on the actuary’s latest report, the board of Trustees set the employer normal contribution rate at 6.88 percent of covered payroll for general employees and at 7.36 percent of covered payroll for law enforcement officers, effective July 1, 2011. The accrued liability rate, if any, varies with each employing unit depending on the amount of prior service that was awarded to the members.
In accordance with the provisions of the legislation that caused the merger of the law enforcement officers’ Retirement System and lgeRS on January 1, 1986, the normal contribution rates are separate for each of the two groups of employees while the accrued liability rate is the same.
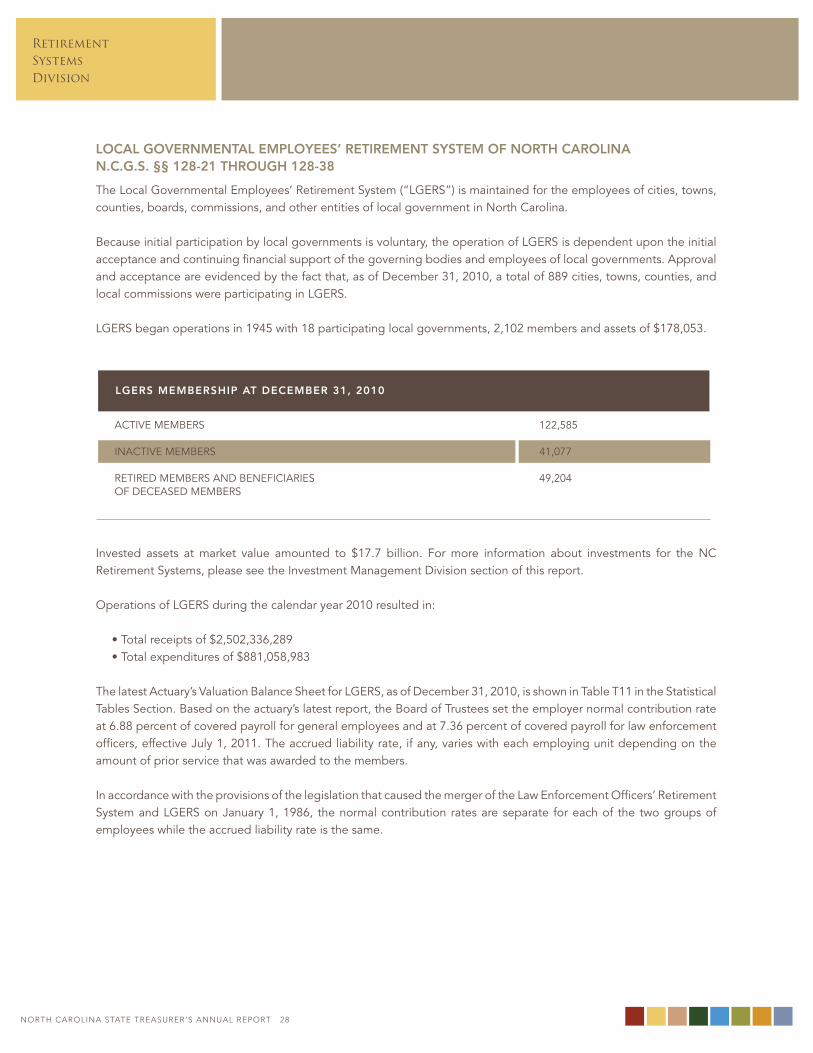
ACTIve membeRS
INACTIve membeRS
ReTIReD membeRS AND beNeFICIARIeS oF DeCeASeD membeRS
122,585
41,077
49,204
lgeRs membeRship at DecembeR 31, 2010
noRtH CARoLInA StAtE tREASuRER’S AnnuAL REPoRt 28
RetirementSystems
Division
noRtH CARoLInA StAtE tREASuRER’S AnnuAL REPoRt 29
emPloyee CoNTRIbUTIoNS
emPloyeR CoNTRIbUTIoNS
oTheR INCome*
INveSTmeNT INCome
ReTIRee beNeFITS
ReFUNDS**
ADmINISTRATIve exPeNSeS
oTheR exPeNSeS***
ADDITIoN To ReSeRveS FoR FUTURe beNeFITS
* Fee, Licenses and Fines Court Costs, Miscellaneous Income and Restore Inactive Accounts ** Return of contributions*** Transfer to Restore Inactive Accounts
$ 331,700,000
$ 318,500,000
$ 4,400,000
$ 1,847,800,000
$ 833,500,000
$ 43,200,000
$ 4,300,000
$ 37,600
$ 1,621,300,000
13.25%
12.73%
.17%
73.89%
33.31%
1.73%
.17%
-
64.79%
c h a R t 3 : l o c a l g o v e R n m e n ta l e m p l o y e e s ’ R e t i R e m e n t s y s t e m o f
n o R t h c a R o l i n a y e a R e n D e D D e c e m b e R 3 1 , 2 0 1 0
souRces of funDs
applications of funDs
noRtH CARoLInA StAtE tREASuRER’S AnnuAL REPoRt 30
RetirementSystemsDivision
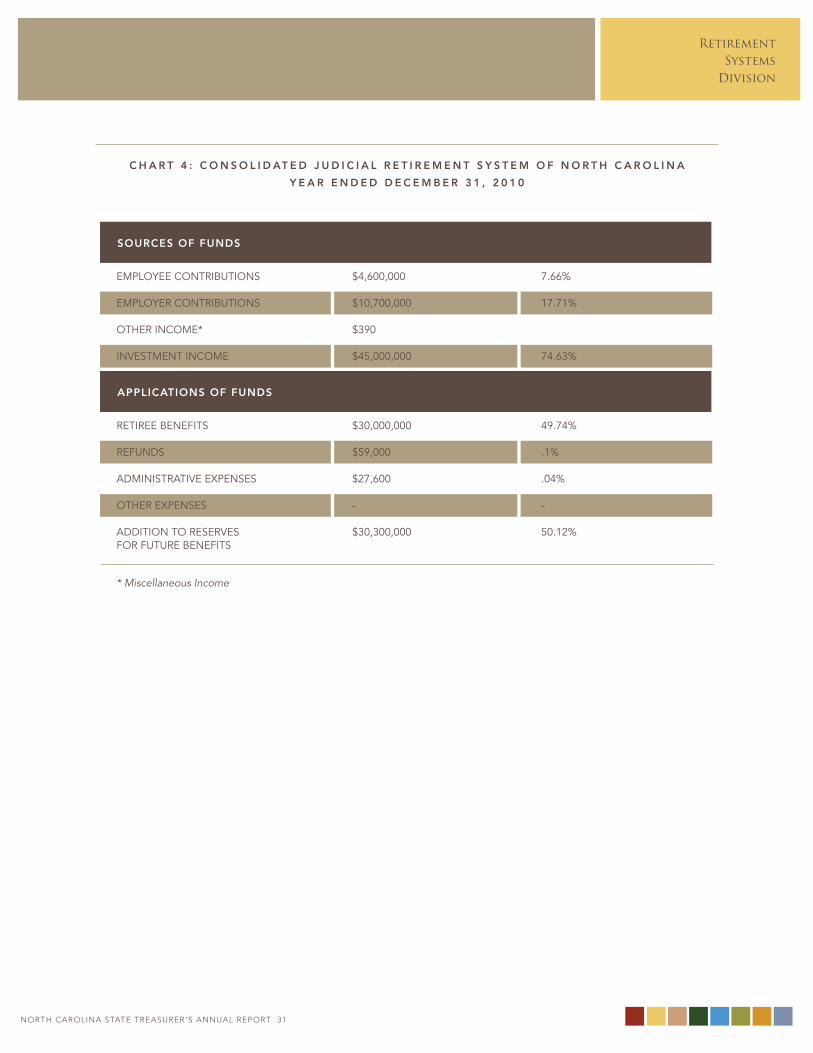
The invested assets at market value were about $429 million. For more information about investments for the NC Retirement Systems, please see the Investment management Division section of this report.
operations of the Judicial System during the calendar year 2010 resulted in:
• Total receipts of $60,376,718 • Total expenditures of $30,115,957
The latest Actuary’s valuation balance Sheet for the Judicial System, as of December 31, 2010, is shown in Table T12 in the Statistical Tables Section. based on the actuary’s latest report, the general Assembly set the employer contribution rate at 25.05 percent of covered members’ payroll, effective July 1, 2011. on this basis, the total number of member and employer rates of contribution is adequate to fund all future benefits presently authorized based on current service.
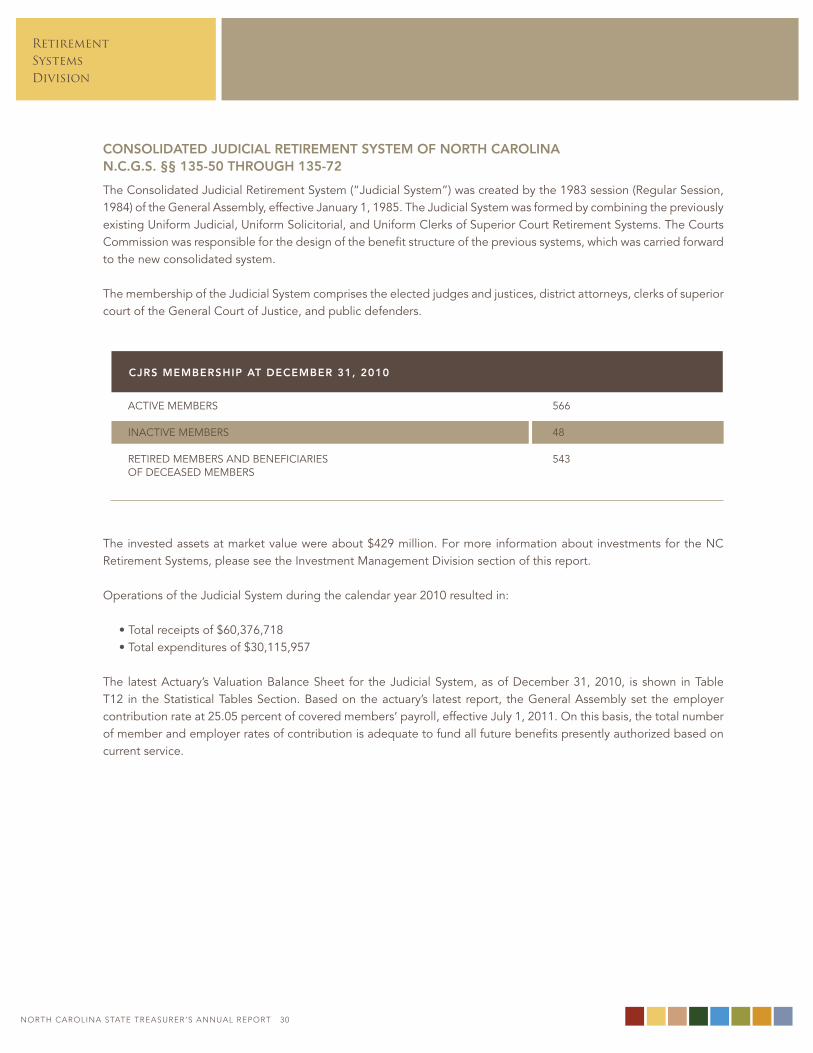
ACTIve membeRS
INACTIve membeRS
ReTIReD membeRS AND beNeFICIARIeS oF DeCeASeD membeRS
566
48
543
cJRs membeRship at DecembeR 31, 2010
consoliDateD JuDicial RetiRement system of noRth caRolinan.c.g.s. §§ 135-50 thRough 135-72
The Consolidated Judicial Retirement System (“Judicial System”) was created by the 1983 session (Regular Session, 1984) of the general Assembly, effective January 1, 1985. The Judicial System was formed by combining the previously existing Uniform Judicial, Uniform Solicitorial, and Uniform Clerks of Superior Court Retirement Systems. The Courts Commission was responsible for the design of the benefit structure of the previous systems, which was carried forward to the new consolidated system.
The membership of the Judicial System comprises the elected judges and justices, district attorneys, clerks of superior court of the general Court of Justice, and public defenders.
noRtH CARoLInA StAtE tREASuRER’S AnnuAL REPoRt 30
RetirementSystems
Division
noRtH CARoLInA StAtE tREASuRER’S AnnuAL REPoRt 31
c h a R t 4 : c o n s o l i D at e D J u D i c i a l R e t i R e m e n t s y s t e m o f n o R t h c a R o l i n a
y e a R e n D e D D e c e m b e R 3 1 , 2 0 1 0
emPloyee CoNTRIbUTIoNS
emPloyeR CoNTRIbUTIoNS
oTheR INCome*
INveSTmeNT INCome
ReTIRee beNeFITS
ReFUNDS
ADmINISTRATIve exPeNSeS
oTheR exPeNSeS
ADDITIoN To ReSeRveS FoR FUTURe beNeFITS
* Miscellaneous Income
$4,600,000
$10,700,000
$390
$45,000,000
$30,000,000 $59,000
$27,600
-
$30,300,000
7.66%
17.71%
74.63%
49.74%
.1%
.04%
-
50.12%
souRces of funDs
applications of funDs
noRtH CARoLInA StAtE tREASuRER’S AnnuAL REPoRt 32
RetirementSystemsDivision
legislative RetiRement system n.c.g.s. §§ 120-4.8 thRough 120-4.29
The legislative Retirement System was created by the 1983 session of the general Assembly as a retirement plan for members of the general Assembly. The membership also includes:
• members who were vested or had maintained contributions in the legislative Retirement Fund
• Those retirees receiving a benefit from the legislative Fund who elect to transfer to the legislative Retirement System
As of December 31, 2010, assets totaled $28,456,897. For more information about investments for the NC Retirement Systems, please see the Investment management Division section of this report.
based on the latest actuarial report, the employer contribution rate was set by the general Assembly at 0 percent of covered payroll effective July 1, 2011. on this basis, the total of employee and employer rates of contribution is adequate to fund all future benefits presently authorized.
ACTIve membeRS
INACTIve membeRS
ReTIReD membeRS
169
77
258
lRs membeRship at DecembeR 31, 2010
m e m b e R s ’ 4 0 1 ( K ) i n v e s t m e n t c h o i c e s
eqUITy FUNDS 60.52%
STAble vAlUe 29.87%
FIxeD INCome 9.61%
noRtH CARoLInA StAtE tREASuRER’S AnnuAL REPoRt 32
RetirementSystems
Division
noRtH CARoLInA StAtE tREASuRER’S AnnuAL REPoRt 33
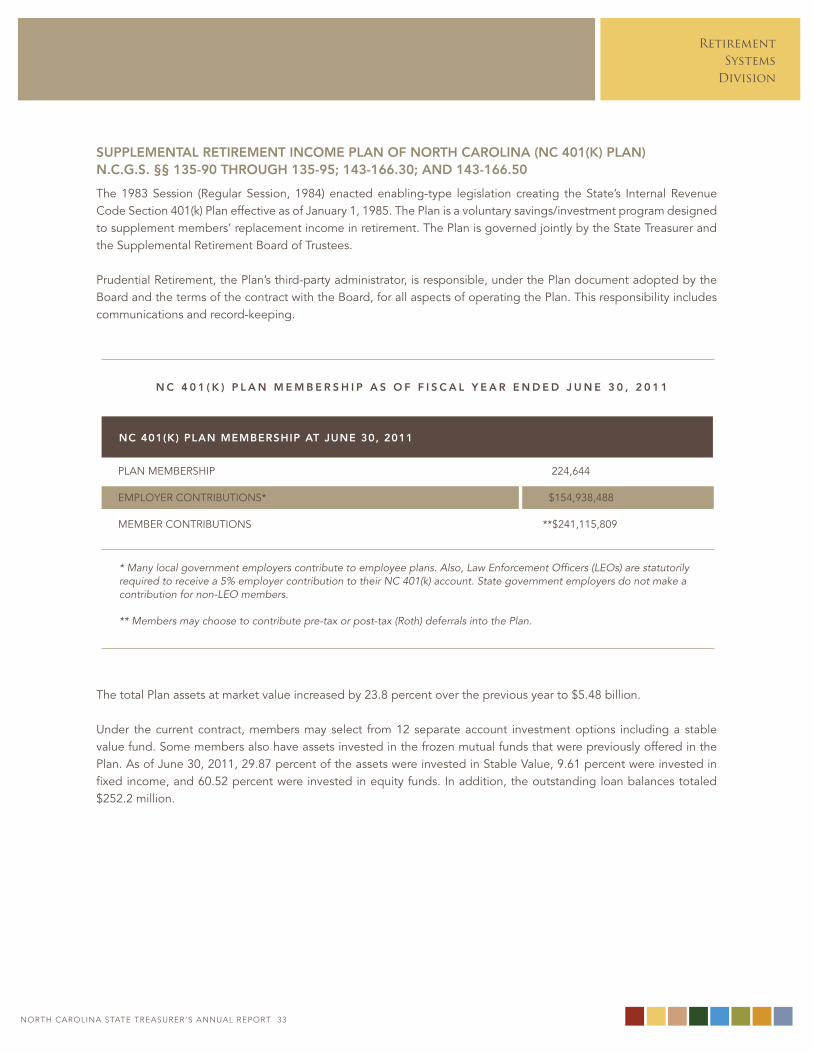
supplemental RetiRement income plan of noRth caRolina (nc 401(K) plan)n.c.g.s. §§ 135-90 thRough 135-95; 143-166.30; anD 143-166.50
The 1983 Session (Regular Session, 1984) enacted enabling-type legislation creating the State’s Internal Revenue Code Section 401(k) Plan effective as of January 1, 1985. The Plan is a voluntary savings/investment program designed to supplement members’ replacement income in retirement. The Plan is governed jointly by the State Treasurer and the Supplemental Retirement board of Trustees.
Prudential Retirement, the Plan’s third-party administrator, is responsible, under the Plan document adopted by the board and the terms of the contract with the board, for all aspects of operating the Plan. This responsibility includes communications and record-keeping.
The total Plan assets at market value increased by 23.8 percent over the previous year to $5.48 billion.
Under the current contract, members may select from 12 separate account investment options including a stable value fund. Some members also have assets invested in the frozen mutual funds that were previously offered in the Plan. As of June 30, 2011, 29.87 percent of the assets were invested in Stable value, 9.61 percent were invested in fixed income, and 60.52 percent were invested in equity funds. In addition, the outstanding loan balances totaled $252.2 million.
PlAN membeRShIP
emPloyeR CoNTRIbUTIoNS*
membeR CoNTRIbUTIoNS
* Many local government employers contribute to employee plans. Also, Law Enforcement Officers (LEOs) are statutorily required to receive a 5% employer contribution to their NC 401(k) account. State government employers do not make a contribution for non-LEO members.
** Members may choose to contribute pre-tax or post-tax (Roth) deferrals into the Plan.
224,644
$154,938,488
**$241,115,809
n c 4 0 1 ( K ) p l a n m e m b e R s h i p a s o f f i s c a l y e a R e n D e D J u n e 3 0 , 2 0 1 1
nc 401(K) plan membeRship at June 30, 2011
noRtH CARoLInA StAtE tREASuRER’S AnnuAL REPoRt 34
RetirementSystemsDivision
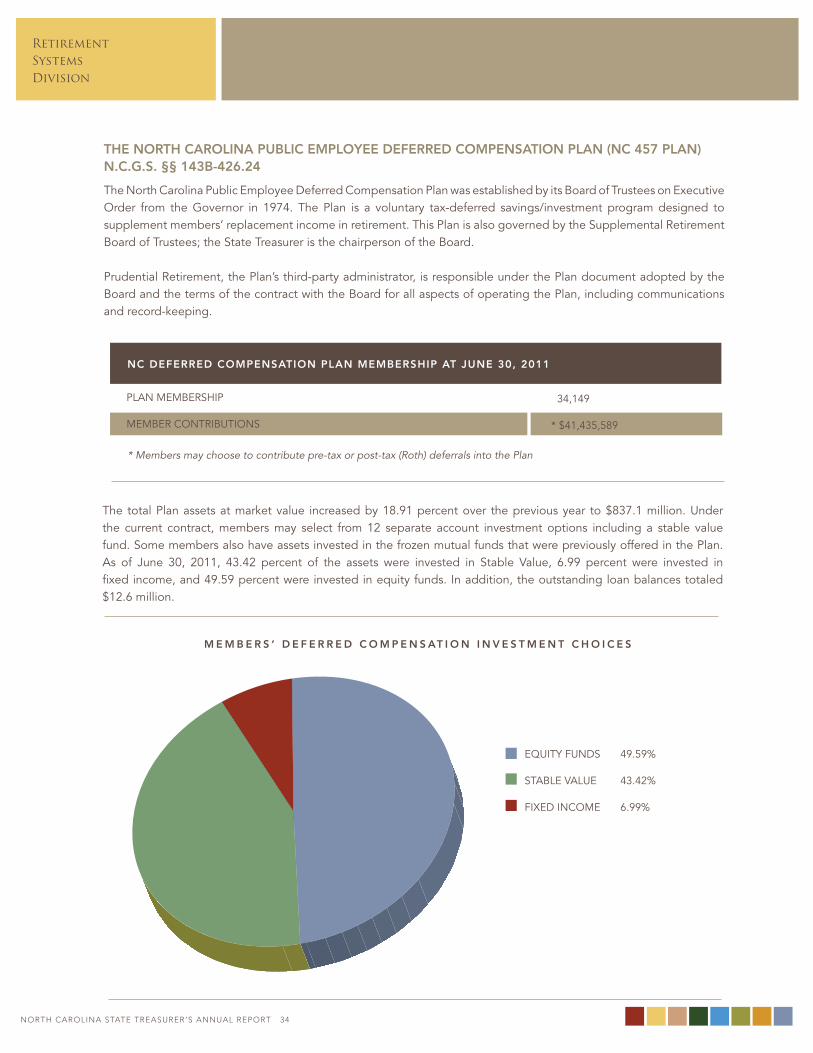
the noRth caRolina public employee DefeRReD compensation plan (nc 457 plan)n.c.g.s. §§ 143b-426.24
The North Carolina Public employee Deferred Compensation Plan was established by its board of Trustees on executive order from the governor in 1974. The Plan is a voluntary tax-deferred savings/investment program designed to supplement members’ replacement income in retirement. This Plan is also governed by the Supplemental Retirement board of Trustees; the State Treasurer is the chairperson of the board.
Prudential Retirement, the Plan’s third-party administrator, is responsible under the Plan document adopted by the board and the terms of the contract with the board for all aspects of operating the Plan, including communications and record-keeping.
PlAN membeRShIP
membeR CoNTRIbUTIoNS
34,149
* $41,435,589
nc DefeRReD compensation plan membeRship at June 30, 2011
* Members may choose to contribute pre-tax or post-tax (Roth) deferrals into the Plan
The total Plan assets at market value increased by 18.91 percent over the previous year to $837.1 million. Under the current contract, members may select from 12 separate account investment options including a stable value fund. Some members also have assets invested in the frozen mutual funds that were previously offered in the Plan. As of June 30, 2011, 43.42 percent of the assets were invested in Stable value, 6.99 percent were invested in fixed income, and 49.59 percent were invested in equity funds. In addition, the outstanding loan balances totaled $12.6 million.
m e m b e R s ’ D e f e R R e D c o m p e n s at i o n i n v e s t m e n t c h o i c e s
eqUITy FUNDS 49.59%
STAble vAlUe 43.42%
FIxeD INCome 6.99%
noRtH CARoLInA StAtE tREASuRER’S AnnuAL REPoRt 34
RetirementSystems
Division
noRtH CARoLInA StAtE tREASuRER’S AnnuAL REPoRt 35
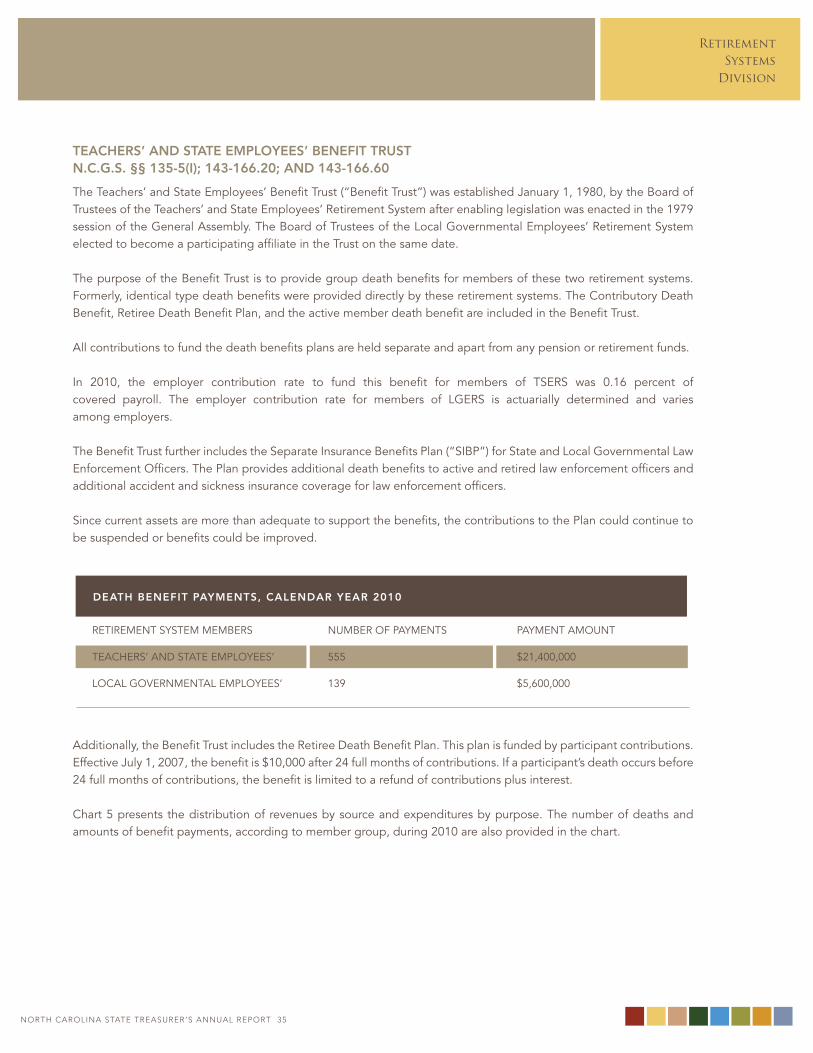
teacheRs’ anD state employees’ benefit tRustn.c.g.s. §§ 135-5(i); 143-166.20; anD 143-166.60
The Teachers’ and State employees’ benefit Trust (“benefit Trust”) was established January 1, 1980, by the board of Trustees of the Teachers’ and State employees’ Retirement System after enabling legislation was enacted in the 1979 session of the general Assembly. The board of Trustees of the local governmental employees’ Retirement System elected to become a participating affiliate in the Trust on the same date.
The purpose of the benefit Trust is to provide group death benefits for members of these two retirement systems. Formerly, identical type death benefits were provided directly by these retirement systems. The Contributory Death benefit, Retiree Death benefit Plan, and the active member death benefit are included in the benefit Trust.
All contributions to fund the death benefits plans are held separate and apart from any pension or retirement funds.
In 2010, the employer contribution rate to fund this benefit for members of TSeRS was 0.16 percent of covered payroll. The employer contribution rate for members of lgeRS is actuarially determined and varies among employers.
The benefit Trust further includes the Separate Insurance benefits Plan (“SIbP”) for State and local governmental law enforcement officers. The Plan provides additional death benefits to active and retired law enforcement officers and additional accident and sickness insurance coverage for law enforcement officers.
Since current assets are more than adequate to support the benefits, the contributions to the Plan could continue to be suspended or benefits could be improved.
Additionally, the benefit Trust includes the Retiree Death benefit Plan. This plan is funded by participant contributions. effective July 1, 2007, the benefit is $10,000 after 24 full months of contributions. If a participant’s death occurs before 24 full months of contributions, the benefit is limited to a refund of contributions plus interest.
Chart 5 presents the distribution of revenues by source and expenditures by purpose. The number of deaths and amounts of benefit payments, according to member group, during 2010 are also provided in the chart.
ReTIRemeNT SySTem membeRS
TeACheRS’ AND STATe emPloyeeS’
loCAl goveRNmeNTAl emPloyeeS’
NUmbeR oF PAymeNTS
555
139
PAymeNT AmoUNT
$21,400,000
$5,600,000
Death benefit payments, calenDaR yeaR 2010
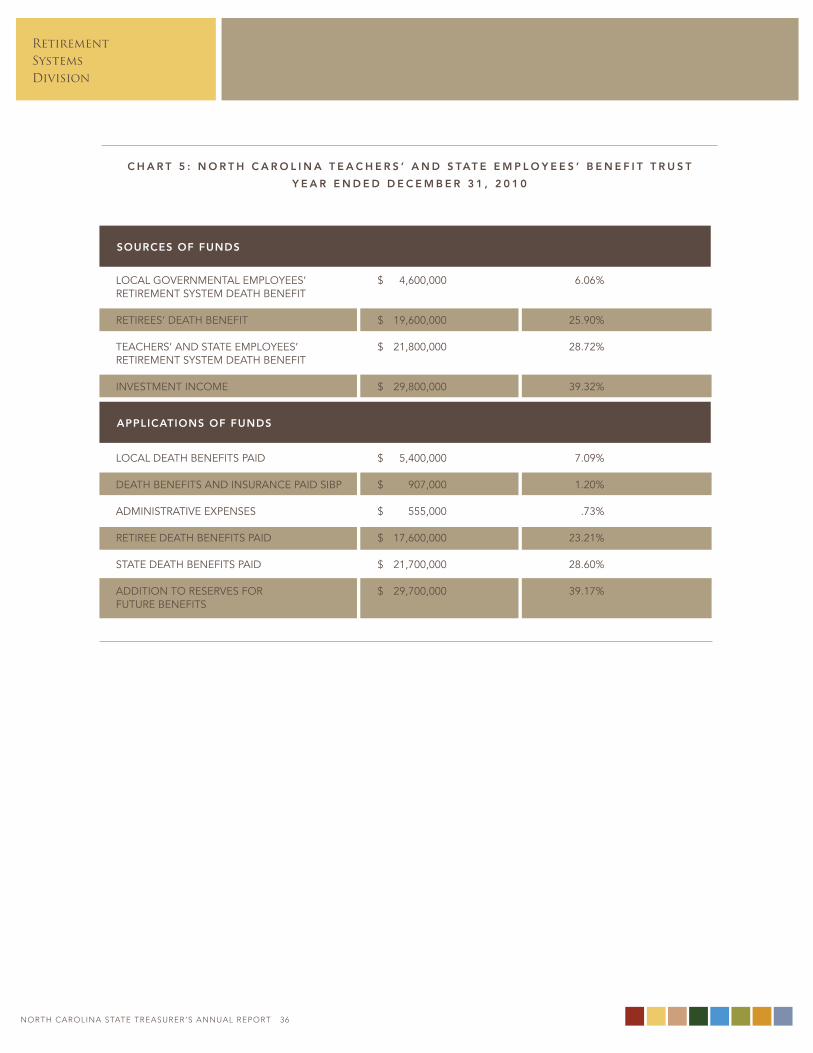
noRtH CARoLInA StAtE tREASuRER’S AnnuAL REPoRt 36
RetirementSystemsDivision
loCAl goveRNmeNTAl emPloyeeS’ ReTIRemeNT SySTem DeATh beNeFIT
ReTIReeS’ DeATh beNeFIT
TeACheRS’ AND STATe emPloyeeS’ ReTIRemeNT SySTem DeATh beNeFIT
INveSTmeNT INCome
loCAl DeATh beNeFITS PAID
DeATh beNeFITS AND INSURANCe PAID SIbP
ADmINISTRATIve exPeNSeS
ReTIRee DeATh beNeFITS PAID
STATe DeATh beNeFITS PAID
ADDITIoN To ReSeRveS FoR FUTURe beNeFITS
$ 4,600,000
$ 19,600,000
$ 21,800,000
$ 29,800,000
$ 5,400,000
$ 907,000
$ 555,000
$ 17,600,000
$ 21,700,000
$ 29,700,000
6.06%
25.90%
28.72%
39.32%
7.09%
1.20%
.73%
23.21%
28.60%
39.17%
c h a R t 5 : n o R t h c a R o l i n a t e a c h e R s ’ a n D s tat e e m p l o y e e s ’ b e n e f i t t R u s t
y e a R e n D e D D e c e m b e R 3 1 , 2 0 1 0
souRces of funDs
applications of funDs
noRtH CARoLInA StAtE tREASuRER’S AnnuAL REPoRt 36
RetirementSystems
Division
noRtH CARoLInA StAtE tREASuRER’S AnnuAL REPoRt 37
fiRemen’s anD Rescue squaD woRKeRs’ pension funDn.c.g.s. §§ 58-86-1 thRough 58-86-90
The Firemen’s and Rescue Squad workers’ Pension Fund was created by the general Assembly in 1959 to pro-vide benefits for certified firemen. The statutes were amended to include certified rescue squad workers beginning January 1, 1982.
both volunteer and paid personnel are included in the membership. Funded by an initial appropriation of $235,000, retroactive benefit payments amounting to $210,700 were made to 362 retirees during August 1962 to cover all ben-efits due and payable since July 1, 1961.
Invested assets at market value amounted to about $323.35 million. For more information about investments for the NC Retirement Systems, please see the Investment management Division section of this report.
operations of the Firemen’s and Rescue Squad workers’ Pension Fund during the 2010 fiscal year resulted in:
• Total receipts of $64,336,894 • Total expenditures of $24,633,459
The latest Actuary’s valuation balance Sheet, as of June 30, 2010, is shown in Table T13 in the Statistical Tables Sec-tion. based on the latest actuary’s report, the general Assembly appropriated $10.1 million for the 2010–2011 fiscal year. The annual appropriations will fund all future benefits, based on current service, and will fund, over a period of nine years from June 30, 2011, the remaining accrued liabilities for past service.
Chart 6 presents the distribution of revenues by source and expenditures by purpose.
fiRemen’s anD Rescue squaD woRKeRs’ membeRship at June 30, 2010
ACTIve membeRS
ReTIReD membeRS
38,484
11,298
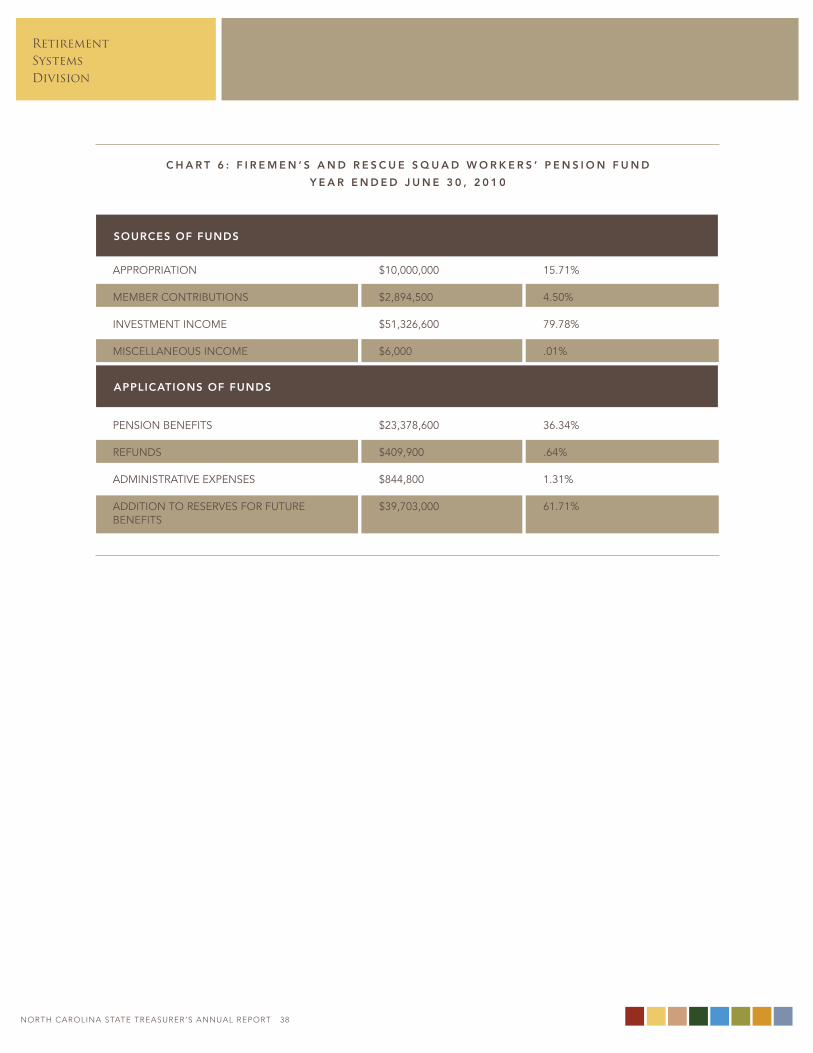
noRtH CARoLInA StAtE tREASuRER’S AnnuAL REPoRt 38
RetirementSystemsDivision
c h a R t 6 : f i R e m e n ’ s a n D R e s c u e s q u a D w o R K e R s ’ p e n s i o n f u n D
y e a R e n D e D J u n e 3 0 , 2 0 1 0
APPRoPRIATIoN
membeR CoNTRIbUTIoNS
INveSTmeNT INCome
mISCellANeoUS INCome
PeNSIoN beNeFITS
ReFUNDS
ADmINISTRATIve exPeNSeS
ADDITIoN To ReSeRveS FoR FUTURe beNeFITS
$10,000,000
$2,894,500
$51,326,600
$6,000
$23,378,600
$409,900
$844,800
$39,703,000
15.71%
4.50%
79.78%
.01%
36.34%
.64%
1.31%
61.71%
souRces of funDs
applications of funDs
noRtH CARoLInA StAtE tREASuRER’S AnnuAL REPoRt 38
RetirementSystems
Division
noRtH CARoLInA StAtE tREASuRER’S AnnuAL REPoRt 39
RETIREES’ HEALTH PREMIUMS fUNdSFunds are remitted from employers through their monthly oRbIT payroll reporting process to pay individual coverage costs of retirees’ health insurance. This coverage is under the State’s health plan. Retirees from the Teachers’ and State employees’, Consolidated Judicial, and legislative Retirement Systems are eligible for coverage. legislation allows selected employers in the local governmental employees’ Retirement System to participate in the Retirees’ health Premiums Fund. The method of collecting the employers’ payments is a surcharge on active members’ payroll payable with the employer contribution rate to the affected retirement system.
financial infoRmation foR 2010beginning Fund balance $556,303,039
aDDitions:employer Contributions $708,031,560Investment Income $7,455,362
DeDuctions:health Premiums Paid $616,040,295Administrative expense $304,605ending Fund balance $655,445,062
legislative RetiRement funDn.c.g.s. §§ 120-4.1 thRough 120-4.2
The legislative Retirement Fund was created by the 1969 session of the general Assembly as a retirement plan for members and elected officers of the North Carolina general Assembly. The Fund was abolished by the 1973 session (second session 1974). The abolishing act preserved the vested and inchoate rights of the members in the Fund so that all members and former members of the general Assembly, who had qualified by virtue of service as of 1974, are still in receipt of monthly allowances or may apply for and receive monthly allowances at age 65.
In the year ended December 31, 2010, there were 12 former members and officers of the general Assembly in receipt of allowances with a cost of $18,900. This cost is funded by a contribution of 5 percent of compensation paid by mem-bers at retirement and an annual general fund appropriation made to the general Assembly. This fund is not operated as a retirement fund, but as an expendable trust fund. In this expendable trust, money is not added to the fund. only the 12 members who applied for retirement during the years of operation are covered in this fund.
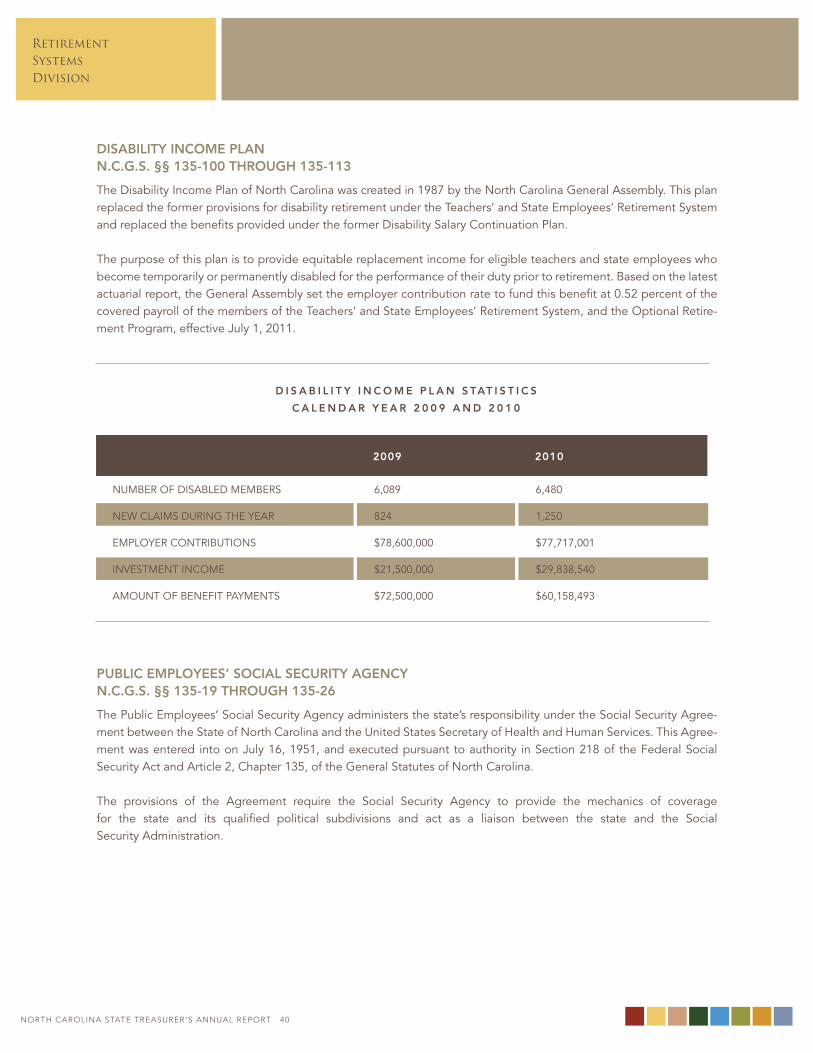
noRtH CARoLInA StAtE tREASuRER’S AnnuAL REPoRt 40
RetirementSystemsDivision
Disability income plann.c.g.s. §§ 135-100 thRough 135-113
The Disability Income Plan of North Carolina was created in 1987 by the North Carolina general Assembly. This plan replaced the former provisions for disability retirement under the Teachers’ and State employees’ Retirement System and replaced the benefits provided under the former Disability Salary Continuation Plan.
The purpose of this plan is to provide equitable replacement income for eligible teachers and state employees who become temporarily or permanently disabled for the performance of their duty prior to retirement. based on the latest actuarial report, the general Assembly set the employer contribution rate to fund this benefit at 0.52 percent of the covered payroll of the members of the Teachers’ and State employees’ Retirement System, and the optional Retire-ment Program, effective July 1, 2011.
public employees’ social secuRity agencyn.c.g.s. §§ 135-19 thRough 135-26
The Public employees’ Social Security Agency administers the state’s responsibility under the Social Security Agree-ment between the State of North Carolina and the United States Secretary of health and human Services. This Agree-ment was entered into on July 16, 1951, and executed pursuant to authority in Section 218 of the Federal Social Security Act and Article 2, Chapter 135, of the general Statutes of North Carolina.
The provisions of the Agreement require the Social Security Agency to provide the mechanics of coverage for the state and its qualified political subdivisions and act as a liaison between the state and the Social Security Administration.
NUmbeR oF DISAbleD membeRS
New ClAImS DURINg The yeAR
emPloyeR CoNTRIbUTIoNS
INveSTmeNT INCome
AmoUNT oF beNeFIT PAymeNTS
6,089
824
$78,600,000
$21,500,000
$72,500,000
6,480
1,250
$77,717,001
$29,838,540
$60,158,493
D i s a b i l i t y i n c o m e p l a n s tat i s t i c s
c a l e n D a R y e a R 2 0 0 9 a n D 2 0 1 0
2009 2010
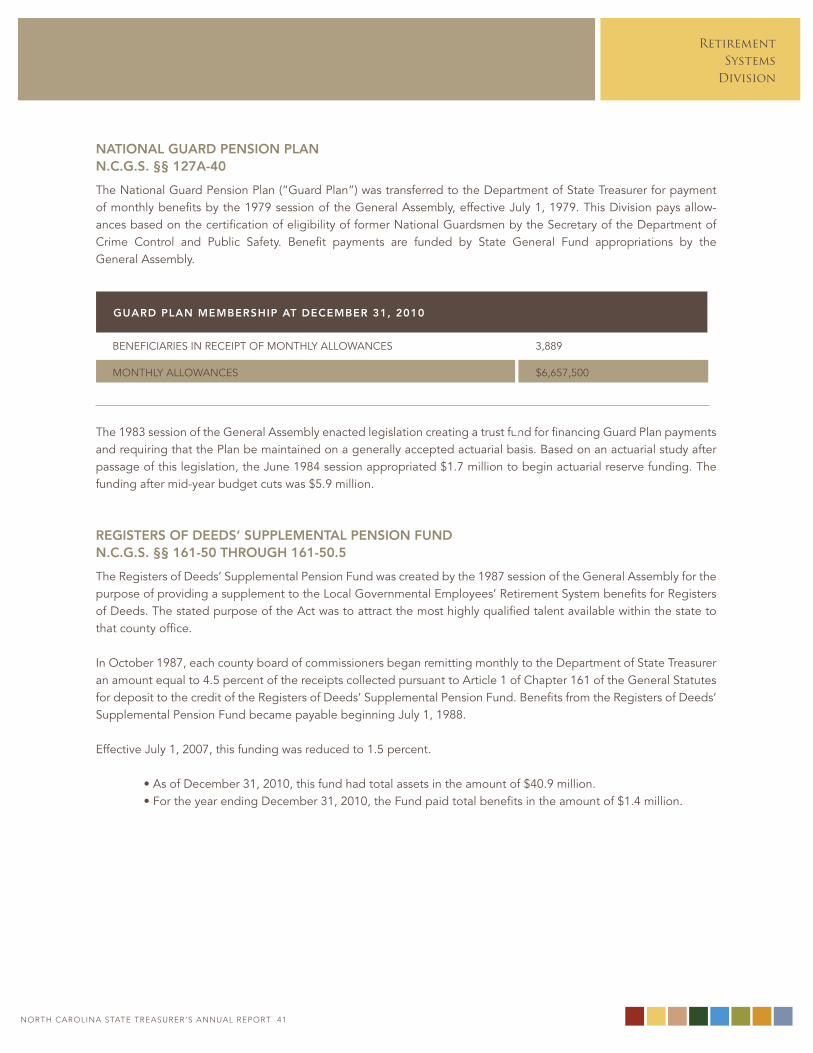
noRtH CARoLInA StAtE tREASuRER’S AnnuAL REPoRt 40
RetirementSystems
Division
noRtH CARoLInA StAtE tREASuRER’S AnnuAL REPoRt 41
national guaRD pension plann.c.g.s. §§ 127a-40
The National guard Pension Plan (“guard Plan”) was transferred to the Department of State Treasurer for payment of monthly benefits by the 1979 session of the general Assembly, effective July 1, 1979. This Division pays allow-ances based on the certification of eligibility of former National guardsmen by the Secretary of the Department of Crime Control and Public Safety. benefit payments are funded by State general Fund appropriations by the general Assembly.
The 1983 session of the general Assembly enacted legislation creating a trust fund for financing guard Plan payments and requiring that the Plan be maintained on a generally accepted actuarial basis. based on an actuarial study after passage of this legislation, the June 1984 session appropriated $1.7 million to begin actuarial reserve funding. The funding after mid-year budget cuts was $5.9 million.
RegisteRs of DeeDs’ supplemental pension funDn.c.g.s. §§ 161-50 thRough 161-50.5
The Registers of Deeds’ Supplemental Pension Fund was created by the 1987 session of the general Assembly for the purpose of providing a supplement to the local governmental employees’ Retirement System benefits for Registers of Deeds. The stated purpose of the Act was to attract the most highly qualified talent available within the state to that county office.
In october 1987, each county board of commissioners began remitting monthly to the Department of State Treasurer an amount equal to 4.5 percent of the receipts collected pursuant to Article 1 of Chapter 161 of the general Statutes for deposit to the credit of the Registers of Deeds’ Supplemental Pension Fund. benefits from the Registers of Deeds’ Supplemental Pension Fund became payable beginning July 1, 1988.
effective July 1, 2007, this funding was reduced to 1.5 percent.
• As of December 31, 2010, this fund had total assets in the amount of $40.9 million. • For the year ending December 31, 2010, the Fund paid total benefits in the amount of $1.4 million.
beNeFICIARIeS IN ReCeIPT oF moNThly AllowANCeS
moNThly AllowANCeS
3,889
$6,657,500
guaRD plan membeRship at DecembeR 31, 2010
noRtH CARoLInA StAtE tREASuRER’S AnnuAL REPoRt 42
RetirementSystemsDivision
THE YEAR’S HIGHLIGHTScompleteD the woRK of the futuRe of RetiRement stuDy commission
The Future of Retirement Study Commission, established in 2010 to deliberate on the design of the Retirement Systems for future public employees in response to the changing economy, issued the following recommendations to the State Treasurer:
• Choice between a defined benefit (“Db”) and defined contribution (“DC”) plan for all current and future employees
• Automatic enrollment in a supplemental DC plan for future new hires • A minimum unreduced retirement age of 55 for all future hires other than law-enforcement officers • A study to consolidate administration of 403(b) plans offered by local school systems • giving flexibility to the local governmental employees’ Retirement System board of Trustees to grant
cost-of-living adjustments (ColAs)
cReateD annuity option foR supplemental RetiRement income paRticipants
The Department implemented the NC 401(k)/NC 457 Transfer benefit option for active retiring members in TSeRS and lgeRS. Active TSeRS and lgeRS members with an existing NC 401(k) or NC Deferred Compensation (457) account through Prudential Retirement were given the one-time opportunity to transfer all or a portion of their plan funds at or after retirement to TSeRS or lgeRS to receive a lifetime monthly benefit (annuity), effective January 1, 2011.
The Retirement Systems and Prudential Retirement partnered with the State employees’ Credit Union to provide members with information on the Transfer benefit.
selecteD new supplemental insuRance pRoviDeR
The Retirement Systems selected Pierce Insurance Agency Inc. to provide supplemental insurance products to retirement benefit recipients. The insurance agency offers retirees coverage for vision, dental, and term and whole life insurance.
enhanceD online customeR infoRmation
Retirement Systems members’ registration in oRbIT (online Retirement benefits through Integrated Technology) increased from 147,000 in the 2009 fiscal year to more than 200,000 registered users in the 2010 fiscal year.
oRbIT, a web portal launched in 2007, enables members to access their retirement account information immediately and provides self-service by offering tools that help members make critical retirement planning decisions.
noRtH CARoLInA StAtE tREASuRER’S AnnuAL REPoRt 42
RetirementSystems
Division
noRtH CARoLInA StAtE tREASuRER’S AnnuAL REPoRt 43
Several new features were added to oRbIT this fiscal year to benefit both members and employers:
• The NC 401(k)/NC 457 Transfer benefit estimator was added to oRbIT, allowing members to create a customized estimate to determine if the annuity is the best option. more than 59,000 estimates were generated through the Transfer benefit estimator since its inception in october 2010. Additionally, more than 1.2 million additional online estimates were generated for retirement benefits and service pur-chases combined.
• The functionality of oRbIT was enhanced, enabling public sector employers to generate their own reports and view invoices through the employer Self Service feature. Previously, employers had to contact the Retirement Systems and formally request reports.
LEGISLATIONThe 2010 Session of the North Carolina general Assembly enacted legislation to:
• Create the NC 401(k) and NC 457 Transfer benefit option for retirees and retiring members in TSeRS and lgeRS to receive an additional monthly lifetime benefit (annuity) based on their transferred balance. The new Transfer benefit option also enables law enforcement officers (“leos”) who did not take advantage of the previously established leo NC 401(k) Transfer benefit plan to transfer funds under this new plan.
• Clarify that elected officials convicted of certain offenses, which require the forfeiting of all retirement benefits, are always eligible for a return of member contributions and, if applicable, interest.
• move the timing of the Social Security offset for Disability Income Plan of NC (“DIPNC”) recipients from December to January to mirror the schedule of Social Security payments.
• Clarify that a DIPNC recipient who has five or more years of contributing retirement service with a state-supported retirement system, and who has been approved for benefits but is not yet in receipt of benefits due to lump-sum payouts of vacation and bonus leave, is eligible for non-contributory State health Plan coverage.
• Require a 12.29 percent employer contribution rate from July 1, 2010, through June 30, 2011, on the local-paid portion of salary paid from local funds for community college presidents.
• Count optional Retirement Program (“oRP”) service under TSeRS reciprocity provisions, allowing the oRP service of an oRP member to be added to a member’s TSeRS service for the purpose of determining eligibility for TSeRS benefits.
COMMUNICATIONSThe Retirement Systems expanded its targeted communication to include:
• Disability messenger, a newsletter printed and mailed to public sector employees receiving disability benefits. The annual newsletter provides guidance on the various disability processes and explanations for actions taken, such as benefit reductions due to Social Security or workers’ Compensation. The newsletter is provided in addition to the personalized communication from the Retirement Systems and access to the “Disability benefits Processing and Training” web pages.
• The first electronic newsletter to retired public sector employees. The Retirement Report e-newsletter was sent to retirees who provided email addresses while registering for oRbIT. The e-newsletter supplements the printed newsletter mailed to retired members.

Skyline of Charlotte, North Carolina
INVESTMENTMANAGEMENT
DIVISION
N O R T H C A R O L I N A S TAT E T R E A S U R E R ’ S
A N N U A L R E P O R T
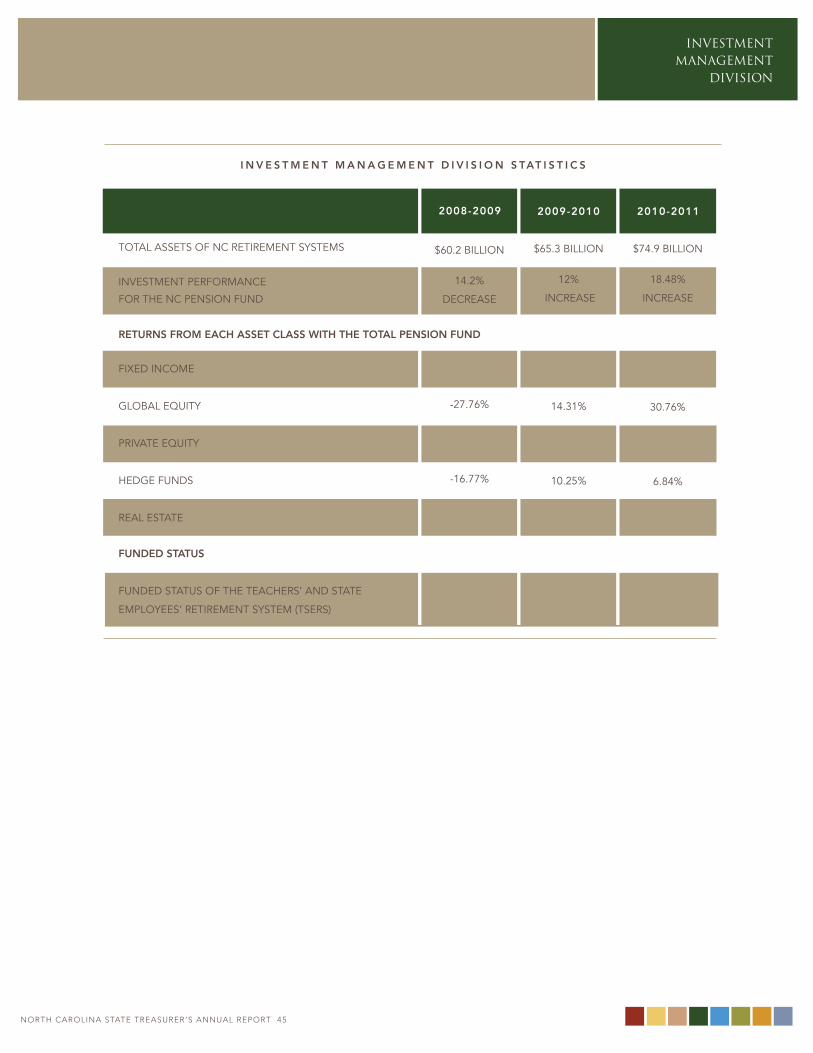
INVESTMENT MANAGEMENT
DIVISION
noRtH CARoLInA StAtE tREASuRER’S AnnuAL REPoRt 45
i n v e s t m e n t m a n a g e m e n t D i v i s i o n s tat i s t i c s
$60.2 bIllIoN
14.2%
DeCReASe
7.62%
-27.76%
-21.53%
-16.77%
-31.43%
99.3%
$65.3 bIllIoN
12%
INCReASe
13.2%
14.31%
12.88%
10.25%
-16.74%
95.9%
$74.9 bIllIoN
18.48%
INCReASe
5.3%
30.76%
15.24%
6.84%
18.16%
95.4%
2008-2009 2009-2010 2010-2011
ToTAl ASSeTS oF NC ReTIRemeNT SySTemS
INveSTmeNT PeRFoRmANCe
FoR The NC PeNSIoN FUND
RetuRns fRom each asset class with the total pension funD
FIxeD INCome
globAl eqUITy
PRIvATe eqUITy
heDge FUNDS
ReAl eSTATe
funDeD status
FUNDeD STATUS oF The TeACheRS’ AND STATe
emPloyeeS’ ReTIRemeNT SySTem (TSeRS)
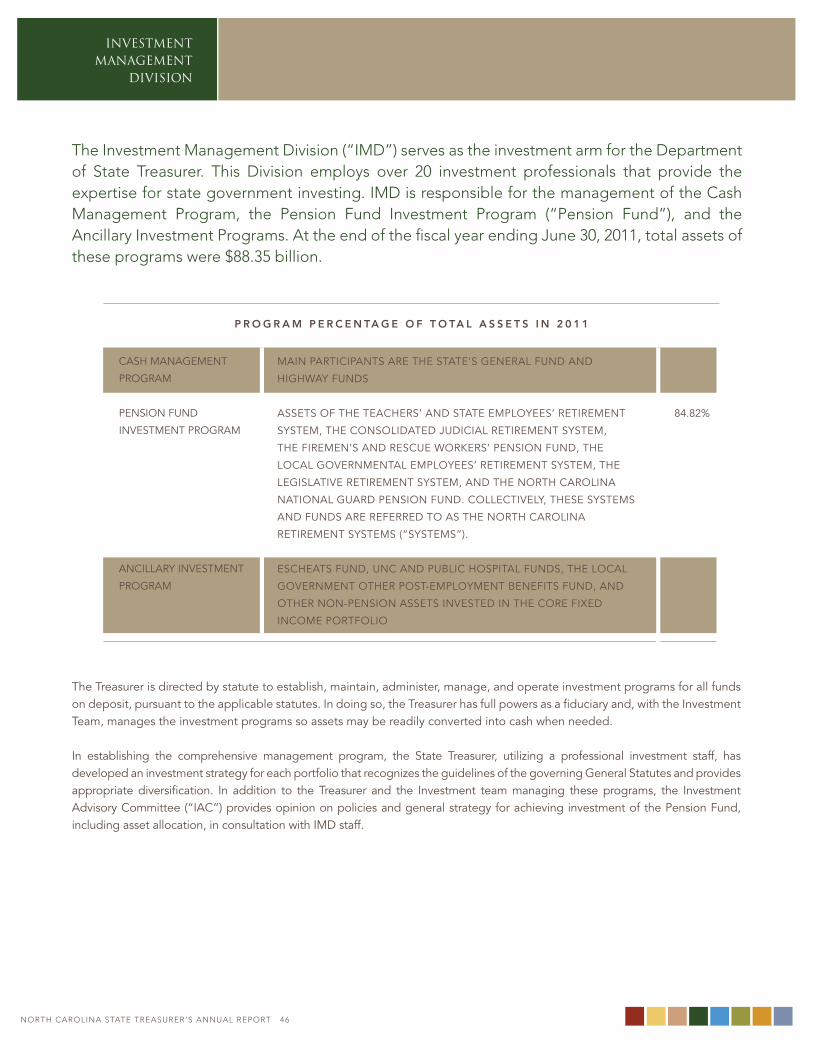
INVESTMENT MANAGEMENT
DIVISION
noRtH CARoLInA StAtE tREASuRER’S AnnuAL REPoRt 46
13.32%
84.82%
1.85%
the Investment Management Division (“IMD”) serves as the investment arm for the Department of State treasurer. this Division employs over 20 investment professionals that provide the expertise for state government investing. IMD is responsible for the management of the Cash Management Program, the Pension Fund Investment Program (“Pension Fund”), and the Ancillary Investment Programs. At the end of the fiscal year ending June 30, 2011, total assets of these programs were $88.35 billion.
The Treasurer is directed by statute to establish, maintain, administer, manage, and operate investment programs for all funds on deposit, pursuant to the applicable statutes. In doing so, the Treasurer has full powers as a fiduciary and, with the Investment Team, manages the investment programs so assets may be readily converted into cash when needed.
In establishing the comprehensive management program, the State Treasurer, utilizing a professional investment staff, has developed an investment strategy for each portfolio that recognizes the guidelines of the governing general Statutes and provides appropriate diversification. In addition to the Treasurer and the Investment team managing these programs, the Investment Advisory Committee (“IAC”) provides opinion on policies and general strategy for achieving investment of the Pension Fund, including asset allocation, in consultation with ImD staff.
mAIN PARTICIPANTS ARe The STATe’S geNeRAl FUND AND
hIghwAy FUNDS
ASSeTS oF The TeACheRS’ AND STATe emPloyeeS’ ReTIRemeNT
SySTem, The CoNSolIDATeD JUDICIAl ReTIRemeNT SySTem,
The FIRemeN’S AND ReSCUe woRKeRS’ PeNSIoN FUND, The
loCAl goveRNmeNTAl emPloyeeS’ ReTIRemeNT SySTem, The
legISlATIve ReTIRemeNT SySTem, AND The NoRTh CARolINA
NATIoNAl gUARD PeNSIoN FUND. ColleCTIvely, TheSe SySTemS
AND FUNDS ARe ReFeRReD To AS The NoRTh CARolINA
ReTIRemeNT SySTemS (“SySTemS”).
eSCheATS FUND, UNC AND PUblIC hoSPITAl FUNDS, The loCAl
goveRNmeNT oTheR PoST-emPloymeNT beNeFITS FUND, AND
oTheR NoN-PeNSIoN ASSeTS INveSTeD IN The CoRe FIxeD
INCome PoRTFolIo
p R o g R a m p e R c e n ta g e o f t o ta l a s s e t s i n 2 0 1 1
CASh mANAgemeNT
PRogRAm
PeNSIoN FUND
INveSTmeNT PRogRAm
ANCIllARy INveSTmeNT
PRogRAm
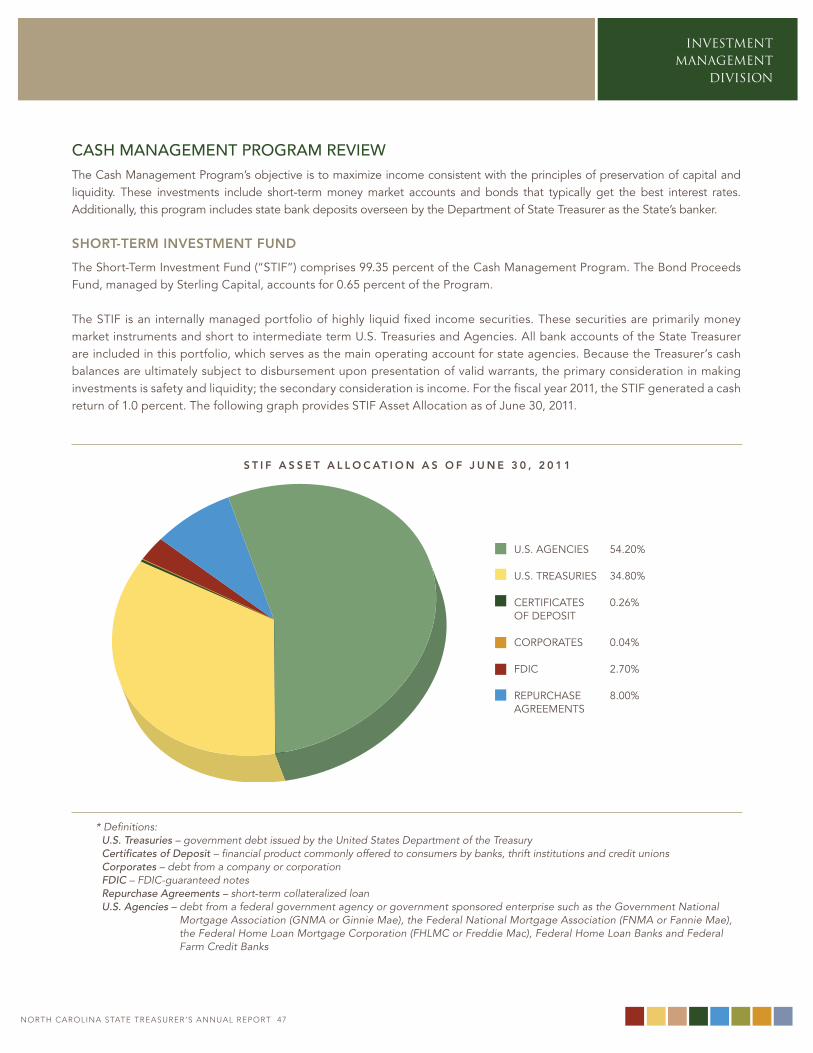
noRtH CARoLInA StAtE tREASuRER’S AnnuAL REPoRt 46
INVESTMENT MANAGEMENT
DIVISION
noRtH CARoLInA StAtE tREASuRER’S AnnuAL REPoRt 47
CASH MANAGEMENT PROGRAM REvIEWThe Cash management Program’s objective is to maximize income consistent with the principles of preservation of capital and liquidity. These investments include short-term money market accounts and bonds that typically get the best interest rates. Additionally, this program includes state bank deposits overseen by the Department of State Treasurer as the State’s banker.
shoRt-teRm investment funD
The Short-Term Investment Fund (“STIF”) comprises 99.35 percent of the Cash management Program. The bond Proceeds Fund, managed by Sterling Capital, accounts for 0.65 percent of the Program.
The STIF is an internally managed portfolio of highly liquid fixed income securities. These securities are primarily money market instruments and short to intermediate term U.S. Treasuries and Agencies. All bank accounts of the State Treasurer are included in this portfolio, which serves as the main operating account for state agencies. because the Treasurer’s cash balances are ultimately subject to disbursement upon presentation of valid warrants, the primary consideration in making investments is safety and liquidity; the secondary consideration is income. For the fiscal year 2011, the STIF generated a cash return of 1.0 percent. The following graph provides STIF Asset Allocation as of June 30, 2011.
* Definitions:U.S. Treasuries – government debt issued by the United States Department of the TreasuryCertificates of Deposit – financial product commonly offered to consumers by banks, thrift institutions and credit unionsCorporates – debt from a company or corporationFDIC – FDIC-guaranteed notesRepurchase Agreements – short-term collateralized loanU.S. Agencies – debt from a federal government agency or government sponsored enterprise such as the Government National
Mortgage Association (GNMA or Ginnie Mae), the Federal National Mortgage Association (FNMA or Fannie Mae), the Federal Home Loan Mortgage Corporation (FHLMC or Freddie Mac), Federal Home Loan Banks and Federal Farm Credit Banks
s t i f a s s e t a l l o c at i o n a s o f J u n e 3 0 , 2 0 1 1
U.S. AgeNCIeS 54.20%
U.S. TReASURIeS 34.80%
CeRTIFICATeS 0.26% oF DePoSIT
CoRPoRATeS 0.04%
FDIC 2.70%
RePURChASe 8.00% AgReemeNTS
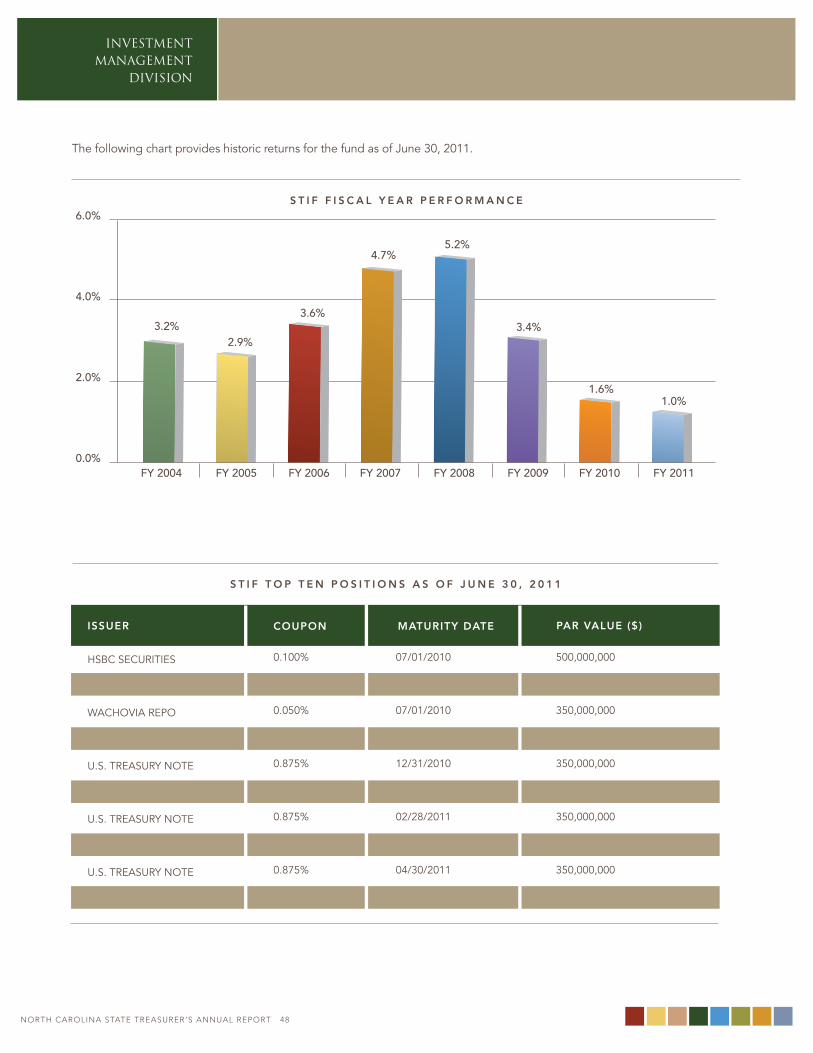
INVESTMENT MANAGEMENT
DIVISION
noRtH CARoLInA StAtE tREASuRER’S AnnuAL REPoRt 48
The following chart provides historic returns for the fund as of June 30, 2011.
s t i f f i s c a l y e a R p e R f o R m a n c e
hSbC SeCURITIeS
UbS wARbURg RePo
wAChovIA RePo
U.S. TReASURy NoTe
U.S. TReASURy NoTe
U.S. TReASURy NoTe
U.S. TReASURy NoTe
U.S. TReASURy NoTe
U.S. TReASURy NoTe
U.S. TReASURy NoTe
0.100%
0.070%
0.050%
1.250%
0.875%
0.875%
0.875%
0.875%
0.875%
0.875%
07/01/2010
07/01/2010
07/01/2010
11/30/2010
12/31/2010
1/31/2011
02/28/2011
03/31/2011
04/30/2011
05/31/2011
s t i f t o p t e n p o s i t i o n s a s o f J u n e 3 0 , 2 0 1 1
coupon matuRity Date
500,000,000
500,000,000
350,000,000
350,000,000
350,000,000
350,000,000
350,000,000
350,000,000
350,000,000
350,000,000
issueR paR value ($)
6.0%
4.0%
2.0%
0.0%
3.2%
FY 2004 FY 2005 FY 2006
2.9%
3.6%
4.7%5.2%
3.4%
1.6%1.0%
FY 2007 FY 2008 FY 2009 FY 2010 FY 2011
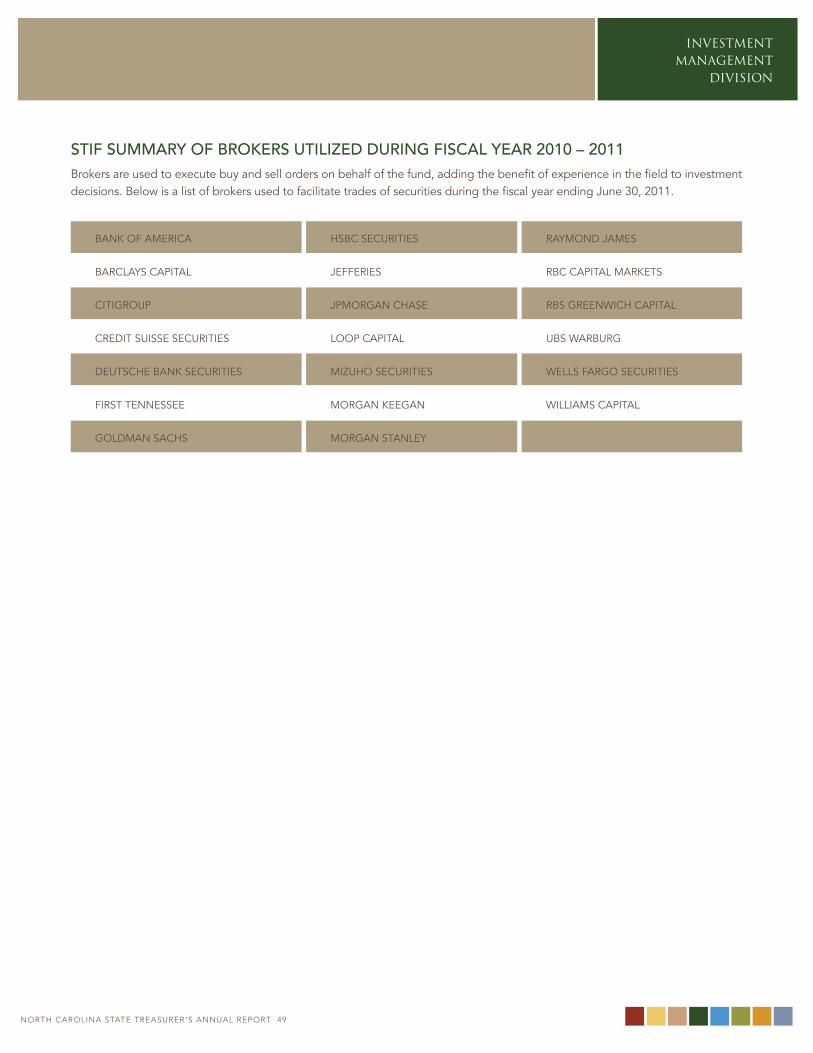
noRtH CARoLInA StAtE tREASuRER’S AnnuAL REPoRt 48
INVESTMENT MANAGEMENT
DIVISION
noRtH CARoLInA StAtE tREASuRER’S AnnuAL REPoRt 49
STIf SUMMARY Of BROkERS UTILIzEd dURING fISCAL YEAR 2010 – 2011brokers are used to execute buy and sell orders on behalf of the fund, adding the benefit of experience in the field to investment decisions. below is a list of brokers used to facilitate trades of securities during the fiscal year ending June 30, 2011.
bANK oF AmeRICA
bARClAyS CAPITAl
CITIgRoUP
CReDIT SUISSe SeCURITIeS
DeUTSChe bANK SeCURITIeS
FIRST TeNNeSSee
golDmAN SAChS
hSbC SeCURITIeS
JeFFeRIeS
JPmoRgAN ChASe
looP CAPITAl
mIzUho SeCURITIeS
moRgAN KeegAN
moRgAN STANley
RAymoND JAmeS
RbC CAPITAl mARKeTS
RbS gReeNwICh CAPITAl
UbS wARbURg
wellS FARgo SeCURITIeS
wIllIAmS CAPITAl
investment manDate examplespoRtfolio
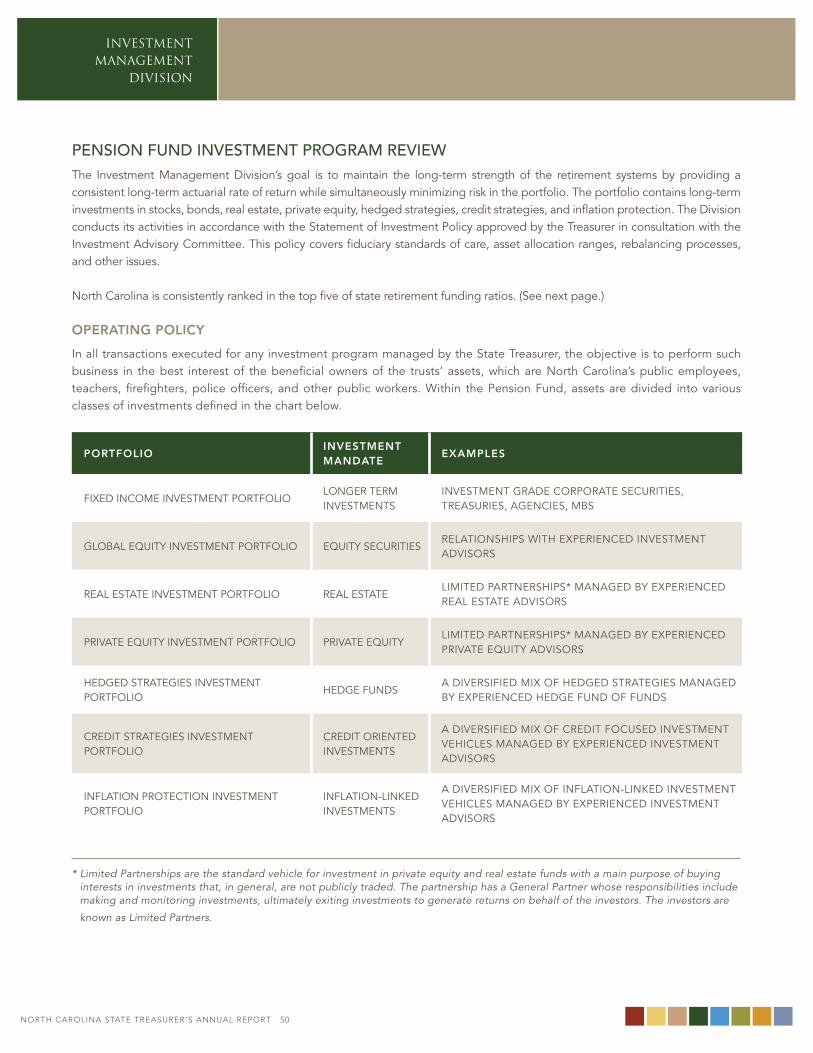
INVESTMENT MANAGEMENT
DIVISION
noRtH CARoLInA StAtE tREASuRER’S AnnuAL REPoRt 50
PENSION fUNd INvESTMENT PROGRAM REvIEWThe Investment management Division’s goal is to maintain the long-term strength of the retirement systems by providing a consistent long-term actuarial rate of return while simultaneously minimizing risk in the portfolio. The portfolio contains long-term investments in stocks, bonds, real estate, private equity, hedged strategies, credit strategies, and inflation protection. The Division conducts its activities in accordance with the Statement of Investment Policy approved by the Treasurer in consultation with the Investment Advisory Committee. This policy covers fiduciary standards of care, asset allocation ranges, rebalancing processes, and other issues.
North Carolina is consistently ranked in the top five of state retirement funding ratios. (See next page.)
opeRating policy
In all transactions executed for any investment program managed by the State Treasurer, the objective is to perform such business in the best interest of the beneficial owners of the trusts’ assets, which are North Carolina’s public employees, teachers, firefighters, police officers, and other public workers. within the Pension Fund, assets are divided into various classes of investments defined in the chart below.
poRtfolioinvestment manDate
examples
FIxeD INCome INveSTmeNT PoRTFolIoloNgeR TeRm INveSTmeNTS
INveSTmeNT gRADe CoRPoRATe SeCURITIeS, TReASURIeS, AgeNCIeS, mbS
globAl eqUITy INveSTmeNT PoRTFolIo eqUITy SeCURITIeSRelATIoNShIPS wITh exPeRIeNCeD INveSTmeNT ADvISoRS
ReAl eSTATe INveSTmeNT PoRTFolIo ReAl eSTATelImITeD PARTNeRShIPS* mANAgeD by exPeRIeNCeD ReAl eSTATe ADvISoRS
PRIvATe eqUITy INveSTmeNT PoRTFolIo PRIvATe eqUITylImITeD PARTNeRShIPS* mANAgeD by exPeRIeNCeD PRIvATe eqUITy ADvISoRS
heDgeD STRATegIeS INveSTmeNT PoRTFolIo
heDge FUNDSA DIveRSIFIeD mIx oF heDgeD STRATegIeS mANAgeD by exPeRIeNCeD heDge FUND oF FUNDS
CReDIT STRATegIeS INveSTmeNT PoRTFolIo
CReDIT oRIeNTeD INveSTmeNTS
A DIveRSIFIeD mIx oF CReDIT FoCUSeD INveSTmeNT vehICleS mANAgeD by exPeRIeNCeD INveSTmeNT ADvISoRS
INFlATIoN PRoTeCTIoN INveSTmeNT PoRTFolIo
INFlATIoN-lINKeD INveSTmeNTS
A DIveRSIFIeD mIx oF INFlATIoN-lINKeD INveSTmeNT vehICleS mANAgeD by exPeRIeNCeD INveSTmeNT ADvISoRS
* Limited Partnerships are the standard vehicle for investment in private equity and real estate funds with a main purpose of buying interests in investments that, in general, are not publicly traded. The partnership has a General Partner whose responsibilities include making and monitoring investments, ultimately exiting investments to generate returns on behalf of the investors. The investors are
known as Limited Partners.
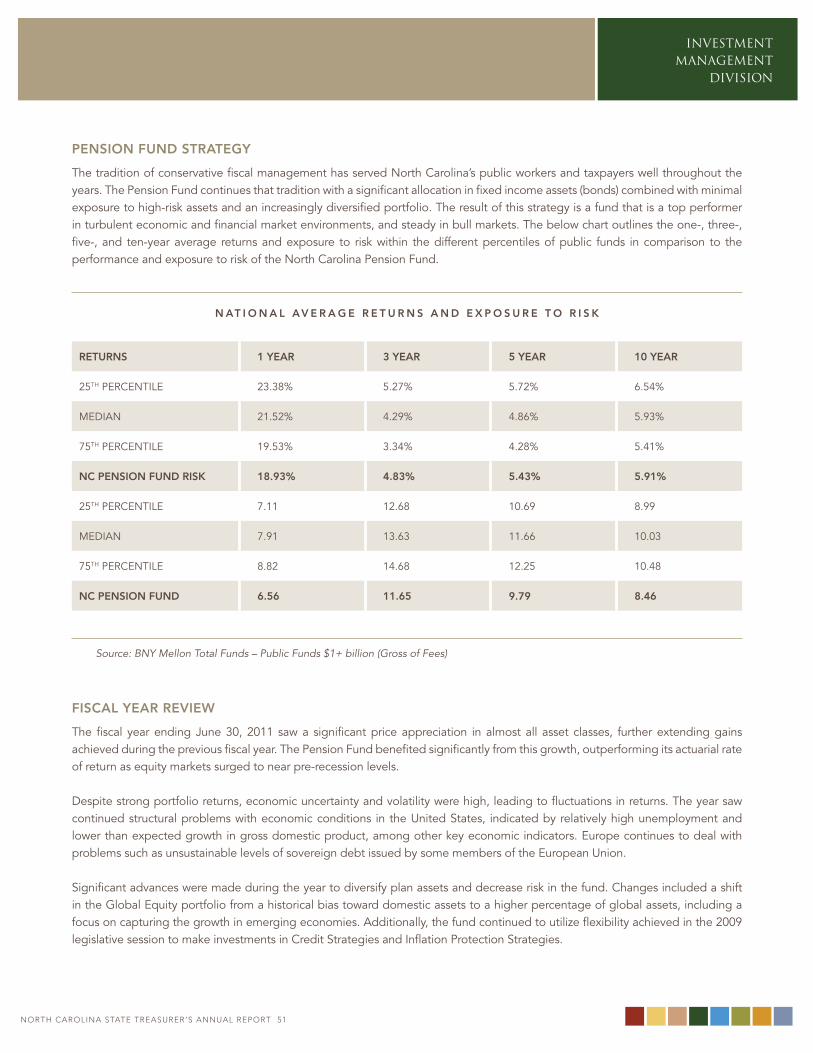
noRtH CARoLInA StAtE tREASuRER’S AnnuAL REPoRt 50
INVESTMENT MANAGEMENT
DIVISION
noRtH CARoLInA StAtE tREASuRER’S AnnuAL REPoRt 51
pension funD stRategy
The tradition of conservative fiscal management has served North Carolina’s public workers and taxpayers well throughout the years. The Pension Fund continues that tradition with a significant allocation in fixed income assets (bonds) combined with minimal exposure to high-risk assets and an increasingly diversified portfolio. The result of this strategy is a fund that is a top performer in turbulent economic and financial market environments, and steady in bull markets. The below chart outlines the one-, three-, five-, and ten-year average returns and exposure to risk within the different percentiles of public funds in comparison to the performance and exposure to risk of the North Carolina Pension Fund.
n at i o n a l av e R a g e R e t u R n s a n D e x p o s u R e t o R i s K
RetuRns 1 yeaR 3 yeaR 5 yeaR 10 yeaR
25Th PeRCeNTIle 23.38% 5.27% 5.72% 6.54%
meDIAN 21.52% 4.29% 4.86% 5.93%
75Th PeRCeNTIle 19.53% 3.34% 4.28% 5.41%
nc pension funD RisK 18.93% 4.83% 5.43% 5.91%
25Th PeRCeNTIle 7.11 12.68 10.69 8.99
meDIAN 7.91 13.63 11.66 10.03
75Th PeRCeNTIle 8.82 14.68 12.25 10.48
nc pension funD 6.56 11.65 9.79 8.46
Source: BNY Mellon Total Funds – Public Funds $1+ billion (Gross of Fees)
fiscal yeaR Review
The fiscal year ending June 30, 2011 saw a significant price appreciation in almost all asset classes, further extending gains achieved during the previous fiscal year. The Pension Fund benefited significantly from this growth, outperforming its actuarial rate of return as equity markets surged to near pre-recession levels.
Despite strong portfolio returns, economic uncertainty and volatility were high, leading to fluctuations in returns. The year saw continued structural problems with economic conditions in the United States, indicated by relatively high unemployment and lower than expected growth in gross domestic product, among other key economic indicators. europe continues to deal with problems such as unsustainable levels of sovereign debt issued by some members of the european Union.
Significant advances were made during the year to diversify plan assets and decrease risk in the fund. Changes included a shift in the global equity portfolio from a historical bias toward domestic assets to a higher percentage of global assets, including a focus on capturing the growth in emerging economies. Additionally, the fund continued to utilize flexibility achieved in the 2009 legislative session to make investments in Credit Strategies and Inflation Protection Strategies.
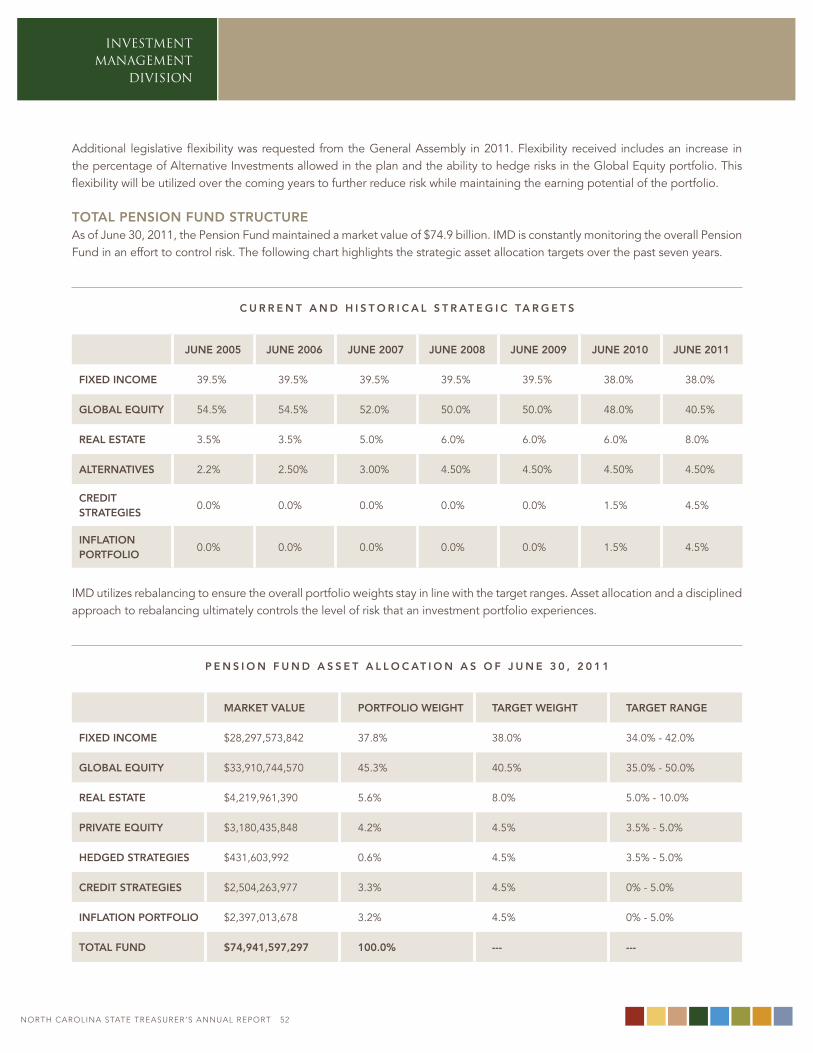
INVESTMENT MANAGEMENT
DIVISION
noRtH CARoLInA StAtE tREASuRER’S AnnuAL REPoRt 52
Additional legislative flexibility was requested from the general Assembly in 2011. Flexibility received includes an increase in the percentage of Alternative Investments allowed in the plan and the ability to hedge risks in the global equity portfolio. This flexibility will be utilized over the coming years to further reduce risk while maintaining the earning potential of the portfolio.
total pension funD stRuctuReAs of June 30, 2011, the Pension Fund maintained a market value of $74.9 billion. ImD is constantly monitoring the overall Pension Fund in an effort to control risk. The following chart highlights the strategic asset allocation targets over the past seven years.
c u R R e n t a n D h i s t o R i c a l s t R at e g i c ta R g e t s
June 2005 June 2006 June 2007 June 2008 June 2009 June 2010 June 2011
fixeD income 39.5% 39.5% 39.5% 39.5% 39.5% 38.0% 38.0%
global equity 54.5% 54.5% 52.0% 50.0% 50.0% 48.0% 40.5%
Real estate 3.5% 3.5% 5.0% 6.0% 6.0% 6.0% 8.0%
alteRnatives 2.2% 2.50% 3.00% 4.50% 4.50% 4.50% 4.50%
cReDit stRategies
0.0% 0.0% 0.0% 0.0% 0.0% 1.5% 4.5%
inflation poRtfolio
0.0% 0.0% 0.0% 0.0% 0.0% 1.5% 4.5%
ImD utilizes rebalancing to ensure the overall portfolio weights stay in line with the target ranges. Asset allocation and a disciplined approach to rebalancing ultimately controls the level of risk that an investment portfolio experiences.
p e n s i o n f u n D a s s e t a l l o c at i o n a s o f J u n e 3 0 , 2 0 1 1
maRKet value poRtfolio weight taRget weight taRget Range
fixeD income $28,297,573,842 37.8% 38.0% 34.0% - 42.0%
global equity $33,910,744,570 45.3% 40.5% 35.0% - 50.0%
Real estate $4,219,961,390 5.6% 8.0% 5.0% - 10.0%
pRivate equity $3,180,435,848 4.2% 4.5% 3.5% - 5.0%
heDgeD stRategies $431,603,992 0.6% 4.5% 3.5% - 5.0%
cReDit stRategies $2,504,263,977 3.3% 4.5% 0% - 5.0%
inflation poRtfolio $2,397,013,678 3.2% 4.5% 0% - 5.0%
total funD $74,941,597,297 100.0% --- ---
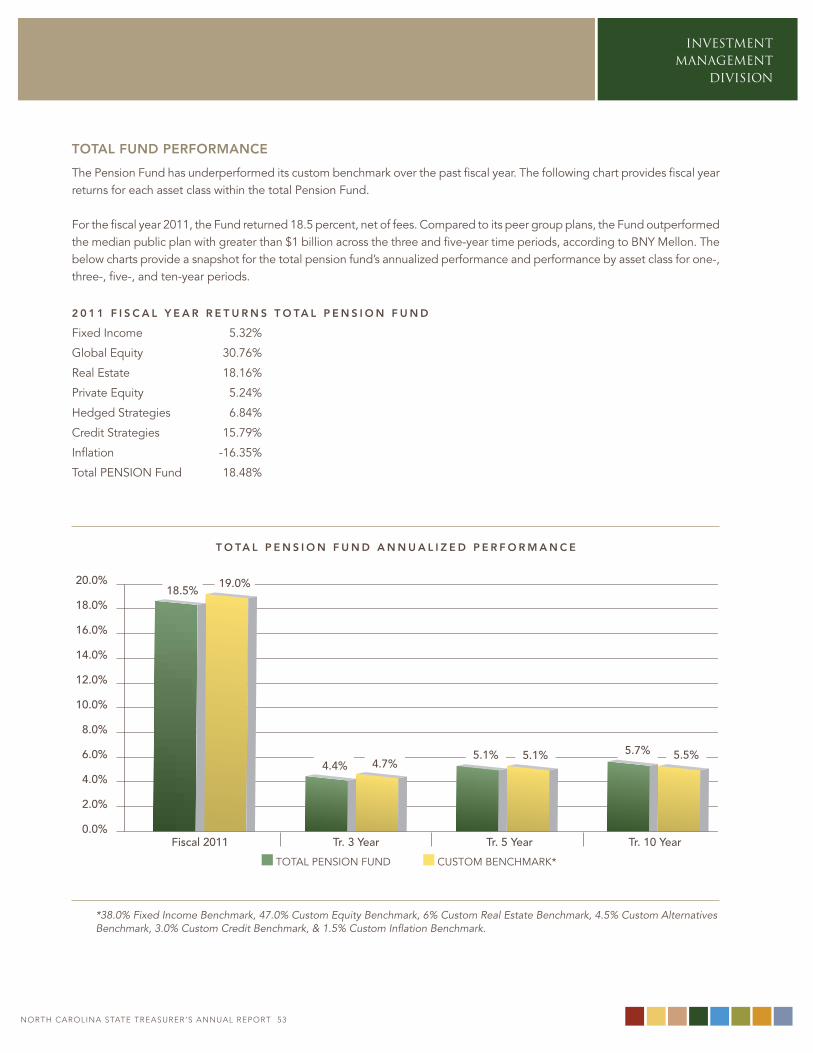
noRtH CARoLInA StAtE tREASuRER’S AnnuAL REPoRt 52
INVESTMENT MANAGEMENT
DIVISION
noRtH CARoLInA StAtE tREASuRER’S AnnuAL REPoRt 53
total funD peRfoRmance
The Pension Fund has underperformed its custom benchmark over the past fiscal year. The following chart provides fiscal year returns for each asset class within the total Pension Fund.
For the fiscal year 2011, the Fund returned 18.5 percent, net of fees. Compared to its peer group plans, the Fund outperformed the median public plan with greater than $1 billion across the three and five-year time periods, according to bNy mellon. The below charts provide a snapshot for the total pension fund’s annualized performance and performance by asset class for one-, three-, five-, and ten-year periods.
2 0 1 1 f i s c a l y e a R R e t u R n s t o ta l p e n s i o n f u n D
Fixed Income 5.32%
global equity 30.76%
Real estate 18.16%
Private equity 5.24%
hedged Strategies 6.84%
Credit Strategies 15.79%
Inflation -16.35%
Total PeNSIoN Fund 18.48%
t o ta l p e n s i o n f u n D a n n u a l i z e D p e R f o R m a n c e
20.0%
18.0%
16.0%
14.0%
12.0%
10.0%
8.0%
6.0%
4.0%
2.0%
0.0%
18.5%19.0%
4.4% 4.7%5.1% 5.1% 5.7% 5.5%
Fiscal 2011 Tr. 3 Year Tr. 5 Year Tr. 10 Year ToTAl PeNSIoN FUND CUSTom beNChmARK*
*38.0% Fixed Income Benchmark, 47.0% Custom Equity Benchmark, 6% Custom Real Estate Benchmark, 4.5% Custom Alternatives Benchmark, 3.0% Custom Credit Benchmark, & 1.5% Custom Inflation Benchmark.
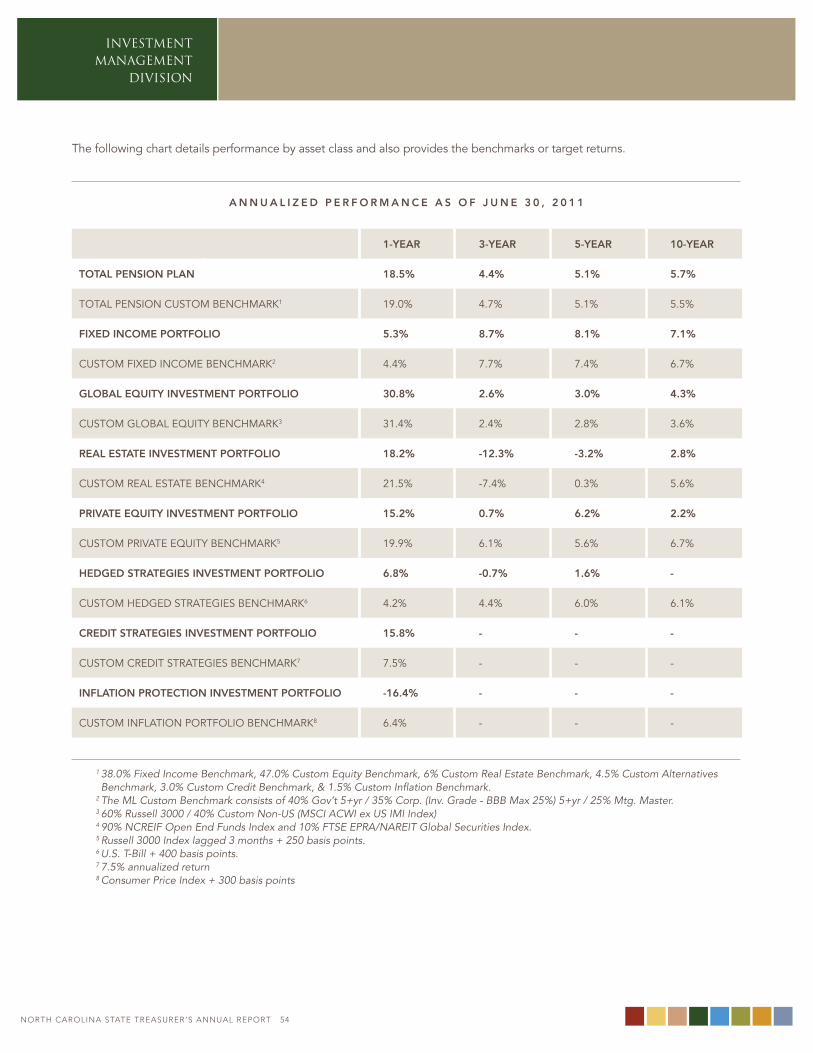
INVESTMENT MANAGEMENT
DIVISION
noRtH CARoLInA StAtE tREASuRER’S AnnuAL REPoRt 54
The following chart details performance by asset class and also provides the benchmarks or target returns.
a n n u a l i z e D p e R f o R m a n c e a s o f J u n e 3 0 , 2 0 1 1
1-yeaR 3-yeaR 5-yeaR 10-yeaR
total pension plan 18.5% 4.4% 5.1% 5.7%
ToTAl PeNSIoN CUSTom beNChmARK1 19.0% 4.7% 5.1% 5.5%
fixeD income poRtfolio 5.3% 8.7% 8.1% 7.1%
CUSTom FIxeD INCome beNChmARK2 4.4% 7.7% 7.4% 6.7%
global equity investment poRtfolio 30.8% 2.6% 3.0% 4.3%
CUSTom globAl eqUITy beNChmARK3 31.4% 2.4% 2.8% 3.6%
Real estate investment poRtfolio 18.2% -12.3% -3.2% 2.8%
CUSTom ReAl eSTATe beNChmARK4 21.5% -7.4% 0.3% 5.6%
pRivate equity investment poRtfolio 15.2% 0.7% 6.2% 2.2%
CUSTom PRIvATe eqUITy beNChmARK5 19.9% 6.1% 5.6% 6.7%
heDgeD stRategies investment poRtfolio 6.8% -0.7% 1.6% -
CUSTom heDgeD STRATegIeS beNChmARK6 4.2% 4.4% 6.0% 6.1%
cReDit stRategies investment poRtfolio 15.8% - - -
CUSTom CReDIT STRATegIeS beNChmARK7 7.5% - - -
inflation pRotection investment poRtfolio -16.4% - - -
CUSTom INFlATIoN PoRTFolIo beNChmARK8 6.4% - - -
1 38.0% Fixed Income Benchmark, 47.0% Custom Equity Benchmark, 6% Custom Real Estate Benchmark, 4.5% Custom Alternatives Benchmark, 3.0% Custom Credit Benchmark, & 1.5% Custom Inflation Benchmark.
2 The ML Custom Benchmark consists of 40% Gov’t 5+yr / 35% Corp. (Inv. Grade - BBB Max 25%) 5+yr / 25% Mtg. Master.3 60% Russell 3000 / 40% Custom Non-US (MSCI ACWI ex US IMI Index) 4 90% NCREIF Open End Funds Index and 10% FTSE EPRA/NAREIT Global Securities Index.5 Russell 3000 Index lagged 3 months + 250 basis points.6 U.S. T-Bill + 400 basis points.7 7.5% annualized return8 Consumer Price Index + 300 basis points
noRtH CARoLInA StAtE tREASuRER’S AnnuAL REPoRt 54
INVESTMENT MANAGEMENT
DIVISION
noRtH CARoLInA StAtE tREASuRER’S AnnuAL REPoRt 55
CORPORATE GOvERNANCE The Department of State Treasurer maintains a corporate governance program. The pension fund works through proxy voting, shareholders resolutions, dialogue with corporate leaders and regulatory agencies, and collaboration with other institutional investors to create long term value for portfolio companies. These initiatives are designed to enhance long-term shareowner value. They include the following strategic objectives:
• Financial regulatory reform• board diversity• Sustainability• Company engagement
financial RegulatoRy RefoRm
During Congressional debate of the Dodd-Frank wall Street Reform and Consumer Protection Act, the North Carolina Retirement Systems signed a letter, along with 19 other pension funds, urging Congress to reaffirm the authority of the Securities and exchange Commission to give shareowners “proxy access.” Proxy access gives a group of shareowners the right to put candidates on a corporate ballot. Such access provides investors a necessary tool to ensure transparency, accountability and management risk at the board level. The June 2010 letter represented more than seven million active and retired employees with assets in excess of $1 trillion.
DiveRsity
In may 2010, the Department partnered with Director Diversity Initiative (DDI), a joint project with the Center of banking and Finance and the Center for Civil Rights at the University of North Carolina at Chapel hill School of law. The partnership includes identifying and encouraging potential directors to attend the one day board training as well as encouraging them to register with DDI Database.
company engagement – massey eneRgy
Following the tragedy at the west virginia Upper big branch mine, the North Carolina Retirement Systems, along with eight other public pension funds, sent an April 2010 letter to Admiral bobby Inman, lead Director of massey energy Company, expressing concern about poor corporate governance practices.
In addition, the coalition of funds urged shareholders to withhold votes from Directors Dan moore, baxter Philips, Jr., and Richard gabrys at the annual meeting in may 2010. Shareholders cast between 48 to 49 percent of their shares against all three Directors, some of the highest opposition votes against any S&P 500 company in 2010.
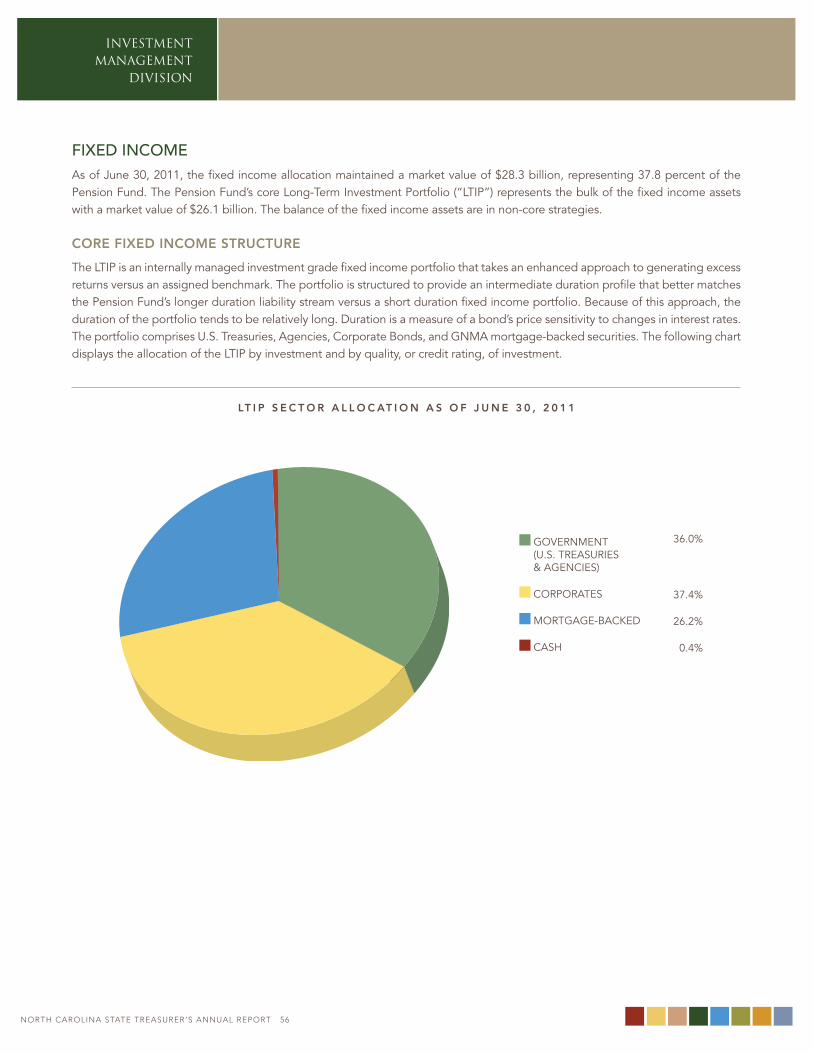
INVESTMENT MANAGEMENT
DIVISION
noRtH CARoLInA StAtE tREASuRER’S AnnuAL REPoRt 56
fIxEd INCOMEAs of June 30, 2011, the fixed income allocation maintained a market value of $28.3 billion, representing 37.8 percent of the Pension Fund. The Pension Fund’s core long-Term Investment Portfolio (“lTIP”) represents the bulk of the fixed income assets with a market value of $26.1 billion. The balance of the fixed income assets are in non-core strategies. coRe fixeD income stRuctuRe
The lTIP is an internally managed investment grade fixed income portfolio that takes an enhanced approach to generating excess returns versus an assigned benchmark. The portfolio is structured to provide an intermediate duration profile that better matches the Pension Fund’s longer duration liability stream versus a short duration fixed income portfolio. because of this approach, the duration of the portfolio tends to be relatively long. Duration is a measure of a bond’s price sensitivity to changes in interest rates. The portfolio comprises U.S. Treasuries, Agencies, Corporate bonds, and gNmA mortgage-backed securities. The following chart displays the allocation of the lTIP by investment and by quality, or credit rating, of investment.
lt i p s e c t o R a l l o c at i o n a s o f J u n e 3 0 , 2 0 1 1
goveRNmeNT (U.S. TReASURIeS & AgeNCIeS)
CoRPoRATeS
moRTgAge-bACKeD
CASh
36.0%
37.4%
26.2%
0.4%
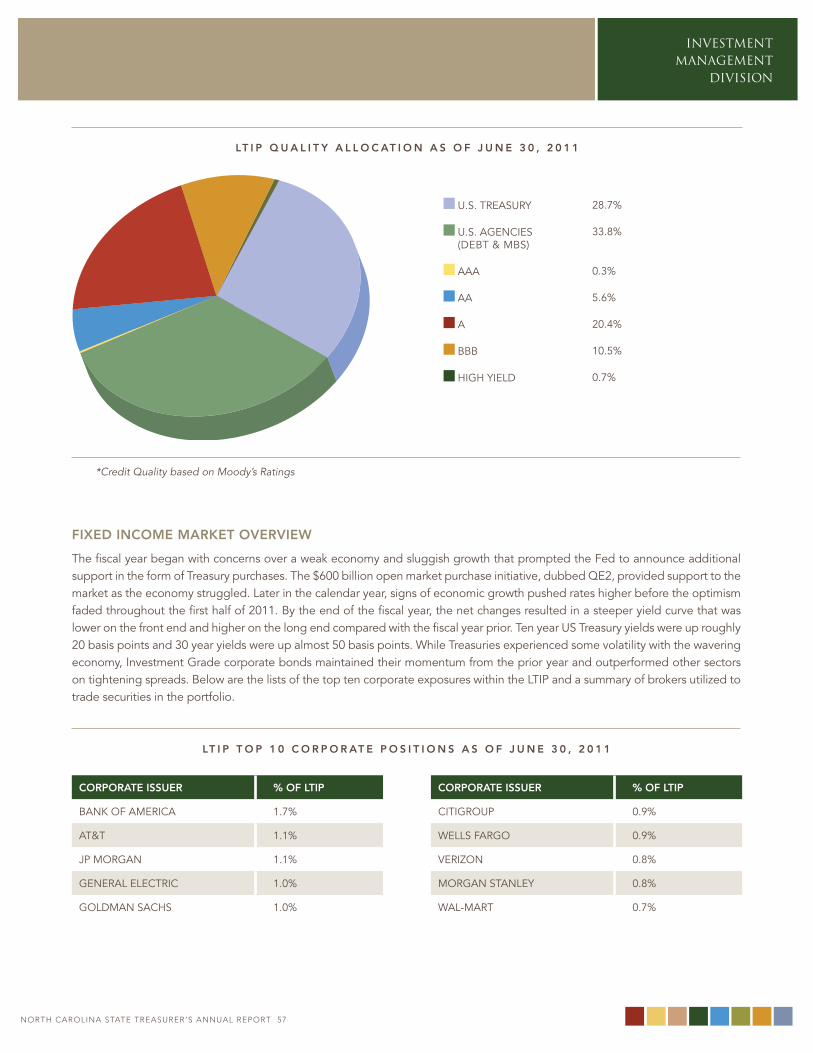
noRtH CARoLInA StAtE tREASuRER’S AnnuAL REPoRt 56
INVESTMENT MANAGEMENT
DIVISION
noRtH CARoLInA StAtE tREASuRER’S AnnuAL REPoRt 57
36.0%
37.4%
26.2%
0.4%
*Credit Quality based on Moody’s Ratings
fixeD income maRKet oveRview
The fiscal year began with concerns over a weak economy and sluggish growth that prompted the Fed to announce additional support in the form of Treasury purchases. The $600 billion open market purchase initiative, dubbed qe2, provided support to the market as the economy struggled. later in the calendar year, signs of economic growth pushed rates higher before the optimism faded throughout the first half of 2011. by the end of the fiscal year, the net changes resulted in a steeper yield curve that was lower on the front end and higher on the long end compared with the fiscal year prior. Ten year US Treasury yields were up roughly 20 basis points and 30 year yields were up almost 50 basis points. while Treasuries experienced some volatility with the wavering economy, Investment grade corporate bonds maintained their momentum from the prior year and outperformed other sectors on tightening spreads. below are the lists of the top ten corporate exposures within the lTIP and a summary of brokers utilized to trade securities in the portfolio.
lt i p t o p 1 0 c o R p o R at e p o s i t i o n s a s o f J u n e 3 0 , 2 0 1 1
coRpoRate issueR % of ltip coRpoRate issueR % of ltip
bANK oF AmeRICA 1.7% CITIgRoUP 0.9%
AT&T 1.1% wellS FARgo 0.9%
JP moRgAN 1.1% veRIzoN 0.8%
geNeRAl eleCTRIC 1.0% moRgAN STANley 0.8%
golDmAN SAChS 1.0% wAl-mART 0.7%
U.S. TReASURy
U.S. AgeNCIeS(DebT & mbS)
AAA
AA
A
bbb
hIgh yIelD
28.7%
33.8%
0.3%
5.6%
20.4%
10.5%
0.7%
lt i p q u a l i t y a l l o c at i o n a s o f J u n e 3 0 , 2 0 1 1
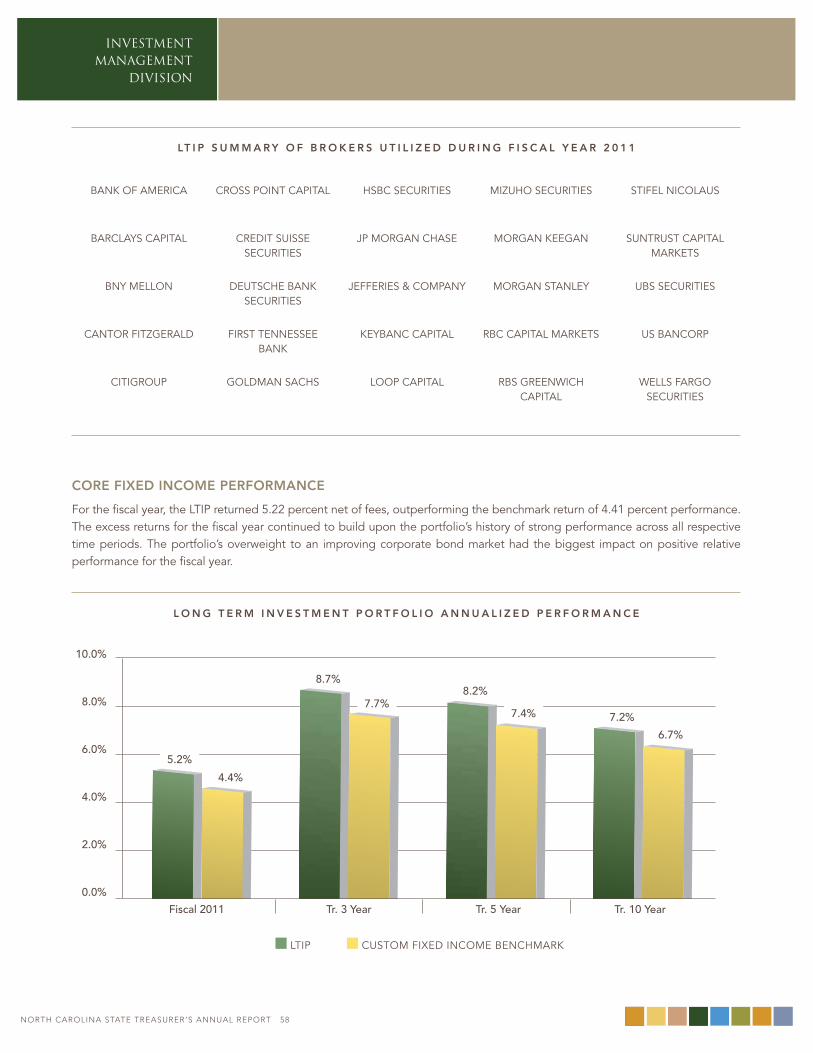
INVESTMENT MANAGEMENT
DIVISION
noRtH CARoLInA StAtE tREASuRER’S AnnuAL REPoRt 58
lt i p s u m m a R y o f b R o K e R s u t i l i z e D D u R i n g f i s c a l y e a R 2 0 1 1
bANK oF AmeRICA CRoSS PoINT CAPITAl hSbC SeCURITIeS mIzUho SeCURITIeS STIFel NIColAUS
bARClAyS CAPITAl CReDIT SUISSe SeCURITIeS
JP moRgAN ChASe moRgAN KeegAN SUNTRUST CAPITAl mARKeTS
bNy melloN DeUTSChe bANK SeCURITIeS
JeFFeRIeS & ComPANy moRgAN STANley UbS SeCURITIeS
CANToR FITzgeRAlD FIRST TeNNeSSee bANK
KeybANC CAPITAl RbC CAPITAl mARKeTS US bANCoRP
CITIgRoUP golDmAN SAChS looP CAPITAl RbS gReeNwICh CAPITAl
wellS FARgo SeCURITIeS
coRe fixeD income peRfoRmance
For the fiscal year, the lTIP returned 5.22 percent net of fees, outperforming the benchmark return of 4.41 percent performance. The excess returns for the fiscal year continued to build upon the portfolio’s history of strong performance across all respective time periods. The portfolio’s overweight to an improving corporate bond market had the biggest impact on positive relative performance for the fiscal year.
l o n g t e R m i n v e s t m e n t p o R t f o l i o a n n u a l i z e D p e R f o R m a n c e
10.0%
8.0%
6.0%
4.0%
2.0%
0.0%
5.2%
4.4%
8.7%
7.7%8.2%
7.4% 7.2%
6.7%
Fiscal 2011 Tr. 3 Year Tr. 5 Year Tr. 10 Year
lTIP CUSTom FIxeD INCome beNChmARK
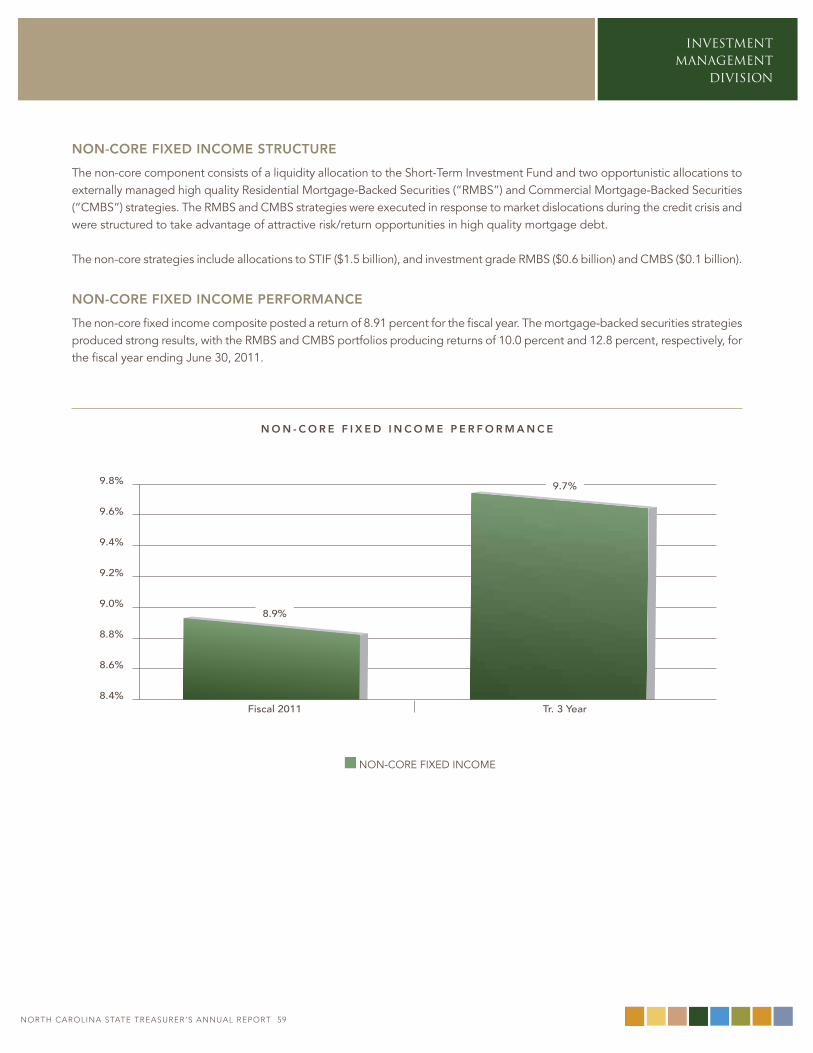
noRtH CARoLInA StAtE tREASuRER’S AnnuAL REPoRt 58
INVESTMENT MANAGEMENT
DIVISION
noRtH CARoLInA StAtE tREASuRER’S AnnuAL REPoRt 59
non-coRe fixeD income stRuctuRe
The non-core component consists of a liquidity allocation to the Short-Term Investment Fund and two opportunistic allocations to externally managed high quality Residential mortgage-backed Securities (“RmbS”) and Commercial mortgage-backed Securities (“CmbS”) strategies. The RmbS and CmbS strategies were executed in response to market dislocations during the credit crisis and were structured to take advantage of attractive risk/return opportunities in high quality mortgage debt.
The non-core strategies include allocations to STIF ($1.5 billion), and investment grade RmbS ($0.6 billion) and CmbS ($0.1 billion).
non-coRe fixeD income peRfoRmance
The non-core fixed income composite posted a return of 8.91 percent for the fiscal year. The mortgage-backed securities strategies produced strong results, with the RmbS and CmbS portfolios producing returns of 10.0 percent and 12.8 percent, respectively, for the fiscal year ending June 30, 2011.
n o n - c o R e f i x e D i n c o m e p e R f o R m a n c e
9.8%
9.6%
9.4%
9.2%
9.0%
8.8%
8.6%
8.4%
8.9%
9.7%
Fiscal 2011 Tr. 3 Year
NoN-CoRe FIxeD INCome
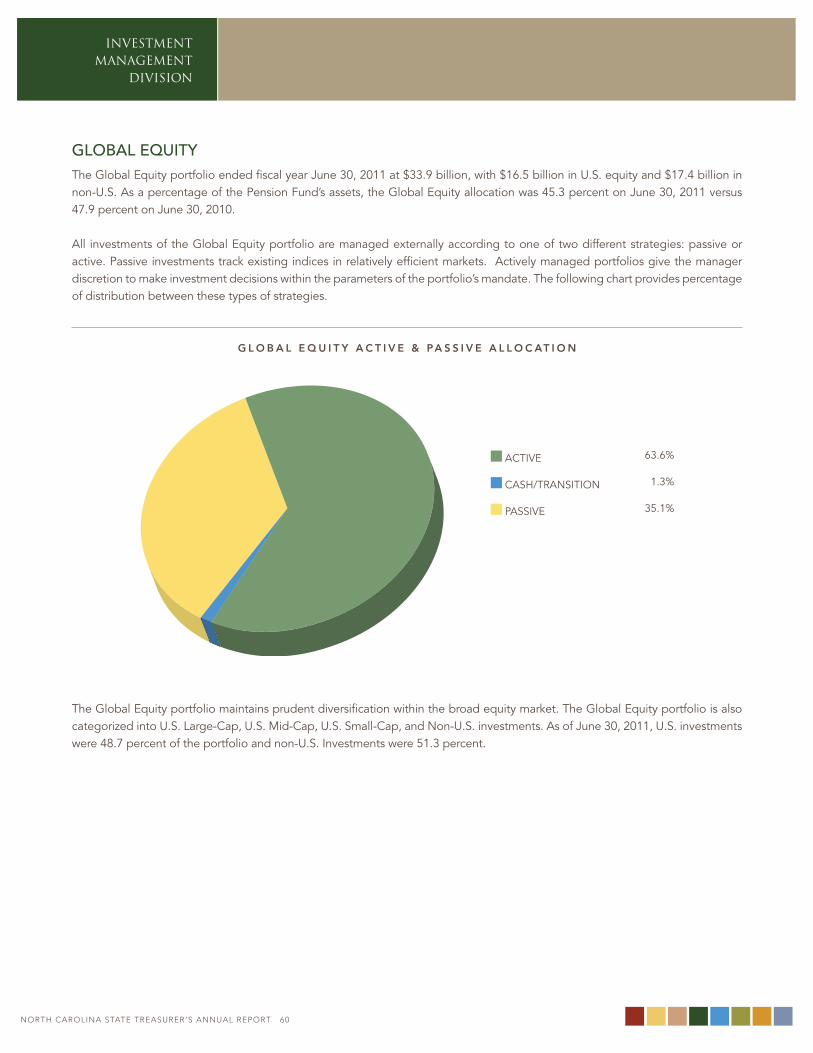
INVESTMENT MANAGEMENT
DIVISION
noRtH CARoLInA StAtE tREASuRER’S AnnuAL REPoRt 60
INVESTMENT MANAGEMENT
DIVISION
GLOBAL EqUITY The global equity portfolio ended fiscal year June 30, 2011 at $33.9 billion, with $16.5 billion in U.S. equity and $17.4 billion in non-U.S. As a percentage of the Pension Fund’s assets, the global equity allocation was 45.3 percent on June 30, 2011 versus 47.9 percent on June 30, 2010.
All investments of the global equity portfolio are managed externally according to one of two different strategies: passive or active. Passive investments track existing indices in relatively efficient markets. Actively managed portfolios give the manager discretion to make investment decisions within the parameters of the portfolio’s mandate. The following chart provides percentage of distribution between these types of strategies.
g l o b a l e q u i t y a c t i v e & pa s s i v e a l l o c at i o n
The global equity portfolio maintains prudent diversification within the broad equity market. The global equity portfolio is also categorized into U.S. large-Cap, U.S. mid-Cap, U.S. Small-Cap, and Non-U.S. investments. As of June 30, 2011, U.S. investments were 48.7 percent of the portfolio and non-U.S. Investments were 51.3 percent.
ACTIve
CASh/TRANSITIoN
PASSIve
63.6%
1.3%
35.1%
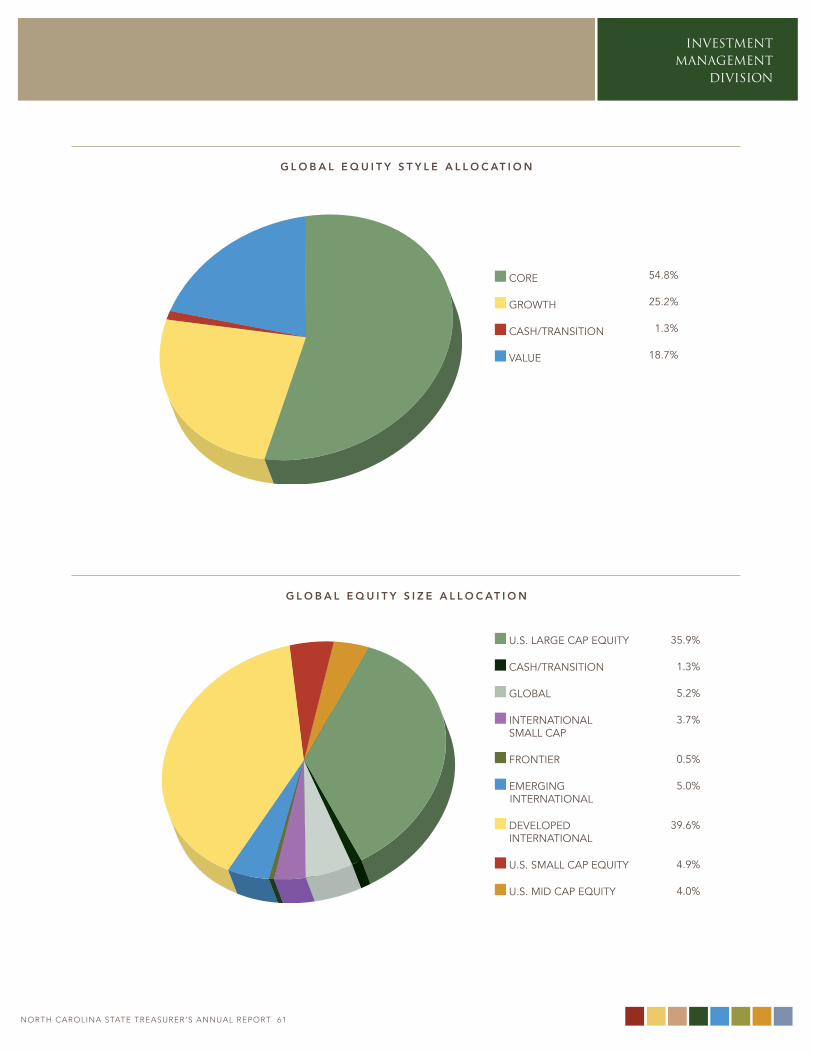
noRtH CARoLInA StAtE tREASuRER’S AnnuAL REPoRt 60
INVESTMENT MANAGEMENT
DIVISION
noRtH CARoLInA StAtE tREASuRER’S AnnuAL REPoRt 61
INVESTMENT MANAGEMENT
DIVISION
g l o b a l e q u i t y s t y l e a l l o c at i o n
g l o b a l e q u i t y s i z e a l l o c at i o n
CoRe
gRowTh
CASh/TRANSITIoN
vAlUe
54.8%
25.2%
1.3%
18.7%
U.S. lARge CAP eqUITy
CASh/TRANSITIoN
globAl
INTeRNATIoNAl SmAll CAP
FRoNTIeR
emeRgINg INTeRNATIoNAl
DeveloPeD INTeRNATIoNAl
U.S. SmAll CAP eqUITy
U.S. mID CAP eqUITy
35.9%
1.3%
5.2%
3.7%
0.5%
5.0%
39.6%
4.9%
4.0%
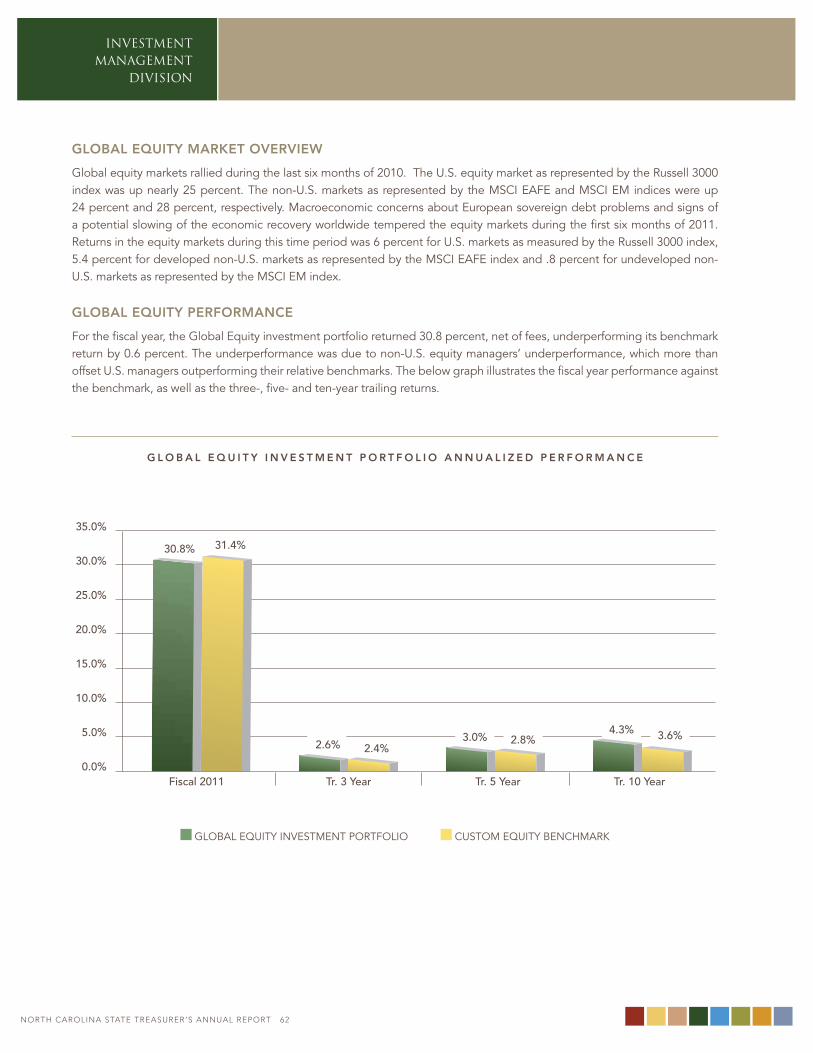
INVESTMENT MANAGEMENT
DIVISION
noRtH CARoLInA StAtE tREASuRER’S AnnuAL REPoRt 62
global equity maRKet oveRview
global equity markets rallied during the last six months of 2010. The U.S. equity market as represented by the Russell 3000 index was up nearly 25 percent. The non-U.S. markets as represented by the mSCI eAFe and mSCI em indices were up 24 percent and 28 percent, respectively. macroeconomic concerns about european sovereign debt problems and signs of a potential slowing of the economic recovery worldwide tempered the equity markets during the first six months of 2011. Returns in the equity markets during this time period was 6 percent for U.S. markets as measured by the Russell 3000 index, 5.4 percent for developed non-U.S. markets as represented by the mSCI eAFe index and .8 percent for undeveloped non-U.S. markets as represented by the mSCI em index.
global equity peRfoRmance
For the fiscal year, the global equity investment portfolio returned 30.8 percent, net of fees, underperforming its benchmark return by 0.6 percent. The underperformance was due to non-U.S. equity managers’ underperformance, which more than offset U.S. managers outperforming their relative benchmarks. The below graph illustrates the fiscal year performance against the benchmark, as well as the three-, five- and ten-year trailing returns.
g l o b a l e q u i t y i n v e s t m e n t p o R t f o l i o a n n u a l i z e D p e R f o R m a n c e
35.0%
30.0%
25.0%
20.0%
15.0%
10.0%
5.0%
0.0%
30.8% 31.4%
2.6% 2.4%3.0% 2.8%
4.3% 3.6%
Fiscal 2011 Tr. 3 Year Tr. 5 Year Tr. 10 Year
globAl eqUITy INveSTmeNT PoRTFolIo CUSTom eqUITy beNChmARK
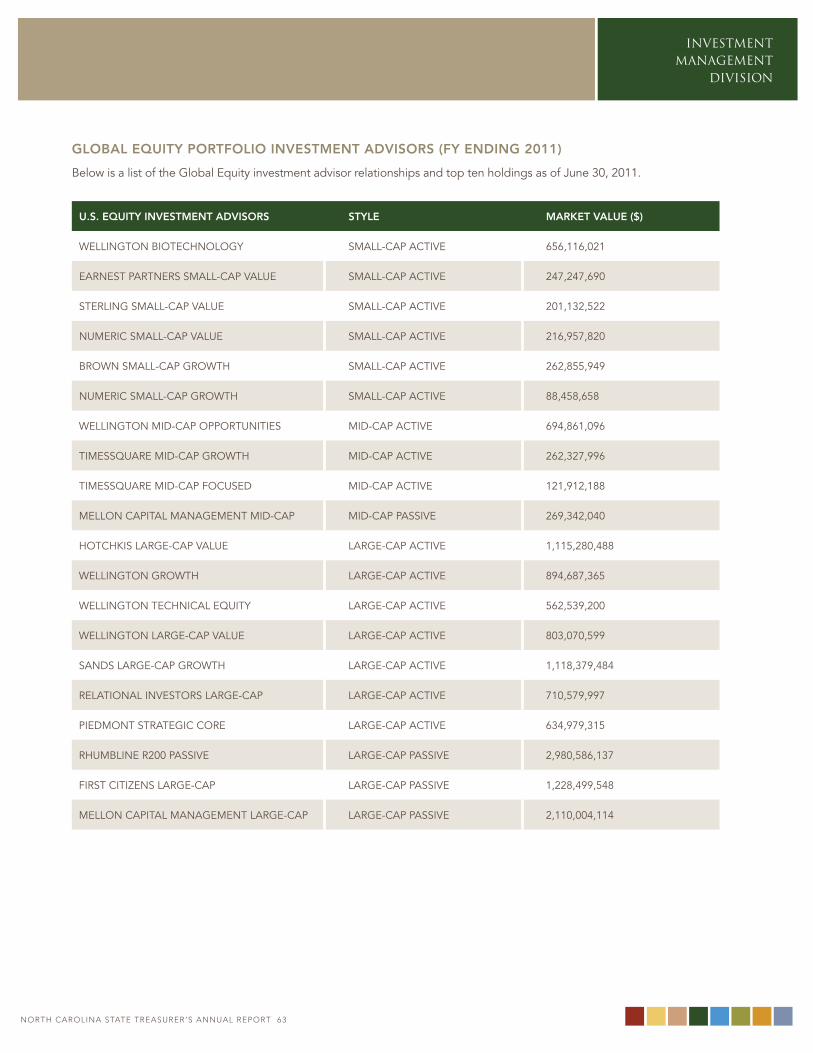
noRtH CARoLInA StAtE tREASuRER’S AnnuAL REPoRt 62
INVESTMENT MANAGEMENT
DIVISION
noRtH CARoLInA StAtE tREASuRER’S AnnuAL REPoRt 63
global equity poRtfolio investment aDvisoRs (fy enDing 2011)
below is a list of the global equity investment advisor relationships and top ten holdings as of June 30, 2011.
u.s. equity investment aDvisoRs style maRKet value ($)
wellINgToN bIoTeChNology SmAll-CAP ACTIve 656,116,021
eARNeST PARTNeRS SmAll-CAP vAlUe SmAll-CAP ACTIve 247,247,690
STeRlINg SmAll-CAP vAlUe SmAll-CAP ACTIve 201,132,522
NUmeRIC SmAll-CAP vAlUe SmAll-CAP ACTIve 216,957,820
bRowN SmAll-CAP gRowTh SmAll-CAP ACTIve 262,855,949
NUmeRIC SmAll-CAP gRowTh SmAll-CAP ACTIve 88,458,658
wellINgToN mID-CAP oPPoRTUNITIeS mID-CAP ACTIve 694,861,096
TImeSSqUARe mID-CAP gRowTh mID-CAP ACTIve 262,327,996
TImeSSqUARe mID-CAP FoCUSeD mID-CAP ACTIve 121,912,188
melloN CAPITAl mANAgemeNT mID-CAP mID-CAP PASSIve 269,342,040
hoTChKIS lARge-CAP vAlUe lARge-CAP ACTIve 1,115,280,488
wellINgToN gRowTh lARge-CAP ACTIve 894,687,365
wellINgToN TeChNICAl eqUITy lARge-CAP ACTIve 562,539,200
wellINgToN lARge-CAP vAlUe lARge-CAP ACTIve 803,070,599
SANDS lARge-CAP gRowTh lARge-CAP ACTIve 1,118,379,484
RelATIoNAl INveSToRS lARge-CAP lARge-CAP ACTIve 710,579,997
PIeDmoNT STRATegIC CoRe lARge-CAP ACTIve 634,979,315
RhUmblINe R200 PASSIve lARge-CAP PASSIve 2,980,586,137
FIRST CITIzeNS lARge-CAP lARge-CAP PASSIve 1,228,499,548
melloN CAPITAl mANAgemeNT lARge-CAP lARge-CAP PASSIve 2,110,004,114
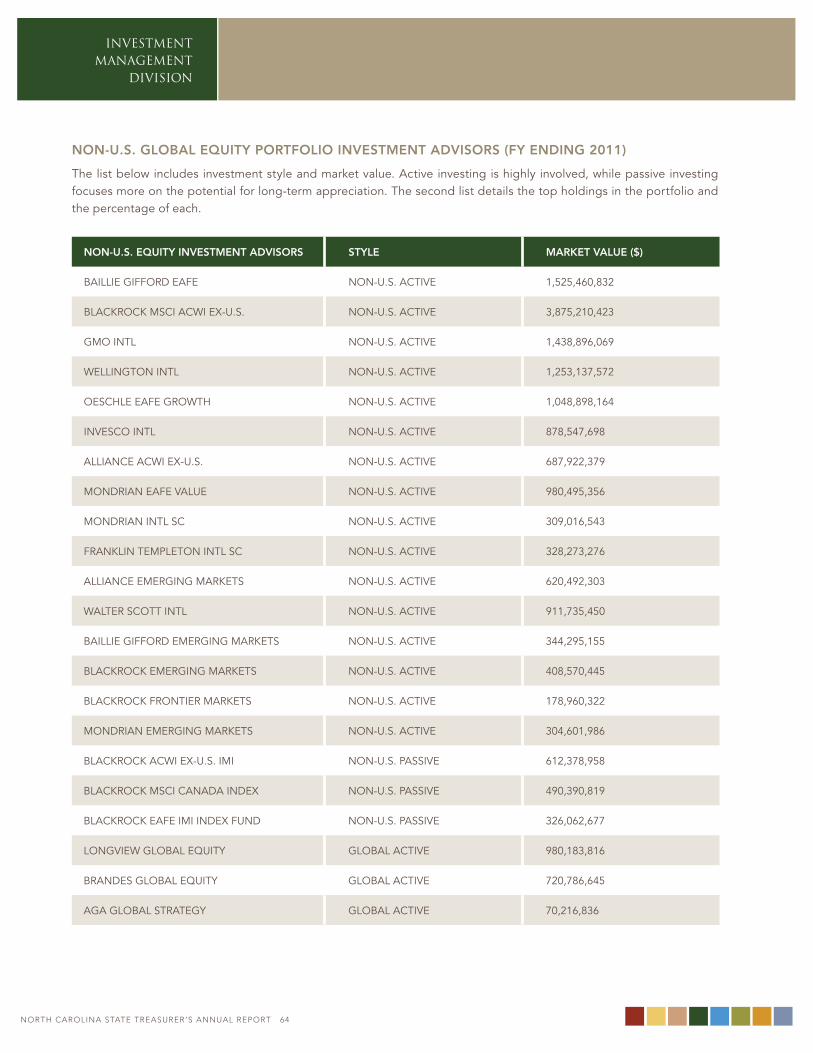
INVESTMENT MANAGEMENT
DIVISION
noRtH CARoLInA StAtE tREASuRER’S AnnuAL REPoRt 64
non-u.s. global equity poRtfolio investment aDvisoRs (fy enDing 2011)
The list below includes investment style and market value. Active investing is highly involved, while passive investing focuses more on the potential for long-term appreciation. The second list details the top holdings in the portfolio and the percentage of each.
non-u.s. equity investment aDvisoRs style maRKet value ($)
bAIllIe gIFFoRD eAFe NoN-U.S. ACTIve 1,525,460,832
blACKRoCK mSCI ACwI ex-U.S. NoN-U.S. ACTIve 3,875,210,423
gmo INTl NoN-U.S. ACTIve 1,438,896,069
wellINgToN INTl NoN-U.S. ACTIve 1,253,137,572
oeSChle eAFe gRowTh NoN-U.S. ACTIve 1,048,898,164
INveSCo INTl NoN-U.S. ACTIve 878,547,698
AllIANCe ACwI ex-U.S. NoN-U.S. ACTIve 687,922,379
moNDRIAN eAFe vAlUe NoN-U.S. ACTIve 980,495,356
moNDRIAN INTl SC NoN-U.S. ACTIve 309,016,543
FRANKlIN TemPleToN INTl SC NoN-U.S. ACTIve 328,273,276
AllIANCe emeRgINg mARKeTS NoN-U.S. ACTIve 620,492,303
wAlTeR SCoTT INTl NoN-U.S. ACTIve 911,735,450
bAIllIe gIFFoRD emeRgINg mARKeTS NoN-U.S. ACTIve 344,295,155
blACKRoCK emeRgINg mARKeTS NoN-U.S. ACTIve 408,570,445
blACKRoCK FRoNTIeR mARKeTS NoN-U.S. ACTIve 178,960,322
moNDRIAN emeRgINg mARKeTS NoN-U.S. ACTIve 304,601,986
blACKRoCK ACwI ex-U.S. ImI NoN-U.S. PASSIve 612,378,958
blACKRoCK mSCI CANADA INDex NoN-U.S. PASSIve 490,390,819
blACKRoCK eAFe ImI INDex FUND NoN-U.S. PASSIve 326,062,677
loNgvIew globAl eqUITy globAl ACTIve 980,183,816
bRANDeS globAl eqUITy globAl ACTIve 720,786,645
AgA globAl STRATegy globAl ACTIve 70,216,836
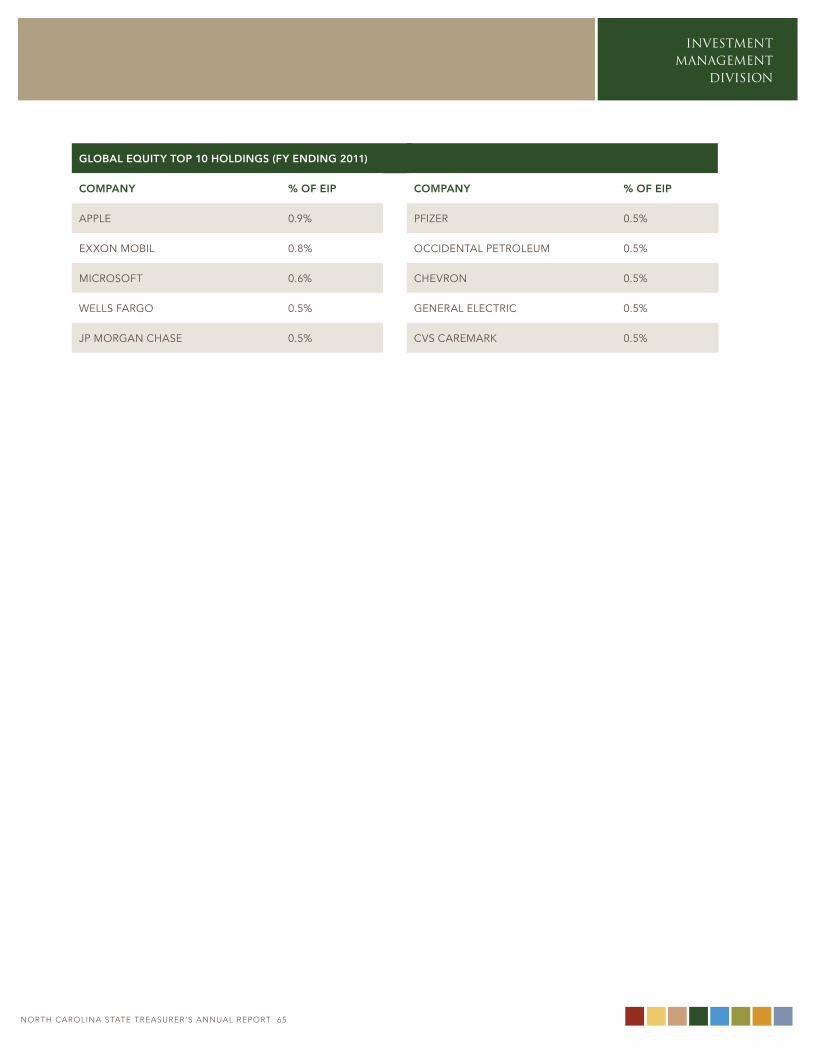
noRtH CARoLInA StAtE tREASuRER’S AnnuAL REPoRt 64
INVESTMENT MANAGEMENT
DIVISION
noRtH CARoLInA StAtE tREASuRER’S AnnuAL REPoRt 65
global equity top 10 holDings (fy enDing 2011)
company % of eip
APPle 0.9%
exxoN mobIl 0.8%
mICRoSoFT 0.6%
wellS FARgo 0.5%
JP moRgAN ChASe 0.5%
company % of eip
PFIzeR 0.5%
oCCIDeNTAl PeTRoleUm 0.5%
ChevRoN 0.5%
geNeRAl eleCTRIC 0.5%
CvS CARemARK 0.5%
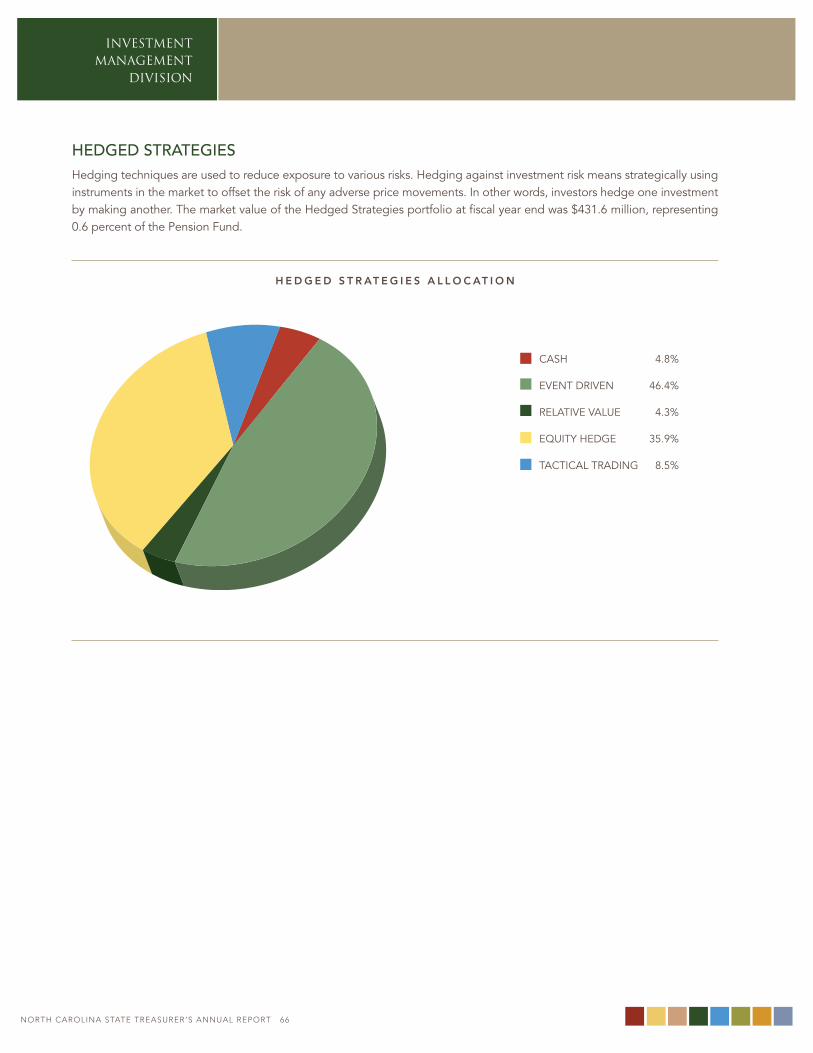
INVESTMENT MANAGEMENT
DIVISION
noRtH CARoLInA StAtE tREASuRER’S AnnuAL REPoRt 66
HEdGEd STRATEGIEShedging techniques are used to reduce exposure to various risks. hedging against investment risk means strategically using instruments in the market to offset the risk of any adverse price movements. In other words, investors hedge one investment by making another. The market value of the hedged Strategies portfolio at fiscal year end was $431.6 million, representing 0.6 percent of the Pension Fund.
h e D g e D s t R at e g i e s a l l o c at i o n
CASh 4.8%
eveNT DRIveN 46.4%
RelATIve vAlUe 4.3%
eqUITy heDge 35.9%
TACTICAl TRADINg 8.5%
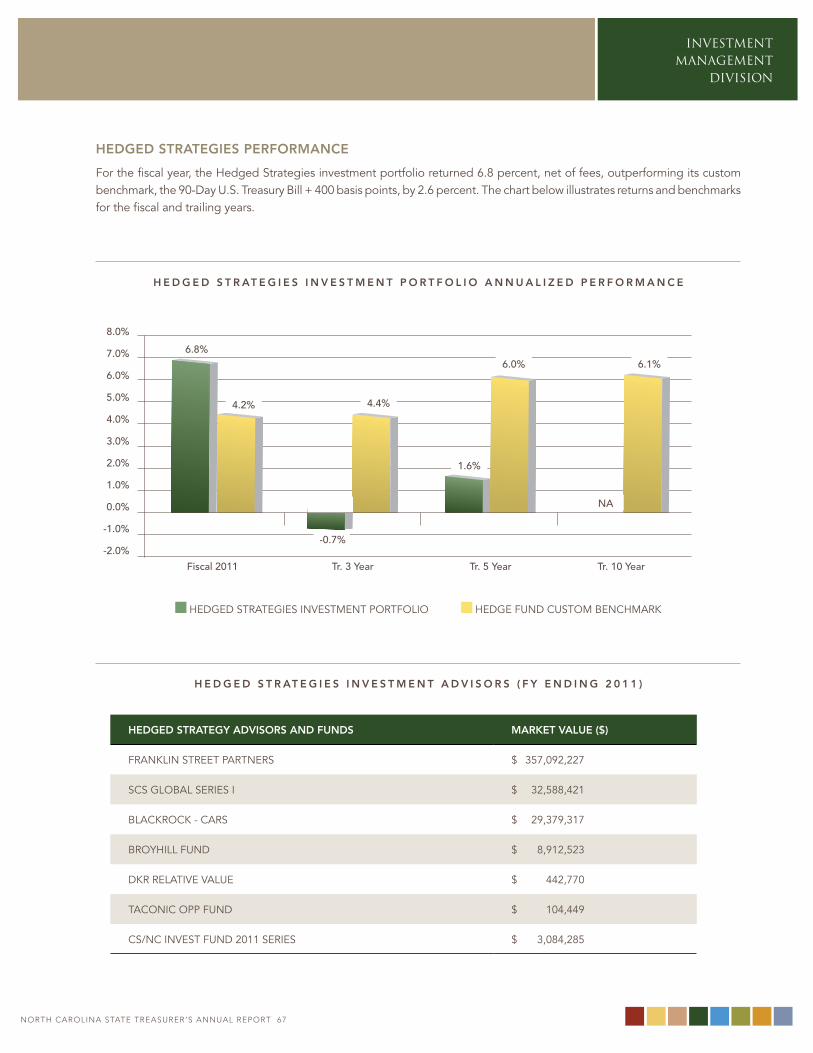
noRtH CARoLInA StAtE tREASuRER’S AnnuAL REPoRt 66
INVESTMENT MANAGEMENT
DIVISION
noRtH CARoLInA StAtE tREASuRER’S AnnuAL REPoRt 67
heDgeD stRategies peRfoRmance
For the fiscal year, the hedged Strategies investment portfolio returned 6.8 percent, net of fees, outperforming its custom benchmark, the 90-Day U.S. Treasury bill + 400 basis points, by 2.6 percent. The chart below illustrates returns and benchmarks for the fiscal and trailing years.
h e D g e D s t R at e g i e s i n v e s t m e n t p o R t f o l i o a n n u a l i z e D p e R f o R m a n c e
8.0%
7.0%
6.0%
5.0%
4.0%
3.0%
2.0%
1.0%
0.0%
-1.0%
-2.0%
6.8%
4.2%
-0.7%
4.4%
1.6%
6.0%
NA
6.1%
Fiscal 2011 Tr. 3 Year Tr. 5 Year Tr. 10 Year
heDgeD STRATegIeS INveSTmeNT PoRTFolIo heDge FUND CUSTom beNChmARK
h e D g e D s t R at e g i e s i n v e s t m e n t a D v i s o R s ( f y e n D i n g 2 0 1 1 )
heDgeD stRategy aDvisoRs anD funDs maRKet value ($)
FRANKlIN STReeT PARTNeRS $ 357,092,227
SCS globAl SeRIeS I $ 32,588,421
blACKRoCK - CARS $ 29,379,317
bRoyhIll FUND $ 8,912,523
DKR RelATIve vAlUe $ 442,770
TACoNIC oPP FUND $ 104,449
CS/NC INveST FUND 2011 SeRIeS $ 3,084,285
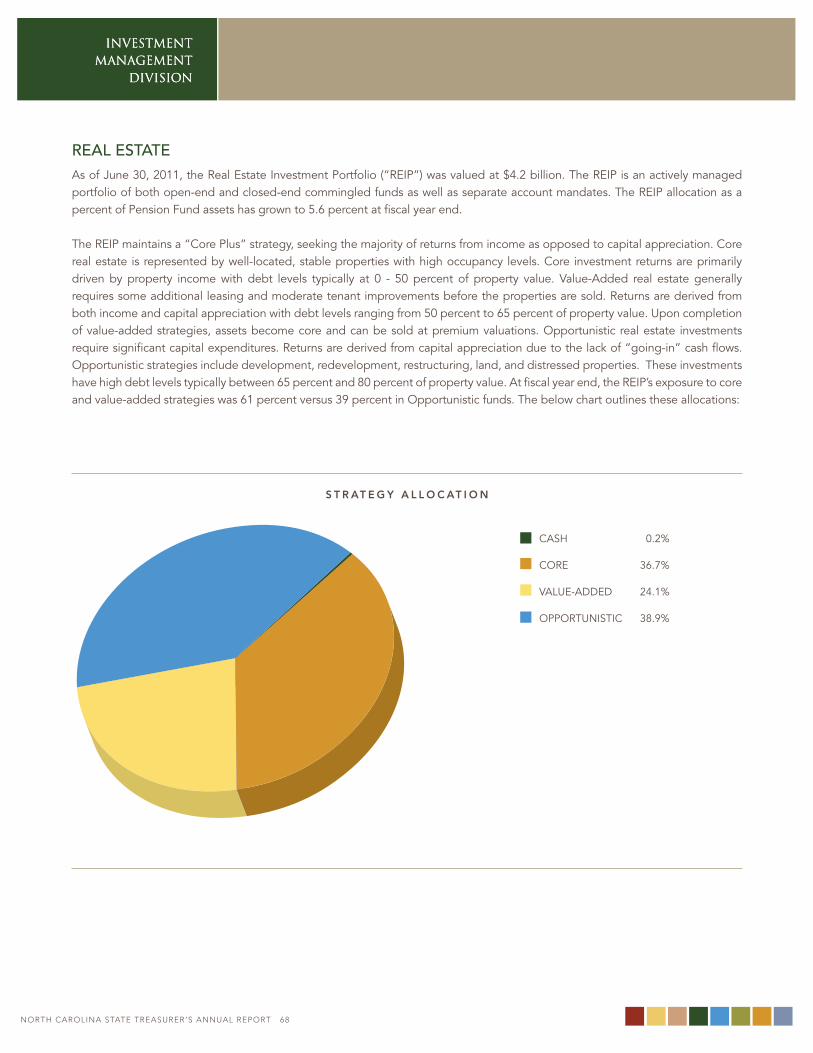
INVESTMENT MANAGEMENT
DIVISION
noRtH CARoLInA StAtE tREASuRER’S AnnuAL REPoRt 68
INVESTMENT MANAGEMENT
DIVISION
REAL ESTATEAs of June 30, 2011, the Real estate Investment Portfolio (“ReIP”) was valued at $4.2 billion. The ReIP is an actively managed portfolio of both open-end and closed-end commingled funds as well as separate account mandates. The ReIP allocation as a percent of Pension Fund assets has grown to 5.6 percent at fiscal year end.
The ReIP maintains a “Core Plus” strategy, seeking the majority of returns from income as opposed to capital appreciation. Core real estate is represented by well-located, stable properties with high occupancy levels. Core investment returns are primarily driven by property income with debt levels typically at 0 - 50 percent of property value. value-Added real estate generally requires some additional leasing and moderate tenant improvements before the properties are sold. Returns are derived from both income and capital appreciation with debt levels ranging from 50 percent to 65 percent of property value. Upon completion of value-added strategies, assets become core and can be sold at premium valuations. opportunistic real estate investments require significant capital expenditures. Returns are derived from capital appreciation due to the lack of “going-in” cash flows. opportunistic strategies include development, redevelopment, restructuring, land, and distressed properties. These investments have high debt levels typically between 65 percent and 80 percent of property value. At fiscal year end, the ReIP’s exposure to core and value-added strategies was 61 percent versus 39 percent in opportunistic funds. The below chart outlines these allocations:
CASh 0.2%
CoRe 36.7%
vAlUe-ADDeD 24.1%
oPPoRTUNISTIC 38.9%
s t R at e g y a l l o c at i o n
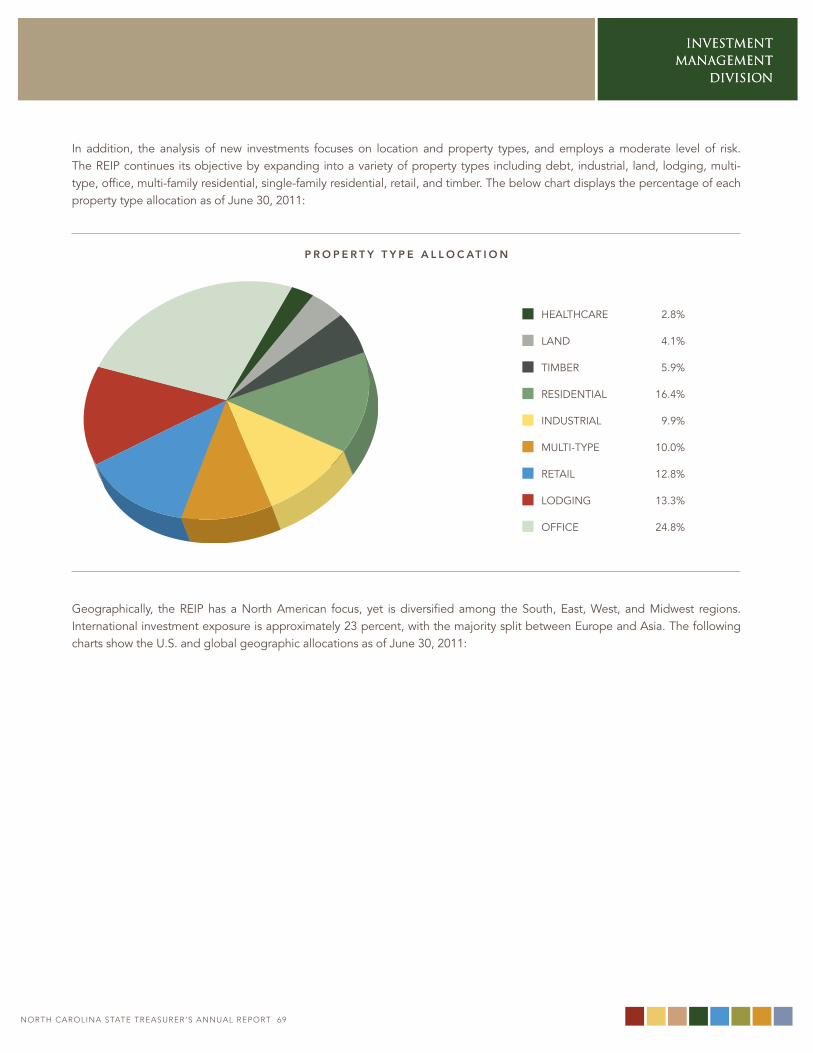
noRtH CARoLInA StAtE tREASuRER’S AnnuAL REPoRt 68
INVESTMENT MANAGEMENT
DIVISION
noRtH CARoLInA StAtE tREASuRER’S AnnuAL REPoRt 69
INVESTMENT MANAGEMENT
DIVISION
In addition, the analysis of new investments focuses on location and property types, and employs a moderate level of risk. The ReIP continues its objective by expanding into a variety of property types including debt, industrial, land, lodging, multi-type, office, multi-family residential, single-family residential, retail, and timber. The below chart displays the percentage of each property type allocation as of June 30, 2011:
p R o p e R t y t y p e a l l o c at i o n
geographically, the ReIP has a North American focus, yet is diversified among the South, east, west, and midwest regions. International investment exposure is approximately 23 percent, with the majority split between europe and Asia. The following charts show the U.S. and global geographic allocations as of June 30, 2011:
heAlThCARe 2.8%
lAND 4.1%
TImbeR 5.9%
ReSIDeNTIAl 16.4%
INDUSTRIAl 9.9%
mUlTI-TyPe 10.0%
ReTAIl 12.8%
loDgINg 13.3%
oFFICe 24.8%
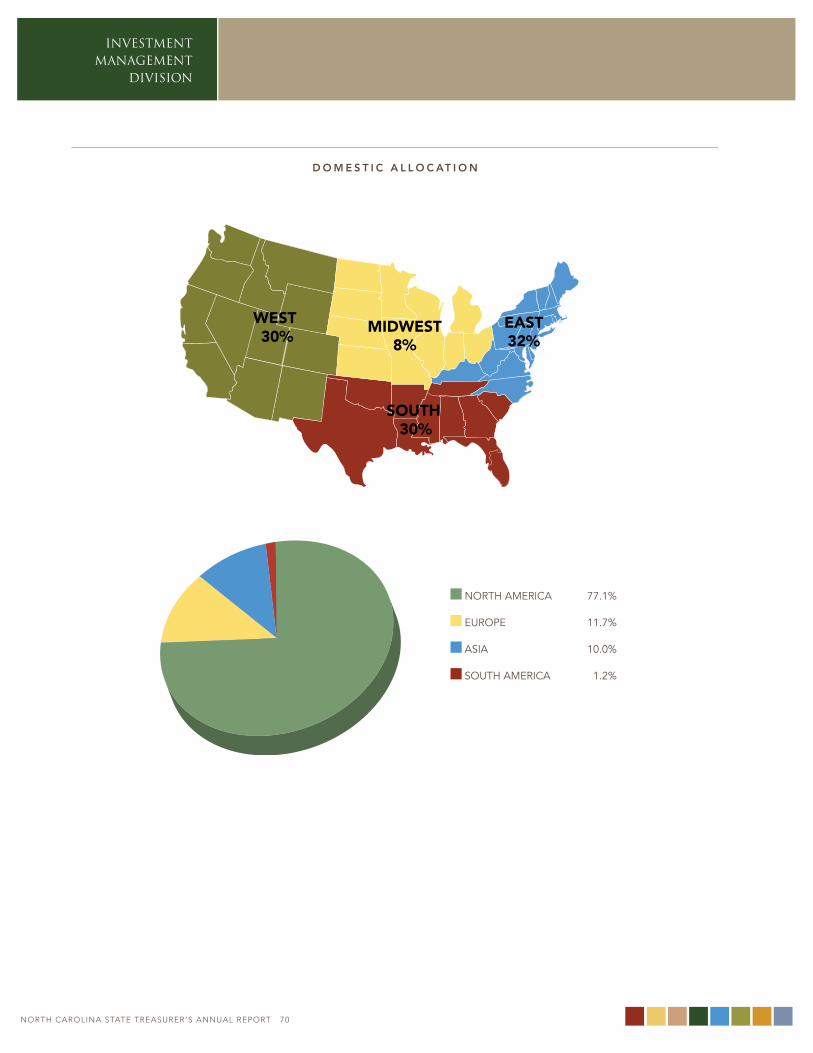
INVESTMENT MANAGEMENT
DIVISION
noRtH CARoLInA StAtE tREASuRER’S AnnuAL REPoRt 70
D o m e s t i c a l l o c at i o n
SOUTH 30%
MIDWEST 8%
EAST 32%
WEST 30%
NoRTh AmeRICA 77.1%
eURoPe 11.7%
ASIA 10.0%
SoUTh AmeRICA 1.2%
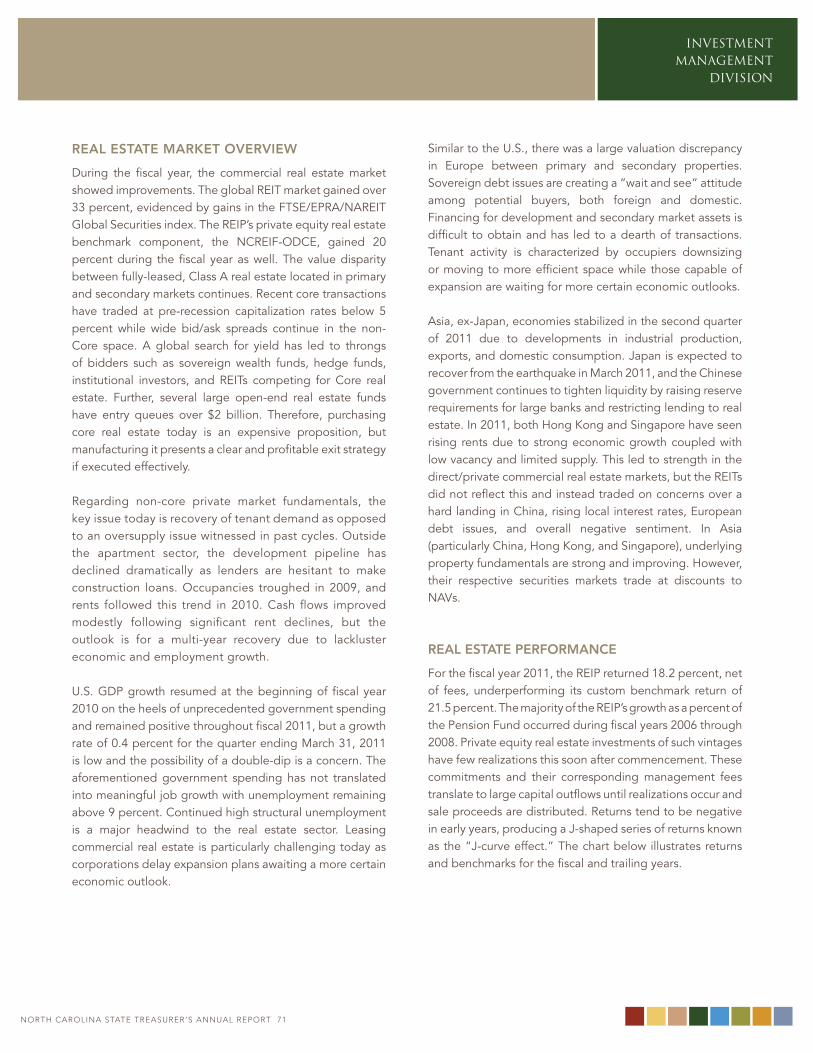
noRtH CARoLInA StAtE tREASuRER’S AnnuAL REPoRt 70
INVESTMENT MANAGEMENT
DIVISION
noRtH CARoLInA StAtE tREASuRER’S AnnuAL REPoRt 71
Real estate maRKet oveRview
During the fiscal year, the commercial real estate market showed improvements. The global ReIT market gained over 33 percent, evidenced by gains in the FTSe/ePRA/NAReIT global Securities index. The ReIP’s private equity real estate benchmark component, the NCReIF-oDCe, gained 20 percent during the fiscal year as well. The value disparity between fully-leased, Class A real estate located in primary and secondary markets continues. Recent core transactions have traded at pre-recession capitalization rates below 5 percent while wide bid/ask spreads continue in the non-Core space. A global search for yield has led to throngs of bidders such as sovereign wealth funds, hedge funds, institutional investors, and ReITs competing for Core real estate. Further, several large open-end real estate funds have entry queues over $2 billion. Therefore, purchasing core real estate today is an expensive proposition, but manufacturing it presents a clear and profitable exit strategy if executed effectively.
Regarding non-core private market fundamentals, the key issue today is recovery of tenant demand as opposed to an oversupply issue witnessed in past cycles. outside the apartment sector, the development pipeline has declined dramatically as lenders are hesitant to make construction loans. occupancies troughed in 2009, and rents followed this trend in 2010. Cash flows improved modestly following significant rent declines, but the outlook is for a multi-year recovery due to lackluster economic and employment growth.
U.S. gDP growth resumed at the beginning of fiscal year 2010 on the heels of unprecedented government spending and remained positive throughout fiscal 2011, but a growth rate of 0.4 percent for the quarter ending march 31, 2011 is low and the possibility of a double-dip is a concern. The aforementioned government spending has not translated into meaningful job growth with unemployment remaining above 9 percent. Continued high structural unemployment is a major headwind to the real estate sector. leasing commercial real estate is particularly challenging today as corporations delay expansion plans awaiting a more certain economic outlook.
Similar to the U.S., there was a large valuation discrepancy in europe between primary and secondary properties. Sovereign debt issues are creating a “wait and see” attitude among potential buyers, both foreign and domestic. Financing for development and secondary market assets is difficult to obtain and has led to a dearth of transactions. Tenant activity is characterized by occupiers downsizing or moving to more efficient space while those capable of expansion are waiting for more certain economic outlooks.
Asia, ex-Japan, economies stabilized in the second quarter of 2011 due to developments in industrial production, exports, and domestic consumption. Japan is expected to recover from the earthquake in march 2011, and the Chinese government continues to tighten liquidity by raising reserve requirements for large banks and restricting lending to real estate. In 2011, both hong Kong and Singapore have seen rising rents due to strong economic growth coupled with low vacancy and limited supply. This led to strength in the direct/private commercial real estate markets, but the ReITs did not reflect this and instead traded on concerns over a hard landing in China, rising local interest rates, european debt issues, and overall negative sentiment. In Asia (particularly China, hong Kong, and Singapore), underlying property fundamentals are strong and improving. however, their respective securities markets trade at discounts to NAvs.
Real estate peRfoRmance
For the fiscal year 2011, the ReIP returned 18.2 percent, net of fees, underperforming its custom benchmark return of 21.5 percent. The majority of the ReIP’s growth as a percent of the Pension Fund occurred during fiscal years 2006 through 2008. Private equity real estate investments of such vintages have few realizations this soon after commencement. These commitments and their corresponding management fees translate to large capital outflows until realizations occur and sale proceeds are distributed. Returns tend to be negative in early years, producing a J-shaped series of returns known as the “J-curve effect.” The chart below illustrates returns and benchmarks for the fiscal and trailing years.
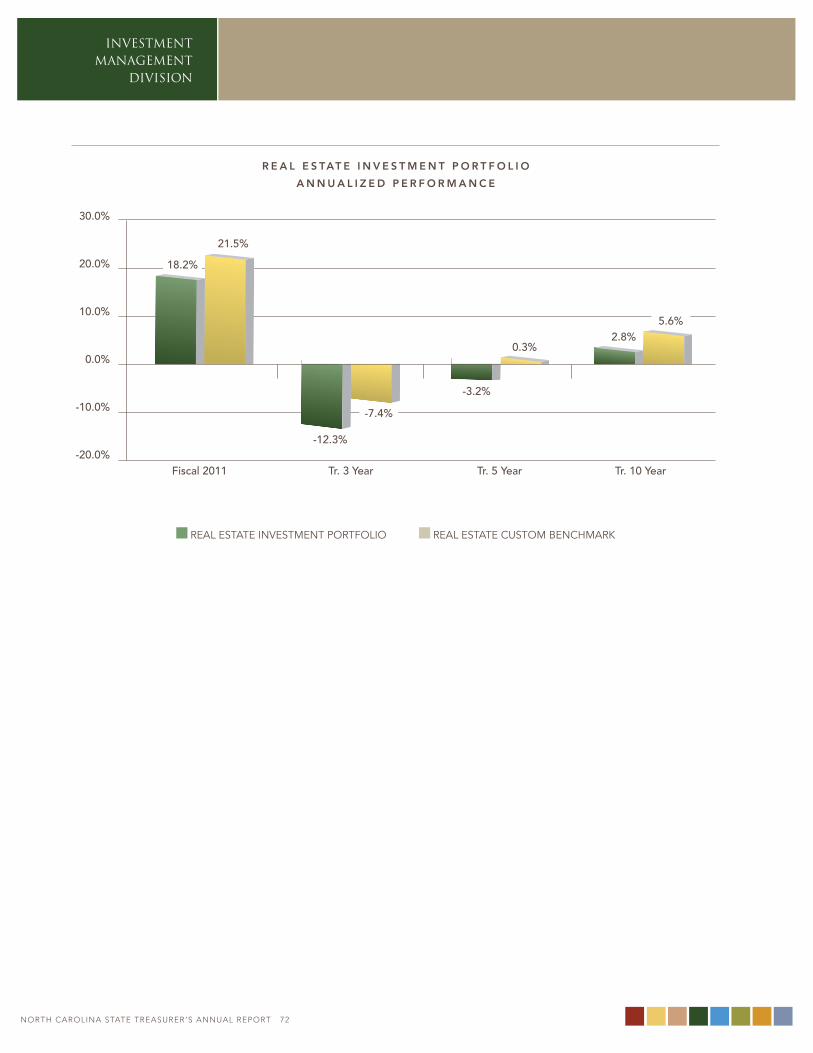
INVESTMENT MANAGEMENT
DIVISION
noRtH CARoLInA StAtE tREASuRER’S AnnuAL REPoRt 72
R e a l e s tat e i n v e s t m e n t p o R t f o l i o
a n n u a l i z e D p e R f o R m a n c e
30.0%
20.0%
10.0%
0.0%
-10.0%
-20.0%
18.2%
21.5%
-12.3%
-7.4%
-3.2%
0.3%2.8%
5.6%
Fiscal 2011 Tr. 3 Year Tr. 5 Year Tr. 10 Year
ReAl eSTATe INveSTmeNT PoRTFolIo ReAl eSTATe CUSTom beNChmARK
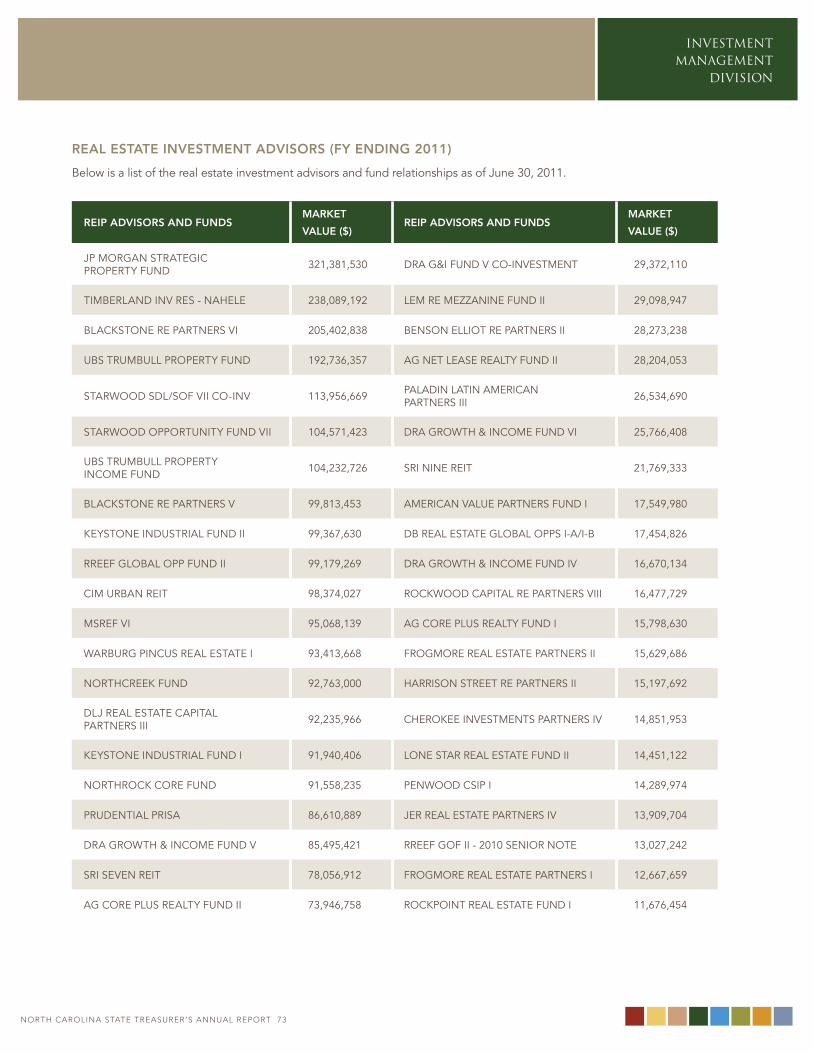
noRtH CARoLInA StAtE tREASuRER’S AnnuAL REPoRt 72
INVESTMENT MANAGEMENT
DIVISION
noRtH CARoLInA StAtE tREASuRER’S AnnuAL REPoRt 73
Real estate investment aDvisoRs (fy enDing 2011)
below is a list of the real estate investment advisors and fund relationships as of June 30, 2011.
Reip aDvisoRs anD funDsmaRKet
value ($)Reip aDvisoRs anD funDs
maRKet
value ($)
JP moRgAN STRATegIC PRoPeRTy FUND 321,381,530 DRA g&I FUND v Co-INveSTmeNT 29,372,110
TImbeRlAND INv ReS - NAhele 238,089,192 lem Re mezzANINe FUND II 29,098,947
blACKSToNe Re PARTNeRS vI 205,402,838 beNSoN ellIoT Re PARTNeRS II 28,273,238
UbS TRUmbUll PRoPeRTy FUND 192,736,357 Ag NeT leASe ReAlTy FUND II 28,204,053
STARwooD SDl/SoF vII Co-INv 113,956,669 PAlADIN lATIN AmeRICAN PARTNeRS III 26,534,690
STARwooD oPPoRTUNITy FUND vII 104,571,423 DRA gRowTh & INCome FUND vI 25,766,408
UbS TRUmbUll PRoPeRTy INCome FUND 104,232,726 SRI NINe ReIT 21,769,333
blACKSToNe Re PARTNeRS v 99,813,453 AmeRICAN vAlUe PARTNeRS FUND I 17,549,980
KeySToNe INDUSTRIAl FUND II 99,367,630 Db ReAl eSTATe globAl oPPS I-A/I-b 17,454,826
RReeF globAl oPP FUND II 99,179,269 DRA gRowTh & INCome FUND Iv 16,670,134
CIm URbAN ReIT 98,374,027 RoCKwooD CAPITAl Re PARTNeRS vIII 16,477,729
mSReF vI 95,068,139 Ag CoRe PlUS ReAlTy FUND I 15,798,630
wARbURg PINCUS ReAl eSTATe I 93,413,668 FRogmoRe ReAl eSTATe PARTNeRS II 15,629,686
NoRThCReeK FUND 92,763,000 hARRISoN STReeT Re PARTNeRS II 15,197,692
DlJ ReAl eSTATe CAPITAl PARTNeRS III 92,235,966 CheRoKee INveSTmeNTS PARTNeRS Iv 14,851,953
KeySToNe INDUSTRIAl FUND I 91,940,406 loNe STAR ReAl eSTATe FUND II 14,451,122
NoRThRoCK CoRe FUND 91,558,235 PeNwooD CSIP I 14,289,974
PRUDeNTIAl PRISA 86,610,889 JeR ReAl eSTATe PARTNeRS Iv 13,909,704
DRA gRowTh & INCome FUND v 85,495,421 RReeF goF II - 2010 SeNIoR NoTe 13,027,242
SRI SeveN ReIT 78,056,912 FRogmoRe ReAl eSTATe PARTNeRS I 12,667,659
Ag CoRe PlUS ReAlTy FUND II 73,946,758 RoCKPoINT ReAl eSTATe FUND I 11,676,454
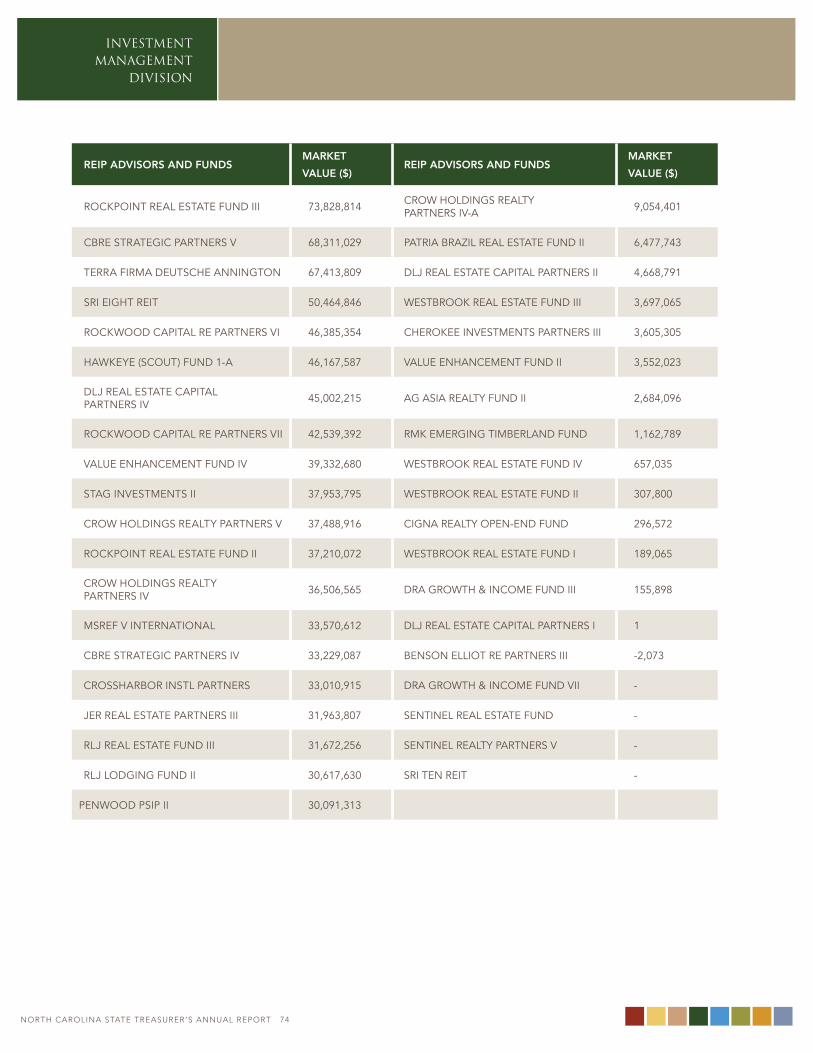
INVESTMENT MANAGEMENT
DIVISION
noRtH CARoLInA StAtE tREASuRER’S AnnuAL REPoRt 74
Reip aDvisoRs anD funDsmaRKet
value ($)Reip aDvisoRs anD funDs
maRKet
value ($)
RoCKPoINT ReAl eSTATe FUND III 73,828,814 CRow holDINgS ReAlTy PARTNeRS Iv-A 9,054,401
CbRe STRATegIC PARTNeRS v 68,311,029 PATRIA bRAzIl ReAl eSTATe FUND II 6,477,743
TeRRA FIRmA DeUTSChe ANNINgToN 67,413,809 DlJ ReAl eSTATe CAPITAl PARTNeRS II 4,668,791
SRI eIghT ReIT 50,464,846 weSTbRooK ReAl eSTATe FUND III 3,697,065
RoCKwooD CAPITAl Re PARTNeRS vI 46,385,354 CheRoKee INveSTmeNTS PARTNeRS III 3,605,305
hAwKeye (SCoUT) FUND 1-A 46,167,587 vAlUe eNhANCemeNT FUND II 3,552,023
DlJ ReAl eSTATe CAPITAl PARTNeRS Iv 45,002,215 Ag ASIA ReAlTy FUND II 2,684,096
RoCKwooD CAPITAl Re PARTNeRS vII 42,539,392 RmK emeRgINg TImbeRlAND FUND 1,162,789
vAlUe eNhANCemeNT FUND Iv 39,332,680 weSTbRooK ReAl eSTATe FUND Iv 657,035
STAg INveSTmeNTS II 37,953,795 weSTbRooK ReAl eSTATe FUND II 307,800
CRow holDINgS ReAlTy PARTNeRS v 37,488,916 CIgNA ReAlTy oPeN-eND FUND 296,572
RoCKPoINT ReAl eSTATe FUND II 37,210,072 weSTbRooK ReAl eSTATe FUND I 189,065
CRow holDINgS ReAlTy PARTNeRS Iv 36,506,565 DRA gRowTh & INCome FUND III 155,898
mSReF v INTeRNATIoNAl 33,570,612 DlJ ReAl eSTATe CAPITAl PARTNeRS I 1
CbRe STRATegIC PARTNeRS Iv 33,229,087 beNSoN ellIoT Re PARTNeRS III -2,073
CRoSShARboR INSTl PARTNeRS 33,010,915 DRA gRowTh & INCome FUND vII -
JeR ReAl eSTATe PARTNeRS III 31,963,807 SeNTINel ReAl eSTATe FUND -
RlJ ReAl eSTATe FUND III 31,672,256 SeNTINel ReAlTy PARTNeRS v -
RlJ loDgINg FUND II 30,617,630 SRI TeN ReIT -
PeNwooD PSIP II 30,091,313
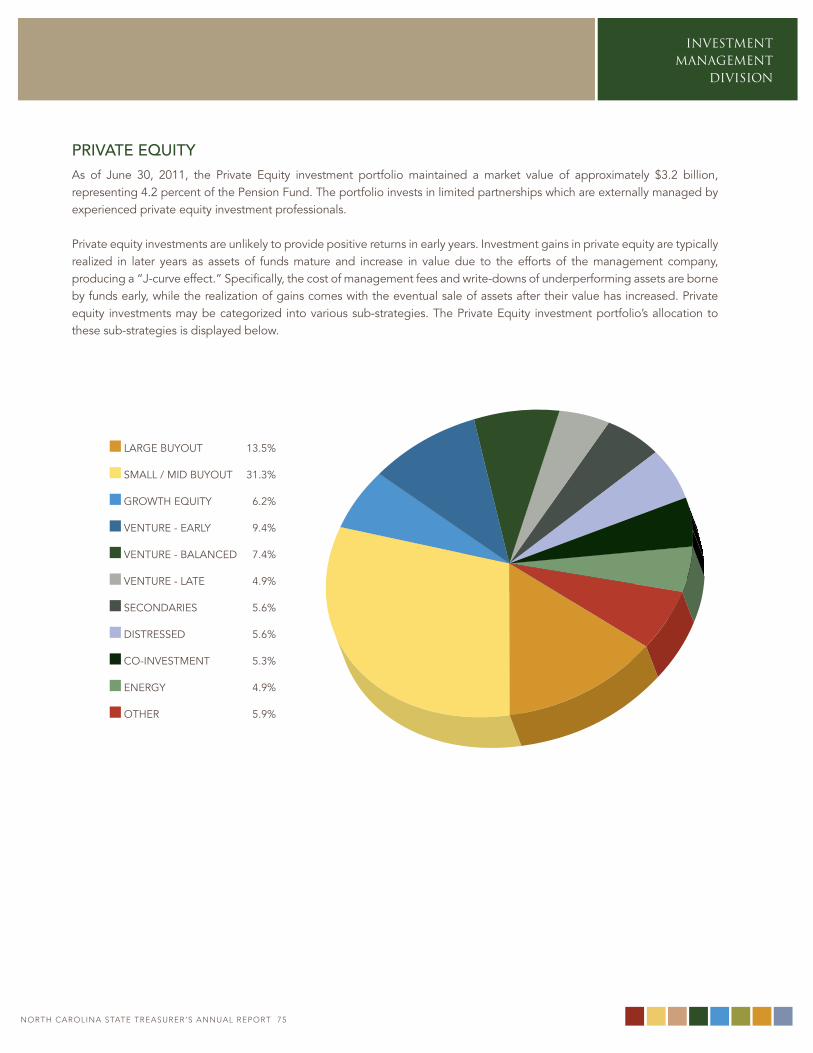
noRtH CARoLInA StAtE tREASuRER’S AnnuAL REPoRt 74
INVESTMENT MANAGEMENT
DIVISION
noRtH CARoLInA StAtE tREASuRER’S AnnuAL REPoRt 75
PRIvATE EqUITYAs of June 30, 2011, the Private equity investment portfolio maintained a market value of approximately $3.2 billion, representing 4.2 percent of the Pension Fund. The portfolio invests in limited partnerships which are externally managed by experienced private equity investment professionals.
Private equity investments are unlikely to provide positive returns in early years. Investment gains in private equity are typically realized in later years as assets of funds mature and increase in value due to the efforts of the management company, producing a “J-curve effect.” Specifically, the cost of management fees and write-downs of underperforming assets are borne by funds early, while the realization of gains comes with the eventual sale of assets after their value has increased. Private equity investments may be categorized into various sub-strategies. The Private equity investment portfolio’s allocation to these sub-strategies is displayed below.
lARge bUyoUT 13.5%
SmAll / mID bUyoUT 31.3%
gRowTh eqUITy 6.2%
veNTURe - eARly 9.4%
veNTURe - bAlANCeD 7.4%
veNTURe - lATe 4.9%
SeCoNDARIeS 5.6%
DISTReSSeD 5.6%
Co-INveSTmeNT 5.3%
eNeRgy 4.9%
oTheR 5.9%
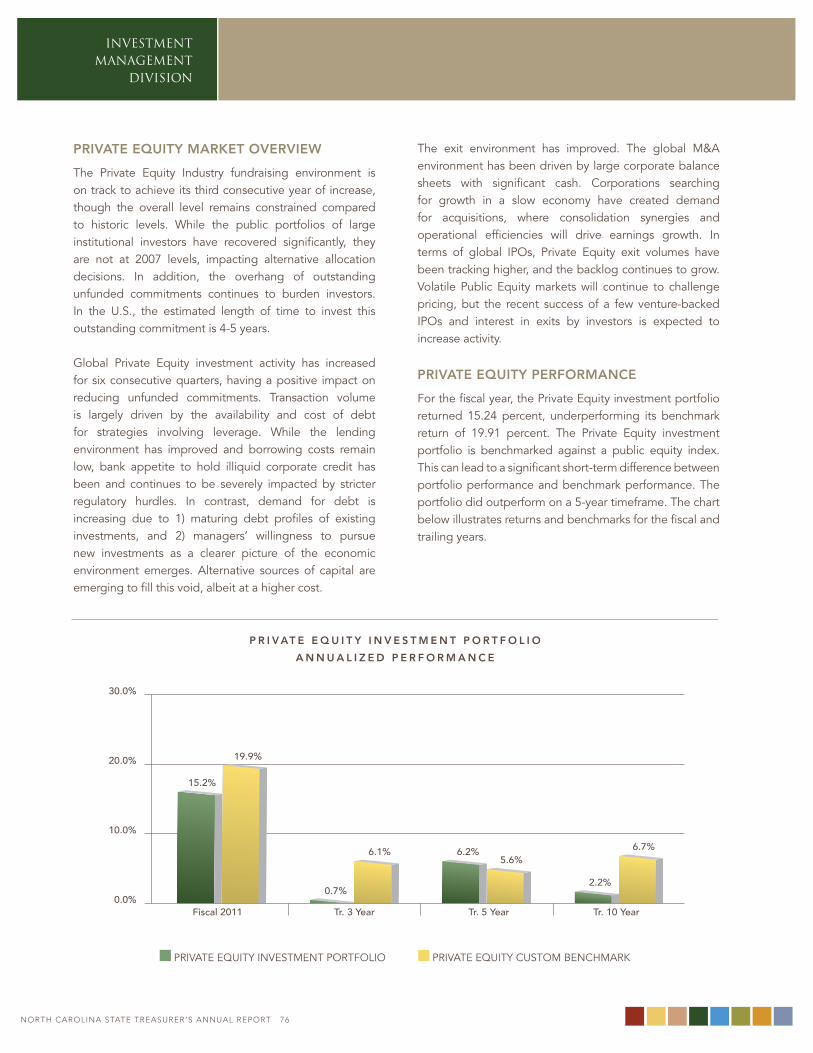
INVESTMENT MANAGEMENT
DIVISION
noRtH CARoLInA StAtE tREASuRER’S AnnuAL REPoRt 76
pRivate equity maRKet oveRview
The Private equity Industry fundraising environment is on track to achieve its third consecutive year of increase, though the overall level remains constrained compared to historic levels. while the public portfolios of large institutional investors have recovered significantly, they are not at 2007 levels, impacting alternative allocation decisions. In addition, the overhang of outstanding unfunded commitments continues to burden investors. In the U.S., the estimated length of time to invest this outstanding commitment is 4-5 years.
global Private equity investment activity has increased for six consecutive quarters, having a positive impact on reducing unfunded commitments. Transaction volume is largely driven by the availability and cost of debt for strategies involving leverage. while the lending environment has improved and borrowing costs remain low, bank appetite to hold illiquid corporate credit has been and continues to be severely impacted by stricter regulatory hurdles. In contrast, demand for debt is increasing due to 1) maturing debt profiles of existing investments, and 2) managers’ willingness to pursue new investments as a clearer picture of the economic environment emerges. Alternative sources of capital are emerging to fill this void, albeit at a higher cost.
The exit environment has improved. The global m&A environment has been driven by large corporate balance sheets with significant cash. Corporations searching for growth in a slow economy have created demand for acquisitions, where consolidation synergies and operational efficiencies will drive earnings growth. In terms of global IPos, Private equity exit volumes have been tracking higher, and the backlog continues to grow. volatile Public equity markets will continue to challenge pricing, but the recent success of a few venture-backed IPos and interest in exits by investors is expected to increase activity.
pRivate equity peRfoRmance
For the fiscal year, the Private equity investment portfolio returned 15.24 percent, underperforming its benchmark return of 19.91 percent. The Private equity investment portfolio is benchmarked against a public equity index. This can lead to a significant short-term difference between portfolio performance and benchmark performance. The portfolio did outperform on a 5-year timeframe. The chart below illustrates returns and benchmarks for the fiscal and trailing years.
p R i vat e e q u i t y i n v e s t m e n t p o R t f o l i o
a n n u a l i z e D p e R f o R m a n c e
30.0%
20.0%
10.0%
0.0%
15.2%
19.9%
0.7%
6.1% 6.2%5.6%
2.2%
6.7%
Fiscal 2011 Tr. 3 Year Tr. 5 Year Tr. 10 Year
PRIvATe eqUITy INveSTmeNT PoRTFolIo PRIvATe eqUITy CUSTom beNChmARK
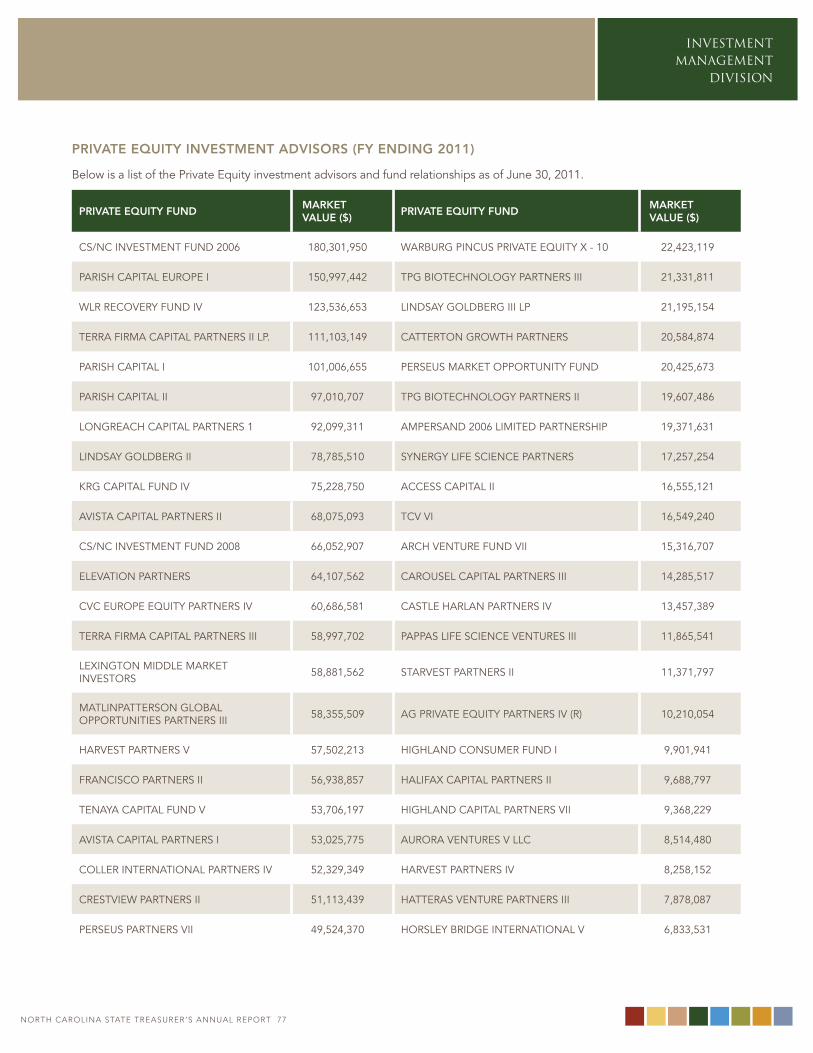
noRtH CARoLInA StAtE tREASuRER’S AnnuAL REPoRt 76
INVESTMENT MANAGEMENT
DIVISION
noRtH CARoLInA StAtE tREASuRER’S AnnuAL REPoRt 77
pRivate equity investment aDvisoRs (fy enDing 2011)
below is a list of the Private equity investment advisors and fund relationships as of June 30, 2011.
pRivate equity funD maRKet value ($)
pRivate equity funD maRKet value ($)
CS/NC INveSTmeNT FUND 2006 180,301,950 wARbURg PINCUS PRIvATe eqUITy x - 10 22,423,119
PARISh CAPITAl eURoPe I 150,997,442 TPg bIoTeChNology PARTNeRS III 21,331,811
wlR ReCoveRy FUND Iv 123,536,653 lINDSAy golDbeRg III lP 21,195,154
TeRRA FIRmA CAPITAl PARTNeRS II lP. 111,103,149 CATTeRToN gRowTh PARTNeRS 20,584,874
PARISh CAPITAl I 101,006,655 PeRSeUS mARKeT oPPoRTUNITy FUND 20,425,673
PARISh CAPITAl II 97,010,707 TPg bIoTeChNology PARTNeRS II 19,607,486
loNgReACh CAPITAl PARTNeRS 1 92,099,311 AmPeRSAND 2006 lImITeD PARTNeRShIP 19,371,631
lINDSAy golDbeRg II 78,785,510 SyNeRgy lIFe SCIeNCe PARTNeRS 17,257,254
KRg CAPITAl FUND Iv 75,228,750 ACCeSS CAPITAl II 16,555,121
AvISTA CAPITAl PARTNeRS II 68,075,093 TCv vI 16,549,240
CS/NC INveSTmeNT FUND 2008 66,052,907 ARCh veNTURe FUND vII 15,316,707
elevATIoN PARTNeRS 64,107,562 CARoUSel CAPITAl PARTNeRS III 14,285,517
CvC eURoPe eqUITy PARTNeRS Iv 60,686,581 CASTle hARlAN PARTNeRS Iv 13,457,389
TeRRA FIRmA CAPITAl PARTNeRS III 58,997,702 PAPPAS lIFe SCIeNCe veNTUReS III 11,865,541
lexINgToN mIDDle mARKeT INveSToRS 58,881,562 STARveST PARTNeRS II 11,371,797
mATlINPATTeRSoN globAl oPPoRTUNITIeS PARTNeRS III 58,355,509 Ag PRIvATe eqUITy PARTNeRS Iv (R) 10,210,054
hARveST PARTNeRS v 57,502,213 hIghlAND CoNSUmeR FUND I 9,901,941
FRANCISCo PARTNeRS II 56,938,857 hAlIFAx CAPITAl PARTNeRS II 9,688,797
TeNAyA CAPITAl FUND v 53,706,197 hIghlAND CAPITAl PARTNeRS vII 9,368,229
AvISTA CAPITAl PARTNeRS I 53,025,775 AURoRA veNTUReS v llC 8,514,480
ColleR INTeRNATIoNAl PARTNeRS Iv 52,329,349 hARveST PARTNeRS Iv 8,258,152
CReSTvIew PARTNeRS II 51,113,439 hATTeRAS veNTURe PARTNeRS III 7,878,087
PeRSeUS PARTNeRS vII 49,524,370 hoRSley bRIDge INTeRNATIoNAl v 6,833,531
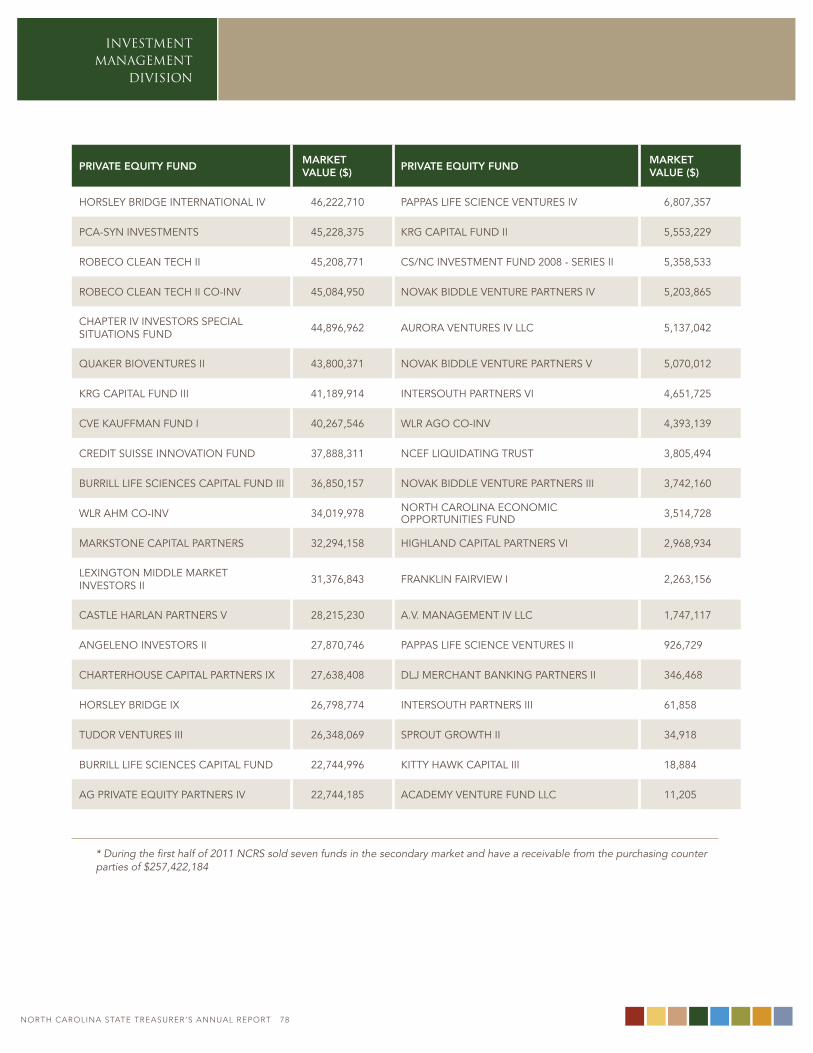
INVESTMENT MANAGEMENT
DIVISION
noRtH CARoLInA StAtE tREASuRER’S AnnuAL REPoRt 78
pRivate equity funD maRKet value ($)
pRivate equity funD maRKet value ($)
hoRSley bRIDge INTeRNATIoNAl Iv 46,222,710 PAPPAS lIFe SCIeNCe veNTUReS Iv 6,807,357
PCA-SyN INveSTmeNTS 45,228,375 KRg CAPITAl FUND II 5,553,229
RobeCo CleAN TeCh II 45,208,771 CS/NC INveSTmeNT FUND 2008 - SeRIeS II 5,358,533
RobeCo CleAN TeCh II Co-INv 45,084,950 NovAK bIDDle veNTURe PARTNeRS Iv 5,203,865
ChAPTeR Iv INveSToRS SPeCIAl SITUATIoNS FUND 44,896,962 AURoRA veNTUReS Iv llC 5,137,042
qUAKeR bIoveNTUReS II 43,800,371 NovAK bIDDle veNTURe PARTNeRS v 5,070,012
KRg CAPITAl FUND III 41,189,914 INTeRSoUTh PARTNeRS vI 4,651,725
Cve KAUFFmAN FUND I 40,267,546 wlR Ago Co-INv 4,393,139
CReDIT SUISSe INNovATIoN FUND 37,888,311 NCeF lIqUIDATINg TRUST 3,805,494
bURRIll lIFe SCIeNCeS CAPITAl FUND III 36,850,157 NovAK bIDDle veNTURe PARTNeRS III 3,742,160
wlR Ahm Co-INv 34,019,978 NoRTh CARolINA eCoNomIC oPPoRTUNITIeS FUND 3,514,728
mARKSToNe CAPITAl PARTNeRS 32,294,158 hIghlAND CAPITAl PARTNeRS vI 2,968,934
lexINgToN mIDDle mARKeT INveSToRS II 31,376,843 FRANKlIN FAIRvIew I 2,263,156
CASTle hARlAN PARTNeRS v 28,215,230 A.v. mANAgemeNT Iv llC 1,747,117
ANgeleNo INveSToRS II 27,870,746 PAPPAS lIFe SCIeNCe veNTUReS II 926,729
ChARTeRhoUSe CAPITAl PARTNeRS Ix 27,638,408 DlJ meRChANT bANKINg PARTNeRS II 346,468
hoRSley bRIDge Ix 26,798,774 INTeRSoUTh PARTNeRS III 61,858
TUDoR veNTUReS III 26,348,069 SPRoUT gRowTh II 34,918
bURRIll lIFe SCIeNCeS CAPITAl FUND 22,744,996 KITTy hAwK CAPITAl III 18,884
Ag PRIvATe eqUITy PARTNeRS Iv 22,744,185 ACADemy veNTURe FUND llC 11,205
* During the first half of 2011 NCRS sold seven funds in the secondary market and have a receivable from the purchasing counter parties of $257,422,184
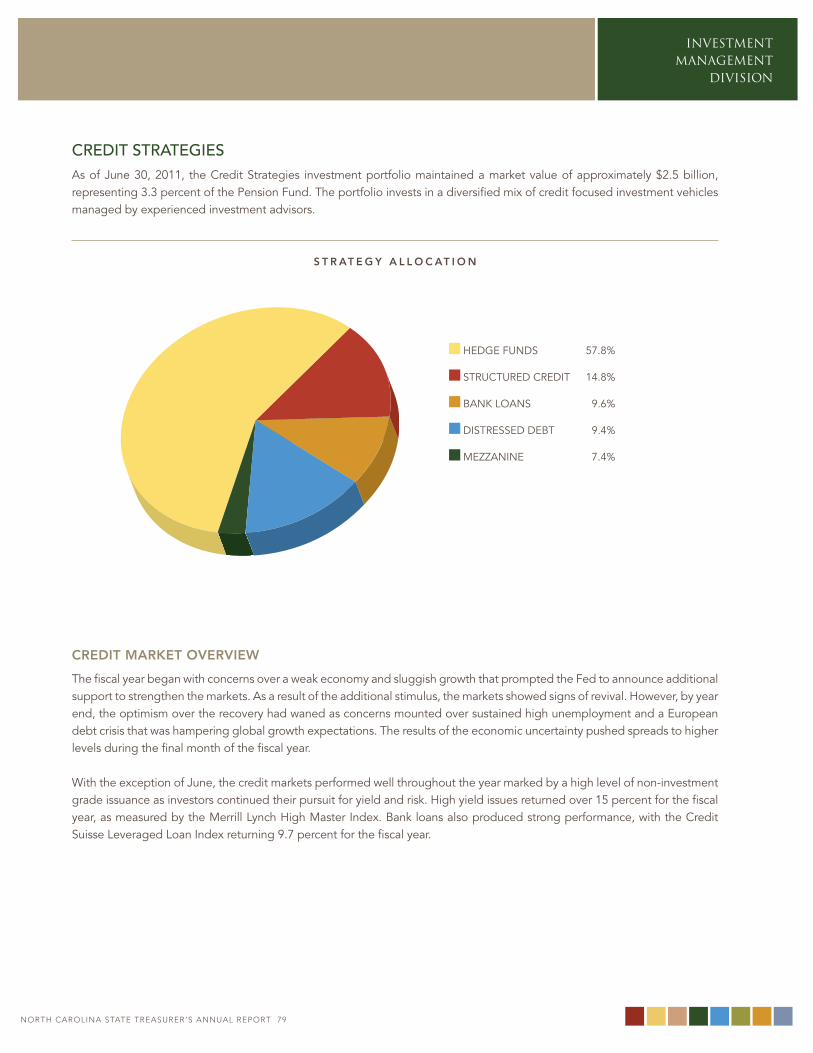
noRtH CARoLInA StAtE tREASuRER’S AnnuAL REPoRt 78
INVESTMENT MANAGEMENT
DIVISION
noRtH CARoLInA StAtE tREASuRER’S AnnuAL REPoRt 79
CREdIT STRATEGIESAs of June 30, 2011, the Credit Strategies investment portfolio maintained a market value of approximately $2.5 billion, representing 3.3 percent of the Pension Fund. The portfolio invests in a diversified mix of credit focused investment vehicles managed by experienced investment advisors.
s t R at e g y a l l o c at i o n
heDge FUNDS 57.8%
STRUCTUReD CReDIT 14.8%
bANK loANS 9.6%
DISTReSSeD DebT 9.4%
mezzANINe 7.4%
cReDit maRKet oveRview
The fiscal year began with concerns over a weak economy and sluggish growth that prompted the Fed to announce additional support to strengthen the markets. As a result of the additional stimulus, the markets showed signs of revival. however, by year end, the optimism over the recovery had waned as concerns mounted over sustained high unemployment and a european debt crisis that was hampering global growth expectations. The results of the economic uncertainty pushed spreads to higher levels during the final month of the fiscal year.
with the exception of June, the credit markets performed well throughout the year marked by a high level of non-investment grade issuance as investors continued their pursuit for yield and risk. high yield issues returned over 15 percent for the fiscal year, as measured by the merrill lynch high master Index. bank loans also produced strong performance, with the Credit Suisse leveraged loan Index returning 9.7 percent for the fiscal year.
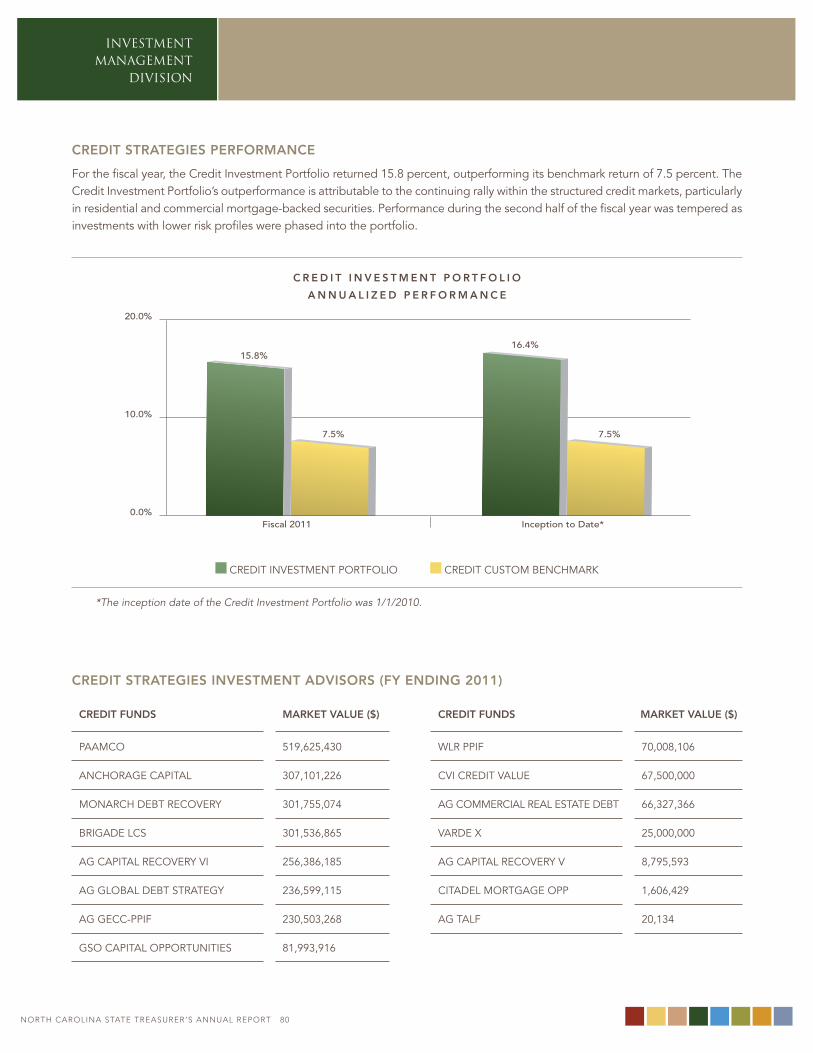
INVESTMENT MANAGEMENT
DIVISION
noRtH CARoLInA StAtE tREASuRER’S AnnuAL REPoRt 80
cReDit stRategies peRfoRmance
For the fiscal year, the Credit Investment Portfolio returned 15.8 percent, outperforming its benchmark return of 7.5 percent. The Credit Investment Portfolio’s outperformance is attributable to the continuing rally within the structured credit markets, particularly in residential and commercial mortgage-backed securities. Performance during the second half of the fiscal year was tempered as investments with lower risk profiles were phased into the portfolio.
c R e D i t i n v e s t m e n t p o R t f o l i o
a n n u a l i z e D p e R f o R m a n c e
20.0%
10.0%
0.0%
15.8%16.4%
7.5% 7.5%
Fiscal 2011 Inception to Date*
CReDIT INveSTmeNT PoRTFolIo CReDIT CUSTom beNChmARK
*The inception date of the Credit Investment Portfolio was 1/1/2010.
cReDit stRategies investment aDvisoRs (fy enDing 2011)
cReDit funDs maRKet value ($) cReDit funDs maRKet value ($)
PAAmCo 519,625,430 wlR PPIF 70,008,106
ANChoRAge CAPITAl 307,101,226 CvI CReDIT vAlUe 67,500,000
moNARCh DebT ReCoveRy 301,755,074 Ag CommeRCIAl ReAl eSTATe DebT 66,327,366
bRIgADe lCS 301,536,865 vARDe x 25,000,000
Ag CAPITAl ReCoveRy vI 256,386,185 Ag CAPITAl ReCoveRy v 8,795,593
Ag globAl DebT STRATegy 236,599,115 CITADel moRTgAge oPP 1,606,429
Ag geCC-PPIF 230,503,268 Ag TAlF 20,134
gSo CAPITAl oPPoRTUNITIeS 81,993,916
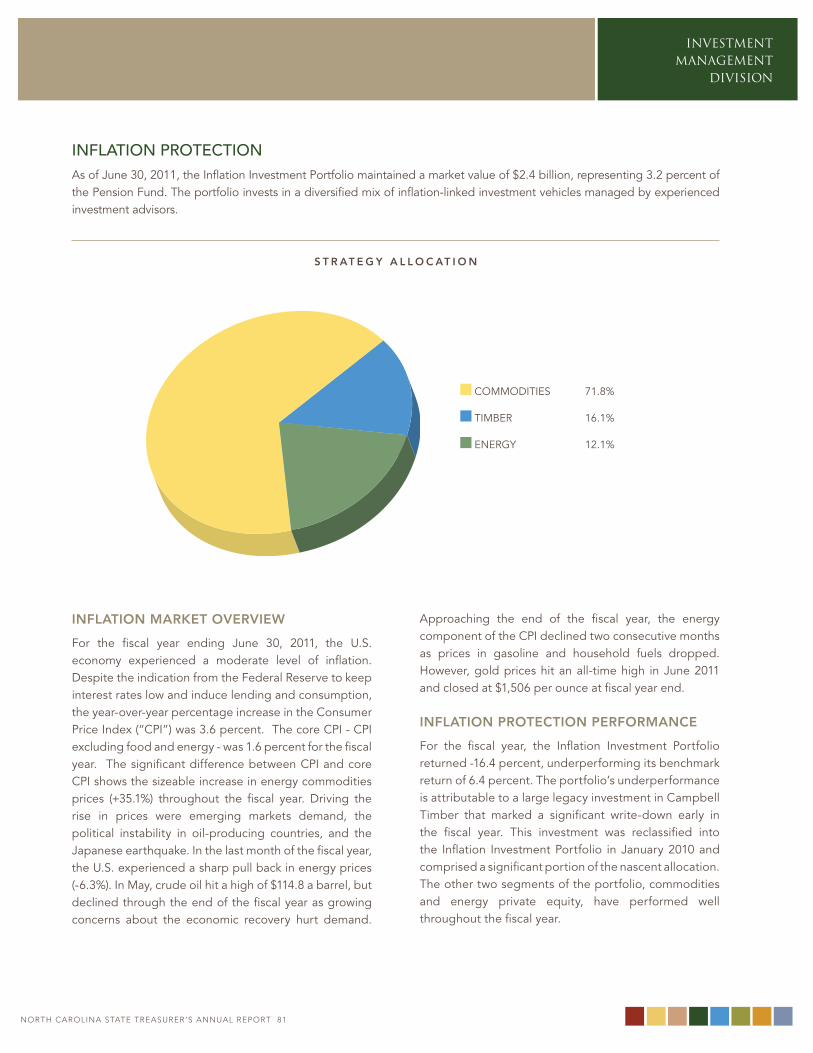
noRtH CARoLInA StAtE tREASuRER’S AnnuAL REPoRt 80
INVESTMENT MANAGEMENT
DIVISION
noRtH CARoLInA StAtE tREASuRER’S AnnuAL REPoRt 81
INfLATION PROTECTIONAs of June 30, 2011, the Inflation Investment Portfolio maintained a market value of $2.4 billion, representing 3.2 percent of the Pension Fund. The portfolio invests in a diversified mix of inflation-linked investment vehicles managed by experienced investment advisors.
s t R at e g y a l l o c at i o n
CommoDITIeS 71.8%
TImbeR 16.1%
eNeRgy 12.1%
inflation maRKet oveRview
For the fiscal year ending June 30, 2011, the U.S. economy experienced a moderate level of inflation. Despite the indication from the Federal Reserve to keep interest rates low and induce lending and consumption, the year-over-year percentage increase in the Consumer Price Index (“CPI”) was 3.6 percent. The core CPI - CPI excluding food and energy - was 1.6 percent for the fiscal year. The significant difference between CPI and core CPI shows the sizeable increase in energy commodities prices (+35.1%) throughout the fiscal year. Driving the rise in prices were emerging markets demand, the political instability in oil-producing countries, and the Japanese earthquake. In the last month of the fiscal year, the U.S. experienced a sharp pull back in energy prices (-6.3%). In may, crude oil hit a high of $114.8 a barrel, but declined through the end of the fiscal year as growing concerns about the economic recovery hurt demand.
Approaching the end of the fiscal year, the energy component of the CPI declined two consecutive months as prices in gasoline and household fuels dropped. however, gold prices hit an all-time high in June 2011 and closed at $1,506 per ounce at fiscal year end.
inflation pRotection peRfoRmance
For the fiscal year, the Inflation Investment Portfolio returned -16.4 percent, underperforming its benchmark return of 6.4 percent. The portfolio’s underperformance is attributable to a large legacy investment in Campbell Timber that marked a significant write-down early in the fiscal year. This investment was reclassified into the Inflation Investment Portfolio in January 2010 and comprised a significant portion of the nascent allocation. The other two segments of the portfolio, commodities and energy private equity, have performed well throughout the fiscal year.
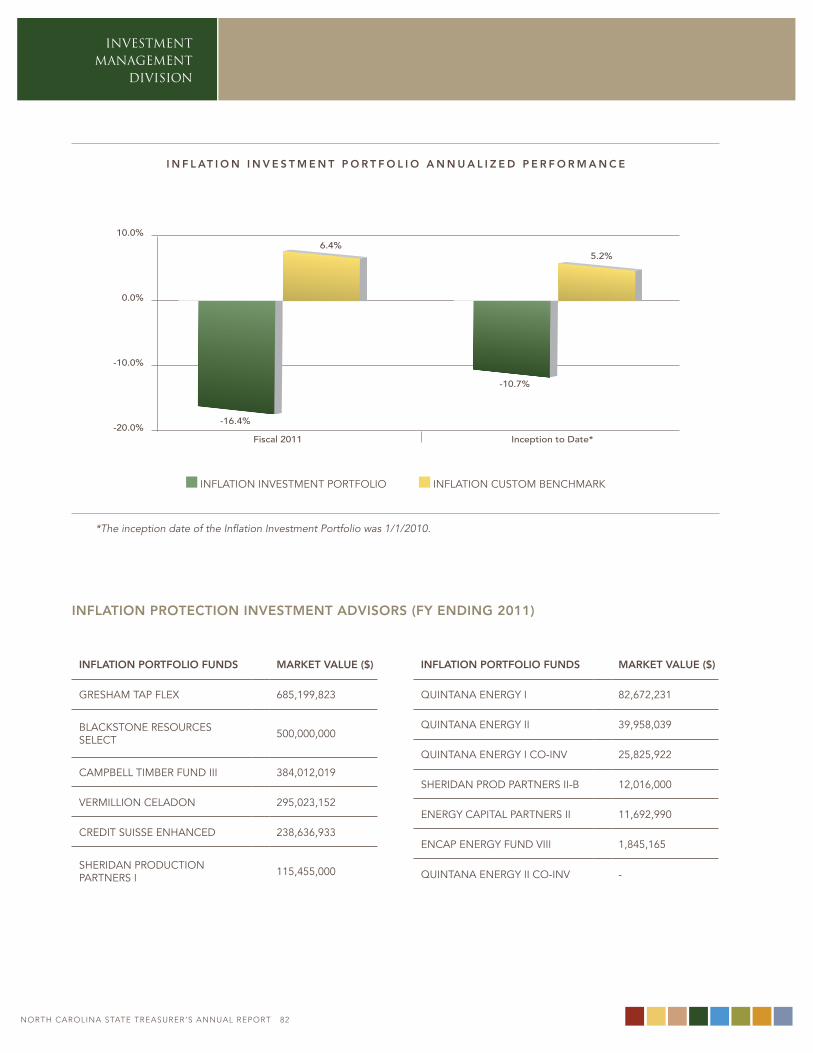
INVESTMENT MANAGEMENT
DIVISION
noRtH CARoLInA StAtE tREASuRER’S AnnuAL REPoRt 82
i n f l at i o n i n v e s t m e n t p o R t f o l i o a n n u a l i z e D p e R f o R m a n c e
10.0%
0.0%
-10.0%
-20.0%-16.4%
-10.7%
6.4%5.2%
Fiscal 2011 Inception to Date*
INFlATIoN INveSTmeNT PoRTFolIo INFlATIoN CUSTom beNChmARK
*The inception date of the Inflation Investment Portfolio was 1/1/2010.
inflation pRotection investment aDvisoRs (fy enDing 2011)
inflation poRtfolio funDs maRKet value ($)
gReShAm TAP Flex 685,199,823
blACKSToNe ReSoURCeS SeleCT 500,000,000
CAmPbell TImbeR FUND III 384,012,019
veRmIllIoN CelADoN 295,023,152
CReDIT SUISSe eNhANCeD 238,636,933
SheRIDAN PRoDUCTIoN PARTNeRS I 115,455,000
inflation poRtfolio funDs maRKet value ($)
qUINTANA eNeRgy I 82,672,231
qUINTANA eNeRgy II 39,958,039
qUINTANA eNeRgy I Co-INv 25,825,922
SheRIDAN PRoD PARTNeRS II-b 12,016,000
eNeRgy CAPITAl PARTNeRS II 11,692,990
eNCAP eNeRgy FUND vIII 1,845,165
qUINTANA eNeRgy II Co-INv -
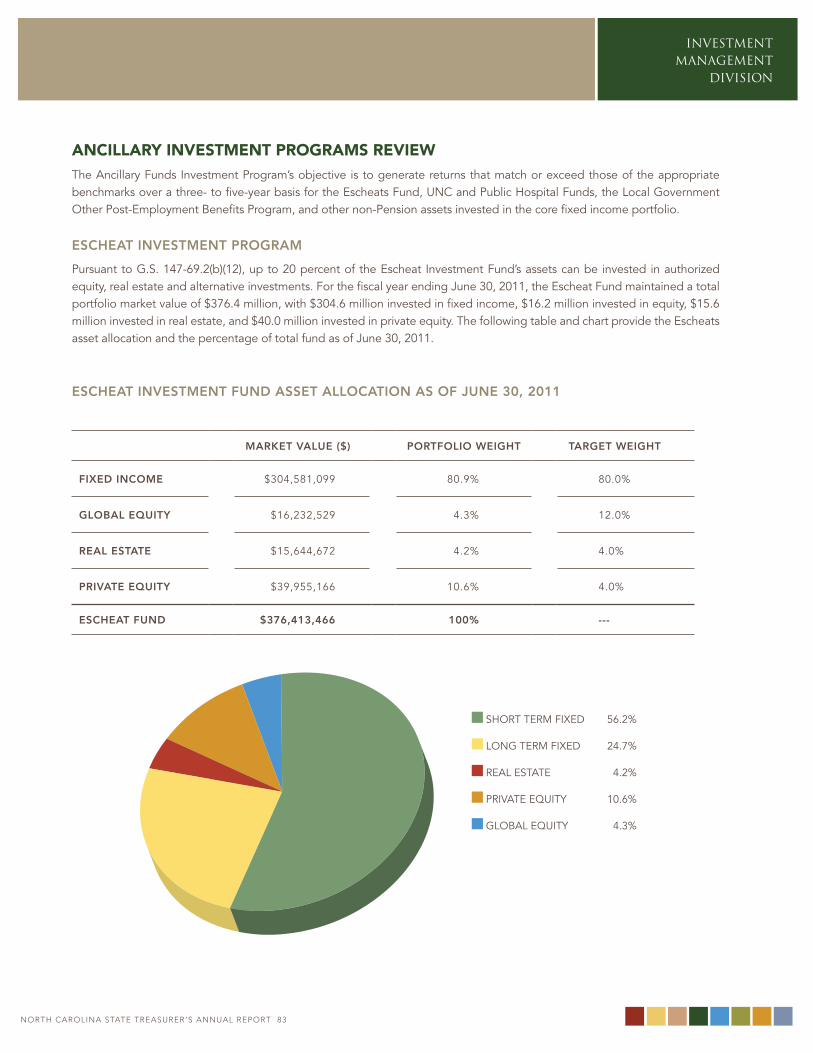
noRtH CARoLInA StAtE tREASuRER’S AnnuAL REPoRt 82
INVESTMENT MANAGEMENT
DIVISION
noRtH CARoLInA StAtE tREASuRER’S AnnuAL REPoRt 83
ANCILLARY INVESTMENT PROGRAMS REVIEWThe Ancillary Funds Investment Program’s objective is to generate returns that match or exceed those of the appropriate benchmarks over a three- to five-year basis for the escheats Fund, UNC and Public hospital Funds, the local government other Post-employment benefits Program, and other non-Pension assets invested in the core fixed income portfolio.
escheat investment pRogRam
Pursuant to g.S. 147-69.2(b)(12), up to 20 percent of the escheat Investment Fund’s assets can be invested in authorized equity, real estate and alternative investments. For the fiscal year ending June 30, 2011, the escheat Fund maintained a total portfolio market value of $376.4 million, with $304.6 million invested in fixed income, $16.2 million invested in equity, $15.6 million invested in real estate, and $40.0 million invested in private equity. The following table and chart provide the escheats asset allocation and the percentage of total fund as of June 30, 2011.
escheat investment funD asset allocation as of June 30, 2011
maRKet value ($) poRtfolio weight taRget weight
fixeD income $304,581,099 80.9% 80.0%
global equity $16,232,529 4.3% 12.0%
Real estate $15,644,672 4.2% 4.0%
pRivate equity $39,955,166 10.6% 4.0%
escheat funD $376,413,466 100% ---
ShoRT TeRm FIxeD 56.2%
loNg TeRm FIxeD 24.7%
ReAl eSTATe 4.2%
PRIvATe eqUITy 10.6%
globAl eqUITy 4.3%
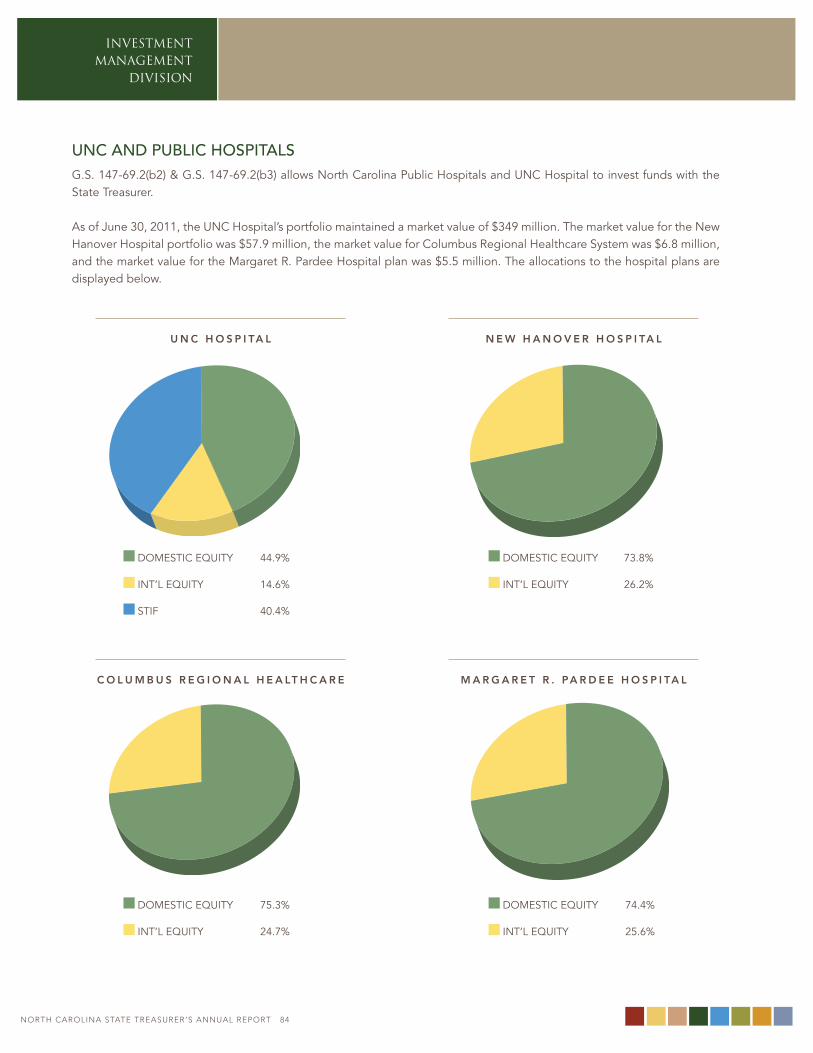
INVESTMENT MANAGEMENT
DIVISION
noRtH CARoLInA StAtE tREASuRER’S AnnuAL REPoRt 84
UNC ANd PUBLIC HOSPITALSg.S. 147-69.2(b2) & g.S. 147-69.2(b3) allows North Carolina Public hospitals and UNC hospital to invest funds with the State Treasurer.
As of June 30, 2011, the UNC hospital’s portfolio maintained a market value of $349 million. The market value for the New hanover hospital portfolio was $57.9 million, the market value for Columbus Regional healthcare System was $6.8 million, and the market value for the margaret R. Pardee hospital plan was $5.5 million. The allocations to the hospital plans are displayed below.
DomeSTIC eqUITy 44.9%
INT’l eqUITy 14.6%
STIF 40.4%
DomeSTIC eqUITy 73.8%
INT’l eqUITy 26.2%
DomeSTIC eqUITy 75.3%
INT’l eqUITy 24.7%
DomeSTIC eqUITy 74.4%
INT’l eqUITy 25.6%
u n c h o s p i ta l
c o l u m b u s R e g i o n a l h e a lt h c a R e
n e w h a n o v e R h o s p i ta l
m a R g a R e t R . pa R D e e h o s p i ta l
noRtH CARoLInA StAtE tREASuRER’S AnnuAL REPoRt 84
INVESTMENT MANAGEMENT
DIVISION
noRtH CARoLInA StAtE tREASuRER’S AnnuAL REPoRt 85
otheR post-employment benefits funD
Pursuant to g.S. 159-30.1, deposits are held for the local government other Post-employment benefits Fund, all subject to compliance with g.S. 147-69.2. The assets are allocated as follows: STIF, lTIF, and authorized equity funds. As of June 30, 2011, there were a total of 13 participants with assets totaling $59.3 million.
otheR non-pension long-teRm investment poRtfolio paRticipants
As of June 30, 2011, the aggregate market value of other non-pension participants invested in the long-Term Investment Portfolio was $1.1 billion.

Appalachian Mountains, Blue Ridge Parkway, North Carolina
State and LocalGovernment
Finance Division
N O R T H C A R O L I N A S TAT E T R E A S U R E R ’ S
A N N U A L R E P O R T
State and LocalGovernment
Finance Division
noRtH CARoLInA StAtE tREASuRER’S AnnuAL REPoRt 87
s tat e a n D l o c a l g o v e R n m e n t f i n a n c e D i v i s i o n s tat i s t i c s
yeS
510
$6.5 bIllIoN
$2.5 bIllIoN
$1.7 bIllIoN
2009-2010
yeS
475
$4.9 bIllIoN
$2.6 bIllIoN
$600 mIllIoN
2008-2009
yeS
439
$3.3 bIllIoN
$1.6 bIllIoN
$1.5 bIllIoN
2010-2011
mAINTAINeD The AAA boND RATINg
NUmbeR oF loCAl goveRNmeNT UNITS CoNTACTeD
RegARDINg TheIR FISCAl heAlTh oR ComPlIANCe
wITh geNeRAl STATUTeS
ToTAl DebT ISSUeD by loCAl goveRNmeNTS
DebT ISSUeD FoR SPeCIAl STATe AND loCAl
AUThoRITIeS AND AgeNCIeS
ToTAl STATe DebT ISSUeD
State and LocalGovernmentFinance Division
noRtH CARoLInA StAtE tREASuRER’S AnnuAL REPoRt 88
HISTORYIn 1931, the North Carolina general Assembly established the local government Commission (“lgC”), staffed by this Division, to help address the problems in local government finance caused by the Depression. In 1933, 62 North Carolina counties, 152 cities and towns, and some 200 special districts were in default on the principal or the interest or both of outstanding obligations. Currently, the State of North Carolina has a larger number of AAA-rated units than any other state, and the debt of its local governments in general finds a significantly better reception on the national bond markets than the national average. many attribute this favored credit status, in part, to the work of the local government Commission. This Commission is unique nationally and is often referred to as a model for local government financial oversight.
THE LOCAL GOvERNMENT COMMISSIONThe lgC, established by g.S. 159-3, provides assistance to local governments and public authorities in North Carolina. It is staffed by the Department of State Treasurer and approves the issuance of debt for all units of local government and assists these units with fiscal management. The Commission is composed of nine members: the State Treasurer, the Secretary of State, the State Auditor, the Secretary of Revenue, and five others by appointment (three by the governor, one by the general Assembly upon the recommendation of the President Pro Tempore, and one by the general Assembly upon the recommendation of the Speaker of the house). The State Treasurer serves as Chairman and selects the Secretary of the Commission, who heads the administrative staff serving the Commission. The general Statutes require the Commission to meet quarterly. As a matter of practice, the Commission’s executive committee meets in the intervening months.
the State and Local Government Finance Division handles the sale and delivery of all State and local debt and monitors the repayment of State and local government debt. Staff counsel assists local governments in determining the feasibility of projects, the size of the financing, and the most expedient form of financing. Additionally, this Division monitors and analyzes the fiscal and accounting practices of all local governments.
The Division comprises the Debt management section, which issues and monitors all State debt, and the Fiscal management section, which monitors fiscal and accounting standards for local governments. The Division also provides the State Treasurer, the local government Commission, the North Carolina Capital Facilities Finance Agency, and the North Carolina Infrastructure Finance Corporation with staff assistance in fulfilling their respective statutory functions.
ToTAl STATe
ToTAl loCAl goveRNmeNTS
total
$ 1.51 bIllIoN
$ 3.30 bIllIoN
$ 4.81 billion
2010-11 fISCAL YEAR SUMMARY Of dEBT ISSUEd
noRtH CARoLInA StAtE tREASuRER’S AnnuAL REPoRt 88
State and LocalGovernment
Finance Division
noRtH CARoLInA StAtE tREASuRER’S AnnuAL REPoRt 89
THE NORTH CAROLINA CAPITAL fACILITIES fINANCE AGENCYPrivate colleges, universities, nonprofit, and for-profit corporations providing certain services may receive financing assistance through bonds issued by the North Carolina Capital Facilities Finance Agency (“Agency”). The Agency board of Directors is composed of seven members: the State Treasurer, the State Auditor, and five others by appointment (three by the governor, one by the President Pro Tempore of the Senate, and one by the Speaker of the house of Representatives). The administrative staff for the Agency is provided by the Department of State Treasurer. The Agency meets monthly.
Following initial contact from an applicant, the staff generally begins the process of determining project feasibility and desirability with a preliminary conference. Upon receipt of an application, financial capability and responsibility are reviewed through ratio and trend analysis. The staff presents the project and its recommendations to the Agency and subsequently to the local government Commission for approval. Since its creation, the Agency has provided over $4.9 billion in tax-exempt capital financing. There have been no defaults in bonds issued by the Agency. At June 30, 2011, there was $2.8 billion in outstanding obligations. each issue is payable solely from revenues derived from each entity financed, is separately secured, and is separate and independent from all other series of bonds as to source of payment and security. During the fiscal year ended June 30, 2011, the Agency issued $184.3 million in bonds for seven institutions. The Agency’s annual report is available from the Department of the State Treasurer.
THE NORTH CAROLINA INfRASTRUCTURE fINANCE CORPORATIONThe North Carolina Infrastructure Finance Corporation (“Corporation”) was created by the general Assembly and organized as a separate not-for-profit corporation. It is managed by a three-member board appointed by the State Treasurer. The Corporation is authorized to issue tax-exempt debt to finance the acquisition, construction, repair, and renovation of State facilities and related infrastructure. The debt obligations are secured by lease or payment agreements with the State financially responsible for the debt payments. The administrative staff for the Corporation
is also provided by the Department of State Treasurer. The Corporation, used in past years to finance State construction, repair and renovation, was inactive during this fiscal year because it is no longer being used as the preferred method for issuing this type of State debt.
dEBT MANAGEMENTThe Division issues and monitors all State debt, including debt secured by a pledge of the taxing power of the State and debt for which repayment is subject to appropriation. with the assistance of other State agencies, the Division determines the cash needs, plans for the repayment of debt (maturity schedules), and schedules the sale at the most appropriate time. An official statement describing the issue and other required disclosures about the State is prepared with the advice and cooperation of bond counsel. Finally, the Division handles the actual sale and delivery of the debt, maintains the State bond records and register of bonds, and monitors the debt service payments. At June 30, 2011, the State had general obligation bonds outstanding of $4.8 billion and Certificates of Participation, limited obligation bonds, and lease-Purchase bonds outstanding of $2.1 billion. (See Tables 7 and 8.)
The Division also is responsible for the authorization and sale of revenue bonds for the North Carolina medical Care Commission, the municipal Power Agencies, the North Carolina Capital Facilities Finance Agency, and the North Carolina housing Finance Agency. only the specific revenues pledged for payment secure these bonds. The staff works with the personnel of these agencies in determining the feasibility and scheduling of the bond offerings, in structuring the issues and the underlying security documents, and in preparing the data that must be presented to the local government Commission for its approval.
The Division assists the State Treasurer in representing the State in all presentations to moody’s Investors Service, Inc., Standard and Poor’s Corporation, and Fitch Ratings, Inc., the three national bond rating agencies used by the State and local governmental units in North Carolina. At June 30, 2011, the State had a “Triple-A” rating, the highest rating attainable, from all three national rating agencies. only six other states enjoyed this distinction. These ratings have enabled the State to sell its bonds at interest rates considerably below the bond buyer’s Index, thereby providing tremendous savings to North Carolina’s taxpayers.
State and LocalGovernmentFinance Division
noRtH CARoLInA StAtE tREASuRER’S AnnuAL REPoRt 90
In addition, the Division staffs the State’s Debt Affordability Committee and drafts an annual Debt Affordability Study, which provides the general Assembly with an overview of the State’s debt load and borrowing capacity. For 2010-11, due primarily to the reduced revenue assumptions for the State, the Study determined that the State’s general Fund debt capacity has been exhausted until fiscal year 2013. The Study also provided an estimate of the annual debt capacity for the Transportation Funds (the State highway Fund and highway Trust Fund) and projected that there is currently no new Transportation debt capacity until fiscal year 2014.
The other primary function of the Division is the approval, sale and delivery of all North Carolina local government bonds and notes. This includes the sale of revenue bonds, which are secured only by specific revenue pledged in payment of the bonds. The Division staff counsels and assists local governmental units in determining the necessity of a project, the size of the issue, and the most expedient form of financing. A review is made of the debt management policies of the unit, the effect of the financing on the unit’s tax rate and the unit’s compliance with The local government budget and Fiscal Control Act. Sale dates are scheduled depending on the need for the money, the anticipated interest rates and the most favorable times bonds can be sold with a minimum of competition. The staff strives to resolve all problems and to determine that all statutory requirements are met before applications are presented to the local government Commission for approval.
Debt records are maintained for all units on principal and interest payments coming due in the current and future years. All debt service payments are monitored through a system of monthly reports. At June 30, 2011, authorized and unissued general obligation bonds for local governments and authorities amounted to $3.9 billion and general obligation debt outstanding amounted to $10.3 billion. (See Table 7.)
Another responsibility of the Division’s staff is assisting units that desire to enter into agreements to finance the lease or installment purchase of capital assets. before approving such agreements, the local government Commission must find that the proposed project is necessary and expedient, the proposed undertaking cannot be economically financed by a bond issue, and that the contract will not require an excessive increase in taxes. During the fiscal year ended
June 30, 2011, the local government Commission approved contracts or other agreements (including refundings) totaling $1.1 billion. (See Tables 5 and 6.)
In order to preserve the tax-exempt status of debt issues of the State that are currently outstanding, the staff continues to perform several tasks to ensure compliance with arbitrage regulations of the Internal Revenue Service. The projects involve monitoring investment yields, monitoring penalties in lieu of rebate requirements, preparing monthly status reports on each debt issue, and preparing information for use by bond counsel and other outside finance and legal professionals.
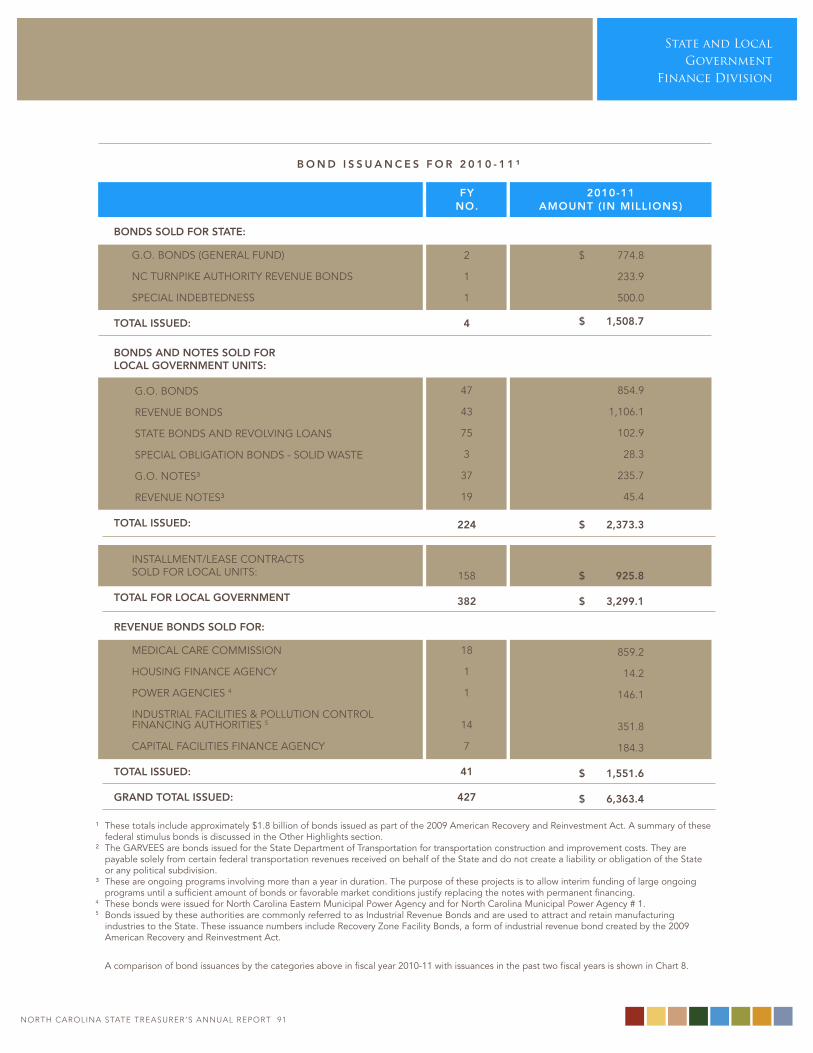
noRtH CARoLInA StAtE tREASuRER’S AnnuAL REPoRt 90
State and LocalGovernment
Finance Division
noRtH CARoLInA StAtE tREASuRER’S AnnuAL REPoRt 91
fy no.
2010-11amount (in millions)
b o n D i s s u a n c e s f o R 2 0 1 0 - 1 1 ¹
¹ These totals include approximately $1.8 billion of bonds issued as part of the 2009 American Recovery and Reinvestment Act. A summary of these federal stimulus bonds is discussed in the other highlights section.
² The gARveeS are bonds issued for the State Department of Transportation for transportation construction and improvement costs. They are payable solely from certain federal transportation revenues received on behalf of the State and do not create a liability or obligation of the State or any political subdivision.
³ These are ongoing programs involving more than a year in duration. The purpose of these projects is to allow interim funding of large ongoing programs until a sufficient amount of bonds or favorable market conditions justify replacing the notes with permanent financing.
4 These bonds were issued for North Carolina eastern municipal Power Agency and for North Carolina municipal Power Agency # 1. 5 bonds issued by these authorities are commonly referred to as Industrial Revenue bonds and are used to attract and retain manufacturing
industries to the State. These issuance numbers include Recovery zone Facility bonds, a form of industrial revenue bond created by the 2009 American Recovery and Reinvestment Act.
A comparison of bond issuances by the categories above in fiscal year 2010-11 with issuances in the past two fiscal years is shown in Chart 8.
2
1 1
4
47 43 75
3 37 19
224
158
382
18 1
1
14 7
41
427
$ 774.8
233.9
500.0
$ 1,508.7
854.9
1,106.1
102.9
28.3
235.7
45.4
$ 2,373.3
$ 925.8
$ 3,299.1
859.2
14.2
146.1
351.8
184.3
$ 1,551.6
$ 6,363.4
bonDs solD foR state:
g.o. boNDS (geNeRAl FUND)
NC TURNPIKe AUThoRITy ReveNUe boNDS
SPeCIAl INDebTeDNeSS
total issueD:
bonDs anD notes solD foR local goveRnment units:
g.o. boNDS
ReveNUe boNDS
STATe boNDS AND RevolvINg loANS
SPeCIAl oblIgATIoN boNDS - SolID wASTe
g.o. NoTeS³
ReveNUe NoTeS³
total issueD:
INSTAllmeNT/leASe CoNTRACTS SolD FoR loCAl UNITS:
total foR local goveRnment
Revenue bonDs solD foR:
meDICAl CARe CommISSIoN
hoUSINg FINANCe AgeNCy
PoweR AgeNCIeS 4
INDUSTRIAl FACIlITIeS & PollUTIoN CoNTRol FINANCINg AUThoRITIeS 5
CAPITAl FACIlITIeS FINANCe AgeNCy total issueD:
gRanD total issueD:
State and LocalGovernmentFinance Division
noRtH CARoLInA StAtE tREASuRER’S AnnuAL REPoRt 92
fISCAL MANAGEMENTAnother function of the Division involves monitoring certain fiscal and accounting standards prescribed for local governmental units by the local government budget and Fiscal Control Act. The Act requires each unit of local government to have its accounts audited annually by a Certified Public Accountant or by an accountant certified by the Commission as qualified to audit local government accounts. As a part of its role in assisting local units and monitoring their fiscal programs, the Division provides guidance in following generally accepted accounting principles. each local government is required to file a copy of its annual audit report with the Division and submit all audit invoices to the Division for approval. The staff of the Fiscal management Section annually reviews the audited financial statements of approximately 1,321 local governments and public authorities. The staff determines that all reports are prepared in accordance with generally accepted accounting principles and that applicable auditing standards have been followed. The staff also reviews the audit report to evaluate the financial condition of the unit, to determine if the unit complied with the local government budget and Fiscal Control Act and other State laws, and to determine if the unit has an adequate system of internal controls in place. As a part of the audit review process, staff reviewed approximately 549 single audits and approximately 264 “yellow book” audits to ensure that audits performed under government Auditing Standards (the “yellow book”) and the federal and State single audit acts meet all the federal and State requirements.
when Division staff notes problems, local governments and public authorities, as well as their independent auditors, receive written communication expressing the staff’s concerns, suggestions for improvements and an offer of assistance. on behalf of the local government Commission, staff requests a response detailing the unit’s plans to take corrective action. In fiscal year 2010-11, staff sent approximately 439 audit letters to units of local government. In providing assistance to local governments, units are counseled in accounting systems and internal controls, cash and investment management, budget preparation, risk management, capital planning, and changes in laws and
regulations. educational programs in the form of seminars and classes also are provided in order to accomplish these tasks. Staff members make presentations throughout the year at various workshops sponsored by: • UNC School of government • North Carolina Association of School
business officials • North Carolina government Finance
officers Association • North Carolina Association of County
Finance officers • North Carolina local government
Investment Association • North Carolina Rural economic
Development Center, Inc. • North Carolina Finance and
Reimbursement officers • government Finance officers Association
of the United States and Canada • North Carolina league of municipalities • North Carolina Department of environment
and Natural Resources • North Carolina State University mPA Program • United States Department of Agriculture (“USDA”)
OUTREACH ANd COMMUNICATIONIn fiscal year 2010-11, staff issued 23 public memoranda directed to local governments, auditors and the state’s public finance community. Topics included the continued implementation of gASb Statement No. 54 on Reporting Fund balance, as well as the Statement on Auditing Standards (“SAS”) 115 and 117, continuing disclosure requirements, the revised fee schedule, a potential federal government shutdown, and changes to the oPeb trust fund held by the State Treasurer. For a complete index of Division memos, visit www.nctreasurer.com/DSThome/StateAndlocalgov/AuditingAndReporting/memos.htm. In addition, interested parties may subscribe to the lgC News listerv, launched in the spring of 2010. Staff provides updates of public memoranda, as well as other pertinent information about public finance issues. The listserv currently has over 857 subscribers.
• Staff members worked with the School of government to present the 10th annual State Treasurer’s Conference on local government Accounting, Auditing and Financial management, held in April 2011. The
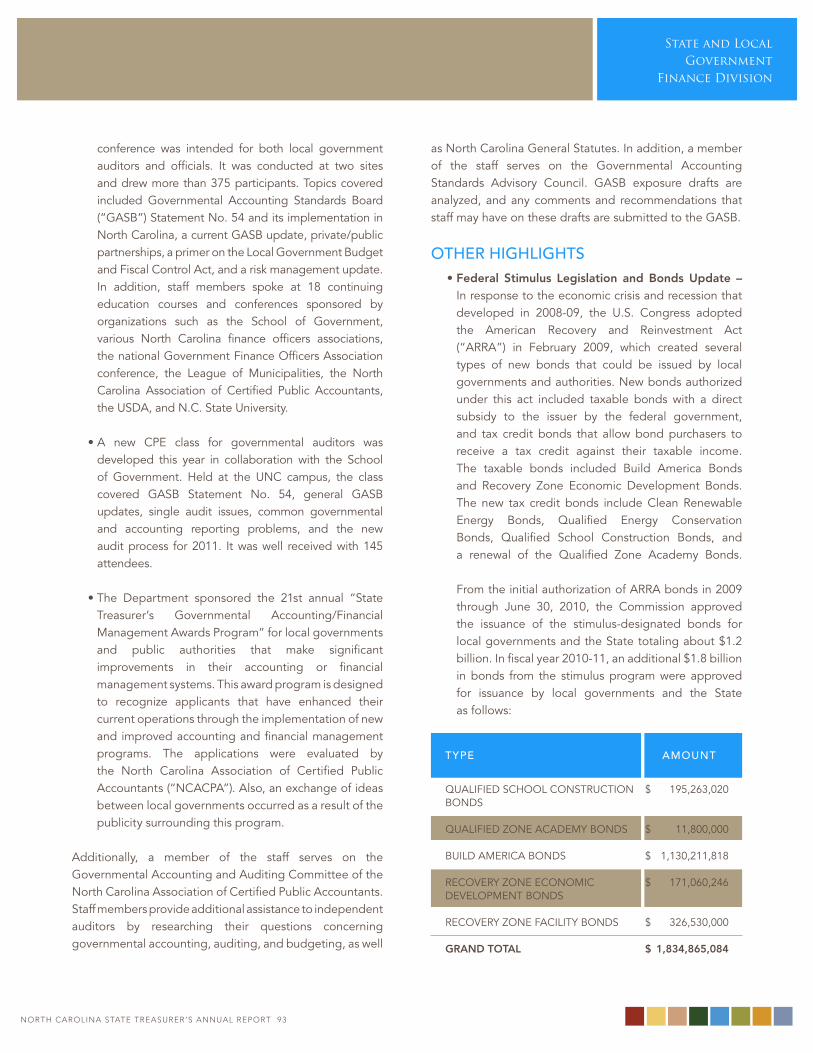
noRtH CARoLInA StAtE tREASuRER’S AnnuAL REPoRt 92
State and LocalGovernment
Finance Division
noRtH CARoLInA StAtE tREASuRER’S AnnuAL REPoRt 93
conference was intended for both local government auditors and officials. It was conducted at two sites and drew more than 375 participants. Topics covered included governmental Accounting Standards board (“gASb”) Statement No. 54 and its implementation in North Carolina, a current gASb update, private/public partnerships, a primer on the local government budget and Fiscal Control Act, and a risk management update. In addition, staff members spoke at 18 continuing education courses and conferences sponsored by organizations such as the School of government, various North Carolina finance officers associations, the national government Finance officers Association conference, the league of municipalities, the North Carolina Association of Certified Public Accountants, the USDA, and N.C. State University.
• A new CPe class for governmental auditors was developed this year in collaboration with the School of government. held at the UNC campus, the class covered gASb Statement No. 54, general gASb updates, single audit issues, common governmental and accounting reporting problems, and the new audit process for 2011. It was well received with 145 attendees.
• The Department sponsored the 21st annual “State Treasurer’s governmental Accounting/Financial management Awards Program” for local governments and public authorities that make significant improvements in their accounting or financial management systems. This award program is designed to recognize applicants that have enhanced their current operations through the implementation of new and improved accounting and financial management programs. The applications were evaluated by the North Carolina Association of Certified Public Accountants (“NCACPA”). Also, an exchange of ideas between local governments occurred as a result of the publicity surrounding this program.
Additionally, a member of the staff serves on the governmental Accounting and Auditing Committee of the North Carolina Association of Certified Public Accountants. Staff members provide additional assistance to independent auditors by researching their questions concerning governmental accounting, auditing, and budgeting, as well
as North Carolina general Statutes. In addition, a member of the staff serves on the governmental Accounting Standards Advisory Council. gASb exposure drafts are analyzed, and any comments and recommendations that staff may have on these drafts are submitted to the gASb.
OTHER HIGHLIGHTS • federal stimulus legislation and bonds update –
In response to the economic crisis and recession that developed in 2008-09, the U.S. Congress adopted the American Recovery and Reinvestment Act (“ARRA”) in February 2009, which created several types of new bonds that could be issued by local governments and authorities. New bonds authorized under this act included taxable bonds with a direct subsidy to the issuer by the federal government, and tax credit bonds that allow bond purchasers to receive a tax credit against their taxable income. The taxable bonds included build America bonds and Recovery zone economic Development bonds. The new tax credit bonds include Clean Renewable energy bonds, qualified energy Conservation bonds, qualified School Construction bonds, and a renewal of the qualified zone Academy bonds. From the initial authorization of ARRA bonds in 2009 through June 30, 2010, the Commission approved the issuance of the stimulus-designated bonds for local governments and the State totaling about $1.2 billion. In fiscal year 2010-11, an additional $1.8 billion in bonds from the stimulus program were approved for issuance by local governments and the State as follows:
TYPE AMOUNT
qUAlIFIeD SChool CoNSTRUCTIoN boNDS
qUAlIFIeD zoNe ACADemy boNDS
bUIlD AmeRICA boNDS
ReCoveRy zoNe eCoNomIC DeveloPmeNT boNDS
ReCoveRy zoNe FACIlITy boNDS
gRanD total
$ 195,263,020
$ 11,800,000
$ 1,130,211,818
$ 171,060,246
$ 326,530,000
$ 1,834,865,084
State and LocalGovernmentFinance Division
noRtH CARoLInA StAtE tREASuRER’S AnnuAL REPoRt 94
The authorization to issue most of the stimulus bonds expired December 31, 2010. After that date, the only stimulus bonds that may be issued are for school construction and energy conservation and renewal. The stimulus bonds shown above are included in the issuance totals chart for all bonds previously shown above in the report.
• fiscal analysis Dashboard project – After rollout in July 2010, the new analysis tool for cities (550) and counties (100) continues to allow governments to quickly benchmark themselves against up to five of their peers in four different areas – governmental activities, the general Fund, water and Sewer operations, and electric operations. The tool provides five years of historical data from audited financial statements and provides up to 20 different analytical ratios and calculations by which a government can measure its financial well being.
• audit Review and invoice approval process – During this fiscal year, staff, with the help of the Information Technology Division, has developed a new process to more efficiently process contracts, audits, and invoices. All data is remitted to the Department of State Treasurer electronically in a standardized format. It utilizes a data portal where each local government or auditor places the financial statements, contract, or invoice in a unique mailbox. The files are retrieved and processed electronically. To date, the process is going smoothly and has been well received by early users, as well as the local governments and auditors that beta tested the process. The system is designed to improve turnaround time, allowing much quicker identification of financial issues and/or crisis conditions, and will use much less paper than the old system of sending two to three paper copies of financial statements to the State for processing.
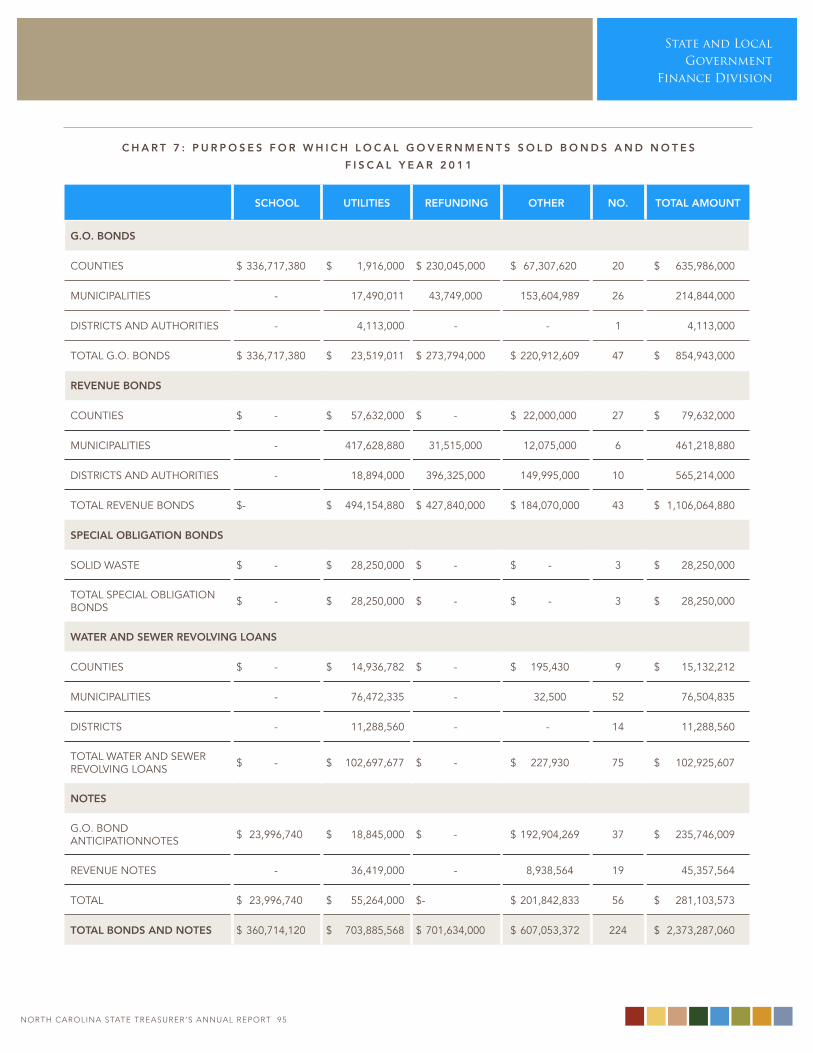
noRtH CARoLInA StAtE tREASuRER’S AnnuAL REPoRt 94
State and LocalGovernment
Finance Division
noRtH CARoLInA StAtE tREASuRER’S AnnuAL REPoRt 95
c h a R t 7 : p u R p o s e s f o R w h i c h l o c a l g o v e R n m e n t s s o l D b o n D s a n D n o t e s
f i s c a l y e a R 2 0 1 1
school utilities RefunDing otheR no. total amount
g.o. bonDs
CoUNTIeS $ 336,717,380 $ 1,916,000 $ 230,045,000 $ 67,307,620 20 $ 635,986,000
mUNICIPAlITIeS - 17,490,011 43,749,000 153,604,989 26 214,844,000
DISTRICTS AND AUThoRITIeS - 4,113,000 - - 1 4,113,000
ToTAl g.o. boNDS $ 336,717,380 $ 23,519,011 $ 273,794,000 $ 220,912,609 47 $ 854,943,000
Revenue bonDs
CoUNTIeS $ - $ 57,632,000 $ - $ 22,000,000 27 $ 79,632,000
mUNICIPAlITIeS - 417,628,880 31,515,000 12,075,000 6 461,218,880
DISTRICTS AND AUThoRITIeS - 18,894,000 396,325,000 149,995,000 10 565,214,000
ToTAl ReveNUe boNDS $- $ 494,154,880 $ 427,840,000 $ 184,070,000 43 $ 1,106,064,880
special obligation bonDs
SolID wASTe $ - $ 28,250,000 $ - $ - 3 $ 28,250,000
ToTAl SPeCIAl oblIgATIoNboNDS $ - $ 28,250,000 $ - $ - 3 $ 28,250,000
wateR anD seweR Revolving loans
CoUNTIeS $ - $ 14,936,782 $ - $ 195,430 9 $ 15,132,212
mUNICIPAlITIeS - 76,472,335 - 32,500 52 76,504,835
DISTRICTS - 11,288,560 - - 14 11,288,560
ToTAl wATeR AND SeweR RevolvINg loANS $ - $ 102,697,677 $ - $ 227,930 75 $ 102,925,607
notes
g.o. boND ANTICIPATIoNNoTeS $ 23,996,740 $ 18,845,000 $ - $ 192,904,269 37 $ 235,746,009
ReveNUe NoTeS - 36,419,000 - 8,938,564 19 45,357,564
ToTAl $ 23,996,740 $ 55,264,000 $- $ 201,842,833 56 $ 281,103,573
total bonDs anD notes $ 360,714,120 $ 703,885,568 $ 701,634,000 $ 607,053,372 224 $ 2,373,287,060
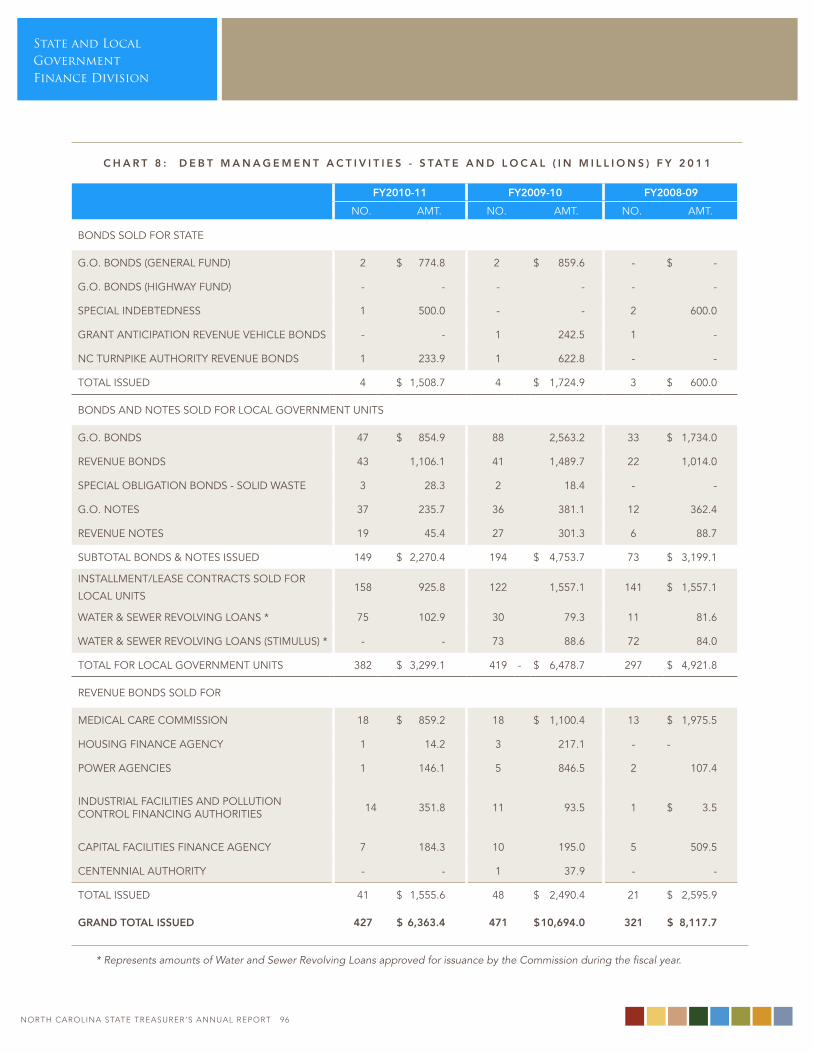
State and LocalGovernmentFinance Division
noRtH CARoLInA StAtE tREASuRER’S AnnuAL REPoRt 96
c h a R t 8 : D e b t m a n a g e m e n t a c t i v i t i e s - s tat e a n D l o c a l ( i n m i l l i o n s ) f y 2 0 1 1
fy2010-11 fy2009-10 fy2008-09
No. AmT. No. AmT. No. AmT.
boNDS SolD FoR STATe
g.o. boNDS (geNeRAl FUND) 2 $ 774.8 2 $ 859.6 - $ -
g.o. boNDS (hIghwAy FUND) - - - - - -
SPeCIAl INDebTeDNeSS 1 500.0 - - 2 600.0
gRANT ANTICIPATIoN ReveNUe vehICle boNDS - - 1 242.5 1 -
NC TURNPIKe AUThoRITy ReveNUe boNDS 1 233.9 1 622.8 - -
ToTAl ISSUeD 4 $ 1,508.7 4 $ 1,724.9 3 $ 600.0
boNDS AND NoTeS SolD FoR loCAl goveRNmeNT UNITS
g.o. boNDS 47 $ 854.9 88 2,563.2 33 $ 1,734.0
ReveNUe boNDS 43 1,106.1 41 1,489.7 22 1,014.0
SPeCIAl oblIgATIoN boNDS - SolID wASTe 3 28.3 2 18.4 - -
g.o. NoTeS 37 235.7 36 381.1 12 362.4
ReveNUe NoTeS 19 45.4 27 301.3 6 88.7
SUbToTAl boNDS & NoTeS ISSUeD 149 $ 2,270.4 194 $ 4,753.7 73 $ 3,199.1
INSTAllmeNT/leASe CoNTRACTS SolD FoR
loCAl UNITS 158 925.8 122 1,557.1 141 $ 1,557.1
wATeR & SeweR RevolvINg loANS * 75 102.9 30 79.3 11 81.6
wATeR & SeweR RevolvINg loANS (STImUlUS) * - - 73 88.6 72 84.0
ToTAl FoR loCAl goveRNmeNT UNITS 382 $ 3,299.1 419 - $ 6,478.7 297 $ 4,921.8
ReveNUe boNDS SolD FoR
meDICAl CARe CommISSIoN 18 $ 859.2 18 $ 1,100.4 13 $ 1,975.5
hoUSINg FINANCe AgeNCy 1 14.2 3 217.1 - -
PoweR AgeNCIeS 1 146.1 5 846.5 2 107.4
INDUSTRIAl FACIlITIeS AND PollUTIoN CoNTRol FINANCINg AUThoRITIeS 14 351.8 11 93.5 1 $ 3.5
CAPITAl FACIlITIeS FINANCe AgeNCy 7 184.3 10 195.0 5 509.5
CeNTeNNIAl AUThoRITy - - 1 37.9 - -
ToTAl ISSUeD 41 $ 1,555.6 48 $ 2,490.4 21 $ 2,595.9
gRanD total issueD 427 $ 6,363.4 471 $ 10,694.0 321 $ 8,117.7
* Represents amounts of Water and Sewer Revolving Loans approved for issuance by the Commission during the fiscal year.

noRtH CARoLInA StAtE tREASuRER’S AnnuAL REPoRt 96
Wetlands in Surf City, North Carolina
UnclaimedProperty &
Escheats Division
N O R T H C A R O L I N A S TAT E T R E A S U R E R ’ S
A N N U A L R E P O R T
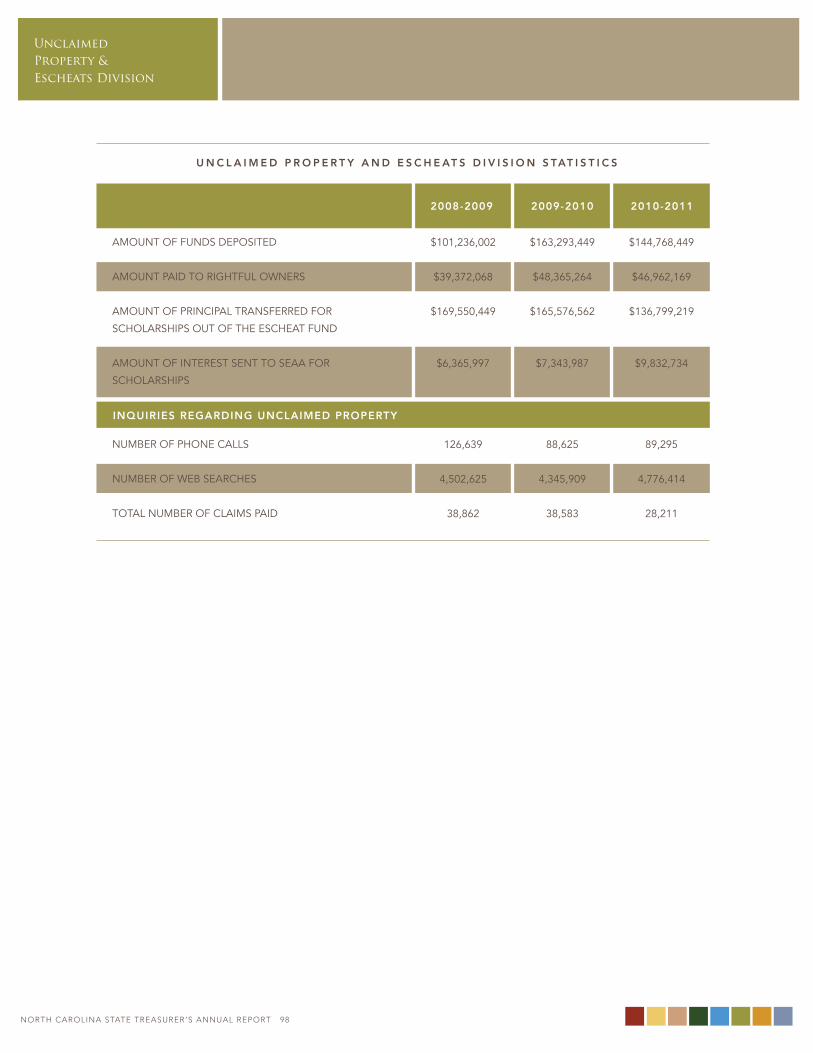
Unclaimed Property & Escheats Division
noRtH CARoLInA StAtE tREASuRER’S AnnuAL REPoRt 98
u n c l a i m e D p R o p e R t y a n D e s c h e at s D i v i s i o n s tat i s t i c s
$101,236,002
$39,372,068
$169,550,449
$6,365,997
126,639
4,502,625
38,862
$163,293,449
$48,365,264
$165,576,562
$7,343,987
88,625
4,345,909
38,583
$144,768,449
$46,962,169
$136,799,219
$9,832,734
89,295
4,776,414
28,211
2009-20102008-2009 2010-2011
AmoUNT oF FUNDS DePoSITeD
AmoUNT PAID To RIghTFUl owNeRS
AmoUNT oF PRINCIPAl TRANSFeRReD FoR
SCholARShIPS oUT oF The eSCheAT FUND
AmoUNT oF INTeReST SeNT To SeAA FoR
SCholARShIPS
NUmbeR oF PhoNe CAllS
NUmbeR oF web SeARCheS
ToTAl NUmbeR oF ClAImS PAID
inquiRies RegaRDing unclaimeD pRopeRty
noRtH CARoLInA StAtE tREASuRER’S AnnuAL REPoRt 98
Unclaimed Property &
Escheats Division
noRtH CARoLInA StAtE tREASuRER’S AnnuAL REPoRt 99
the Department of State treasurer oversees and maintains the State’s unclaimed property. By law, unclaimed property is escheated, or turned over, to the department for safekeeping. the unclaimed Property and Escheats Division is responsible for recovering and returning such property to all rightful owners.
The funds in this program were previously held by financial institutions, insurance companies, businesses and government agencies in the form of wages, utility deposits, insurance policy proceeds, and other sources of funds. Property is considered unclaimed when the apparent owner fails to communicate interest in it for a period of time called the dormancy period. once the property has met its dormancy limit and the holder has made a good faith effort to locate an apparent owner, any funds they are holding are escheated to the State Treasurer’s office. Upon receipt of this information, the Unclaimed Property and escheats Division works to locate the owners by various means, including listing names on the website, earning media coverage through television and newspapers, and sending lists to Clerks of Court.
The interest earned on these funds is sent to the State education Assistance Authority (“SeAA”) for student loans and grants. At the end of the 2011 fiscal year, ending June 30, a total amount of $9.8 million from interest earned and $116.3 million from the principal was sent to SeAA to be used for needy and worthy students. A total of 79,421 students were assisted through SeAA.
The general Assembly has mandated additional funds from the principal to be sent to the Department of veterans Scholarship Fund in the amount of $6.5 million and community colleges in the amount of nearly $14 million.
Currently the unclaimed property fund is valued at approximately $400 million. This is a combination of unclaimed property collected from businesses and interest earnings from the investment of the fund.
Additionally the Division staff attends outreach events such as the North Carolina State Fair, mountain State Fair, various civic organizations and many other events throughout the State to promote public awareness about the program.
The total number of claims paid for year ending June 30, 2011 was 28,211, totaling nearly $47 million. Additionally, NCCash.com, a searchable online database of unclaimed property, now has nearly 105,000 subscribers who are automatically notified if they have property.
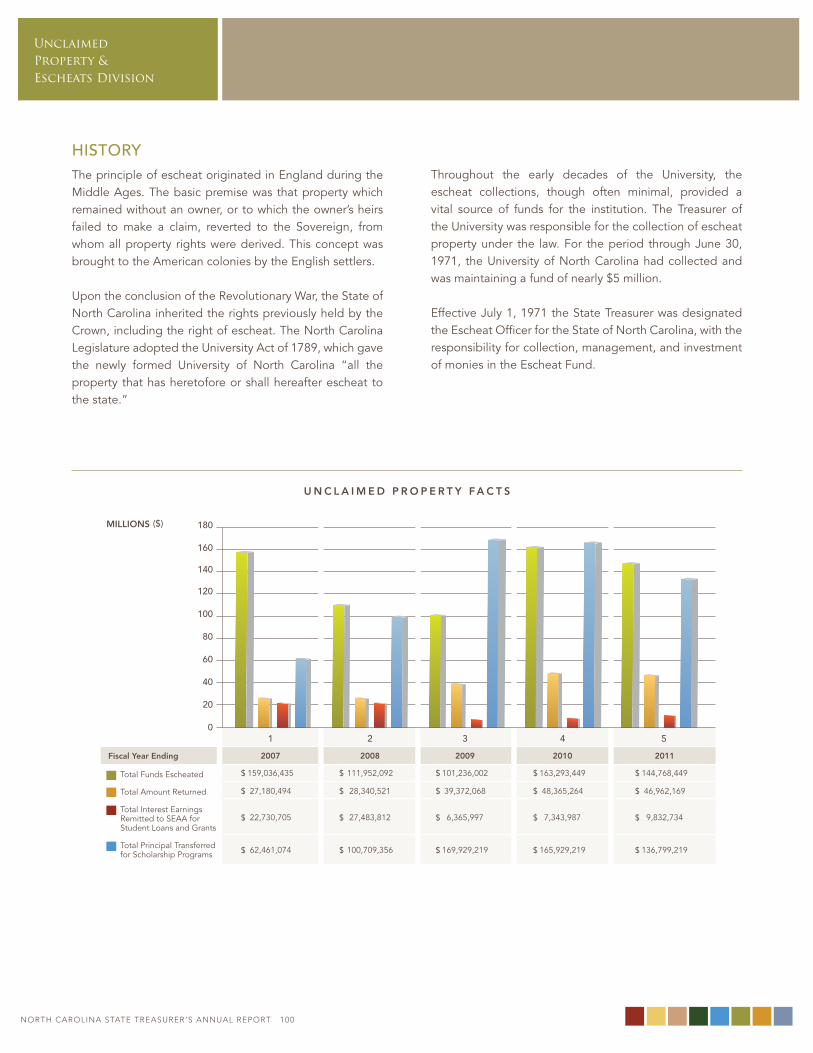
Unclaimed Property & Escheats Division
noRtH CARoLInA StAtE tREASuRER’S AnnuAL REPoRt 100
HISTORYThe principle of escheat originated in england during the middle Ages. The basic premise was that property which remained without an owner, or to which the owner’s heirs failed to make a claim, reverted to the Sovereign, from whom all property rights were derived. This concept was brought to the American colonies by the english settlers.
Upon the conclusion of the Revolutionary war, the State of North Carolina inherited the rights previously held by the Crown, including the right of escheat. The North Carolina legislature adopted the University Act of 1789, which gave the newly formed University of North Carolina “all the property that has heretofore or shall hereafter escheat to the state.”
Throughout the early decades of the University, the escheat collections, though often minimal, provided a vital source of funds for the institution. The Treasurer of the University was responsible for the collection of escheat property under the law. For the period through June 30, 1971, the University of North Carolina had collected and was maintaining a fund of nearly $5 million.
effective July 1, 1971 the State Treasurer was designated the escheat officer for the State of North Carolina, with the responsibility for collection, management, and investment of monies in the escheat Fund.
u n c l a i m e D p R o p e R t y fa c t s
$
($)
$
$
$
$
$
$
$
$
$
$
$
$
$
$
$
$
$
$
$
noRtH CARoLInA StAtE tREASuRER’S AnnuAL REPoRt 100
North Carolina State flower, dogwood Blossoms
FINANCIAL OPERATIONS
DIVISION
N O R T H C A R O L I N A S TAT E T R E A S U R E R ’ S
A N N U A L R E P O R T
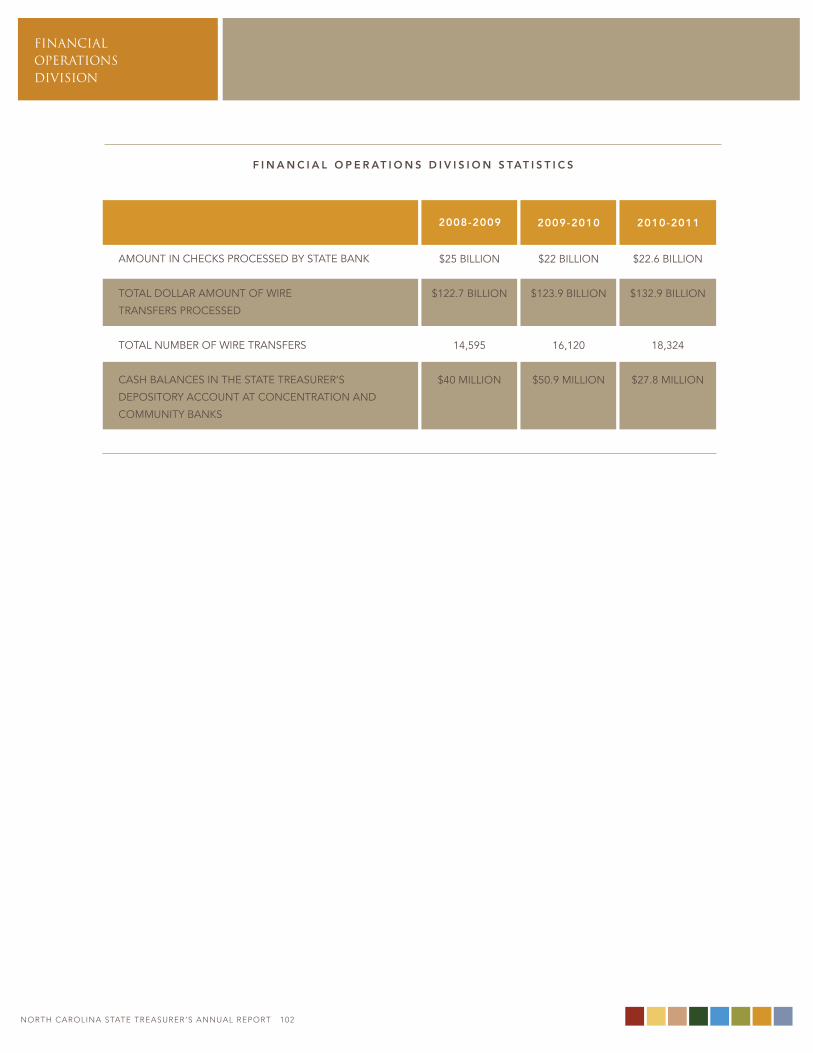
FINANCIAL OPERATIONS DIVISION
noRtH CARoLInA StAtE tREASuRER’S AnnuAL REPoRt 102
f i n a n c i a l o p e R at i o n s D i v i s i o n s tat i s t i c s
$25 bIllIoN
$122.7 bIllIoN
14,595
$40 mIllIoN
$22 bIllIoN
$123.9 bIllIoN
16,120
$50.9 mIllIoN
$22.6 bIllIoN
$132.9 bIllIoN
18,324
$27.8 mIllIoN
2008-2009 2009-2010 2010-2011
AmoUNT IN CheCKS PRoCeSSeD by STATe bANK
ToTAl DollAR AmoUNT oF wIRe
TRANSFeRS PRoCeSSeD
ToTAl NUmbeR oF wIRe TRANSFeRS
CASh bAlANCeS IN The STATe TReASUReR’S
DePoSIToRy ACCoUNT AT CoNCeNTRATIoN AND
CommUNITy bANKS
noRtH CARoLInA StAtE tREASuRER’S AnnuAL REPoRt 102
FINANCIAL OPERATIONS
DIVISION
noRtH CARoLInA StAtE tREASuRER’S AnnuAL REPoRt 103
The Division comprises four sections: • banking operations • bank Reconciliation Unit • Statewide Accounting operations • Departmental Accounting
HISTORYIn 1925, the general Assembly passed a law stating that all deposits received by the state must be deposited into centralized accounts in the name of the State Treasurer at banks approved by the Treasurer. In 1929, it designated the State Treasurer’s office as the centralized office of deposits and disbursements. As such, the position of Treasurer for each state agency and department was eliminated. This centralized system for managing the flow of monies collected and disbursed by all State departments, agencies, institutions, and universities ensures that the State continues to be the prime beneficiary of the flow of State funds through the commercial banking system in the course of conducting State business.
by 2009, the Department had begun issuing warrants electronically to vendors, employees, and retirees.
FoD was first formed in its current setup in 2001. Prior to that time, the Departmental Accounting section was part of the Administrative Services Division, while the banking and Statewide Accounting sections were part of the Investment and banking Division. The 2001 redesign was intended to make the workflow more efficient and cleaner for internal controls.
the Financial operations Division (“FoD”) performs the State treasurer’s role of serving as the State’s Banker and ensures that efficient banking services are provided to all State agencies and institutions. the Division also is charged with properly accounting for and reporting on all funds that are deposited, invested and disbursed through the Department of State treasurer.
FINANCIAL OPERATIONS DIVISION
noRtH CARoLInA StAtE tREASuRER’S AnnuAL REPoRt 104
BANkING OPERATIONSAll revenues collected by a State entity on behalf of the State must be deposited with the State Treasurer. The banking operations Section maintains correspondent depository relationships with various North Carolina banks and savings institutions in order for those entities to have a convenient location to make their deposits. Relationships are maintained with the six major banking institutions that have a statewide branch network (wachovia, bank of America, RbC, First Citizens, bb&T, and SunTrust), as well as more than 90 community banks across the state. The banking operations Section also performs accounting and monitoring functions for the Collateralization of Public Deposits program, which provides for the securing of funds deposited by the State and local units of government with financial institutions.
State entities disburse funds from their accounts maintained with the State Treasurer either electronically or by the issuance of warrants or checks. During fiscal year 2010-2011, more than 7.1 million warrants were processed, representing approximately $22 billion in payments.
The banking operations Section is also responsible for activities of the Division’s custodian bank, including securities delivery instructions, as well as collection of income and maturities.
BANk RECONCILIATION UNIT The bank Reconciliation Unit is responsible for reconciling all of the State Treasurer’s bank accounts. It reports to the Director of the Financial operations Division for internal control purposes.
STATEWIdE ACCOUNTING OPERATIONSThis section manages the accounting for the State Treasurer’s $87 billion investment pool and banking programs. It also maintains the general ledgers for the pension fund, employee benefit trust funds, and the escheats Fund, also known as the Unclaimed Property Fund, administered by the State Treasurer. The accounts for the outstanding general obligation and Special Indebtedness of the State are maintained by the Statewide Accounting operations section. Functions include the recording of new debt and the timely payment of principal and interest for the State’s debt. The section is also responsible for the financial statement audit of the NC Supplemental Retirement Income Plan (NC 401k) and the North Carolina Public employee Deferred Compensation Plan (NC 457).
dEPARTMENTAL ACCOUNTING The Departmental Accounting section manages all fiscal duties that relate to the administration of the programs of the Department of State Treasurer. These duties include developing and monitoring the operating budget for the Department, preparing payroll for more than 400 employees and contractors, managing accounts payable, and enforcing centralized purchasing.

noRtH CARoLInA StAtE tREASuRER’S AnnuAL REPoRt 104
Wrightsville Beach, North Carolina
STATISTICAL TAbLES
N O R T H C A R O L I N A S TAT E T R E A S U R E R ’ S
A N N U A L R E P O R T
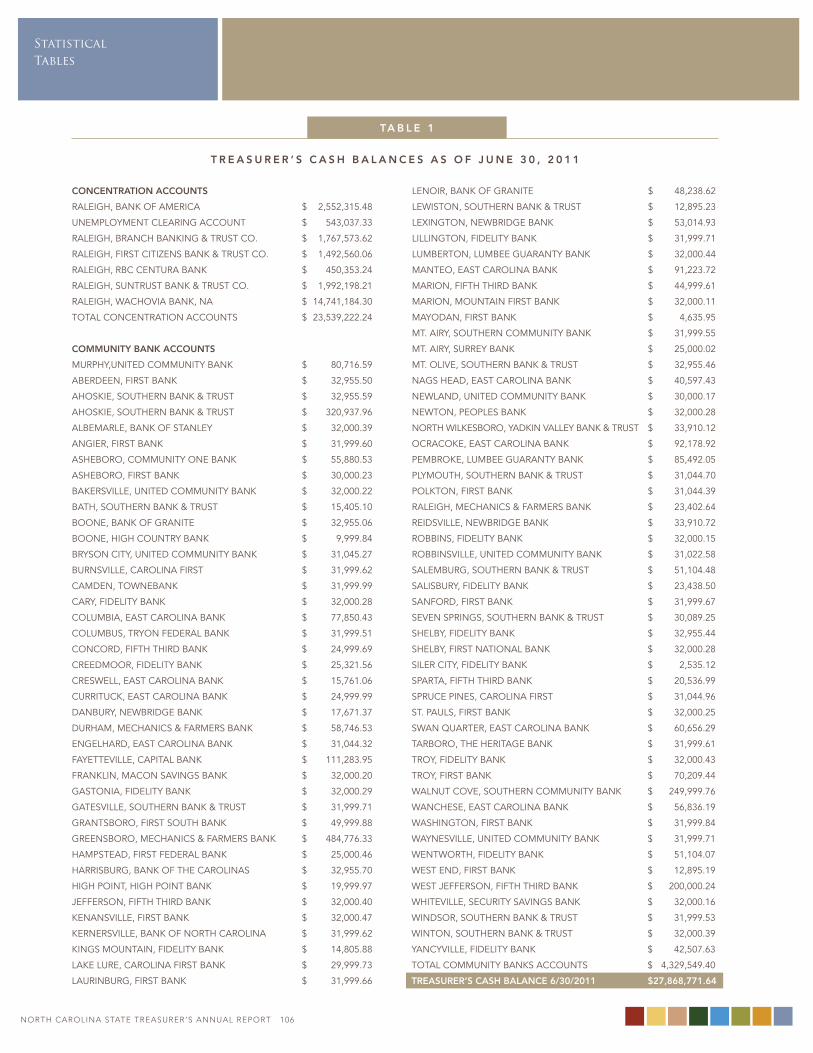
StatisticalTables
noRtH CARoLInA StAtE tREASuRER’S AnnuAL REPoRt 106
concentRation accounts
RAleIgh, bANK oF AmeRICA $ 2,552,315.48
UNemPloymeNT CleARINg ACCoUNT $ 543,037.33
RAleIgh, bRANCh bANKINg & TRUST Co. $ 1,767,573.62
RAleIgh, FIRST CITIzeNS bANK & TRUST Co. $ 1,492,560.06
RAleIgh, RbC CeNTURA bANK $ 450,353.24
RAleIgh, SUNTRUST bANK & TRUST Co. $ 1,992,198.21
RAleIgh, wAChovIA bANK, NA $ 14,741,184.30
ToTAl CoNCeNTRATIoN ACCoUNTS $ 23,539,222.24
community banK accounts
mURPhy,UNITeD CommUNITy bANK $ 80,716.59
AbeRDeeN, FIRST bANK $ 32,955.50
AhoSKIe, SoUTheRN bANK & TRUST $ 32,955.59
AhoSKIe, SoUTheRN bANK & TRUST $ 320,937.96
AlbemARle, bANK oF STANley $ 32,000.39
ANgIeR, FIRST bANK $ 31,999.60
ASheboRo, CommUNITy oNe bANK $ 55,880.53
ASheboRo, FIRST bANK $ 30,000.23
bAKeRSvIlle, UNITeD CommUNITy bANK $ 32,000.22
bATh, SoUTheRN bANK & TRUST $ 15,405.10
booNe, bANK oF gRANITe $ 32,955.06
booNe, hIgh CoUNTRy bANK $ 9,999.84
bRySoN CITy, UNITeD CommUNITy bANK $ 31,045.27
bURNSvIlle, CARolINA FIRST $ 31,999.62
CAmDeN, TowNebANK $ 31,999.99
CARy, FIDelITy bANK $ 32,000.28
ColUmbIA, eAST CARolINA bANK $ 77,850.43
ColUmbUS, TRyoN FeDeRAl bANK $ 31,999.51
CoNCoRD, FIFTh ThIRD bANK $ 24,999.69
CReeDmooR, FIDelITy bANK $ 25,321.56
CReSwell, eAST CARolINA bANK $ 15,761.06
CURRITUCK, eAST CARolINA bANK $ 24,999.99
DANbURy, NewbRIDge bANK $ 17,671.37
DURhAm, meChANICS & FARmeRS bANK $ 58,746.53
eNgelhARD, eAST CARolINA bANK $ 31,044.32
FAyeTTevIlle, CAPITAl bANK $ 111,283.95
FRANKlIN, mACoN SAvINgS bANK $ 32,000.20
gASToNIA, FIDelITy bANK $ 32,000.29
gATeSvIlle, SoUTheRN bANK & TRUST $ 31,999.71
gRANTSboRo, FIRST SoUTh bANK $ 49,999.88
gReeNSboRo, meChANICS & FARmeRS bANK $ 484,776.33
hAmPSTeAD, FIRST FeDeRAl bANK $ 25,000.46
hARRISbURg, bANK oF The CARolINAS $ 32,955.70
hIgh PoINT, hIgh PoINT bANK $ 19,999.97
JeFFeRSoN, FIFTh ThIRD bANK $ 32,000.40
KeNANSvIlle, FIRST bANK $ 32,000.47
KeRNeRSvIlle, bANK oF NoRTh CARolINA $ 31,999.62
KINgS moUNTAIN, FIDelITy bANK $ 14,805.88
lAKe lURe, CARolINA FIRST bANK $ 29,999.73
lAURINbURg, FIRST bANK $ 31,999.66
leNoIR, bANK oF gRANITe $ 48,238.62
lewISToN, SoUTheRN bANK & TRUST $ 12,895.23
lexINgToN, NewbRIDge bANK $ 53,014.93
lIllINgToN, FIDelITy bANK $ 31,999.71
lUmbeRToN, lUmbee gUARANTy bANK $ 32,000.44
mANTeo, eAST CARolINA bANK $ 91,223.72
mARIoN, FIFTh ThIRD bANK $ 44,999.61
mARIoN, moUNTAIN FIRST bANK $ 32,000.11
mAyoDAN, FIRST bANK $ 4,635.95
mT. AIRy, SoUTheRN CommUNITy bANK $ 31,999.55
mT. AIRy, SURRey bANK $ 25,000.02
mT. olIve, SoUTheRN bANK & TRUST $ 32,955.46
NAgS heAD, eAST CARolINA bANK $ 40,597.43
NewlAND, UNITeD CommUNITy bANK $ 30,000.17
NewToN, PeoPleS bANK $ 32,000.28
NoRTh wIlKeSboRo, yADKIN vAlley bANK & TRUST $ 33,910.12
oCRACoKe, eAST CARolINA bANK $ 92,178.92
PembRoKe, lUmbee gUARANTy bANK $ 85,492.05
PlymoUTh, SoUTheRN bANK & TRUST $ 31,044.70
PolKToN, FIRST bANK $ 31,044.39
RAleIgh, meChANICS & FARmeRS bANK $ 23,402.64
ReIDSvIlle, NewbRIDge bANK $ 33,910.72
RobbINS, FIDelITy bANK $ 32,000.15
RobbINSvIlle, UNITeD CommUNITy bANK $ 31,022.58
SAlembURg, SoUTheRN bANK & TRUST $ 51,104.48
SAlISbURy, FIDelITy bANK $ 23,438.50
SANFoRD, FIRST bANK $ 31,999.67
SeveN SPRINgS, SoUTheRN bANK & TRUST $ 30,089.25
Shelby, FIDelITy bANK $ 32,955.44
Shelby, FIRST NATIoNAl bANK $ 32,000.28
SIleR CITy, FIDelITy bANK $ 2,535.12
SPARTA, FIFTh ThIRD bANK $ 20,536.99
SPRUCe PINeS, CARolINA FIRST $ 31,044.96
ST. PAUlS, FIRST bANK $ 32,000.25
SwAN qUARTeR, eAST CARolINA bANK $ 60,656.29
TARboRo, The heRITAge bANK $ 31,999.61
TRoy, FIDelITy bANK $ 32,000.43
TRoy, FIRST bANK $ 70,209.44
wAlNUT Cove, SoUTheRN CommUNITy bANK $ 249,999.76
wANCheSe, eAST CARolINA bANK $ 56,836.19
wAShINgToN, FIRST bANK $ 31,999.84
wAyNeSvIlle, UNITeD CommUNITy bANK $ 31,999.71
weNTwoRTh, FIDelITy bANK $ 51,104.07
weST eND, FIRST bANK $ 12,895.19
weST JeFFeRSoN, FIFTh ThIRD bANK $ 200,000.24
whITevIlle, SeCURITy SAvINgS bANK $ 32,000.16
wINDSoR, SoUTheRN bANK & TRUST $ 31,999.53
wINToN, SoUTheRN bANK & TRUST $ 32,000.39
yANCyvIlle, FIDelITy bANK $ 42,507.63
ToTAl CommUNITy bANKS ACCoUNTS $ 4,329,549.40
tReasuReR’s cash balance 6/30/2011 $ 27,868,771.64
ta b l e 1
t R e a s u R e R ’ s c a s h b a l a n c e s a s o f J u n e 3 0 , 2 0 1 1
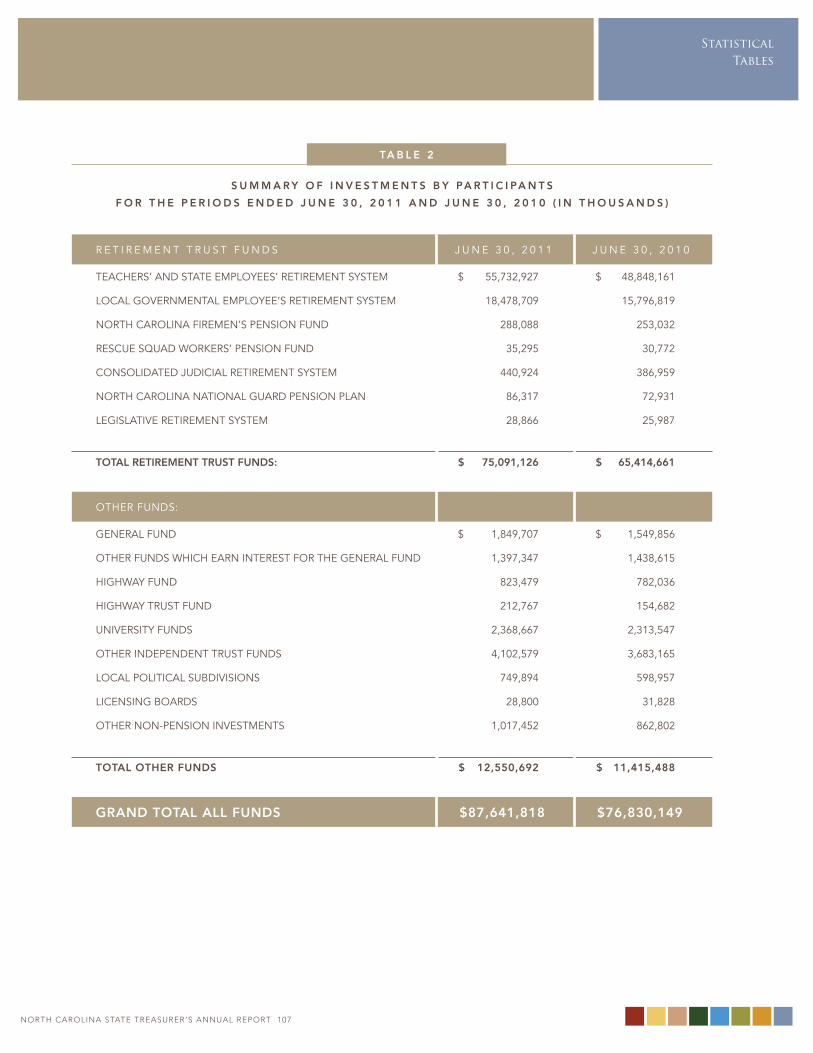
noRtH CARoLInA StAtE tREASuRER’S AnnuAL REPoRt 106
StatisticalTables
noRtH CARoLInA StAtE tREASuRER’S AnnuAL REPoRt 107
s u m m a R y o f i n v e s t m e n t s b y pa R t i c i pa n t s
f o R t h e p e R i o D s e n D e D J u n e 3 0 , 2 0 1 1 a n D J u n e 3 0 , 2 0 1 0 ( i n t h o u s a n D s )
R e T I R e m e N T T R U S T F U N D S J U N e 3 0 , 2 0 1 1 J U N e 3 0 , 2 0 1 0
TeACheRS’ AND STATe emPloyeeS’ ReTIRemeNT SySTem $ 55,732,927 $ 48,848,161
loCAl goveRNmeNTAl emPloyee’S ReTIRemeNT SySTem 18,478,709 15,796,819
NoRTh CARolINA FIRemeN’S PeNSIoN FUND 288,088 253,032
ReSCUe SqUAD woRKeRS’ PeNSIoN FUND 35,295 30,772
CoNSolIDATeD JUDICIAl ReTIRemeNT SySTem 440,924 386,959
NoRTh CARolINA NATIoNAl gUARD PeNSIoN PlAN 86,317 72,931
legISlATIve ReTIRemeNT SySTem 28,866 25,987
total RetiRement tRust funDs: $ 75,091,126 $ 65,414,661
oTheR FUNDS:
geNeRAl FUND $ 1,849,707 $ 1,549,856
oTheR FUNDS whICh eARN INTeReST FoR The geNeRAl FUND 1,397,347 1,438,615
hIghwAy FUND 823,479 782,036
hIghwAy TRUST FUND 212,767 154,682
UNIveRSITy FUNDS 2,368,667 2,313,547
oTheR INDePeNDeNT TRUST FUNDS 4,102,579 3,683,165
loCAl PolITICAl SUbDIvISIoNS 749,894 598,957
lICeNSINg boARDS 28,800 31,828
oTheR NoN-PeNSIoN INveSTmeNTS 1,017,452 862,802
total otheR funDs $ 12,550,692 $ 11,415,488
gRanD total all funDs $ 87,641,818 $ 76,830,149
ta b l e 2
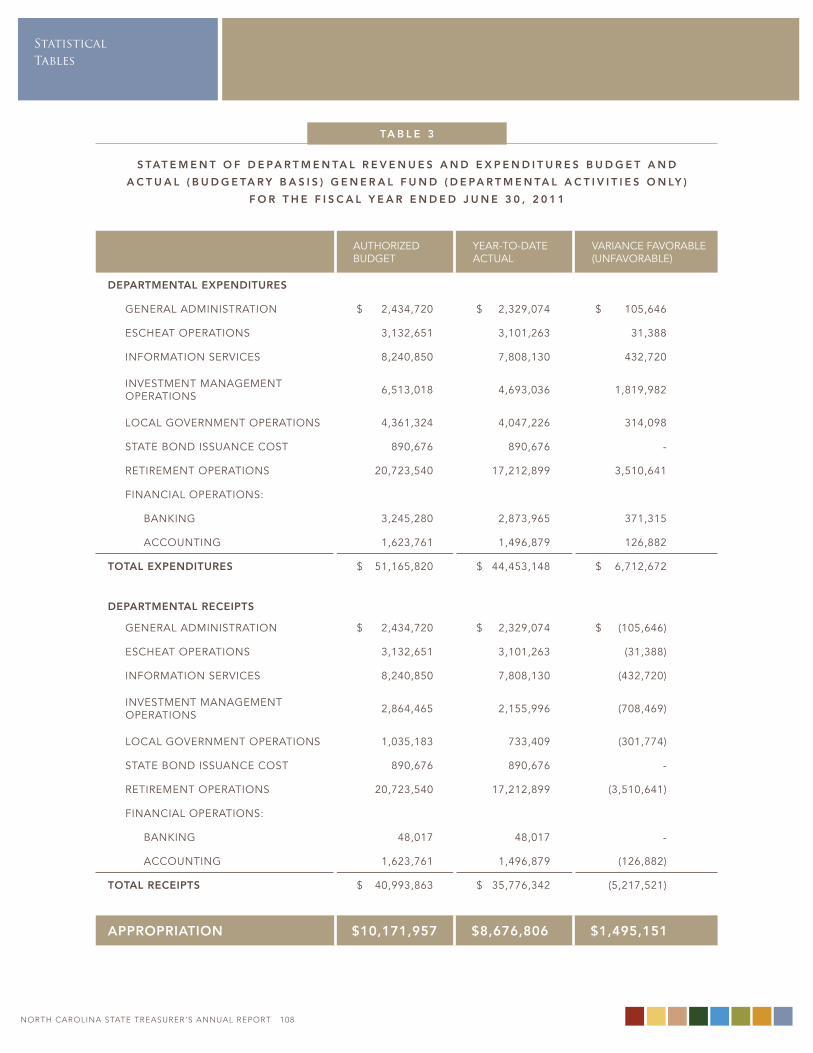
StatisticalTables
noRtH CARoLInA StAtE tREASuRER’S AnnuAL REPoRt 108
s tat e m e n t o f D e pa R t m e n ta l R e v e n u e s a n D e x p e n D i t u R e s b u D g e t a n D
a c t u a l ( b u D g e ta R y b a s i s ) g e n e R a l f u n D ( D e pa R t m e n ta l a c t i v i t i e s o n ly )
f o R t h e f i s c a l y e a R e n D e D J u n e 3 0 , 2 0 1 1
AUThoRIzeD bUDgeT
yeAR-To-DATeACTUAl
vARIANCe FAvoRAble(UNFAvoRAble)
DepaRtmental expenDituRes
geNeRAl ADmINISTRATIoN $ 2,434,720 $ 2,329,074 $ 105,646
eSCheAT oPeRATIoNS 3,132,651 3,101,263 31,388
INFoRmATIoN SeRvICeS 8,240,850 7,808,130 432,720
INveSTmeNT mANAgemeNT oPeRATIoNS 6,513,018 4,693,036 1,819,982
loCAl goveRNmeNT oPeRATIoNS 4,361,324 4,047,226 314,098
STATe boND ISSUANCe CoST 890,676 890,676 -
ReTIRemeNT oPeRATIoNS 20,723,540 17,212,899 3,510,641
FINANCIAl oPeRATIoNS:
bANKINg 3,245,280 2,873,965 371,315
ACCoUNTINg 1,623,761 1,496,879 126,882
total expenDituRes $ 51,165,820 $ 44,453,148 $ 6,712,672
DepaRtmental Receipts
geNeRAl ADmINISTRATIoN $ 2,434,720 $ 2,329,074 $ (105,646)
eSCheAT oPeRATIoNS 3,132,651 3,101,263 (31,388)
INFoRmATIoN SeRvICeS 8,240,850 7,808,130 (432,720)
INveSTmeNT mANAgemeNT oPeRATIoNS 2,864,465 2,155,996 (708,469)
loCAl goveRNmeNT oPeRATIoNS 1,035,183 733,409 (301,774)
STATe boND ISSUANCe CoST 890,676 890,676 -
ReTIRemeNT oPeRATIoNS 20,723,540 17,212,899 (3,510,641)
FINANCIAl oPeRATIoNS:
bANKINg 48,017 48,017 -
ACCoUNTINg 1,623,761 1,496,879 (126,882)
total Receipts $ 40,993,863 $ 35,776,342 (5,217,521)
appRopRiation $10,171,957 $8,676,806 $1,495,151
ta b l e 3
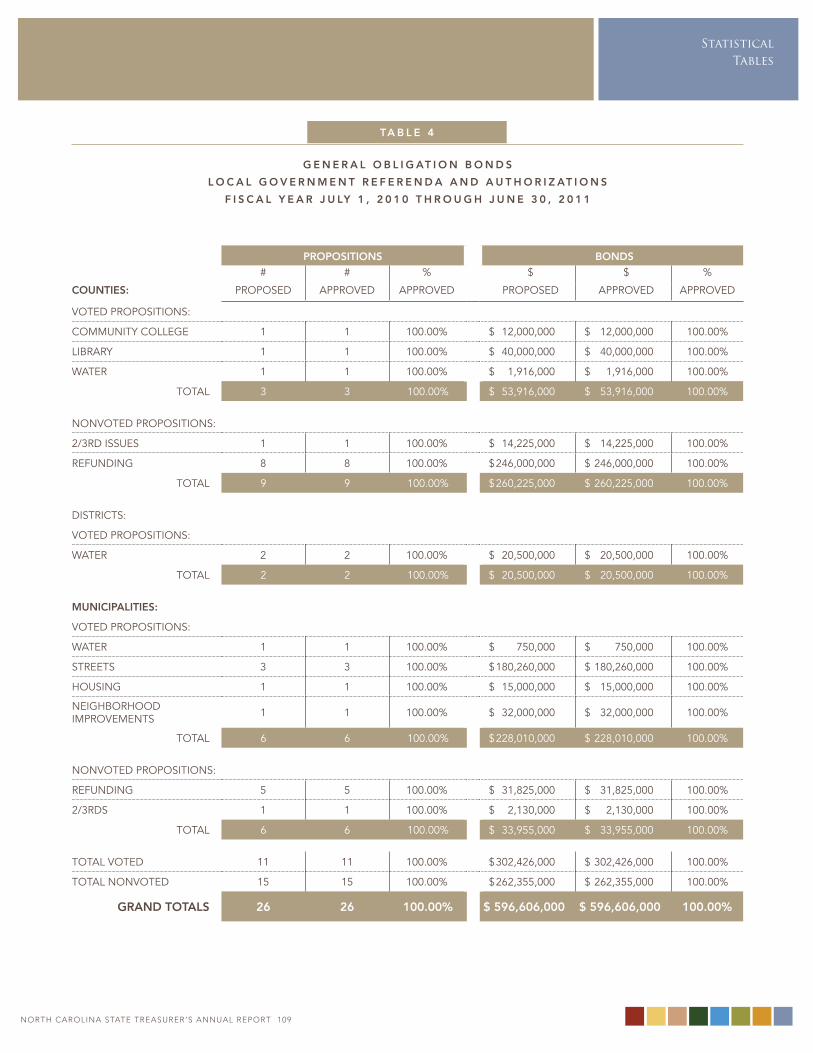
noRtH CARoLInA StAtE tREASuRER’S AnnuAL REPoRt 108
StatisticalTables
noRtH CARoLInA StAtE tREASuRER’S AnnuAL REPoRt 109
g e n e R a l o b l i g at i o n b o n D s
l o c a l g o v e R n m e n t R e f e R e n D a a n D a u t h o R i z at i o n s
f i s c a l y e a R J u ly 1 , 2 0 1 0 t h R o u g h J u n e 3 0 , 2 0 1 1
pRopositions bonDs
# # % $ $ %
counties: PRoPoSeD APPRoveD APPRoveD PRoPoSeD APPRoveD APPRoveD
voTeD PRoPoSITIoNS:
CommUNITy College 1 1 100.00% $ 12,000,000 $ 12,000,000 100.00%
lIbRARy 1 1 100.00% $ 40,000,000 $ 40,000,000 100.00%
wATeR 1 1 100.00% $ 1,916,000 $ 1,916,000 100.00%
ToTAl 3 3 100.00% $ 53,916,000 $ 53,916,000 100.00%
NoNvoTeD PRoPoSITIoNS:
2/3RD ISSUeS 1 1 100.00% $ 14,225,000 $ 14,225,000 100.00%
ReFUNDINg 8 8 100.00% $ 246,000,000 $ 246,000,000 100.00%
ToTAl 9 9 100.00% $ 260,225,000 $ 260,225,000 100.00%
DISTRICTS:
voTeD PRoPoSITIoNS:
wATeR 2 2 100.00% $ 20,500,000 $ 20,500,000 100.00%
ToTAl 2 2 100.00% $ 20,500,000 $ 20,500,000 100.00%
municipalities:
voTeD PRoPoSITIoNS:
wATeR 1 1 100.00% $ 750,000 $ 750,000 100.00%
STReeTS 3 3 100.00% $ 180,260,000 $ 180,260,000 100.00%
hoUSINg 1 1 100.00% $ 15,000,000 $ 15,000,000 100.00%
NeIghboRhooD ImPRovemeNTS 1 1 100.00% $ 32,000,000 $ 32,000,000 100.00%
ToTAl 6 6 100.00% $ 228,010,000 $ 228,010,000 100.00%
NoNvoTeD PRoPoSITIoNS:
ReFUNDINg 5 5 100.00% $ 31,825,000 $ 31,825,000 100.00%
2/3RDS 1 1 100.00% $ 2,130,000 $ 2,130,000 100.00%
ToTAl 6 6 100.00% $ 33,955,000 $ 33,955,000 100.00%
ToTAl voTeD 11 11 100.00% $ 302,426,000 $ 302,426,000 100.00%
ToTAl NoNvoTeD 15 15 100.00% $ 262,355,000 $ 262,355,000 100.00%
gRanD totals 26 26 100.00% $ 596,606,000 $ 596,606,000 100.00%
ta b l e 4
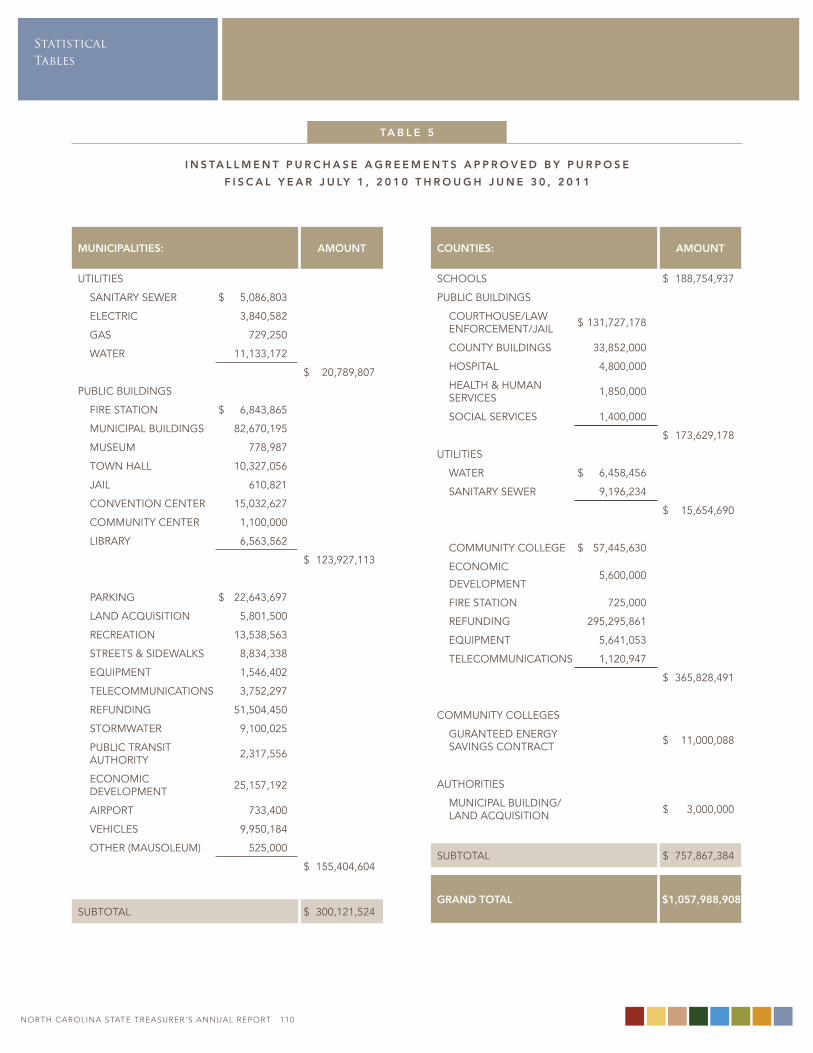
StatisticalTables
noRtH CARoLInA StAtE tREASuRER’S AnnuAL REPoRt 110
ta b l e 5
municipalities: amount
UTIlITIeS
SANITARy SeweR $ 5,086,803
eleCTRIC 3,840,582
gAS 729,250
wATeR 11,133,172
$ 20,789,807
PUblIC bUIlDINgS
FIRe STATIoN $ 6,843,865
mUNICIPAl bUIlDINgS 82,670,195
mUSeUm 778,987
TowN hAll 10,327,056
JAIl 610,821
CoNveNTIoN CeNTeR 15,032,627
CommUNITy CeNTeR 1,100,000
lIbRARy 6,563,562
$ 123,927,113
PARKINg $ 22,643,697
lAND ACqUISITIoN 5,801,500
ReCReATIoN 13,538,563
STReeTS & SIDewAlKS 8,834,338
eqUIPmeNT 1,546,402
TeleCommUNICATIoNS 3,752,297
ReFUNDINg 51,504,450
SToRmwATeR 9,100,025
PUblIC TRANSIT AUThoRITy 2,317,556
eCoNomIC DeveloPmeNT 25,157,192
AIRPoRT 733,400
vehICleS 9,950,184
oTheR (mAUSoleUm) 525,000
$ 155,404,604
SUbToTAl $ 300,121,524
i n s ta l l m e n t p u R c h a s e a g R e e m e n t s a p p R o v e D b y p u R p o s e
f i s c a l y e a R J u ly 1 , 2 0 1 0 t h R o u g h J u n e 3 0 , 2 0 1 1
counties: amount
SChoolS $ 188,754,937
PUblIC bUIlDINgS
CoURThoUSe/lAw eNFoRCemeNT/JAIl $ 131,727,178
CoUNTy bUIlDINgS 33,852,000
hoSPITAl 4,800,000
heAlTh & hUmAN SeRvICeS 1,850,000
SoCIAl SeRvICeS 1,400,000
$ 173,629,178
UTIlITIeS
wATeR $ 6,458,456
SANITARy SeweR 9,196,234
$ 15,654,690
CommUNITy College $ 57,445,630
eCoNomIC
DeveloPmeNT 5,600,000
FIRe STATIoN 725,000
ReFUNDINg 295,295,861
eqUIPmeNT 5,641,053
TeleCommUNICATIoNS 1,120,947
$ 365,828,491
CommUNITy CollegeS
gURANTeeD eNeRgy SAvINgS CoNTRACT $ 11,000,088
AUThoRITIeS
mUNICIPAl bUIlDINg/lAND ACqUISITIoN $ 3,000,000
SUbToTAl $ 757,867,384
gRanD total $1,057,988,908
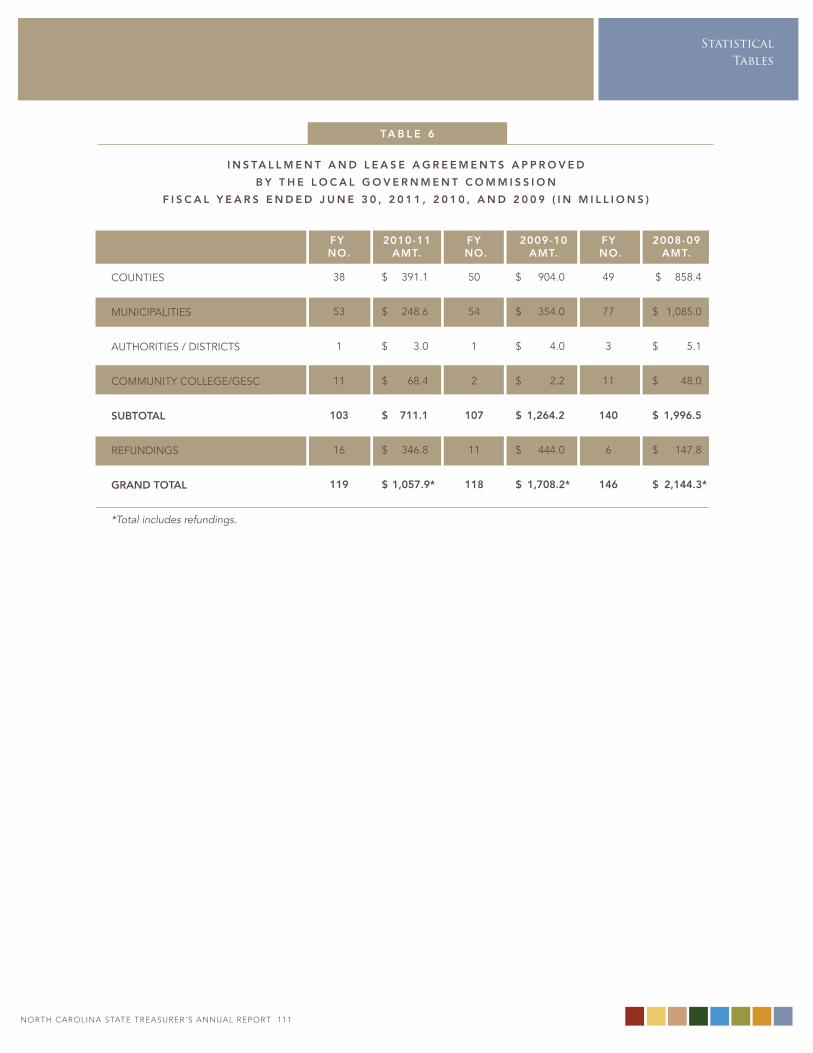
noRtH CARoLInA StAtE tREASuRER’S AnnuAL REPoRt 110
StatisticalTables
noRtH CARoLInA StAtE tREASuRER’S AnnuAL REPoRt 111
i n s ta l l m e n t a n D l e a s e a g R e e m e n t s a p p R o v e D
b y t h e l o c a l g o v e R n m e n t c o m m i s s i o n
f i s c a l y e a R s e n D e D J u n e 3 0 , 2 0 1 1 , 2 0 1 0 , a n D 2 0 0 9 ( i n m i l l i o n s )
fy no.
2010-11 amt.
fy no.
2009-10amt.
fy no.
2008-09amt.
CoUNTIeS
mUNICIPAlITIeS
AUThoRITIeS / DISTRICTS
CommUNITy College/geSC
subtotal
ReFUNDINgS
gRanD total
*Total includes refundings.
38
53
1
11
103
16
119
$ 391.1
$ 248.6
$ 3.0
$ 68.4
$ 711.1
$ 346.8
$ 1,057.9*
50
54
1
2
107
11
118
$ 904.0
$ 354.0
$ 4.0
$ 2.2
$ 1,264.2
$ 444.0
$ 1,708.2*
49
77
3
11
140
6
146
$ 858.4
$ 1,085.0
$ 5.1
$ 48.0
$ 1,996.5
$ 147.8
$ 2,144.3*
ta b l e 6
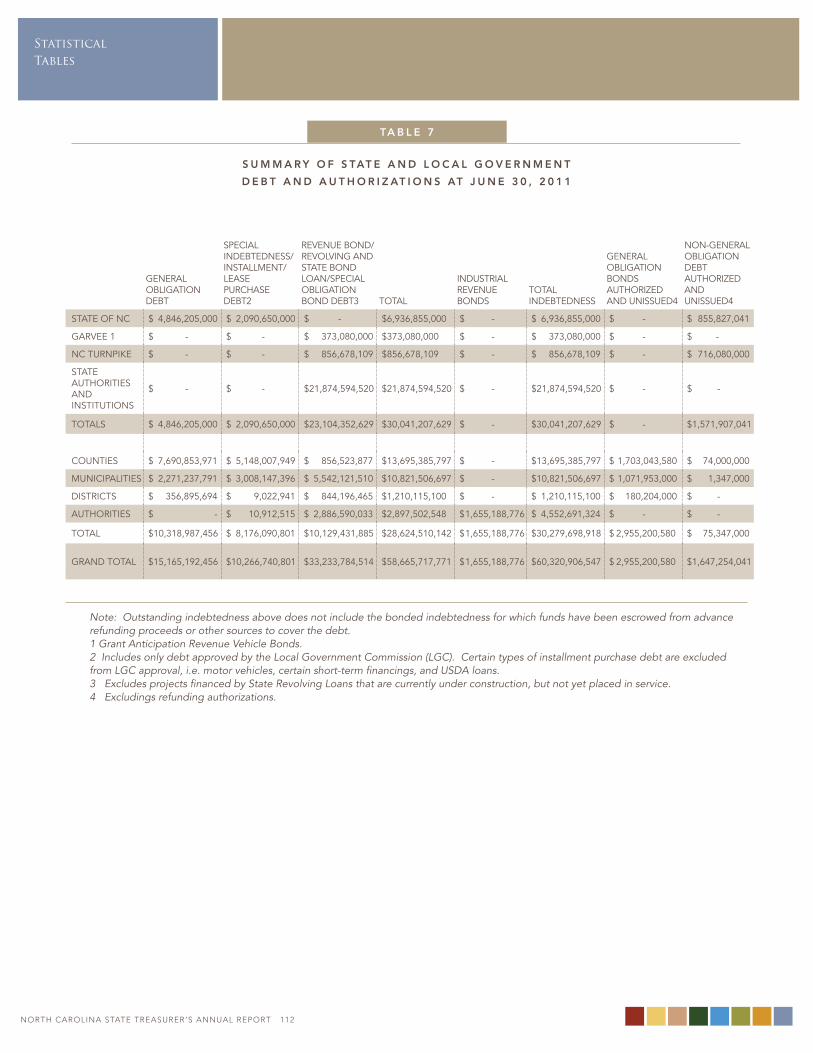
StatisticalTables
noRtH CARoLInA StAtE tREASuRER’S AnnuAL REPoRt 112
geNeRAloblIgATIoNDebT
SPeCIAl INDebTeDNeSS/INSTAllmeNT/leASe PURChASe DebT2
ReveNUe boND/RevolvINg AND STATe boND loAN/SPeCIAl oblIgATIoN boND DebT3 ToTAl
INDUSTRIAlReveNUeboNDS
ToTAlINDebTeDNeSS
geNeRAloblIgATIoNboNDSAUThoRIzeDAND UNISSUeD4
NoN-geNeRAloblIgATIoN DebTAUThoRIzeD ANDUNISSUeD4
STATe oF NC $ 4,846,205,000 $ 2,090,650,000 $ - $6,936,855,000 $ - $ 6,936,855,000 $ - $ 855,827,041
gARvee 1 $ - $ - $ 373,080,000 $373,080,000 $ - $ 373,080,000 $ - $ -
NC TURNPIKe $ - $ - $ 856,678,109 $856,678,109 $ - $ 856,678,109 $ - $ 716,080,000
STATe AUThoRITIeSAND INSTITUTIoNS
$ - $ - $ 21,874,594,520 $21,874,594,520 $ - $ 21,874,594,520 $ - $ -
ToTAlS $ 4,846,205,000 $ 2,090,650,000 $ 23,104,352,629 $30,041,207,629 $ - $ 30,041,207,629 $ - $ 1,571,907,041
CoUNTIeS $ 7,690,853,971 $ 5,148,007,949 $ 856,523,877 $13,695,385,797 $ - $ 13,695,385,797 $ 1,703,043,580 $ 74,000,000
mUNICIPAlITIeS $ 2,271,237,791 $ 3,008,147,396 $ 5,542,121,510 $10,821,506,697 $ - $ 10,821,506,697 $ 1,071,953,000 $ 1,347,000
DISTRICTS $ 356,895,694 $ 9,022,941 $ 844,196,465 $1,210,115,100 $ - $ 1,210,115,100 $ 180,204,000 $ -
AUThoRITIeS $ - $ 10,912,515 $ 2,886,590,033 $2,897,502,548 $ 1,655,188,776 $ 4,552,691,324 $ - $ -
ToTAl $ 10,318,987,456 $ 8,176,090,801 $ 10,129,431,885 $28,624,510,142 $ 1,655,188,776 $ 30,279,698,918 $ 2,955,200,580 $ 75,347,000
gRAND ToTAl $ 15,165,192,456 $ 10,266,740,801 $33,233,784,514 $58,665,717,771 $ 1,655,188,776 $ 60,320,906,547 $ 2,955,200,580 $ 1,647,254,041
Note: Outstanding indebtedness above does not include the bonded indebtedness for which funds have been escrowed from advance refunding proceeds or other sources to cover the debt.1 Grant Anticipation Revenue Vehicle Bonds.2 Includes only debt approved by the Local Government Commission (LGC). Certain types of installment purchase debt are excluded from LGC approval, i.e. motor vehicles, certain short-term financings, and USDA loans.3 Excludes projects financed by State Revolving Loans that are currently under construction, but not yet placed in service.4 Excludings refunding authorizations.
s u m m a R y o f s tat e a n D l o c a l g o v e R n m e n t
D e b t a n D a u t h o R i z at i o n s at J u n e 3 0 , 2 0 1 1
ta b l e 7
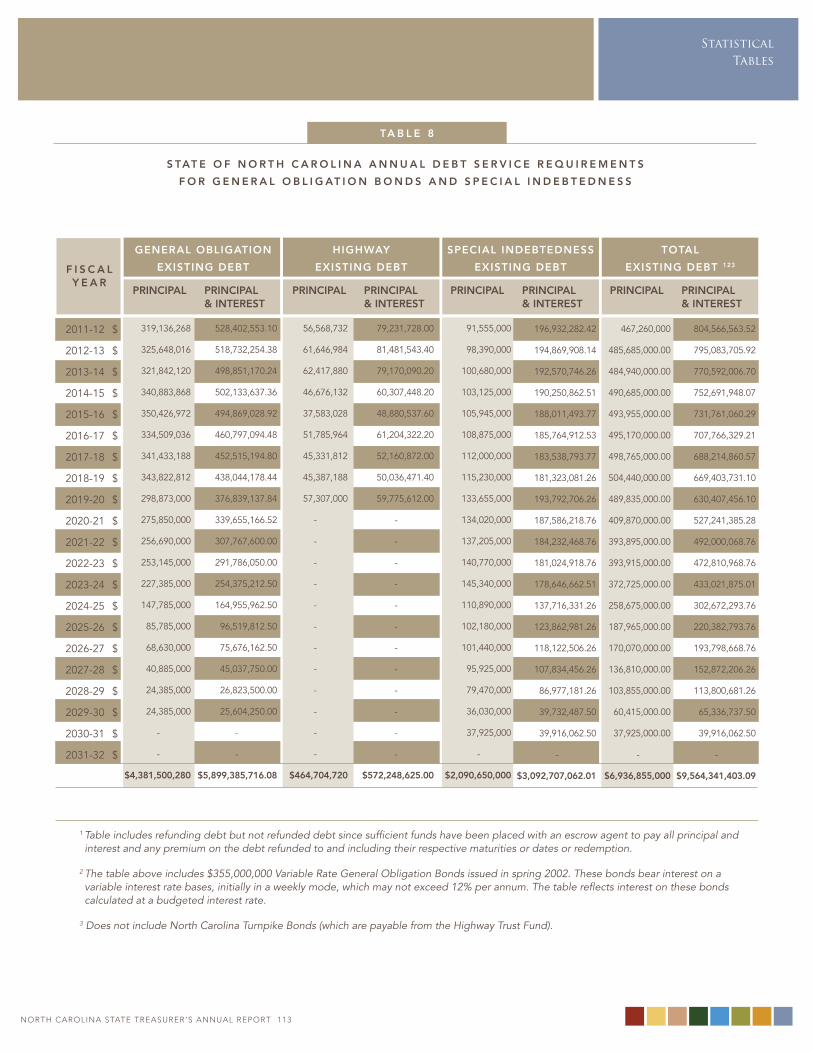
noRtH CARoLInA StAtE tREASuRER’S AnnuAL REPoRt 112
StatisticalTables
noRtH CARoLInA StAtE tREASuRER’S AnnuAL REPoRt 113
s tat e o f n o R t h c a R o l i n a a n n u a l D e b t s e R v i c e R e q u i R e m e n t s
f o R g e n e R a l o b l i g at i o n b o n D s a n D s p e c i a l i n D e b t e D n e s s
1 Table includes refunding debt but not refunded debt since sufficient funds have been placed with an escrow agent to pay all principal andinterest and any premium on the debt refunded to and including their respective maturities or dates or redemption.
2 The table above includes $355,000,000 Variable Rate General Obligation Bonds issued in spring 2002. These bonds bear interest on a variable interest rate bases, initially in a weekly mode, which may not exceed 12% per annum. The table reflects interest on these bonds calculated at a budgeted interest rate.
3 Does not include North Carolina Turnpike Bonds (which are payable from the Highway Trust Fund).
2011-12
2012-13
2013-14
2014-15
2015-16
2016-17
2017-18
2018-19
2019-20
2020-21
2021-22
2022-23
2023-24
2024-25
2025-26
2026-27
2027-28
2028-29
2029-30
2030-31
2031-32
$
$
$
$
$
$
$
$
$
$
$
$
$
$
$
$
$
$
$
$
$
geneRal obligation
existing Debtf i s c a ly e a R
highway
existing Debt
special inDebteDness
existing Debt
total
existing Debt 123
319,136,268
325,648,016
321,842,120
340,883,868
350,426,972
334,509,036
341,433,188
343,822,812
298,873,000
275,850,000
256,690,000
253,145,000
227,385,000
147,785,000
85,785,000
68,630,000
40,885,000
24,385,000
24,385,000
-
-
$4,381,500,280
528,402,553.10
518,732,254.38
498,851,170.24
502,133,637.36
494,869,028.92
460,797,094.48
452,515,194.80
438,044,178.44
376,839,137.84
339,655,166.52
307,767,600.00
291,786,050.00
254,375,212.50
164,955,962.50
96,519,812.50
75,676,162.50
45,037,750.00
26,823,500.00
25,604,250.00
-
-
$5,899,385,716.08
pRincipal pRincipal & inteRest
56,568,732
61,646,984
62,417,880
46,676,132
37,583,028
51,785,964
45,331,812
45,387,188
57,307,000
-
-
-
-
-
-
-
-
-
-
-
-
$464,704,720
79,231,728.00
81,481,543.40
79,170,090.20
60,307,448.20
48,880,537.60
61,204,322.20
52,160,872.00
50,036,471.40
59,775,612.00
-
-
-
-
-
-
-
-
-
-
-
-
$572,248,625.00
pRincipal pRincipal & inteRest
91,555,000
98,390,000
100,680,000
103,125,000
105,945,000
108,875,000
112,000,000
115,230,000
133,655,000
134,020,000
137,205,000
140,770,000
145,340,000
110,890,000
102,180,000
101,440,000
95,925,000
79,470,000
36,030,000
37,925,000
-
$2,090,650,000
196,932,282.42
194,869,908.14
192,570,746.26
190,250,862.51
188,011,493.77
185,764,912.53
183,538,793.77
181,323,081.26
193,792,706.26
187,586,218.76
184,232,468.76
181,024,918.76
178,646,662.51
137,716,331.26
123,862,981.26
118,122,506.26
107,834,456.26
86,977,181.26
39,732,487.50
39,916,062.50
-
$3,092,707,062.01
pRincipal pRincipal & inteRest
467,260,000
485,685,000.00
484,940,000.00
490,685,000.00
493,955,000.00
495,170,000.00
498,765,000.00
504,440,000.00
489,835,000.00
409,870,000.00
393,895,000.00
393,915,000.00
372,725,000.00
258,675,000.00
187,965,000.00
170,070,000.00
136,810,000.00
103,855,000.00
60,415,000.00
37,925,000.00
-
$6,936,855,000
804,566,563.52
795,083,705.92
770,592,006.70
752,691,948.07
731,761,060.29
707,766,329.21
688,214,860.57
669,403,731.10
630,407,456.10
527,241,385.28
492,000,068.76
472,810,968.76
433,021,875.01
302,672,293.76
220,382,793.76
193,798,668.76
152,872,206.26
113,800,681.26
65,336,737.50
39,916,062.50
-
$9,564,341,403.09
pRincipal pRincipal & inteRest
ta b l e 8
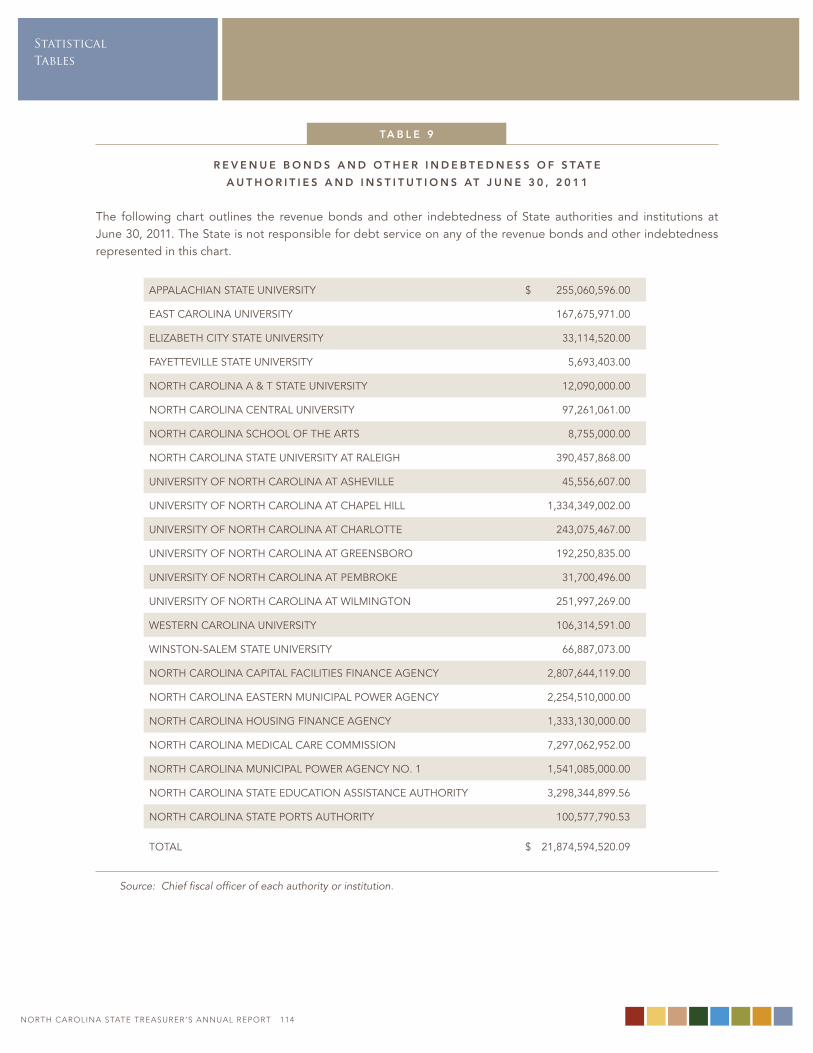
StatisticalTables
noRtH CARoLInA StAtE tREASuRER’S AnnuAL REPoRt 114
R e v e n u e b o n D s a n D o t h e R i n D e b t e D n e s s o f s tat e
a u t h o R i t i e s a n D i n s t i t u t i o n s at J u n e 3 0 , 2 0 1 1
The following chart outlines the revenue bonds and other indebtedness of State authorities and institutions at June 30, 2011. The State is not responsible for debt service on any of the revenue bonds and other indebtedness represented in this chart.
APPAlAChIAN STATe UNIveRSITy $ 255,060,596.00
eAST CARolINA UNIveRSITy 167,675,971.00
elIzAbeTh CITy STATe UNIveRSITy 33,114,520.00
FAyeTTevIlle STATe UNIveRSITy 5,693,403.00
NoRTh CARolINA A & T STATe UNIveRSITy 12,090,000.00
NoRTh CARolINA CeNTRAl UNIveRSITy 97,261,061.00
NoRTh CARolINA SChool oF The ARTS 8,755,000.00
NoRTh CARolINA STATe UNIveRSITy AT RAleIgh 390,457,868.00
UNIveRSITy oF NoRTh CARolINA AT AShevIlle 45,556,607.00
UNIveRSITy oF NoRTh CARolINA AT ChAPel hIll 1,334,349,002.00
UNIveRSITy oF NoRTh CARolINA AT ChARloTTe 243,075,467.00
UNIveRSITy oF NoRTh CARolINA AT gReeNSboRo 192,250,835.00
UNIveRSITy oF NoRTh CARolINA AT PembRoKe 31,700,496.00
UNIveRSITy oF NoRTh CARolINA AT wIlmINgToN 251,997,269.00
weSTeRN CARolINA UNIveRSITy 106,314,591.00
wINSToN-SAlem STATe UNIveRSITy 66,887,073.00
NoRTh CARolINA CAPITAl FACIlITIeS FINANCe AgeNCy 2,807,644,119.00
NoRTh CARolINA eASTeRN mUNICIPAl PoweR AgeNCy 2,254,510,000.00
NoRTh CARolINA hoUSINg FINANCe AgeNCy 1,333,130,000.00
NoRTh CARolINA meDICAl CARe CommISSIoN 7,297,062,952.00
NoRTh CARolINA mUNICIPAl PoweR AgeNCy No. 1 1,541,085,000.00
NoRTh CARolINA STATe eDUCATIoN ASSISTANCe AUThoRITy 3,298,344,899.56
NoRTh CARolINA STATe PoRTS AUThoRITy 100,577,790.53
ToTAl $ 21,874,594,520.09
Source: Chief fiscal officer of each authority or institution.
ta b l e 9
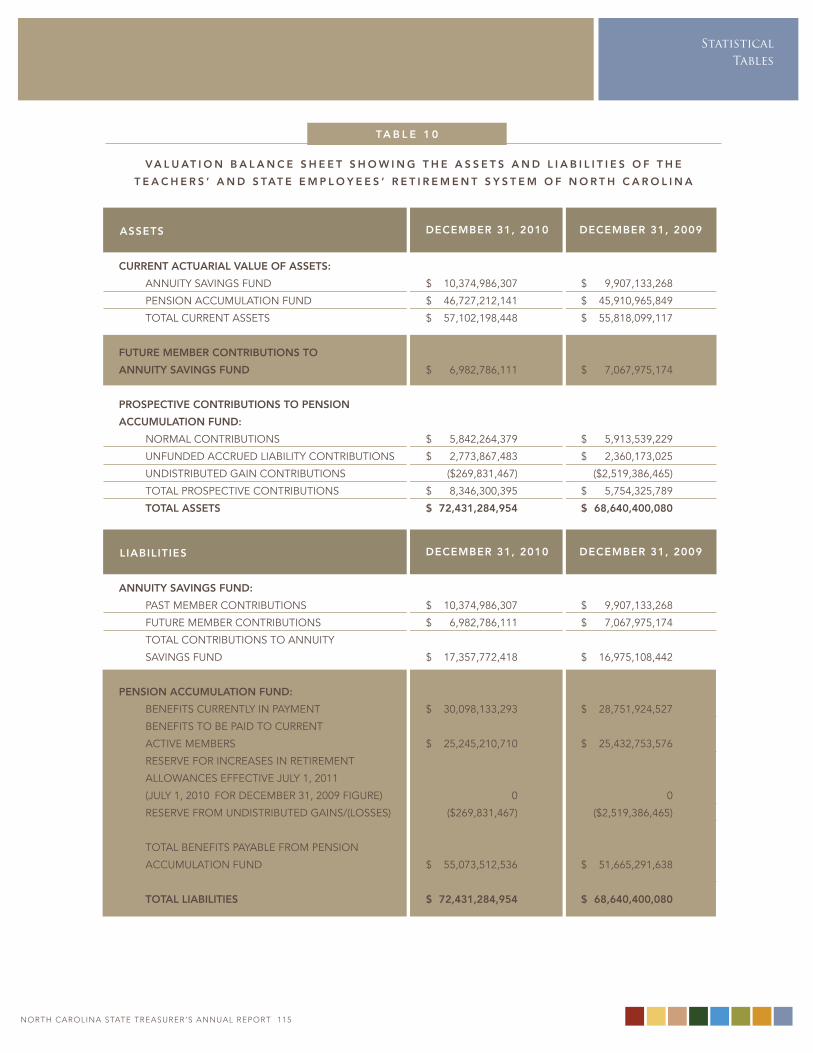
noRtH CARoLInA StAtE tREASuRER’S AnnuAL REPoRt 114
StatisticalTables
noRtH CARoLInA StAtE tREASuRER’S AnnuAL REPoRt 115
va l u at i o n b a l a n c e s h e e t s h o w i n g t h e a s s e t s a n D l i a b i l i t i e s o f t h e
t e a c h e R s ’ a n D s tat e e m p l o y e e s ’ R e t i R e m e n t s y s t e m o f n o R t h c a R o l i n a
assets DecembeR 31, 2009
DecembeR 31, 2009
DecembeR 31, 2010
DecembeR 31, 2010
cuRRent actuaRial value of assets:
ANNUITy SAvINgS FUND
PeNSIoN ACCUmUlATIoN FUND
ToTAl CURReNT ASSeTS
futuRe membeR contRibutions to
annuity savings funD
pRospective contRibutions to pension
accumulation funD:
NoRmAl CoNTRIbUTIoNS
UNFUNDeD ACCRUeD lIAbIlITy CoNTRIbUTIoNS
UNDISTRIbUTeD gAIN CoNTRIbUTIoNS
ToTAl PRoSPeCTIve CoNTRIbUTIoNS
total assets
annuity savings funD:
PAST membeR CoNTRIbUTIoNS
FUTURe membeR CoNTRIbUTIoNS
ToTAl CoNTRIbUTIoNS To ANNUITy
SAvINgS FUND
pension accumulation funD:
beNeFITS CURReNTly IN PAymeNT
beNeFITS To be PAID To CURReNT
ACTIve membeRS
ReSeRve FoR INCReASeS IN ReTIRemeNT
AllowANCeS eFFeCTIve JUly 1, 2011
(JUly 1, 2010 FoR DeCembeR 31, 2009 FIgURe)
ReSeRve FRom UNDISTRIbUTeD gAINS/(loSSeS)
ToTAl beNeFITS PAyAble FRom PeNSIoN
ACCUmUlATIoN FUND
total liabilities
$ 10,374,986,307
$ 46,727,212,141
$ 57,102,198,448
$ 6,982,786,111
$ 5,842,264,379
$ 2,773,867,483
($269,831,467)
$ 8,346,300,395
$ 72,431,284,954
$ 10,374,986,307
$ 6,982,786,111
$ 17,357,772,418
$ 30,098,133,293
$ 25,245,210,710
0
($269,831,467)
$ 55,073,512,536
$ 72,431,284,954
$ 9,907,133,268
$ 45,910,965,849
$ 55,818,099,117
$ 7,067,975,174
$ 5,913,539,229
$ 2,360,173,025
($2,519,386,465)
$ 5,754,325,789
$ 68,640,400,080
$ 9,907,133,268
$ 7,067,975,174
$ 16,975,108,442
$ 28,751,924,527
$ 25,432,753,576
0
($2,519,386,465)
$ 51,665,291,638
$ 68,640,400,080
liabilities
ta b l e 1 0
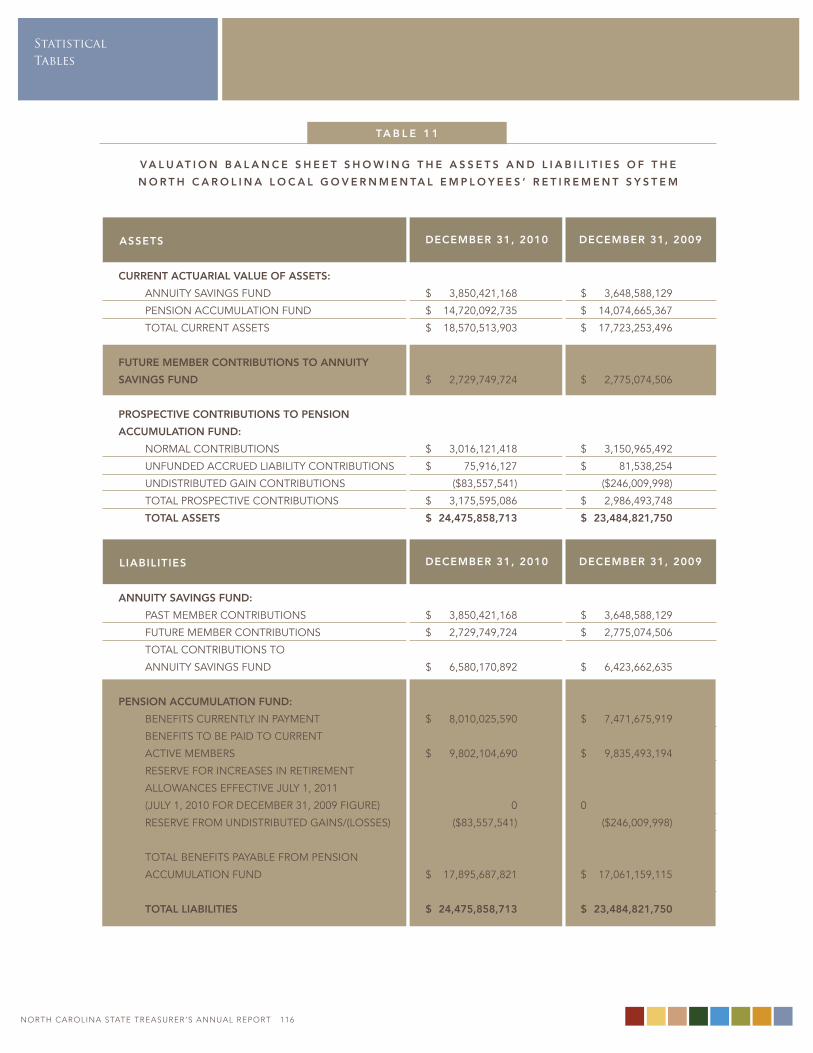
StatisticalTables
noRtH CARoLInA StAtE tREASuRER’S AnnuAL REPoRt 116
va l u at i o n b a l a n c e s h e e t s h o w i n g t h e a s s e t s a n D l i a b i l i t i e s o f t h e
n o R t h c a R o l i n a l o c a l g o v e R n m e n ta l e m p l o y e e s ’ R e t i R e m e n t s y s t e m
assets DecembeR 31, 2009
DecembeR 31, 2009
DecembeR 31, 2010
DecembeR 31, 2010
cuRRent actuaRial value of assets:
ANNUITy SAvINgS FUND
PeNSIoN ACCUmUlATIoN FUND
ToTAl CURReNT ASSeTS
futuRe membeR contRibutions to annuity
savings funD
pRospective contRibutions to pension
accumulation funD:
NoRmAl CoNTRIbUTIoNS
UNFUNDeD ACCRUeD lIAbIlITy CoNTRIbUTIoNS
UNDISTRIbUTeD gAIN CoNTRIbUTIoNS
ToTAl PRoSPeCTIve CoNTRIbUTIoNS
total assets
annuity savings funD:
PAST membeR CoNTRIbUTIoNS
FUTURe membeR CoNTRIbUTIoNS
ToTAl CoNTRIbUTIoNS To
ANNUITy SAvINgS FUND
pension accumulation funD:
beNeFITS CURReNTly IN PAymeNT
beNeFITS To be PAID To CURReNT
ACTIve membeRS
ReSeRve FoR INCReASeS IN ReTIRemeNT
AllowANCeS eFFeCTIve JUly 1, 2011
(JUly 1, 2010 FoR DeCembeR 31, 2009 FIgURe)
ReSeRve FRom UNDISTRIbUTeD gAINS/(loSSeS)
ToTAl beNeFITS PAyAble FRom PeNSIoN
ACCUmUlATIoN FUND
total liabilities
$ 3,850,421,168
$ 14,720,092,735
$ 18,570,513,903
$ 2,729,749,724
$ 3,016,121,418
$ 75,916,127
($83,557,541)
$ 3,175,595,086
$ 24,475,858,713
$ 3,850,421,168
$ 2,729,749,724
$ 6,580,170,892
$ 8,010,025,590
$ 9,802,104,690
0
($83,557,541)
$ 17,895,687,821
$ 24,475,858,713
$ 3,648,588,129
$ 14,074,665,367
$ 17,723,253,496
$ 2,775,074,506
$ 3,150,965,492
$ 81,538,254
($246,009,998)
$ 2,986,493,748
$ 23,484,821,750
$ 3,648,588,129
$ 2,775,074,506
$ 6,423,662,635
$ 7,471,675,919
$ 9,835,493,194
0
($246,009,998)
$ 17,061,159,115
$ 23,484,821,750
liabilities
ta b l e 1 1
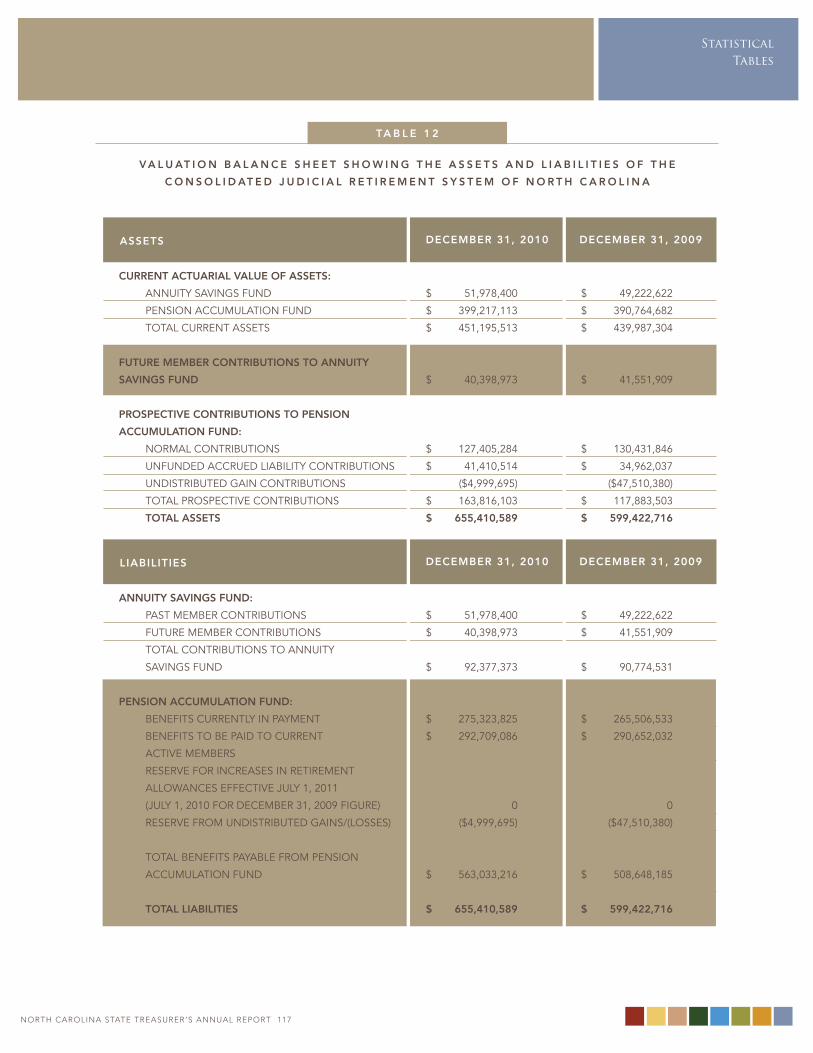
noRtH CARoLInA StAtE tREASuRER’S AnnuAL REPoRt 116
StatisticalTables
noRtH CARoLInA StAtE tREASuRER’S AnnuAL REPoRt 117
va l u at i o n b a l a n c e s h e e t s h o w i n g t h e a s s e t s a n D l i a b i l i t i e s o f t h e
c o n s o l i D at e D J u D i c i a l R e t i R e m e n t s y s t e m o f n o R t h c a R o l i n a
assets DecembeR 31, 2009
DecembeR 31, 2009
DecembeR 31, 2010
DecembeR 31, 2010
cuRRent actuaRial value of assets:
ANNUITy SAvINgS FUND
PeNSIoN ACCUmUlATIoN FUND
ToTAl CURReNT ASSeTS
futuRe membeR contRibutions to annuity
savings funD
pRospective contRibutions to pension
accumulation funD:
NoRmAl CoNTRIbUTIoNS
UNFUNDeD ACCRUeD lIAbIlITy CoNTRIbUTIoNS
UNDISTRIbUTeD gAIN CoNTRIbUTIoNS
ToTAl PRoSPeCTIve CoNTRIbUTIoNS
total assets
annuity savings funD:
PAST membeR CoNTRIbUTIoNS
FUTURe membeR CoNTRIbUTIoNS
ToTAl CoNTRIbUTIoNS To ANNUITy
SAvINgS FUND
pension accumulation funD:
beNeFITS CURReNTly IN PAymeNT
beNeFITS To be PAID To CURReNT
ACTIve membeRS
ReSeRve FoR INCReASeS IN ReTIRemeNT
AllowANCeS eFFeCTIve JUly 1, 2011
(JUly 1, 2010 FoR DeCembeR 31, 2009 FIgURe)
ReSeRve FRom UNDISTRIbUTeD gAINS/(loSSeS)
ToTAl beNeFITS PAyAble FRom PeNSIoN
ACCUmUlATIoN FUND
total liabilities
$ 51,978,400
$ 399,217,113
$ 451,195,513
$ 40,398,973
$ 127,405,284
$ 41,410,514
($4,999,695)
$ 163,816,103
$ 655,410,589
$ 51,978,400
$ 40,398,973
$ 92,377,373
$ 275,323,825
$ 292,709,086
0
($4,999,695)
$ 563,033,216
$ 655,410,589
$ 49,222,622
$ 390,764,682
$ 439,987,304
$ 41,551,909
$ 130,431,846
$ 34,962,037
($47,510,380)
$ 117,883,503
$ 599,422,716
$ 49,222,622
$ 41,551,909
$ 90,774,531
$ 265,506,533
$ 290,652,032
0
($47,510,380)
$ 508,648,185
$ 599,422,716
liabilities
ta b l e 1 2
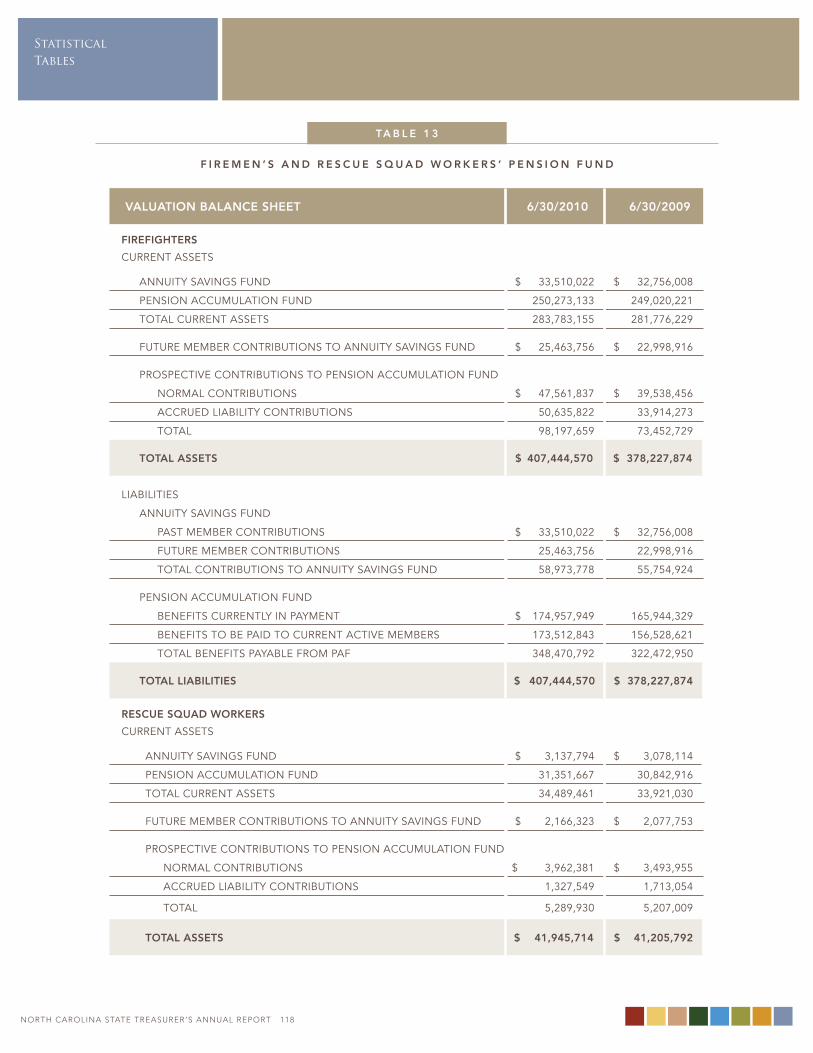
StatisticalTables
noRtH CARoLInA StAtE tREASuRER’S AnnuAL REPoRt 118
ta b l e 1 3
valuation balance sheet 6/30/2010 6/30/2009
fiRefighteRs
CURReNT ASSeTS
ANNUITy SAvINgS FUND $ 33,510,022 $ 32,756,008
PeNSIoN ACCUmUlATIoN FUND 250,273,133 249,020,221
ToTAl CURReNT ASSeTS 283,783,155 281,776,229
FUTURe membeR CoNTRIbUTIoNS To ANNUITy SAvINgS FUND $ 25,463,756 $ 22,998,916
PRoSPeCTIve CoNTRIbUTIoNS To PeNSIoN ACCUmUlATIoN FUND
NoRmAl CoNTRIbUTIoNS $ 47,561,837 $ 39,538,456
ACCRUeD lIAbIlITy CoNTRIbUTIoNS 50,635,822 33,914,273
ToTAl 98,197,659 73,452,729
total assets $ 407,444,570 $ 378,227,874
lIAbIlITIeS
ANNUITy SAvINgS FUND
PAST membeR CoNTRIbUTIoNS $ 33,510,022 $ 32,756,008
FUTURe membeR CoNTRIbUTIoNS 25,463,756 22,998,916
ToTAl CoNTRIbUTIoNS To ANNUITy SAvINgS FUND 58,973,778 55,754,924
PeNSIoN ACCUmUlATIoN FUND
beNeFITS CURReNTly IN PAymeNT $ 174,957,949 165,944,329
beNeFITS To be PAID To CURReNT ACTIve membeRS 173,512,843 156,528,621
ToTAl beNeFITS PAyAble FRom PAF 348,470,792 322,472,950
total liabilities $ 407,444,570 $ 378,227,874
Rescue squaD woRKeRs
CURReNT ASSeTS
ANNUITy SAvINgS FUND $ 3,137,794 $ 3,078,114
PeNSIoN ACCUmUlATIoN FUND 31,351,667 30,842,916
ToTAl CURReNT ASSeTS 34,489,461 33,921,030
FUTURe membeR CoNTRIbUTIoNS To ANNUITy SAvINgS FUND $ 2,166,323 $ 2,077,753
PRoSPeCTIve CoNTRIbUTIoNS To PeNSIoN ACCUmUlATIoN FUND
NoRmAl CoNTRIbUTIoNS $ 3,962,381 $ 3,493,955
ACCRUeD lIAbIlITy CoNTRIbUTIoNS 1,327,549 1,713,054
ToTAl 5,289,930 5,207,009
total assets $ 41,945,714 $ 41,205,792
f i R e m e n ’ s a n D R e s c u e s q u a D w o R K e R s ’ p e n s i o n f u n D
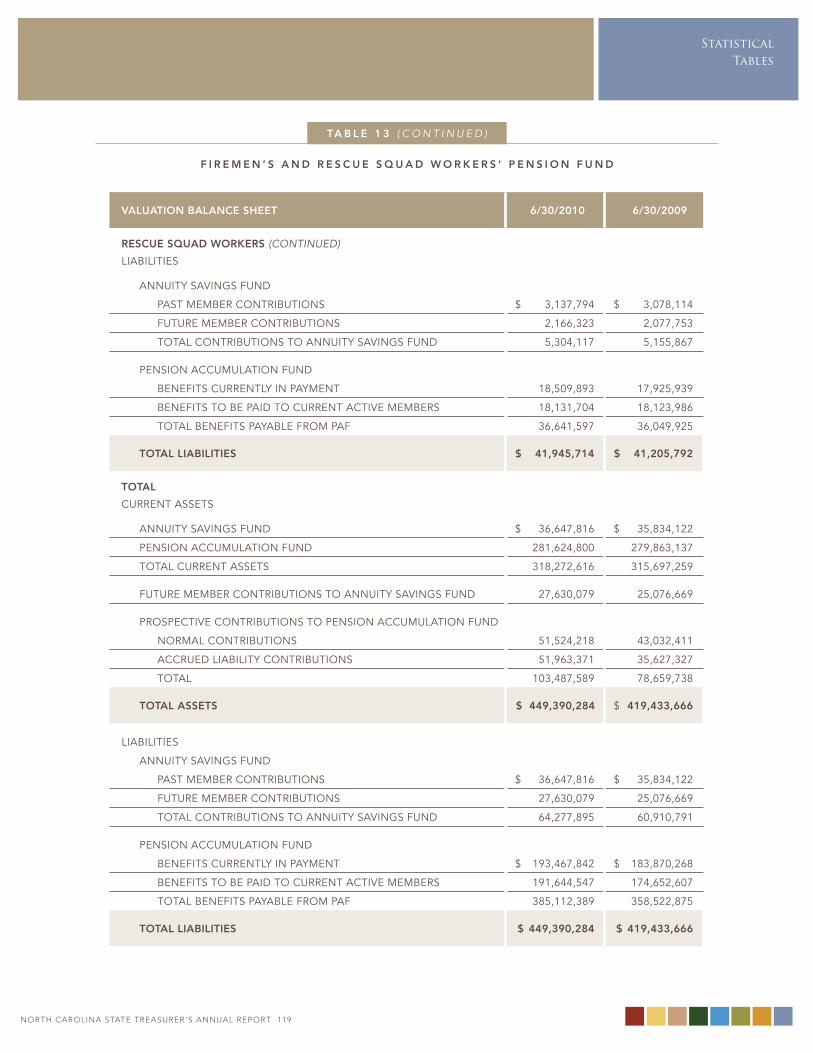
noRtH CARoLInA StAtE tREASuRER’S AnnuAL REPoRt 118
StatisticalTables
noRtH CARoLInA StAtE tREASuRER’S AnnuAL REPoRt 119
ta b l e 1 3 ( C O N T I N U E D )
f i R e m e n ’ s a n D R e s c u e s q u a D w o R K e R s ’ p e n s i o n f u n D
valuation balance sheet 6/30/2010 6/30/2009
Rescue squaD woRKeRs (CONTINUED)
lIAbIlITIeS
ANNUITy SAvINgS FUND
PAST membeR CoNTRIbUTIoNS $ 3,137,794 $ 3,078,114
FUTURe membeR CoNTRIbUTIoNS 2,166,323 2,077,753
ToTAl CoNTRIbUTIoNS To ANNUITy SAvINgS FUND 5,304,117 5,155,867
PeNSIoN ACCUmUlATIoN FUND
beNeFITS CURReNTly IN PAymeNT 18,509,893 17,925,939
beNeFITS To be PAID To CURReNT ACTIve membeRS 18,131,704 18,123,986
ToTAl beNeFITS PAyAble FRom PAF 36,641,597 36,049,925
total liabilities $ 41,945,714 $ 41,205,792
total
CURReNT ASSeTS
ANNUITy SAvINgS FUND $ 36,647,816 $ 35,834,122
PeNSIoN ACCUmUlATIoN FUND 281,624,800 279,863,137
ToTAl CURReNT ASSeTS 318,272,616 315,697,259
FUTURe membeR CoNTRIbUTIoNS To ANNUITy SAvINgS FUND 27,630,079 25,076,669
PRoSPeCTIve CoNTRIbUTIoNS To PeNSIoN ACCUmUlATIoN FUND
NoRmAl CoNTRIbUTIoNS 51,524,218 43,032,411
ACCRUeD lIAbIlITy CoNTRIbUTIoNS 51,963,371 35,627,327
ToTAl 103,487,589 78,659,738
total assets $ 449,390,284 $ 419,433,666
lIAbIlITIeS
ANNUITy SAvINgS FUND
PAST membeR CoNTRIbUTIoNS $ 36,647,816 $ 35,834,122
FUTURe membeR CoNTRIbUTIoNS 27,630,079 25,076,669
ToTAl CoNTRIbUTIoNS To ANNUITy SAvINgS FUND 64,277,895 60,910,791
PeNSIoN ACCUmUlATIoN FUND
beNeFITS CURReNTly IN PAymeNT $ 193,467,842 $ 183,870,268
beNeFITS To be PAID To CURReNT ACTIve membeRS 191,644,547 174,652,607
ToTAl beNeFITS PAyAble FRom PAF 385,112,389 358,522,875
total liabilities $ 449,390,284 $ 419,433,666