Embed Size (px)
Citation preview
Northern Inland Business
Energy Assessment
Saving Energy Costs for
Businesses
Full Report
i
Northern Inland Business Energy Audit
1. Executive Summary
Although energy costs were not a large proportion of total business operating costs for the
businesses surveyed in this study (ranging from 1-15%), energy costs (particularly gas and
electricity) amounted to substantial costs in many businesses (range $200 to $139,000 per
month).
Methods for reducing these energy costs and improving business profitability fall into two
main categories:
1. Undertaking activities which improve the efficiency of current operations and
equipment. Some of these activities have zero cost, while others (e.g. upgrading
equipment) may be quite expensive;
2. Generating energy on-site through the use of renewable energy technologies such as
solar, wind and biofuels. These technologies all involve considerable capital outlays
(from $10-150,000 for small solar installations to over $1M for biogas production
and capture facilities).
For business in our region, the range of energy efficiency options is large, and the economics
of adopting various measures must be assessed on a case-by-case basis. This report
provides insights into measures which are cost-effective in various situations, and the
financial results achieved by businesses in our Northern Inland region.
As far as small scale on-site renewable energy is concerned, installing solar PV systems are
the most economically feasible solution for most businesses, though bioenergy may also be
a good option for businesses producing large quantities of organic waste (or who can access
that waste cheaply).
On-site solar installations typically had a payback period of between 2 and 7 years. Some
farms are now installing solar pumps for crop irrigation and livestock watering. These
typically have a longer payback period (7-8 years), unless the electricity can be used for
other activities on the farm, which reduces the payback period.
ii
Small-scale wind does not yet appear to compete with solar or bioenergy options, though
large-scale wind is now economically comparable to fossil fuel-based electricity generation
under the current system where LCGs of around 7c/kWh are payable to large scale
renewable generators.
Small scale on-site renewable energy generation is most cost effective where the majority of
energy is used on-site in the business to offset the costs of bringing in energy from external
sources such as the electricity or gas grid. There is currently little benefit in exporting large
amounts of surplus electricity to the grid as it only attracts a feed-in tariff of 0-8 c/kWh (with
the 60c/kWh tariff program due to end on 31 December 2016). Selling surplus electricity via
the grid to other users is also problematic as grid operators charge up to 17 c/kWh to use
the grid.
Many large scale renewable energy options are fast-approaching cost competitiveness with
mainstream fossil fuel (coal and gas) based systems. We are already seeing the construction
of several large solar and wind farms in our region. These systems are able to use the grid
and compete with fossil fuels due to LCG payments and the ability to take advantage of
higher wholesale market prices during peak demand periods.
For large scale renewable electricity generators, connection to the grid is important. Some
parts of the grid may not be able to handle the large extra energy inputs, meaning the
construction of costly transmission lines to access higher voltage lines.
With the advent of several large renewable electricity producers in the Glen Innes/Inverell
area, TransGrid are examining the construction of a Renewable Energy Hub to reduce the
costs of connection to the high voltage lines which run north-south from NSW to Qld.
iii
Contents 1. Executive Summary .......................................................................................................................... i
2. Background ..................................................................................................................................... 1
3. Methods and Objective ................................................................................................................... 1
4. Cutting Business Energy Costs ........................................................................................................ 3
5. Economic Comparison of ‘On-Grid’ Energy Sources ..................................................................... 28
Electricity Costs ................................................................................................................................. 28
Gas Costs ........................................................................................................................................... 38
6. Economic assessment of renewable energy sources for on-grid delivered retail energy ............ 40
On-grid renewables in our region ..................................................................................................... 40
Green power ..................................................................................................................................... 41
Costs of large-scale on-grid renewable energy sources ................................................................... 42
7. Economic Assessment of Energy Efficiency Initiatives and Behind the Meter Activities ............. 45
Energy Efficiency Initiatives .............................................................................................................. 46
Renewable Energy Initiatives for Businesses .................................................................................... 49
Solar Energy .................................................................................................................................. 49
Solar Pumping on Farms ............................................................................................................... 52
Wind Energy .................................................................................................................................. 56
Biomass Energy ............................................................................................................................. 59
8. Economic Assessment of Additional Energy Infrastructure Required to Deliver Energy from
Renewable Sources ............................................................................................................................... 64
Smart Grids ................................................................................................................................... 64
9. Funding Your Project - Financing and Grants/Programs .............................................................. 66
10. What About Community Owned Energy Projects? ................................................................... 68
11. Sources ...................................................................................................................................... 78
Figures Figure 1. Bills for Standard Versus Negotiated Contract Electricity Plans ............................................ 29

iv
Figure 2. Network Charges as a Proportion of Total Electricity Cost – Northern Inland Region .......... 30
Figure 3. Electricity Price Comparison from EnergyWatch Plans (businesses using less than 100,000
kWh/year = small user). ........................................................................................................................ 31
Figure 4. Negotiated Electricity Contract Plan Prices (businesses using more than 100,000 kWh/year)
versus Standard Online Plan (businesses using less than 100,000 kWh/year) ..................................... 33
Figure 5. Effect of Energy Reduction Activities on Monthly Electricity Cost (Tamworth Shopping Mall)
.............................................................................................................................................................. 35
Figure 6. Time of Electricity Use For Different Northern Inland Businesses......................................... 36
Figure 7. Energy Costs Relative to Total Operating Costs ..................................................................... 37
Figure 8. Gas Prices – Northern Inland Region ..................................................................................... 38
Figure 9. Simplified Explanation of ‘In Front of’ and ‘Behind’ the Meter ............................................. 40
Figure 10. Things to Consider Before Installing a Solar System (Clean Energy Council 2014, Moyse
2013) ..................................................................................................................................................... 50
Figure 11. Solar System Payback Periods (Years) ................................................................................. 51
Figure 12. Solar System Installation Prices in $/W ............................................................................... 52
Figure 13. A Solar Pumping System (NSW Farmers 2015) .................................................................... 53
Figure 14. REC (=STC) Income from a 6KW Wind System* ................................................................... 59
Figure 15. Potential Annual Biomass Volumes for Northern Inland Region ......................................... 60
Figure 16. Biogas Quantity Produced From Different Feedstocks (Keskar 2014) ................................. 61
Figure 17. Biomass System Installation Prices in $/W (Compared with Behind the Meter Solar and
Wind) ..................................................................................................................................................... 62
Figure 18. Cost of Energy for Various Energy Systems (excludes any capital cost considerations) ..... 63
Figure 19. Funding Decision Chart ........................................................................................................ 67
Figure 20. Steps for a Successful Community Energy Project ............................................................... 70
Tables Table 1. Options For Reducing Business Energy Costs (adapted from Dee 2015) .................................. 4
Table 2. Standard Electricity Retail Plan Versus Negotiated Contract for a Business .......................... 32
Table 3. Estimated Retail Prices of Renewable Energy Sources (AEMO 2015, BREE 2013, IRENA 2015,
Productivity Commission 2011) ............................................................................................................ 44
Table 4. Estimated Payback Periods for Energy Efficiency Investments in Large Commercial Buildings
(Department of Climate Change and Energy Efficiency 2012). ............................................................ 47
Table 5. Estimated Payback Periods for Energy Efficiency Investments in Small to Medium Enterprise
Buildings (Department of Climate Change and Energy Efficiency 2012) .............................................. 48
Table 6. Pros and Cons of Solar Pumping on Farms.............................................................................. 55
Table 7. Wind Versus Solar Considerations .......................................................................................... 57
Table 8. Pros and Cons of Community Energy Projects ........................................................................ 68
v
Glossary HVAC = Heating, ventilation and air conditioning
LCG = Large scale renewable energy certificate (a credit payment made to large scale
renewable energy generators)
LGA = Local government area
kVA = A thousand volt amps (used to levy peak demand charges for large electricity users)
kWh = Kilowatt hours
LED = Light emitting diode
LPG = Liquid petroleum gas
MJ = Megajoules (used to measure gas use and charges)
RET = Renewable Energy Target (Australian Government policy to supply a proportion of
energy from renewable sources)
SNG = Simulated natural gas
STC = Small Scale Technology Certificate (a credit payment made to small scale renewable
energy generators)
TLPG = Tempered liquid petroleum gas
TOU = Time of use (i.e. peak, shoulder and off-peak electricity use periods)
1
2. Background
Energy is an important business cost which impacts upon competitiveness. This investigation has been conducted to better understand these costs and how they might be reduced as a step towards improving business competitiveness and regional economic development in the Northern Inland Region of NSW.
The study was resourced by the NSW Government via the Department of Industry. The research was conducted by Regional Development Australia Northern Inland (RDANI).
3. Methods and Objective Information in this report has been complied via a desktop literature review, a survey of businesses in the Northern Inland region, and information provided by regional stakeholders who have an interest in business and economic development, energy efficiency and renewable energy. These include:
Adam Blakester – Starfish Initiatives (Armidale);
Gavin Ashley – Moreland Energy Foundation (Melbourne);
Doug Truman – Business Energy Advisor (Tamworth);
Darren Keegan - NSW Department of Industry (Tamworth);
Peter Sniekers - NSW Department of Industry (Armidale);
Nathan Gilbody – Roberts & Morrow Accountants (Armidale);
John Clements – Bindaree Beef (Inverell);
Bruce Read – The Atrium Shopping Mall (Tamworth)
John Bishton – IGA (Bingara)
Enis Rudzic – UNE (Armidale)
Elaine Dickson – Baiada (Sydney)
David Wallis – Manuka Chaff (Quirindi)
Phil Wheaton – Armidale Bowling Club (Armidale)
Lauren Brassel – Elders (Moree)
Carol Hargrave, David Boundy – SuperAir (Armidale)
Kylie Cork – Cork Constructions (Tamworth)
Chris Sheppard – Chris Sheppard Electrical (Armidale)
Sally Huggins – Aussie Kids of Moree (Moree)
Laurie Knight – Phoenix Centre (Armidale)
Ross Burgess – Rossbuild Constructions (Armidale)
James Goodwin – Goodcom Communications (Walcha)
Rita Brissett – PLC (Armidale)
2
Ian Mitchell and Sharyn Kelly - Phoenix Foundry (Uralla)
Graeme Hollis – NEGS (Armidale)
Lauren Zell – NSW Office of Environment & Heritage (Armidale)
Malcolm Donnelly – Glen Innes Shire Council (Glen Innes)
Pat Bradley – The Armidale School (Armidale)
Terri Sun – Business Consultant (Gold Coast)
Lachlan Teys and Allan McGrath – TEYS (Tamworth)
The work is aimed at condensing the vast amount of often confusing and voluminous information regarding business energy use and energy efficiency funding options into a set of simple checklists, facts, illustrations and step by step processes which businesses of different sizes in different economic sectors of our local economy can follow to make simple and rapid decisions to reduce their energy costs.
This document represents a collation of the background research from which the simpler set of summary information has been compiled (see summary report).

3
4. Cutting Business Energy Costs
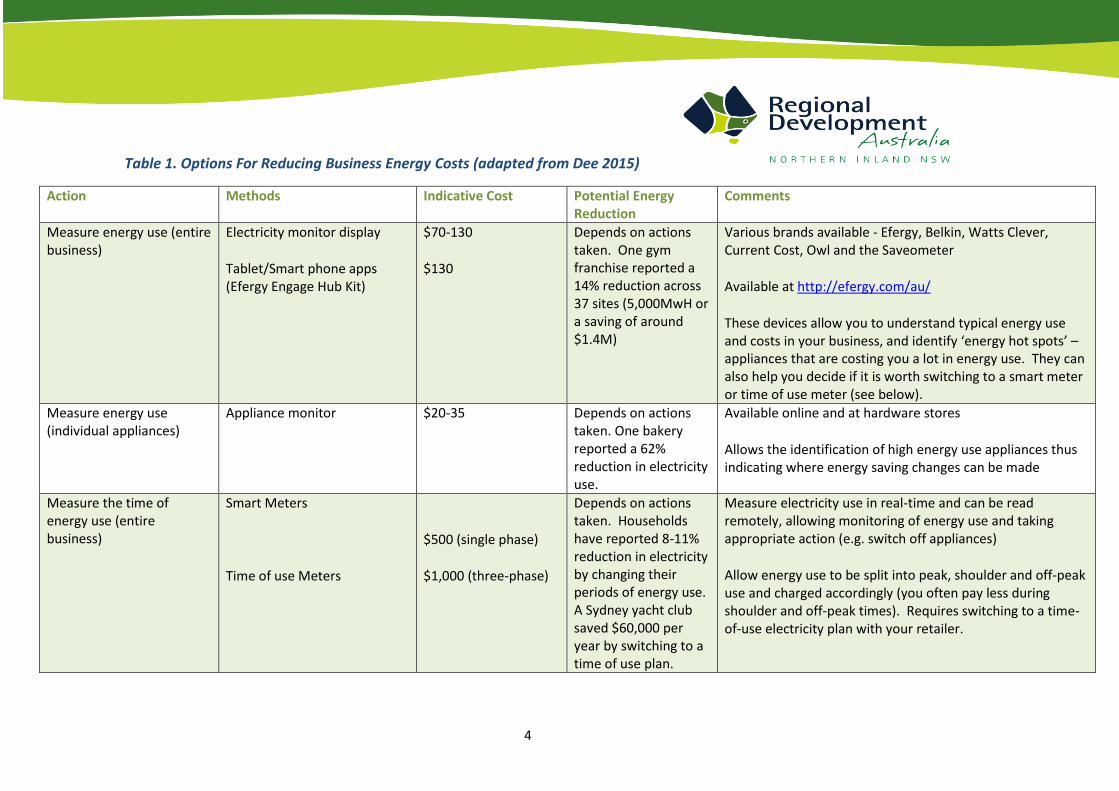
Table 1 below provides a comprehensive overview of the steps businesses can take to reduce their energy use and costs, as well as providing an indication of the level of energy cuts which can be achieved.
Note that it is important to check that penalties do not apply in your electricity retail contract for reducing your usage below a certain level. Typically, these do not apply to standard off-the-shelf contracts, but may be included in the contracts negotiated by large users (>100,000 kWh per annum who are on contestable large market contracts) – see section 5 below.
4
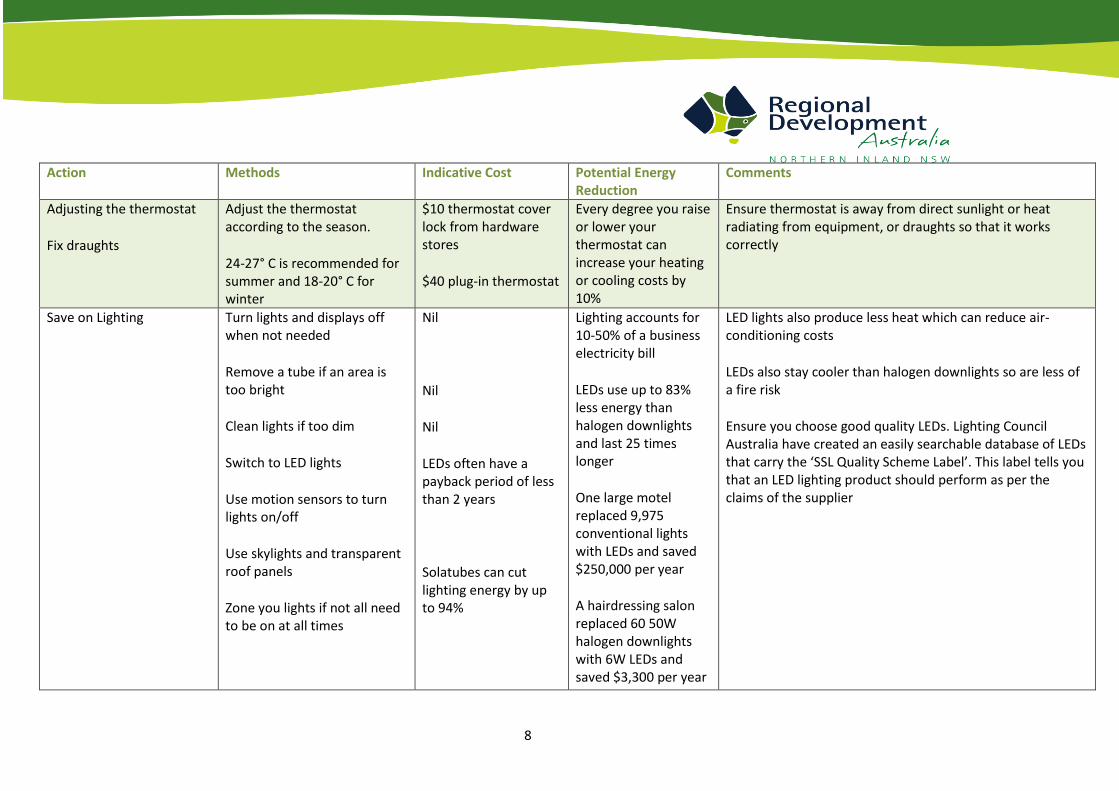
Table 1. Options For Reducing Business Energy Costs (adapted from Dee 2015)
Action Methods Indicative Cost Potential Energy Reduction
Comments
Measure energy use (entire business)
Electricity monitor display
Tablet/Smart phone apps (Efergy Engage Hub Kit)
$70-130
$130
Depends on actions taken. One gym franchise reported a 14% reduction across 37 sites (5,000MwH or a saving of around $1.4M)
Various brands available - Efergy, Belkin, Watts Clever, Current Cost, Owl and the Saveometer
Available at http://efergy.com/au/
These devices allow you to understand typical energy use and costs in your business, and identify ‘energy hot spots’ – appliances that are costing you a lot in energy use. They can also help you decide if it is worth switching to a smart meter or time of use meter (see below).
Measure energy use (individual appliances)
Appliance monitor $20-35 Depends on actions taken. One bakery reported a 62% reduction in electricity use.
Available online and at hardware stores
Allows the identification of high energy use appliances thus indicating where energy saving changes can be made
Measure the time of energy use (entire business)
Smart Meters
Time of use Meters
$500 (single phase)
$1,000 (three-phase)
Depends on actions taken. Households have reported 8-11% reduction in electricity by changing their periods of energy use. A Sydney yacht club saved $60,000 per year by switching to a time of use plan.
Measure electricity use in real-time and can be read remotely, allowing monitoring of energy use and taking appropriate action (e.g. switch off appliances)
Allow energy use to be split into peak, shoulder and off-peak use and charged accordingly (you often pay less during shoulder and off-peak times). Requires switching to a time-of-use electricity plan with your retailer.
5
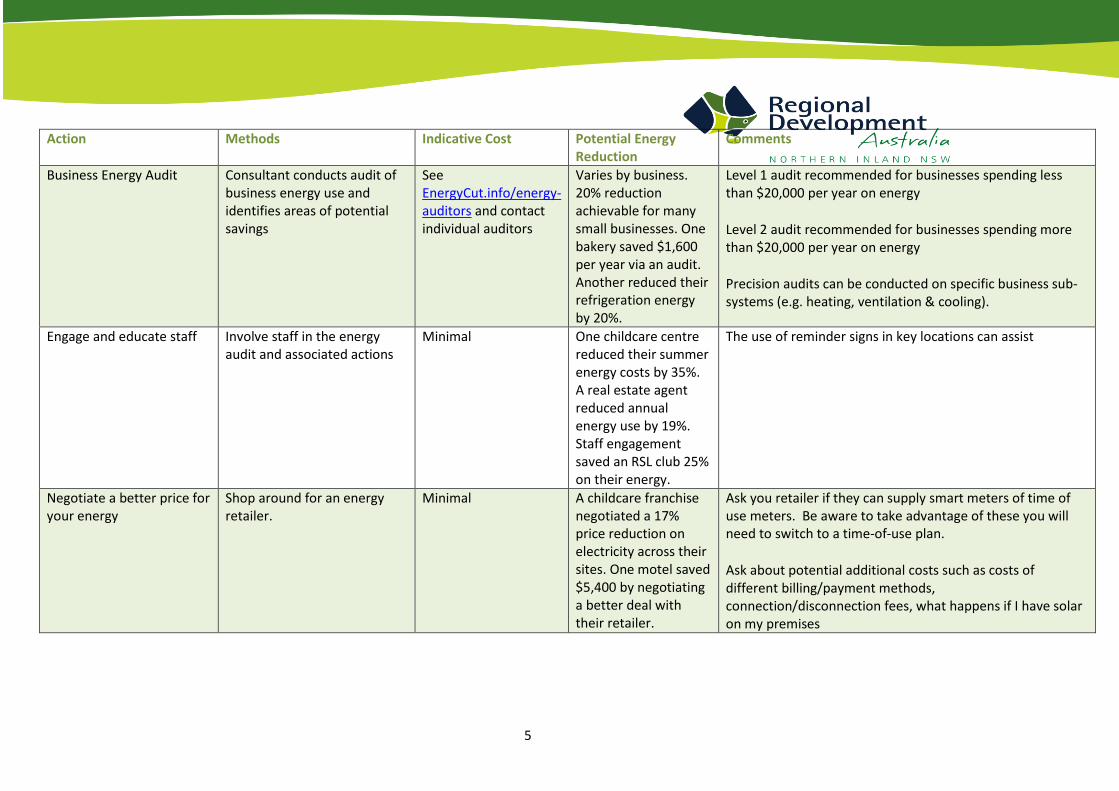
Action Methods Indicative Cost Potential Energy Reduction
Comments
Business Energy Audit Consultant conducts audit of business energy use and identifies areas of potential savings
See EnergyCut.info/energy-auditors and contact individual auditors
Varies by business. 20% reduction achievable for many small businesses. One bakery saved $1,600 per year via an audit. Another reduced their refrigeration energy by 20%.
Level 1 audit recommended for businesses spending less than $20,000 per year on energy
Level 2 audit recommended for businesses spending more than $20,000 per year on energy
Precision audits can be conducted on specific business sub-systems (e.g. heating, ventilation & cooling).
Engage and educate staff Involve staff in the energy audit and associated actions
Minimal One childcare centre reduced their summer energy costs by 35%. A real estate agent reduced annual energy use by 19%. Staff engagement saved an RSL club 25% on their energy.
The use of reminder signs in key locations can assist
Negotiate a better price for your energy
Shop around for an energy retailer.
Minimal A childcare franchise negotiated a 17% price reduction on electricity across their sites. One motel saved $5,400 by negotiating a better deal with their retailer.
Ask you retailer if they can supply smart meters of time of use meters. Be aware to take advantage of these you will need to switch to a time-of-use plan.
Ask about potential additional costs such as costs of different billing/payment methods, connection/disconnection fees, what happens if I have solar on my premises

6
Action Methods Indicative Cost Potential Energy Reduction
Comments
Power Factor Correction
Power factor correction units cost around $30-60 per kVAr (kilovoltamperes reactive), plus install costs of $2-10K depending in site factors
Peak penalty is between $3-14 per kVA per month in our area1
Estimated in 2009 poor power factors cost the community in the Essential Energy supply area $13M due to reactive power losses
Installation of power correction factor equipment usually pays for itself in 1-2 years2
Does not reduce energy use, but reduces the peak demand charge. One country club saved $3,500 per year.
Businesses can be penalised by the electricity distributor (Essential Energy) for low power factors (i.e. poor electrical efficiency) by having to pay a peak load tariff (this load is measured in kilovoltamperes - kVA). Many large industrial businesses have equipment which produce additional inductive loads (often called reactive power – power which is not doing ‘real work’). Reactive power (measured as kVAr) is the extra power that magnetic equipment (transformers, motors etc.) need to produce magnetizing flux over and above their working power requirement. This extra power is called inductive load. Reactive power causes low power factors (= inefficient use of power), which increases the apparent power (measured in kVA) that is being supplied to the business. Some larger businesses may pay a capacity charge - an extra charge for the peak demand they use each month - regardless of how long that peak occurs for. For some businesses, it can be the largest cost on their electricity bill. This is charged by the energy distributor, not the energy retailer to reflect the size of the electricity line they must supply to meet peak loads. If a business has a low power factor (i.e. the efficiency of their electrical equipment is poor) a higher apparent supply must be drawn from the grid (i.e. a higher peak demand). If this peak is reduced, you can request a ‘demand reset’ from the energy distributor (Essential Energy) and save money.
1. Essential Energy (2015), 2. Halliday, C. and Elder, L. (2009)
7
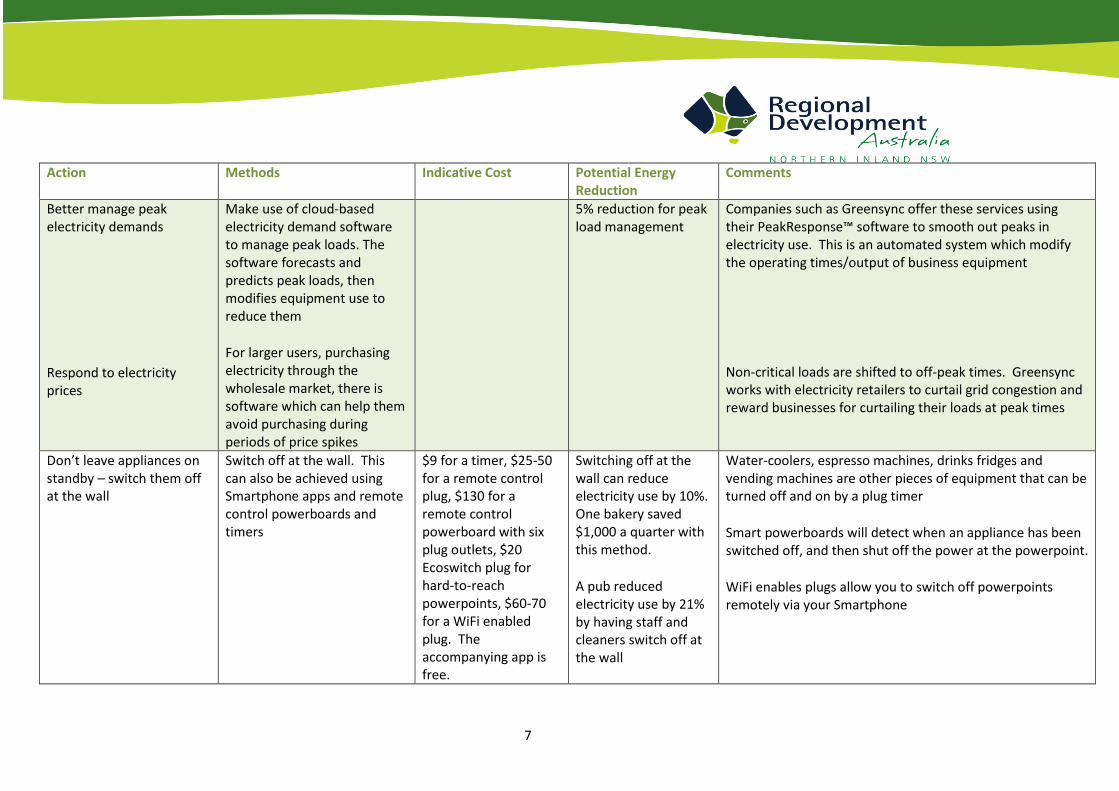
Action Methods Indicative Cost Potential Energy Reduction
Comments
Better manage peak electricity demands
Respond to electricity prices
Make use of cloud-based electricity demand software to manage peak loads. The software forecasts and predicts peak loads, then modifies equipment use to reduce them
For larger users, purchasing electricity through the wholesale market, there is software which can help them avoid purchasing during periods of price spikes
5% reduction for peak load management
Companies such as Greensync offer these services using their PeakResponse™ software to smooth out peaks in electricity use. This is an automated system which modify the operating times/output of business equipment
Non-critical loads are shifted to off-peak times. Greensync works with electricity retailers to curtail grid congestion and reward businesses for curtailing their loads at peak times
Don’t leave appliances on standby – switch them off at the wall
Switch off at the wall. This can also be achieved using Smartphone apps and remote control powerboards and timers
$9 for a timer, $25-50 for a remote control plug, $130 for a remote control powerboard with six plug outlets, $20 Ecoswitch plug for hard-to-reach powerpoints, $60-70 for a WiFi enabled plug. The accompanying app is free.
Switching off at the wall can reduce electricity use by 10%. One bakery saved $1,000 a quarter with this method.
A pub reduced electricity use by 21% by having staff and cleaners switch off at the wall
Water-coolers, espresso machines, drinks fridges and vending machines are other pieces of equipment that can be turned off and on by a plug timer
Smart powerboards will detect when an appliance has been switched off, and then shut off the power at the powerpoint.
WiFi enables plugs allow you to switch off powerpoints remotely via your Smartphone
8
Action Methods Indicative Cost Potential Energy Reduction
Comments
Adjusting the thermostat
Fix draughts
Adjust the thermostat according to the season.
24-27° C is recommended for summer and 18-20° C for winter
$10 thermostat cover lock from hardware stores
$40 plug-in thermostat
Every degree you raise or lower your thermostat can increase your heating or cooling costs by 10%
Ensure thermostat is away from direct sunlight or heat radiating from equipment, or draughts so that it works correctly
Save on Lighting
Turn lights and displays off when not needed
Remove a tube if an area is too bright
Clean lights if too dim
Switch to LED lights
Use motion sensors to turn lights on/off
Use skylights and transparent roof panels
Zone you lights if not all need to be on at all times
Nil
Nil
Nil
LEDs often have a payback period of less than 2 years
Solatubes can cut lighting energy by up to 94%
Lighting accounts for 10-50% of a business electricity bill
LEDs use up to 83% less energy than halogen downlights and last 25 times longer
One large motel replaced 9,975 conventional lights with LEDs and saved $250,000 per year
A hairdressing salon replaced 60 50W halogen downlights with 6W LEDs and saved $3,300 per year
LED lights also produce less heat which can reduce air-conditioning costs
LEDs also stay cooler than halogen downlights so are less of a fire risk
Ensure you choose good quality LEDs. Lighting Council Australia have created an easily searchable database of LEDs that carry the ‘SSL Quality Scheme Label’. This label tells you that an LED lighting product should perform as per the claims of the supplier
9
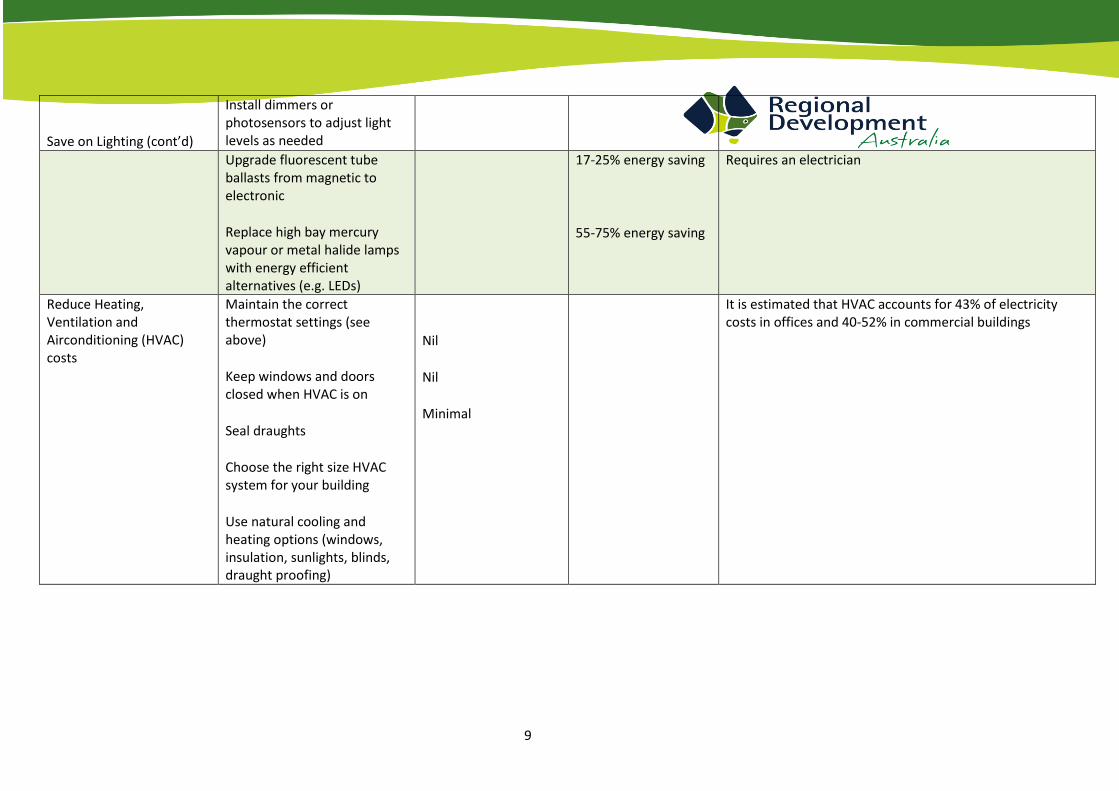
Save on Lighting (cont’d)
Install dimmers or photosensors to adjust light levels as needed
Upgrade fluorescent tube ballasts from magnetic to electronic
Replace high bay mercury vapour or metal halide lamps with energy efficient alternatives (e.g. LEDs)
17-25% energy saving
55-75% energy saving
Requires an electrician
Reduce Heating, Ventilation and Airconditioning (HVAC) costs
Maintain the correct thermostat settings (see above)
Keep windows and doors closed when HVAC is on
Seal draughts
Choose the right size HVAC system for your building
Use natural cooling and heating options (windows, insulation, sunlights, blinds, draught proofing)
Nil
Nil
Minimal
It is estimated that HVAC accounts for 43% of electricity costs in offices and 40-52% in commercial buildings
10
Action Methods Indicative Cost Potential Energy Reduction
Comments
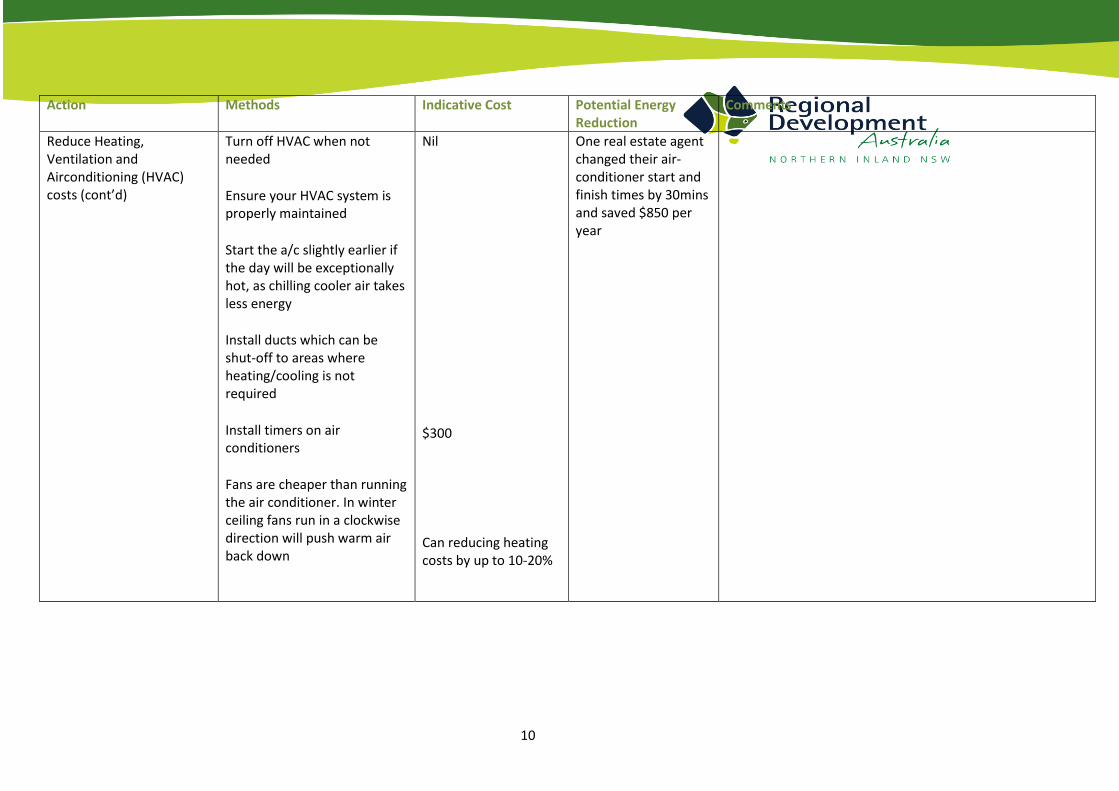
Reduce Heating, Ventilation and Airconditioning (HVAC) costs (cont’d)
Turn off HVAC when not needed
Ensure your HVAC system is properly maintained
Start the a/c slightly earlier if the day will be exceptionally hot, as chilling cooler air takes less energy
Install ducts which can be shut-off to areas where heating/cooling is not required
Install timers on air conditioners
Fans are cheaper than running the air conditioner. In winter ceiling fans run in a clockwise direction will push warm air back down
Nil
$300
Can reducing heating costs by up to 10-20%
One real estate agent changed their air-conditioner start and finish times by 30mins and saved $850 per year
11
Action Methods Indicative Cost Potential Energy Reduction
Comments
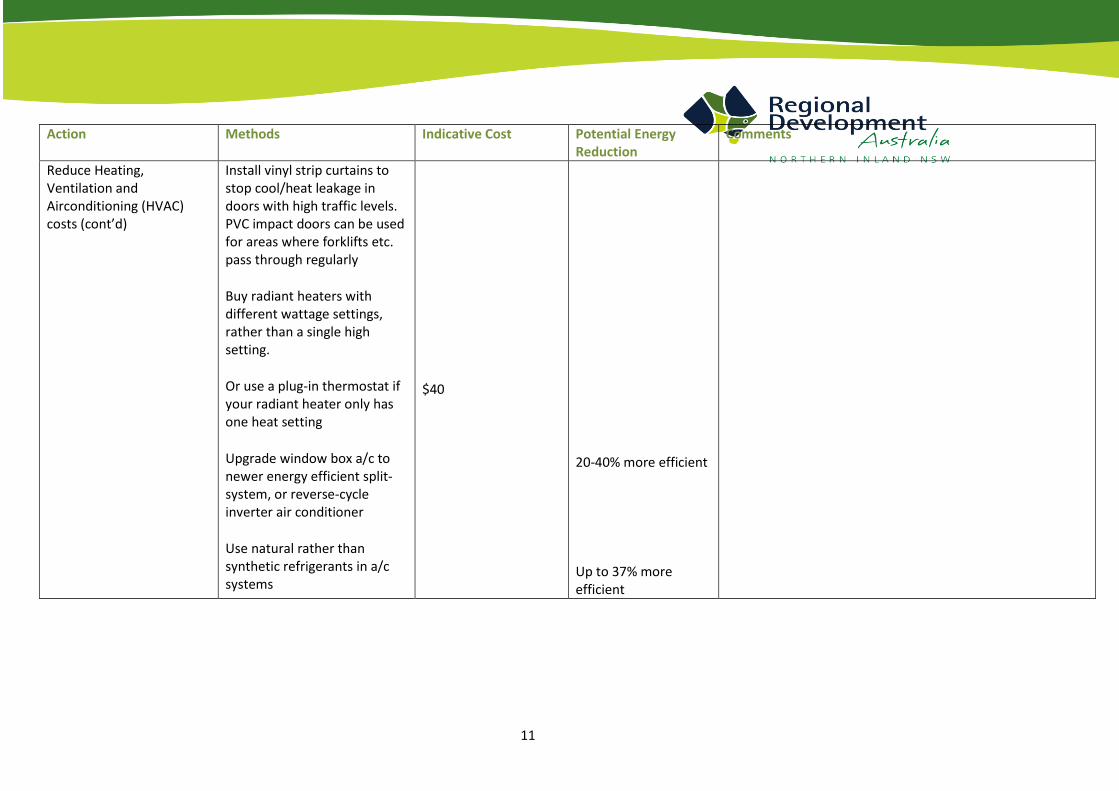
Reduce Heating, Ventilation and Airconditioning (HVAC) costs (cont’d)
Install vinyl strip curtains to stop cool/heat leakage in doors with high traffic levels. PVC impact doors can be used for areas where forklifts etc. pass through regularly
Buy radiant heaters with different wattage settings, rather than a single high setting.
Or use a plug-in thermostat if your radiant heater only has one heat setting
Upgrade window box a/c to newer energy efficient split-system, or reverse-cycle inverter air conditioner
Use natural rather than synthetic refrigerants in a/c systems
$40
20-40% more efficient
Up to 37% more efficient
12
Action Methods Indicative Cost Potential Energy Reduction
Comments
Reduce Heating, Ventilation and Airconditioning (HVAC) costs (cont’d)
Use occupancy sensors to turn on/off HVAC systems
In drier less humid climates, use evaporative cooling systems rather than normal refrigerative air conditioners
Consider inverter-type a/c which has a variable speed drive on the compressor motor
Heat the smallest area possible
For gas heating systems, look out for gas heating appliances that have a maximum number of energy-rating stars and the lowest MJ figure.
These use up to 75% less energy
This saves energy by up to 50% in ducted HVAC systems as the motor changes speed rather than constantly stopping/starting
Each extra star on a gas heater will save you around 10% on running costs
Many businesses waste money by using heaters when all they need to do is improve their insulation, eliminate draughts, use ceiling fans, and better utilise the warmth of the sun
Make sure the gas heater has a minimum 4-star rating. Super-efficient systems are now available that have a 6-star rating.
13
Action Methods Indicative Cost Potential Energy Reduction
Comments
Reduce Heating, Ventilation and Airconditioning (HVAC) costs (cont’d)
Off-peak electric storage heater (‘heat banks’) use cheap off-peak energy at night to heat up a special heat retaining material (usually bricks). It then releases this heat during the day and is a very economical way of heating a room. However, you may need an additional heater for the evening if the stored heat has run low.
Heat can be recovered from industrial processes and use to heat business premises
One bakery used this system to recover heat from ovens and reduce annual energy costs by 10-15%
Insulation Roof, wall and floor insulation
Insulation of hot water systems and pipes
Proper insulation can reduce cooling costs by up to 40% and heating costs by up to 70%
Windows are a large source of heat loss and gain. At the very least, your ceiling should be insulated to a minimum R-value of 4.1 and your walls should be insulated to a minimum of 2.8.
Ceiling roof insulation is most important followed by wall and floor insulation
14
Action Methods Indicative Cost Potential Energy Reduction
Comments
Insulation Seal up draughts
Exhaust fans - self-closing damper or filter on it. This will stop air escaping or entering when it’s not in use
Install external shading such as eaves, shutters, shade cloths, retractable awnings or plant shade trees. These solutions offer a quick way to reduce heat gain from the sun - typically, the north- and west-facing walls
Solar-powered roof-cavity ventilators have proven to be very effective in removing heat from enclosed roof spaces. This can lead to lower air-conditioning cooling costs
This can be your lowest cost solution
Wall and ceiling insulation saved a Glen Innes motel 7% on their power bills
One large office business installed insulation and double glazed windows which reduced the9ir heating and cooling cost by $20,000 per year
15
Action Methods Indicative Cost Potential Energy Reduction
Comments
Insulation (cont’d) Ceiling grilles
Painting a roof white or a pale colour
Use double-glazed windows
Reduces heating and cooling costs by 4-8%. One butcher saved $2,000 per year
During hot summer days, these ceiling grilles can be left open. The hot air in your premises rises through the open ceiling grilles and the powered ventilator on your rooftop sucks the hot air out. During winter, you can shut the ceiling grilles to keep the heat in.
Maximises the solar reflectance of a roof – this reduces the amount of heat that is transferred to the building below.
Reduce IT costs Turn off computers at the wall at end of day/weekends
Use a laptop instead of a desktop and monitor
Enable all the energy-saving options on your IT equipment so they revert to sleep mode if not in use (both computers and monitors)
Nil
Nil
Nil
80-90% energy saving
Reduce energy use by up to 90%
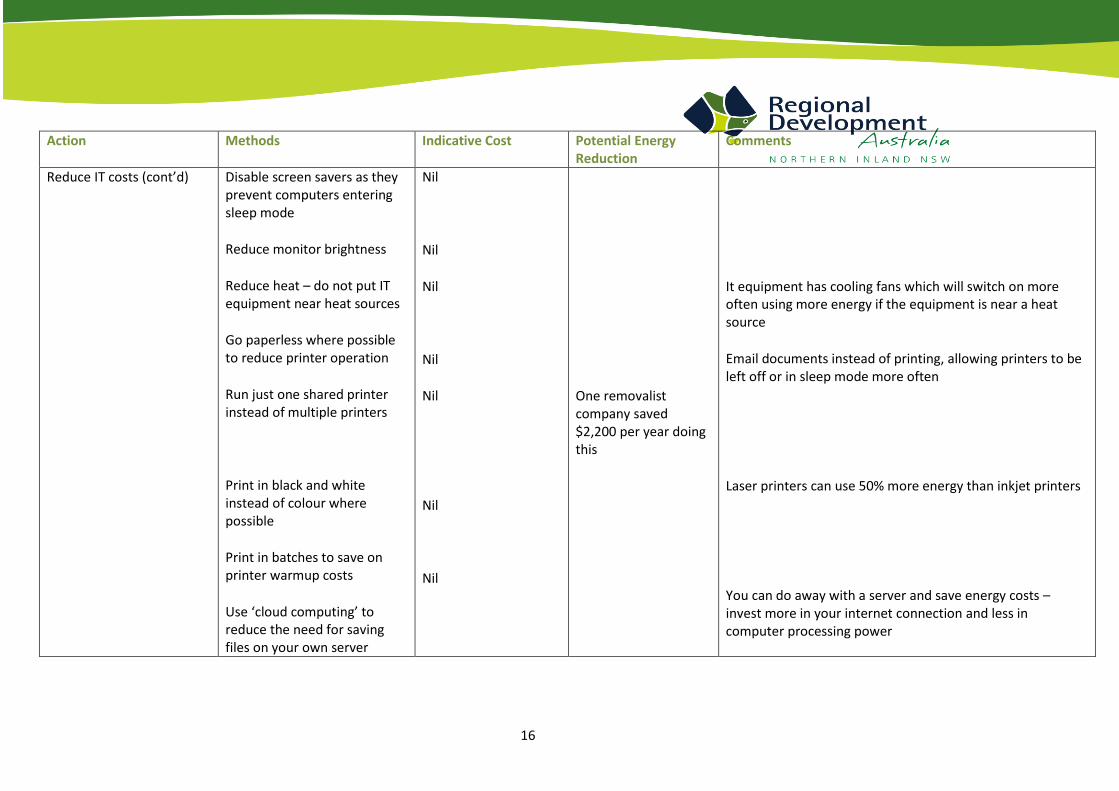
16
Action Methods Indicative Cost Potential Energy Reduction
Comments
Reduce IT costs (cont’d) Disable screen savers as they prevent computers entering sleep mode
Reduce monitor brightness
Reduce heat – do not put IT equipment near heat sources
Go paperless where possible to reduce printer operation
Run just one shared printer instead of multiple printers
Print in black and white instead of colour where possible
Print in batches to save on printer warmup costs
Use ‘cloud computing’ to reduce the need for saving files on your own server
Nil
Nil
Nil
Nil
Nil
Nil
Nil
One removalist company saved $2,200 per year doing this
It equipment has cooling fans which will switch on more often using more energy if the equipment is near a heat source
Email documents instead of printing, allowing printers to be left off or in sleep mode more often
Laser printers can use 50% more energy than inkjet printers
You can do away with a server and save energy costs – invest more in your internet connection and less in computer processing power
17
Action Methods Indicative Cost Potential Energy Reduction
Comments
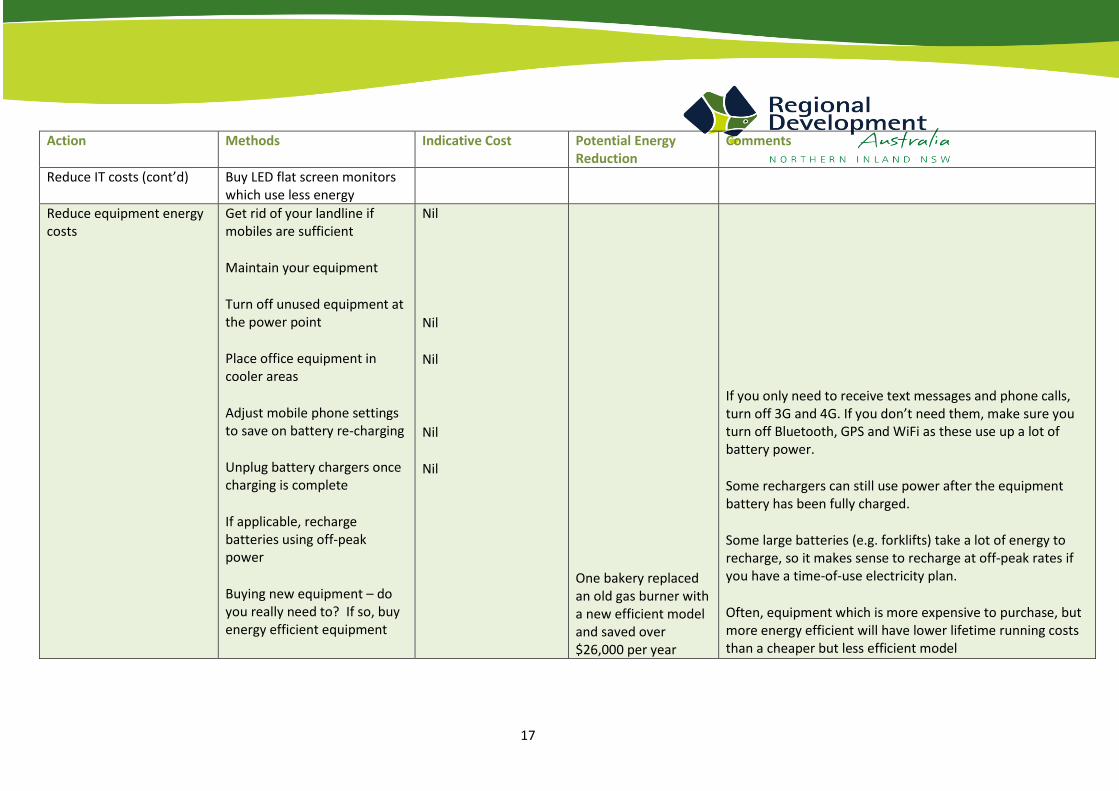
Reduce IT costs (cont’d) Buy LED flat screen monitors which use less energy
Reduce equipment energy costs
Get rid of your landline if mobiles are sufficient
Maintain your equipment
Turn off unused equipment at the power point
Place office equipment in cooler areas
Adjust mobile phone settings to save on battery re-charging
Unplug battery chargers once charging is complete
If applicable, recharge batteries using off-peak power
Buying new equipment – do you really need to? If so, buy energy efficient equipment
Nil
Nil
Nil
Nil
Nil
One bakery replaced an old gas burner with a new efficient model and saved over $26,000 per year
If you only need to receive text messages and phone calls, turn off 3G and 4G. If you don’t need them, make sure you turn off Bluetooth, GPS and WiFi as these use up a lot of battery power.
Some rechargers can still use power after the equipment battery has been fully charged.
Some large batteries (e.g. forklifts) take a lot of energy to recharge, so it makes sense to recharge at off-peak rates if you have a time-of-use electricity plan.
Often, equipment which is more expensive to purchase, but more energy efficient will have lower lifetime running costs than a cheaper but less efficient model
18
Action Methods Indicative Cost Potential Energy Reduction
Comments
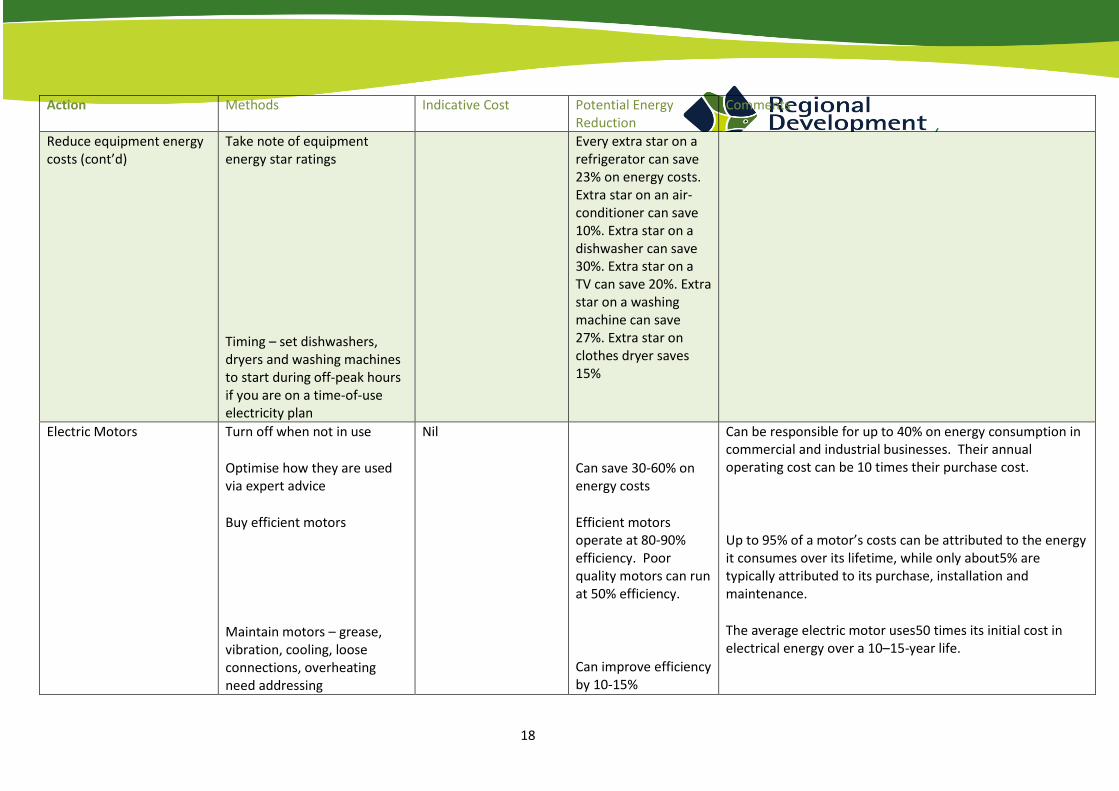
Reduce equipment energy costs (cont’d)
Take note of equipment energy star ratings
Timing – set dishwashers, dryers and washing machines to start during off-peak hours if you are on a time-of-use electricity plan
Every extra star on a refrigerator can save 23% on energy costs. Extra star on an air-conditioner can save 10%. Extra star on a dishwasher can save 30%. Extra star on a TV can save 20%. Extra star on a washing machine can save 27%. Extra star on clothes dryer saves 15%
Electric Motors Turn off when not in use
Optimise how they are used via expert advice
Buy efficient motors
Maintain motors – grease, vibration, cooling, loose connections, overheating need addressing
Nil
Can save 30-60% on energy costs
Efficient motors operate at 80-90% efficiency. Poor quality motors can run at 50% efficiency.
Can improve efficiency by 10-15%
Can be responsible for up to 40% on energy consumption in commercial and industrial businesses. Their annual operating cost can be 10 times their purchase cost.
Up to 95% of a motor’s costs can be attributed to the energy it consumes over its lifetime, while only about5% are typically attributed to its purchase, installation and maintenance.
The average electric motor uses50 times its initial cost in electrical energy over a 10–15-year life.
19
Action Methods Indicative Cost Potential Energy Reduction
Comments
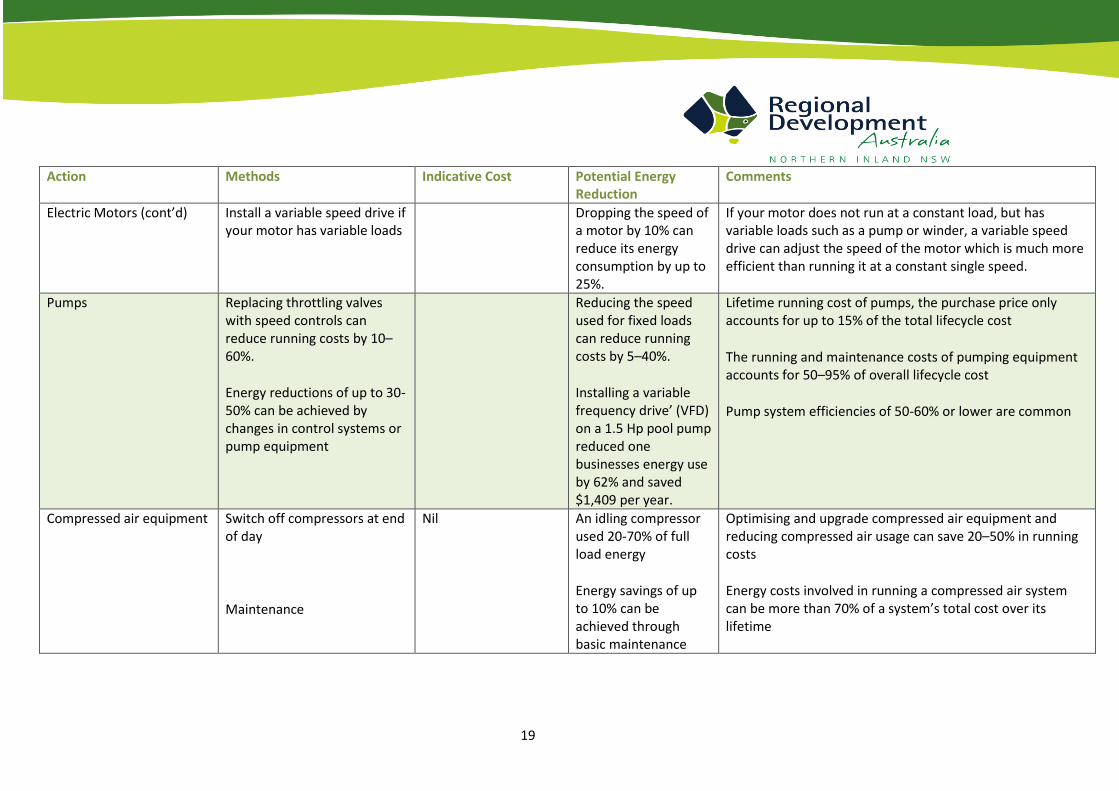
Electric Motors (cont’d) Install a variable speed drive if your motor has variable loads
Dropping the speed of a motor by 10% can reduce its energy consumption by up to 25%.
If your motor does not run at a constant load, but has variable loads such as a pump or winder, a variable speed drive can adjust the speed of the motor which is much more efficient than running it at a constant single speed.
Pumps Replacing throttling valves with speed controls can reduce running costs by 10–60%.
Energy reductions of up to 30-50% can be achieved by changes in control systems or pump equipment
Reducing the speed used for fixed loads can reduce running costs by 5–40%.
Installing a variable frequency drive’ (VFD) on a 1.5 Hp pool pump reduced one businesses energy use by 62% and saved $1,409 per year.
Lifetime running cost of pumps, the purchase price only accounts for up to 15% of the total lifecycle cost
The running and maintenance costs of pumping equipment accounts for 50–95% of overall lifecycle cost
Pump system efficiencies of 50-60% or lower are common
Compressed air equipment Switch off compressors at end of day
Maintenance
Nil An idling compressor used 20-70% of full load energy
Energy savings of up to 10% can be achieved through basic maintenance
Optimising and upgrade compressed air equipment and reducing compressed air usage can save 20–50% in running costs
Energy costs involved in running a compressed air system can be more than 70% of a system’s total cost over its lifetime
20
Action Methods Indicative Cost Potential Energy Reduction
Comments
Compressed air equipment (cont’d)
Maintenance
Reduce pressure where possible
Shorten the distance between the compressor and equipment
Locate compressors in cooler areas
When replacing old equipment, consider whether the new equipment should use variable speed drives. VSDs have the ability to adjust the speed of the motor and they are particularly efficient when the demand for compressed air varies.
Nil
Reducing the pressure of the system by 10% can save 5% in energy
A 4°C reduction is air intake temperature reduces energy use by 1%
Can generate energy savings of up to 50%.
Fix leaks, maintain air cleaning system, lubrication, drive belt tension
Transport Avoid speeding and hard acceleration
Minimise loads in utes and vans to reduce fuel use
Nil Can reduce fuel use by 30-70%
At 110kmh you can use 25% more fuel than at 90kmh
21
Action Methods Indicative Cost Potential Energy Reduction
Comments
Transport (cont’d) Keep vehicles well maintained
Tyre type and inflation
Roof-racks and other external attachments
Plan ahead to combine multiple tasks and reduce the number of trips
Buy or lease an appropriately sized vehicle for your needs
Nil
4% fuel saving
Tyres can account for up to 20% of fuel consumption
Removing these can increase fuel efficiency up to 20%
Tyres with low rolling resistance can reduce fuel costs by 6%
Bigger vehicles with larger engines cost more to run
Refrigeration Replace old fridges and freezers (older than 15yrs) with new models
Turn off unused fridges
Check your thermostat level
Nil
Can save up to 40% on energy costs
Up to $220/year
Every 1°C you reduce the temperature can increase energy 2-4%
22
Action Methods Indicative Cost Potential Energy Reduction
Comments
Refrigeration (cont’d) Keep freezer frost-free to improve efficiency
Fridges work best when two-thirds full and freezers when three quarters full
Replace worn seals
Look for high star ratings
Check the thermostat setting
Install times on fridges to switch them off and on
Replace faulty compressors
Place refrigerators away from heat
Leave at least 50-80mm between fridge and walls
Change lighting in commercial display fridges
Nil
$60 for fridge seal
$20
Nil
Nil
10% improvement in energy efficiency
Every extra star saves 23% in energy
$950 per year
50% reduction in energy use
15% less energy use
For food safety, fridges should be set at or below 5°C and freezers at minus 15-18° C. For every degree that you set your fridge or freezer colder than these levels, you will increase your running costs by 2–4%
Space gives better airflow around coils and condenser
Switch to low heat-generating CFL or LED lights
23
Action Methods Indicative Cost Potential Energy Reduction
Comments
Refrigeration (cont’d) Use insulation on commercial fridges
Businesses with open-top chest freezers can use ‘thermo-roller’ insulation
Buy fridges with high star ratings
In commercial fridges, consider those with enclosed glass doors, or retro-fit them
Coolrooms run more efficiently if around 66% full
Annual savings of $2,430 were achieved when using a ‘thermo-roller’ on top of a 10-metre-length freezer
Over a 10-year period, buying a 4-star fridge instead of a 2-starversion can save you up to $480 in electricity costs
Enclosed refrigeration units with glass doors reduce energy use by 30–68%.
Install thermal insulation blankets and insulation curtains
Installing well-fitted night blinds on open systems can significantly cut down your refrigeration energy use

24
Action Methods Indicative Cost Potential Energy Reduction
Comments
Refrigeration (cont’d) Place high-turnover product near the coolroom door to minimise the time doors are open
Seal gaps in coolrooms
Reduce coolroom lighting use – turn off lights and use LEDs
Upgrade the power controls and thermostat in your coolroom
Natural refrigerants are more energy efficient
Keep maintenance up to date
Many manufacturers now offer new energy efficient components (including variable-speed compressors, high efficiency motors, electronically commutated (EC) fans, and entire condensing units) that are designed to be retrofitted into existing plants and systems. These can offer an easy low-cost pathway for energy efficiency upgrades.
Thermal insulation and vapour barriers in walls, floors and ceilings, automatic door-closers, door seals and high-speed closers, strip curtains, plastic doors, air locks, night curtains, cabinet doors and lids can all be used to reduce refrigeration loads.
The use of reflective coatings on external walls and roofs and thermal coatings on floors, as well as the use of compact fluorescents or LED lighting systems that are suitable for low-temperature operation, will all reduce energy consumption and internal heat loads. Linking the operation of the lighting system to occupancy sensors can also help to further reduce this energy use.
Hot Water Wash in cold or lower temperature water
Only run dishwashers when full and use the ‘Eco’ setting
Check the temperature setting on you hot water system
Nil
Nil
Nil
Hot water systems need to be at a minimum of 60°C to stop bacteria multiplying, but not higher than 65°C. Instant hot water systems can be set at 50°C.
25
Action Methods Indicative Cost Potential Energy Reduction
Comments
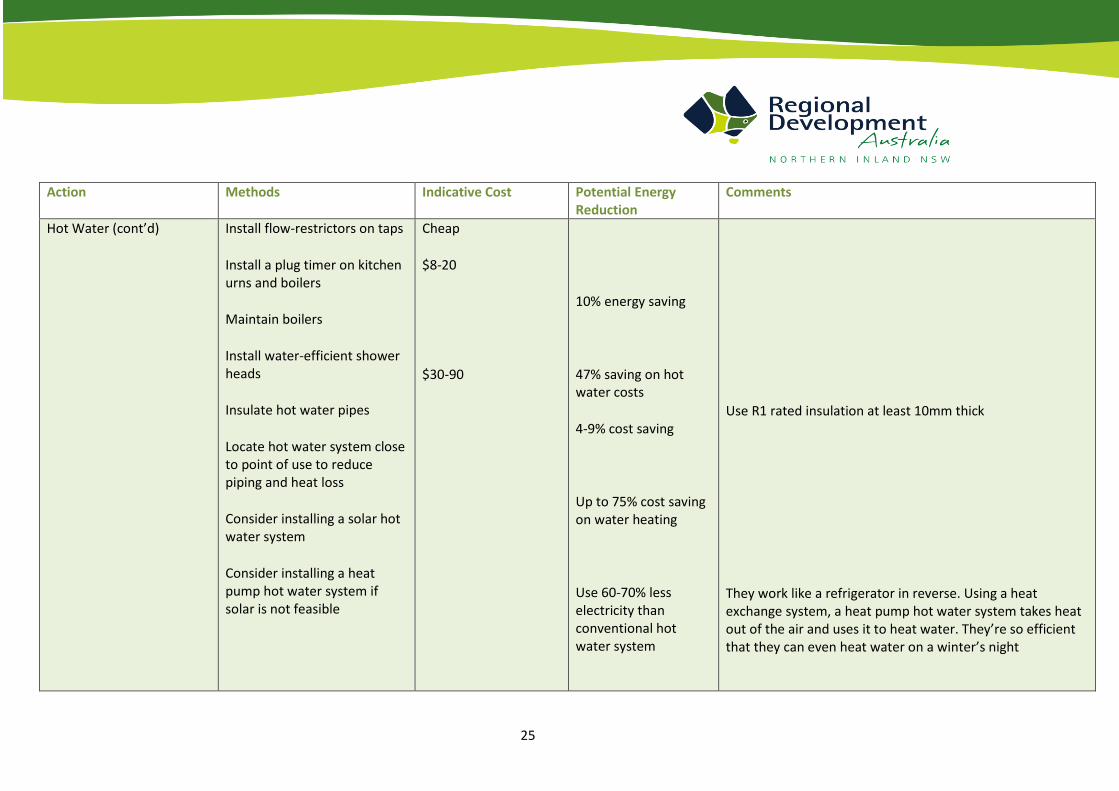
Hot Water (cont’d) Install flow-restrictors on taps
Install a plug timer on kitchen urns and boilers
Maintain boilers
Install water-efficient shower heads
Insulate hot water pipes
Locate hot water system close to point of use to reduce piping and heat loss
Consider installing a solar hot water system
Consider installing a heat pump hot water system if solar is not feasible
Cheap
$8-20
$30-90
10% energy saving
47% saving on hot water costs
4-9% cost saving
Up to 75% cost saving on water heating
Use 60-70% less electricity than conventional hot water system
Use R1 rated insulation at least 10mm thick
They work like a refrigerator in reverse. Using a heat exchange system, a heat pump hot water system takes heat out of the air and uses it to heat water. They’re so efficient that they can even heat water on a winter’s night
26
Action Methods Indicative Cost Potential Energy Reduction
Comments
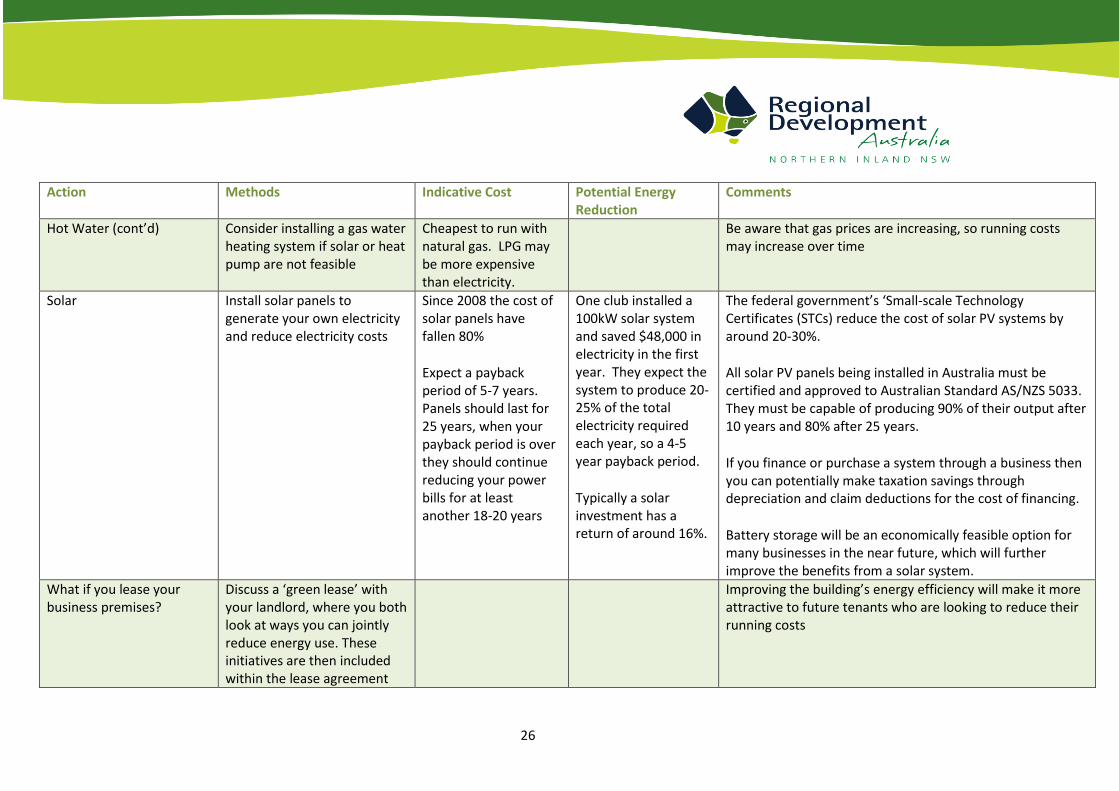
Hot Water (cont’d) Consider installing a gas water heating system if solar or heat pump are not feasible
Cheapest to run with natural gas. LPG may be more expensive than electricity.
Be aware that gas prices are increasing, so running costs may increase over time
Solar Install solar panels to generate your own electricity and reduce electricity costs
Since 2008 the cost of solar panels have fallen 80%
Expect a payback period of 5-7 years. Panels should last for 25 years, when your payback period is over they should continue reducing your power bills for at least another 18-20 years
One club installed a 100kW solar system and saved $48,000 in electricity in the first year. They expect the system to produce 20-25% of the total electricity required each year, so a 4-5 year payback period.
Typically a solar investment has a return of around 16%.
The federal government’s ‘Small-scale Technology Certificates (STCs) reduce the cost of solar PV systems by around 20-30%.
All solar PV panels being installed in Australia must be certified and approved to Australian Standard AS/NZS 5033. They must be capable of producing 90% of their output after 10 years and 80% after 25 years.
If you finance or purchase a system through a business then you can potentially make taxation savings through depreciation and claim deductions for the cost of financing.
Battery storage will be an economically feasible option for many businesses in the near future, which will further improve the benefits from a solar system.
What if you lease your business premises?
Discuss a ‘green lease’ with your landlord, where you both look at ways you can jointly reduce energy use. These initiatives are then included within the lease agreement
Improving the building’s energy efficiency will make it more attractive to future tenants who are looking to reduce their running costs
27
Action Methods Indicative Cost Potential Energy Reduction
Comments
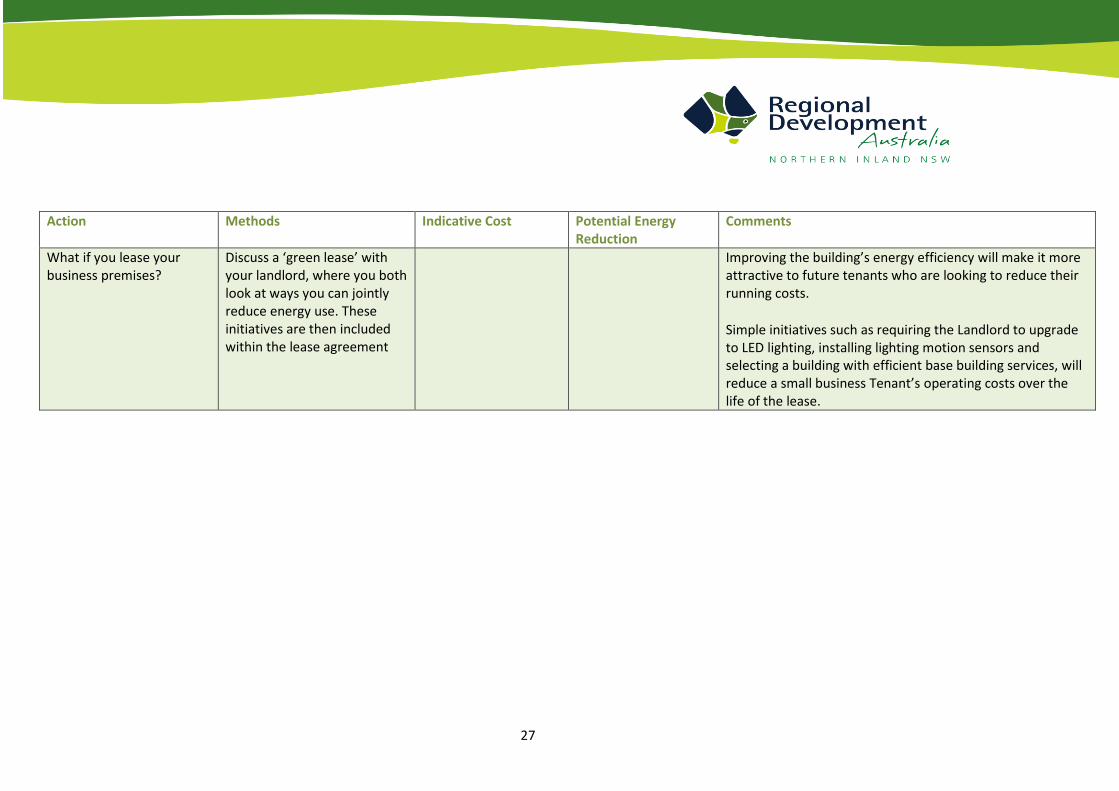
What if you lease your business premises?
Discuss a ‘green lease’ with your landlord, where you both look at ways you can jointly reduce energy use. These initiatives are then included within the lease agreement
Improving the building’s energy efficiency will make it more attractive to future tenants who are looking to reduce their running costs.
Simple initiatives such as requiring the Landlord to upgrade to LED lighting, installing lighting motion sensors and selecting a building with efficient base building services, will reduce a small business Tenant’s operating costs over the life of the lease.
28
5. Economic Comparison of ‘On-Grid’ Energy Sources The only ‘on-grid’ energy sources in the region are electricity, natural gas via pipeline in the
Tamworth area, synthetic natural gas in Armidale and Tempered LPG in Glen Innes.
However, gas in most areas is delivered as LPG by bulk delivery to fixed storage tanks on
site, or via smaller exchange cylinders.
Electricity Costs
For the businesses surveyed, energy costs as a percentage of operating costs varied from a
low of 1% for a supermarket to a high of 15% for a shopping mall (these were both after
corrective actions had been taken to reduce energy costs).
Many large electricity users (>100,000 kWh/year) have a negotiated contract (known as a
contestable large market contract) with a retailer for their electricity supply. These have a
different price structure to the ‘small market’ online plans listed on websites such as
EnergyWatch.com.au or Energymadeeasy.gov.au which allows consumers to compare
electricity and gas plans for households and (smaller) businesses.
EnergyWatch classifies a ‘large business’ as using more than 40,000 kWh of electricity per
year, and more than 100,000 MJ of gas per year. We found many businesses in our area
well beyond these levels of energy consumption (e.g. 825,000 kWh of electricity and
625,000 MJ of gas for a bowling club, 33,000,000 MJ of gas for an abattoir).
Consequently, many large users have negotiated (or used an energy specialist to negotiate)
special contract rates for their electricity under the government set contestability
regulations . In fact, the EnergyWatch site cannot deal with the large monthly electricity
amounts paid by some of these businesses, therefore cannot suggest the best energy plan
for them. The plans listed on comparison websites typically have higher charges for energy
use in kWh, but lower charges for network access than those for a negotiated contract.
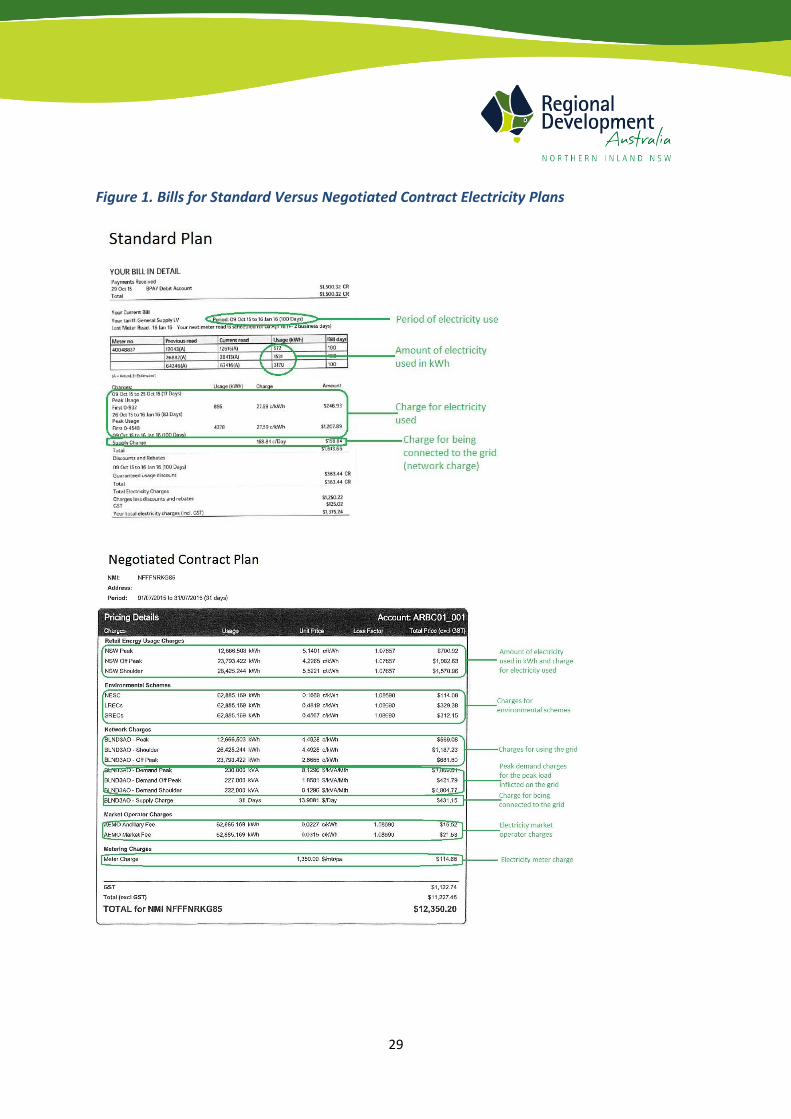
Figure 1 shows the typical layouts of a standard electricity plan bill detail versus a
negotiated contract.
Moreover, large users (over 100,000 kWh per year) will usually attract an additional demand
charge based on the peak load they draw from the grid each month – even if they only draw
that peak load for a very short period. Combined with other network access charges,
network costs are generally a much larger portion of their total bill than electricity use
charges (Figure 2). However, overall this arrangement will generally produce a lower
electricity cost than choosing a standard retail plan on-line.
Many large electricity users (> 100,000 kWh per year) have a negotiated contract with
their retailer, rather than the ‘off-the shelf’ plans which appear on comparison websites
such as EnergyWatch and EnergyMadeEasy.
29
Figure 1. Bills for Standard Versus Negotiated Contract Electricity Plans

30
Figure 2. Network Charges as a Proportion of Total Electricity Cost – Northern Inland Region
Figure 3 illustrates the typical range of plan results for business energy use levels covered on
the EnergyWatch comparison website. Both single rate and time of use plans are shown.
For a business to be on a time of use plan, they must have a newer time of use electricity
meter (these can be installed retrospectively if you have an old meter – about $500 for a
single-phase meter and $850 for a three-phase meter). The main consideration will be the
trade-off between higher daily connection fees, but lower electricity use fees with a time of
use plan. If the majority of your electricity is used in off-peak periods, the saving with a time
of use plan may outweigh the additional daily connection costs.
Some retailers (e.g. Powershop) charge customers in units of 1 kWh, which includes both
electricity use and grid access cost in a single charge. However the unit charge changes as
the level of electricity use changes. Also, units can be pre-purchased at specific prices,
allowing the customer to lock in the unit price of some usage if they think the price is good.
Some customers have noted that they find this system confusing compared to the standard
‘set-and-forget’ rates of other retailers. Usage is regularly reviewed and the unit prices
changes accordingly which can result in high unit prices per kWh during periods of low
electricity use (because the fixed daily access charge is spread across a small number of
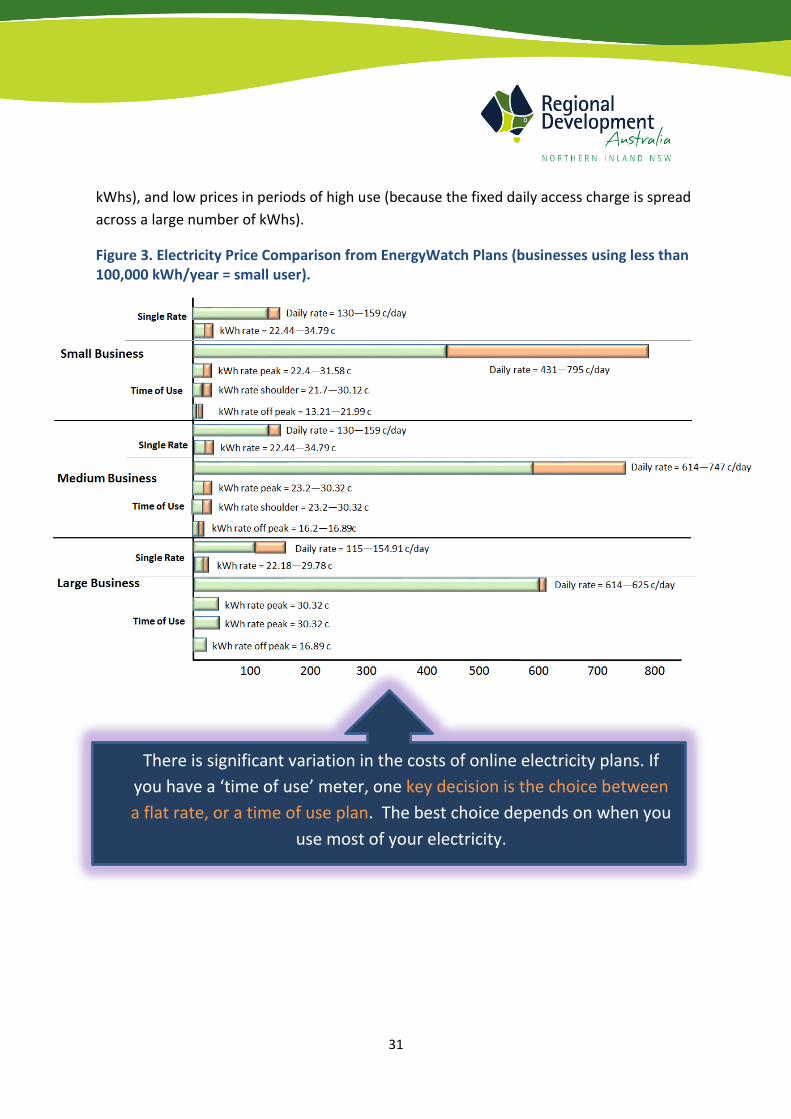
31
kWhs), and low prices in periods of high use (because the fixed daily access charge is spread
across a large number of kWhs).
Figure 3. Electricity Price Comparison from EnergyWatch Plans (businesses using less than 100,000 kWh/year = small user).
There is significant variation in the costs of online electricity plans. If
you have a ‘time of use’ meter, one key decision is the choice between
a flat rate, or a time of use plan. The best choice depends on when you
use most of your electricity.
32
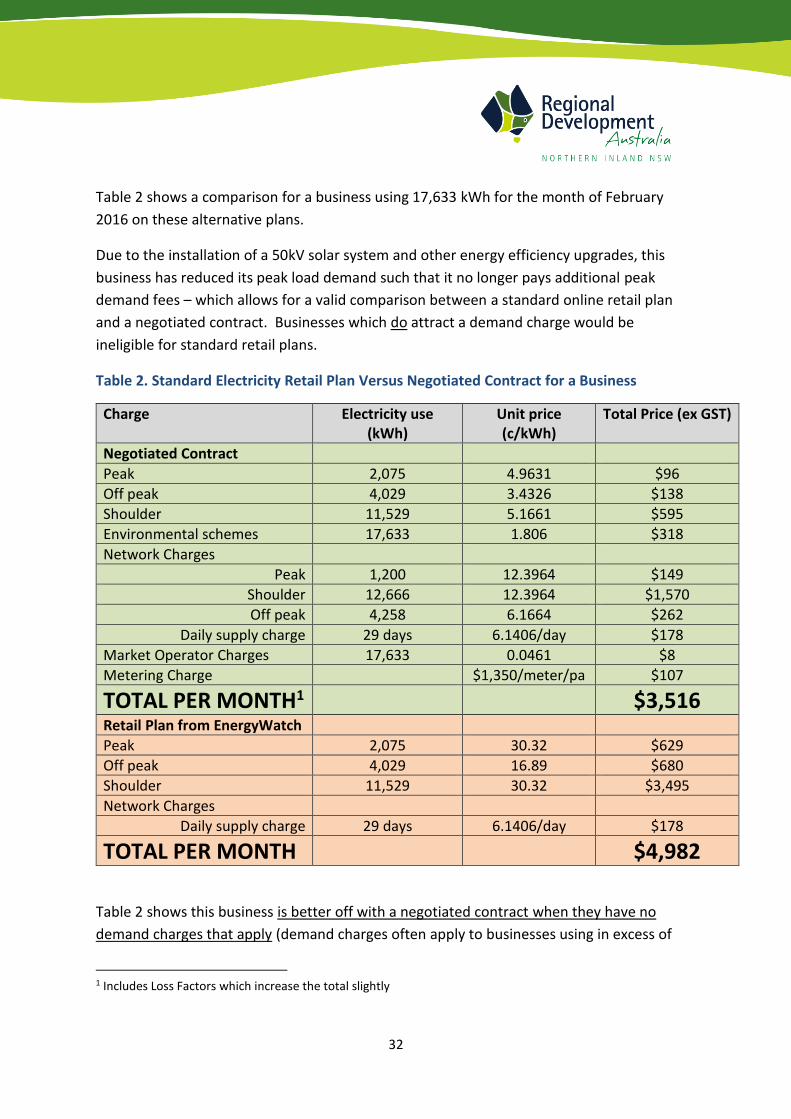
Table 2 shows a comparison for a business using 17,633 kWh for the month of February
2016 on these alternative plans.
Due to the installation of a 50kV solar system and other energy efficiency upgrades, this
business has reduced its peak load demand such that it no longer pays additional peak
demand fees – which allows for a valid comparison between a standard online retail plan
and a negotiated contract. Businesses which do attract a demand charge would be
ineligible for standard retail plans.
Table 2. Standard Electricity Retail Plan Versus Negotiated Contract for a Business
Charge Electricity use (kWh)
Unit price (c/kWh)
Total Price (ex GST)
Negotiated Contract
Peak 2,075 4.9631 $96
Off peak 4,029 3.4326 $138
Shoulder 11,529 5.1661 $595
Environmental schemes 17,633 1.806 $318
Network Charges
Peak 1,200 12.3964 $149
Shoulder 12,666 12.3964 $1,570
Off peak 4,258 6.1664 $262
Daily supply charge 29 days 6.1406/day $178
Market Operator Charges 17,633 0.0461 $8
Metering Charge $1,350/meter/pa $107
TOTAL PER MONTH1 $3,516 Retail Plan from EnergyWatch
Peak 2,075 30.32 $629
Off peak 4,029 16.89 $680
Shoulder 11,529 30.32 $3,495
Network Charges
Daily supply charge 29 days 6.1406/day $178
TOTAL PER MONTH $4,982
Table 2 shows this business is better off with a negotiated contract when they have no
demand charges that apply (demand charges often apply to businesses using in excess of
1 Includes Loss Factors which increase the total slightly
33
100,000 kWh pa). This is because the low electricity prices outweigh the additional network
charges.
Many business however will be above the 100,000 kWh pa threshold, in which case the
online plans listed on comparison websites may not be relevant.
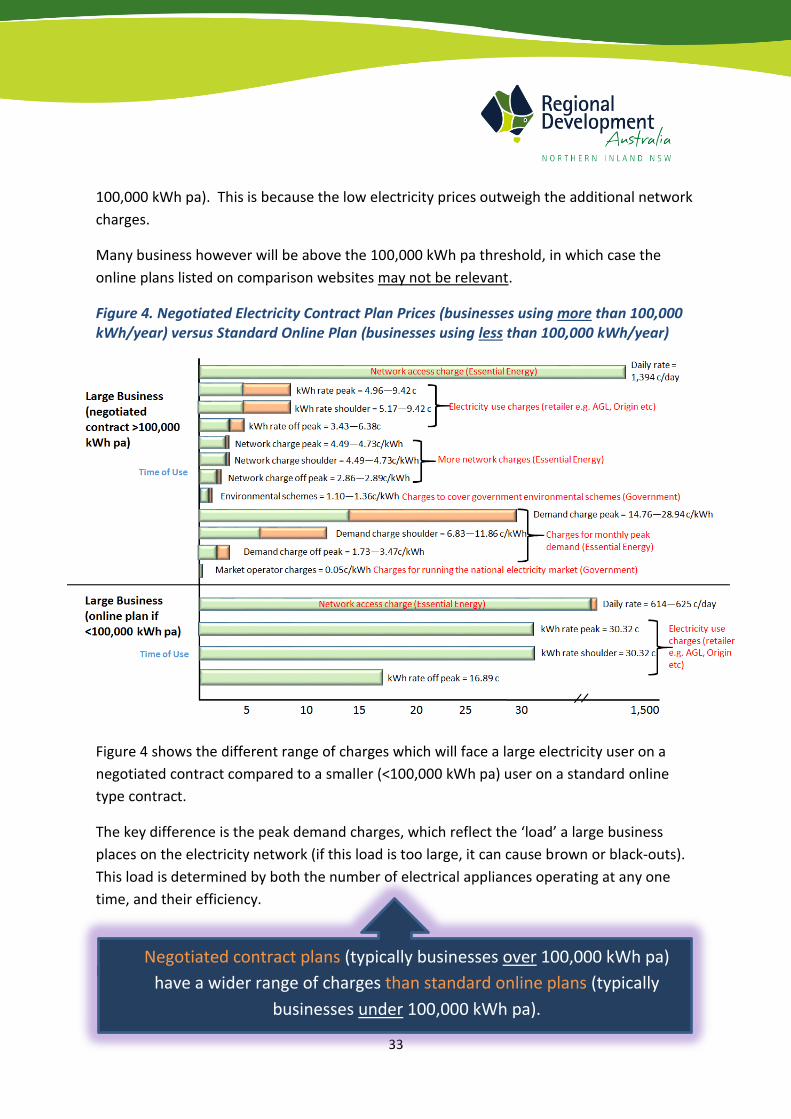
Figure 4. Negotiated Electricity Contract Plan Prices (businesses using more than 100,000 kWh/year) versus Standard Online Plan (businesses using less than 100,000 kWh/year)
Figure 4 shows the different range of charges which will face a large electricity user on a
negotiated contract compared to a smaller (<100,000 kWh pa) user on a standard online
type contract.
The key difference is the peak demand charges, which reflect the ‘load’ a large business
places on the electricity network (if this load is too large, it can cause brown or black-outs).
This load is determined by both the number of electrical appliances operating at any one
time, and their efficiency.
Peak demand is actually charged in kVA/month (not kWh) where: Negotiated contract plans (typically businesses over 100,000 kWh pa)
have a wider range of charges than standard online plans (typically
businesses under 100,000 kWh pa).
34
kVA = kW/Power Factor
Unlike kWh which has a time factor (the number of hours a business was drawing down a
certain number of kWs of electrical power), kVA has no time factor but represents the peak
load a business was inflicting on the electricity grid for an instant in time that month.
These demand charges do not apply to residential houses or smaller businesses because
individually they do not put a large load on the grid, so do not affect its design and capacity.
But large electricity users can have an impact in this regard.
The practical implications for a business are if it can get overall electricity use down below
100,000 kWh (and hence your peak demand down), you can avoid these charges.
This can be achieved in three main ways:
1. Install a renewable energy system (e.g. solar, wind, bioenergy) to reduce electricity
used from the grid;
2. Install a power factor correction unit which reduces spikes in electricity demand;
3. Undertake energy efficiency measures such as those listed in Table 1 of Section 4
above.
Below is a practical example from a business in our region which installed a 75kW rooftop
solar system, LED lighting and a power factor correction unit so that electricity use fell and
large demand peaks were eliminated. Consequently, they renegotiated the contract with their
electricity retailer to have the demand charges removed from their bill (Figure 5).
35
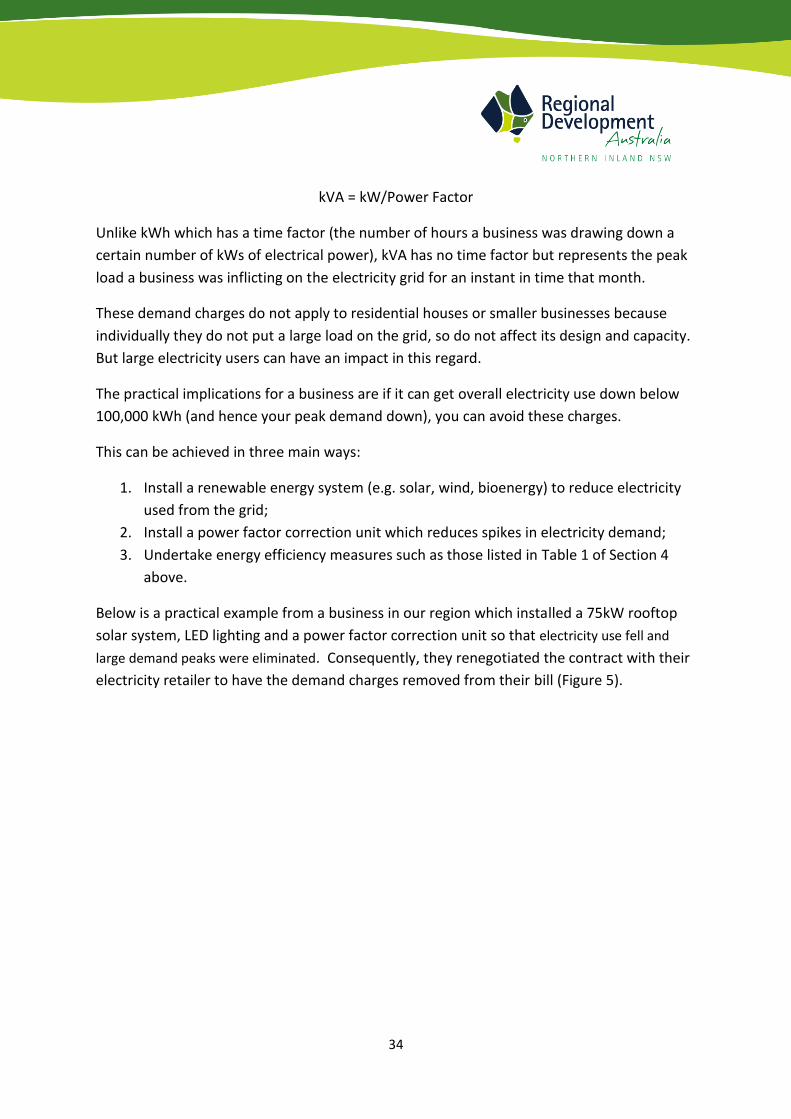
Figure 5. Effect of Energy Reduction Activities on Monthly Electricity Cost (Tamworth Shopping Mall)
Key messages from Figure 5 are:
Solar reduced electricity consumption;
Solar, LED lights and power factor correction unit reduced consumption and peak demand;
Negotiating a new plan resulted in some higher network costs (see Figure 4), but these are offset by the elimination of peak demand charges and lower electricity use.
Some electricity plans may contain a penalty clause which will apply if electricity consumption varies by more than 10% than anticipated. Installing a solar system or other measures may invoke this clause. However, typically this only applies to very large power users such as mine sites with annual consumption of 10GWh or more. None of the businesses surveyed in this study used anywhere near that much electricity.
Note also that your retailer will need to be notified if you install a solar or other renewable energy system in your business.
Eliminating peak demand charges
can be a large cost saving

36
The financial decision on whether to adopt a flat rate or TOU plan depends on the pattern (time) of use within a business, and Figure 6 shows there is considerable variation depending on the type of operation.
Those on flat rate plans pay a single price for all their electricity (21.49-27.59 c/kWh) for the
businesses surveyed, but lower network charges.
Those on TOU plans pay much lower rates for their electricity (4.71-5.84 c/kWh peak, 4.49-
5.84 c/kWh shoulder, 2.86-3.71 c/kWh off-peak), but much higher network charges
including peak demand charges in many cases.
Therefore, working out the best plan for an individual businesses means obtaining data on
usage rates during peak/shoulder/off-peak periods (which requires a TOU meter), obtaining
data on peak demands (if using more than 100,000 kWhs per year), and obtaining kWh, kVA
and network charges from different retailers and calculating total costs. This is not a trivial
task.
Figure 6. Time of Electricity Use For Different Northern Inland Businesses
37
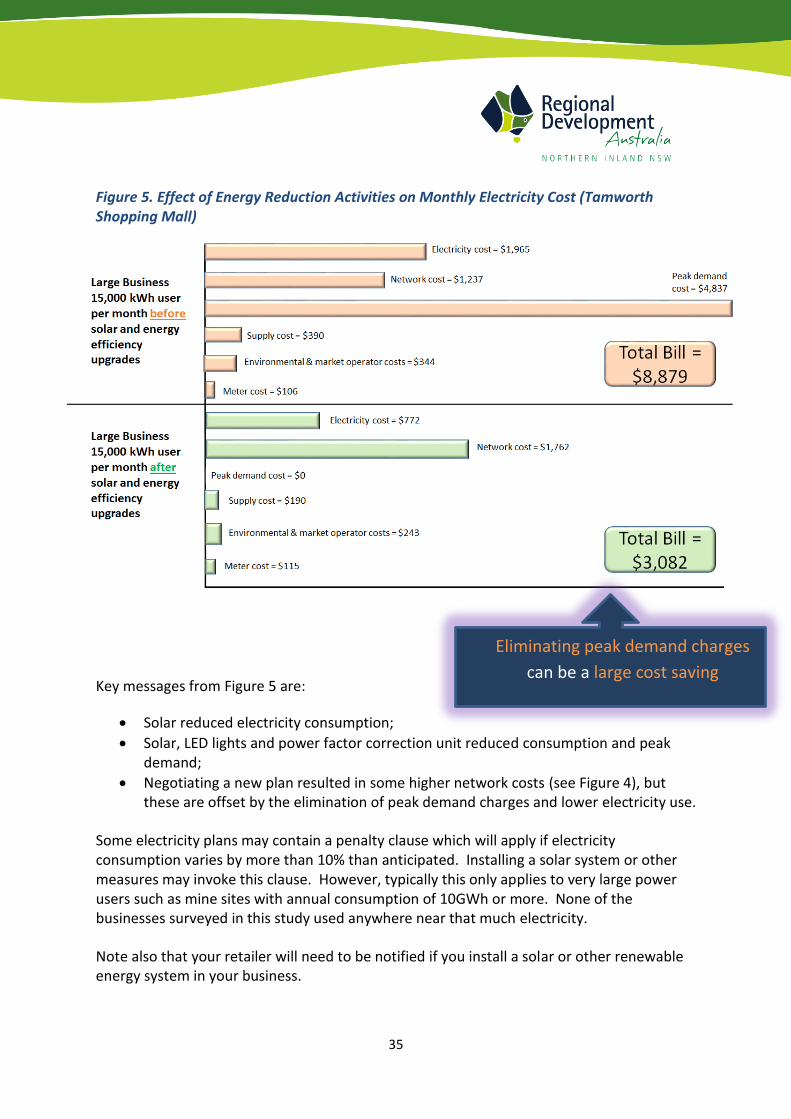
All businesses surveyed were asked to provide the total cost of their energy consumption as
a percentage of their total business operating costs. The results of this information are
provided in Figure 7.
Figure 7. Energy Costs Relative to Total Operating Costs
While many of these energy costs seem quite small as a percentage of total operating costs,
the value of the energy costs can be quite large (for example $54,000 per month for gas and
$139,000 per month for electricity at an abattoir, $12,500 per month for electricity at a club,
$5,000 per month for electricity at a retail/wholesale store, $35,000 per month for
electricity at a boarding school).
38
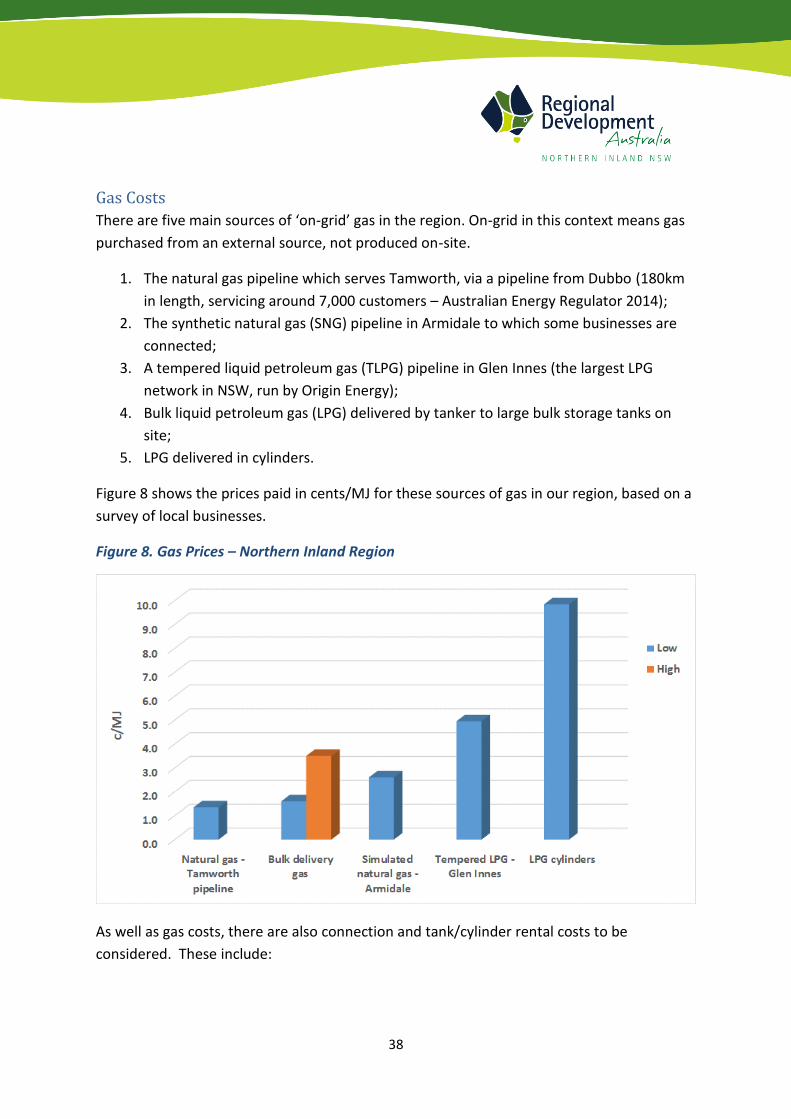
Gas Costs
There are five main sources of ‘on-grid’ gas in the region. On-grid in this context means gas
purchased from an external source, not produced on-site.
1. The natural gas pipeline which serves Tamworth, via a pipeline from Dubbo (180km
in length, servicing around 7,000 customers – Australian Energy Regulator 2014);
2. The synthetic natural gas (SNG) pipeline in Armidale to which some businesses are
connected;
3. A tempered liquid petroleum gas (TLPG) pipeline in Glen Innes (the largest LPG
network in NSW, run by Origin Energy);
4. Bulk liquid petroleum gas (LPG) delivered by tanker to large bulk storage tanks on
site;
5. LPG delivered in cylinders.
Figure 8 shows the prices paid in cents/MJ for these sources of gas in our region, based on a
survey of local businesses.
Figure 8. Gas Prices – Northern Inland Region
As well as gas costs, there are also connection and tank/cylinder rental costs to be
considered. These include:

39
Small 45kg LPG cylinders – around $40/year
Large LPG cylinders – around $70/year
Large bulk storage tanks - $600-1,000/year
SNG pipeline connection – around $200/year
Natural gas pipeline connection – around $0.46/MJ ($365/day plus a per MJ
distribution use of system charge) for a large (33M MJ/pa) user.
The advantage of natural gas, apart from price, is that there are a wider variety of natural
gas appliances to choose from compared to LPG appliances.
Gas in the region is often used for heating purposes, including the heating of hot water.
40
6. Economic assessment of renewable energy sources for on-grid
delivered retail energy
On-grid renewables in our region
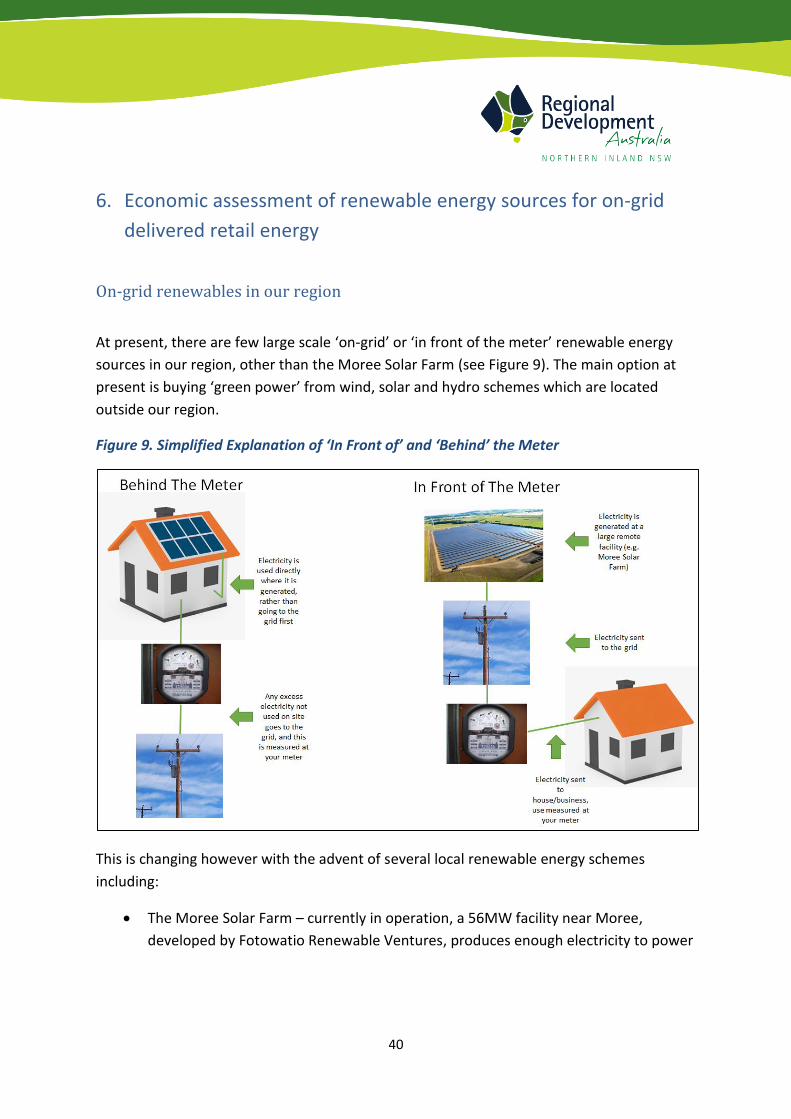
At present, there are few large scale ‘on-grid’ or ‘in front of the meter’ renewable energy
sources in our region, other than the Moree Solar Farm (see Figure 9). The main option at
present is buying ‘green power’ from wind, solar and hydro schemes which are located
outside our region.
Figure 9. Simplified Explanation of ‘In Front of’ and ‘Behind’ the Meter
This is changing however with the advent of several local renewable energy schemes
including:
The Moree Solar Farm – currently in operation, a 56MW facility near Moree,
developed by Fotowatio Renewable Ventures, produces enough electricity to power

41
15,000 homes. This required 13km of new or upgraded electricity lines to connect
to the existing Transgrid transmission system in Moree;
The Glen Innes White Rock Windfarm – being developed by Goldwind Australia with
up to 119 turbines, stage 1 will be 70 turbines with a capacity of 175MW, enough to
supply 75,000 homes;
The Inverell Sapphire Wind Farm – being developed by CWP Renewables with
260MW capacity, enough to supply 115,000 homes, will be the largest windfarm in
NSW;
White Rock Solar Farm – another Goldwind Australia project of 20MW capacity
(power for 7,200 homes), currently awaiting a funding announcement from ARENA;
One Wind wind farm at Glen Innes – 25 wind turbines with up to 75MW capacity,
enough to power 47,000 homes.
All of the Glen Innes and Inverell projects will require some new lines to be built to
connect to the existing 133kV Transgrid transmission lines;
Most renewable energy generation occurs ‘behind the meter’, such as the popular rooftop
solar installations (Figure 9). While these are connected to the grid, and you may receive a
small payment (typically less than 8c/kWh) for any surplus electricity put back into the grid,
most of the electricity is being consumed by the owner of the system on site. These are only
small-scale generating systems, hence not competing directly with large-scale ‘in front of
the meter’ coal-fired power stations.
Green power
Consumers can choose an electricity plan with a percentage (up to 100%) of their electricity
sourced from renewable energy. This is known as ‘Green Power’.
Typically, using green power will add between 5.5 and 6.82 cents/kWh to the cost of your
electricity.
At present there is only one operational on-grid (in front of the meter)
renewable electricity producer in our region – the Moree Solar Farm.
However, more are coming (windfarms and possibly a solar farm near Glen
Innes). Renewable energy can be purchased from other regions via retailers
and typically adds around 6c/kWh to the cost of your electricity.
42
Retailers such as Diamond Energy specialise in supplying renewable energy via the grid to
customers, and the proceeds of their business are used to support a portfolio of renewable
energy assets for wind, biogas, solar and wave energy generation. Like other companies
selling green power, there is an extra cost of 1.1-5.0 C/kWh, depending on what proportion
of the customers electricity comes from renewable sources. For non-residential customers,
you must spend over $30,000 per year on electricity to qualify for their business plans.
Diamond Energy are also developing a product to purchase electricity from battery storage
at 100c/kWh during certain periods when the grid requires extra supply.
Costs of large-scale on-grid renewable energy sources
Large-scale on-grid renewable energy sources are fast approaching or have already reached
cost-competitiveness with coal-fired energy or natural gas based electricity. Some still have
higher average costs of production and the cost of accessing the grid is also a factor. This
later cost is around 13-17c/kWh for electricity, is charged to the retailer and passed onto
the customer.
However, large scale renewable energy benefits from the National Renewable Energy Target
(RET) policy in the order of 7c/kWh via the purchase of large scale renewable energy
certificates (known as LCGs). Energy retailers must purchase LCGs to ensure a proportion of
their energy supply is renewable. Moreover, the cost of most renewable energy
technologies has fallen rapidly in recent years and continues to do so, meaning more
renewable energy options will soon be cost-competitive with fossil fuels.
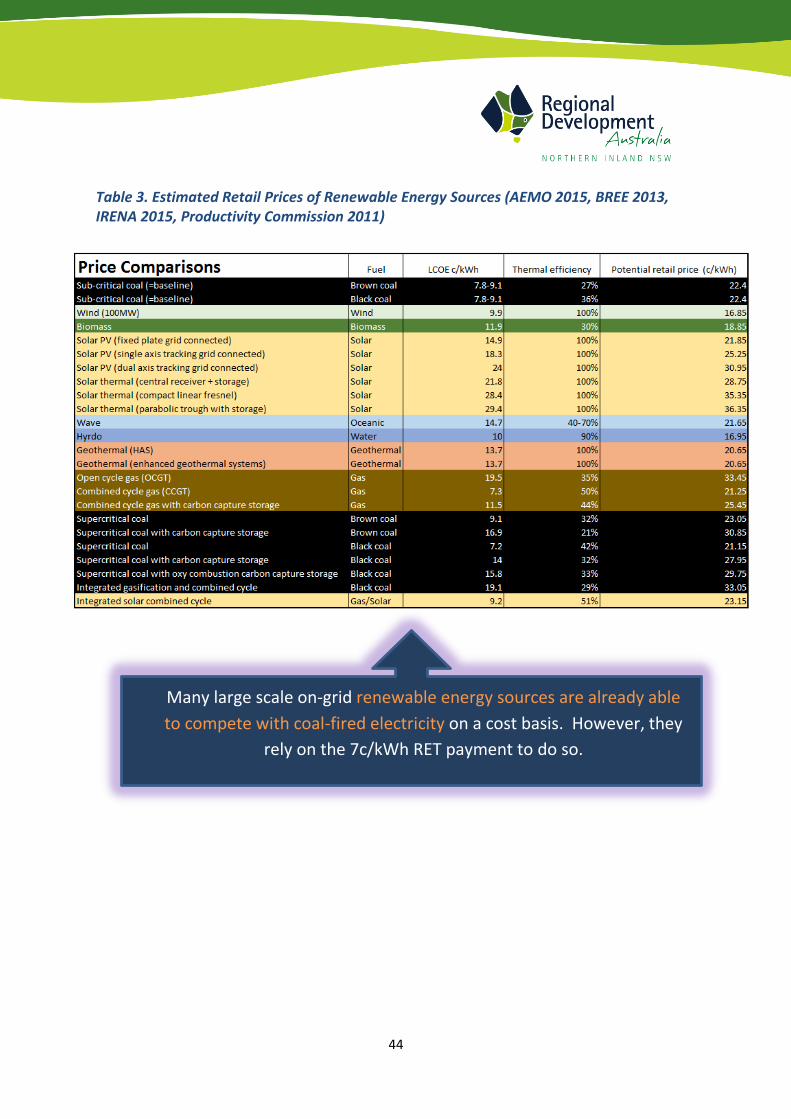
To illustrate the potential retail price of renewables versus fossil fuel electricity, Table 3 has
been calculated. It uses the Levelised Cost of Energy (LCOE) which is a measure of the cost
of generating energy from that source taking account of capital and operating costs, the
amount of energy produced, and expressed as production cost per kWh.
To that production cost are added the typical grid access and retail margin costs to arrive at
a potential retail price paid by the customer.
The LCOE of coal-fired electricity is taken as the baseline for setting the relative retail price
of electricity, and the retail cost of renewable energy is adjusted for the 7c/kWh LCG income
43
received, thus arriving at the comparative retail price for renewable energy sources shown
in Table 3.
Table 3 indicates that several large-scale renewable energy options are currently or almost
cost-competitive with coal-fired electricity including:
Wind (coming to our region soon – White Rock, OneWind and Sapphire wind farms in the Glen Innes/Inverell LGAs);
Biomass (cost depends on fuel source, fuel cost and transport distance);
Some large-scale solar (now operating and feeding into the grid at Moree, also planned for Glen Innes);
Wave (not applicable);
Hydro (not applicable at large scale in our region);
Geothermal (not applicable in our region);
Gas (natural gas currently being developed in parts of our region by Santos).
This cost competitiveness is obviously assisted by the RET income which renewable energy generators receive for selling their LGC certificates to electricity retailers. Recent uncertainty regarding Australian renewable energy policy and the future of the RET payments means this can be a difficult space to operate in. Note also that the LGC price is not fixed at 7c/kWh and varies according to market supply and demand of the certificates.
44
Table 3. Estimated Retail Prices of Renewable Energy Sources (AEMO 2015, BREE 2013, IRENA 2015, Productivity Commission 2011)
Many large scale on-grid renewable energy sources are already able
to compete with coal-fired electricity on a cost basis. However, they
rely on the 7c/kWh RET payment to do so.
45
7. Economic Assessment of Energy Efficiency Initiatives and Behind
the Meter Activities
The decision to invest in energy efficiency or renewable energy activities within a business is
largely an economic decision. While environmental benefits certainly play a role – more in
some businesses than others – there is no escaping the reality that a formal or informal
consideration of the financial costs and benefits will usually be the key decision factor.
SKM (2013) report that firms are typically looking for a payback period of 3.5 years or less,
and that the payback period is the most widely used economic decision making rule for
energy investment decisions. A survey found 60% of businesses would not adopt energy
efficiency initiatives with a payback period of more than 3 years, and that large businesses
were more likely to accept longer payback periods than small businesses. Literature on the
discount rates which businesses apply to these investment decisions suggests that a
payback period of just 2 years is often the threshold.
Our survey of local businesses revealed payback periods ranging from 1.2 to 7 years for
energy saving investments. One business owner commented that he did not understand
businesses who were seeking such short payback periods as 3 years, because even with a
longer payback period his $100,000 investment was saving him $15,000 per year which was
a much better return than most financial investments.
The SKM (2013) study also revealed that on a national scale, the biggest energy use savings
for businesses were likely to come from improvements in HVAC systems, boilers,
commercial lighting and pumps.
It has been reported that since 2007-8, the annual energy efficiency improvement in the
energy-intensive manufacturing and other manufacturing sectors has tripled from 0.4% to
Most businesses expect a payback period of three years or less from
their energy efficiency investments
46
1.2% per annum. Energy efficiency improvements in the mining industry are running at
about 0.9% per annum, however due to increased intensity of operations overall energy
intensity is actually increasing at 2% per annum (ClimateWorks Australia 2014).
Energy Efficiency Initiatives
Langham et al (2010) investigated the economic impacts of energy efficiency measures
which could be adopted by businesses in their buildings. In order of cost effectiveness,
these were:
1. Lighting upgrades – industrial scale business;
2. Purchasing equipment based on energy star ratings – commercial scale business;
3. Lighting upgrades – commercial scale business;
4. Operation and maintenance of lighting - commercial scale business;
5. Operation and maintenance of air handling (inspection of A/C, Optimisation of the
change of the filters, Cleaning of condensing and evaporating coils, fine tuning of
controls, optimal scheduling) - commercial scale business;
6. Operation and maintenance of pumping (fine tuning of controls, optimal scheduling)
- commercial scale business;
7. Fan high efficiency motors, variable speed drives - commercial scale business;
8. Lighting upgrade before end of life - industrial scale business;
9. Operation and maintenance of cooling (Inspection of A/C, Optimisation of the
change of the filters, Cleaning of condensing and evaporating coils, fine tuning of
controls, optimal scheduling) - commercial scale business;
10. High Efficiency cooling pump (install high efficiency air conditioning) - commercial
scale business;
11. Operation and maintenance of electric heating - commercial scale business;
12. High Efficiency cooling (install high efficiency air conditioning) - commercial scale
business;
13. Lighting upgrade before end of life (state-of-the-art technologies in highly efficient,
dynamic lighting systems equipment and controls) - commercial scale business.
Businesses have a range of cost effective options for improving energy
efficiency
47
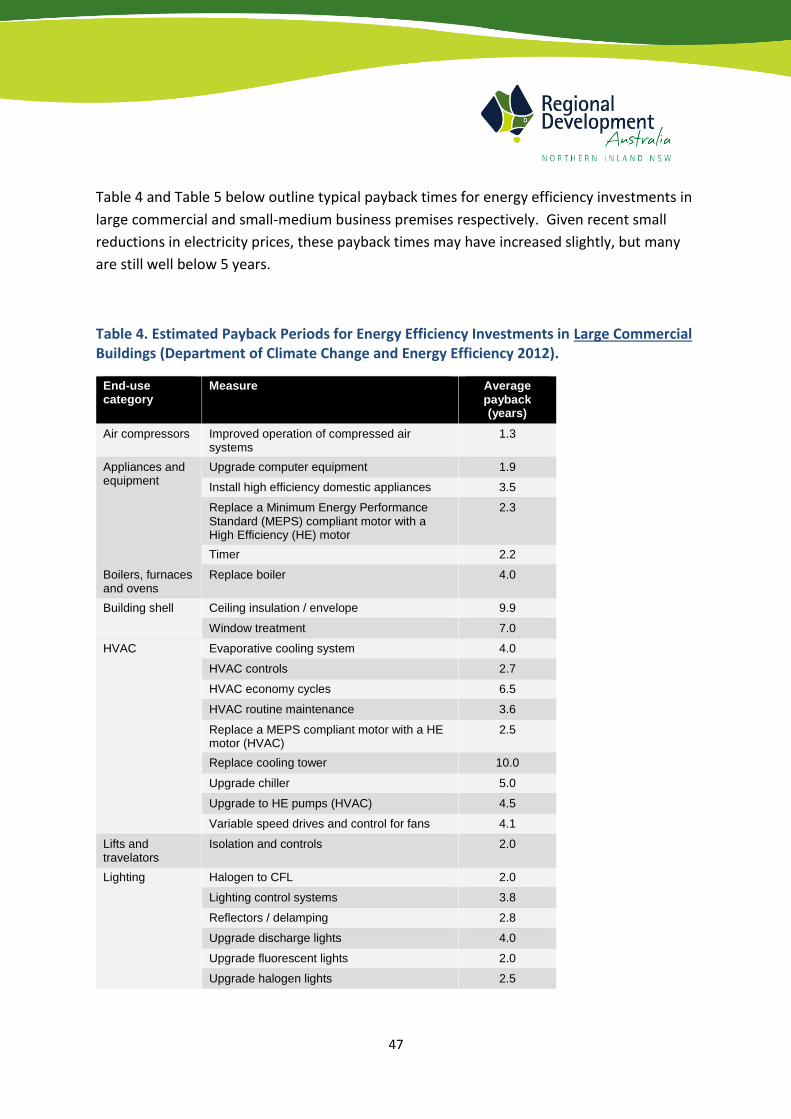
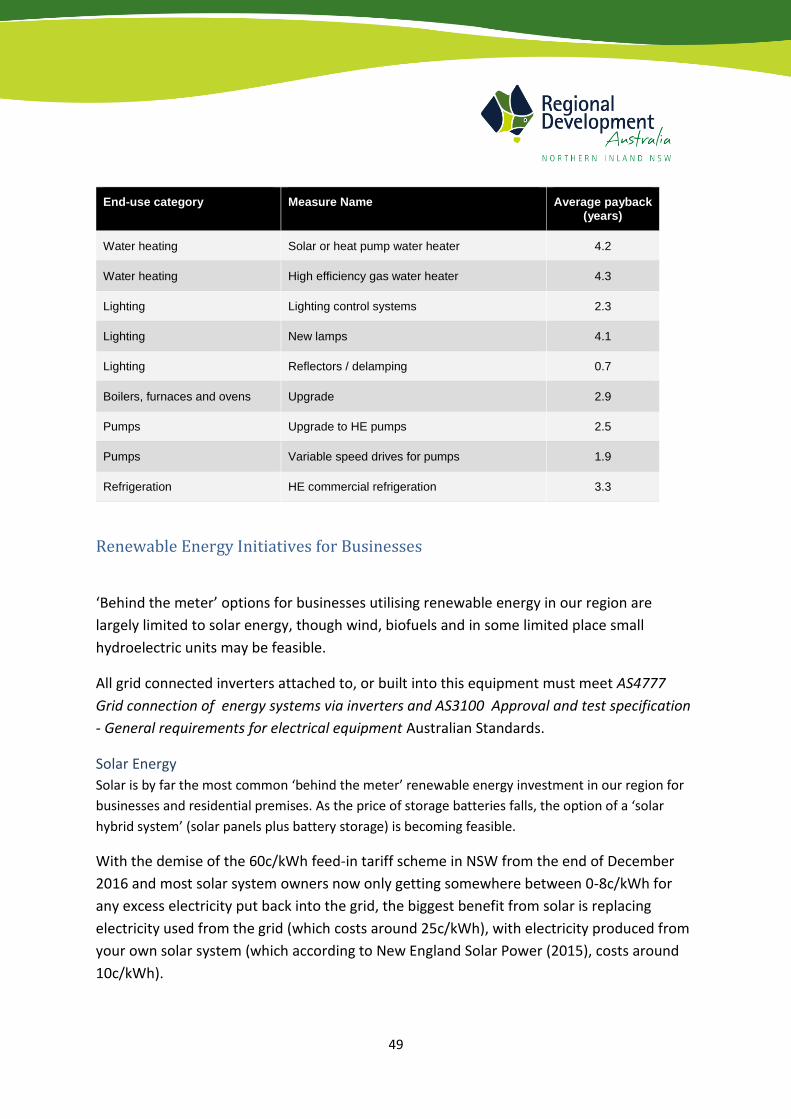
Table 4 and Table 5 below outline typical payback times for energy efficiency investments in
large commercial and small-medium business premises respectively. Given recent small
reductions in electricity prices, these payback times may have increased slightly, but many
are still well below 5 years.
Table 4. Estimated Payback Periods for Energy Efficiency Investments in Large Commercial Buildings (Department of Climate Change and Energy Efficiency 2012).
End-use category
Measure Average payback (years)
Air compressors Improved operation of compressed air systems
1.3
Appliances and equipment
Upgrade computer equipment 1.9
Install high efficiency domestic appliances 3.5
Replace a Minimum Energy Performance Standard (MEPS) compliant motor with a High Efficiency (HE) motor
2.3
Timer 2.2
Boilers, furnaces and ovens
Replace boiler 4.0
Building shell Ceiling insulation / envelope 9.9
Window treatment 7.0
HVAC Evaporative cooling system 4.0
HVAC controls 2.7
HVAC economy cycles 6.5
HVAC routine maintenance 3.6
Replace a MEPS compliant motor with a HE motor (HVAC)
2.5
Replace cooling tower 10.0
Upgrade chiller 5.0
Upgrade to HE pumps (HVAC) 4.5
Variable speed drives and control for fans 4.1
Lifts and travelators
Isolation and controls 2.0
Lighting Halogen to CFL 2.0
Lighting control systems 3.8
Reflectors / delamping 2.8
Upgrade discharge lights 4.0
Upgrade fluorescent lights 2.0
Upgrade halogen lights 2.5

48
End-use category
Measure Average payback (years)
Voltage optimisation 3.5
Pumps Variable speed drives for pumps 3.1
Refrigeration HE commercial refrigeration 5.0
Refrigeration Replace a low efficiency fan motor with an Electronically Commutated (EC) motor
1.0
Standalone heating and A/C
High efficiency stand alone AC 4.0
Ventilation / fans Car park ventilation control 2.4
Water heating High efficiency gas water heater 2.6
Solar or heat pump water heater 8.6
Water heating control systems 1.5
Table 5. Estimated Payback Periods for Energy Efficiency Investments in Small to Medium Enterprise Buildings (Department of Climate Change and Energy Efficiency 2012)
End-use category Measure Name Average payback (years)
Air Compressors Improved operation of compressed air systems 3.7
Appliances and equipment Controls, timers and voltage optimisation 2.7
Appliances and equipment Upgrade computer equipment 3.2
Appliances and equipment Replace a Minimum Energy Performance Standard (MEPS) compliant motor with a High Efficiency (HE) motor
4.2
Appliances and equipment Install HE or upgraded domestic appliances 4.0
Appliances and equipment Variable speed drives 2.3
Building shell upgrade Ceiling insulation / envelope 6.9
Building shell upgrade Window treatment 3.0
Ventilation / fans Improve fan efficiency 2.3
Heating and cooling Controls 2.5
Heating and cooling High efficiency stand alone AC 5.6
Water heating Water heating control systems 0.5
49
End-use category Measure Name Average payback (years)
Water heating Solar or heat pump water heater 4.2
Water heating High efficiency gas water heater 4.3
Lighting Lighting control systems 2.3
Lighting New lamps 4.1
Lighting Reflectors / delamping 0.7
Boilers, furnaces and ovens Upgrade 2.9
Pumps Upgrade to HE pumps 2.5
Pumps Variable speed drives for pumps 1.9
Refrigeration HE commercial refrigeration 3.3
Renewable Energy Initiatives for Businesses
‘Behind the meter’ options for businesses utilising renewable energy in our region are
largely limited to solar energy, though wind, biofuels and in some limited place small
hydroelectric units may be feasible.
All grid connected inverters attached to, or built into this equipment must meet AS4777
Grid connection of energy systems via inverters and AS3100 Approval and test specification
- General requirements for electrical equipment Australian Standards.
Solar Energy
Solar is by far the most common ‘behind the meter’ renewable energy investment in our region for
businesses and residential premises. As the price of storage batteries falls, the option of a ‘solar
hybrid system’ (solar panels plus battery storage) is becoming feasible.
With the demise of the 60c/kWh feed-in tariff scheme in NSW from the end of December
2016 and most solar system owners now only getting somewhere between 0-8c/kWh for
any excess electricity put back into the grid, the biggest benefit from solar is replacing
electricity used from the grid (which costs around 25c/kWh), with electricity produced from
your own solar system (which according to New England Solar Power (2015), costs around
10c/kWh).
50
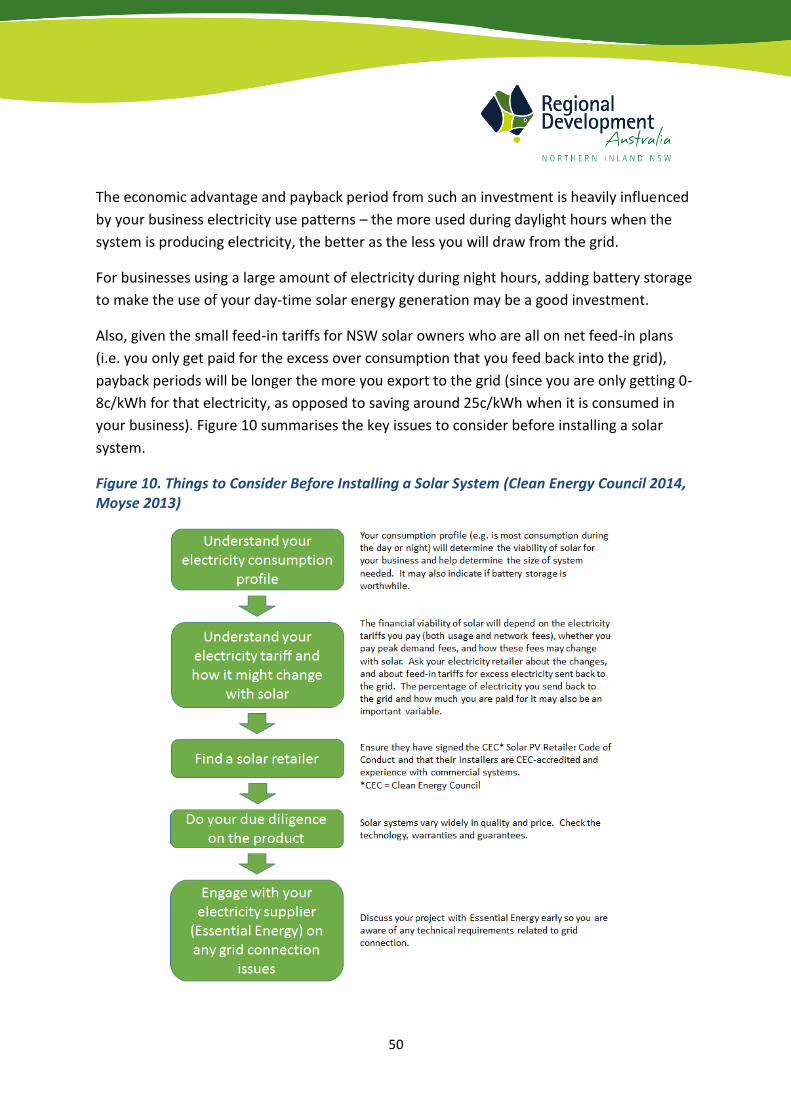
The economic advantage and payback period from such an investment is heavily influenced
by your business electricity use patterns – the more used during daylight hours when the
system is producing electricity, the better as the less you will draw from the grid.
For businesses using a large amount of electricity during night hours, adding battery storage
to make the use of your day-time solar energy generation may be a good investment.
Also, given the small feed-in tariffs for NSW solar owners who are all on net feed-in plans
(i.e. you only get paid for the excess over consumption that you feed back into the grid),
payback periods will be longer the more you export to the grid (since you are only getting 0-
8c/kWh for that electricity, as opposed to saving around 25c/kWh when it is consumed in
your business). Figure 10 summarises the key issues to consider before installing a solar
system.
Figure 10. Things to Consider Before Installing a Solar System (Clean Energy Council 2014, Moyse 2013)
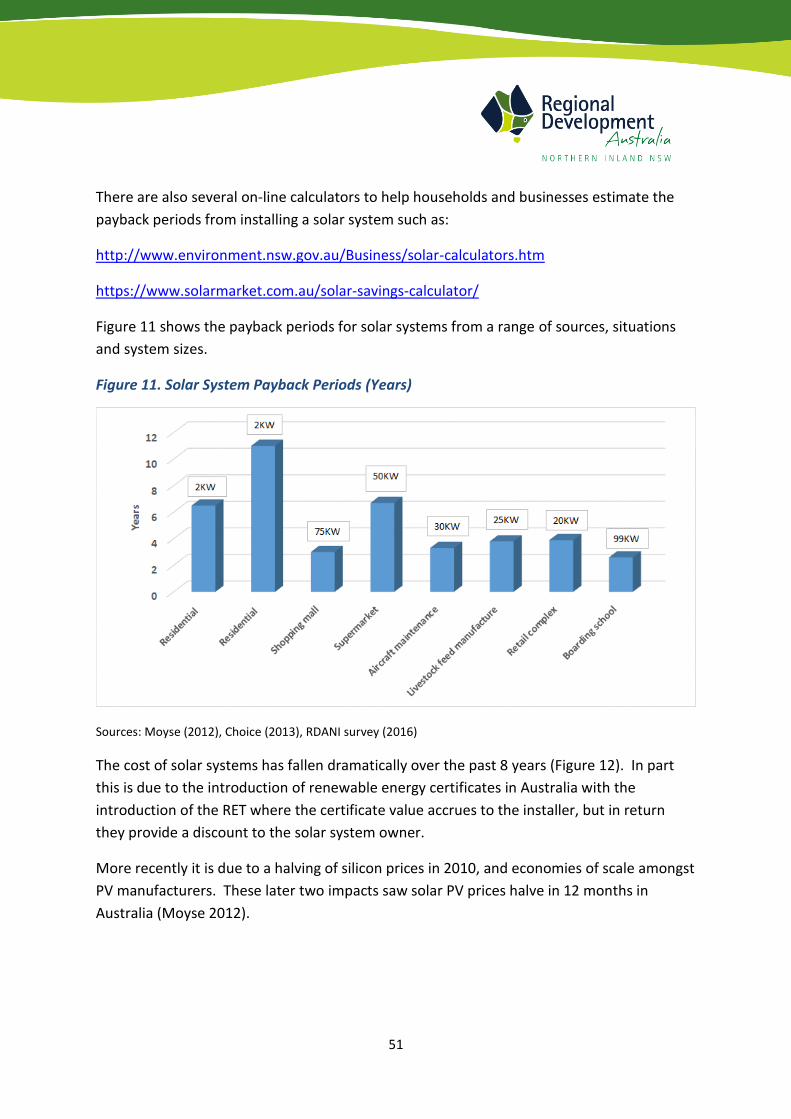
51
There are also several on-line calculators to help households and businesses estimate the
payback periods from installing a solar system such as:
http://www.environment.nsw.gov.au/Business/solar-calculators.htm
https://www.solarmarket.com.au/solar-savings-calculator/
Figure 11 shows the payback periods for solar systems from a range of sources, situations
and system sizes.
Figure 11. Solar System Payback Periods (Years)
Sources: Moyse (2012), Choice (2013), RDANI survey (2016)
The cost of solar systems has fallen dramatically over the past 8 years (Figure 12). In part
this is due to the introduction of renewable energy certificates in Australia with the
introduction of the RET where the certificate value accrues to the installer, but in return
they provide a discount to the solar system owner.
More recently it is due to a halving of silicon prices in 2010, and economies of scale amongst
PV manufacturers. These later two impacts saw solar PV prices halve in 12 months in
Australia (Moyse 2012).
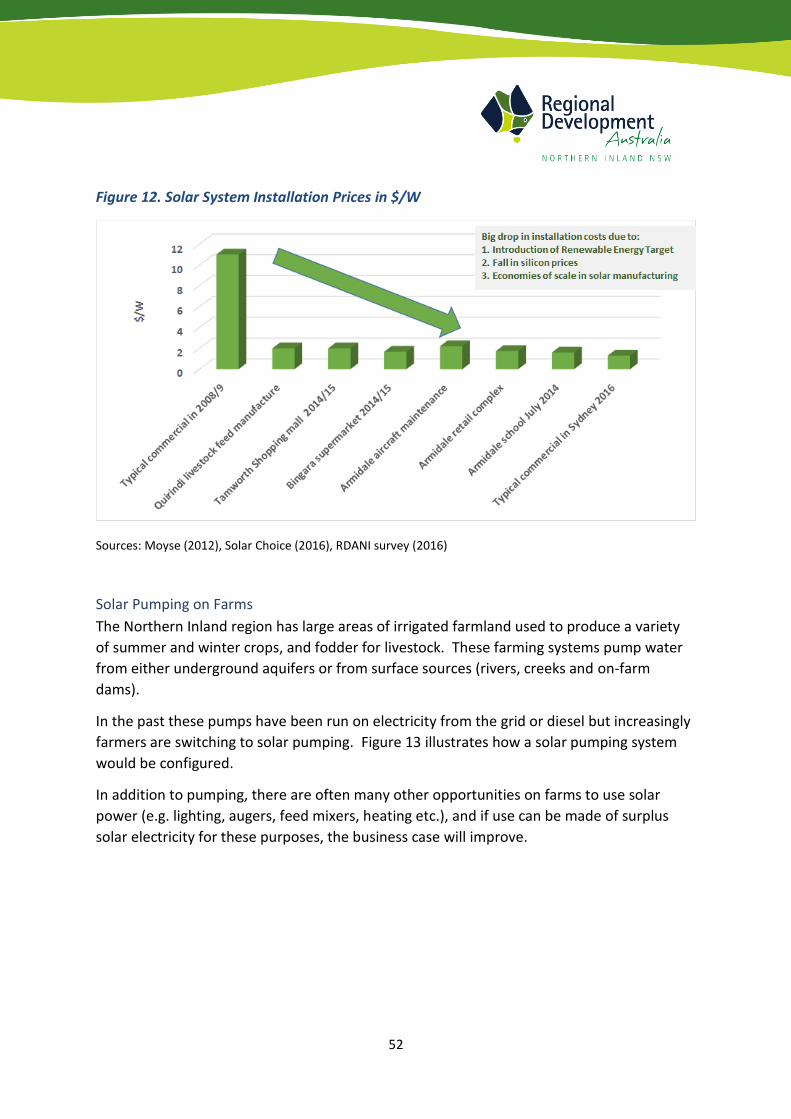
52
Figure 12. Solar System Installation Prices in $/W
Sources: Moyse (2012), Solar Choice (2016), RDANI survey (2016)
Solar Pumping on Farms
The Northern Inland region has large areas of irrigated farmland used to produce a variety
of summer and winter crops, and fodder for livestock. These farming systems pump water
from either underground aquifers or from surface sources (rivers, creeks and on-farm
dams).
In the past these pumps have been run on electricity from the grid or diesel but increasingly
farmers are switching to solar pumping. Figure 13 illustrates how a solar pumping system
would be configured.
In addition to pumping, there are often many other opportunities on farms to use solar
power (e.g. lighting, augers, feed mixers, heating etc.), and if use can be made of surplus
solar electricity for these purposes, the business case will improve.
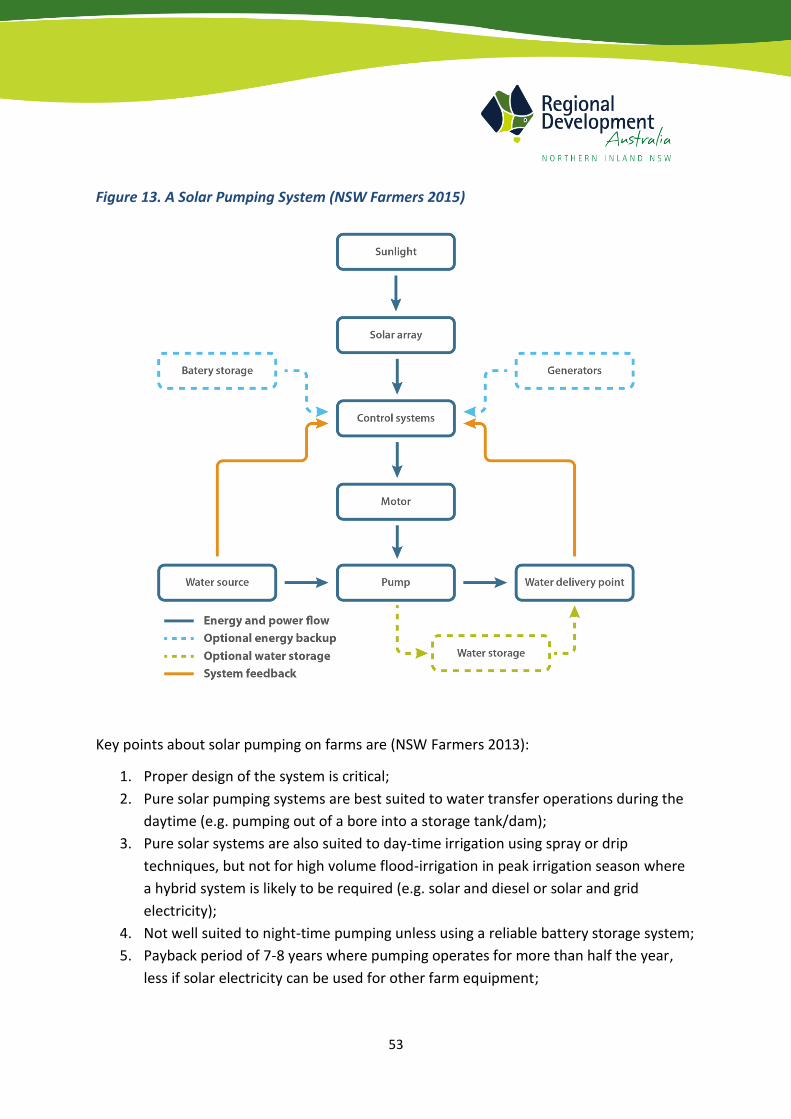
53
Figure 13. A Solar Pumping System (NSW Farmers 2015)
Key points about solar pumping on farms are (NSW Farmers 2013):
1. Proper design of the system is critical;
2. Pure solar pumping systems are best suited to water transfer operations during the
daytime (e.g. pumping out of a bore into a storage tank/dam);
3. Pure solar systems are also suited to day-time irrigation using spray or drip
techniques, but not for high volume flood-irrigation in peak irrigation season where
a hybrid system is likely to be required (e.g. solar and diesel or solar and grid
electricity);
4. Not well suited to night-time pumping unless using a reliable battery storage system;
5. Payback period of 7-8 years where pumping operates for more than half the year,
less if solar electricity can be used for other farm equipment;
54
6. Can have a hybrid diesel-solar pump. The solar pump can pump water into a storage
facility, which can then be used for night-time or cloudy-day irrigation using the
diesel pump. This reduces diesel costs however these systems have high up-front
costs;
7. Pure solar systems are very efficient (90+%) and can range from 200W-21KW, with
the largest systems delivering 2,500L/min and a 350 foot lift;
8. Both surface and submersible (bore) pumps are available;
9. Solar pump prices are higher than electric or diesel pumps, being in the range of
$1,000-6,000/kW;
10. The most economic option is to install solar pumping configurations which are small
and used often, which often means pumping into storages;
11. The cost of the storage facility also needs to be considered and weighed up against
the electricity/diesel cost saving;
12. Ground-mounted solar systems of less than 10kW typically cost $2.50-3.00 per watt
to purchase and install (after allowing for STC rebates from the installer);
13. Also consider the alternative cost of running a mains electricity line to the pump as
opposed to a solar system;
14. The size of the solar system is determined by the amount of water that needs to be
moved, by how far and to what elevation.
Table 6 outline some of the pros and cons of adopting solar pumping.
For more detail on how to assess if solar pumping is right for your farm see Section 3 of the
NSW Farmers document: ‘Solar-powered pumping in agriculture: A guide to system
selection and design’ available at:
https://www.nswfarmers.org.au/__data/assets/pdf_file/0014/46031/OEH-Solar-PV-
Pumping-Guide-final-draft-20150521.pdf .
There is also software available to assist in the design and selection of farm solar pumping
systems:
http://www.solarcass.com/
http://net.grundfos.com/Appl/WebCAPS
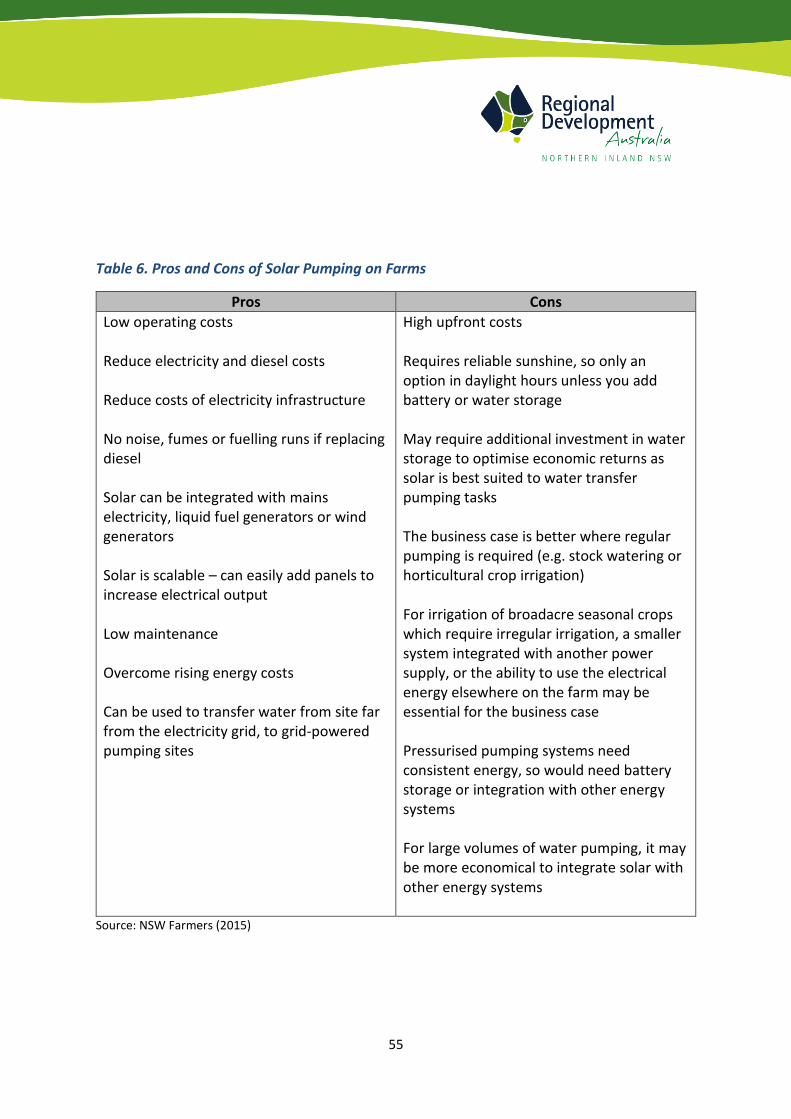
55
Table 6. Pros and Cons of Solar Pumping on Farms
Pros Cons
Low operating costs Reduce electricity and diesel costs Reduce costs of electricity infrastructure No noise, fumes or fuelling runs if replacing diesel Solar can be integrated with mains electricity, liquid fuel generators or wind generators Solar is scalable – can easily add panels to increase electrical output Low maintenance Overcome rising energy costs Can be used to transfer water from site far from the electricity grid, to grid-powered pumping sites
High upfront costs Requires reliable sunshine, so only an option in daylight hours unless you add battery or water storage May require additional investment in water storage to optimise economic returns as solar is best suited to water transfer pumping tasks The business case is better where regular pumping is required (e.g. stock watering or horticultural crop irrigation) For irrigation of broadacre seasonal crops which require irregular irrigation, a smaller system integrated with another power supply, or the ability to use the electrical energy elsewhere on the farm may be essential for the business case Pressurised pumping systems need consistent energy, so would need battery storage or integration with other energy systems For large volumes of water pumping, it may be more economical to integrate solar with other energy systems
Source: NSW Farmers (2015)

56
Wind Energy
Any wind energy that is ‘behind the meter’ will be small to medium scale, not the large scale
turbines seen in commercial windfarms and planned for the Glen Innes and Inverell
projects.
Overall in our region, it seems unlikely that wind generation can compete with solar due to
the additional cost (around $10/W install cost for wind compared to $2/W for solar), and
the difficulty in finding good sites for smaller turbines which typically need to be at least
30m high (James Goodwin, personal communication April 2016). Table 7 provides a
comparison of wind and solar electricity generation.
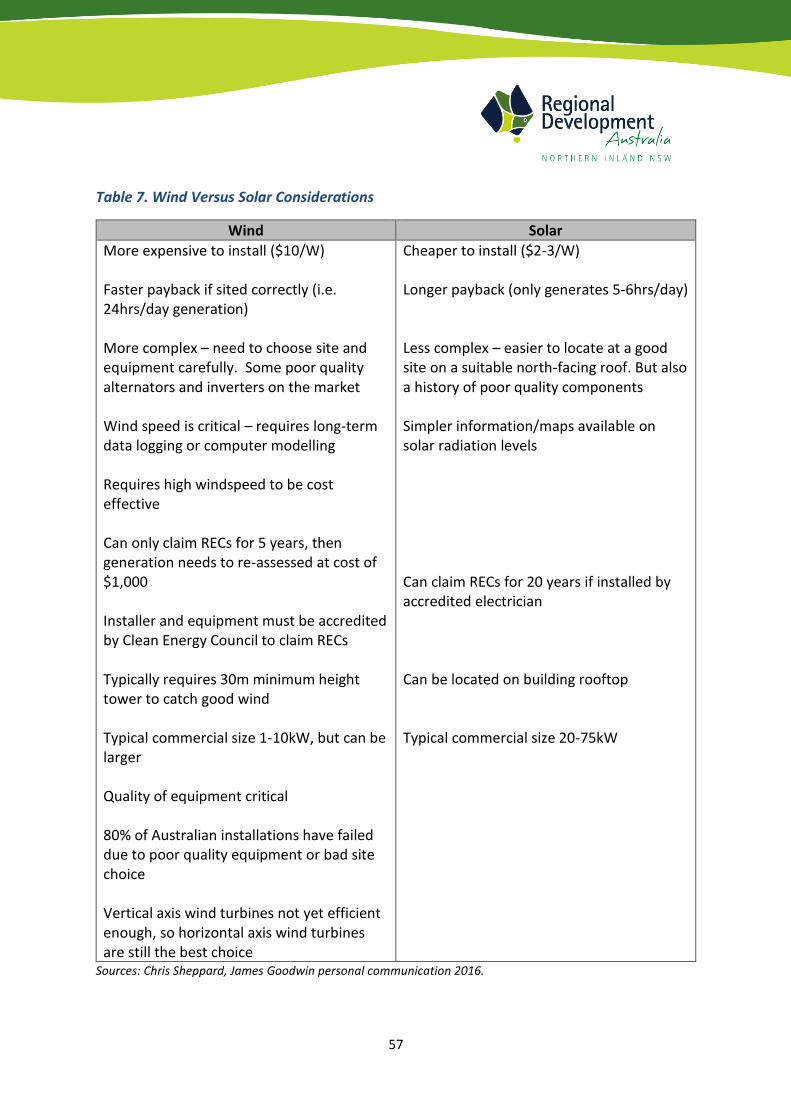
57
Table 7. Wind Versus Solar Considerations
Wind Solar
More expensive to install ($10/W) Faster payback if sited correctly (i.e. 24hrs/day generation) More complex – need to choose site and equipment carefully. Some poor quality alternators and inverters on the market Wind speed is critical – requires long-term data logging or computer modelling Requires high windspeed to be cost effective Can only claim RECs for 5 years, then generation needs to re-assessed at cost of $1,000 Installer and equipment must be accredited by Clean Energy Council to claim RECs Typically requires 30m minimum height tower to catch good wind Typical commercial size 1-10kW, but can be larger Quality of equipment critical 80% of Australian installations have failed due to poor quality equipment or bad site choice Vertical axis wind turbines not yet efficient enough, so horizontal axis wind turbines are still the best choice
Cheaper to install ($2-3/W) Longer payback (only generates 5-6hrs/day) Less complex – easier to locate at a good site on a suitable north-facing roof. But also a history of poor quality components Simpler information/maps available on solar radiation levels Can claim RECs for 20 years if installed by accredited electrician Can be located on building rooftop Typical commercial size 20-75kW
Sources: Chris Sheppard, James Goodwin personal communication 2016.
58
Small/medium-scale wind energy generally refers to wind turbines rated less than 100 kW
(usually 1-10kW) which are mostly intended to supply electricity to buildings, and may or
may not be connected to the grid. This is distinct to ‘utility-scale’ wind turbines, rated
between several hundred kilowatts and a few megawatts each, which form wind farms
onshore (predominantly in rural areas) and offshore, and are almost always grid-connected.
These small turbines typically have a hub height of around 11m and a rotor diameter of
3.5m, compared to 82m and 78m respectively for large scale turbines (The Carbon Trust
2008, Sustainability Victoria 2010).
However, in our region it has been found that to catch clean reliable wind and be cost-
effective, the turbine must be at least 7-10m higher than any significant obstacle within a
300-500m radius – meaning typically 30+m of height.
Taller towers tend to be economically viable as they produce more power even though they
are more expensive. For example, doubling the height of a tower from 18m to 38m may
involve a 17% increase in cost, but a 150% increase in power output (Sustainability Victoria
2010). Clearly however, tower height may be restricted by planning regulations.
As for solar systems, wind turbine systems under 10kW capacity and 25MWh per annum
output are eligible for STCs under the RET, which currently trade at around $40/MWh.
These are usually paid in three instalments – at the time of installation, at 5 years and 10
years although you can opt to have them paid annually. However, unlike solar, the wind
generation will have to be re-assessed every 5 years.
Typically a wind system will earn more STCs than an equivalent rated solar system. Unlike
most solar system installation where the installer claims the STC income, but gives the
system owner a discount on the install cost in lieu of those credits, for wind systems the
owner may claim the credits.
Figure 14 illustrates the STC income that would be received from a small scale wind system
over 10 years. This is an additional benefit to the electricity saved by generating your own
power from the wind.
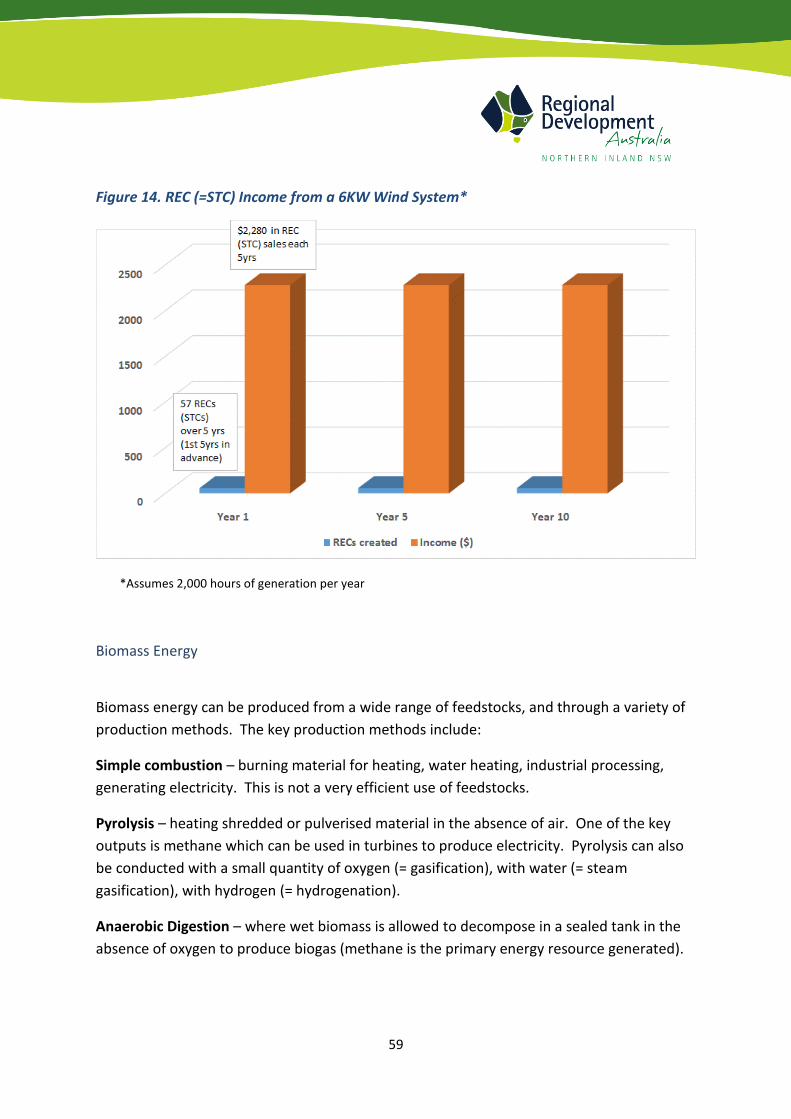
59
Figure 14. REC (=STC) Income from a 6KW Wind System*
*Assumes 2,000 hours of generation per year
Biomass Energy
Biomass energy can be produced from a wide range of feedstocks, and through a variety of
production methods. The key production methods include:
Simple combustion – burning material for heating, water heating, industrial processing,
generating electricity. This is not a very efficient use of feedstocks.
Pyrolysis – heating shredded or pulverised material in the absence of air. One of the key
outputs is methane which can be used in turbines to produce electricity. Pyrolysis can also
be conducted with a small quantity of oxygen (= gasification), with water (= steam
gasification), with hydrogen (= hydrogenation).
Anaerobic Digestion – where wet biomass is allowed to decompose in a sealed tank in the
absence of oxygen to produce biogas (methane is the primary energy resource generated).
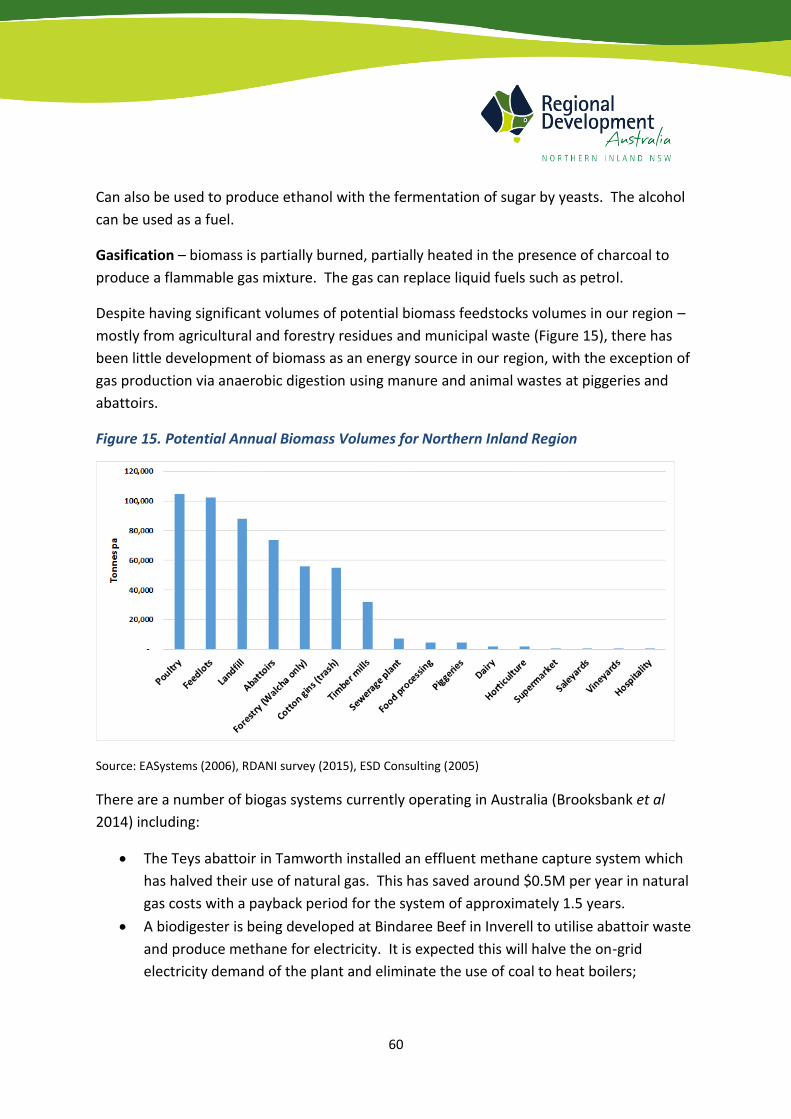
60
Can also be used to produce ethanol with the fermentation of sugar by yeasts. The alcohol
can be used as a fuel.
Gasification – biomass is partially burned, partially heated in the presence of charcoal to
produce a flammable gas mixture. The gas can replace liquid fuels such as petrol.
Despite having significant volumes of potential biomass feedstocks volumes in our region –
mostly from agricultural and forestry residues and municipal waste (Figure 15), there has
been little development of biomass as an energy source in our region, with the exception of
gas production via anaerobic digestion using manure and animal wastes at piggeries and
abattoirs.
Figure 15. Potential Annual Biomass Volumes for Northern Inland Region
Source: EASystems (2006), RDANI survey (2015), ESD Consulting (2005)
There are a number of biogas systems currently operating in Australia (Brooksbank et al
2014) including:
The Teys abattoir in Tamworth installed an effluent methane capture system which
has halved their use of natural gas. This has saved around $0.5M per year in natural
gas costs with a payback period for the system of approximately 1.5 years.
A biodigester is being developed at Bindaree Beef in Inverell to utilise abattoir waste
and produce methane for electricity. It is expected this will halve the on-grid
electricity demand of the plant and eliminate the use of coal to heat boilers;
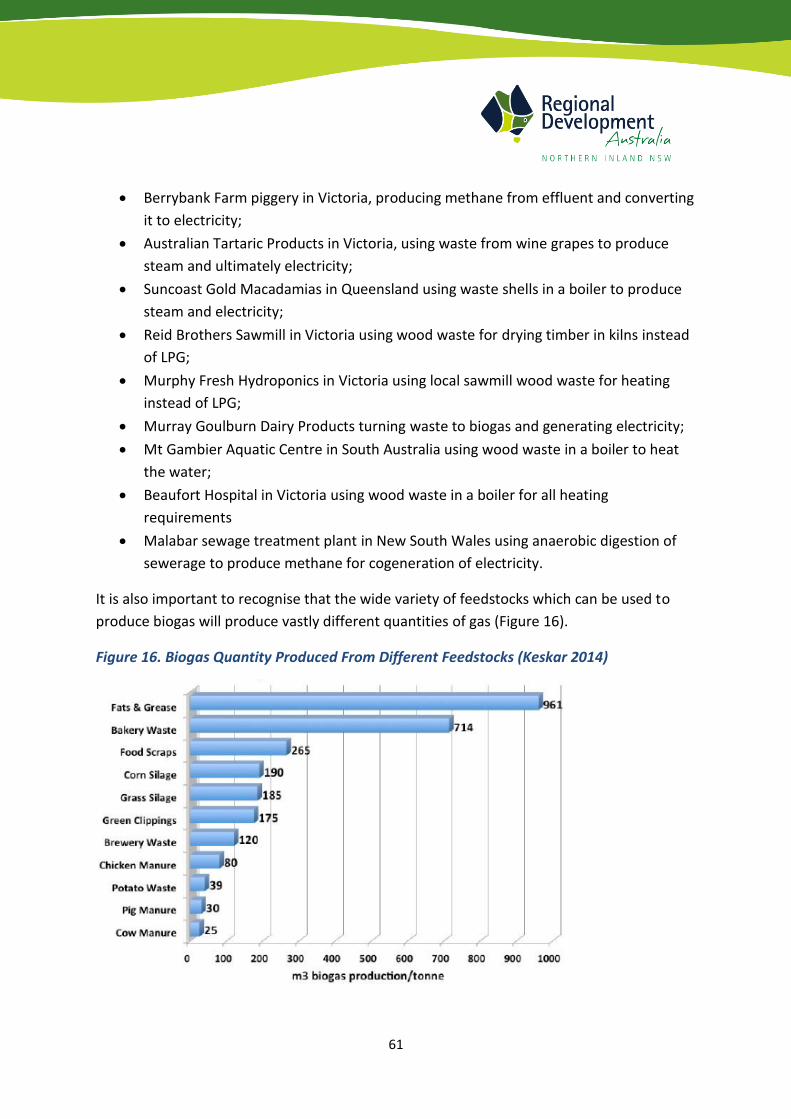
61
Berrybank Farm piggery in Victoria, producing methane from effluent and converting
it to electricity;
Australian Tartaric Products in Victoria, using waste from wine grapes to produce
steam and ultimately electricity;
Suncoast Gold Macadamias in Queensland using waste shells in a boiler to produce
steam and electricity;
Reid Brothers Sawmill in Victoria using wood waste for drying timber in kilns instead
of LPG;
Murphy Fresh Hydroponics in Victoria using local sawmill wood waste for heating
instead of LPG;
Murray Goulburn Dairy Products turning waste to biogas and generating electricity;
Mt Gambier Aquatic Centre in South Australia using wood waste in a boiler to heat
the water;
Beaufort Hospital in Victoria using wood waste in a boiler for all heating
requirements
Malabar sewage treatment plant in New South Wales using anaerobic digestion of
sewerage to produce methane for cogeneration of electricity.
It is also important to recognise that the wide variety of feedstocks which can be used to
produce biogas will produce vastly different quantities of gas (Figure 16).
Figure 16. Biogas Quantity Produced From Different Feedstocks (Keskar 2014)
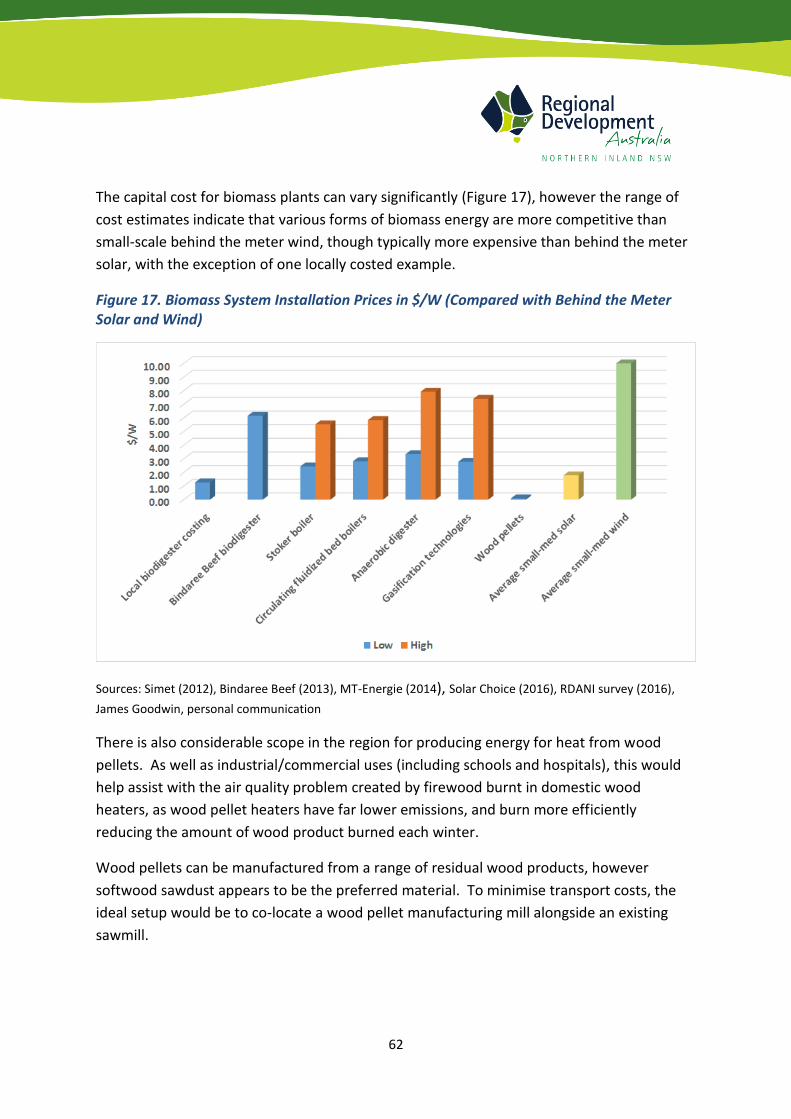
62
The capital cost for biomass plants can vary significantly (Figure 17), however the range of
cost estimates indicate that various forms of biomass energy are more competitive than
small-scale behind the meter wind, though typically more expensive than behind the meter
solar, with the exception of one locally costed example.
Figure 17. Biomass System Installation Prices in $/W (Compared with Behind the Meter Solar and Wind)
Sources: Simet (2012), Bindaree Beef (2013), MT-Energie (2014), Solar Choice (2016), RDANI survey (2016),
James Goodwin, personal communication
There is also considerable scope in the region for producing energy for heat from wood
pellets. As well as industrial/commercial uses (including schools and hospitals), this would
help assist with the air quality problem created by firewood burnt in domestic wood
heaters, as wood pellet heaters have far lower emissions, and burn more efficiently
reducing the amount of wood product burned each winter.
Wood pellets can be manufactured from a range of residual wood products, however
softwood sawdust appears to be the preferred material. To minimise transport costs, the
ideal setup would be to co-locate a wood pellet manufacturing mill alongside an existing
sawmill.
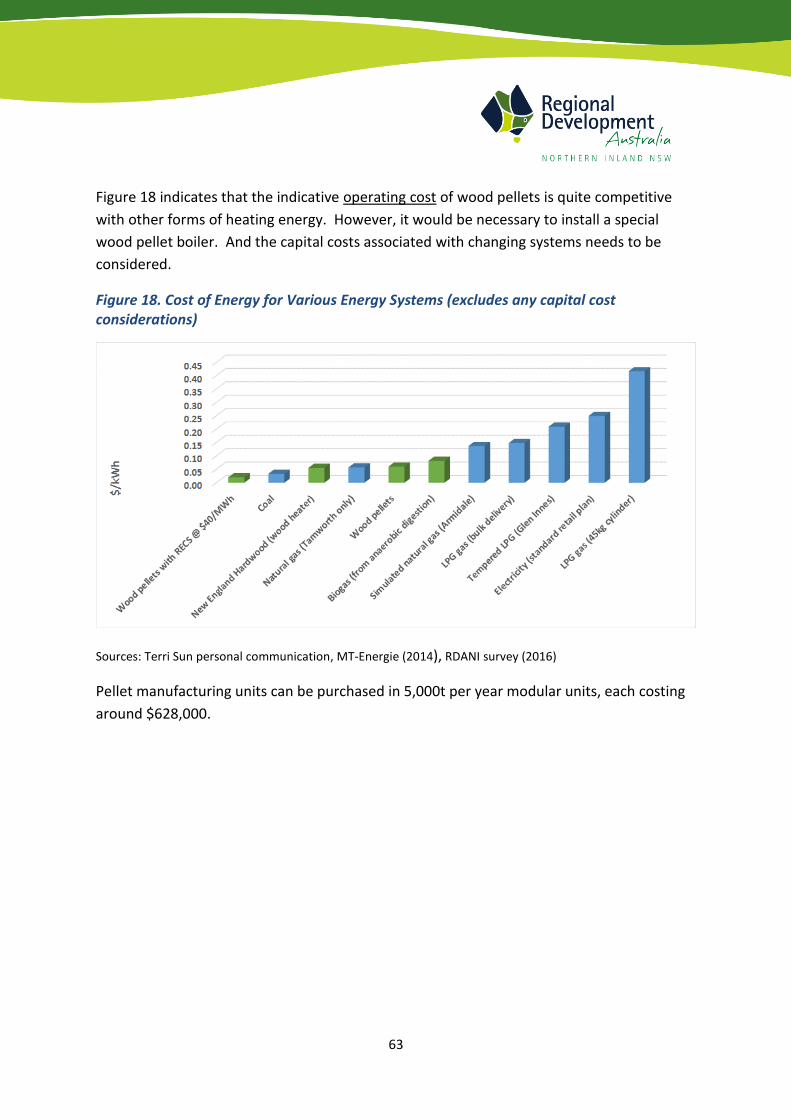
63
Figure 18 indicates that the indicative operating cost of wood pellets is quite competitive
with other forms of heating energy. However, it would be necessary to install a special
wood pellet boiler. And the capital costs associated with changing systems needs to be
considered.
Figure 18. Cost of Energy for Various Energy Systems (excludes any capital cost considerations)
Sources: Terri Sun personal communication, MT-Energie (2014), RDANI survey (2016)
Pellet manufacturing units can be purchased in 5,000t per year modular units, each costing
around $628,000.
64
8. Economic Assessment of Additional Energy Infrastructure
Required to Deliver Energy from Renewable Sources
The New England region has been highlighted as a prime area for developing renewable
generation and is home to several high quality renewable energy resources. Currently, the
local transmission line from Glen Innes to Inverell is limited to one 120MW generator,
whereas a Renewable Energy Hub could potentially allow for more than 700MW of
renewable energy generation. TransGrid are investigating such a hub.
A Hub would enable the connection of multiple generators in one location, optimising the
transmission network, reducing the cost of connection and bring increased economic
benefit to the region.
TransGrid’s feasibility study will test the model for bringing several renewable energy
producers together in the National Electricity Market and in the New England region
(Aurecon 2016).
Smart Grids
Because of the problem of inherent variability of many forms of renewable energy due to
environmental factors (e.g. wind speed, sunlight), the ultimate answer to this problem it to
set up a Smart Grid.
Existing grid systems already incorporate elements of smart functionality, but this is mostly
used to balance supply and demand.
Smart grids incorporate information and communications technology into every aspect of
electricity generation, delivery and consumption in order to minimise environmental
impact, enhance markets, improve reliability and service, and reduce costs and improve
efficiency (IRENA 2013).
A Smart Grid assists with renewable energy generation by:
1. Coping with variability of electricity supply;
2. Coping with small-scale renewable energy generations systems; and
3. Cater for the initial higher cost of renewable systems.
The four key components of a smart grid include:
65
1. Information collectors – sensors which measure various aspects of system
performance;
2. Information assemblers, displays and assessors – accept information from collectors
to display and analyse it;
3. Information-based controllers – change the behaviour of the system to achieve
various goals; and
4. Energy resources – generate, store or reduce demand for electricity.
Smart grids allow a diverse array of electricity sources to be integrate by performing
functions as cutting the power supply to interruptible users for short periods if there is little
wind and wind energy generation drops away.
Monitoring and control of the electrical system is important, and smart grids can also
address these needs. They can change supply volumes and voltage as required and supply
real-time information on supply and demand of electricity. This also helps with accurate
pricing of distributed renewable energy.
The ability to aggregate and control the electrical output of numerous dispersed small scale
renewable generators also helps overcome the high capital cost of establishing a single large
scale plant.
There is also the capacity to link electricity price signals to smart appliances, such that they
only operate when a specific electricity price level is reached, saving the consumer money.
Smart grids will also be compatible with and help refine the operation of the imminent
increase in battery storage.
Some smart grids can also ‘island’ if the main grid goes down, thus run in stand-alone mode
providing energy.
66
9. Funding Your Project - Financing and Grants/Programs
First, it is important to remember that typically, financiers of energy efficiency purchases by
businesses will not offer a finance term longer than the warranty available on the product.
Secondly, the source of finance you are seeking for your project can come from several
options including:
Finance – either self-funded from your reserves or cashflow, or borrowing from a
commercial lender, government organisation or energy retailer;
Grants or Project Support – from a government organisation;
Income Stream – through renewable energy certificates, carbon credits or feed-in
tariffs for electricity;
Equity or Venture Capital Partners – community investors, angel investors or
government organisations.
Figure 19 below provides a decision chart to step you through the options for funding your
energy efficiency or renewable energy project. Be aware that government programs in this
space are constantly changing with new programs coming on-stream and old programs
closing.
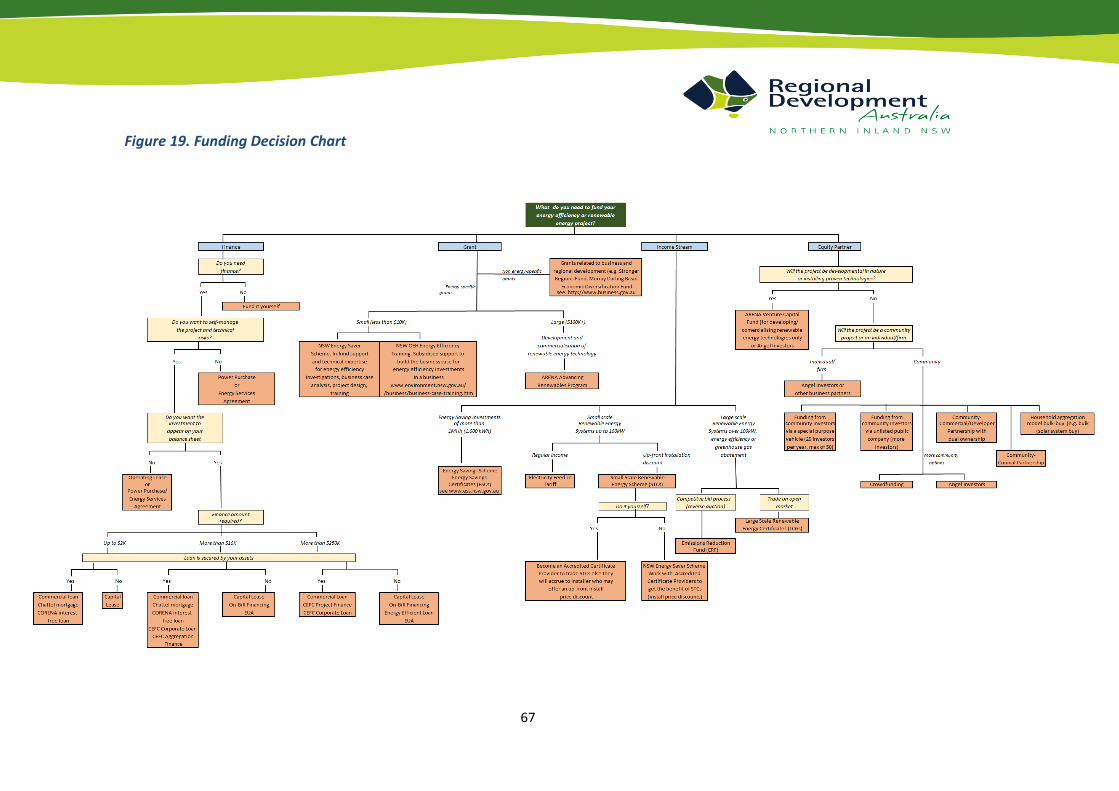
67
Figure 19. Funding Decision Chart
68
10. What About Community Owned Energy Projects?
Community energy projects involve a large component of local community investment and
ownership. They may be entirely community owned, or have shared ownership with an
energy developer or other investor.
Their primary objective is that a large proportion of the benefits flow back to local
community members in the form of;
Locally produced energy at a competitive price;
Generation of local jobs and skills;
Retaining the money paid for energy in the local economy;
Share and dividend income for local investors.
Key features of community owned projects are summarised below in Table 8, highlighting
the pros and cons of such projects:
Table 8. Pros and Cons of Community Energy Projects
Pros Cons
Often initiated and primarily owned by the local community Primarily local investment Minimal commercial interests There will be a lot of learning while doing Economic, environmental and social benefits for the local community that commercial renewable energy developments don't offer Co-ownership increases local/public acceptance
This process will be a marathon, not a sprint There will be a lot of learning while doing Development costs alone may be $500K - $1M Banks & institutional investors probably won't lend money for project development costs Because of the expense may need to attract both local and outside investors Each project is slightly different – no one size fits all template to follow
69
Often re-invest profits in local community projects Fit in the space between individual and large-scale utility generators Motivations include - energy security, reduce carbon footprint, boost local economy, support renewables education/uptake Better match local energy needs, utilise waste streams productively
Key complexities are - financing to reach an 'investment ready' phase, getting a fair price for electricity, grid connection Becoming an electricity retailer in your own right requires an application process to the Australian Energy Regulator, licencing fees, regular reporting and securing grid access and paying grid charges (which are usually re-couped from customers)
Figure 20 below provides an overview of the typical steps to be followed to successfully
develop and implement a community energy project, though as noted above no two
projects are exactly the same, each will present a unique set of issues to be dealt with.
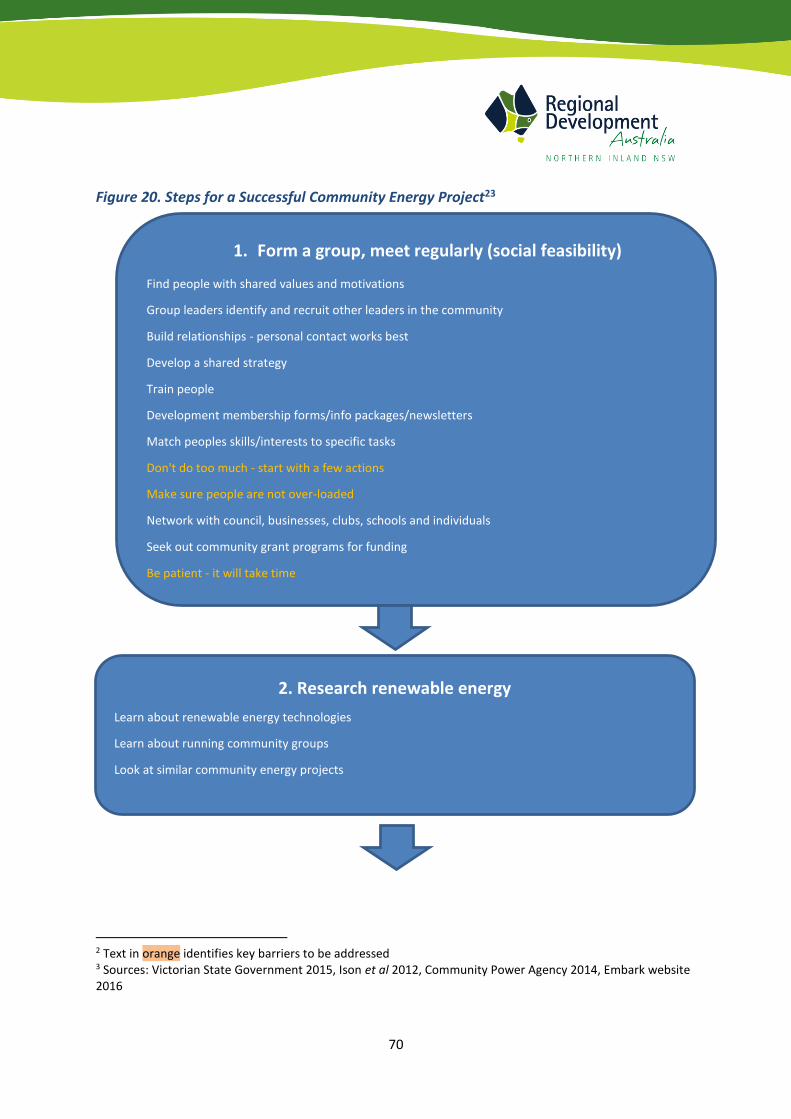
70
Figure 20. Steps for a Successful Community Energy Project23
2 Text in orange identifies key barriers to be addressed 3 Sources: Victorian State Government 2015, Ison et al 2012, Community Power Agency 2014, Embark website 2016
1. Form a group, meet regularly (social feasibility)
Find people with shared values and motivations
Group leaders identify and recruit other leaders in the community
Build relationships - personal contact works best
Develop a shared strategy
Train people
Development membership forms/info packages/newsletters
Match peoples skills/interests to specific tasks
Don't do too much - start with a few actions
Make sure people are not over-loaded
Network with council, businesses, clubs, schools and individuals
Seek out community grant programs for funding
Be patient - it will take time
2. Research renewable energy
Learn about renewable energy technologies
Learn about running community groups
Look at similar community energy projects
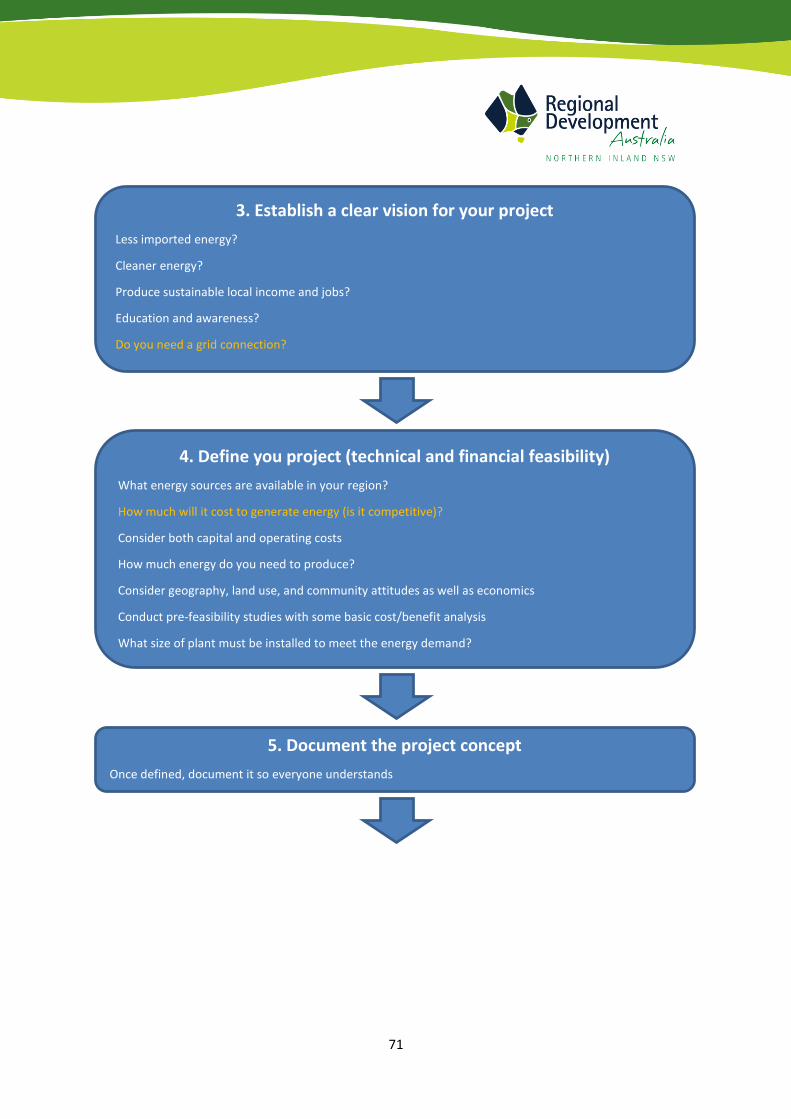
71
3. Establish a clear vision for your project
Less imported energy?
Cleaner energy?
Produce sustainable local income and jobs?
Education and awareness?
Do you need a grid connection?
4. Define you project (technical and financial feasibility)
What energy sources are available in your region?
How much will it cost to generate energy (is it competitive)?
Consider both capital and operating costs
How much energy do you need to produce?
Consider geography, land use, and community attitudes as well as economics
Conduct pre-feasibility studies with some basic cost/benefit analysis
What size of plant must be installed to meet the energy demand?
5. Document the project concept
Once defined, document it so everyone understands
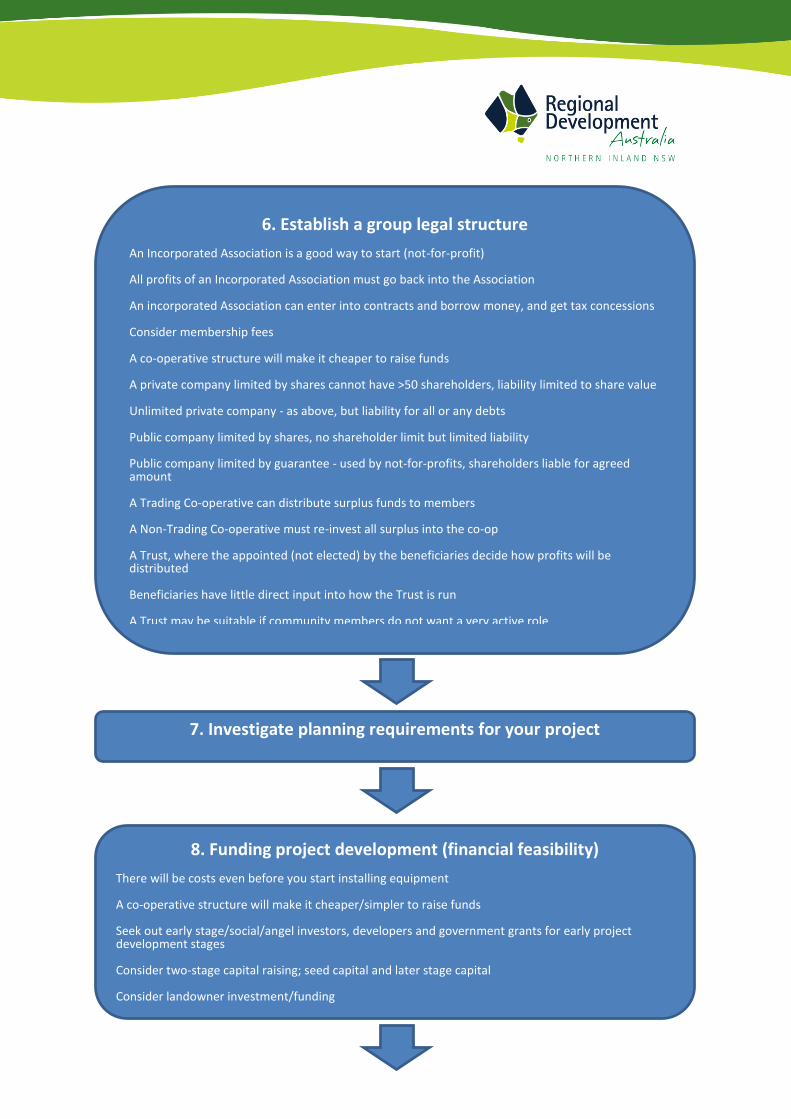
72
6. Establish a group legal structure
An Incorporated Association is a good way to start (not-for-profit)
All profits of an Incorporated Association must go back into the Association
An incorporated Association can enter into contracts and borrow money, and get tax concessions
Consider membership fees
A co-operative structure will make it cheaper to raise funds
A private company limited by shares cannot have >50 shareholders, liability limited to share value
Unlimited private company - as above, but liability for all or any debts
Public company limited by shares, no shareholder limit but limited liability
Public company limited by guarantee - used by not-for-profits, shareholders liable for agreed amount
A Trading Co-operative can distribute surplus funds to members
A Non-Trading Co-operative must re-invest all surplus into the co-op
A Trust, where the appointed (not elected) by the beneficiaries decide how profits will be distributed
Beneficiaries have little direct input into how the Trust is run
A Trust may be suitable if community members do not want a very active role
7. Investigate planning requirements for your project
8. Funding project development (financial feasibility)
There will be costs even before you start installing equipment
A co-operative structure will make it cheaper/simpler to raise funds
Seek out early stage/social/angel investors, developers and government grants for early project development stages
Consider two-stage capital raising; seed capital and later stage capital
Consider landowner investment/funding
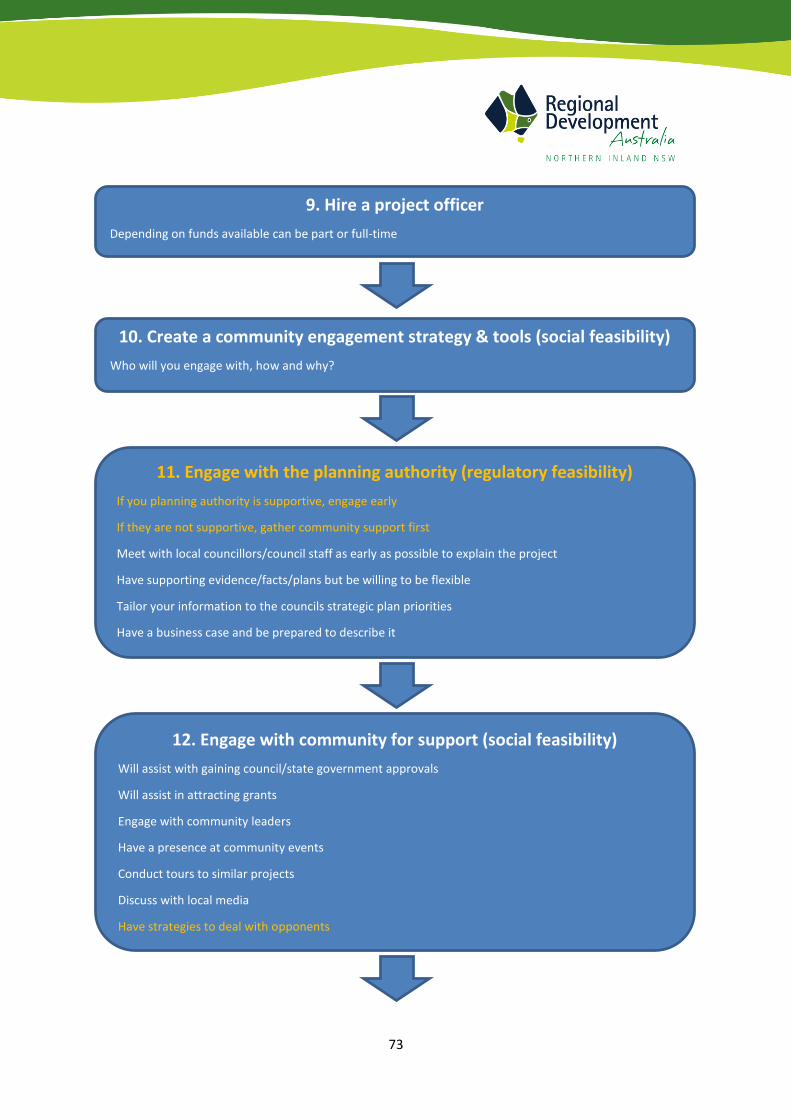
73
9. Hire a project officer
Depending on funds available can be part or full-time
10. Create a community engagement strategy & tools (social feasibility)
Who will you engage with, how and why?
11. Engage with the planning authority (regulatory feasibility)
If you planning authority is supportive, engage early
If they are not supportive, gather community support first
Meet with local councillors/council staff as early as possible to explain the project
Have supporting evidence/facts/plans but be willing to be flexible
Tailor your information to the councils strategic plan priorities
Have a business case and be prepared to describe it
12. Engage with community for support (social feasibility)
Will assist with gaining council/state government approvals
Will assist in attracting grants
Engage with community leaders
Have a presence at community events
Conduct tours to similar projects
Discuss with local media
Have strategies to deal with opponents
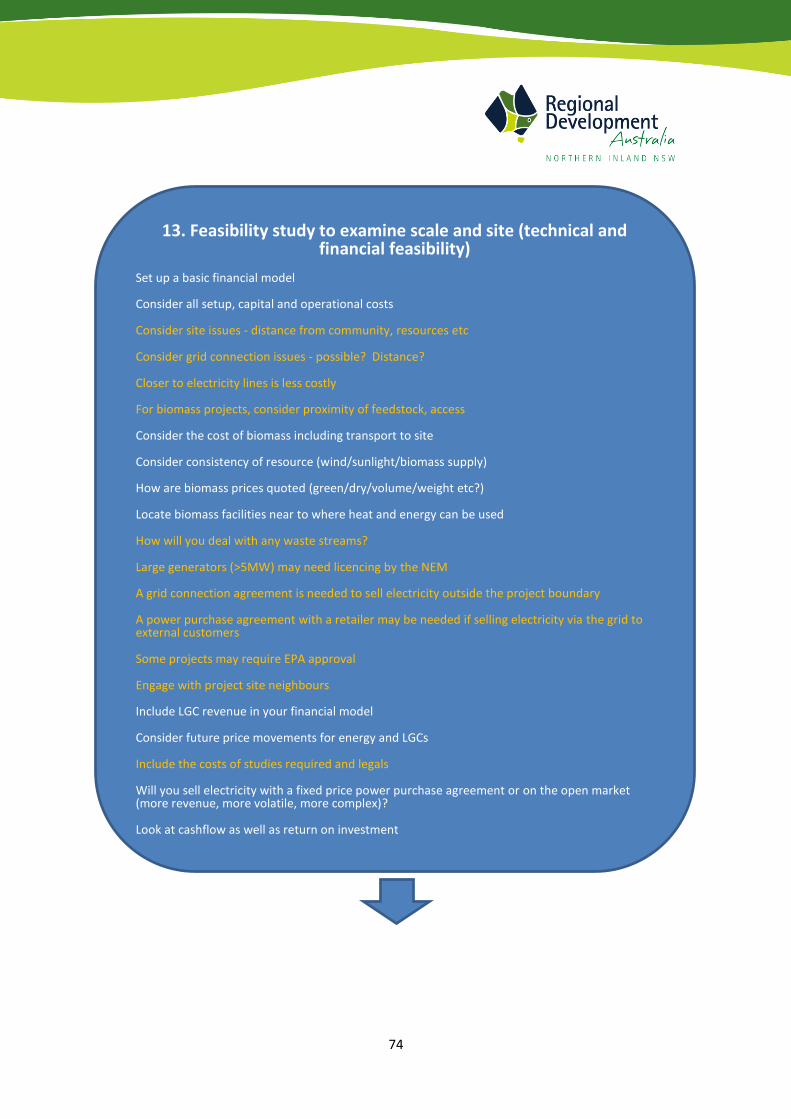
74
13. Feasibility study to examine scale and site (technical and financial feasibility)
Set up a basic financial model
Consider all setup, capital and operational costs
Consider site issues - distance from community, resources etc
Consider grid connection issues - possible? Distance?
Closer to electricity lines is less costly
For biomass projects, consider proximity of feedstock, access
Consider the cost of biomass including transport to site
Consider consistency of resource (wind/sunlight/biomass supply)
How are biomass prices quoted (green/dry/volume/weight etc?)
Locate biomass facilities near to where heat and energy can be used
How will you deal with any waste streams?
Large generators (>5MW) may need licencing by the NEM
A grid connection agreement is needed to sell electricity outside the project boundary
A power purchase agreement with a retailer may be needed if selling electricity via the grid to external customers
Some projects may require EPA approval
Engage with project site neighbours
Include LGC revenue in your financial model
Consider future price movements for energy and LGCs
Include the costs of studies required and legals
Will you sell electricity with a fixed price power purchase agreement or on the open market (more revenue, more volatile, more complex)?
Look at cashflow as well as return on investment
75
14. Full feasibility study/business case (financial feasibility)
Develop the business case - financial/social/environmental
The business case will evolve as the project progresses and you learn more
You must consider project risks
Investors, financiers and government grant agencies will require a business case
Use the business case to examine site costs and hence choice
Use specialists for critical information (e.g. energy yields)
May take months to develop a good business case
Learn how the energy market works
Understand grid connection requirements
Do you need to hire specialist consultants to meet planning requirements?
Are there cheaper options (e.g. local uni) than specialist consultants?
Wind monitoring can take at least a year
Consider the delivery route for large construction materials
Noise and possibly shadow flicker assessments for wind turbines
Flora and fauna considerations
Cultural heritage issues
Aeronautical and visual assessments
Landholder property access agreements
15. Planning approval process
Proceeds once you are satisfied with project feasibility
Commissioned studies from experts are likely to be requested
Windfarms <$30M are assessed by local council, over $30M by NSW Govt
Will require environmental impact assessments
Application fees apply
For windfarms within 2km of residents, their written approval is required
Windfarms in particular have a highly technical approvals process
76
16. Determine ownership structure and raise funds
May start out as an incorporated association, then move to another structure once capital raising is required
Probably form a co-operative or unlisted public company at capital raising time
Main difference between these structures is member voting rights
These will require extensive disclosure documentation to attract investors
It is useful for the membership of the new board to contain members from the old association to retain corporate memory
Most suppliers are more comfortable dealing with a company than a co-operative
Unlisted companies have less time to raise capital than co-operatives
Co-operatives have a more complex process for raising inter-state funds
17. Raising capital
Most community projects fall into the smaller investment category, so tend not to appeal to larger institutional investors
Co-operatives tend to be more attractive to individual rather than institutional investors
For-profit co-ops can issue shares or bonds which pay annual dividends to members
Not-for-profit co-ops can only issues bonds and provide a return through interest on these bonds (or member loans)
Cost of raising capital through a company structure is much higher than a co-op
Sources of capital may include members, entrepreneurs, self-managed super funds, landowners, angel investors, energy project developers, private equity/venture capital firms
Early investors face greater risk and longer wait for returns and will need incentives
Look for angel or patient investors first
Minimum investment levels must be low to attract community investors
Develop the offer document to raise capital
Co-ops have much lower offer document requirements than other legal structures
Different classes of shares can be offered at different stages of development
Set deadlines for share offers
Target various markets for investment (local and elsewhere)
Existing members and shareholders are your best prospects

77
18. Build infrastructure and sell energy
Issue tenders for equipment suppliers and construction
Negotiate with energy retailers to sell your energy (unless it is all used on-site)
<5MW generating capacity do not need to be registered with the AEMO as a market generator
Can register as a non-market generator and sell to local retailers instead of the wholesale market
Can sell electricity on the spot market (fluctuates) or for an agreed price to a retailer/wholesaler
Spot prices change every 30 minutes (average 5-6c/kWh in NSW in 2013, max $12.50/kWh)
The spot price can go negative when there is too much supply (i.e. a penalty for supplying)
The Australian Energy Market Operator (AEMO) manages electricity supply to match demand
Electricity selling options for community generators are to sell on-market and receive the spot price each 30mins, or sell off-market to a retailer for an agreed price/fixed term
Off-market sales are called Power Purchase Agreements (PPAs)
Renewable energy will also attract Renewable Energy Certificates which are an extra source of revenue. 1 REC = 1MWh of renewable electricity.
78
11. Sources
AEMO (2015), South Australian Fuel and Technology Report, South Australian Advisory Functions,
January 2015.
Aurecon (2016), Renewable Energy Hub concept investigation stakeholder workshop report and
findings TransGrid3 March 2016 Revision: 2, Reference: Project No 250592.
Australian Energy Regulator (2014), https://www.aer.gov.au/networks-pipelines/service-
providers-assets/central-ranges-pipeline-gas-distribution-network.
Bindaree Beef (2013), privately supplied data.
BREE (2013), Australian Energy Technology Assessment 2013 Model Update, December 2013.
Clean Energy Council (2014), Guide to Installing Solar PV for Business and Industry,
cleanenergycouncil.org.au.
ClimateWorks Australia (2014), Pathways to Deep Decarbonisation in 2050: How Australia can
prosper in a low carbon world, Technical Report, September 2014.
Community Power Agency (2014), Community-Owned Renewable Energy – A How To Guide, April
2014.
Dee, J. (2015), Energy Cut – The 20 Step Guide to Cutting Energy Bills in Your Business, Department
of Industry & Science.
Department of Climate Change and Energy Efficiency (2012), Energy use and energy efficiency
opportunity data for commercial sector and small/medium businesses, Summary of Results,
Commissioned by Department of Climate Change and Energy Efficiency, July 2012.
EASystems (2006), Business Attraction Folio for Organic Waste Industry Development Prepared for
Northern Inland Regional Waste.
Embark website (2016), http://www.embark.com.au/display/WebsiteContent/Home
ESD Consulting (2005), Feasibility Study for Utilisation of Residual Wood in the Walcha Region,
report to New England / North West Regional Development Board Northern Inland Forestry
Investment Group.
Essential Energy (2015), Network Price List and Explanatory Notes, Effective July 1 2015.
79
Haliday, C. and Elder, L. (2009), Power Factor Correction - The Easiest, Biggest, Green Initiative,
paper presented at the Energy NSW 2009 – Managing the Winds of Change: Conference & Trade
Exhibition in Sydney, Thursday 29th to Friday 30th October 2009.
IRENA (2013), Smart Grids and Renewables, A Guide to Deployment.
IRENA (2015), Renewable Power Generation Costs in 2014.
Ison, N., Hicks, J., Gilding, J. and Ross, K. (2012), The Australian Renewable Energy Sector –
Challenges and Opportunities, Final Report November 2012.
Keskar, J. (2014), Biogas Basics – Biogas Project Stage and Planning, CRCCARE, available at
http://www.territorynrm.org.au/wp-content/uploads/2013/06/Biogas-presentation-
files_combined.pdf .
Langham, E., Dunstan, C., Walgenwitz, G., Denvir, P., Lederwasch, A., and Landler, J. (2010), Reduced
Infrastructure Costs from Improving Building Energy Efficiency. Prepared for the Department of
Climate Change and Energy Efficiency by the Institute for Sustainable Futures, University of
Technology Sydney and Energetics, Productivity Commission (2011), Carbon Emission Policies in Key
Economies, Research Report, Canberra.
Moyse, D. (2012), Submission by Alternative Technology Association on The IPART Review of Solar
Feed-in Tariffs‘ Setting a fair and reasonable value for electricity generated by small-scale solar PV
units in NSW’ 23rd January 2012.
Moyse, D. (2013), Solar payback: Smaller is better, Climate Spectator,
http://www.businessspectator.com.au/article/2013/9/23/solar-energy/solar-payback-smaller-better
MT-Energie (2014), Study of Profitability of a Biogas Plant Including Raw Gas Upgrading, privately
supplied data.
New England Solar Power (2015), Newsletter, available at
http://www.newenglandsolarpower.com.au/newsletter.php
NSW Farmers (2013), Farm Energy Innovation Program – Energy & Irrigation, Solar PV pumping
systems, https://www.nswfarmers.org.au/__data/assets/pdf_file/0011/35858/Energy-Irrigation-
Solar-PV-pumping-systems.pdf
NSW Farmers (2015), GSES, Solar-powered pumping in agriculture: A guide to system selection and
design.
Simet, A. (2012), Global Costs of Biomass Power, Biomass Magazine, available at
http://biomassmagazine.com/articles/8344/global-costs-of-biomass-power .

80
SKM (2013), Assessment of Economic Benefits from a National Energy Saving Initiative, Final Report
to the Department of Climate Change and Energy Efficiency, March 2013.
Solar Choice (2016), Commercial Solar PV Price Index: March 2016,
http://www.solarchoice.net.au/blog/news/commercial-solar-pv-system-prices-march-2016-300316
Sustainability Victoria (2010), Victorian Consumer Guide to Small Wind Turbine Generation,
Prepared by Enhar for Sustainability Victoria July 2010.
The Carbon Trust (2008), Small-scale wind energy Policy insights and practical guidance, August
2008.
Victorian State Government (2015), Guide to Community-Owned Renewable Energy for Victorians,
Victorian Government Department of Economic Development, Jobs, Transport and Resources,
November 2015.
Brooksbank, K., Lever, M., Paterson, H. & Weybury, M.l., (2014), ‘Biomass scoping study’, Bulletin
4862, Department of Agriculture and Food, Western Australia, Perth.