Embed Size (px)
Citation preview
Northwest Indiana Regional Development Authority
Comprehensive Economic Development Plan January 9, 2007
2 Foreward
Foreword
In fall 2006, the Northwest Indiana Regional Development Authority
[RDA] commenced its planning process for a comprehensive strategic
development plan for Lake and Porter counties. Its enabling legislation
requires RDA to submit such a plan to the budget committee and
office of management and budget by January 1, 2008. RDA issued an
RFP for consulting services and selected Policy Analytics, LLC. to lead
the strategic planning effort. The scope of the work focused on the
mandated project areas: the Gary/Chicago International Airport, the
Northern Indiana Commuter Transportation District, the Regional Bus
Authority and Shoreline Development [Marquette Greenway Plan].
The creation of the Northwest Indiana Regional Development Author-
ity and prior economic development investments within the project
areas testify to the timeframe and perseverance of elected officials,
business executives, labor leaders and other stakeholders engaged in
the process. We would like to acknowledge U.S. Congressman Peter
Visclosky, Governor Mitchell Daniels, State Senator Earline Rogers,
State Representative Chet Dobis and the entire northwest Indiana
legislative delegation for their leadership and foresight in creating and
then passing the legislation which establishes the RDA. The RDA as a
legislative concept was first drafted by State Representative Chet
Dobis and he gathered support from many quarters to put the idea on
the agenda of decision-makers across the state. Governor Mitch
Daniels from the Indiana Statehouse and Congressman Pete Visclosky
from Washington provided statesman-like leadership during the period
of the 2005 session of the Indiana General Assembly in pushing for a
vehicle – the RDA – which could become the catalyst for change in
the region. State Senator Earline Rogers and State Representative
Chet Dobis provided bi-partisan leadership during the crucial periods
of legislative drafting and deal-making ensuring that the RDA became
a reality. We believe the vision of these leaders for the development
of northwest Indiana will be implemented through the effective long-
term effort of the RDA that is previewed in this report.
We would like to thank the RDA Board Members Chairman John
Clark, Harley Snyder, Dr. Howard Cohen, Carmen Fernandez, Lou
Martinez, Bill Joiner and Gus Olympidis; Tim Sanders, Executive
Director, Sherri Shabaz, Executive Assistant; Mark Lopez of Congress-
man Visclosky’s office, City of Whiting Mayor Joseph Stahura; City of
Hammond Mayor Thomas McDermott Jr.; City of East Chicago Mayor
George Pabey, Housing Authority Director John Artis, City Planner
Richard Morrisroe; City of Gary Mayor Rudy Clay, Deputy Mayor
Richard Comer, City Planner Christopher Meyers and Department of
Environmental Affairs Director Dorreen Carey; Cities of East Chicago
and Gary Consultant Will Woody; City of Portage Mayor Douglas
Olson and City Planner A.J. Monroe; Gary/Chicago Airport Executive
Director Chris Curry and Consultant Paul Karas; Northern Indiana
Commuter Transportation District General Manager Gerald Hanas and
Director of Marketing & Planning, John Parsons; Regional Bus Author-
ity Chairman Dennis Rittenmeyer, RBA Project Director Ken Dallmeyer
and RBA TranSystems Consultant Lynn Otte; Northwest Indiana Forum
Environmental Affairs Director Kay Nelson, Northwestern Indiana
Regional Planning Commission Executive Director John Swanson,
Economic Development Committee members including Chairman Leigh
Morris and Graphic Director John Smith; and, staff at U.S. Environ-
mental Protection Agency, U.S. Coast Guard, Indiana Department of
Environmental Management and Indiana Finance Authority.
Policy Analytics attempts to bring the highest quality insight and
analysis to public sector issues. We believe this comprehensive eco-
nomic development planning project fulfilled the RDA’s fiduciary
responsibility. We are grateful for the opportunity to serve the Author-
ity in its endeavor to be catalyst for economic transformation.
“The sky’s the limit for Northwest Indiana” Governor Mitch Daniels
3 Table of Contents
Page
Forward 2 Executive Summary 4
Methodology 6
Regional Development Authority 7 Development Vision 8 Strategic Planning Framework Economic Data Profile
Quality of Life Factors Environmental Risk Factors
Gary/Chicago International Airport 18 The Airport Development Vision The Airport Development Process
Market Outlook for Passenger Demand Return on Investment
Northern Indiana Commuter Transportation District 30
The Westlake Corridor Development Vision The Westlake Corridor Development Process
Market Outlook for Ridership Demand Return on Investment
Northwest Indiana Regional Bus Authority 37 The Regional Bus Development Vision The Regional Bus Development Process Market Outlook for Passenger Demand Return on Investment
Shoreline Development 43 The Marquette Greenway Development Vision The Marquette Greenway Development Process Market Outlook for Public Access
Return on Investment
Findings 51
4 Executive Summary
Executive Summary
There is a spirit of excitement, optimism and renewed hope that
permeates the personal interactions of the citizens of northwest
Indiana, not evident for many years. One reason for that positive spirit
is the creation of the Northwest Indiana Regional Development
Authority – accomplished in 2005 and now beginning to make its
mark. The RDA’s enabling statute requires a comprehensive economic
development strategy with clear metrics and financial analysis of the
four key development assets named in the legislation: the Gary/
Chicago International Airport, the Northern Indiana Commuter Trans-
portation District [NICTD], shoreline development [Marquette Green-
way Plan], and a regional bus authority. Policy Analytics, LLC was
chosen to complete that planning function and issue a report to the
RDA providing guidance for its investments in the coming years.
The planning process involved:
• Review of previous studies of the regional economy
• Extensive interviews with public and private sector
leaders and stakeholders
• Review of the planning and development programs
for each of the targeted investments
• Projections of the growth paths for each of the targeted invest-
ments, gathering detailed timeline and budget
information
• Analysis of the Return on Investment resulting from each of the
targeted investments
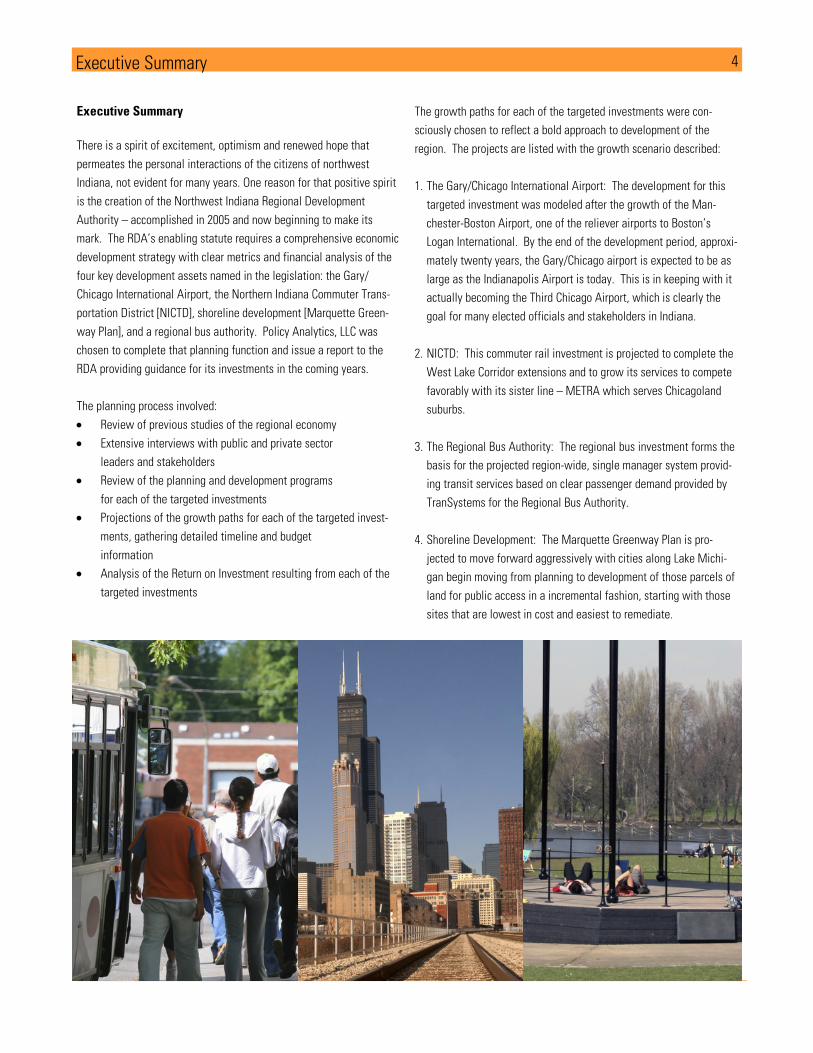
The growth paths for each of the targeted investments were con-
sciously chosen to reflect a bold approach to development of the
region. The projects are listed with the growth scenario described:
1. The Gary/Chicago International Airport: The development for this
targeted investment was modeled after the growth of the Man-
chester-Boston Airport, one of the reliever airports to Boston’s
Logan International. By the end of the development period, approxi-
mately twenty years, the Gary/Chicago airport is expected to be as
large as the Indianapolis Airport is today. This is in keeping with it
actually becoming the Third Chicago Airport, which is clearly the
goal for many elected officials and stakeholders in Indiana.
2. NICTD: This commuter rail investment is projected to complete the
West Lake Corridor extensions and to grow its services to compete
favorably with its sister line – METRA which serves Chicagoland
suburbs.
3. The Regional Bus Authority: The regional bus investment forms the
basis for the projected region-wide, single manager system provid-
ing transit services based on clear passenger demand provided by
TranSystems for the Regional Bus Authority.
4. Shoreline Development: The Marquette Greenway Plan is pro-
jected to move forward aggressively with cities along Lake Michi-
gan begin moving from planning to development of those parcels of
land for public access in a incremental fashion, starting with those
sites that are lowest in cost and easiest to remediate.
5 Executive Summary
These four targeted investments are then compared on the basis of
metrics developed to reflect an ROI approach to quantitatively meas-
ure the impact of the development projects on the region’s economy.
Using a well-documented dynamic policy analysis model [REMI], the
investment driven development of each of the four statutorily identi-
fied projects was modeled and its impact on the economy of the
region was measured. The Present Value of the cost of the project
was then compared to the number of jobs produced, the Present Value
of the personal income generated, and the Present Value of the total
economic activity [gross regional product] resulting from the project.
The comparisons are not always straightforward. Because the public
cost of the project to the regional economy does not include federal or
private sector funding, projects which receive a high percentage of
federal match dollars will show much higher rates of return.
Both the Marquette Greenway Plan and the Gary/Chicago Interna-
tional Airport showed substantially better Benefit/Cost Ratios and
Output Ratios than did the transit systems. This is in keeping with
other nationally recognized analyses – transit systems require net
public operating subsidies as well as public capital investments.
The results of comparing these projects against a series of quantita-
tive measures is not to eliminate any of the statutorily listed projects.
Developing a regional economy and making a broad positive impact on
the quality of life of a region, requires multi-dimensional investment
and a thoughtful and timely approach. The projects and their impacts
that are presented in this report paint a picture of what northwest
Indiana could be. It is now for the citizens of the region to determine
whether this vision is right for them and if so, how to achieve it.
ROI Summary
Gary/Chicago
Airport NICTD
Marquette
Greenway
Plan RBA
Benefit Cost Ratio $117.33 $64.62 $421.60 $13.88
Output Ratio $420.09 $56.44 $1,292.41 $22.42
Cost per Job $2,276.00 $21,530.00 $772.00 $46,630.00
Source: Policy Analytics, 2007
Table 1

6 Methodology
Methodology
Policy Analytics, LLC in consultation with RDA Board Members and its
Executive Director devised a two–phase strategic planning process.
Phase 1 will define the development vision, offer aspirational profiles
and plausible return on investments. Based upon a public comment
period, Phase 2 will present available financing mechanisms to
achieve the regional vision for a world-class economy.
Policy Analytics incorporated its recent work with the Northwestern
Indiana Regional Planning Commission [NIRPC], the Metropolitan
Planning Organization and Council of Governments for Lake, Porter and
La Porte counties. NIRPC underwent a strategic economic develop-
ment planning process in anticipation of a formal Comprehensive
Economic Development Strategy [CEDS]. Policy Analytics conducted
stakeholder interviews and meetings and reviewed more than 50
regional and local planning reports produced since 2000. Six themes
or “strategic directions” emerged: economic development, transporta-
tion, environment, workforce development, leadership and quality of
life including social equity. Additionally, a regional economic profile
illustrated the NIRPC region’s interdependence on the Chicago metro-
politan area, specifically the city center.
Throughout the process, Policy Analytics solicited input from private,
public and non-profit sector stakeholders who validated the six strate-
gic directions including the four RDA targeted investments. Their
comments and actions demonstrated the willingness to think and act
regionally. This type of regional collaboration is supported by a two-
phased economic development process, planning and preparation,
followed by deal making, an economic development framework
whereby each sectoral actor could add value during the two-phased
economic development process of planning and preparation followed
by deal making. The RDA comprehensive development plan suggests
that a financial analysis overlay represents a third phase in this proc-
ess.
Policy Analytics leveraged the insight from the NIRPC project and
applied a deeper level of analysis during the RDA strategic planning
process. Targeted investments refer to projects mandated in the
enabling statute: the Gary/Chicago International Airport, Northern
Indiana Commuter Transportation District, the Regional Bus Authority
and the Shoreline Development [Marquette Greenway Plan]. Executive
management and key stakeholders of the four-targeted projects de-
scribed the overall vision, strategies and tactics underway. They
provided access to privileged and publicly available information. The
Policy Analytics team then extracted key data for analysis. The aggre-
gated data formulated the project’s baseline assumptions. In some
instances, industry experts and best practices supplemented the
project area visions or validated the research team’s assumptions.
To meet the project sponsor and stakeholder expectations, Policy
Analytics led by President Bill Sheldrake, assembled a professional
seven member team consisting of Policy Analytics’ staff consultants;
Hunden Strategic Partners, a Beverly Shores-based real estate and
economic development firm; and Civil and Environmental Consultants,
a Pittsburg, PA-based land use, environmental planning and engineer-
ing company.
7 Regional Development Authority
Regional Development Authority
The Northwest Indiana Regional Development Authority is a recently
created body corporate and politic serving Lake and Porter counties.
The purpose of this regional economic development authority is to
strategically direct funding toward four catalytic projects: the Gary/
Chicago International Airport, Northern Indiana Commuter Transpor-
tation District, Regional Bus Authority and shoreline development [the
Marquette Greenway], as well as other qualified projects.
The governing body consists of a seven-member board composed of
leadership appointed by the Mayors of Gary, East Chicago and
Hammond; by County Executives from Lake and Porter counties; and
by the Governor of Indiana. Each city and county contributes $3.5
million for a total of $17.5 million annually. As a result of the “Major
Moves” legislation from the 2006 Indiana General Assembly, the RDA
will receive $20 million from the state in State Fiscal Year [SFY] 2007.
For the next 8 years, the state will distribute $10 million per year,
providing a total of $27.5 in annual revenue to be used for both op-
erations and investment in RDA approved projects through SFY 2015.
The board members raise the bar in regional collaboration and a non-
partisan commitment to transforming the economic future of north-
west Indiana. First and foremost the RDA seeks to be bold, a catalyst,
through which equally ambitious and sustainably-balanced projects
come to fruition for the benefit of all individuals. Additionally, RDA
will instill public confidence through transparency, efficiency and
accountability in its the work of guiding resources towards major
economic development projects.
Through the RDA, northwest Indiana has been given a significant
opportunity to gain control of its economic destiny. The legislation
provides both the authority and financial resources to invest in its key
assets. One of the ways the legislation seeks to direct that capitali-
zation is to require a process of “due diligence” or planning prior to
the making of investment or asset allocation decisions.
IC 36-7.5-3-4(a) states:
Sec. 4. (a) The development authority shall prepare a compre-
hensive strategic development plan that includes detailed infor-
mation concerning the following:
(1) The proposed projects to be undertaken or financed by
the development authority.
(2) The following information for each project included
under subdivision (1):
(A) Timeline and budget.
(B) The return on investment.
(C) The projected or expected need for an ongoing subsidy.
(D) Any projected or expected federal matching funds.
(b) The development authority shall before January 1, 2008,
submit the comprehensive strategic development plan for review
by the budget committee and approval by the director of the
office of management and budget.
As added by P.L.214-2005, SEC.73.
John Clark Chairman Senior Advisor to Gov. Daniels Dir. Office of Energy and Defense Development
Dr. Howard Cohen Treasurer Chancellor Purdue University Calumet
Harley Snyder President HSC, Inc.
Gus Olympidis President and CEO Family Express Corporation
Board Members
Vision Be a catalyst for the transformation of the Northwest Indiana economy to robust
world class status
Values Bold Collaborative Transparent Non-partisan Efficient Accountability
Bill Joiner Retired Banker
Lou Martinez President United Way
Carmen Fernandez Counsel East Chicago Corporation
Executive Director Tim Sanders

8 Development Vision
Development Vision
The statute stipulates that the RDA may undertake or finance four
named projects and may also engage in financing other economic
development projects in northwest Indiana. The four named projects
for purposes of this report are referred to as Targeted Investments.
The statute requires a budget and timeline for each project’s develop-
ment, the return on investment, the projected need for an ongoing
subsidy and projected federal matching funding. This report provides
information relevant to those items for each of the projects and as
explained below, utilizes a dynamic policy analysis model to yield
information regarding return on investment.
This report provides the comprehensive economic development strat-
egy required in the statute. It is based on an analysis of the region’s
economic and demographic variables and an eight month long review
of economic and transportation policy studies completed for the
Northwesterm Indiana Regional Planning Commission [NIRPC]. This
earlier work was completed in November of 2006 and also included
stakeholder interviews throughout the region. These interviews and
focus groups included both public sector and private sector leaders
who brought a broad perspective to the planning outcomes.
The report also contains an in-depth description of each of the tar-
geted investment’s “preferred” development path, gleaned from the
planning work already done by the management of each of the pro-
jects and supplemented by analysis and “due diligence” conducted by
the Policy Analytics research team. The costs of the project were not
simply taken from management but were analyzed and have in some
cases been adjusted to reflect newer information not originally avail-
able. The projections for current dollar costs [investment costs that
include inflation] were made by Policy Analytics and are based on
assumptions of general inflation over longer time horizons and for
specialized components of aggregate inflation indices.
Within the discussion of each targeted investment, the required need
for subsidy and the availability of federal matching funds will be
discussed. These parameters like many of the other aspects of the
analysis are estimates that will, of course, require adjustments as
new information comes to the fore. The concept of the “net regional
cost of the project” incorporates the analysis of these items [federal
match and subsidy] and is then used in the REMI analysis and metrics
defined below.
The RDA purchased REMI’s “Policy Insight” model for the basic eco-
nomic analysis contained in this report and also obtained “Transight”,
a related transportation model for use with the transportation assets
which are the core of the specified targeted investments. Each in-
vestment was analyzed in a detailed manner as to its probable and
planned development path, the timeline associated with that develop-
ment, the costs associated with achieving that development path, and
the possible availability of federal funding for use within the project.
The funding and development time horizon chosen was from 2007
through 2040. Because these assets are large, complex projects they
require a significant period of time to develop and grow. The Gary/
Chicago International Airport’s Master Plan development was slated
to take place over a roughly 20 year period. Many commuter rail
development projects are years in planning and then a decade or
slightly less to construct. After the project is developed, there must
be some amount of time for its benefits to work through the economy
and be measurable to their fullest extent. Thus the timeline to 2040
for the economic modeling provides this window for adequate meas-
urement.
Return on investment [ROI] can be measured in various ways, and is a
substantially different measure in public sector projects than in pri-
vate sector analysis. Principally, the difference is that for many public
sector projects, especially in transportation, the growth of the asset’s
services being provided increases the required subsidy or public
sector funding infusion. For purposes of this report, the ROI calcula-
tions manifest themselves in 3 separate measurements, a benefit/
cost ratio, a cost per job and an output ratio. Each of these measures
is defined below.
1. Benefit/Cost Ratio: The numerator equals the sum of the dis-
counted benefits of the project over the entire time horizon [till 2040],
where benefits are measured by the increase in total personal income
generated by the project investment. The denominator equals the sum
of the discounted costs of the project over the entire time horizon.
9 Development Vision
2. Output Ratio: Gross Regional Product [GRP] is the measure of
total output for a defined geography. This is a broader measure of
economic activity than personal income and includes business contri-
butions to economic activity as well. The numerator is the sum of the
discounted GRP over the project time horizon and the denominator is
the sum of the discounted costs of the project over the entire time
horizon.
3. Cost per Job: Incentive based economic development efforts and
projects are often compared on the basis of the costs expended by the
public sector per each job realized in a project or series of projects.
This measure is a fraction, the numerator is the sum of the discounted
costs over the time horizon and the denominator is the total number
of jobs resulting from the project by the end of the measurement time
period.
The quantitative measures – gross regional product, personal income,
or total employment – used in these ratios are outputs from employ-
ing the REMI model for the analysis of the project. The use of the
REMI model allowed for a consistent measurement – as consistent as
possible across different kinds of projects – to be employed in the
ratios.
The ROI calculations and ratios presented in this report are not in-
tended to eliminate any one of these targeted investments from being
considered for funding. The Indiana General Assembly in its creation
of the RDA provided that each of the four projects be supported in
their role as significant contributors to economic growth in the region.
In fact, the analysis in this report supports the view that it is only in a
multi-faceted or multi-dimensional approach to regional development
that the most rapid, the broadest, and the most sustainable growth
path can be achieved.
Strategic Planning Framework
In early 2006, NIRPC undertook a two-fold strategic planning and
research process to establish a regional strategic plan for economic
development, and to determine what role NIRPC should play in the
process of economic development for the region. Input was obtained
from both public and private sector regional stakeholders, and key
information was distilled from more than 50 regional and local plan-
ning documents.
Stakeholders articulated a need for collaborative planning across the
region that includes public sector, private sector, and non-profit in-
volvement. Economic development is a process that occurs within a
two-phase framework. The first phase is planning and preparation,
focusing on policy and infrastructure development that is conducive to
economic growth. This phase is led by the public sector, which lays a
solid foundation for investment through comprehensive land use and
transportation planning, and awareness of environmental and social
impacts. The second phase is private sector driven and focused on
implementation. Through creation, attraction, retention, expansion
and redevelopment efforts, private sector leaders attract new invest-
ment either from resident enterprises or from those just entering the
region.
To conceptualize a regional strategic direction in economic planning,
economic goals and objectives were integrated from local research
and planning documents into six economic development themes.
These themes are areas where public sector leaders should intention-
ally focus their planning efforts to create an economic environment
conducive to growth. Together, these themes make up the compo-
nents of a holistic regional development vision and are presented
below in brief.
Pro-Growth Business Environment—Comprehensive, region-wide
economic planning incorporating a coordinated land use plan. De-
velop high quality infrastructure, and encourage collaboration be-
tween the public sector and private sector through public-private
partnerships.
Transportation—Integrate transportation planning with regional land
use planning. Develop the Gary/Chicago International Airport, and
facilitate faster freight movement throughout the region. Provide
greater inter-region and intra-region access through an optimized
regional transportation system. Anticipate the continued growth in
residential development in southern Lake and Porter counties, includ-
ing planning for the Illiana Expressway and other assets that will
improve the flow of citizens and workers within the region and to
destinations outside it.
10 Development Vision
Environment—Include environmental implications into regional eco-
nomic planning. Support sustainable development through brownfield
redevelopment, conservation, and by reclaiming the Lake Michigan
shoreline for public use. Ensure sustainable development by integrat-
ing the five aspects of environmental planning into the processes of
economic development and transportation planning. Support the
implementation of the Marquette Greenway, pedestrian friendly
systems, blueways and biodiversity projects that strengthen the
health and well-being of life within the NIRPC region.
Workforce Development—Recognize the local workforce as an eco-
nomic development asset. Develop a highly-skilled, qualified and
competitive workforce, with the education and training needed for
today’s jobs. Partner with regional workforce leaders and academic
institutions to co-convene best practice forums on the vital linkages
between world class economic development and globally competitive
workforce and education systems.
Leadership—Establish and continue to communicate a cohesive
regional vision for economic development and build intra-regional
collaboration into the fabric of the public and private sector proc-
esses. Anticipate market opportunities to develop and sustain a
globally competitive region.
Quality of Life—Promote quality of life values through a comprehen-
sive land use plan. Engage in broader dialogue with stakeholders to
open cultural pathways between communities and across the region.
Promote opportunities for disadvantaged residents, and seek to re-
duce economic disparities by incorporating socially just solutions to
regional problems. Plan strategically for strong economic growth, a
diversifying employment base, efficient and accessible intra-regional
transportation, and a healthy environment for generations to come.
These strategies for region-wide economic development are long-
term directional guidelines for moving the northwest Indiana region
toward a world-class, globally competitive economy – the goal of the
RDA. The four regional targeted investments analyzed in this report
are foundational for achieving this economic development vision.
Investing in these assets will bring quantifiable economic and social
returns. Development of the Gary/Chicago International Airport to its
full potential will attract investment and improve an important compo-
nent of the region’s transportation network. Creating a regional bus
network, and expanding commuter rail to more communities will lead
to an optimized transportation network, increase employment oppor-
tunities for area residents, and be important considerations in sus-
tainable land use planning. Redeveloping the Lake Michigan shore-
line for public use will attract private development and have positive
environmental and quality of life impacts for the region.
This development process is intended to result in a state that for
northwest Indiana is definably different from its historical situation
and its current status. While there are many economic assets and
beautiful places in the region, northwest Indiana has not been re-
garded as the most desirable place to live, work and raise a family.
It has often been compared unfavorably to the Chicago metropolitan
area, [of which it is statistically and economically a part], and to
Indianapolis and central Indiana – the political axis to which the
region must relate. The “end-state” envisioned in this report and for
which the RDA is planning its investments is nothing less than a
region which will be on an equal footing with or for some aspects
compare favorably with these other two geographies.
This report therefore is not comprised of timid proposals for investing
in the key statutorily defined targeted investments. In fact, there is a
theme throughout this discussion – that it is only through the bold and
aggressive work of the RDA, and its colleague entities engaged in the
regional economic development process that the true aspirations of
the citizens of northwest Indiana can be realized.
11 Development Vision
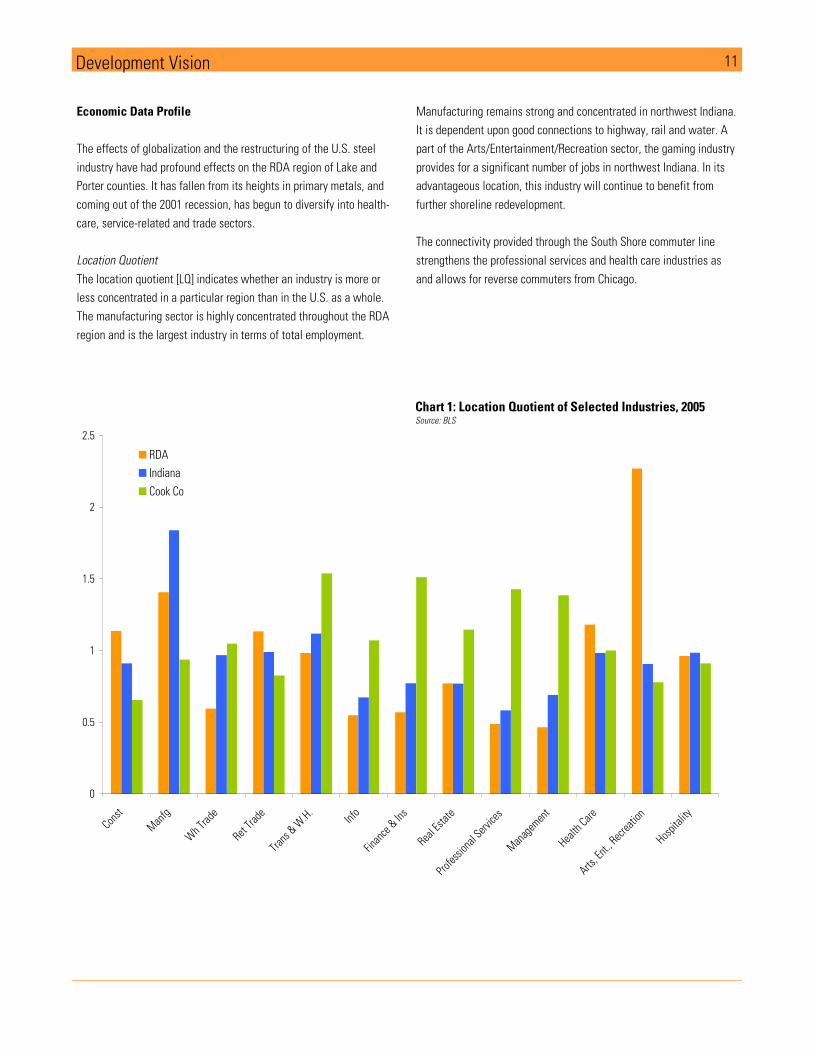
Economic Data Profile
The effects of globalization and the restructuring of the U.S. steel
industry have had profound effects on the RDA region of Lake and
Porter counties. It has fallen from its heights in primary metals, and
coming out of the 2001 recession, has begun to diversify into health-
care, service-related and trade sectors.
Location Quotient
The location quotient [LQ] indicates whether an industry is more or
less concentrated in a particular region than in the U.S. as a whole.
The manufacturing sector is highly concentrated throughout the RDA
region and is the largest industry in terms of total employment.
Manufacturing remains strong and concentrated in northwest Indiana.
It is dependent upon good connections to highway, rail and water. A
part of the Arts/Entertainment/Recreation sector, the gaming industry
provides for a significant number of jobs in northwest Indiana. In its
advantageous location, this industry will continue to benefit from
further shoreline redevelopment.
The connectivity provided through the South Shore commuter line
strengthens the professional services and health care industries as
and allows for reverse commuters from Chicago.
0
0.5
1
1.5
2
2.5
Cons
t
Man
fg
Wh T
rade
Ret T
rade
Tran
s & W
.H.
Info
Finan
ce &
Ins
Real
Estate
Profes
siona
l Servic
es
Man
agem
ent
Healt
h Care
Arts,
Ent., Rec
reation
Hosp
itality
RDA
Indiana
Cook Co
Chart 1: Location Quotient of Selected Industries, 2005 Source: BLS
12 Development Vision
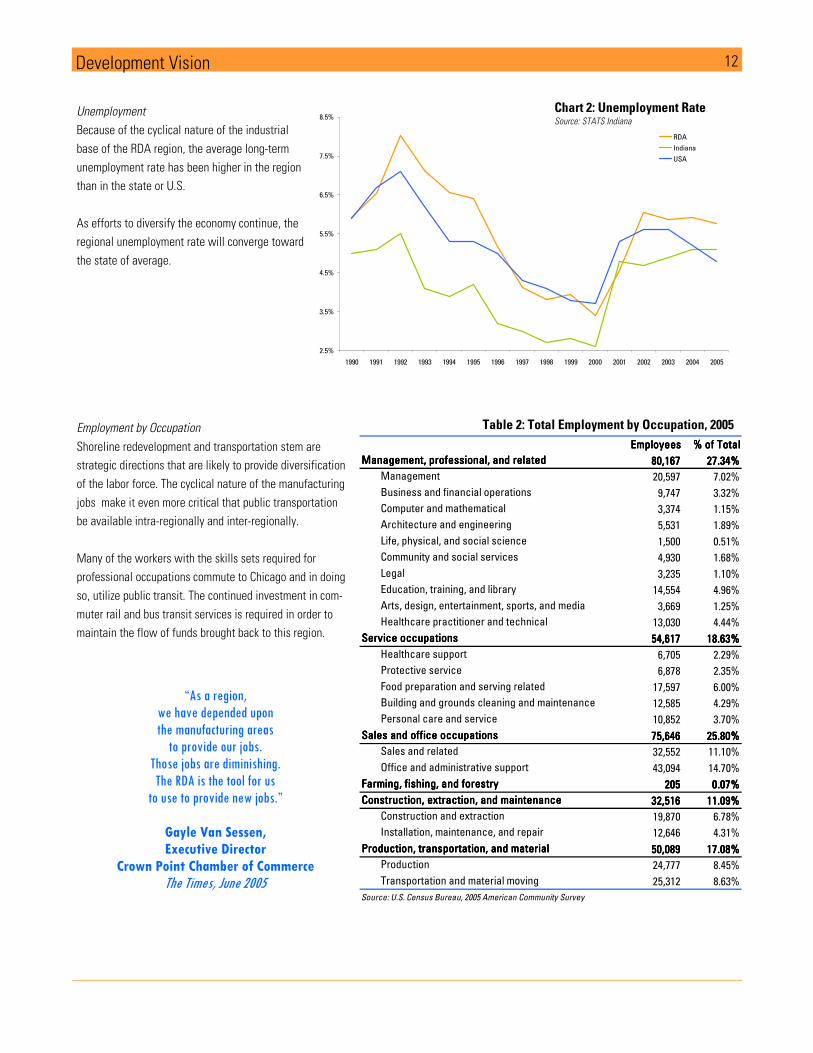
Unemployment
Because of the cyclical nature of the industrial
base of the RDA region, the average long-term
unemployment rate has been higher in the region
than in the state or U.S.
As efforts to diversify the economy continue, the
regional unemployment rate will converge toward
the state of average.
Employment by Occupation
Shoreline redevelopment and transportation stem are
strategic directions that are likely to provide diversification
of the labor force. The cyclical nature of the manufacturing
jobs make it even more critical that public transportation
be available intra-regionally and inter-regionally.
Many of the workers with the skills sets required for
professional occupations commute to Chicago and in doing
so, utilize public transit. The continued investment in com-
muter rail and bus transit services is required in order to
maintain the flow of funds brought back to this region.
2.5%
3.5%
4.5%
5.5%
6.5%
7.5%
8.5%
1990 1991 1992 1993 1994 1995 1996 1997 1998 1999 2000 2001 2002 2003 2004 2005
RDA
Indiana
USA
EmployeesEmployeesEmployeesEmployees % of Total% of Total% of Total% of Total
Management, professional, and relatedManagement, professional, and relatedManagement, professional, and relatedManagement, professional, and related 80,16780,16780,16780,167 27.34%27.34%27.34%27.34%
Management 20,597 7.02%
Business and financial operations 9,747 3.32%
Computer and mathematical 3,374 1.15%
Architecture and engineering 5,531 1.89%
Life, physical, and social science 1,500 0.51%
Community and social services 4,930 1.68%
Legal 3,235 1.10%
Education, training, and library 14,554 4.96%
Arts, design, entertainment, sports, and media 3,669 1.25%
Healthcare practitioner and technical 13,030 4.44%
Service occupationsService occupationsService occupationsService occupations 54,61754,61754,61754,617 18.63%18.63%18.63%18.63%
Healthcare support 6,705 2.29%
Protective service 6,878 2.35%
Food preparation and serving related 17,597 6.00%
Building and grounds cleaning and maintenance 12,585 4.29%
Personal care and service 10,852 3.70%
Sales and office occupationsSales and office occupationsSales and office occupationsSales and office occupations 75,64675,64675,64675,646 25.80%25.80%25.80%25.80%
Sales and related 32,552 11.10%
Office and administrative support 43,094 14.70%
Farming, fishing, and forestry Farming, fishing, and forestry Farming, fishing, and forestry Farming, fishing, and forestry 205205205205 0.07%0.07%0.07%0.07%
Construction, extraction, and maintenanceConstruction, extraction, and maintenanceConstruction, extraction, and maintenanceConstruction, extraction, and maintenance 32,51632,51632,51632,516 11.09%11.09%11.09%11.09%
Construction and extraction 19,870 6.78%
Installation, maintenance, and repair 12,646 4.31%
Production, transportation, and materialProduction, transportation, and materialProduction, transportation, and materialProduction, transportation, and material 50,08950,08950,08950,089 17.08%17.08%17.08%17.08%
Production 24,777 8.45%
Transportation and material moving 25,312 8.63%
Source: U.S. Census Bureau, 2005 American Community Survey
Chart 2: Unemployment Rate Source: STATS Indiana
“As a region, we have depended upon the manufacturing areas to provide our jobs.
Those jobs are diminishing. The RDA is the tool for us to use to provide new jobs.”
Gayle Van Sessen, Executive Director
Crown Point Chamber of Commerce The Times, June 2005
Table 2: Total Employment by Occupation, 2005
13
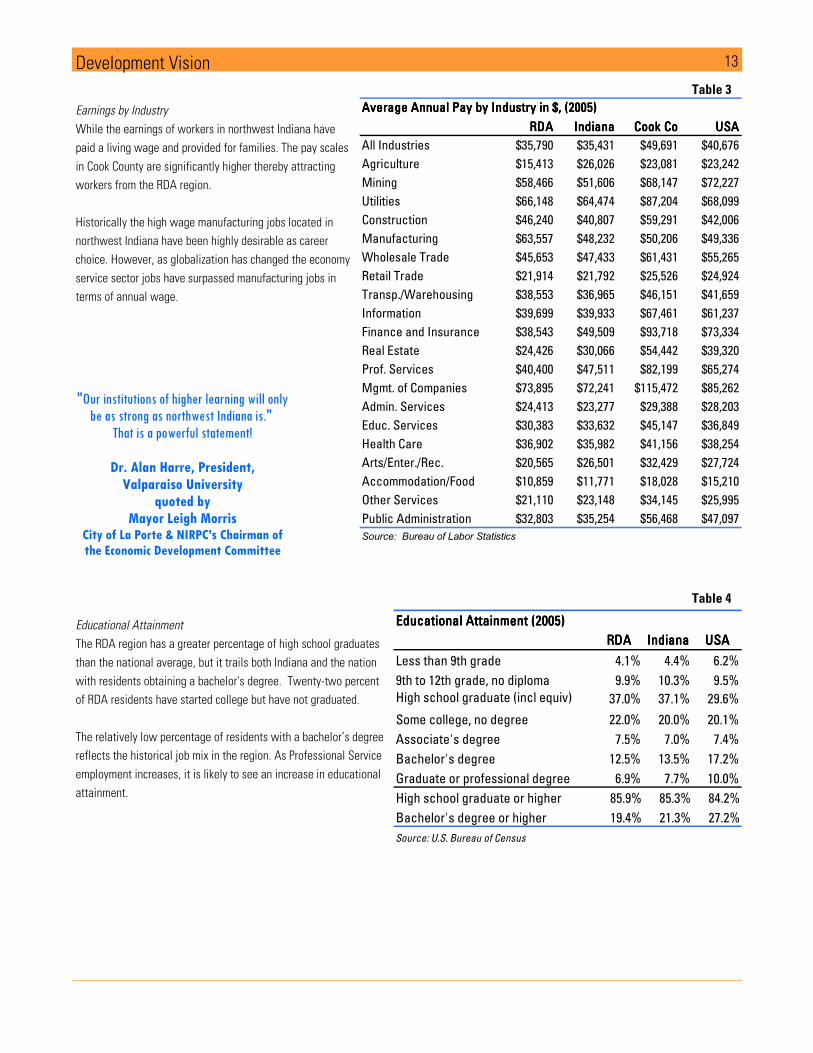
Earnings by Industry
While the earnings of workers in northwest Indiana have
paid a living wage and provided for families. The pay scales
in Cook County are significantly higher thereby attracting
workers from the RDA region.
Historically the high wage manufacturing jobs located in
northwest Indiana have been highly desirable as career
choice. However, as globalization has changed the economy
service sector jobs have surpassed manufacturing jobs in
terms of annual wage.
Development Vision
Educational Attainment
The RDA region has a greater percentage of high school graduates
than the national average, but it trails both Indiana and the nation
with residents obtaining a bachelor's degree. Twenty-two percent
of RDA residents have started college but have not graduated.
The relatively low percentage of residents with a bachelor’s degree
reflects the historical job mix in the region. As Professional Service
employment increases, it is likely to see an increase in educational
attainment.
Educational Attainment (2005)Educational Attainment (2005)Educational Attainment (2005)Educational Attainment (2005)
RDARDARDARDA IndianaIndianaIndianaIndiana USAUSAUSAUSA
Less than 9th grade 4.1% 4.4% 6.2%
9th to 12th grade, no diploma 9.9% 10.3% 9.5%
High school graduate (incl equiv) 37.0% 37.1% 29.6%
Some college, no degree 22.0% 20.0% 20.1%
Associate's degree 7.5% 7.0% 7.4%
Bachelor's degree 12.5% 13.5% 17.2%
Graduate or professional degree 6.9% 7.7% 10.0%
High school graduate or higher 85.9% 85.3% 84.2%
Bachelor's degree or higher 19.4% 21.3% 27.2%
Source: U.S. Bureau of Census
"Our institutions of higher learning will only be as strong as northwest Indiana is."
That is a powerful statement!
Dr. Alan Harre, President, Valparaiso University
quoted by Mayor Leigh Morris
City of La Porte & NIRPC’s Chairman of the Economic Development Committee
RDARDARDARDA IndianaIndianaIndianaIndiana Cook CoCook CoCook CoCook Co USAUSAUSAUSA
All Industries $35,790 $35,431 $49,691 $40,676
Agriculture $15,413 $26,026 $23,081 $23,242
Mining $58,466 $51,606 $68,147 $72,227
Utilities $66,148 $64,474 $87,204 $68,099
Construction $46,240 $40,807 $59,291 $42,006
Manufacturing $63,557 $48,232 $50,206 $49,336
Wholesale Trade $45,653 $47,433 $61,431 $55,265
Retail Trade $21,914 $21,792 $25,526 $24,924
Transp./Warehousing $38,553 $36,965 $46,151 $41,659
Information $39,699 $39,933 $67,461 $61,237
Finance and Insurance $38,543 $49,509 $93,718 $73,334
Real Estate $24,426 $30,066 $54,442 $39,320
Prof. Services $40,400 $47,511 $82,199 $65,274
Mgmt. of Companies $73,895 $72,241 $115,472 $85,262
Admin. Services $24,413 $23,277 $29,388 $28,203
Educ. Services $30,383 $33,632 $45,147 $36,849
Health Care $36,902 $35,982 $41,156 $38,254
Arts/Enter./Rec. $20,565 $26,501 $32,429 $27,724
Accommodation/Food $10,859 $11,771 $18,028 $15,210
Other Services $21,110 $23,148 $34,145 $25,995
Public Administration $32,803 $35,254 $56,468 $47,097
Average Annual Pay by Industry in $, (2005)Average Annual Pay by Industry in $, (2005)Average Annual Pay by Industry in $, (2005)Average Annual Pay by Industry in $, (2005)
Source: Bureau of Labor Statistics
Table 4
Table 3
14 Development Vision
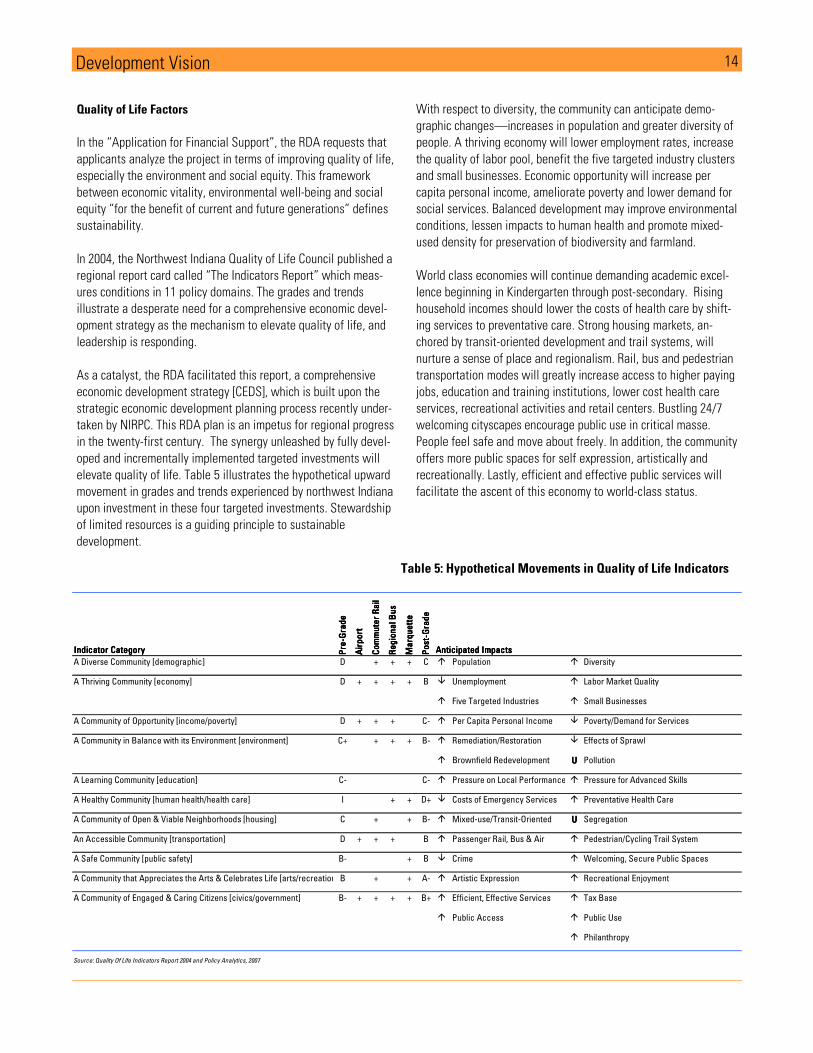
Quality of Life Factors
In the “Application for Financial Support”, the RDA requests that
applicants analyze the project in terms of improving quality of life,
especially the environment and social equity. This framework
between economic vitality, environmental well-being and social
equity “for the benefit of current and future generations” defines
sustainability.
In 2004, the Northwest Indiana Quality of Life Council published a
regional report card called “The Indicators Report” which meas-
ures conditions in 11 policy domains. The grades and trends
illustrate a desperate need for a comprehensive economic devel-
opment strategy as the mechanism to elevate quality of life, and
leadership is responding.
As a catalyst, the RDA facilitated this report, a comprehensive
economic development strategy [CEDS], which is built upon the
strategic economic development planning process recently under-
taken by NIRPC. This RDA plan is an impetus for regional progress
in the twenty-first century. The synergy unleashed by fully devel-
oped and incrementally implemented targeted investments will
elevate quality of life. Table 5 illustrates the hypothetical upward
movement in grades and trends experienced by northwest Indiana
upon investment in these four targeted investments. Stewardship
of limited resources is a guiding principle to sustainable
development.
With respect to diversity, the community can anticipate demo-
graphic changes—increases in population and greater diversity of
people. A thriving economy will lower employment rates, increase
the quality of labor pool, benefit the five targeted industry clusters
and small businesses. Economic opportunity will increase per
capita personal income, ameliorate poverty and lower demand for
social services. Balanced development may improve environmental
conditions, lessen impacts to human health and promote mixed-
used density for preservation of biodiversity and farmland.
World class economies will continue demanding academic excel-
lence beginning in Kindergarten through post-secondary. Rising
household incomes should lower the costs of health care by shift-
ing services to preventative care. Strong housing markets, an-
chored by transit-oriented development and trail systems, will
nurture a sense of place and regionalism. Rail, bus and pedestrian
transportation modes will greatly increase access to higher paying
jobs, education and training institutions, lower cost health care
services, recreational activities and retail centers. Bustling 24/7
welcoming cityscapes encourage public use in critical masse.
People feel safe and move about freely. In addition, the community
offers more public spaces for self expression, artistically and
recreationally. Lastly, efficient and effective public services will
facilitate the ascent of this economy to world-class status.
Table 5: Hypothetical Movements in Quality of Life Indicators
Indicator CategoryIndicator CategoryIndicator CategoryIndicator Category Pre
-Gra
de
Pre
-Gra
de
Pre
-Gra
de
Pre
-Gra
de
Air
port
Air
port
Air
port
Air
port
Com
mute
r R
ail
Com
mute
r R
ail
Com
mute
r R
ail
Com
mute
r R
ail
Regio
nal B
us
Regio
nal B
us
Regio
nal B
us
Regio
nal B
us
Marq
uett
eM
arq
uett
eM
arq
uett
eM
arq
uett
e
Post-
Gra
de
Post-
Gra
de
Post-
Gra
de
Post-
Gra
de
A Diverse Community [demographic] D + + + C � Population � Diversity
A Thriving Community [economy] D + + + + B � Unemployment � Labor Market Quality
� Five Targeted Industries � Small Businesses
A Community of Opportunity [income/poverty] D + + + C- � Per Capita Personal Income � Poverty/Demand for Services
A Community in Balance with its Environment [environment] C+ + + + B- � Remediation/Restoration � Effects of Sprawl
� Brownfield Redevelopment UUUU Pollution
A Learning Community [education] C- C- � Pressure on Local Performance � Pressure for Advanced Skills
A Healthy Community [human health/health care] I + + D+ � Costs of Emergency Services � Preventative Health Care
A Community of Open & Viable Neighborhoods [housing] C + + B- � Mixed-use/Transit-Oriented UUUU Segregation
An Accessible Community [transportation] D + + + B � Passenger Rail, Bus & Air � Pedestrian/Cycling Trail System
A Safe Community [public safety] B- + B � Crime � Welcoming, Secure Public Spaces
A Community that Appreciates the Arts & Celebrates Life [arts/recreation] B + + A- � Artistic Expression � Recreational Enjoyment
A Community of Engaged & Caring Citizens [civics/government] B- + + + + B+ � Efficient, Effective Services � Tax Base
� Public Access � Public Use
� Philanthropy
Source: Quality Of Life Indicators Report 2004 and Policy Analytics, 2007
Anticipated ImpactsAnticipated ImpactsAnticipated ImpactsAnticipated Impacts
15
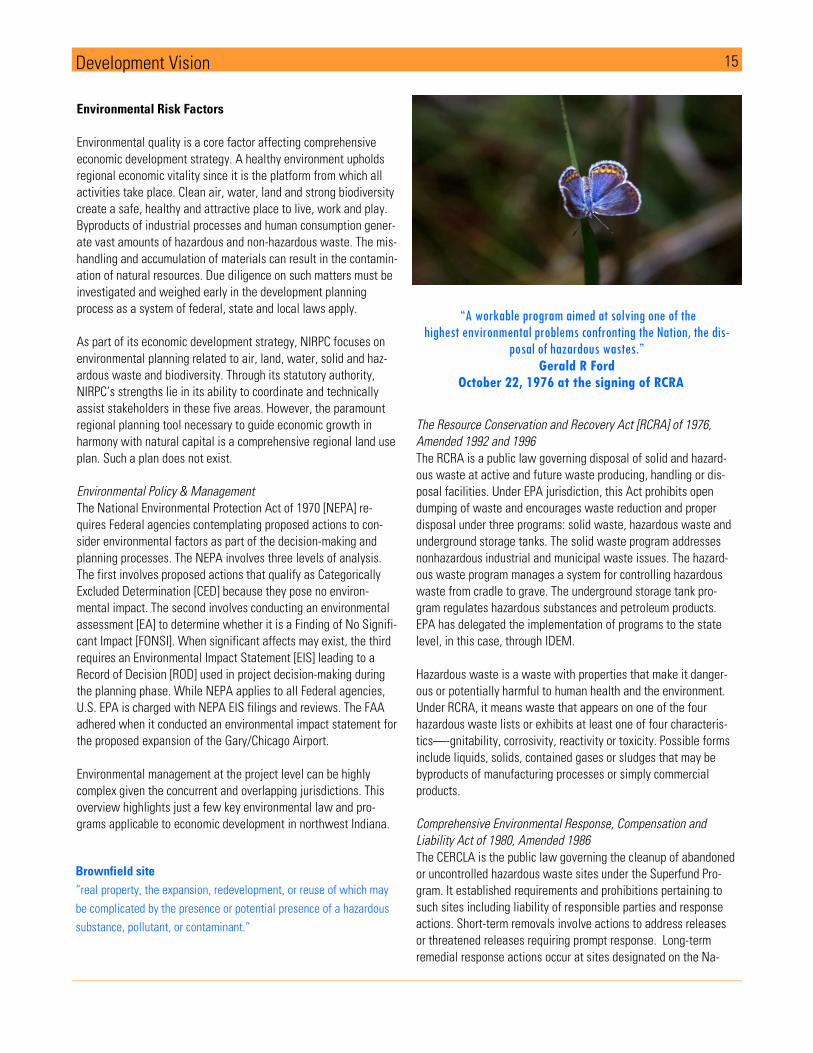
Environmental Risk Factors
Environmental quality is a core factor affecting comprehensive
economic development strategy. A healthy environment upholds
regional economic vitality since it is the platform from which all
activities take place. Clean air, water, land and strong biodiversity
create a safe, healthy and attractive place to live, work and play.
Byproducts of industrial processes and human consumption gener-
ate vast amounts of hazardous and non-hazardous waste. The mis-
handling and accumulation of materials can result in the contamin-
ation of natural resources. Due diligence on such matters must be
investigated and weighed early in the development planning
process as a system of federal, state and local laws apply.
As part of its economic development strategy, NIRPC focuses on
environmental planning related to air, land, water, solid and haz-
ardous waste and biodiversity. Through its statutory authority,
NIRPC’s strengths lie in its ability to coordinate and technically
assist stakeholders in these five areas. However, the paramount
regional planning tool necessary to guide economic growth in
harmony with natural capital is a comprehensive regional land use
plan. Such a plan does not exist.
Environmental Policy & Management
The National Environmental Protection Act of 1970 [NEPA] re-
quires Federal agencies contemplating proposed actions to con-
sider environmental factors as part of the decision-making and
planning processes. The NEPA involves three levels of analysis.
The first involves proposed actions that qualify as Categorically
Excluded Determination [CED] because they pose no environ-
mental impact. The second involves conducting an environmental
assessment [EA] to determine whether it is a Finding of No Signifi-
cant Impact [FONSI]. When significant affects may exist, the third
requires an Environmental Impact Statement [EIS] leading to a
Record of Decision [ROD] used in project decision-making during
the planning phase. While NEPA applies to all Federal agencies,
U.S. EPA is charged with NEPA EIS filings and reviews. The FAA
adhered when it conducted an environmental impact statement for
the proposed expansion of the Gary/Chicago Airport.
Environmental management at the project level can be highly
complex given the concurrent and overlapping jurisdictions. This
overview highlights just a few key environmental law and pro-
grams applicable to economic development in northwest Indiana.
The Resource Conservation and Recovery Act [RCRA] of 1976,
Amended 1992 and 1996
The RCRA is a public law governing disposal of solid and hazard-
ous waste at active and future waste producing, handling or dis-
posal facilities. Under EPA jurisdiction, this Act prohibits open
dumping of waste and encourages waste reduction and proper
disposal under three programs: solid waste, hazardous waste and
underground storage tanks. The solid waste program addresses
nonhazardous industrial and municipal waste issues. The hazard-
ous waste program manages a system for controlling hazardous
waste from cradle to grave. The underground storage tank pro-
gram regulates hazardous substances and petroleum products.
EPA has delegated the implementation of programs to the state
level, in this case, through IDEM.
Hazardous waste is a waste with properties that make it danger-
ous or potentially harmful to human health and the environment.
Under RCRA, it means waste that appears on one of the four
hazardous waste lists or exhibits at least one of four characteris-
tics—-gnitability, corrosivity, reactivity or toxicity. Possible forms
include liquids, solids, contained gases or sludges that may be
byproducts of manufacturing processes or simply commercial
products.
Comprehensive Environmental Response, Compensation and
Liability Act of 1980, Amended 1986
The CERCLA is the public law governing the cleanup of abandoned
or uncontrolled hazardous waste sites under the Superfund Pro-
gram. It established requirements and prohibitions pertaining to
such sites including liability of responsible parties and response
actions. Short-term removals involve actions to address releases
or threatened releases requiring prompt response. Long-term
remedial response actions occur at sites designated on the Na-
“A workable program aimed at solving one of the
highest environmental problems confronting the Nation, the dis-posal of hazardous wastes.”
Gerald R Ford October 22, 1976 at the signing of RCRA
Development Vision
Brownfield site
“real property, the expansion, redevelopment, or reuse of which may
be complicated by the presence or potential presence of a hazardous
substance, pollutant, or contaminant.”
16
tional Priorities List that is serious but not immediately life threat-
ening dangers to human health and the environment.
All Appropriate Inquiries [AAI], CERCLA Brownfields Amendments,
2002
Effective November 2006, all appropriate inquiries defines the
standards and practices for “the process of evaluating a property’s
environmental conditions and assessing potential liability for any
contamination.” AAI applies to any party who may potentially
claim protection under CERCLA liability and to those seeking EPA
Brownfield Grant monies. An AAI must be completed or updated
within one year of property acquisition.
403 Wetlands Permit
Section 404 of the Clean Water Act establishes a program to regulate
the discharge of dredged or fill material into the waters of the United
States, including wetlands. Regulated activities in these waters
include fill for development, water resource projects and infrastruc-
ture development. Section 404 requires a permit before dredged or fill
material may be discharged into the waters of the U.S., unless
exempt. It assesses aquatic environment, potential impacts, ways to
minimize such impacts and compensatory measures if necessary.
The U.S. ACE, U.S. EPA and U.S. FWS maintain a role and responsibil-
ity in this area. The ACE administers the day-to-day program including
the wetlands delineation and permitting processes. The EPA’s role
includes determining the scope of geographic jurisdiction, applicable
exemptions and reviews individual permit applications. The FWS
evaluates impacts to fish and wildlife on all new Federal projects and
Federally-permitted projects.
401 Wetlands Permit
In conjunction with a 403 permit application, a party must file a 401
Water Quality Certification permit or waiver with the Indiana Depart-
ment of Environmental Management’s Office of Water Quality and
Office of Land Quality for wetlands that lie outside of the ACE juris-
diction.
Environmental management exists to address contamination that is
known to adversely affect human health and the environment. It
requires interaction between the responsible party, the appropriate
regulatory agency(s) and potentially, a new purchaser. Typical reme-
diation projects may take at least seven years to complete, which can
add a significant delay to aggressive economic development project
schedules.
Contaminated properties carry a level of risk associated with impact
and clean-up costs. Liability follows the chain of ownership, so new
property owners must weigh their risk tolerance. Legal instruments,
such as leasing agreements and deed covenants, define user and
ownership rights thereby managing some of the risks. Risk adverse
property owners may seek an issuance of No Further Action[NFA] or
Covenant Not To Sue [CNTS]. Both documents protect the seller and
buyer from specifically named contaminants; if a contaminant
emerges on site but is not listed on the NFA or CNTS, both parties
may still be liable. In addition, the EPA may seek compliance assur-
ances during this transaction from both parties.
Wetlands
“areas that are inundated or saturated by surface or ground water
at a frequency and duration sufficient to support, and that under
normal circumstances do support, a prevalence of vegetation
typically adapted for life in saturated soil conditions. Wetlands
generally include swamps, marshes, bogs, and similar areas."
Development Vision
17
Critical Path Factor
Environmental factors are critical paths that may affect either project
timing or costs. Due diligence and proper guidance during initial
planning, acquisition and construction phases can lower these risks
associated with unexpected contamination. Failure to adequately do
so may expose the parties to unanticipated liabilities of clean-up
costs.
Major industries generate billions of dollars and still underpin the
regional economy. Ensuring the longevity of these industries is crucial
to future economic prosperity. Historical manufacturing footprints
have tied up thousands of acres along the shoreline for this lucrative
use. Technological advancements, global industry pressures and
changing land valuations offer an opportunity for leaner facilities to
divest of certain parcels. Elected officials can also influence indus-
tries’ land use decision-making by proposing public infrastructure
aligned to the vision of the Marquette Greenway. Congressman Vis-
closky has made it clear that viable industry is a mainstay along the
shoreline and that potential reuses, advantageous to public access,
will not be made at their expense. An incremental approach for sound
shoreline development is the recommended course of action.
Environmental factors may impede a firm’s ability to fully respond to
such planning request. First, environmental management is a cost
center for business. Every dollar directed toward mitigation does not
create shareholder value. Secondly, several lakefront operations are
designated RCRA facilities undergoing corrective action. Hazardous
waste contamination of soil and water create a complex set of liabil-
ity, remediation and redevelopment issues. As generators of air
pollutants, industries maintain pollution control devices that must be
calibrated based upon air models of on-side and surrounding land
uses. Activities which bring people closer to the RCRA sites for longer
periods of time drive up exposure measurements in industry air mod-
els. Finally, the Sarbanes Oxley Act requires disclosure of contingent
liabilities once quantified. This report utilized environmental remedia-
tion costs developed through reliable public documents, experienced
engineering consulting firms and other publicly available information.
Development Vision

18
Gary Chicago International Airport GYY
19 GYY
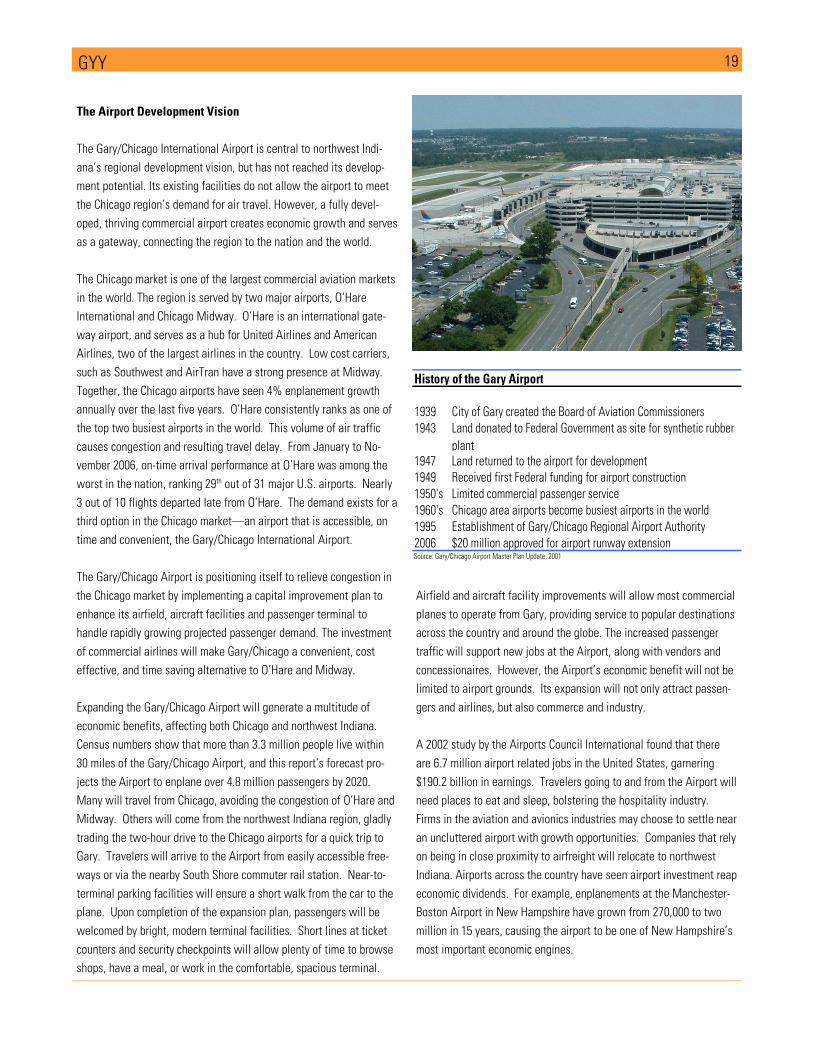
The Airport Development Vision
The Gary/Chicago International Airport is central to northwest Indi-
ana’s regional development vision, but has not reached its develop-
ment potential. Its existing facilities do not allow the airport to meet
the Chicago region’s demand for air travel. However, a fully devel-
oped, thriving commercial airport creates economic growth and serves
as a gateway, connecting the region to the nation and the world.
The Chicago market is one of the largest commercial aviation markets
in the world. The region is served by two major airports, O’Hare
International and Chicago Midway. O’Hare is an international gate-
way airport, and serves as a hub for United Airlines and American
Airlines, two of the largest airlines in the country. Low cost carriers,
such as Southwest and AirTran have a strong presence at Midway.
Together, the Chicago airports have seen 4% enplanement growth
annually over the last five years. O’Hare consistently ranks as one of
the top two busiest airports in the world. This volume of air traffic
causes congestion and resulting travel delay. From January to No-
vember 2006, on-time arrival performance at O’Hare was among the
worst in the nation, ranking 29th out of 31 major U.S. airports. Nearly
3 out of 10 flights departed late from O’Hare. The demand exists for a
third option in the Chicago market—an airport that is accessible, on
time and convenient, the Gary/Chicago International Airport.
The Gary/Chicago Airport is positioning itself to relieve congestion in
the Chicago market by implementing a capital improvement plan to
enhance its airfield, aircraft facilities and passenger terminal to
handle rapidly growing projected passenger demand. The investment
of commercial airlines will make Gary/Chicago a convenient, cost
effective, and time saving alternative to O’Hare and Midway.
Expanding the Gary/Chicago Airport will generate a multitude of
economic benefits, affecting both Chicago and northwest Indiana.
Census numbers show that more than 3.3 million people live within
30 miles of the Gary/Chicago Airport, and this report’s forecast pro-
jects the Airport to enplane over 4.8 million passengers by 2020.
Many will travel from Chicago, avoiding the congestion of O’Hare and
Midway. Others will come from the northwest Indiana region, gladly
trading the two-hour drive to the Chicago airports for a quick trip to
Gary. Travelers will arrive to the Airport from easily accessible free-
ways or via the nearby South Shore commuter rail station. Near-to-
terminal parking facilities will ensure a short walk from the car to the
plane. Upon completion of the expansion plan, passengers will be
welcomed by bright, modern terminal facilities. Short lines at ticket
counters and security checkpoints will allow plenty of time to browse
shops, have a meal, or work in the comfortable, spacious terminal.
Airfield and aircraft facility improvements will allow most commercial
planes to operate from Gary, providing service to popular destinations
across the country and around the globe. The increased passenger
traffic will support new jobs at the Airport, along with vendors and
concessionaires. However, the Airport’s economic benefit will not be
limited to airport grounds. Its expansion will not only attract passen-
gers and airlines, but also commerce and industry.
A 2002 study by the Airports Council International found that there
are 6.7 million airport related jobs in the United States, garnering
$190.2 billion in earnings. Travelers going to and from the Airport will
need places to eat and sleep, bolstering the hospitality industry.
Firms in the aviation and avionics industries may choose to settle near
an uncluttered airport with growth opportunities. Companies that rely
on being in close proximity to airfreight will relocate to northwest
Indiana. Airports across the country have seen airport investment reap
economic dividends. For example, enplanements at the Manchester-
Boston Airport in New Hampshire have grown from 270,000 to two
million in 15 years, causing the airport to be one of New Hampshire’s
most important economic engines.
History of the Gary Airport
1939 City of Gary created the Board of Aviation Commissioners
1943 Land donated to Federal Government as site for synthetic rubber
plant1947 Land returned to the airport for development
1949 Received first Federal funding for airport construction
1950's Limited commercial passenger service
1960's Chicago area airports become busiest airports in the world
1995 Establishment of Gary/Chicago Regional Airport Authority
2006 $20 million approved for airport runway extensionSource: Gary/Chicago Airport Master Plan Update, 2001
20 GYY
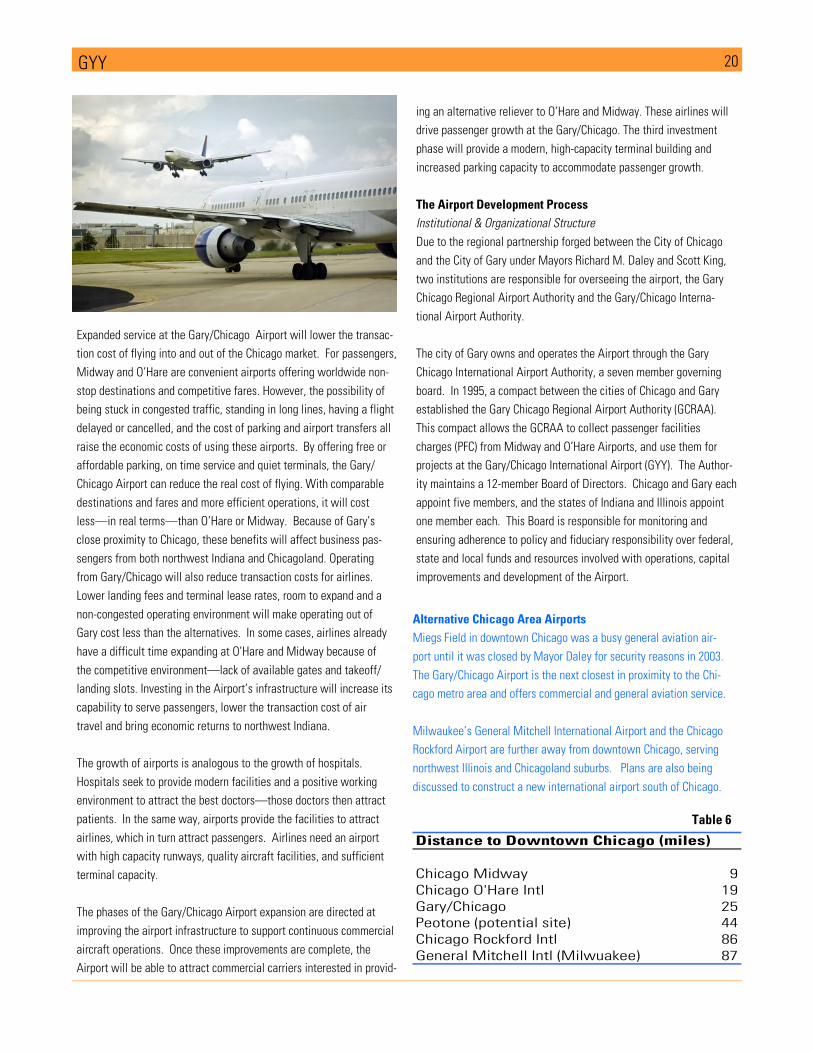
Expanded service at the Gary/Chicago Airport will lower the transac-
tion cost of flying into and out of the Chicago market. For passengers,
Midway and O’Hare are convenient airports offering worldwide non-
stop destinations and competitive fares. However, the possibility of
being stuck in congested traffic, standing in long lines, having a flight
delayed or cancelled, and the cost of parking and airport transfers all
raise the economic costs of using these airports. By offering free or
affordable parking, on time service and quiet terminals, the Gary/
Chicago Airport can reduce the real cost of flying. With comparable
destinations and fares and more efficient operations, it will cost
less—in real terms—than O’Hare or Midway. Because of Gary’s
close proximity to Chicago, these benefits will affect business pas-
sengers from both northwest Indiana and Chicagoland. Operating
from Gary/Chicago will also reduce transaction costs for airlines.
Lower landing fees and terminal lease rates, room to expand and a
non-congested operating environment will make operating out of
Gary cost less than the alternatives. In some cases, airlines already
have a difficult time expanding at O’Hare and Midway because of
the competitive environment—lack of available gates and takeoff/
landing slots. Investing in the Airport’s infrastructure will increase its
capability to serve passengers, lower the transaction cost of air
travel and bring economic returns to northwest Indiana.
The growth of airports is analogous to the growth of hospitals.
Hospitals seek to provide modern facilities and a positive working
environment to attract the best doctors—those doctors then attract
patients. In the same way, airports provide the facilities to attract
airlines, which in turn attract passengers. Airlines need an airport
with high capacity runways, quality aircraft facilities, and sufficient
terminal capacity.
The phases of the Gary/Chicago Airport expansion are directed at
improving the airport infrastructure to support continuous commercial
aircraft operations. Once these improvements are complete, the
Airport will be able to attract commercial carriers interested in provid-
ing an alternative reliever to O’Hare and Midway. These airlines will
drive passenger growth at the Gary/Chicago. The third investment
phase will provide a modern, high-capacity terminal building and
increased parking capacity to accommodate passenger growth.
The Airport Development Process
Institutional & Organizational Structure
Due to the regional partnership forged between the City of Chicago
and the City of Gary under Mayors Richard M. Daley and Scott King,
two institutions are responsible for overseeing the airport, the Gary
Chicago Regional Airport Authority and the Gary/Chicago Interna-
tional Airport Authority.
The city of Gary owns and operates the Airport through the Gary
Chicago International Airport Authority, a seven member governing
board. In 1995, a compact between the cities of Chicago and Gary
established the Gary Chicago Regional Airport Authority (GCRAA).
This compact allows the GCRAA to collect passenger facilities
charges (PFC) from Midway and O’Hare Airports, and use them for
projects at the Gary/Chicago International Airport (GYY). The Author-
ity maintains a 12-member Board of Directors. Chicago and Gary each
appoint five members, and the states of Indiana and Illinois appoint
one member each. This Board is responsible for monitoring and
ensuring adherence to policy and fiduciary responsibility over federal,
state and local funds and resources involved with operations, capital
improvements and development of the Airport.
Chicago Midway 9
Chicago O'Hare Intl 19
Gary/Chicago 25
Peotone (potential site) 44
Chicago Rockford Intl 86
General Mitchell Intl (Milwuakee) 87
Distance to Downtown Chicago (miles)
Alternative Chicago Area Airports
Miegs Field in downtown Chicago was a busy general aviation air-
port until it was closed by Mayor Daley for security reasons in 2003.
The Gary/Chicago Airport is the next closest in proximity to the Chi-
cago metro area and offers commercial and general aviation service.
Milwaukee’s General Mitchell International Airport and the Chicago
Rockford Airport are further away from downtown Chicago, serving
northwest Illinois and Chicagoland suburbs. Plans are also being
discussed to construct a new international airport south of Chicago.
Table 6
21 GYY
Core Services
In October 2006, officials at Gary/Chicago welcomed Ft. Lauderdale,
FL-based SkyValue USA as its low cost commercial carrier and an-
nounced that SkyValue would begin non-stop service to five destina-
tions: Fort Lauderdale FL , Las Vegas NV, Orlando FL, Phoenix AZ and
St. Petersburg FL in December. A total of 22 weekly round-trip flights
are expected aboard Boeing 737-800 aircraft with maximum capacity
of 174 passengers. SkyValue, an affiliate of Xtra Airways, hired 39
new flight attendants from northwest Indiana and Chicago to service
the anticipated schedule. Near terminal parking is free.
Private services include the Gary Jet Center, charter passenger flight,
general aviation, air cargo operators and on-demand airfreight ship-
ments. Aviation Professionals Inc. offers flight training, FAA testing
and a shop for pilots.
Current Facilities
The Airport lies off of I-90, I-80/94 at Cline Avenue and U.S. Highway
12/Industrial Avenues. The current footprint consists of 716 acres
centered by the airfield configuration of two active runways. Runway
12-30, the primary runway, measures 7,000 feet long and 150 feet
wide. The crosswind runway 2-20 measures 3,603 feet long and 100
feet wide. The terminal building is handicap accessible with three
gates including a concession area, automated luggage retrieval and
ticket counters. Airport facilities include a passenger terminal build-
ing, the Gary Jet Center, the Fixed Base Operator (FBO) and several
hangars for both corporate and general aviation use, an Aircraft
Rescue and Fire Fighting (ARFF) unit, fuel storage and an airport
maintenance facility.
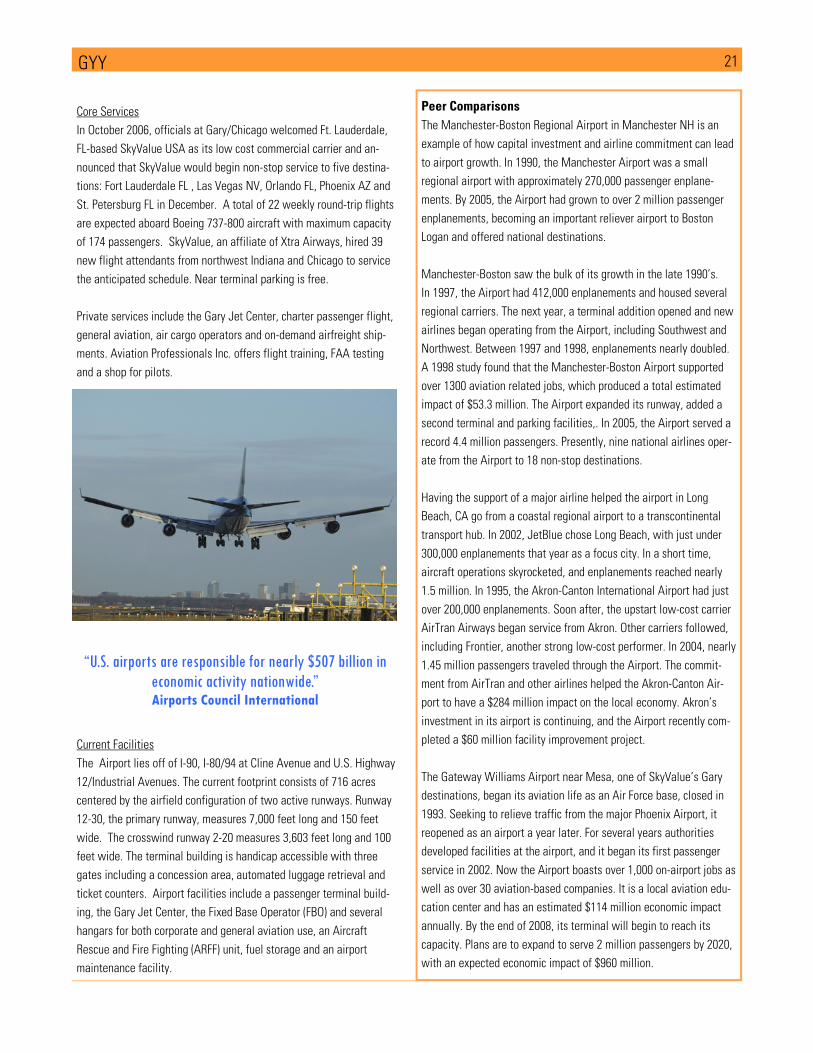
“U.S. airports are responsible for nearly $507 billion in
economic activity nationwide.” Airports Council International
Peer Comparisons
The Manchester-Boston Regional Airport in Manchester NH is an
example of how capital investment and airline commitment can lead
to airport growth. In 1990, the Manchester Airport was a small
regional airport with approximately 270,000 passenger enplane-
ments. By 2005, the Airport had grown to over 2 million passenger
enplanements, becoming an important reliever airport to Boston
Logan and offered national destinations.
Manchester-Boston saw the bulk of its growth in the late 1990’s.
In 1997, the Airport had 412,000 enplanements and housed several
regional carriers. The next year, a terminal addition opened and new
airlines began operating from the Airport, including Southwest and
Northwest. Between 1997 and 1998, enplanements nearly doubled.
A 1998 study found that the Manchester-Boston Airport supported
over 1300 aviation related jobs, which produced a total estimated
impact of $53.3 million. The Airport expanded its runway, added a
second terminal and parking facilities,. In 2005, the Airport served a
record 4.4 million passengers. Presently, nine national airlines oper-
ate from the Airport to 18 non-stop destinations.
Having the support of a major airline helped the airport in Long
Beach, CA go from a coastal regional airport to a transcontinental
transport hub. In 2002, JetBlue chose Long Beach, with just under
300,000 enplanements that year as a focus city. In a short time,
aircraft operations skyrocketed, and enplanements reached nearly
1.5 million. In 1995, the Akron-Canton International Airport had just
over 200,000 enplanements. Soon after, the upstart low-cost carrier
AirTran Airways began service from Akron. Other carriers followed,
including Frontier, another strong low-cost performer. In 2004, nearly
1.45 million passengers traveled through the Airport. The commit-
ment from AirTran and other airlines helped the Akron-Canton Air-
port to have a $284 million impact on the local economy. Akron’s
investment in its airport is continuing, and the Airport recently com-
pleted a $60 million facility improvement project.
The Gateway Williams Airport near Mesa, one of SkyValue’s Gary
destinations, began its aviation life as an Air Force base, closed in
1993. Seeking to relieve traffic from the major Phoenix Airport, it
reopened as an airport a year later. For several years authorities
developed facilities at the airport, and it began its first passenger
service in 2002. Now the Airport boasts over 1,000 on-airport jobs as
well as over 30 aviation-based companies. It is a local aviation edu-
cation center and has an estimated $114 million economic impact
annually. By the end of 2008, its terminal will begin to reach its
capacity. Plans are to expand to serve 2 million passengers by 2020,
with an expected economic impact of $960 million.
22 GYY
The Opportunity
Seeing Gary/Chicago transform into the reliever and third major
Chicago airport is a critical step toward realizing northwest Indiana’s
economic potential. Northwest Indiana’s leaders and researchers
understand this imperative. Specifically, stakeholder interviews
included Gary/Chicago airport’s development as a component of the
region’s strategic vision for transportation. Fully developed, it will
serve as the cornerstone of Northwest Indiana’s transportation infra-
structure, enabling business to interact more efficiently in a global
economy.
Chicago’s need for a third airport has been demonstrated in this
report, and congestion is only predicted to increase. Air travel is the
mode of transportation for modern business, and without efficient
access, firms become disconnected from clients and suppliers. Even
massive airports like O’Hare face air traffic capacity limitations.
Access to air travel is so valuable that the economic and political
forces that drive Chicago’s economy will not allow limited capacity to
hinder economic progress over the long term. Chicago’s demand for
additional capacity will be satisfied by a third major commercial
airport. It is up to the leaders in northwest Indiana to ensure that
Gary/Chicago assumes that role. To take advantage of this market
opportunity, Gary/Chicago must invest both wisely and aggressively.
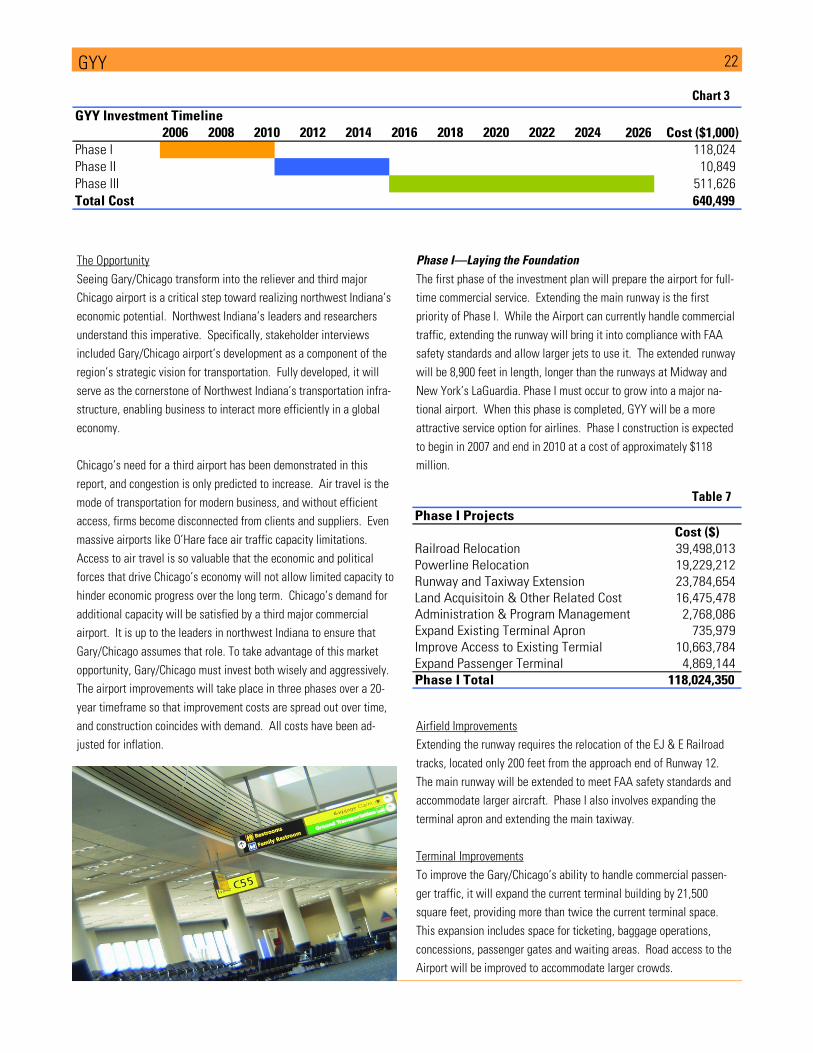
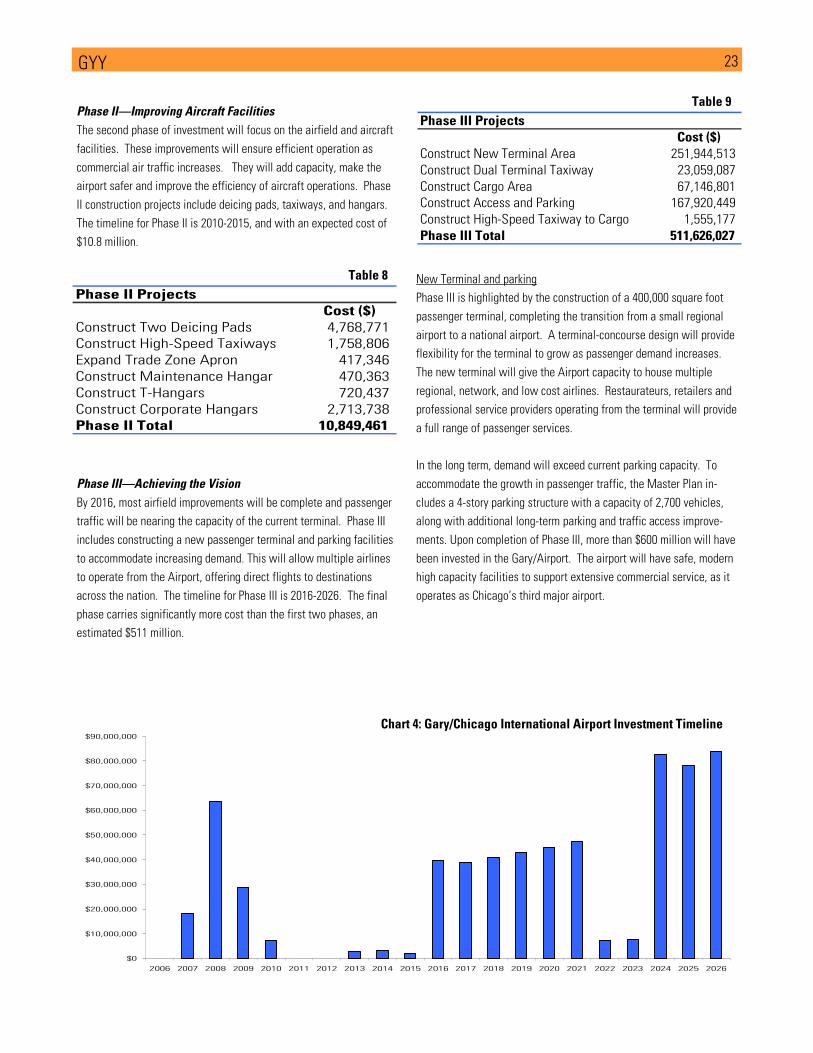
The airport improvements will take place in three phases over a 20-
year timeframe so that improvement costs are spread out over time,
and construction coincides with demand. All costs have been ad-
justed for inflation.
Phase I—Laying the Foundation
The first phase of the investment plan will prepare the airport for full-
time commercial service. Extending the main runway is the first
priority of Phase I. While the Airport can currently handle commercial
traffic, extending the runway will bring it into compliance with FAA
safety standards and allow larger jets to use it. The extended runway
will be 8,900 feet in length, longer than the runways at Midway and
New York’s LaGuardia. Phase I must occur to grow into a major na-
tional airport. When this phase is completed, GYY will be a more
attractive service option for airlines. Phase I construction is expected
to begin in 2007 and end in 2010 at a cost of approximately $118
million.
Airfield Improvements
Extending the runway requires the relocation of the EJ & E Railroad
tracks, located only 200 feet from the approach end of Runway 12.
The main runway will be extended to meet FAA safety standards and
accommodate larger aircraft. Phase I also involves expanding the
terminal apron and extending the main taxiway.
Terminal Improvements
To improve the Gary/Chicago’s ability to handle commercial passen-
ger traffic, it will expand the current terminal building by 21,500
square feet, providing more than twice the current terminal space.
This expansion includes space for ticketing, baggage operations,
concessions, passenger gates and waiting areas. Road access to the
Airport will be improved to accommodate larger crowds.
Phase I ProjectsCost ($)
Railroad Relocation 39,498,013
Powerline Relocation 19,229,212
Runway and Taxiway Extension 23,784,654
Land Acquisitoin & Other Related Cost 16,475,478
Administration & Program Management 2,768,086
Expand Existing Terminal Apron 735,979
Improve Access to Existing Termial 10,663,784
Expand Passenger Terminal 4,869,144
Phase I Total 118,024,350
Chart 3
Table 7
GYY Investment Timeline2026 Cost ($1,000)
Phase I 118,024
Phase II 10,849
Phase III 511,626
Total Cost 640,499
2022 20242014 2016 2018 20202006 2008 2010 2012
23 GYY
Phase II—Improving Aircraft Facilities
The second phase of investment will focus on the airfield and aircraft
facilities. These improvements will ensure efficient operation as
commercial air traffic increases. They will add capacity, make the
airport safer and improve the efficiency of aircraft operations. Phase
II construction projects include deicing pads, taxiways, and hangars.
The timeline for Phase II is 2010-2015, and with an expected cost of
$10.8 million.
Phase III—Achieving the Vision
By 2016, most airfield improvements will be complete and passenger
traffic will be nearing the capacity of the current terminal. Phase III
includes constructing a new passenger terminal and parking facilities
to accommodate increasing demand. This will allow multiple airlines
to operate from the Airport, offering direct flights to destinations
across the nation. The timeline for Phase III is 2016-2026. The final
phase carries significantly more cost than the first two phases, an
estimated $511 million.
New Terminal and parking
Phase III is highlighted by the construction of a 400,000 square foot
passenger terminal, completing the transition from a small regional
airport to a national airport. A terminal-concourse design will provide
flexibility for the terminal to grow as passenger demand increases.
The new terminal will give the Airport capacity to house multiple
regional, network, and low cost airlines. Restaurateurs, retailers and
professional service providers operating from the terminal will provide
a full range of passenger services.
In the long term, demand will exceed current parking capacity. To
accommodate the growth in passenger traffic, the Master Plan in-
cludes a 4-story parking structure with a capacity of 2,700 vehicles,
along with additional long-term parking and traffic access improve-
ments. Upon completion of Phase III, more than $600 million will have
been invested in the Gary/Airport. The airport will have safe, modern
high capacity facilities to support extensive commercial service, as it
operates as Chicago’s third major airport.
$0
$10,000,000
$20,000,000
$30,000,000
$40,000,000
$50,000,000
$60,000,000
$70,000,000
$80,000,000
$90,000,000
2006 2007 2008 2009 2010 2011 2012 2013 2014 2015 2016 2017 2018 2019 2020 2021 2022 2023 2024 2025 2026
Chart 4: Gary/Chicago International Airport Investment Timeline
Phase III ProjectsCost ($)
Construct New Terminal Area 251,944,513
Construct Dual Terminal Taxiway 23,059,087
Construct Cargo Area 67,146,801
Construct Access and Parking 167,920,449
Construct High-Speed Taxiway to Cargo 1,555,177
Phase III Total 511,626,027
Table 9
Phase II ProjectsCost ($)
Construct Two Deicing Pads 4,768,771
Construct High-Speed Taxiways 1,758,806
Expand Trade Zone Apron 417,346
Construct Maintenance Hangar 470,363
Construct T-Hangars 720,437
Construct Corporate Hangars 2,713,738
Phase II Total 10,849,461
Table 8
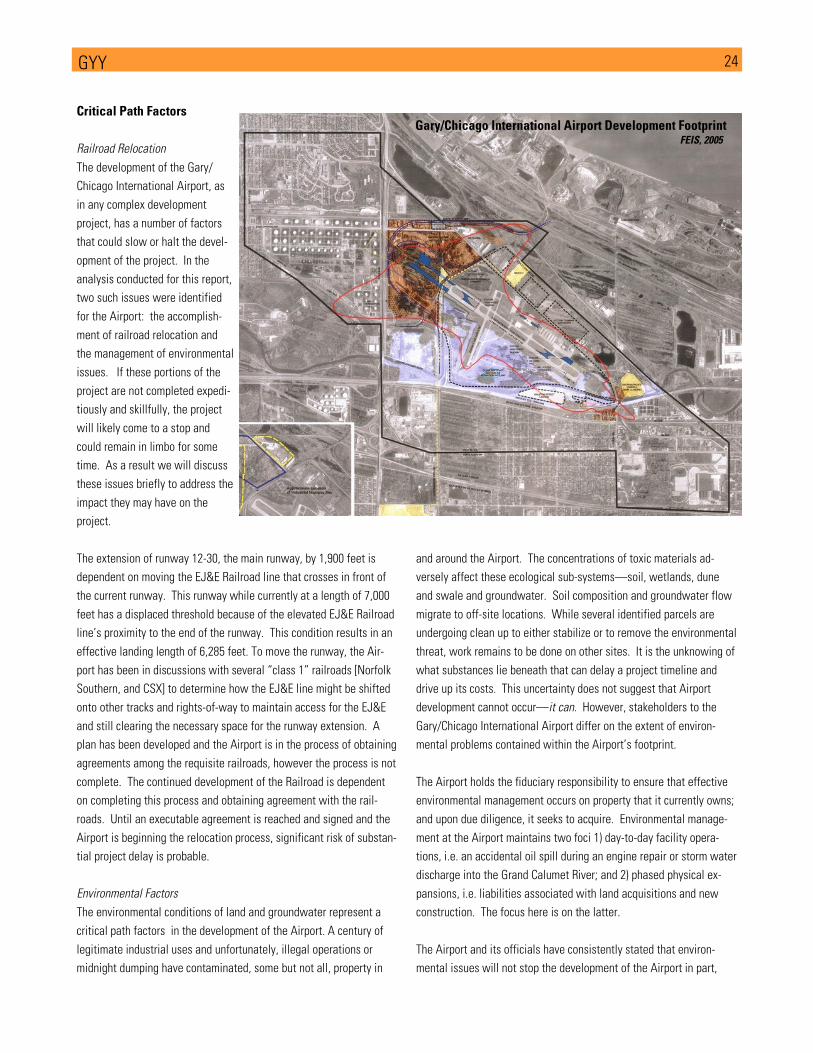
24 GYY
Critical Path Factors
Railroad Relocation
The development of the Gary/
Chicago International Airport, as
in any complex development
project, has a number of factors
that could slow or halt the devel-
opment of the project. In the
analysis conducted for this report,
two such issues were identified
for the Airport: the accomplish-
ment of railroad relocation and
the management of environmental
issues. If these portions of the
project are not completed expedi-
tiously and skillfully, the project
will likely come to a stop and
could remain in limbo for some
time. As a result we will discuss
these issues briefly to address the
impact they may have on the
project.
The extension of runway 12-30, the main runway, by 1,900 feet is
dependent on moving the EJ&E Railroad line that crosses in front of
the current runway. This runway while currently at a length of 7,000
feet has a displaced threshold because of the elevated EJ&E Railroad
line’s proximity to the end of the runway. This condition results in an
effective landing length of 6,285 feet. To move the runway, the Air-
port has been in discussions with several “class 1” railroads [Norfolk
Southern, and CSX] to determine how the EJ&E line might be shifted
onto other tracks and rights-of-way to maintain access for the EJ&E
and still clearing the necessary space for the runway extension. A
plan has been developed and the Airport is in the process of obtaining
agreements among the requisite railroads, however the process is not
complete. The continued development of the Railroad is dependent
on completing this process and obtaining agreement with the rail-
roads. Until an executable agreement is reached and signed and the
Airport is beginning the relocation process, significant risk of substan-
tial project delay is probable.
Environmental Factors
The environmental conditions of land and groundwater represent a
critical path factors in the development of the Airport. A century of
legitimate industrial uses and unfortunately, illegal operations or
midnight dumping have contaminated, some but not all, property in
and around the Airport. The concentrations of toxic materials ad-
versely affect these ecological sub-systems—soil, wetlands, dune
and swale and groundwater. Soil composition and groundwater flow
migrate to off-site locations. While several identified parcels are
undergoing clean up to either stabilize or to remove the environmental
threat, work remains to be done on other sites. It is the unknowing of
what substances lie beneath that can delay a project timeline and
drive up its costs. This uncertainty does not suggest that Airport
development cannot occur—it can. However, stakeholders to the
Gary/Chicago International Airport differ on the extent of environ-
mental problems contained within the Airport’s footprint.
The Airport holds the fiduciary responsibility to ensure that effective
environmental management occurs on property that it currently owns;
and upon due diligence, it seeks to acquire. Environmental manage-
ment at the Airport maintains two foci 1) day-to-day facility opera-
tions, i.e. an accidental oil spill during an engine repair or storm water
discharge into the Grand Calumet River; and 2) phased physical ex-
pansions, i.e. liabilities associated with land acquisitions and new
construction. The focus here is on the latter.
The Airport and its officials have consistently stated that environ-
mental issues will not stop the development of the Airport in part,
Gary/Chicago International Airport Development Footprint FEIS, 2005
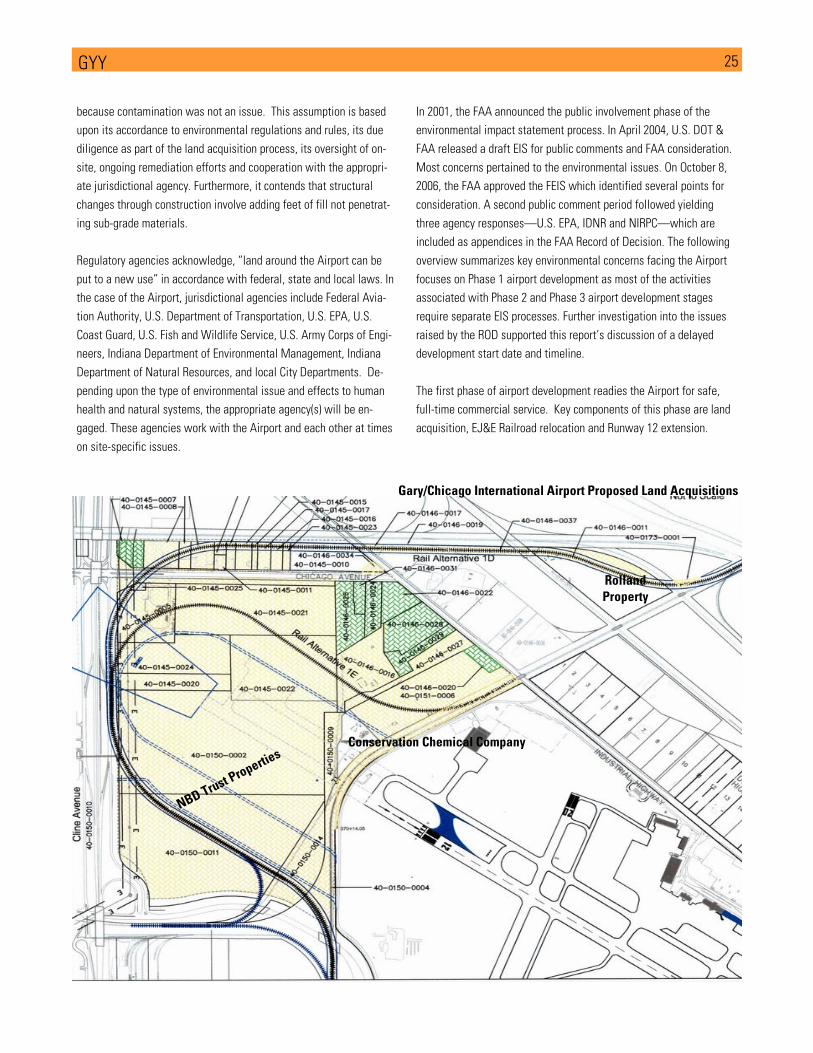
25 GYY
because contamination was not an issue. This assumption is based
upon its accordance to environmental regulations and rules, its due
diligence as part of the land acquisition process, its oversight of on-
site, ongoing remediation efforts and cooperation with the appropri-
ate jurisdictional agency. Furthermore, it contends that structural
changes through construction involve adding feet of fill not penetrat-
ing sub-grade materials.
Regulatory agencies acknowledge, “land around the Airport can be
put to a new use” in accordance with federal, state and local laws. In
the case of the Airport, jurisdictional agencies include Federal Avia-
tion Authority, U.S. Department of Transportation, U.S. EPA, U.S.
Coast Guard, U.S. Fish and Wildlife Service, U.S. Army Corps of Engi-
neers, Indiana Department of Environmental Management, Indiana
Department of Natural Resources, and local City Departments. De-
pending upon the type of environmental issue and effects to human
health and natural systems, the appropriate agency(s) will be en-
gaged. These agencies work with the Airport and each other at times
on site-specific issues.
In 2001, the FAA announced the public involvement phase of the
environmental impact statement process. In April 2004, U.S. DOT &
FAA released a draft EIS for public comments and FAA consideration.
Most concerns pertained to the environmental issues. On October 8,
2006, the FAA approved the FEIS which identified several points for
consideration. A second public comment period followed yielding
three agency responses—U.S. EPA, IDNR and NIRPC—which are
included as appendices in the FAA Record of Decision. The following
overview summarizes key environmental concerns facing the Airport
focuses on Phase 1 airport development as most of the activities
associated with Phase 2 and Phase 3 airport development stages
require separate EIS processes. Further investigation into the issues
raised by the ROD supported this report’s discussion of a delayed
development start date and timeline.
The first phase of airport development readies the Airport for safe,
full-time commercial service. Key components of this phase are land
acquisition, EJ&E Railroad relocation and Runway 12 extension.
NBD T
rust Pr
opertie
s Conservation Chemical Company
Rolland Property
Gary/Chicago International Airport Proposed Land Acquisitions
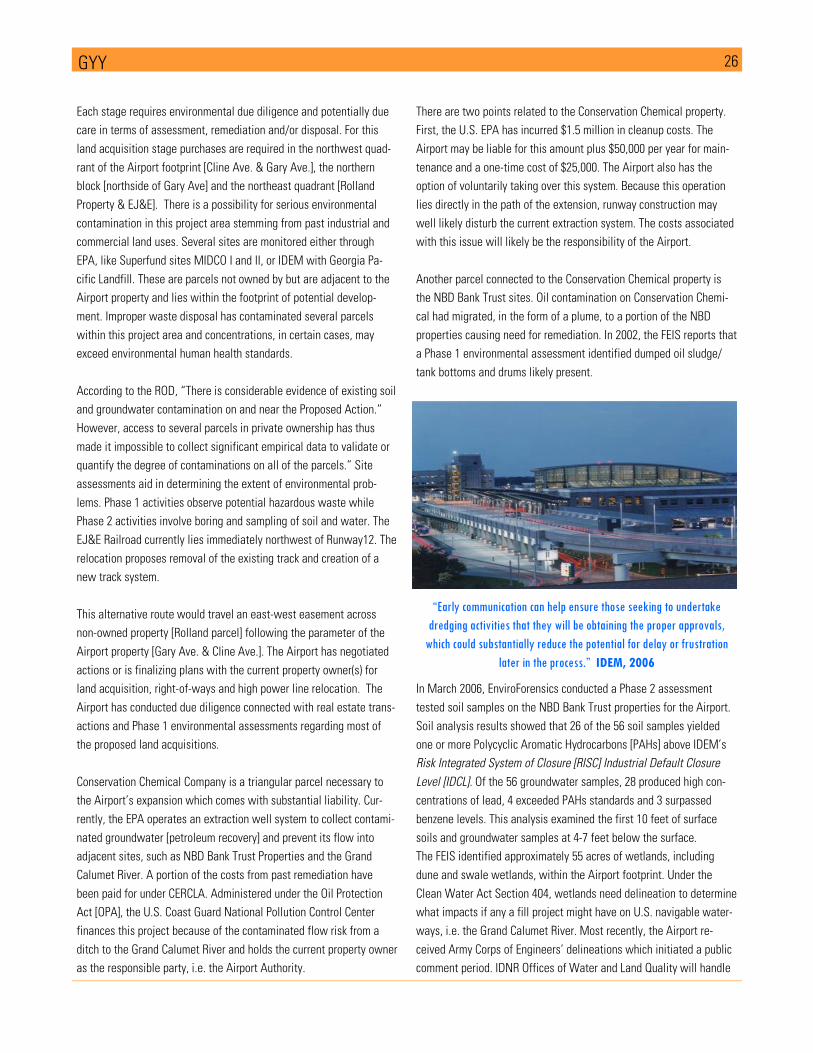
26 GYY
Each stage requires environmental due diligence and potentially due
care in terms of assessment, remediation and/or disposal. For this
land acquisition stage purchases are required in the northwest quad-
rant of the Airport footprint [Cline Ave. & Gary Ave.], the northern
block [northside of Gary Ave] and the northeast quadrant [Rolland
Property & EJ&E]. There is a possibility for serious environmental
contamination in this project area stemming from past industrial and
commercial land uses. Several sites are monitored either through
EPA, like Superfund sites MIDCO I and II, or IDEM with Georgia Pa-
cific Landfill. These are parcels not owned by but are adjacent to the
Airport property and lies within the footprint of potential develop-
ment. Improper waste disposal has contaminated several parcels
within this project area and concentrations, in certain cases, may
exceed environmental human health standards.
According to the ROD, “There is considerable evidence of existing soil
and groundwater contamination on and near the Proposed Action.”
However, access to several parcels in private ownership has thus
made it impossible to collect significant empirical data to validate or
quantify the degree of contaminations on all of the parcels.” Site
assessments aid in determining the extent of environmental prob-
lems. Phase 1 activities observe potential hazardous waste while
Phase 2 activities involve boring and sampling of soil and water. The
EJ&E Railroad currently lies immediately northwest of Runway12. The
relocation proposes removal of the existing track and creation of a
new track system.
This alternative route would travel an east-west easement across
non-owned property [Rolland parcel] following the parameter of the
Airport property [Gary Ave. & Cline Ave.]. The Airport has negotiated
actions or is finalizing plans with the current property owner(s) for
land acquisition, right-of-ways and high power line relocation. The
Airport has conducted due diligence connected with real estate trans-
actions and Phase 1 environmental assessments regarding most of
the proposed land acquisitions.
Conservation Chemical Company is a triangular parcel necessary to
the Airport’s expansion which comes with substantial liability. Cur-
rently, the EPA operates an extraction well system to collect contami-
nated groundwater [petroleum recovery] and prevent its flow into
adjacent sites, such as NBD Bank Trust Properties and the Grand
Calumet River. A portion of the costs from past remediation have
been paid for under CERCLA. Administered under the Oil Protection
Act [OPA], the U.S. Coast Guard National Pollution Control Center
finances this project because of the contaminated flow risk from a
ditch to the Grand Calumet River and holds the current property owner
as the responsible party, i.e. the Airport Authority.
There are two points related to the Conservation Chemical property.
First, the U.S. EPA has incurred $1.5 million in cleanup costs. The
Airport may be liable for this amount plus $50,000 per year for main-
tenance and a one-time cost of $25,000. The Airport also has the
option of voluntarily taking over this system. Because this operation
lies directly in the path of the extension, runway construction may
well likely disturb the current extraction system. The costs associated
with this issue will likely be the responsibility of the Airport.
Another parcel connected to the Conservation Chemical property is
the NBD Bank Trust sites. Oil contamination on Conservation Chemi-
cal had migrated, in the form of a plume, to a portion of the NBD
properties causing need for remediation. In 2002, the FEIS reports that
a Phase 1 environmental assessment identified dumped oil sludge/
tank bottoms and drums likely present.
In March 2006, EnviroForensics conducted a Phase 2 assessment
tested soil samples on the NBD Bank Trust properties for the Airport.
Soil analysis results showed that 26 of the 56 soil samples yielded
one or more Polycyclic Aromatic Hydrocarbons [PAHs] above IDEM’s
Risk Integrated System of Closure [RISC] Industrial Default Closure
Level [IDCL]. Of the 56 groundwater samples, 28 produced high con-
centrations of lead, 4 exceeded PAHs standards and 3 surpassed
benzene levels. This analysis examined the first 10 feet of surface
soils and groundwater samples at 4-7 feet below the surface.
The FEIS identified approximately 55 acres of wetlands, including
dune and swale wetlands, within the Airport footprint. Under the
Clean Water Act Section 404, wetlands need delineation to determine
what impacts if any a fill project might have on U.S. navigable water-
ways, i.e. the Grand Calumet River. Most recently, the Airport re-
ceived Army Corps of Engineers’ delineations which initiated a public
comment period. IDNR Offices of Water and Land Quality will handle
“Early communication can help ensure those seeking to undertake
dredging activities that they will be obtaining the proper approvals,
which could substantially reduce the potential for delay or frustration
later in the process.” IDEM, 2006
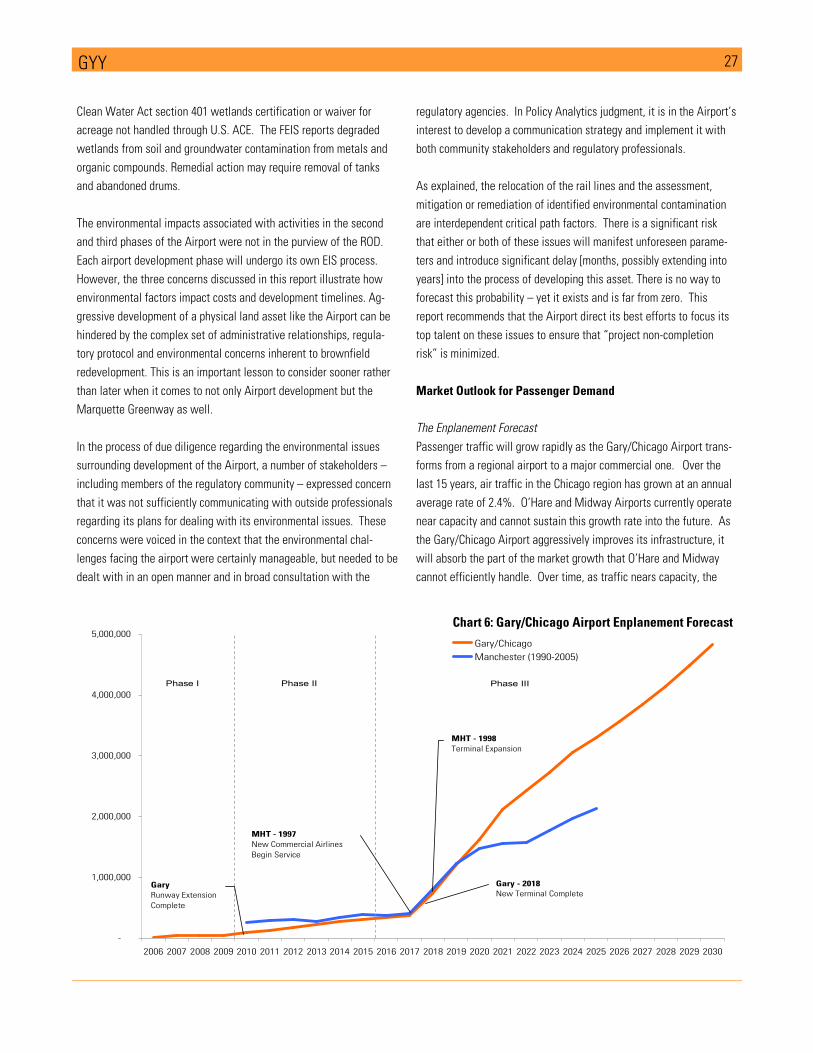
27 GYY
Clean Water Act section 401 wetlands certification or waiver for
acreage not handled through U.S. ACE. The FEIS reports degraded
wetlands from soil and groundwater contamination from metals and
organic compounds. Remedial action may require removal of tanks
and abandoned drums.
The environmental impacts associated with activities in the second
and third phases of the Airport were not in the purview of the ROD.
Each airport development phase will undergo its own EIS process.
However, the three concerns discussed in this report illustrate how
environmental factors impact costs and development timelines. Ag-
gressive development of a physical land asset like the Airport can be
hindered by the complex set of administrative relationships, regula-
tory protocol and environmental concerns inherent to brownfield
redevelopment. This is an important lesson to consider sooner rather
than later when it comes to not only Airport development but the
Marquette Greenway as well.
In the process of due diligence regarding the environmental issues
surrounding development of the Airport, a number of stakeholders –
including members of the regulatory community – expressed concern
that it was not sufficiently communicating with outside professionals
regarding its plans for dealing with its environmental issues. These
concerns were voiced in the context that the environmental chal-
lenges facing the airport were certainly manageable, but needed to be
dealt with in an open manner and in broad consultation with the
regulatory agencies. In Policy Analytics judgment, it is in the Airport’s
interest to develop a communication strategy and implement it with
both community stakeholders and regulatory professionals.
As explained, the relocation of the rail lines and the assessment,
mitigation or remediation of identified environmental contamination
are interdependent critical path factors. There is a significant risk
that either or both of these issues will manifest unforeseen parame-
ters and introduce significant delay [months, possibly extending into
years] into the process of developing this asset. There is no way to
forecast this probability – yet it exists and is far from zero. This
report recommends that the Airport direct its best efforts to focus its
top talent on these issues to ensure that “project non-completion
risk” is minimized.
Market Outlook for Passenger Demand
The Enplanement Forecast
Passenger traffic will grow rapidly as the Gary/Chicago Airport trans-
forms from a regional airport to a major commercial one. Over the
last 15 years, air traffic in the Chicago region has grown at an annual
average rate of 2.4%. O’Hare and Midway Airports currently operate
near capacity and cannot sustain this growth rate into the future. As
the Gary/Chicago Airport aggressively improves its infrastructure, it
will absorb the part of the market growth that O’Hare and Midway
cannot efficiently handle. Over time, as traffic nears capacity, the
-
1,000,000
2,000,000
3,000,000
4,000,000
5,000,000
2006 2007 2008 2009 2010 2011 2012 2013 2014 2015 2016 2017 2018 2019 2020 2021 2022 2023 2024 2025 2026 2027 2028 2029 2030
Gary/Chicago
Manchester (1990-2005)
Phase I Phase II Phase III
Gary - 2018
New Terminal Complete
MHT - 1998
Terminal Expansion
Gary
Runway Extension
Complete
MHT - 1997
New Commercial Airlines
Begin Service
Chart 6: Gary/Chicago Airport Enplanement Forecast
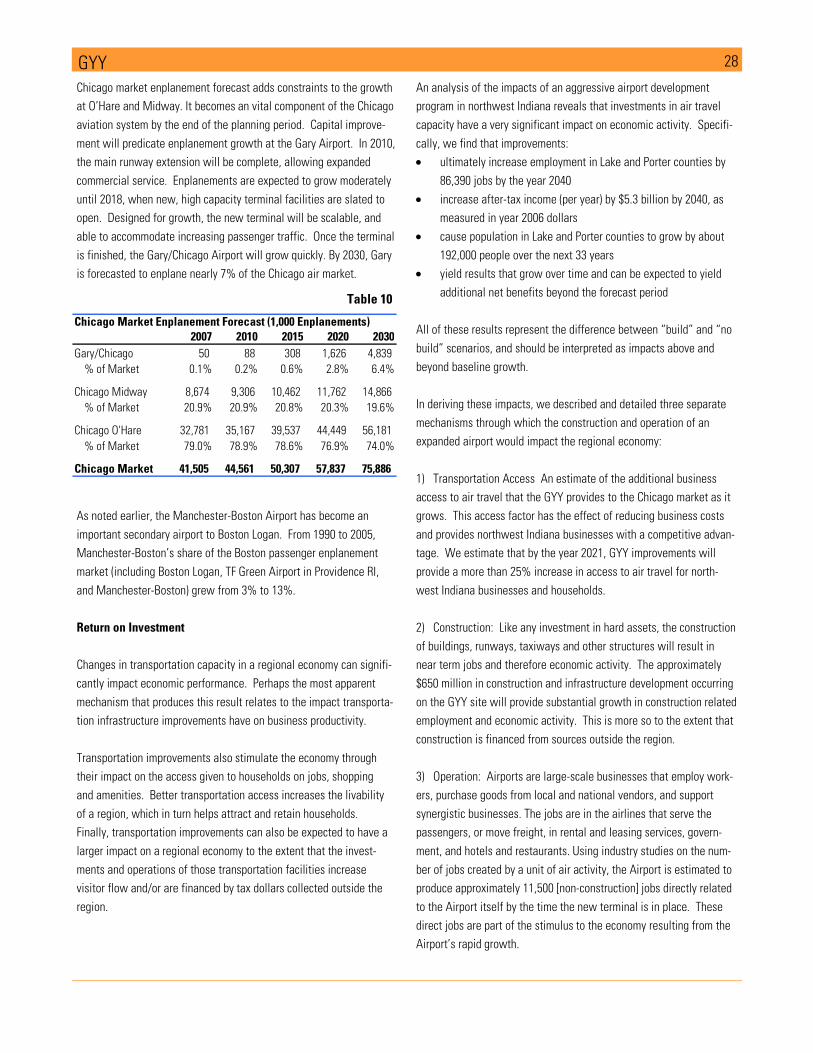
28 GYY
Chicago market enplanement forecast adds constraints to the growth
at O’Hare and Midway. It becomes an vital component of the Chicago
aviation system by the end of the planning period. Capital improve-
ment will predicate enplanement growth at the Gary Airport. In 2010,
the main runway extension will be complete, allowing expanded
commercial service. Enplanements are expected to grow moderately
until 2018, when new, high capacity terminal facilities are slated to
open. Designed for growth, the new terminal will be scalable, and
able to accommodate increasing passenger traffic. Once the terminal
is finished, the Gary/Chicago Airport will grow quickly. By 2030, Gary
is forecasted to enplane nearly 7% of the Chicago air market.
As noted earlier, the Manchester-Boston Airport has become an
important secondary airport to Boston Logan. From 1990 to 2005,
Manchester-Boston’s share of the Boston passenger enplanement
market (including Boston Logan, TF Green Airport in Providence RI,
and Manchester-Boston) grew from 3% to 13%.
Return on Investment
Changes in transportation capacity in a regional economy can signifi-
cantly impact economic performance. Perhaps the most apparent
mechanism that produces this result relates to the impact transporta-
tion infrastructure improvements have on business productivity.
Transportation improvements also stimulate the economy through
their impact on the access given to households on jobs, shopping
and amenities. Better transportation access increases the livability
of a region, which in turn helps attract and retain households.
Finally, transportation improvements can also be expected to have a
larger impact on a regional economy to the extent that the invest-
ments and operations of those transportation facilities increase
visitor flow and/or are financed by tax dollars collected outside the
region.
An analysis of the impacts of an aggressive airport development
program in northwest Indiana reveals that investments in air travel
capacity have a very significant impact on economic activity. Specifi-
cally, we find that improvements:
• ultimately increase employment in Lake and Porter counties by
86,390 jobs by the year 2040
• increase after-tax income (per year) by $5.3 billion by 2040, as
measured in year 2006 dollars
• cause population in Lake and Porter counties to grow by about
192,000 people over the next 33 years
• yield results that grow over time and can be expected to yield
additional net benefits beyond the forecast period
All of these results represent the difference between “build” and “no
build” scenarios, and should be interpreted as impacts above and
beyond baseline growth.
In deriving these impacts, we described and detailed three separate
mechanisms through which the construction and operation of an
expanded airport would impact the regional economy:
1) Transportation Access An estimate of the additional business
access to air travel that the GYY provides to the Chicago market as it
grows. This access factor has the effect of reducing business costs
and provides northwest Indiana businesses with a competitive advan-
tage. We estimate that by the year 2021, GYY improvements will
provide a more than 25% increase in access to air travel for north-
west Indiana businesses and households.
2) Construction: Like any investment in hard assets, the construction
of buildings, runways, taxiways and other structures will result in
near term jobs and therefore economic activity. The approximately
$650 million in construction and infrastructure development occurring
on the GYY site will provide substantial growth in construction related
employment and economic activity. This is more so to the extent that
construction is financed from sources outside the region.
3) Operation: Airports are large-scale businesses that employ work-
ers, purchase goods from local and national vendors, and support
synergistic businesses. The jobs are in the airlines that serve the
passengers, or move freight, in rental and leasing services, govern-
ment, and hotels and restaurants. Using industry studies on the num-
ber of jobs created by a unit of air activity, the Airport is estimated to
produce approximately 11,500 [non-construction] jobs directly related
to the Airport itself by the time the new terminal is in place. These
direct jobs are part of the stimulus to the economy resulting from the
Airport’s rapid growth.
Table 10
Chicago Market Enplanement Forecast (1,000 Enplanements)2007 2010 2015 2020 2030
Gary/Chicago 50 88 308 1,626 4,839
% of Market 0.1% 0.2% 0.6% 2.8% 6.4%
Chicago Midway 8,674 9,306 10,462 11,762 14,866
% of Market 20.9% 20.9% 20.8% 20.3% 19.6%
Chicago O'Hare 32,781 35,167 39,537 44,449 56,181
% of Market 79.0% 78.9% 78.6% 76.9% 74.0%
Chicago Market 41,505 44,561 50,307 57,837 75,886
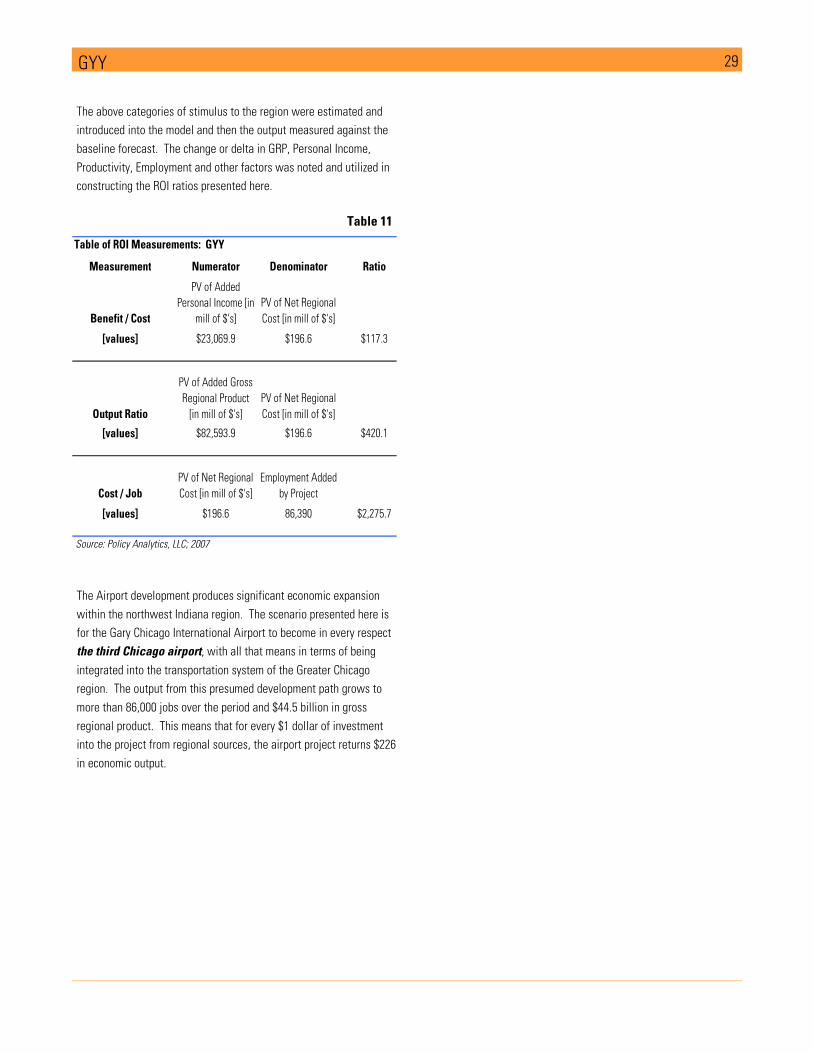
29 GYY
The above categories of stimulus to the region were estimated and
introduced into the model and then the output measured against the
baseline forecast. The change or delta in GRP, Personal Income,
Productivity, Employment and other factors was noted and utilized in
constructing the ROI ratios presented here.
The Airport development produces significant economic expansion
within the northwest Indiana region. The scenario presented here is
for the Gary Chicago International Airport to become in every respect
the third Chicago airport, with all that means in terms of being
integrated into the transportation system of the Greater Chicago
region. The output from this presumed development path grows to
more than 86,000 jobs over the period and $44.5 billion in gross
regional product. This means that for every $1 dollar of investment
into the project from regional sources, the airport project returns $226
in economic output.
Table of ROI Measurements: GYY
Measurement Numerator Denominator Ratio
Benefit / Cost
PV of Added
Personal Income [in
mill of $'s]
PV of Net Regional
Cost [in mill of $'s]
[values] $23,069.9 $196.6 $117.3
Output Ratio
PV of Added Gross
Regional Product
[in mill of $'s]
PV of Net Regional
Cost [in mill of $'s]
[values] $82,593.9 $196.6 $420.1
Cost / Job
PV of Net Regional
Cost [in mill of $'s]
Employment Added
by Project
[values] $196.6 86,390 $2,275.7
Table 11
Source: Policy Analytics, LLC; 2007
30
Northern Indiana Commuter Transportation District NICTD
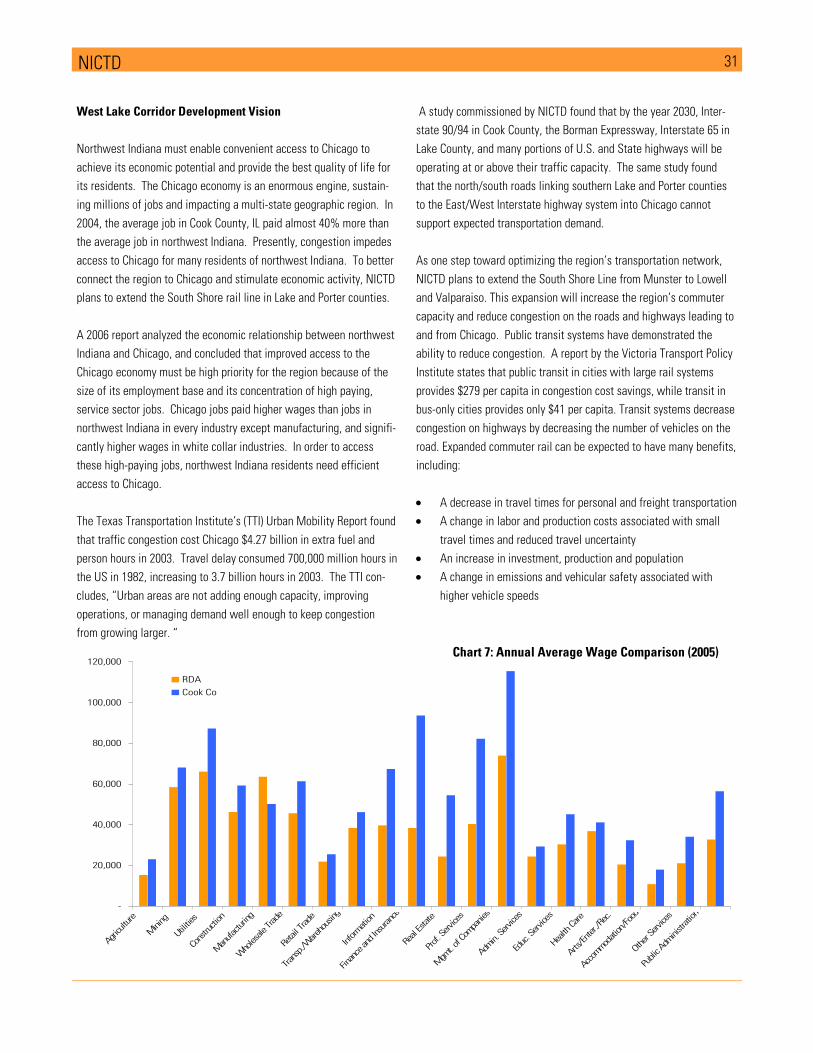
31 NICTD
West Lake Corridor Development Vision
Northwest Indiana must enable convenient access to Chicago to
achieve its economic potential and provide the best quality of life for
its residents. The Chicago economy is an enormous engine, sustain-
ing millions of jobs and impacting a multi-state geographic region. In
2004, the average job in Cook County, IL paid almost 40% more than
the average job in northwest Indiana. Presently, congestion impedes
access to Chicago for many residents of northwest Indiana. To better
connect the region to Chicago and stimulate economic activity, NICTD
plans to extend the South Shore rail line in Lake and Porter counties.
A 2006 report analyzed the economic relationship between northwest
Indiana and Chicago, and concluded that improved access to the
Chicago economy must be high priority for the region because of the
size of its employment base and its concentration of high paying,
service sector jobs. Chicago jobs paid higher wages than jobs in
northwest Indiana in every industry except manufacturing, and signifi-
cantly higher wages in white collar industries. In order to access
these high-paying jobs, northwest Indiana residents need efficient
access to Chicago.
The Texas Transportation Institute’s (TTI) Urban Mobility Report found
that traffic congestion cost Chicago $4.27 billion in extra fuel and
person hours in 2003. Travel delay consumed 700,000 million hours in
the US in 1982, increasing to 3.7 billion hours in 2003. The TTI con-
cludes, “Urban areas are not adding enough capacity, improving
operations, or managing demand well enough to keep congestion
from growing larger. “
A study commissioned by NICTD found that by the year 2030, Inter-
state 90/94 in Cook County, the Borman Expressway, Interstate 65 in
Lake County, and many portions of U.S. and State highways will be
operating at or above their traffic capacity. The same study found
that the north/south roads linking southern Lake and Porter counties
to the East/West Interstate highway system into Chicago cannot
support expected transportation demand.
As one step toward optimizing the region’s transportation network,
NICTD plans to extend the South Shore Line from Munster to Lowell
and Valparaiso. This expansion will increase the region’s commuter
capacity and reduce congestion on the roads and highways leading to
and from Chicago. Public transit systems have demonstrated the
ability to reduce congestion. A report by the Victoria Transport Policy
Institute states that public transit in cities with large rail systems
provides $279 per capita in congestion cost savings, while transit in
bus-only cities provides only $41 per capita. Transit systems decrease
congestion on highways by decreasing the number of vehicles on the
road. Expanded commuter rail can be expected to have many benefits,
including:
• A decrease in travel times for personal and freight transportation
• A change in labor and production costs associated with small
travel times and reduced travel uncertainty
• An increase in investment, production and population
• A change in emissions and vehicular safety associated with
higher vehicle speeds
-
20,000
40,000
60,000
80,000
100,000
120,000
Agriculture
Mining
Utilities
Constru
ction
Manufacturing
Wholesale Trade
Retail Trade
Transp./W
arehousing
Inform
ation
Finance and Insurance
Real Estate
Prof. Services
Mgm
t. of Com
panies
Admin. Services
Educ. Services
Health Care
Arts/Enter./R
ec.
Accommodation/Food
Other S
ervices
Public Ad
ministra
tion
RDA
Cook Co
Chart 7: Annual Average Wage Comparison (2005)
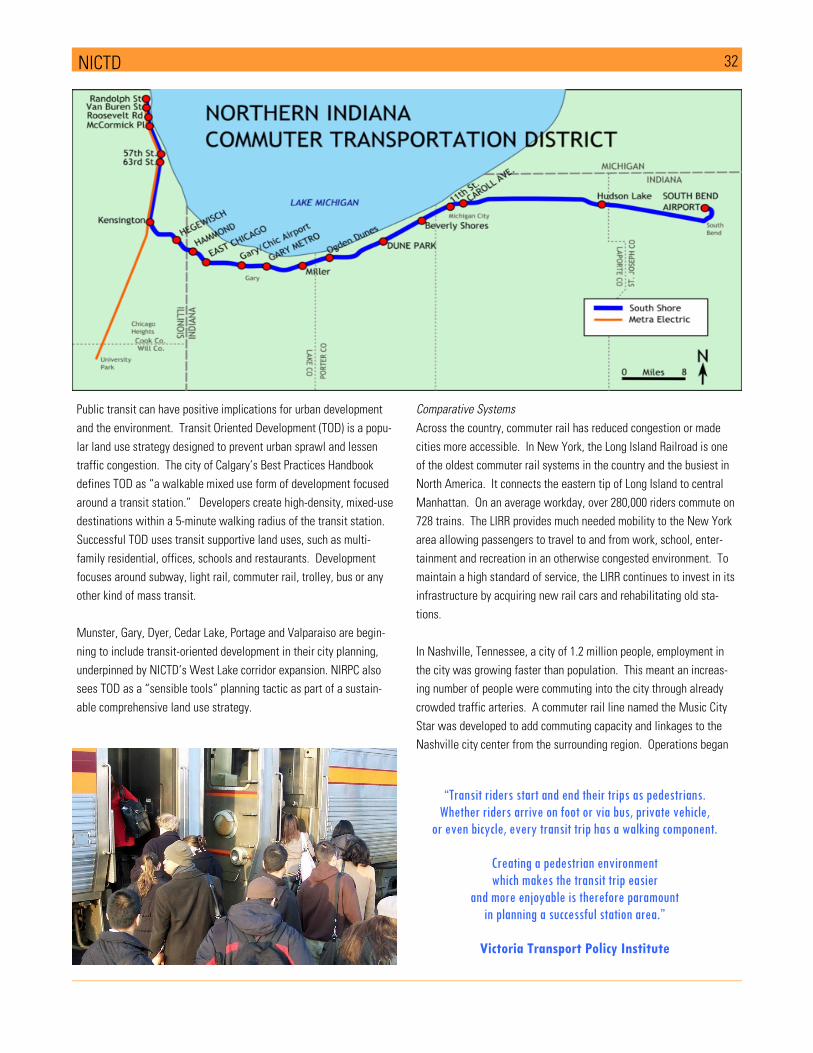
32 NICTD
Public transit can have positive implications for urban development
and the environment. Transit Oriented Development (TOD) is a popu-
lar land use strategy designed to prevent urban sprawl and lessen
traffic congestion. The city of Calgary’s Best Practices Handbook
defines TOD as “a walkable mixed use form of development focused
around a transit station.” Developers create high-density, mixed-use
destinations within a 5-minute walking radius of the transit station.
Successful TOD uses transit supportive land uses, such as multi-
family residential, offices, schools and restaurants. Development
focuses around subway, light rail, commuter rail, trolley, bus or any
other kind of mass transit.
Munster, Gary, Dyer, Cedar Lake, Portage and Valparaiso are begin-
ning to include transit-oriented development in their city planning,
underpinned by NICTD’s West Lake corridor expansion. NIRPC also
sees TOD as a “sensible tools” planning tactic as part of a sustain-
able comprehensive land use strategy.
Comparative Systems
Across the country, commuter rail has reduced congestion or made
cities more accessible. In New York, the Long Island Railroad is one
of the oldest commuter rail systems in the country and the busiest in
North America. It connects the eastern tip of Long Island to central
Manhattan. On an average workday, over 280,000 riders commute on
728 trains. The LIRR provides much needed mobility to the New York
area allowing passengers to travel to and from work, school, enter-
tainment and recreation in an otherwise congested environment. To
maintain a high standard of service, the LIRR continues to invest in its
infrastructure by acquiring new rail cars and rehabilitating old sta-
tions.
In Nashville, Tennessee, a city of 1.2 million people, employment in
the city was growing faster than population. This meant an increas-
ing number of people were commuting into the city through already
crowded traffic arteries. A commuter rail line named the Music City
Star was developed to add commuting capacity and linkages to the
Nashville city center from the surrounding region. Operations began
“Transit riders start and end their trips as pedestrians. Whether riders arrive on foot or via bus, private vehicle,
or even bicycle, every transit trip has a walking component.
Creating a pedestrian environment which makes the transit trip easier
and more enjoyable is therefore paramount in planning a successful station area.”
Victoria Transport Policy Institute
National Commuter Rail Trends
In 2004, 21 commuter rail agencies provided over 414 million passen-
ger trips in the US, a 20% increase from 1995. Nationwide, commut-
ers traveled over 9.7 billion miles in 2004.
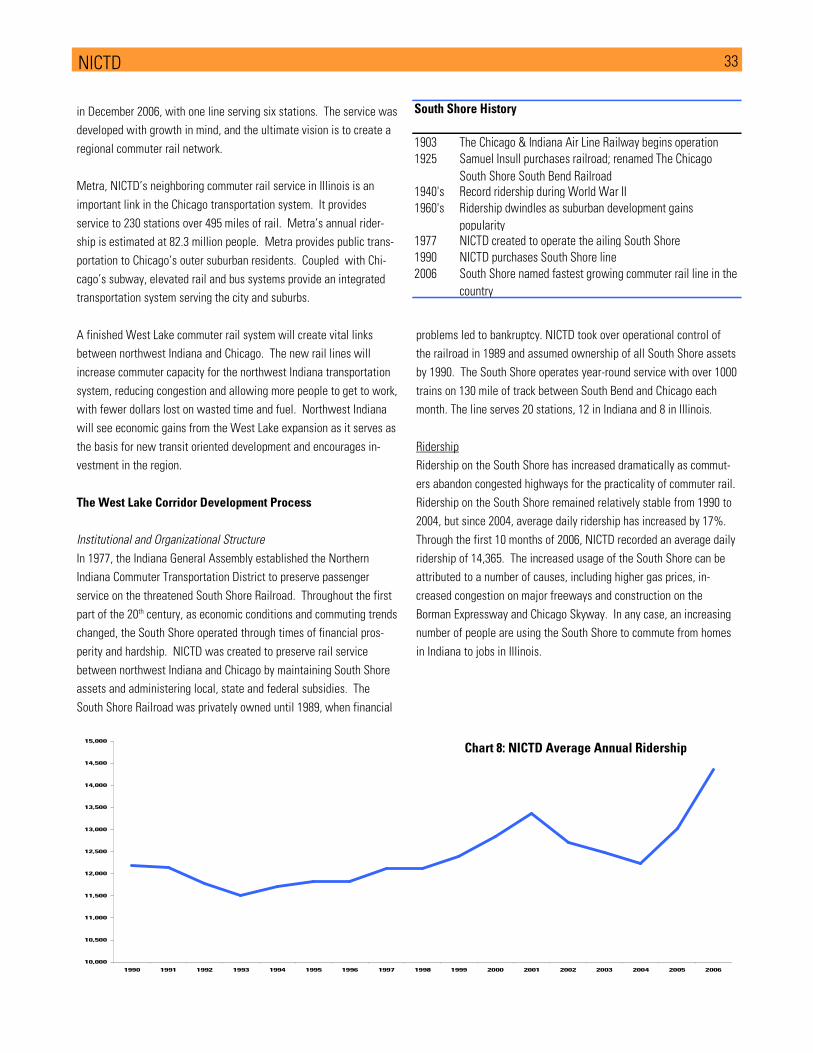
33 NICTD
in December 2006, with one line serving six stations. The service was
developed with growth in mind, and the ultimate vision is to create a
regional commuter rail network.
Metra, NICTD’s neighboring commuter rail service in Illinois is an
important link in the Chicago transportation system. It provides
service to 230 stations over 495 miles of rail. Metra’s annual rider-
ship is estimated at 82.3 million people. Metra provides public trans-
portation to Chicago’s outer suburban residents. Coupled with Chi-
cago’s subway, elevated rail and bus systems provide an integrated
transportation system serving the city and suburbs.
A finished West Lake commuter rail system will create vital links
between northwest Indiana and Chicago. The new rail lines will
increase commuter capacity for the northwest Indiana transportation
system, reducing congestion and allowing more people to get to work,
with fewer dollars lost on wasted time and fuel. Northwest Indiana
will see economic gains from the West Lake expansion as it serves as
the basis for new transit oriented development and encourages in-
vestment in the region.
The West Lake Corridor Development Process
Institutional and Organizational Structure
In 1977, the Indiana General Assembly established the Northern
Indiana Commuter Transportation District to preserve passenger
service on the threatened South Shore Railroad. Throughout the first
part of the 20th century, as economic conditions and commuting trends
changed, the South Shore operated through times of financial pros-
perity and hardship. NICTD was created to preserve rail service
between northwest Indiana and Chicago by maintaining South Shore
assets and administering local, state and federal subsidies. The
South Shore Railroad was privately owned until 1989, when financial
problems led to bankruptcy. NICTD took over operational control of
the railroad in 1989 and assumed ownership of all South Shore assets
by 1990. The South Shore operates year-round service with over 1000
trains on 130 mile of track between South Bend and Chicago each
month. The line serves 20 stations, 12 in Indiana and 8 in Illinois.
Ridership
Ridership on the South Shore has increased dramatically as commut-
ers abandon congested highways for the practicality of commuter rail.
Ridership on the South Shore remained relatively stable from 1990 to
2004, but since 2004, average daily ridership has increased by 17%.
Through the first 10 months of 2006, NICTD recorded an average daily
ridership of 14,365. The increased usage of the South Shore can be
attributed to a number of causes, including higher gas prices, in-
creased congestion on major freeways and construction on the
Borman Expressway and Chicago Skyway. In any case, an increasing
number of people are using the South Shore to commute from homes
in Indiana to jobs in Illinois.
10,000
10,500
11,000
11,500
12,000
12,500
13,000
13,500
14,000
14,500
15,000
1990 1991 1992 1993 1994 1995 1996 1997 1998 1999 2000 2001 2002 2003 2004 2005 2006
NICTD_Ann_Avg_Ridership
South Shore History
1903 The Chicago & Indiana Air Line Railway begins operation
1925 Samuel Insull purchases railroad; renamed The Chicago
South Shore South Bend Railroad1940's Record ridership during World War II
1960's Ridership dwindles as suburban development gains
popularity1977 NICTD created to operate the ailing South Shore
1990 NICTD purchases South Shore line
2006 South Shore named fastest growing commuter rail line in the
country
Chart 8: NICTD Average Annual Ridership
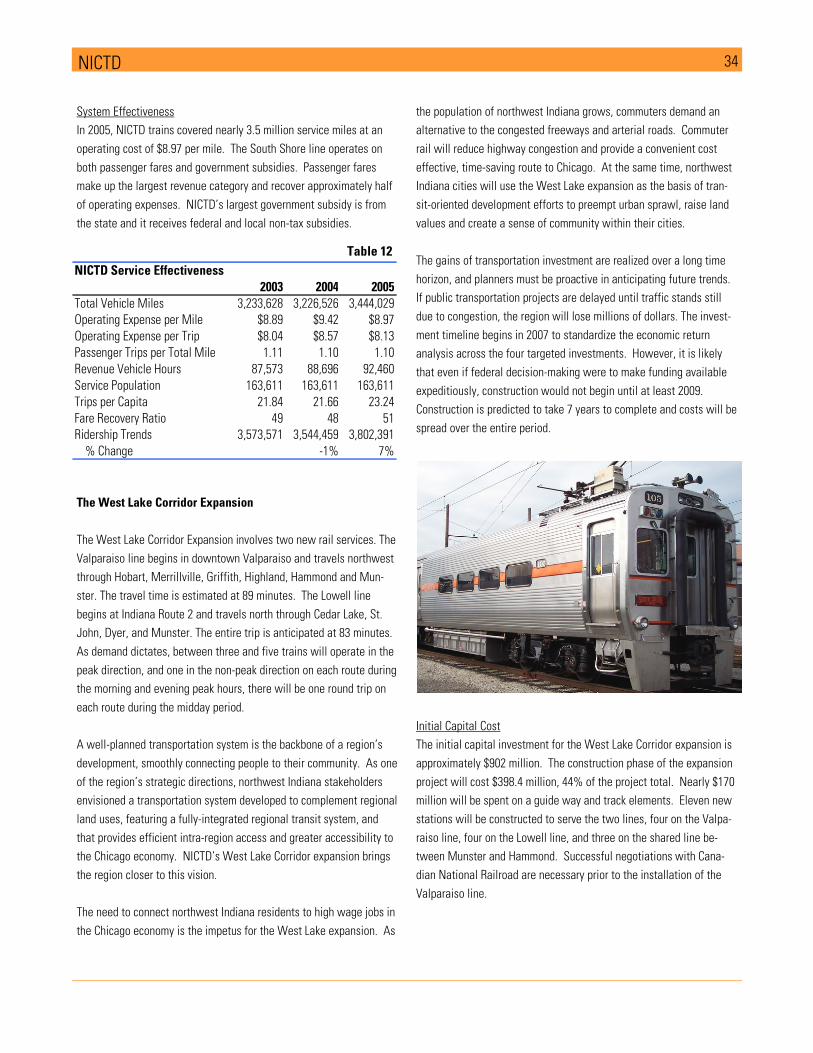
34 NICTD
System Effectiveness
In 2005, NICTD trains covered nearly 3.5 million service miles at an
operating cost of $8.97 per mile. The South Shore line operates on
both passenger fares and government subsidies. Passenger fares
make up the largest revenue category and recover approximately half
of operating expenses. NICTD’s largest government subsidy is from
the state and it receives federal and local non-tax subsidies.
The West Lake Corridor Expansion
The West Lake Corridor Expansion involves two new rail services. The
Valparaiso line begins in downtown Valparaiso and travels northwest
through Hobart, Merrillville, Griffith, Highland, Hammond and Mun-
ster. The travel time is estimated at 89 minutes. The Lowell line
begins at Indiana Route 2 and travels north through Cedar Lake, St.
John, Dyer, and Munster. The entire trip is anticipated at 83 minutes.
As demand dictates, between three and five trains will operate in the
peak direction, and one in the non-peak direction on each route during
the morning and evening peak hours, there will be one round trip on
each route during the midday period.
A well-planned transportation system is the backbone of a region’s
development, smoothly connecting people to their community. As one
of the region’s strategic directions, northwest Indiana stakeholders
envisioned a transportation system developed to complement regional
land uses, featuring a fully-integrated regional transit system, and
that provides efficient intra-region access and greater accessibility to
the Chicago economy. NICTD’s West Lake Corridor expansion brings
the region closer to this vision.
The need to connect northwest Indiana residents to high wage jobs in
the Chicago economy is the impetus for the West Lake expansion. As
the population of northwest Indiana grows, commuters demand an
alternative to the congested freeways and arterial roads. Commuter
rail will reduce highway congestion and provide a convenient cost
effective, time-saving route to Chicago. At the same time, northwest
Indiana cities will use the West Lake expansion as the basis of tran-
sit-oriented development efforts to preempt urban sprawl, raise land
values and create a sense of community within their cities.
The gains of transportation investment are realized over a long time
horizon, and planners must be proactive in anticipating future trends.
If public transportation projects are delayed until traffic stands still
due to congestion, the region will lose millions of dollars. The invest-
ment timeline begins in 2007 to standardize the economic return
analysis across the four targeted investments. However, it is likely
that even if federal decision-making were to make funding available
expeditiously, construction would not begin until at least 2009.
Construction is predicted to take 7 years to complete and costs will be
spread over the entire period.
Initial Capital Cost
The initial capital investment for the West Lake Corridor expansion is
approximately $902 million. The construction phase of the expansion
project will cost $398.4 million, 44% of the project total. Nearly $170
million will be spent on a guide way and track elements. Eleven new
stations will be constructed to serve the two lines, four on the Valpa-
raiso line, four on the Lowell line, and three on the shared line be-
tween Munster and Hammond. Successful negotiations with Cana-
dian National Railroad are necessary prior to the installation of the
Valparaiso line.
NICTD Service Effectiveness2003 2004 2005
Total Vehicle Miles 3,233,628 3,226,526 3,444,029
Operating Expense per Mile $8.89 $9.42 $8.97
Operating Expense per Trip $8.04 $8.57 $8.13
Passenger Trips per Total Mile 1.11 1.10 1.10
Revenue Vehicle Hours 87,573 88,696 92,460
Service Population 163,611 163,611 163,611
Trips per Capita 21.84 21.66 23.24
Fare Recovery Ratio 49 48 51
Ridership Trends 3,573,571 3,544,459 3,802,391
% Change -1% 7%
Table 12
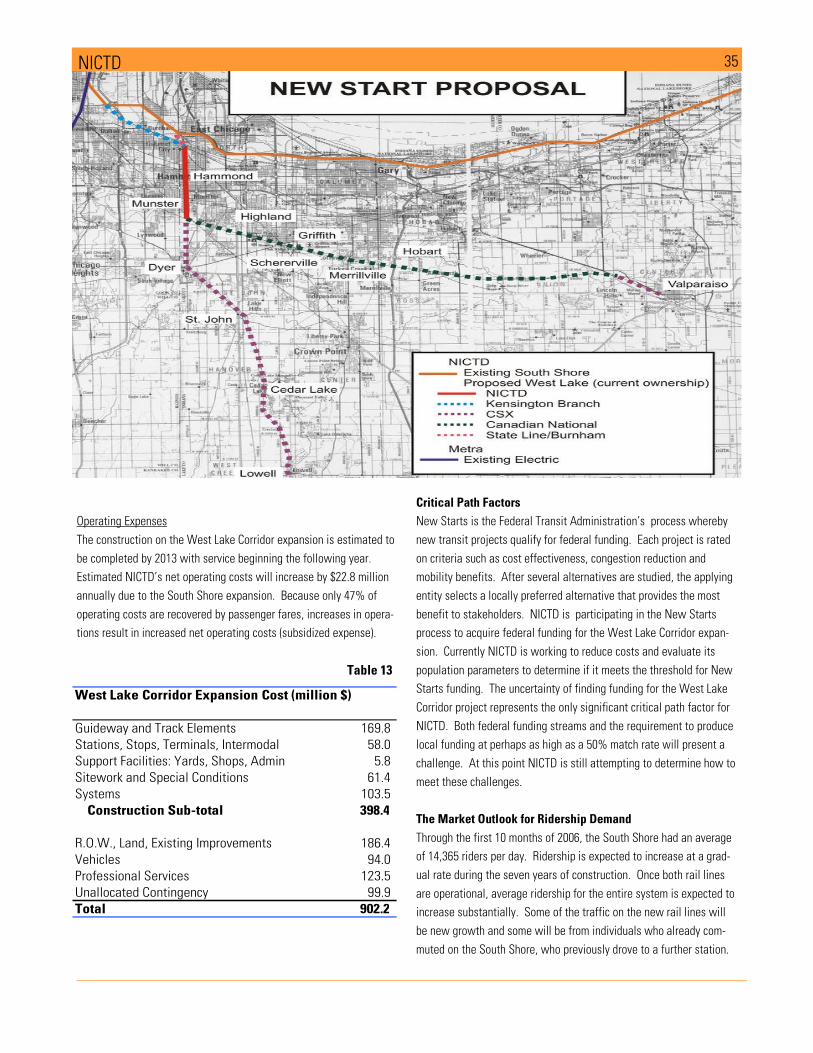
35 NICTD
Operating Expenses
The construction on the West Lake Corridor expansion is estimated to
be completed by 2013 with service beginning the following year.
Estimated NICTD’s net operating costs will increase by $22.8 million
annually due to the South Shore expansion. Because only 47% of
operating costs are recovered by passenger fares, increases in opera-
tions result in increased net operating costs (subsidized expense).
Critical Path Factors New Starts is the Federal Transit Administration’s process whereby
new transit projects qualify for federal funding. Each project is rated
on criteria such as cost effectiveness, congestion reduction and
mobility benefits. After several alternatives are studied, the applying
entity selects a locally preferred alternative that provides the most
benefit to stakeholders. NICTD is participating in the New Starts
process to acquire federal funding for the West Lake Corridor expan-
sion. Currently NICTD is working to reduce costs and evaluate its
population parameters to determine if it meets the threshold for New
Starts funding. The uncertainty of finding funding for the West Lake
Corridor project represents the only significant critical path factor for
NICTD. Both federal funding streams and the requirement to produce
local funding at perhaps as high as a 50% match rate will present a
challenge. At this point NICTD is still attempting to determine how to
meet these challenges.
The Market Outlook for Ridership Demand
Through the first 10 months of 2006, the South Shore had an average
of 14,365 riders per day. Ridership is expected to increase at a grad-
ual rate during the seven years of construction. Once both rail lines
are operational, average ridership for the entire system is expected to
increase substantially. Some of the traffic on the new rail lines will
be new growth and some will be from individuals who already com-
muted on the South Shore, who previously drove to a further station.
Table 13
Guideway and Track Elements 169.8
Stations, Stops, Terminals, Intermodal 58.0
Support Facilities: Yards, Shops, Admin 5.8
Sitework and Special Conditions 61.4
Systems 103.5
Construction Sub-total 398.4
R.O.W., Land, Existing Improvements 186.4
Vehicles 94.0
Professional Services 123.5
Unallocated Contingency 99.9
Total 902.2
West Lake Corridor Expansion Cost (million $)
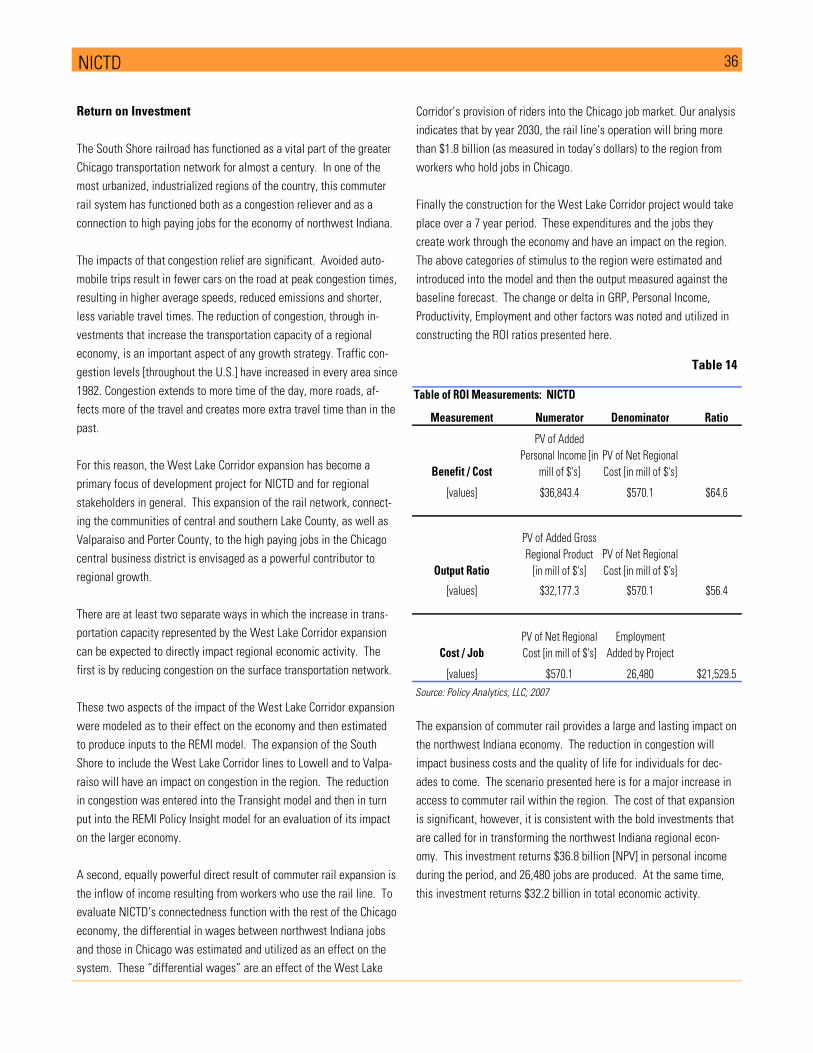
36 NICTD
Return on Investment
The South Shore railroad has functioned as a vital part of the greater
Chicago transportation network for almost a century. In one of the
most urbanized, industrialized regions of the country, this commuter
rail system has functioned both as a congestion reliever and as a
connection to high paying jobs for the economy of northwest Indiana.
The impacts of that congestion relief are significant. Avoided auto-
mobile trips result in fewer cars on the road at peak congestion times,
resulting in higher average speeds, reduced emissions and shorter,
less variable travel times. The reduction of congestion, through in-
vestments that increase the transportation capacity of a regional
economy, is an important aspect of any growth strategy. Traffic con-
gestion levels [throughout the U.S.] have increased in every area since
1982. Congestion extends to more time of the day, more roads, af-
fects more of the travel and creates more extra travel time than in the
past.
For this reason, the West Lake Corridor expansion has become a
primary focus of development project for NICTD and for regional
stakeholders in general. This expansion of the rail network, connect-
ing the communities of central and southern Lake County, as well as
Valparaiso and Porter County, to the high paying jobs in the Chicago
central business district is envisaged as a powerful contributor to
regional growth.
There are at least two separate ways in which the increase in trans-
portation capacity represented by the West Lake Corridor expansion
can be expected to directly impact regional economic activity. The
first is by reducing congestion on the surface transportation network.
These two aspects of the impact of the West Lake Corridor expansion
were modeled as to their effect on the economy and then estimated
to produce inputs to the REMI model. The expansion of the South
Shore to include the West Lake Corridor lines to Lowell and to Valpa-
raiso will have an impact on congestion in the region. The reduction
in congestion was entered into the Transight model and then in turn
put into the REMI Policy Insight model for an evaluation of its impact
on the larger economy.
A second, equally powerful direct result of commuter rail expansion is
the inflow of income resulting from workers who use the rail line. To
evaluate NICTD’s connectedness function with the rest of the Chicago
economy, the differential in wages between northwest Indiana jobs
and those in Chicago was estimated and utilized as an effect on the
system. These “differential wages” are an effect of the West Lake
Corridor’s provision of riders into the Chicago job market. Our analysis
indicates that by year 2030, the rail line’s operation will bring more
than $1.8 billion (as measured in today’s dollars) to the region from
workers who hold jobs in Chicago.
Finally the construction for the West Lake Corridor project would take
place over a 7 year period. These expenditures and the jobs they
create work through the economy and have an impact on the region.
The above categories of stimulus to the region were estimated and
introduced into the model and then the output measured against the
baseline forecast. The change or delta in GRP, Personal Income,
Productivity, Employment and other factors was noted and utilized in
constructing the ROI ratios presented here.
The expansion of commuter rail provides a large and lasting impact on
the northwest Indiana economy. The reduction in congestion will
impact business costs and the quality of life for individuals for dec-
ades to come. The scenario presented here is for a major increase in
access to commuter rail within the region. The cost of that expansion
is significant, however, it is consistent with the bold investments that
are called for in transforming the northwest Indiana regional econ-
omy. This investment returns $36.8 billion [NPV] in personal income
during the period, and 26,480 jobs are produced. At the same time,
this investment returns $32.2 billion in total economic activity.
Table of ROI Measurements: NICTD
Measurement Numerator Denominator Ratio
Benefit / Cost
PV of Added
Personal Income [in
mill of $'s]
PV of Net Regional
Cost [in mill of $'s]
[values] $36,843.4 $570.1 $64.6
Output Ratio
PV of Added Gross
Regional Product
[in mill of $'s]
PV of Net Regional
Cost [in mill of $'s]
[values] $32,177.3 $570.1 $56.4
Cost / Job
PV of Net Regional
Cost [in mill of $'s]
Employment
Added by Project
[values] $570.1 26,480 $21,529.5
Table 14
Source: Policy Analytics, LLC; 2007
37
Regional Bus Authority RBA
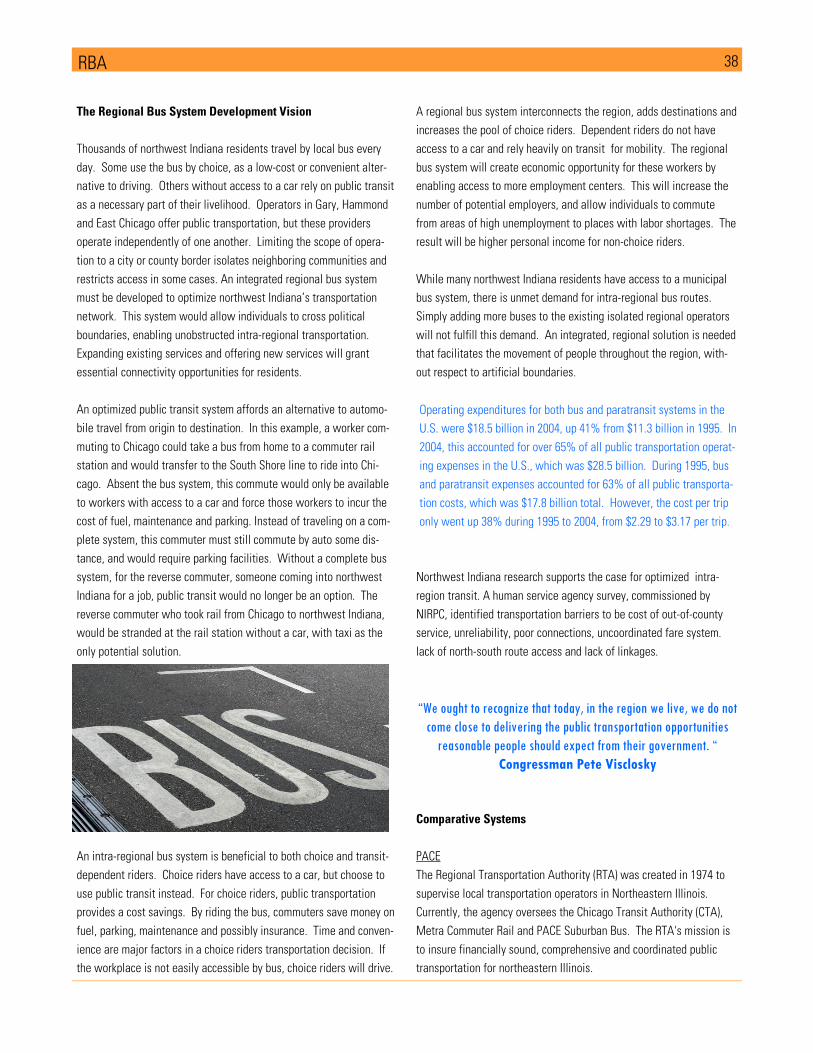
38 RBA
The Regional Bus System Development Vision
Thousands of northwest Indiana residents travel by local bus every
day. Some use the bus by choice, as a low-cost or convenient alter-
native to driving. Others without access to a car rely on public transit
as a necessary part of their livelihood. Operators in Gary, Hammond
and East Chicago offer public transportation, but these providers
operate independently of one another. Limiting the scope of opera-
tion to a city or county border isolates neighboring communities and
restricts access in some cases. An integrated regional bus system
must be developed to optimize northwest Indiana’s transportation
network. This system would allow individuals to cross political
boundaries, enabling unobstructed intra-regional transportation.
Expanding existing services and offering new services will grant
essential connectivity opportunities for residents.
An optimized public transit system affords an alternative to automo-
bile travel from origin to destination. In this example, a worker com-
muting to Chicago could take a bus from home to a commuter rail
station and would transfer to the South Shore line to ride into Chi-
cago. Absent the bus system, this commute would only be available
to workers with access to a car and force those workers to incur the
cost of fuel, maintenance and parking. Instead of traveling on a com-
plete system, this commuter must still commute by auto some dis-
tance, and would require parking facilities. Without a complete bus
system, for the reverse commuter, someone coming into northwest
Indiana for a job, public transit would no longer be an option. The
reverse commuter who took rail from Chicago to northwest Indiana,
would be stranded at the rail station without a car, with taxi as the
only potential solution.
An intra-regional bus system is beneficial to both choice and transit-
dependent riders. Choice riders have access to a car, but choose to
use public transit instead. For choice riders, public transportation
provides a cost savings. By riding the bus, commuters save money on
fuel, parking, maintenance and possibly insurance. Time and conven-
ience are major factors in a choice riders transportation decision. If
the workplace is not easily accessible by bus, choice riders will drive.
A regional bus system interconnects the region, adds destinations and
increases the pool of choice riders. Dependent riders do not have
access to a car and rely heavily on transit for mobility. The regional
bus system will create economic opportunity for these workers by
enabling access to more employment centers. This will increase the
number of potential employers, and allow individuals to commute
from areas of high unemployment to places with labor shortages. The
result will be higher personal income for non-choice riders.
While many northwest Indiana residents have access to a municipal
bus system, there is unmet demand for intra-regional bus routes.
Simply adding more buses to the existing isolated regional operators
will not fulfill this demand. An integrated, regional solution is needed
that facilitates the movement of people throughout the region, with-
out respect to artificial boundaries.
Northwest Indiana research supports the case for optimized intra-
region transit. A human service agency survey, commissioned by
NIRPC, identified transportation barriers to be cost of out-of-county
service, unreliability, poor connections, uncoordinated fare system.
lack of north-south route access and lack of linkages.
Comparative Systems
PACE
The Regional Transportation Authority (RTA) was created in 1974 to
supervise local transportation operators in Northeastern Illinois.
Currently, the agency oversees the Chicago Transit Authority (CTA),
Metra Commuter Rail and PACE Suburban Bus. The RTA's mission is
to insure financially sound, comprehensive and coordinated public
transportation for northeastern Illinois.
Operating expenditures for both bus and paratransit systems in the
U.S. were $18.5 billion in 2004, up 41% from $11.3 billion in 1995. In
2004, this accounted for over 65% of all public transportation operat-
ing expenses in the U.S., which was $28.5 billion. During 1995, bus
and paratransit expenses accounted for 63% of all public transporta-
tion costs, which was $17.8 billion total. However, the cost per trip
only went up 38% during 1995 to 2004, from $2.29 to $3.17 per trip.
“We ought to recognize that today, in the region we live, we do not come close to delivering the public transportation opportunities reasonable people should expect from their government. “
Congressman Pete Visclosky

39 RBA
PACE is the bus operator for Chicago’s outer suburbs. It serves over
210 communities and has a service area population of more than 5.2
million. Pace also administers the Vanpool Incentive Program, the
second largest vanpool program in the United States. In the program,
a vanpool participant drives a multi-passenger van that is owned,
insured and maintained by Pace. P ACE is part of a regional, multi-
modal public transit system, connecting with Chicago’s metro bus,
subway and elevated rail system to provide integrated access from
Chicago’s outer suburbs to its urban core. It provides valuable access
and congestion relief for suburban commuters.
Case Study
The Regional Public Transportation Authority (RPTA), otherwise
known as Valley Metro is the provider responsible for public transit in
the region of Phoenix and Maricopa County, Arizona. Even though
Valley Metro has this responsibility, they do not actually operate the
majority of transit services in the region. They are regarded as a
membership organization, where most services are separately oper-
ated and funded by the numerous individual municipalities in the
greater Phoenix region. These cities agree to participate with Valley
Metro by creating a brand name so services can be streamlined and
confusion among riders reduced.
From the headquarters in downtown Phoenix, RPTA manages a cus-
tomer service, marketing and long-term transit planning operation,
which is collectively shared among all Valley Metro member cities.
Each member city has a representative on the RPTA board of directors
that is appointed by its mayor or board of supervisors.
Numerous independent service providers offer bus transit every day
through Valley Metro. Although these systems are independently
owned and operated they all, possess the same Valley Metro logo
scheme. By doing this, Valley Metro is able to create the awareness
and understanding that all bus systems providing services in the
region are unified, which can also create the perception that all ser-
vice providers are the same organization.
Although each municipality is currently independently owned and
operated, each with its own staff and source of funding, Valley Metro
has a vision to consolidate each system into one seamless regional
agency. Some consolidation has already occurred, with the merging
of Mesa’s municipal bus system and the Dial-a-Ride system with
Valley Metro. However, there are areas of concern, such as service
levels being maintained, protection of funds and each local agency
convincing their customers that they will receive the same care and
attention as they did before.
From 2003 to 2004, Valley Metro’s fixed route bus fleet of 694 pro-
vided 51.8 million rides to its 3.2 million-service area population on 83
routes with a farebox collection rate of 23%.
Existing Operators
The current public bus system includes three autonomous municipal
services in the cities of Gary, East Chicago and Hammond and with
five demand-response providers. These transit systems offer both
fixed route and demand response services. A fixed route provides
service along a prescribed route on a scheduled basis. Large buses,
capable of transporting 25 or more people serve these routes. The
Gary Public Transportation Corporation (GPTC), East Chicago Transit
(ECT) and the Hammond Transit System (HTS) are fixed route service
providers that provide demand response services only on a limited
basis.
A demand response service operates on a door-to-door basis, requir-
ing an advance reservation. These vehicles do not follow a fixed
route, but travel throughout the community transporting passengers
according to their specific requests. Service is provided
Table 15
Existing Bus Service Effectiveness
2003 2004 2005
Total Vehicle Miles 3,378,676 3,278,806 3,362,406
Operating Expense per Mile $3.58 $4.27 $4.16
Operating Expense per Trip $5.46 $5.73 $5.72
Passenger Trips per Total Mile 0.65 0.74 0.73
Service Area Population 631,362 631,362 631,362
Dollars per Capita $19.14 $22.18 $22.14
Trips per Capita 3.5 3.9 3.9
Fare Recovery Ratio 18% 18% 17%
INDOT 2003-2005 Annual Reports, Regional Bus Authority, 2030 Connections
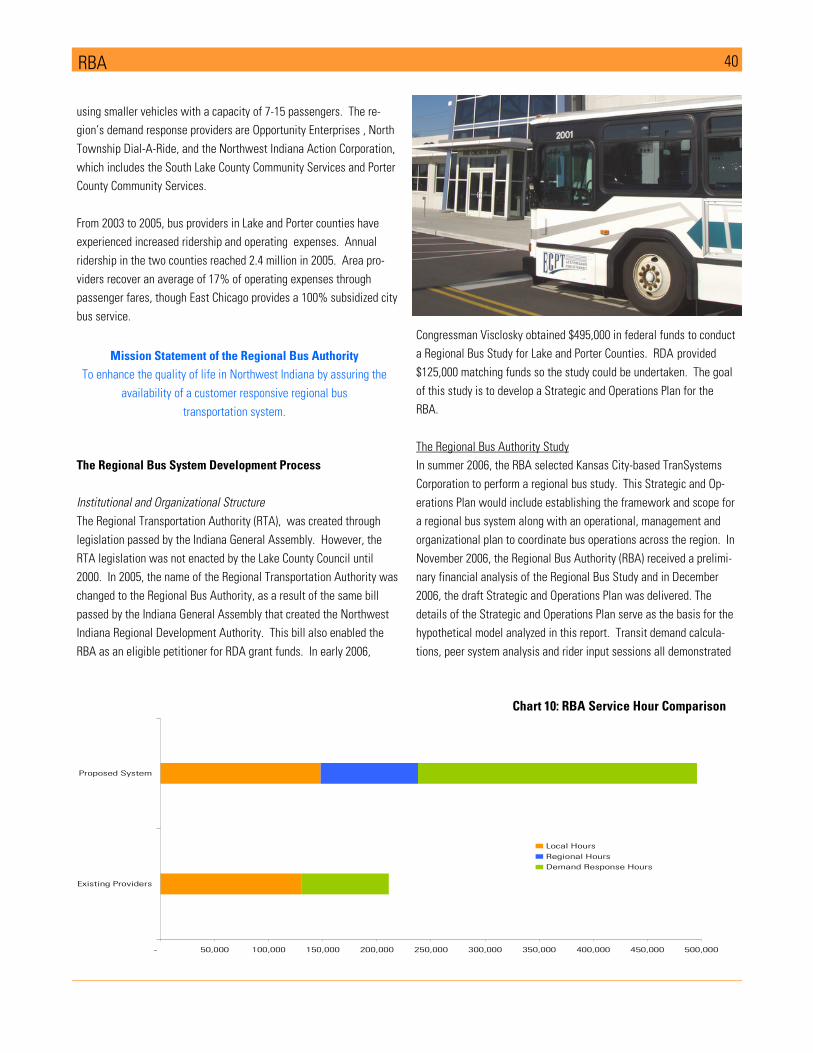
40 RBA
using smaller vehicles with a capacity of 7-15 passengers. The re-
gion’s demand response providers are Opportunity Enterprises , North
Township Dial-A-Ride, and the Northwest Indiana Action Corporation,
which includes the South Lake County Community Services and Porter
County Community Services.
From 2003 to 2005, bus providers in Lake and Porter counties have
experienced increased ridership and operating expenses. Annual
ridership in the two counties reached 2.4 million in 2005. Area pro-
viders recover an average of 17% of operating expenses through
passenger fares, though East Chicago provides a 100% subsidized city
bus service.
The Regional Bus System Development Process
Institutional and Organizational Structure
The Regional Transportation Authority (RTA), was created through
legislation passed by the Indiana General Assembly. However, the
RTA legislation was not enacted by the Lake County Council until
2000. In 2005, the name of the Regional Transportation Authority was
changed to the Regional Bus Authority, as a result of the same bill
passed by the Indiana General Assembly that created the Northwest
Indiana Regional Development Authority. This bill also enabled the
RBA as an eligible petitioner for RDA grant funds. In early 2006,
Congressman Visclosky obtained $495,000 in federal funds to conduct
a Regional Bus Study for Lake and Porter Counties. RDA provided
$125,000 matching funds so the study could be undertaken. The goal
of this study is to develop a Strategic and Operations Plan for the
RBA.
The Regional Bus Authority Study
In summer 2006, the RBA selected Kansas City-based TranSystems
Corporation to perform a regional bus study. This Strategic and Op-
erations Plan would include establishing the framework and scope for
a regional bus system along with an operational, management and
organizational plan to coordinate bus operations across the region. In
November 2006, the Regional Bus Authority (RBA) received a prelimi-
nary financial analysis of the Regional Bus Study and in December
2006, the draft Strategic and Operations Plan was delivered. The
details of the Strategic and Operations Plan serve as the basis for the
hypothetical model analyzed in this report. Transit demand calcula-
tions, peer system analysis and rider input sessions all demonstrated
- 50,000 100,000 150,000 200,000 250,000 300,000 350,000 400,000 450,000 500,000
Existing Providers
Proposed System
Local Hours
Regional Hours
Demand Response Hours
Mission Statement of the Regional Bus Authority
To enhance the quality of life in Northwest Indiana by assuring the
availability of a customer responsive regional bus
transportation system.
Chart 10: RBA Service Hour Comparison
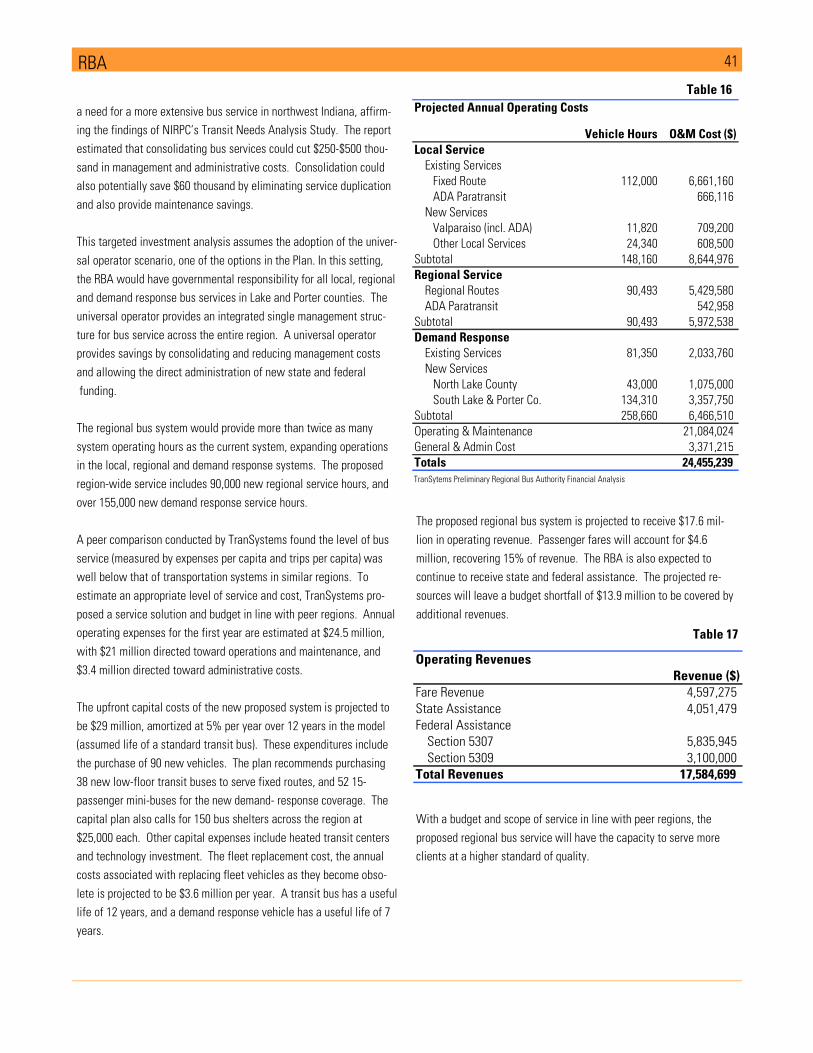
41 RBA
a need for a more extensive bus service in northwest Indiana, affirm-
ing the findings of NIRPC’s Transit Needs Analysis Study. The report
estimated that consolidating bus services could cut $250-$500 thou-
sand in management and administrative costs. Consolidation could
also potentially save $60 thousand by eliminating service duplication
and also provide maintenance savings.
This targeted investment analysis assumes the adoption of the univer-
sal operator scenario, one of the options in the Plan. In this setting,
the RBA would have governmental responsibility for all local, regional
and demand response bus services in Lake and Porter counties. The
universal operator provides an integrated single management struc-
ture for bus service across the entire region. A universal operator
provides savings by consolidating and reducing management costs
and allowing the direct administration of new state and federal
funding.
The regional bus system would provide more than twice as many
system operating hours as the current system, expanding operations
in the local, regional and demand response systems. The proposed
region-wide service includes 90,000 new regional service hours, and
over 155,000 new demand response service hours.
A peer comparison conducted by TranSystems found the level of bus
service (measured by expenses per capita and trips per capita) was
well below that of transportation systems in similar regions. To
estimate an appropriate level of service and cost, TranSystems pro-
posed a service solution and budget in line with peer regions. Annual
operating expenses for the first year are estimated at $24.5 million,
with $21 million directed toward operations and maintenance, and
$3.4 million directed toward administrative costs.
The upfront capital costs of the new proposed system is projected to
be $29 million, amortized at 5% per year over 12 years in the model
(assumed life of a standard transit bus). These expenditures include
the purchase of 90 new vehicles. The plan recommends purchasing
38 new low-floor transit buses to serve fixed routes, and 52 15-
passenger mini-buses for the new demand- response coverage. The
capital plan also calls for 150 bus shelters across the region at
$25,000 each. Other capital expenses include heated transit centers
and technology investment. The fleet replacement cost, the annual
costs associated with replacing fleet vehicles as they become obso-
lete is projected to be $3.6 million per year. A transit bus has a useful
life of 12 years, and a demand response vehicle has a useful life of 7
years.
The proposed regional bus system is projected to receive $17.6 mil-
lion in operating revenue. Passenger fares will account for $4.6
million, recovering 15% of revenue. The RBA is also expected to
continue to receive state and federal assistance. The projected re-
sources will leave a budget shortfall of $13.9 million to be covered by
additional revenues.
With a budget and scope of service in line with peer regions, the
proposed regional bus service will have the capacity to serve more
clients at a higher standard of quality.
Projected Annual Operating Costs
Vehicle Hours O&M Cost ($)Local Service
Existing Services
Fixed Route 112,000 6,661,160
ADA Paratransit 666,116
New Services
Valparaiso (incl. ADA) 11,820 709,200
Other Local Services 24,340 608,500
Subtotal 148,160 8,644,976
Regional Service
Regional Routes 90,493 5,429,580
ADA Paratransit 542,958
Subtotal 90,493 5,972,538
Demand Response
Existing Services 81,350 2,033,760
New Services
North Lake County 43,000 1,075,000
South Lake & Porter Co. 134,310 3,357,750
Subtotal 258,660 6,466,510
Operating & Maintenance 21,084,024
General & Admin Cost 3,371,215
Totals 24,455,239 TranSytems Preliminary Regional Bus Authority Financial Analysis
Table 16
Table 17
Operating RevenuesRevenue ($)
Fare Revenue 4,597,275
State Assistance 4,051,479
Federal Assistance
Section 5307 5,835,945
Section 5309 3,100,000
Total Revenues 17,584,699

42 RBA
The Market Outlook for Passenger Demand
Cost and passenger trips per capita are the two metrics used to deter-
mine the level of service for the proposed regional bus system. In the
first year of operation, TranSystem estimates ridership of 7.66 trips
per capita. Once the integrated regional system is in place, ridership
is expected to increase. NIRPC’s Regional Transit Needs Analysis,
Connections 2030 Regional Transportation Plan and surveys from
regional non-profits show that lack of routes, inconvenient times and
unreliable service all prevent people from taking public transit. The
regional bus system is designed to eliminate or minimize these barri-
ers, attracting more riders. The model for the following return on
investment analysis assumes that bus per capita trip ridership will
grow to meet the TranSystem’s peer region average by 2011.
Return on Investment
Public Transit throughout the U.S. provides a vital service to urban and
elderly individuals who are unable or unwilling to use automobiles
for their primary transportation. Unfortunately this critical core of
services provided by transit agencies – primarily bus systems – has
masked the economic development impact that transit provides for a
region.
However, the public transit system must deliver those services in a
way that provides value to both the rider with no other option, and
those who are induced to ride for cost-savings and convenience. The
NIRPC 2030 Plan identified the critical issues for northwest Indiana
transit system riders and potential riders.
• Access to jobs, and basic services
• Affordability
• The need for cross-county line service
• Improvements to service quality
• The need to promote transit friendly development
The creation of the RBA and the option of producing an integrated
region-wide single provider system has developed a way to address
these issues and yield the benefits that any transportation improve-
ments can deliver: reduced congestion on the roadways, better access
across the region to jobs, healthcare, shopping and amenities. Like
commuter rail and improved access to air travel, improved bus transit
services stimulate the economy and increase the quality of life for the
citizens of a region. The proposed Universal Operator System, defined
in the TranSystems report is evaluated here using the REMI model –
consistent with the methodology used for the other targeted invest-
ments.
The ridership forecast for this new system is consistent with the peer
group regions’ costs as defined in the TranSystems report. This in-
creased ridership was estimated to decrease congestion on the sur-
face transportation networks throughout northwest Indiana using the
Transight model. As a result of that analysis, we find that these
improvements to the transit system would:
• Increase employment by nearly 7,000 jobs over the period to
2040
• Provide personal income growth of $4.5 billion [NPV], over the
time horizon
• Generate $7.2 billion in additional economic activity during the
same period
• Cause the population to increase in Lake and Porter counties by
approximately 8,670 persons
These measurements are against a baseline forecast for the region
and so should be considered net increases due to the introduction of
the new transit services.
Table 19
Regional Bus System Summary
Operating Revenue $17,584,699Expenses
Operating Expenses $24,455,239
Upfront Capital Cost (Annualized) $3,422,488
Fleet Replacement Cost $3,655,000
Total Expenses $31,532,727
Budget Shortfall $13,948,028
Total Service Hours 497,313
Expenses per Capita $39
Trips per Capita 7.66
Table 18
Table of ROI Measurements: RBA
Measurement Numerator Denominator Ratio
Benefit / Cost
PV of Added Personal
Income [in mill of $'s]
PV of Net Regional
Cost [in mill of $'s]
[values] $4,481.6 $322.9 $13.9
Output Ratio
PV of Added Gross
Regional Product [in
mill of $'s]
PV of Net Regional
Cost [in mill of $'s]
[values] $7,238.2 $322.9 $22.4
Cost / Job
PV of Net Regional Cost
[in mill of $'s]
Employment Added
by Project
[values] $322.8 6,924 $46,620.5
Source: Policy Analytics, 2007
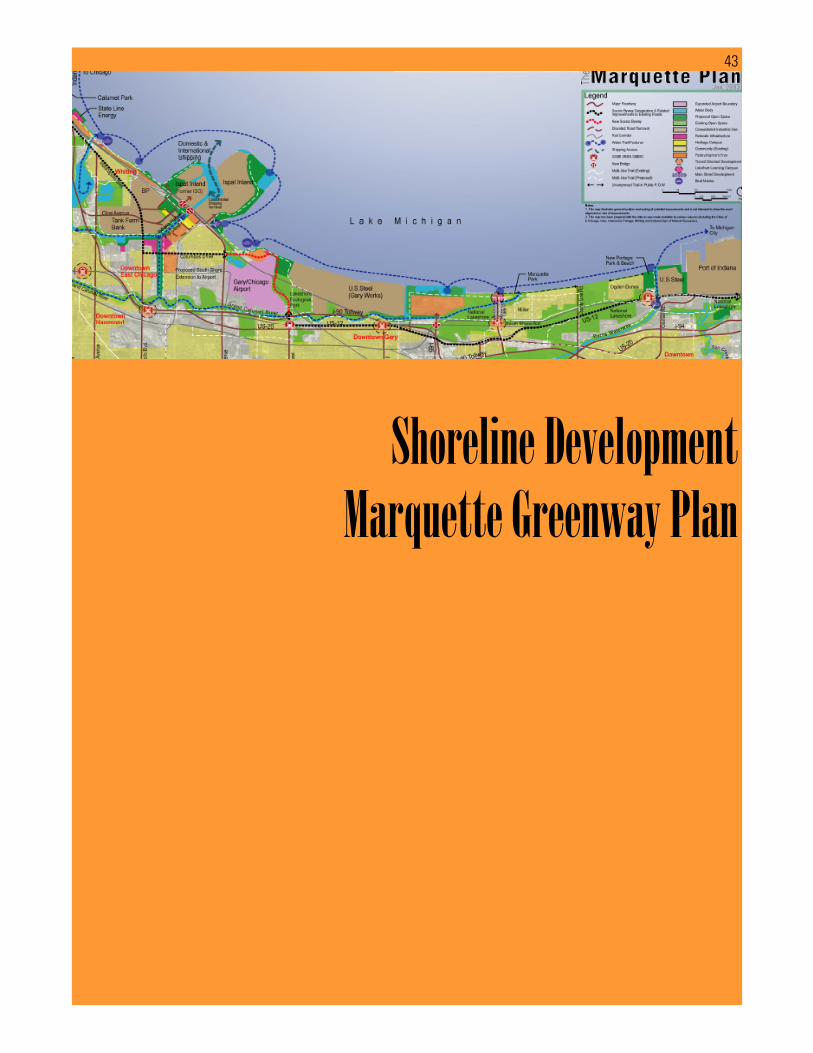
43
Shoreline Development Marquette Greenway Plan
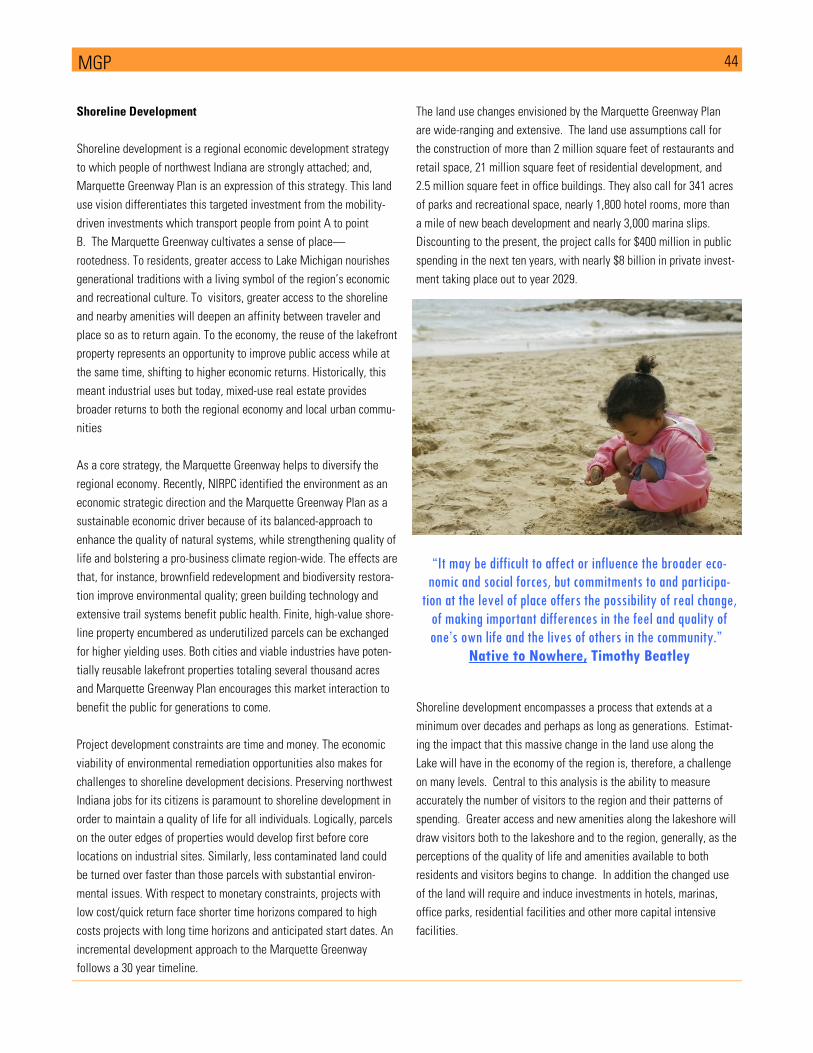
44 MGP
Shoreline Development
Shoreline development is a regional economic development strategy
to which people of northwest Indiana are strongly attached; and,
Marquette Greenway Plan is an expression of this strategy. This land
use vision differentiates this targeted investment from the mobility-
driven investments which transport people from point A to point
B. The Marquette Greenway cultivates a sense of place—
rootedness. To residents, greater access to Lake Michigan nourishes
generational traditions with a living symbol of the region’s economic
and recreational culture. To visitors, greater access to the shoreline
and nearby amenities will deepen an affinity between traveler and
place so as to return again. To the economy, the reuse of the lakefront
property represents an opportunity to improve public access while at
the same time, shifting to higher economic returns. Historically, this
meant industrial uses but today, mixed-use real estate provides
broader returns to both the regional economy and local urban commu-
nities
As a core strategy, the Marquette Greenway helps to diversify the
regional economy. Recently, NIRPC identified the environment as an
economic strategic direction and the Marquette Greenway Plan as a
sustainable economic driver because of its balanced-approach to
enhance the quality of natural systems, while strengthening quality of
life and bolstering a pro-business climate region-wide. The effects are
that, for instance, brownfield redevelopment and biodiversity restora-
tion improve environmental quality; green building technology and
extensive trail systems benefit public health. Finite, high-value shore-
line property encumbered as underutilized parcels can be exchanged
for higher yielding uses. Both cities and viable industries have poten-
tially reusable lakefront properties totaling several thousand acres
and Marquette Greenway Plan encourages this market interaction to
benefit the public for generations to come.
Project development constraints are time and money. The economic
viability of environmental remediation opportunities also makes for
challenges to shoreline development decisions. Preserving northwest
Indiana jobs for its citizens is paramount to shoreline development in
order to maintain a quality of life for all individuals. Logically, parcels
on the outer edges of properties would develop first before core
locations on industrial sites. Similarly, less contaminated land could
be turned over faster than those parcels with substantial environ-
mental issues. With respect to monetary constraints, projects with
low cost/quick return face shorter time horizons compared to high
costs projects with long time horizons and anticipated start dates. An
incremental development approach to the Marquette Greenway
follows a 30 year timeline.
The land use changes envisioned by the Marquette Greenway Plan
are wide-ranging and extensive. The land use assumptions call for
the construction of more than 2 million square feet of restaurants and
retail space, 21 million square feet of residential development, and
2.5 million square feet in office buildings. They also call for 341 acres
of parks and recreational space, nearly 1,800 hotel rooms, more than
a mile of new beach development and nearly 3,000 marina slips.
Discounting to the present, the project calls for $400 million in public
spending in the next ten years, with nearly $8 billion in private invest-
ment taking place out to year 2029.
Shoreline development encompasses a process that extends at a
minimum over decades and perhaps as long as generations. Estimat-
ing the impact that this massive change in the land use along the
Lake will have in the economy of the region is, therefore, a challenge
on many levels. Central to this analysis is the ability to measure
accurately the number of visitors to the region and their patterns of
spending. Greater access and new amenities along the lakeshore will
draw visitors both to the lakeshore and to the region, generally, as the
perceptions of the quality of life and amenities available to both
residents and visitors begins to change. In addition the changed use
of the land will require and induce investments in hotels, marinas,
office parks, residential facilities and other more capital intensive
facilities.
“It may be difficult to affect or influence the broader eco-nomic and social forces, but commitments to and participa-tion at the level of place offers the possibility of real change, of making important differences in the feel and quality of one’s own life and the lives of others in the community.”
Native to Nowhere, Timothy Beatley
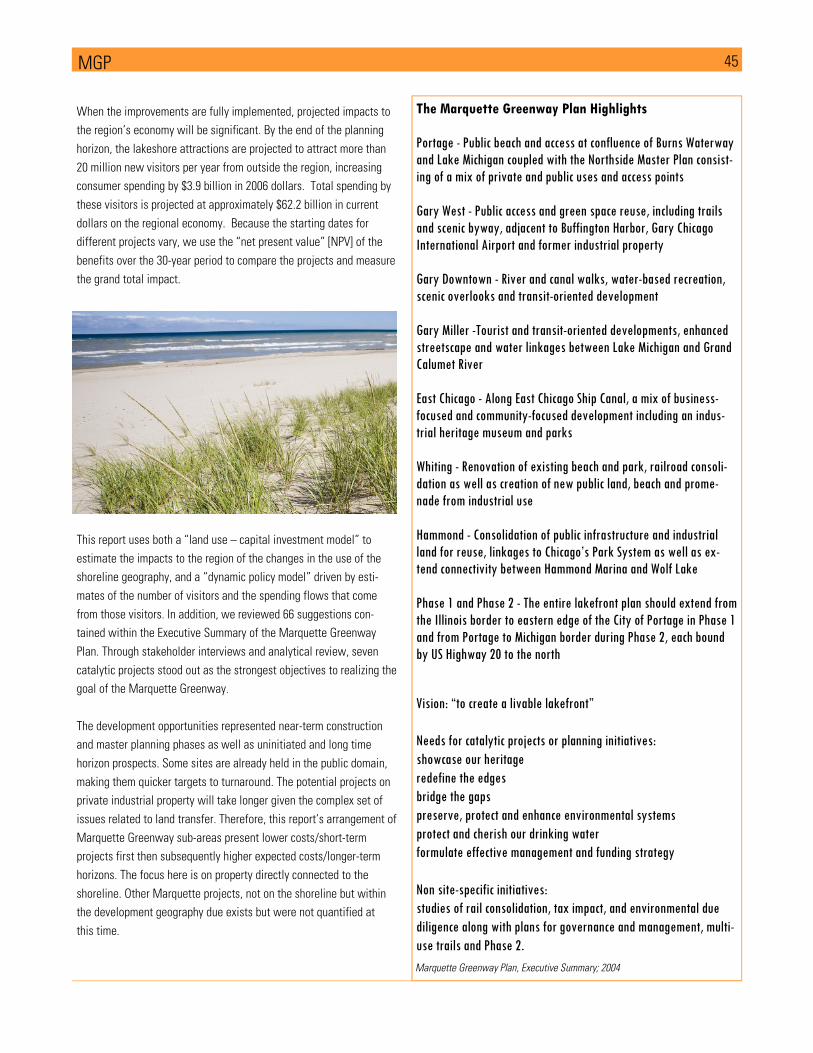
45 MGP
When the improvements are fully implemented, projected impacts to
the region’s economy will be significant. By the end of the planning
horizon, the lakeshore attractions are projected to attract more than
20 million new visitors per year from outside the region, increasing
consumer spending by $3.9 billion in 2006 dollars. Total spending by
these visitors is projected at approximately $62.2 billion in current
dollars on the regional economy. Because the starting dates for
different projects vary, we use the “net present value” [NPV] of the
benefits over the 30-year period to compare the projects and measure
the grand total impact.
This report uses both a “land use – capital investment model” to
estimate the impacts to the region of the changes in the use of the
shoreline geography, and a “dynamic policy model” driven by esti-
mates of the number of visitors and the spending flows that come
from those visitors. In addition, we reviewed 66 suggestions con-
tained within the Executive Summary of the Marquette Greenway
Plan. Through stakeholder interviews and analytical review, seven
catalytic projects stood out as the strongest objectives to realizing the
goal of the Marquette Greenway.
The development opportunities represented near-term construction
and master planning phases as well as uninitiated and long time
horizon prospects. Some sites are already held in the public domain,
making them quicker targets to turnaround. The potential projects on
private industrial property will take longer given the complex set of
issues related to land transfer. Therefore, this report’s arrangement of
Marquette Greenway sub-areas present lower costs/short-term
projects first then subsequently higher expected costs/longer-term
horizons. The focus here is on property directly connected to the
shoreline. Other Marquette projects, not on the shoreline but within
the development geography due exists but were not quantified at
this time.
The Marquette Greenway Plan Highlights Portage - Public beach and access at confluence of Burns Waterway and Lake Michigan coupled with the Northside Master Plan consist-ing of a mix of private and public uses and access points Gary West - Public access and green space reuse, including trails and scenic byway, adjacent to Buffington Harbor, Gary Chicago International Airport and former industrial property Gary Downtown - River and canal walks, water-based recreation, scenic overlooks and transit-oriented development Gary Miller -Tourist and transit-oriented developments, enhanced streetscape and water linkages between Lake Michigan and Grand Calumet River East Chicago - Along East Chicago Ship Canal, a mix of business-focused and community-focused development including an indus-trial heritage museum and parks Whiting - Renovation of existing beach and park, railroad consoli-dation as well as creation of new public land, beach and prome-nade from industrial use Hammond - Consolidation of public infrastructure and industrial land for reuse, linkages to Chicago’s Park System as well as ex-tend connectivity between Hammond Marina and Wolf Lake Phase 1 and Phase 2 - The entire lakefront plan should extend from the Illinois border to eastern edge of the City of Portage in Phase 1 and from Portage to Michigan border during Phase 2, each bound by US Highway 20 to the north
Vision: “to create a livable lakefront” Needs for catalytic projects or planning initiatives: showcase our heritage redefine the edges bridge the gaps preserve, protect and enhance environmental systems protect and cherish our drinking water formulate effective management and funding strategy Non site-specific initiatives: studies of rail consolidation, tax impact, and environmental due diligence along with plans for governance and management, multi-use trails and Phase 2.
Marquette Greenway Plan, Executive Summary; 2004
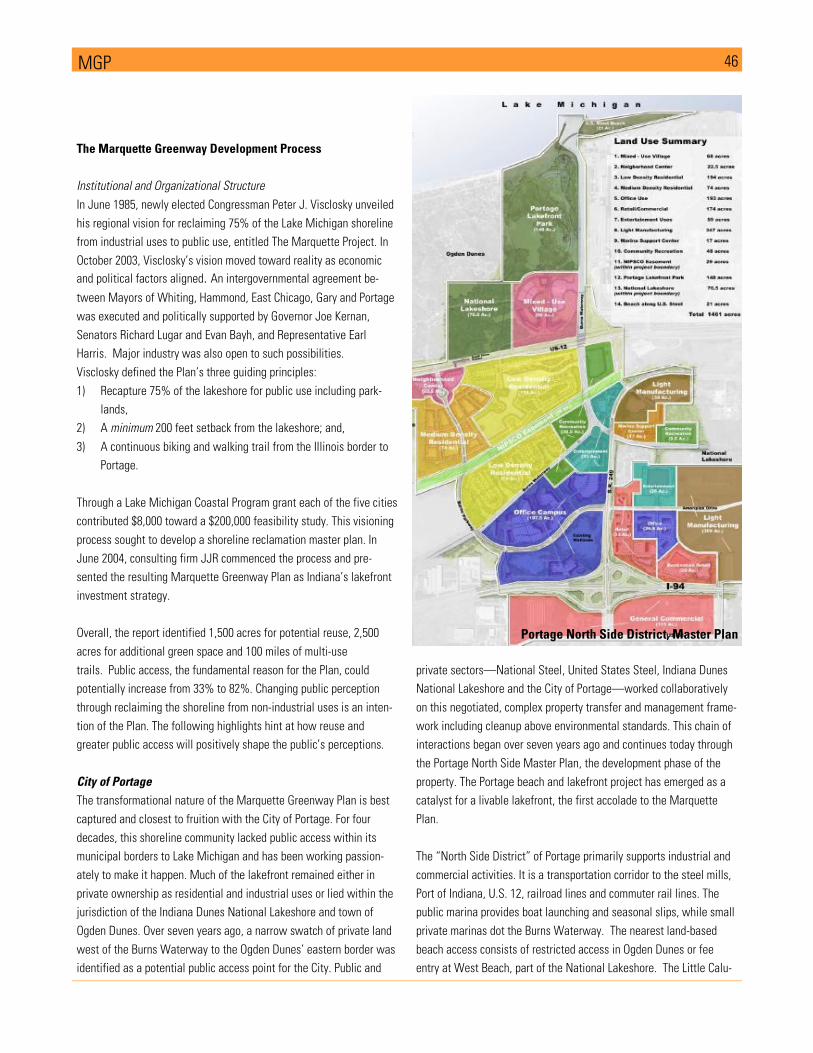
46 MGP
The Marquette Greenway Development Process
Institutional and Organizational Structure
In June 1985, newly elected Congressman Peter J. Visclosky unveiled
his regional vision for reclaiming 75% of the Lake Michigan shoreline
from industrial uses to public use, entitled The Marquette Project. In
October 2003, Visclosky’s vision moved toward reality as economic
and political factors aligned. An intergovernmental agreement be-
tween Mayors of Whiting, Hammond, East Chicago, Gary and Portage
was executed and politically supported by Governor Joe Kernan,
Senators Richard Lugar and Evan Bayh, and Representative Earl
Harris. Major industry was also open to such possibilities.
Visclosky defined the Plan’s three guiding principles:
1) Recapture 75% of the lakeshore for public use including park-
lands,
2) A minimum 200 feet setback from the lakeshore; and,
3) A continuous biking and walking trail from the Illinois border to
Portage.
Through a Lake Michigan Coastal Program grant each of the five cities
contributed $8,000 toward a $200,000 feasibility study. This visioning
process sought to develop a shoreline reclamation master plan. In
June 2004, consulting firm JJR commenced the process and pre-
sented the resulting Marquette Greenway Plan as Indiana’s lakefront
investment strategy.
Overall, the report identified 1,500 acres for potential reuse, 2,500
acres for additional green space and 100 miles of multi-use
trails. Public access, the fundamental reason for the Plan, could
potentially increase from 33% to 82%. Changing public perception
through reclaiming the shoreline from non-industrial uses is an inten-
tion of the Plan. The following highlights hint at how reuse and
greater public access will positively shape the public’s perceptions.
City of Portage
The transformational nature of the Marquette Greenway Plan is best
captured and closest to fruition with the City of Portage. For four
decades, this shoreline community lacked public access within its
municipal borders to Lake Michigan and has been working passion-
ately to make it happen. Much of the lakefront remained either in
private ownership as residential and industrial uses or lied within the
jurisdiction of the Indiana Dunes National Lakeshore and town of
Ogden Dunes. Over seven years ago, a narrow swatch of private land
west of the Burns Waterway to the Ogden Dunes’ eastern border was
identified as a potential public access point for the City. Public and
private sectors—National Steel, United States Steel, Indiana Dunes
National Lakeshore and the City of Portage—worked collaboratively
on this negotiated, complex property transfer and management frame-
work including cleanup above environmental standards. This chain of
interactions began over seven years ago and continues today through
the Portage North Side Master Plan, the development phase of the
property. The Portage beach and lakefront project has emerged as a
catalyst for a livable lakefront, the first accolade to the Marquette
Plan.
The “North Side District” of Portage primarily supports industrial and
commercial activities. It is a transportation corridor to the steel mills,
Port of Indiana, U.S. 12, railroad lines and commuter rail lines. The
public marina provides boat launching and seasonal slips, while small
private marinas dot the Burns Waterway. The nearest land-based
beach access consists of restricted access in Ogden Dunes or fee
entry at West Beach, part of the National Lakeshore. The Little Calu-
Portage North Side District, Master Plan
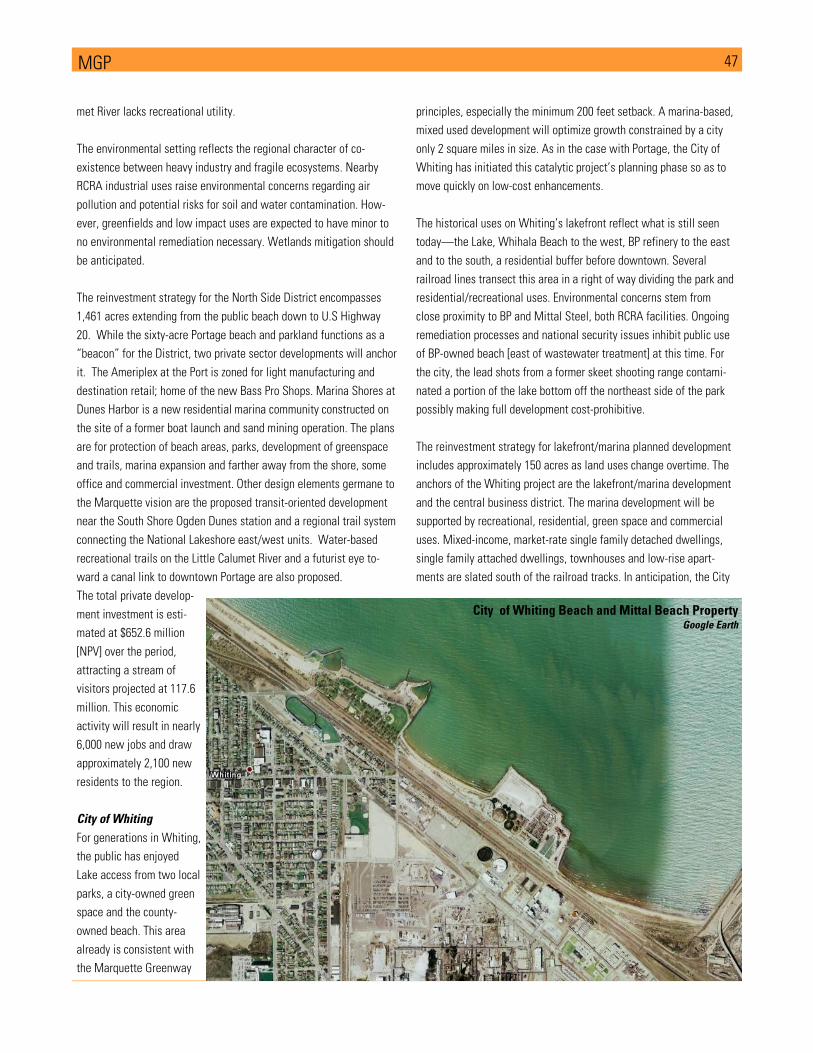
47 MGP
met River lacks recreational utility.
The environmental setting reflects the regional character of co-
existence between heavy industry and fragile ecosystems. Nearby
RCRA industrial uses raise environmental concerns regarding air
pollution and potential risks for soil and water contamination. How-
ever, greenfields and low impact uses are expected to have minor to
no environmental remediation necessary. Wetlands mitigation should
be anticipated.
The reinvestment strategy for the North Side District encompasses
1,461 acres extending from the public beach down to U.S Highway
20. While the sixty-acre Portage beach and parkland functions as a
“beacon” for the District, two private sector developments will anchor
it. The Ameriplex at the Port is zoned for light manufacturing and
destination retail; home of the new Bass Pro Shops. Marina Shores at
Dunes Harbor is a new residential marina community constructed on
the site of a former boat launch and sand mining operation. The plans
are for protection of beach areas, parks, development of greenspace
and trails, marina expansion and farther away from the shore, some
office and commercial investment. Other design elements germane to
the Marquette vision are the proposed transit-oriented development
near the South Shore Ogden Dunes station and a regional trail system
connecting the National Lakeshore east/west units. Water-based
recreational trails on the Little Calumet River and a futurist eye to-
ward a canal link to downtown Portage are also proposed.
The total private develop-
ment investment is esti-
mated at $652.6 million
[NPV] over the period,
attracting a stream of
visitors projected at 117.6
million. This economic
activity will result in nearly
6,000 new jobs and draw
approximately 2,100 new
residents to the region.
City of Whiting
For generations in Whiting,
the public has enjoyed
Lake access from two local
parks, a city-owned green
space and the county-
owned beach. This area
already is consistent with
the Marquette Greenway
principles, especially the minimum 200 feet setback. A marina-based,
mixed used development will optimize growth constrained by a city
only 2 square miles in size. As in the case with Portage, the City of
Whiting has initiated this catalytic project’s planning phase so as to
move quickly on low-cost enhancements.
The historical uses on Whiting’s lakefront reflect what is still seen
today—the Lake, Whihala Beach to the west, BP refinery to the east
and to the south, a residential buffer before downtown. Several
railroad lines transect this area in a right of way dividing the park and
residential/recreational uses. Environmental concerns stem from
close proximity to BP and Mittal Steel, both RCRA facilities. Ongoing
remediation processes and national security issues inhibit public use
of BP-owned beach [east of wastewater treatment] at this time. For
the city, the lead shots from a former skeet shooting range contami-
nated a portion of the lake bottom off the northeast side of the park
possibly making full development cost-prohibitive.
The reinvestment strategy for lakefront/marina planned development
includes approximately 150 acres as land uses change overtime. The
anchors of the Whiting project are the lakefront/marina development
and the central business district. The marina development will be
supported by recreational, residential, green space and commercial
uses. Mixed-income, market-rate single family detached dwellings,
single family attached dwellings, townhouses and low-rise apart-
ments are slated south of the railroad tracks. In anticipation, the City
City of Whiting Beach and Mittal Beach Property Google Earth
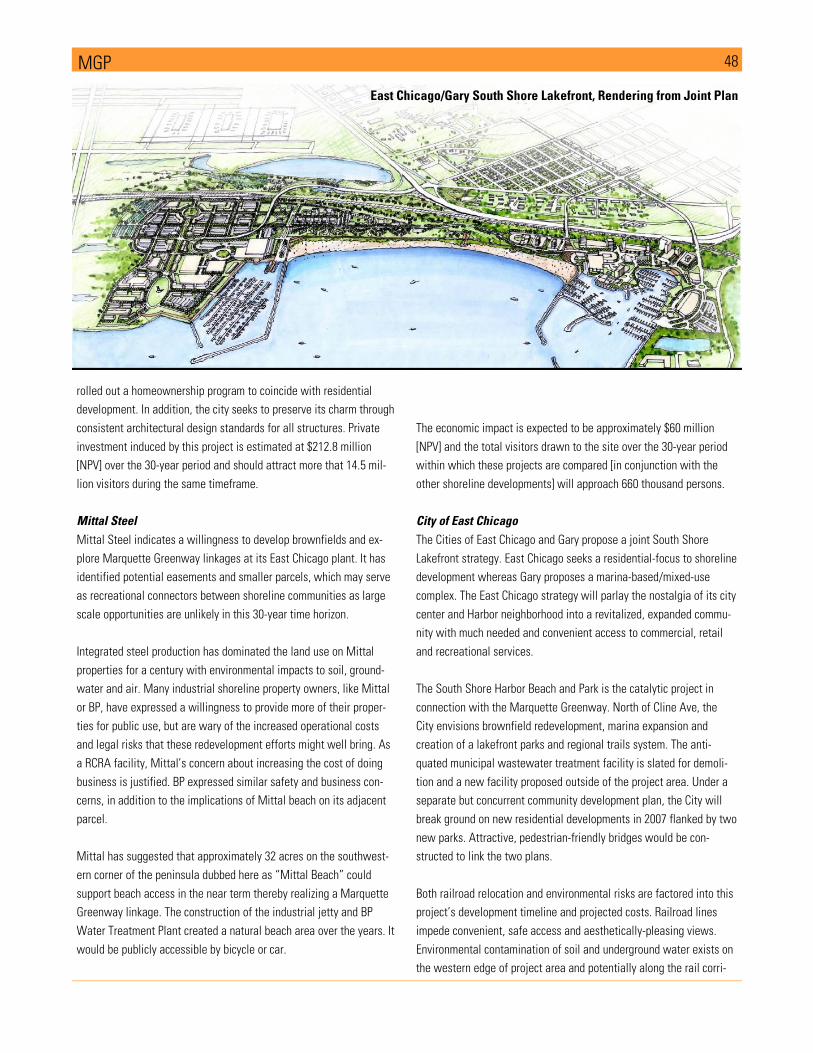
48 MGP
rolled out a homeownership program to coincide with residential
development. In addition, the city seeks to preserve its charm through
consistent architectural design standards for all structures. Private
investment induced by this project is estimated at $212.8 million
[NPV] over the 30-year period and should attract more that 14.5 mil-
lion visitors during the same timeframe.
Mittal Steel
Mittal Steel indicates a willingness to develop brownfields and ex-
plore Marquette Greenway linkages at its East Chicago plant. It has
identified potential easements and smaller parcels, which may serve
as recreational connectors between shoreline communities as large
scale opportunities are unlikely in this 30-year time horizon.
Integrated steel production has dominated the land use on Mittal
properties for a century with environmental impacts to soil, ground-
water and air. Many industrial shoreline property owners, like Mittal
or BP, have expressed a willingness to provide more of their proper-
ties for public use, but are wary of the increased operational costs
and legal risks that these redevelopment efforts might well bring. As
a RCRA facility, Mittal’s concern about increasing the cost of doing
business is justified. BP expressed similar safety and business con-
cerns, in addition to the implications of Mittal beach on its adjacent
parcel.
Mittal has suggested that approximately 32 acres on the southwest-
ern corner of the peninsula dubbed here as “Mittal Beach” could
support beach access in the near term thereby realizing a Marquette
Greenway linkage. The construction of the industrial jetty and BP
Water Treatment Plant created a natural beach area over the years. It
would be publicly accessible by bicycle or car.
The economic impact is expected to be approximately $60 million
[NPV] and the total visitors drawn to the site over the 30-year period
within which these projects are compared [in conjunction with the
other shoreline developments] will approach 660 thousand persons.
City of East Chicago
The Cities of East Chicago and Gary propose a joint South Shore
Lakefront strategy. East Chicago seeks a residential-focus to shoreline
development whereas Gary proposes a marina-based/mixed-use
complex. The East Chicago strategy will parlay the nostalgia of its city
center and Harbor neighborhood into a revitalized, expanded commu-
nity with much needed and convenient access to commercial, retail
and recreational services.
The South Shore Harbor Beach and Park is the catalytic project in
connection with the Marquette Greenway. North of Cline Ave, the
City envisions brownfield redevelopment, marina expansion and
creation of a lakefront parks and regional trails system. The anti-
quated municipal wastewater treatment facility is slated for demoli-
tion and a new facility proposed outside of the project area. Under a
separate but concurrent community development plan, the City will
break ground on new residential developments in 2007 flanked by two
new parks. Attractive, pedestrian-friendly bridges would be con-
structed to link the two plans.
Both railroad relocation and environmental risks are factored into this
project’s development timeline and projected costs. Railroad lines
impede convenient, safe access and aesthetically-pleasing views.
Environmental contamination of soil and underground water exists on
the western edge of project area and potentially along the rail corri-
East Chicago/Gary South Shore Lakefront, Rendering from Joint Plan
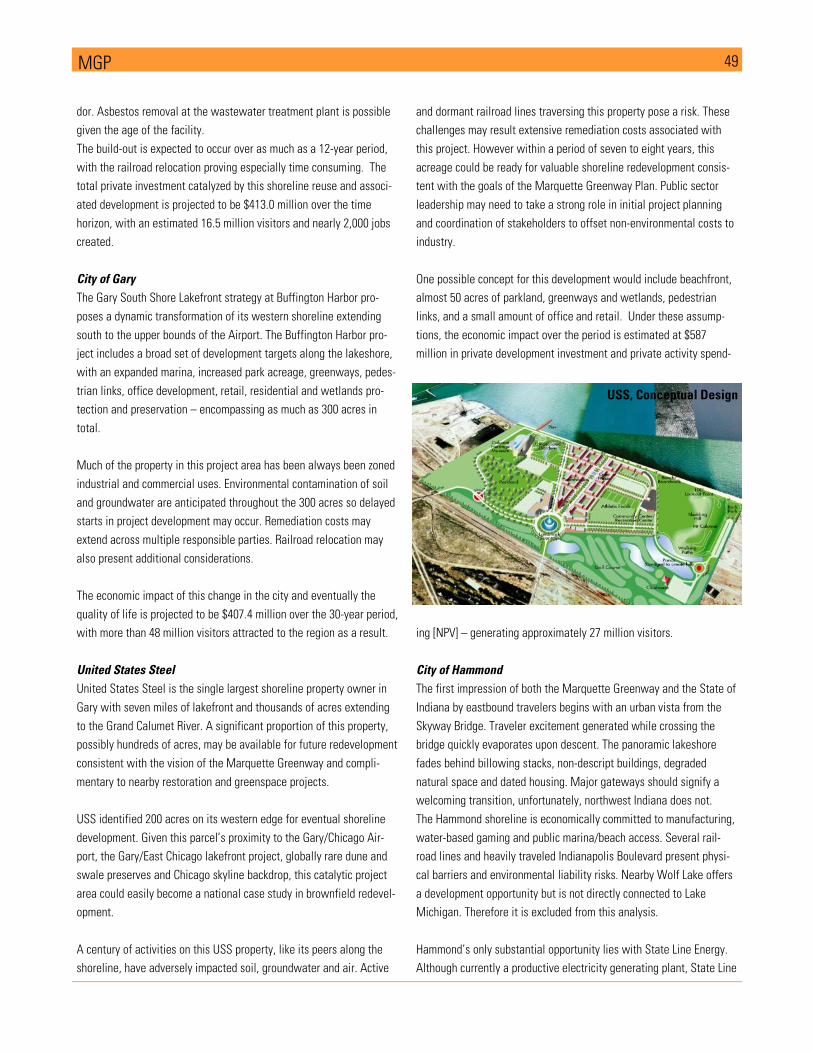
49 MGP
dor. Asbestos removal at the wastewater treatment plant is possible
given the age of the facility.
The build-out is expected to occur over as much as a 12-year period,
with the railroad relocation proving especially time consuming. The
total private investment catalyzed by this shoreline reuse and associ-
ated development is projected to be $413.0 million over the time
horizon, with an estimated 16.5 million visitors and nearly 2,000 jobs
created.
City of Gary
The Gary South Shore Lakefront strategy at Buffington Harbor pro-
poses a dynamic transformation of its western shoreline extending
south to the upper bounds of the Airport. The Buffington Harbor pro-
ject includes a broad set of development targets along the lakeshore,
with an expanded marina, increased park acreage, greenways, pedes-
trian links, office development, retail, residential and wetlands pro-
tection and preservation – encompassing as much as 300 acres in
total.
Much of the property in this project area has been always been zoned
industrial and commercial uses. Environmental contamination of soil
and groundwater are anticipated throughout the 300 acres so delayed
starts in project development may occur. Remediation costs may
extend across multiple responsible parties. Railroad relocation may
also present additional considerations.
The economic impact of this change in the city and eventually the
quality of life is projected to be $407.4 million over the 30-year period,
with more than 48 million visitors attracted to the region as a result.
United States Steel
United States Steel is the single largest shoreline property owner in
Gary with seven miles of lakefront and thousands of acres extending
to the Grand Calumet River. A significant proportion of this property,
possibly hundreds of acres, may be available for future redevelopment
consistent with the vision of the Marquette Greenway and compli-
mentary to nearby restoration and greenspace projects.
USS identified 200 acres on its western edge for eventual shoreline
development. Given this parcel’s proximity to the Gary/Chicago Air-
port, the Gary/East Chicago lakefront project, globally rare dune and
swale preserves and Chicago skyline backdrop, this catalytic project
area could easily become a national case study in brownfield redevel-
opment.
A century of activities on this USS property, like its peers along the
shoreline, have adversely impacted soil, groundwater and air. Active
and dormant railroad lines traversing this property pose a risk. These
challenges may result extensive remediation costs associated with
this project. However within a period of seven to eight years, this
acreage could be ready for valuable shoreline redevelopment consis-
tent with the goals of the Marquette Greenway Plan. Public sector
leadership may need to take a strong role in initial project planning
and coordination of stakeholders to offset non-environmental costs to
industry.
One possible concept for this development would include beachfront,
almost 50 acres of parkland, greenways and wetlands, pedestrian
links, and a small amount of office and retail. Under these assump-
tions, the economic impact over the period is estimated at $587
million in private development investment and private activity spend-
ing [NPV] – generating approximately 27 million visitors.
City of Hammond
The first impression of both the Marquette Greenway and the State of
Indiana by eastbound travelers begins with an urban vista from the
Skyway Bridge. Traveler excitement generated while crossing the
bridge quickly evaporates upon descent. The panoramic lakeshore
fades behind billowing stacks, non-descript buildings, degraded
natural space and dated housing. Major gateways should signify a
welcoming transition, unfortunately, northwest Indiana does not.
The Hammond shoreline is economically committed to manufacturing,
water-based gaming and public marina/beach access. Several rail-
road lines and heavily traveled Indianapolis Boulevard present physi-
cal barriers and environmental liability risks. Nearby Wolf Lake offers
a development opportunity but is not directly connected to Lake
Michigan. Therefore it is excluded from this analysis.
Hammond’s only substantial opportunity lies with State Line Energy.
Although currently a productive electricity generating plant, State Line
USS, Conceptual Design
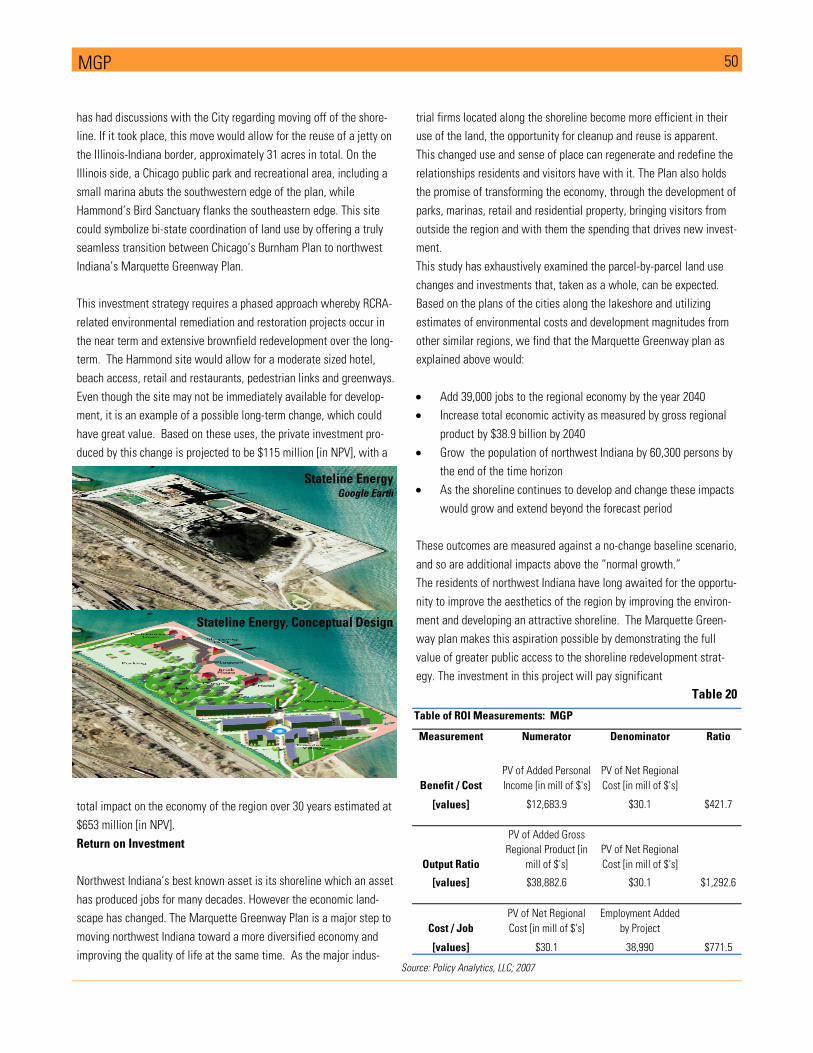
50 MGP
has had discussions with the City regarding moving off of the shore-
line. If it took place, this move would allow for the reuse of a jetty on
the Illinois-Indiana border, approximately 31 acres in total. On the
Illinois side, a Chicago public park and recreational area, including a
small marina abuts the southwestern edge of the plan, while
Hammond’s Bird Sanctuary flanks the southeastern edge. This site
could symbolize bi-state coordination of land use by offering a truly
seamless transition between Chicago’s Burnham Plan to northwest
Indiana’s Marquette Greenway Plan.
This investment strategy requires a phased approach whereby RCRA-
related environmental remediation and restoration projects occur in
the near term and extensive brownfield redevelopment over the long-
term. The Hammond site would allow for a moderate sized hotel,
beach access, retail and restaurants, pedestrian links and greenways.
Even though the site may not be immediately available for develop-
ment, it is an example of a possible long-term change, which could
have great value. Based on these uses, the private investment pro-
duced by this change is projected to be $115 million [in NPV], with a
total impact on the economy of the region over 30 years estimated at
$653 million [in NPV].
Return on Investment
Northwest Indiana’s best known asset is its shoreline which an asset
has produced jobs for many decades. However the economic land-
scape has changed. The Marquette Greenway Plan is a major step to
moving northwest Indiana toward a more diversified economy and
improving the quality of life at the same time. As the major indus-
trial firms located along the shoreline become more efficient in their
use of the land, the opportunity for cleanup and reuse is apparent.
This changed use and sense of place can regenerate and redefine the
relationships residents and visitors have with it. The Plan also holds
the promise of transforming the economy, through the development of
parks, marinas, retail and residential property, bringing visitors from
outside the region and with them the spending that drives new invest-
ment.
This study has exhaustively examined the parcel-by-parcel land use
changes and investments that, taken as a whole, can be expected.
Based on the plans of the cities along the lakeshore and utilizing
estimates of environmental costs and development magnitudes from
other similar regions, we find that the Marquette Greenway plan as
explained above would:
• Add 39,000 jobs to the regional economy by the year 2040
• Increase total economic activity as measured by gross regional
product by $38.9 billion by 2040
• Grow the population of northwest Indiana by 60,300 persons by
the end of the time horizon
• As the shoreline continues to develop and change these impacts
would grow and extend beyond the forecast period
These outcomes are measured against a no-change baseline scenario,
and so are additional impacts above the “normal growth.”
The residents of northwest Indiana have long awaited for the opportu-
nity to improve the aesthetics of the region by improving the environ-
ment and developing an attractive shoreline. The Marquette Green-
way plan makes this aspiration possible by demonstrating the full
value of greater public access to the shoreline redevelopment strat-
egy. The investment in this project will pay significant
Table 20
Table of ROI Measurements: MGP
Measurement Numerator Denominator Ratio
Benefit / Cost
PV of Added Personal
Income [in mill of $'s]
PV of Net Regional
Cost [in mill of $'s]
[values] $12,683.9 $30.1 $421.7
Output Ratio
PV of Added Gross
Regional Product [in
mill of $'s]
PV of Net Regional
Cost [in mill of $'s]
[values] $38,882.6 $30.1 $1,292.6
Cost / Job
PV of Net Regional
Cost [in mill of $'s]
Employment Added
by Project
[values] $30.1 38,990 $771.5
Source: Policy Analytics, LLC; 2007
Stateline Energy, Conceptual Design
Stateline Energy Google Earth
51 Findings
Conclusion / Findings
The 2005 Indiana General Assembly created the Northwest Indiana
Regional Development Authority, assigned a development mission,
provided funding and required that it complete a Comprehensive
Economic Development Plan prior to the start of making investments.
For each of the projects identified in the statute, the report was to
include: budget and timeline, the return on investment, the expected
need for ongoing subsidy, and the projected federal matching funds.
This report, completed under the RDA’s supervision, is submitted as
fulfillment of that statutory requirement.
This report is built upon the foundation of an eight month analysis and
review of the economy and demographics of northwest Indiana,
relevant policy studies completed over the past six years, and an
intensive analysis of the four targeted investments set forth in the
RDA’s statute. This analysis yielded the following insights:
1. The Gary / Chicago International Airport has the potential to
capture a significant amount of the greater Chicago region’s air activ-
ity growing to approximately two-thirds the size of Midway today,
becoming in reality the third most important airport in the Chicago
region and adding 86,000 jobs and $82.6 billion [PV] in net new eco-
nomic activity over the next 40 years. This development will be
completed with a substantial amount of federal funding, and will not
be expected to require long term outside subsidies.
2. The West Lake Corridor extension of the South Shore commuter
railroad to Lowell and Valparaiso will reduce congestion within the
northwest Indiana region and produce significant inflows of personal
income, boosting the regional economy, producing more than 26,000
new jobs and $32.2 billion [PV] in net new economic activity. If the
project is funded through the federal New Starts program, it will likely
receive 50% federal funding, and will require state funds at the cur-
rent ratio to subsidize its expanded operations.
3. The development of the Lake Michigan shoreline in northwest
Indiana will reduce environmental contamination, increase the quality
of life for residents and produce economic benefits far in excess of
the funds needed for the investments. The Marquette Greenway Plan
as estimated/described in this report will add 39,000 jobs to the
regional economy and increase net new economic activity by $38.9
billion [PV] over the next 40 years. This development will require no
net ongoing subsidies. It is not clear what federal match rates will
apply for the projects included in this development plan, as federal
programmatic funds have not been identified.
4. The provision of a region-wide, integrated transit/bus system will
provide access to jobs, access to health care and access to shopping
for both citizens without other means of transportation and those who
choose to ride transit. These new transit services will increase em-
ployment by 7,000 jobs and add $7.2 billion [PV] in net new economic
activity during the next 40 years. Federal funds are expected to pro-
vide approximately 28% of the annual operating and capital cost, with
the need to cover an annual budget shortfall of approximately $14
million region-wide.
The RDA’s goal is to be “…a catalyst for the transformation of the
Northwest Indiana economy to robust world class status.” The pro-
jected impact of the above projects is a very robust $160.9 billion in
net new economic activity, and an increase in jobs of 158,000 by 2040
that amounts to nearly a 50% increase above the baseline forecast.
These projects help to catalyze a Northwest Indiana that is a leading
portion of the Indiana and Chicago economies and known for its
quality of life. In short, the vision of those who worked to establish
the RDA can become a reality. The challenge is to deliver on the
development path that is laid out for the region – it is a question of
implementation and resources – but the vision can be realized if the
people of Northwest Indiana choose to make it happen.
52
Policy Analytics, LLC is an Indiana based company specializing
in economic research, public finance, and policy analysis. William J.
Sheldrake founded the firm in 2004 with the vision of providing crea-
tive analytical insight for public and private decision-making to busi-
ness executives, elected officials and other community leaders in
need of first rank research and top quality strategic thinking. The com-
pany is headquartered in Indianapolis, Indiana while working on pro-
jects throughout the state and the Midwest. Through its experienced
staff, Policy Analytics brings to its projects the combined experience
of over 60 years of public finance and public policy expertise and dec-
ades of private sector and academic research skills.
Project Team
To meet the project sponsor and stakeholder expectations, Policy
Analytics led by President Bill Sheldrake, assembled a professional
seven member team consisting of Policy Analytics’ staff consultants;
Hunden Strategic Partners, a Beverly Shores-based real estate and
economic development firm; and Civil and Environmental Consultants,
a Pittsburg, PA-based land use, environmental planning and engineer-
ing company.
Policy Analytics, LLC
155 E. Market St., Suite 501
Indianapolis, IN 46204
317-860-0785
www.policyanalyticsllc.com


![Northwest Indiana Regional Development Authority ...in.gov/rda/files/RDA_Phase_II_2_20_07.pdfThe Northwest Indiana Regional Development Authority [the “RDA”] was created during](https://img.pdfslide.net/doc/110x75/60b4af26db423f59cf310291/northwest-indiana-regional-development-authority-ingovrdafilesrdaphaseii22007pdf.jpg)