Embed Size (px)
Citation preview
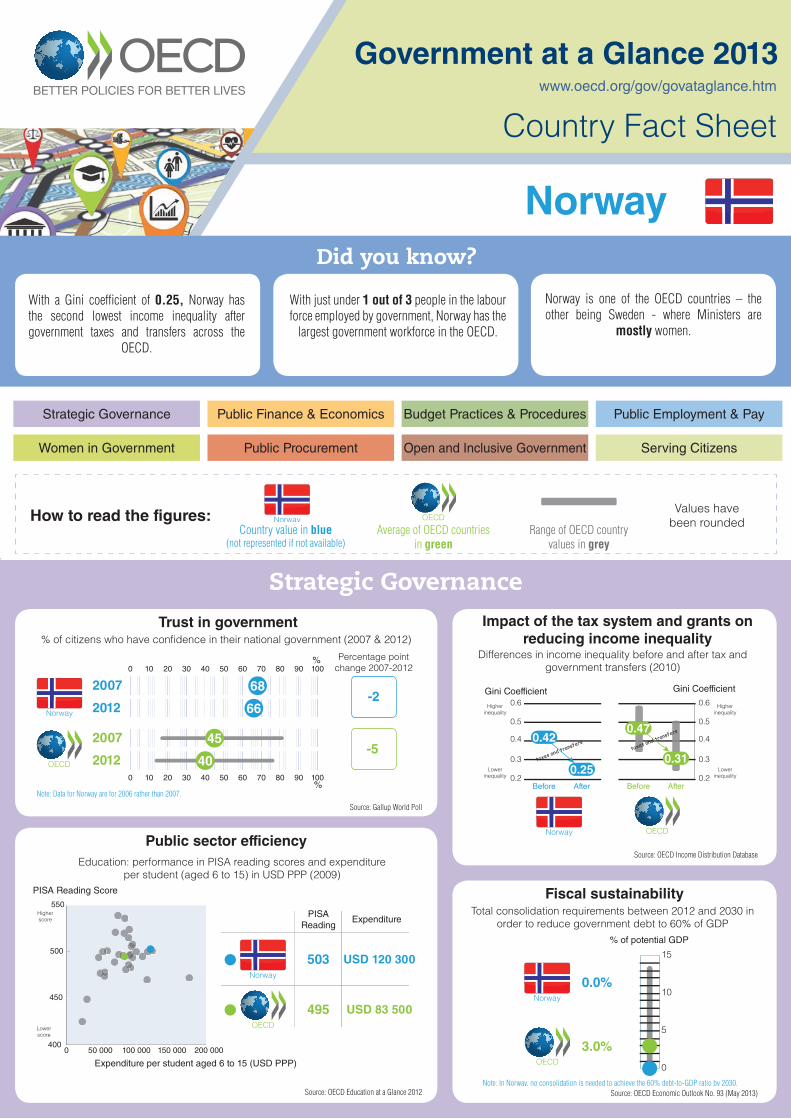
Government at a Glance 2013
Country Fact Sheet
Strategic Governance
Women in Government
Public Finance & Economics
Public Procurement
Budget Practices & Procedures
Open and Inclusive Government
Public Employment & Pay
Serving Citizens
Did you know?
Average of OECD countries in green
Country value in blue (not represented if not available)
Range of OECD country values in grey
www.oecd.org/gov/govataglance.htm
How to read the figures: OECDValues have
been rounded
Trust in government
Fiscal sustainability
Public sector efficiency
Impact of the tax system and grants on reducing income inequality% of citizens who have confi dence in their national government (2007 & 2012)
Education: performance in PISA reading scores and expenditure per student (aged 6 to 15) in USD PPP (2009)
Source: Gallup World Poll
Source: OECD Education at a Glance 2012
Source: OECD Income Distribution Database
Source: OECD Economic Outlook No. 93 (May 2013)
Total consolidation requirements between 2012 and 2030 in order to reduce government debt to 60% of GDP
Differences in income inequality before and after tax and government transfers (2010)
Strategic Governance
0.2
0.3
0.4
0.5
0.6
0.2
0.3
0.4
0.5
0.6Gini Coefficient Gini Coefficient
Higherinequality
Higherinequality
Lowerinequality
Lowerinequality
Before After Before After
OECD
0.47
0.31taxes and transfers
0.25
0.42
taxes and transfers
Norway
0
5
10
15
% of potential GDP
3.0%OECD
Note: In Norway, no consolidation is needed to achieve the 60% debt-to-GDP ratio by 2030.
0.0%Norway
Expenditure per student aged 6 to 15 (USD PPP)
PISA Reading Score
0 50 000 100 000 150 000 200 000400
450
500
550Higherscore
Lowerscore
OECD
PISAReading
Expenditure
495 USD 83 500
503 USD 120 300Norway
Norway
With just under 1 out of 3 people in the labour force employed by government, Norway has the
largest government workforce in the OECD.
With a Gini coeffi cient of 0.25, Norway has the second lowest income inequality after government taxes and transfers across the
OECD.
Norway is one of the OECD countries – the other being Sweden - where Ministers are
mostly women.
Percentage pointchange 2007-20120 10 20 30 40 50 60 70 80 90 100
%
0 10 20 30 40 50 60 70 80 90 100%
45
40
2007
2012-5
OECD
-22007
2012 66
68
Note: Data for Norway are for 2006 rather than 2007.
Norway
Norway
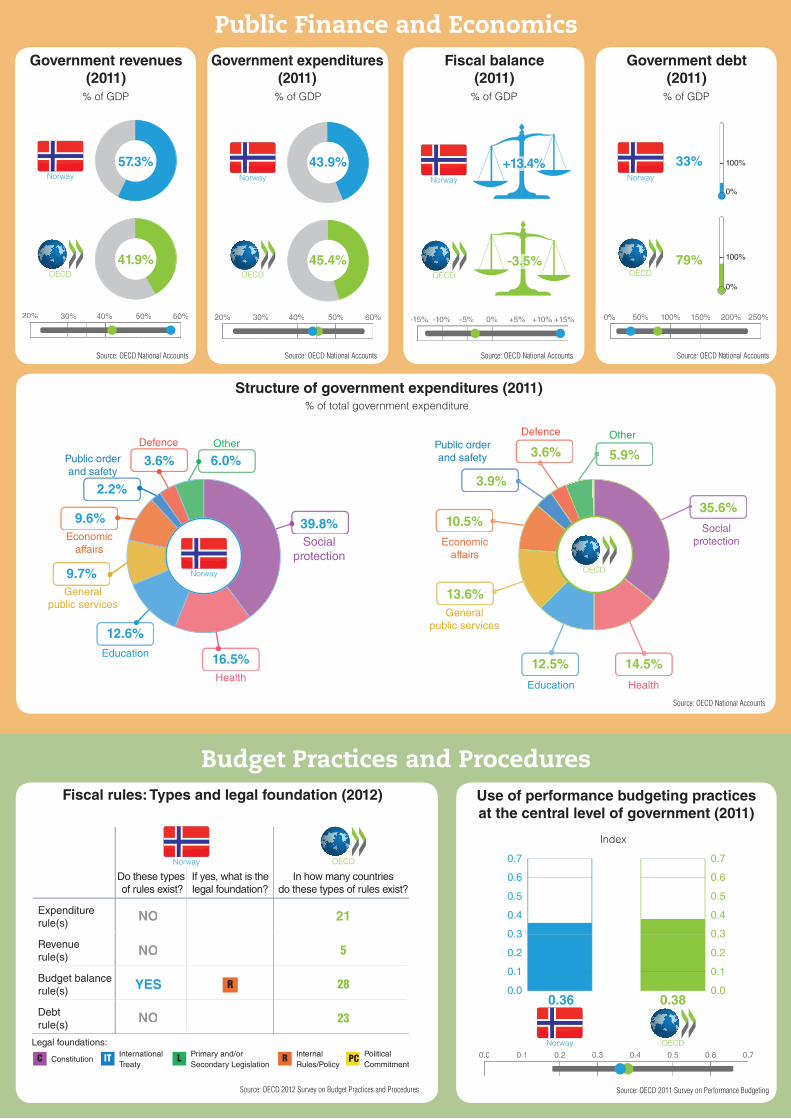
Public Finance and Economics
Structure of government expenditures (2011)% of total government expenditure
Government revenues(2011)
Government expenditures(2011)
Fiscal balance(2011)
Government debt(2011)
% of GDP % of GDP % of GDP % of GDP
Source: OECD National Accounts Source: OECD National Accounts Source: OECD National Accounts Source: OECD National Accounts
Source: OECD National Accounts
Budget Practices and ProceduresFiscal rules: Types and legal foundation (2012) Use of performance budgeting practices
at the central level of government (2011)
Index
Source: OECD 2012 Survey on Budget Practices and Procedures Source: OECD 2011 Survey on Performance Budgeting
20% 30% 40% 50% 60%
OECD
41.9%
57.3%Norway
20% 30% 40% 50% 60%
OECD
45.4%
43.9%Norway
OECD
-15% -10% 0%-5% +5% +10% +15%
-3.5%
+13.4%Norway
0% 50% 100% 150% 200% 250%
OECD79% 100%
0%
33%Norway
100%
0%
Socialprotection
HealthEducation
Generalpublic services
Economicaffairs
Public orderand safety
Defence Other
35.6%
5.9%
3.9%
3.6%
14.5%12.5%
13.6%
10.5%
OECD
6.0%Other
3.6%Defence
2.2%
Public orderand safety
9.6%Economic
affairs
9.7%General
public services
12.6%Education 16.5%
Health
39.8%Social
protectionNorway
In how many countriesdo these types of rules exist?
If yes, what is thelegal foundation?
Do these types of rules exist?
Expenditurerule(s)
Revenuerule(s)
Budget balancerule(s)
Debtrule(s)
Legal foundations:
ConstitutionInternationalTreaty
Primary and/orSecondary Legislation
InternalRules/Policy
PoliticalCommitment
C IT L R PC
21
5
28
23
OECD
NO
RYES
NO
NO
Norway
0.0
0.1
0.2
0.3
0.4
0.5
0.6
0.7
0.38
OECD0.0 0.1 0.2 0.3 0.4 0.5 0.6 0.7
0.36
Norway
0.0
0.1
0.2
0.3
0.4
0.5
0.6
0.7
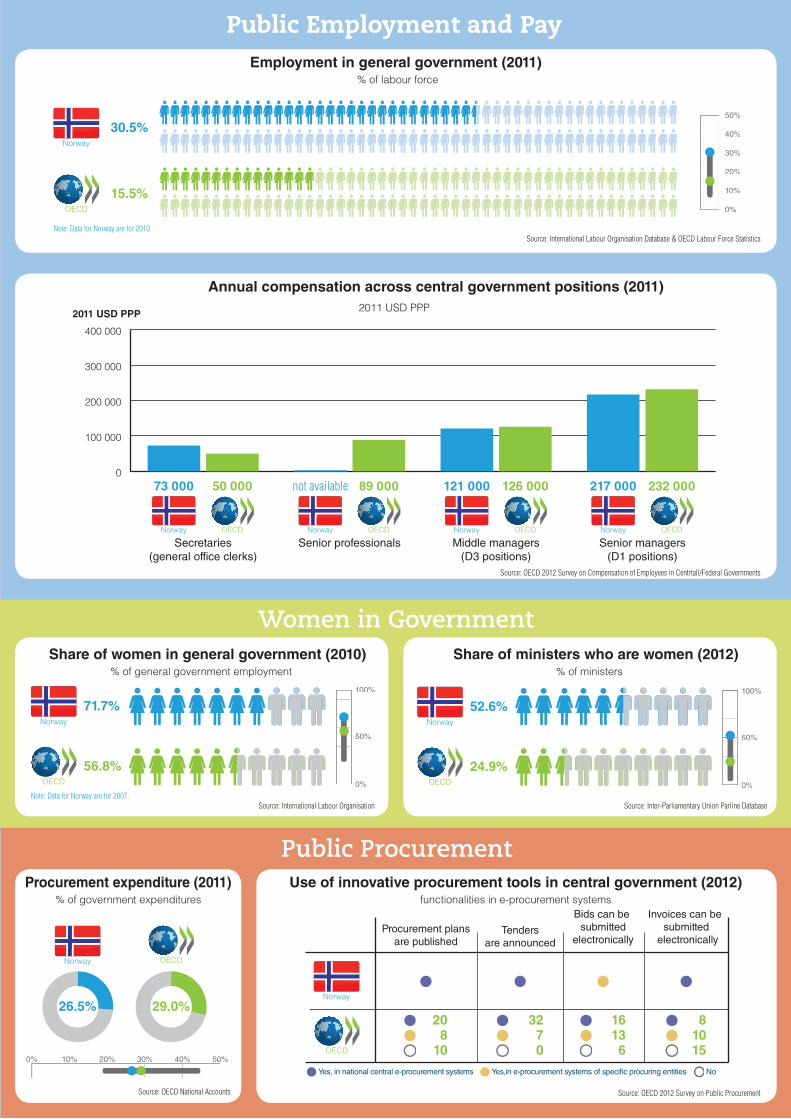
Public Employment and PayEmployment in general government (2011)
% of labour force
Annual compensation across central government positions (2011)
Source: OECD 2012 Survey on Compensation of Employees in Centrtall/Federal Governments
Source: International Labour Organisation Database & OECD Labour Force Statistics
2011 USD PPP
Women in GovernmentShare of women in general government (2010) Share of ministers who are women (2012)
Source: International Labour Organisation Source: Inter-Parliamentary Union Parline Database
% of general government employment % of ministers
Public ProcurementProcurement expenditure (2011) Use of innovative procurement tools in central government (2012)
% of government expenditures functionalities in e-procurement systems
Source: OECD National Accounts Source: OECD 2012 Survey on Public Procurement
0% 10% 20% 30% 40% 50%
OECD
29.0%26.5%
Norway
Procurement plansare published
Yes, in national central e-procurement systems Yes,in e-procurement systems of speci�c procuring entities No
Tendersare announced
Bids can be submitted
electronically
Invoices can be submitted
electronically
208
10
3270
16136
81015OECD
Norway
56.8%OECD
50%
0%
100%
71.7%
Note: Data for Norway are for 2007.
Norway
24.9%OECD
50%
0%
100%
52.6%Norway
50%
0%
10%
20%
30%
40%
15.5%OECD
30.5%
Note: Data for Norway are for 2010.
Norway
232 000126 00089 00050 000
OECDOECDOECDOECD
Middle managers(D3 positions)
Senior managers(D1 positions)
Senior professionalsSecretaries(general office clerks)
2011 USD PPP
0
100 000
200 000
300 000
400 000
217 000121 00073 000
NorwayNorwayNorwayNorway
not available
Open and Inclusive GovernmentAsset disclosure: Level of disclosure of private interests
and public availability of information (2012)
Source: OECD 2012 Survey on Confl ict of Interest Disclosure
Serving Citizens: quality of public services
out of pocket expenditure as a % of fi nal household consumption
Access to medical care (2011) Citizen take-up of e-government services (2012)% of individuals using the internet to interact with public authorities
Satisfaction and confidence across public services (2012)% of citizens expressing confi dence/satisfaction
Source: OECD Health Statistics 2013 Source: Eurostat and OECD
Source: World Gallup Poll
Government at a Glance 2013With a focus on public administration, OECD Government at a Glance 2013 provides readers with a dashboard of key indicators assembled with the
goal of contributing to the analysis and international comparison of public sector performance across OECD countries. Indicators on public finances
and employment are provided alongside composite indexes summarising aspects of public management policies, and indicators on service quality
in education, health, taxation and justice. Government at a Glance 2013 also includes indicators on key governance and public management
issues, such as strategice governance, budgeting, compensation in the public service, public procurement and open government.
www.oecd.org/gov/govataglance.htm
http://dx.doi.org/10.1787/gov_glance-2013-en
For background data and to consult this publication on line:
For more information and to consult all other Country Fact Sheets:
v1.13/11/13
50%OECD
100%
0%
25%
50%
75%
78%Norway
40%
66%71%
51% 72%
National government
Judicial system Local police
Health care Education system
OECD range
OECD
66%
78%82%
81% 80%20
40
60
80
100
Norway
2.9%
OECD0% 1% 2% 3% 4% 5%
2.7%
Note: Data for Norway are for 2010.
Norway
100
75
50
25
0
51OECD
66Norway
Low level Middle level High level
0 10 20 30 40 50 60 70 80 90 100
0 10 20 30 40 50 60 70 80 90 100


![Gini Coefficient California pre-tax income, 2000, Gini=62.1%saez/course131/taxintro_ch17_new_attach.pdfFigure 1: Gini coefficient 6RXUFH .RSF]XN 6DH] 6RQJ4-( :DJHHDUQLQJVLQHTXDOLW\](https://img.pdfslide.net/doc/110x75/5f9d687763df8333422405c5/gini-coefficient-california-pre-tax-income-2000-gini621-saezcourse131taxintroch17newattachpdf.jpg)