Embed Size (px)
DESCRIPTION
Norwegian Marine Insurance Statistics As of 31 December 2003. Page: 2.3.1. Norwegian Marine Insurance Statistics As of 31 December 2003. Page: 2.3.2. Norwegian Marine Insurance Statistics As of 31 December 2003. Page: 2.3.3. Norwegian Marine Insurance Statistics As of 31 December 2003. - PowerPoint PPT Presentation
Citation preview
Norwegian Marine Insurance StatisticsAs of 31 December 2003
Page: 2.3.1
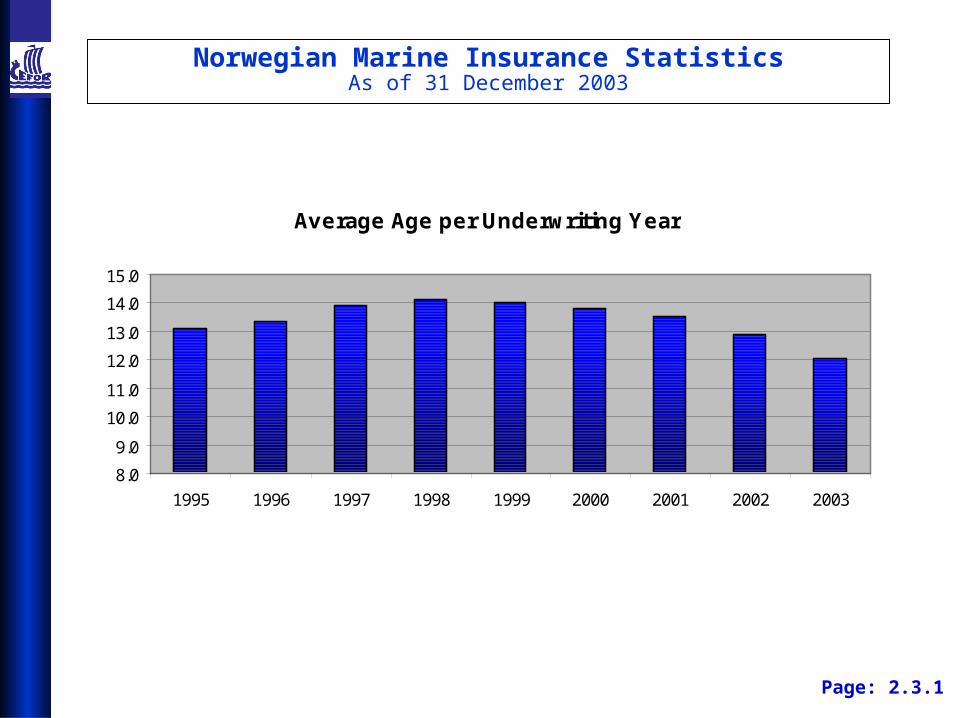
Average Age per Underwriting Year
8.0
9.0
10.0
11.0
12.0
13.0
14.0
15.0
1995 1996 1997 1998 1999 2000 2001 2002 2003
Norwegian Marine Insurance StatisticsAs of 31 December 2003
Page: 2.3.2
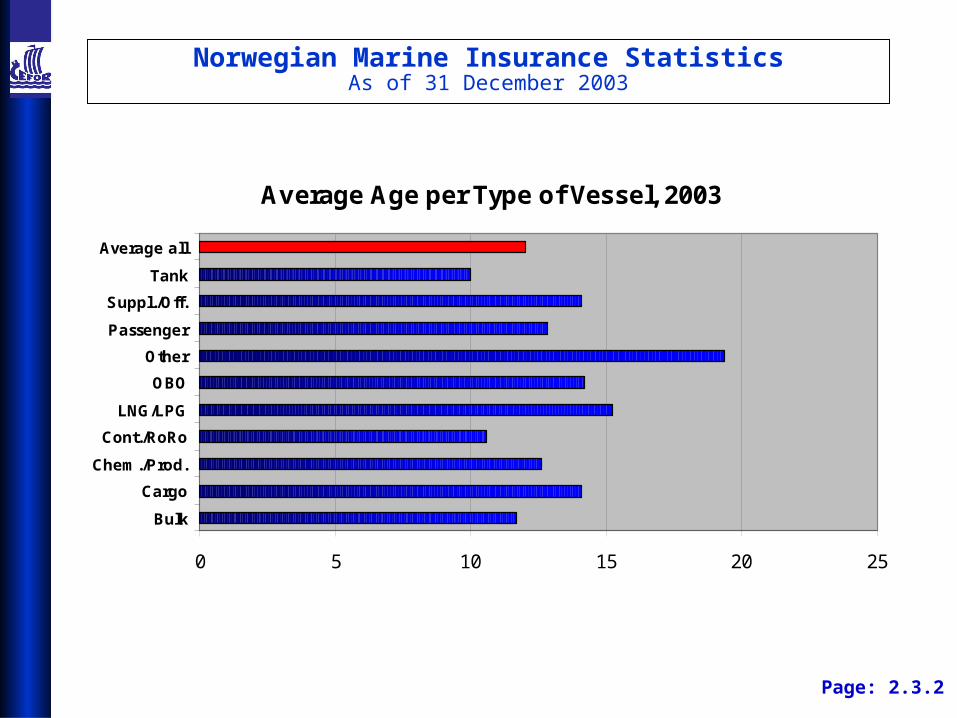
Average Age per Type of Vessel, 2003
0 5 10 15 20 25
Bulk
Cargo
Chem./Prod.
Cont./RoRo
LNG/LPG
OBO
Other
Passenger
Suppl./Off.
Tank
Average all
Norwegian Marine Insurance StatisticsAs of 31 December 2003
Page: 2.3.3
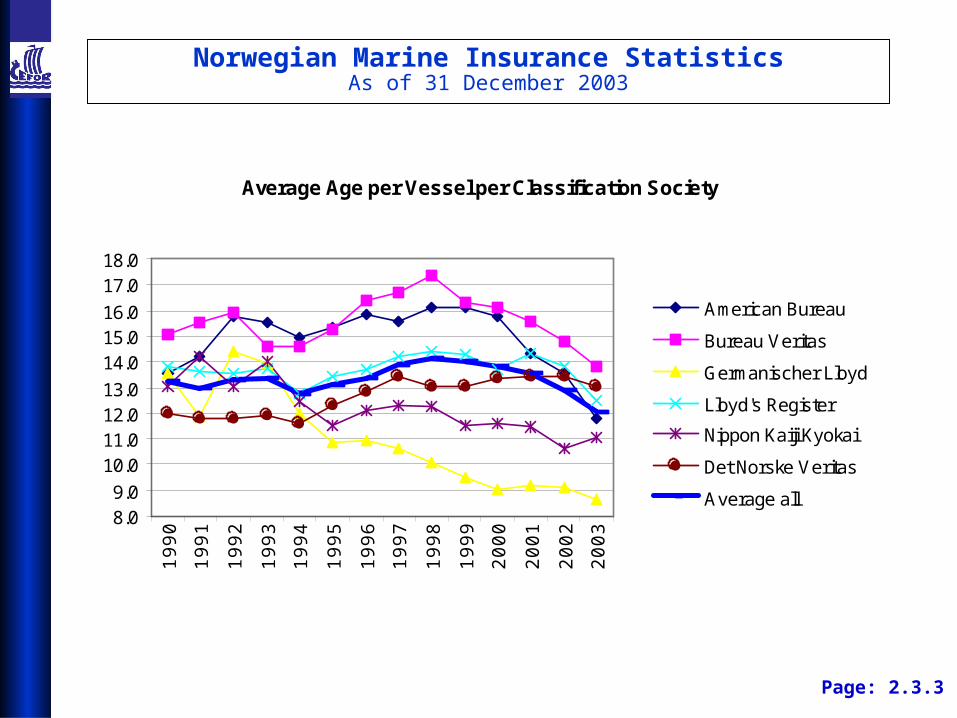
Average Age per Vessel per Classification Society
8.09.0
10.011.012.013.0
14.015.016.0
17.018.0
1990
1991
1992
1993
1994
1995
1996
1997
1998
1999
2000
2001
2002
2003
American Bureau
Bureau Veritas
Germanischer Lloyd
Lloyd's Register
Nippon Kaiji Kyokai
Det Norske Veritas
Average all
Norwegian Marine Insurance StatisticsAs of 31 December 2003
Page: 2.3.4
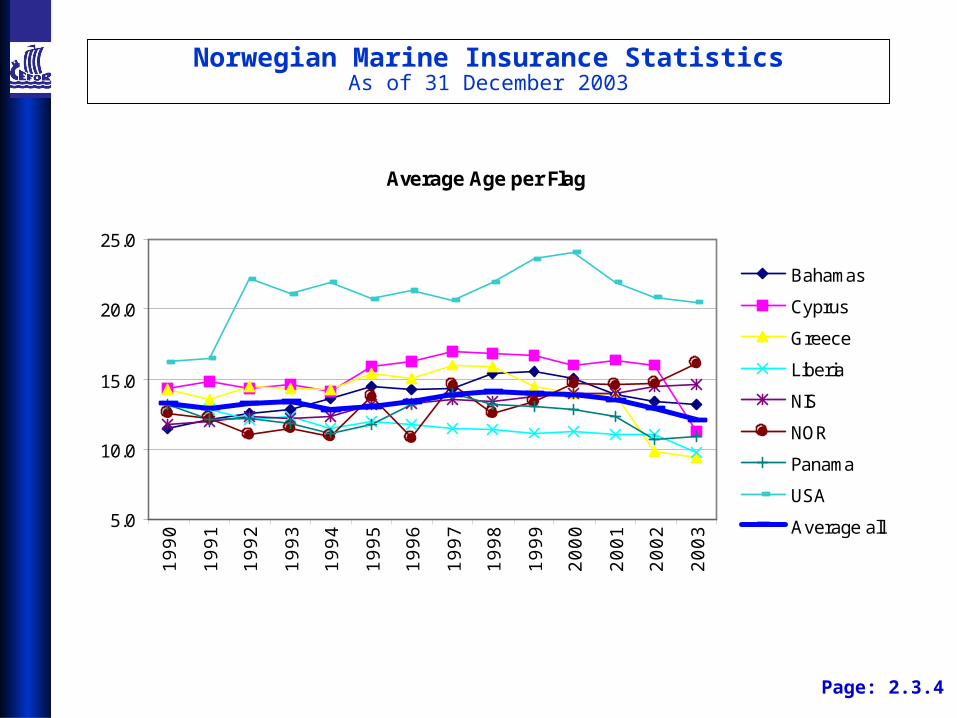
Average Age per Flag
5.0
10.0
15.0
20.0
25.0
1990
1991
1992
1993
1994
1995
1996
1997
1998
1999
2000
2001
2002
2003
Bahamas
Cyprus
Greece
Liberia
NIS
NOR
Panama
USA
Average all
Norwegian Marine Insurance StatisticsAs of 31 December 2003
Page: 2.3.5
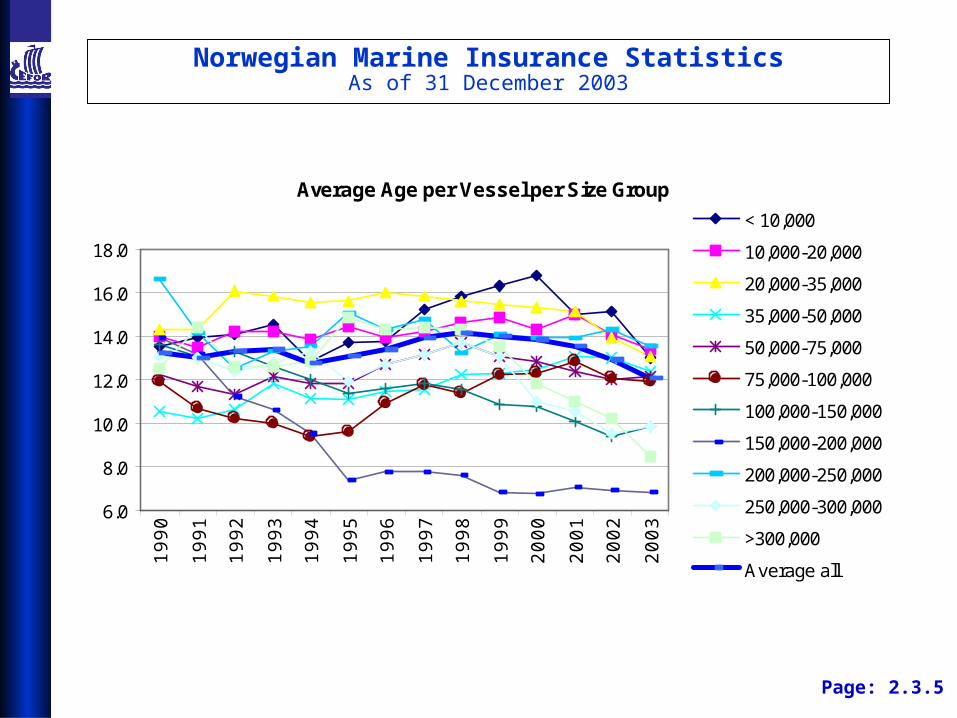
Average Age per Vessel per Size Group
6.0
8.0
10.0
12.0
14.0
16.0
18.0
1990
1991
1992
1993
1994
1995
1996
1997
1998
1999
2000
2001
2002
2003
< 10,000
10,000-20,000
20,000-35,000
35,000-50,000
50,000-75,000
75,000-100,000
100,000-150,000
150,000-200,000
200,000-250,000
250,000-300,000
>300,000
Average all
Norwegian Marine Insurance StatisticsAs of 31 December 2003
Page: 2.3.6
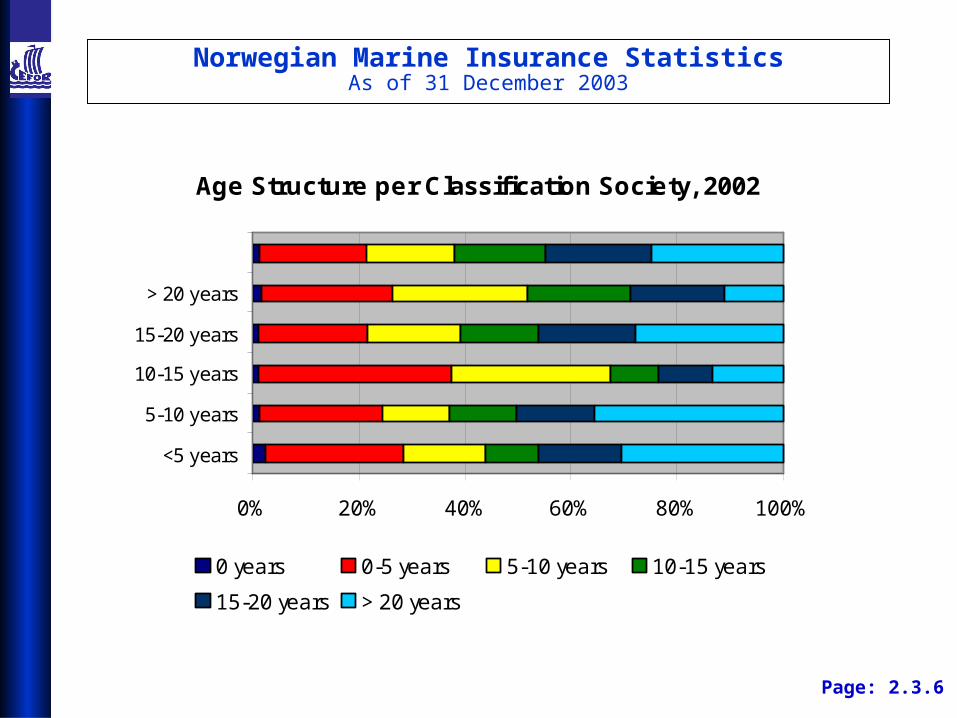
Age Structure per Classification Society, 2002
0% 20% 40% 60% 80% 100%
<5 years
5-10 years
10-15 years
15-20 years
> 20 years
0 years 0-5 years 5-10 years 10-15 years
15-20 years > 20 years
Norwegian Marine Insurance StatisticsAs of 31 December 2003
Page: 3.1.1
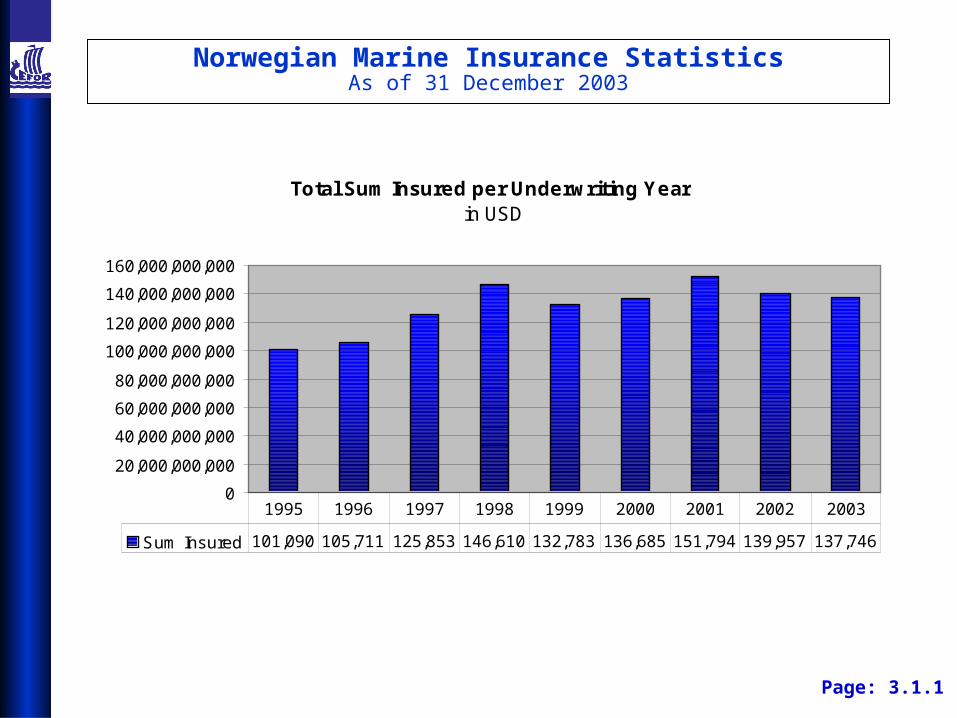
Total Sum Insured per Underwriting Year in USD
0
20,000,000,000
40,000,000,000
60,000,000,000
80,000,000,000
100,000,000,000
120,000,000,000
140,000,000,000
160,000,000,000
Sum Insured 101,090, 105,711, 125,853, 146,610, 132,783, 136,685, 151,794, 139,957, 137,746,
1995 1996 1997 1998 1999 2000 2001 2002 2003
2003
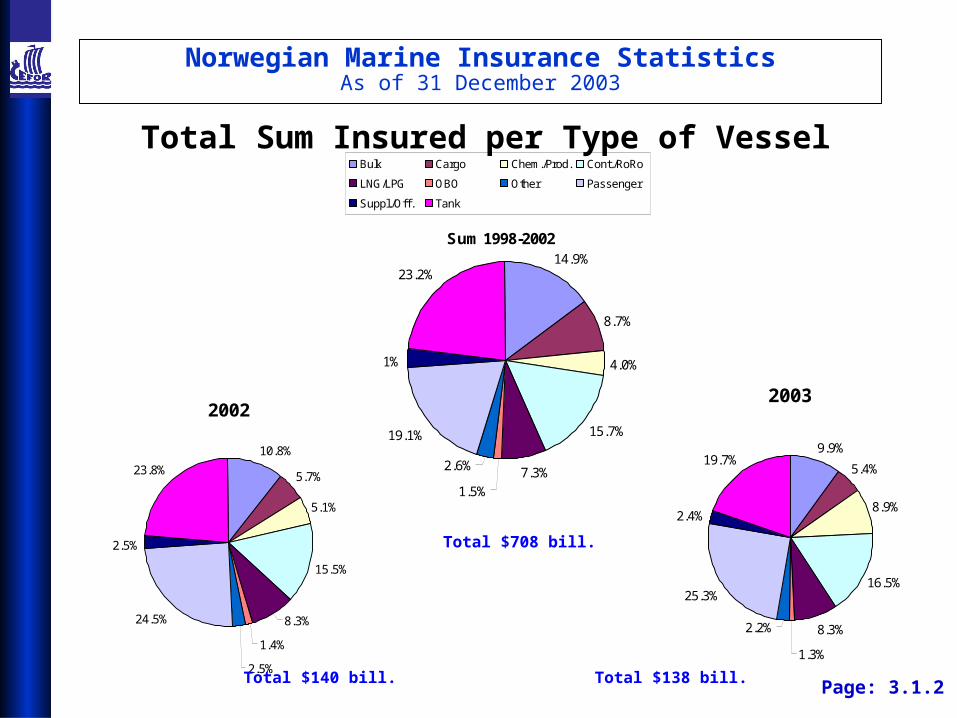
9.9%
5.4%
8.9%
16.5%
8.3%
1.3%
2.2%
25.3%
2.4%
19.7%
Sum 1998-200214.9%
8.7%
4.0%
15.7%
7.3%1.5%
2.6%
19.1%
3.1%
23.2%
Bulk Cargo Chem./Prod. Cont./RoRo
LNG/LPG OBO Other Passenger
Suppl./Off. Tank
2002
10.8%
5.7%
5.1%
15.5%
8.3%
1.4%
2.5%
24.5%
2.5%
23.8%
Norwegian Marine Insurance StatisticsAs of 31 December 2003
Total Sum Insured per Type of Vessel
Total $708 bill.
Total $140 bill. Total $138 bill.Page: 3.1.2
2003
15.3%
9.0%
11.8%
15.8%12.8%
10.5%
11.6%
5.1%
0.4%
4.1%
3.6%2002
15.9%
8.3%
12.7%
15.4%13.0%
10.6%
11.5%
4.6%
0.4%
4.2%
3.5%
Norwegian Marine Insurance StatisticsAs of 31 December 2003
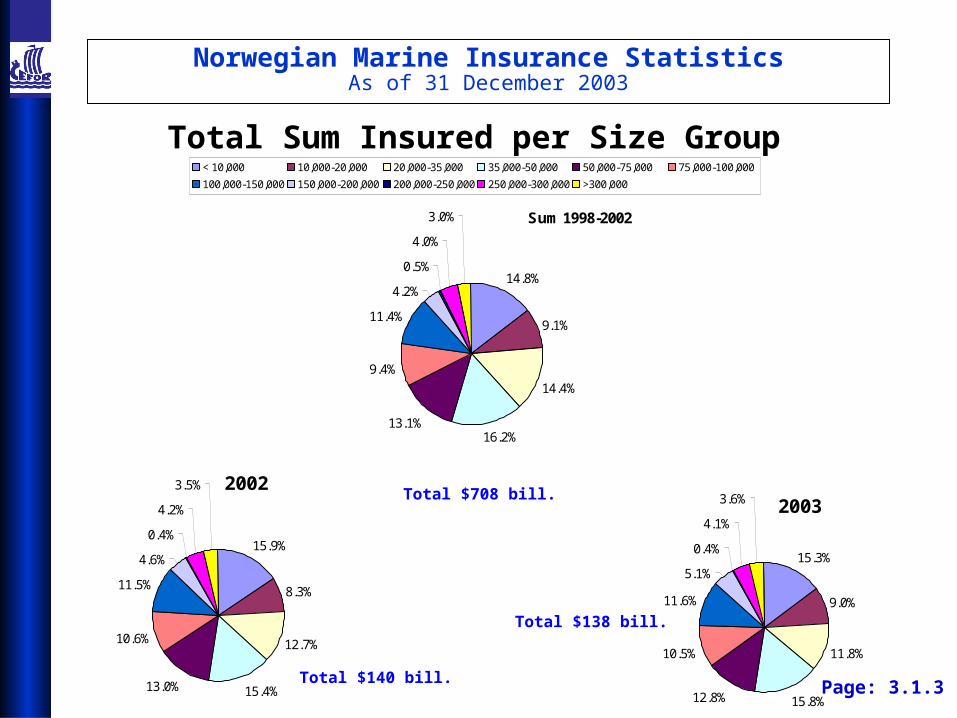
Total Sum Insured per Size Group
Total $708 bill.
Total $140 bill.
Total $138 bill.
Page: 3.1.3
Sum 1998-2002
14.8%
9.1%
14.4%
16.2%13.1%
9.4%
11.4%
4.2%
0.5%
4.0%
3.0%
< 10,000 10,000-20,000 20,000-35,000 35,000-50,000 50,000-75,000 75,000-100,000
100,000-150,000 150,000-200,000 200,000-250,000 250,000-300,000 >300,000
2003
41.1%
27.5%
13.6%
8.6%
9.3%
2002
43.3%
23.2%
13.3%
9.5%
10.7%
Norwegian Marine Insurance StatisticsAs of 31 December 2003
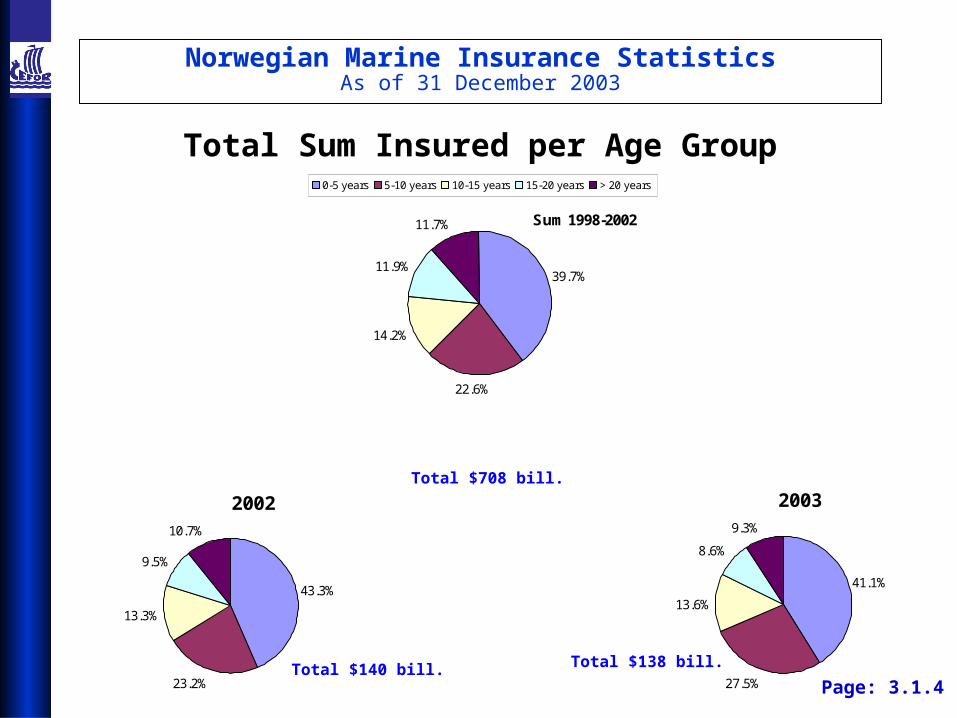
Total Sum Insured per Age Group
Page: 3.1.4
Total $708 bill.
Total $140 bill. Total $138 bill.
Sum 1998-2002
39.7%
22.6%
14.2%
11.9%
11.7%
0-5 years 5-10 years 10-15 years 15-20 years > 20 years
2003
13.8%
3.9%
8.7%
26.4%4.5%
32.8%
9.8%
2002
15.2%
5.0%
6.7%
26.4%6.3%
30.8%
9.6%
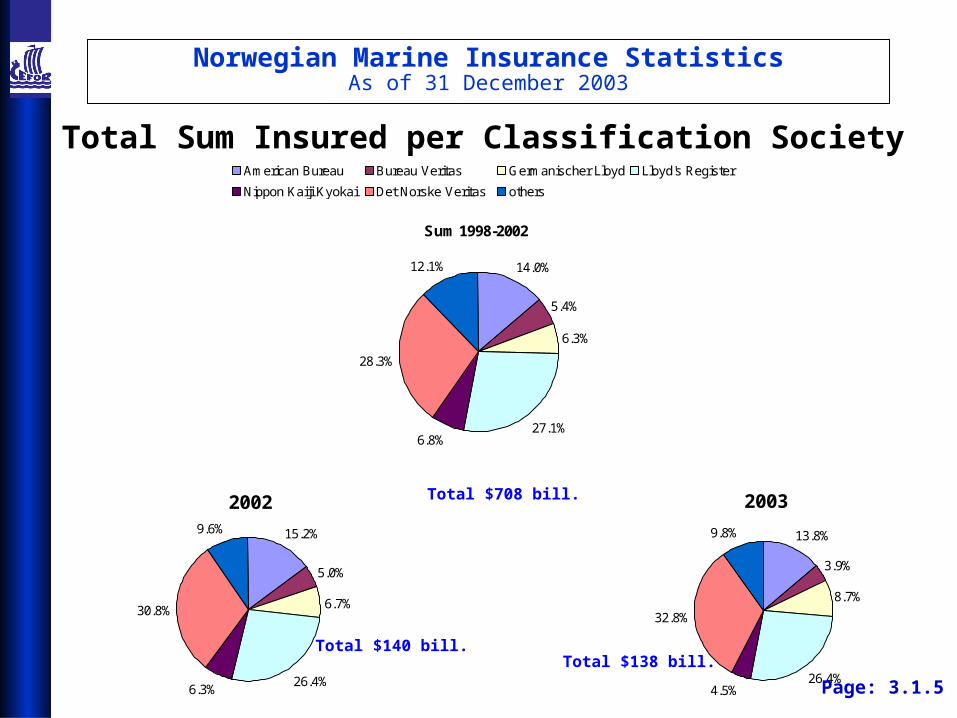
Sum 1998-2002
14.0%
5.4%
6.3%
27.1%6.8%
28.3%
12.1%
American Bureau Bureau Veritas Germanischer Lloyd Lloyd's Register
Nippon Kaiji Kyokai Det Norske Veritas others
Norwegian Marine Insurance StatisticsAs of 31 December 2003
Total Sum Insured per Classification Society
Page: 3.1.5
Total $138 bill.Total $140 bill.
Total $708 bill.
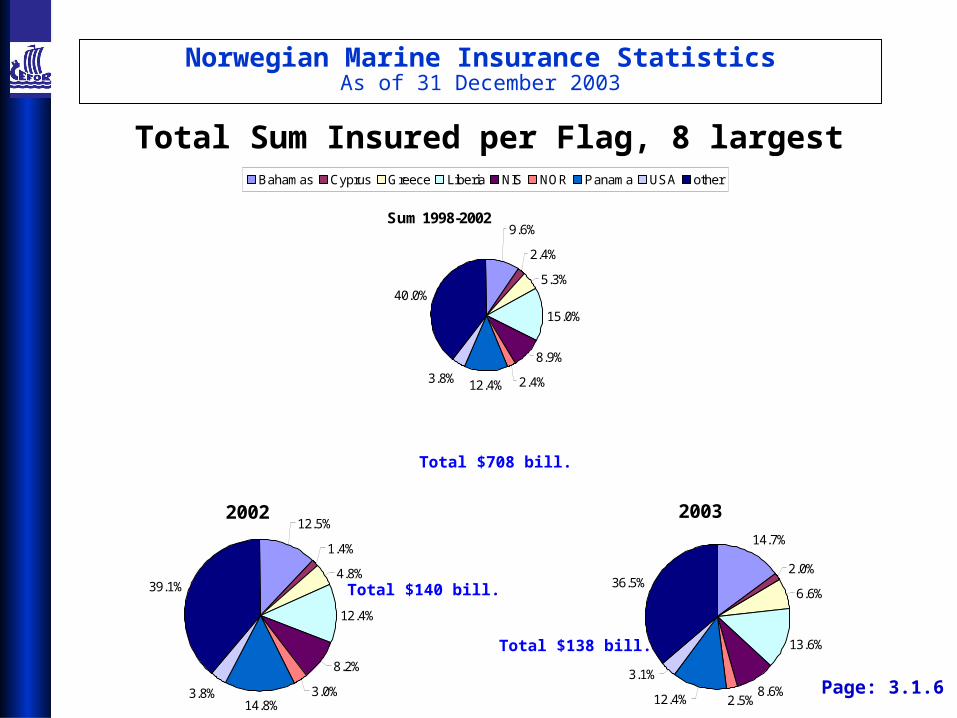
2003
14.7%
2.0%
6.6%
13.6%
8.6%2.5%12.4%
3.1%
36.5%
200212.5%
1.4%
4.8%
12.4%
8.2%
3.0%14.8%
3.8%
39.1%
Norwegian Marine Insurance StatisticsAs of 31 December 2003
Total Sum Insured per Flag, 8 largest
Total $140 bill.
Total $138 bill.
Page: 3.1.6
Total $708 bill.
Sum 1998-20029.6%
2.4%
5.3%
15.0%
8.9%
2.4%12.4%3.8%
40.0%
Bahamas Cyprus Greece Liberia NIS NOR Panama USA other
Norwegian Marine Insurance StatisticsAs of 31 December 2003
Page: 3.2.1
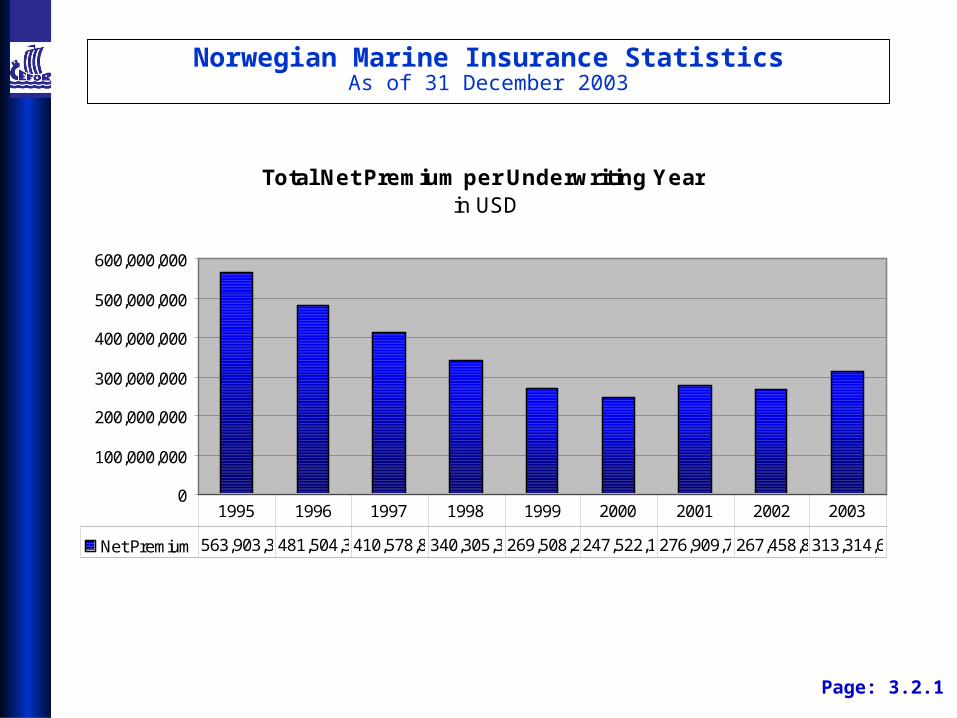
Total Net Premium per Underwriting Year in USD
0
100,000,000
200,000,000
300,000,000
400,000,000
500,000,000
600,000,000
Net Premium 563,903,3 481,504,3410,578,8 340,305,3 269,508,2247,522,1 276,909,7 267,458,8313,314,6
1995 1996 1997 1998 1999 2000 2001 2002 2003
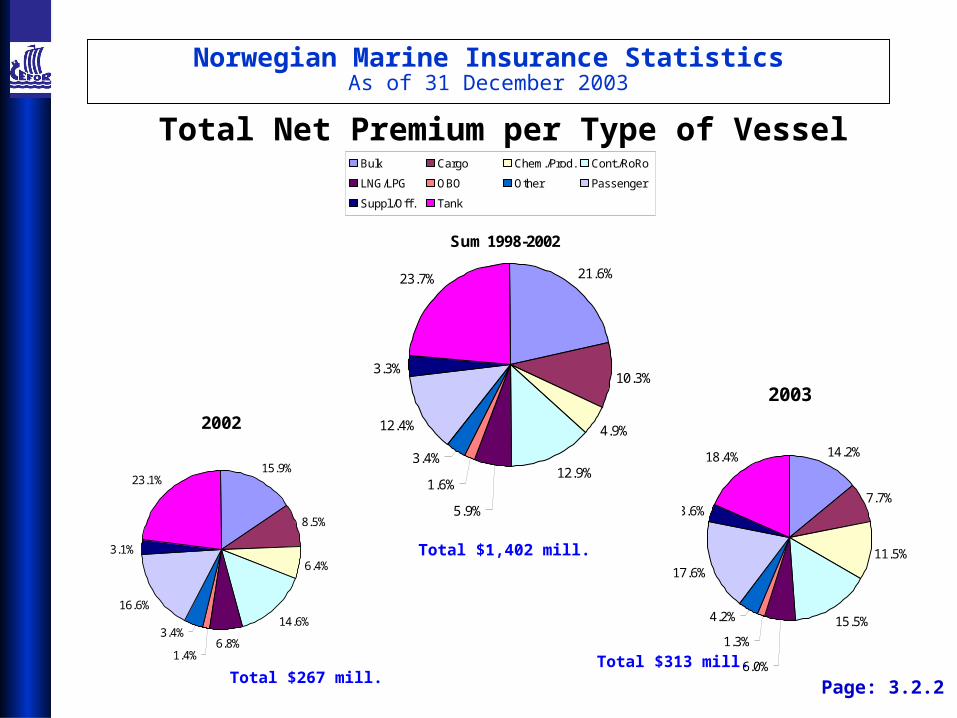
2003
14.2%
7.7%
11.5%
15.5%
6.0%
1.3%
4.2%
17.6%
3.6%
18.4%
Sum 1998-2002
21.6%
10.3%
4.9%
12.9%
5.9%
1.6%
3.4%
12.4%
3.3%
23.7%
Bulk Cargo Chem./Prod. Cont./RoRo
LNG/LPG OBO Other Passenger
Suppl./Off. Tank
2002
15.9%
8.5%
6.4%
14.6%
6.8%1.4%
3.4%
16.6%
3.1%
23.1%
Norwegian Marine Insurance StatisticsAs of 31 December 2003
Total Net Premium per Type of Vessel
Total $267 mill.Page: 3.2.2
Total $1,402 mill.
Total $313 mill.
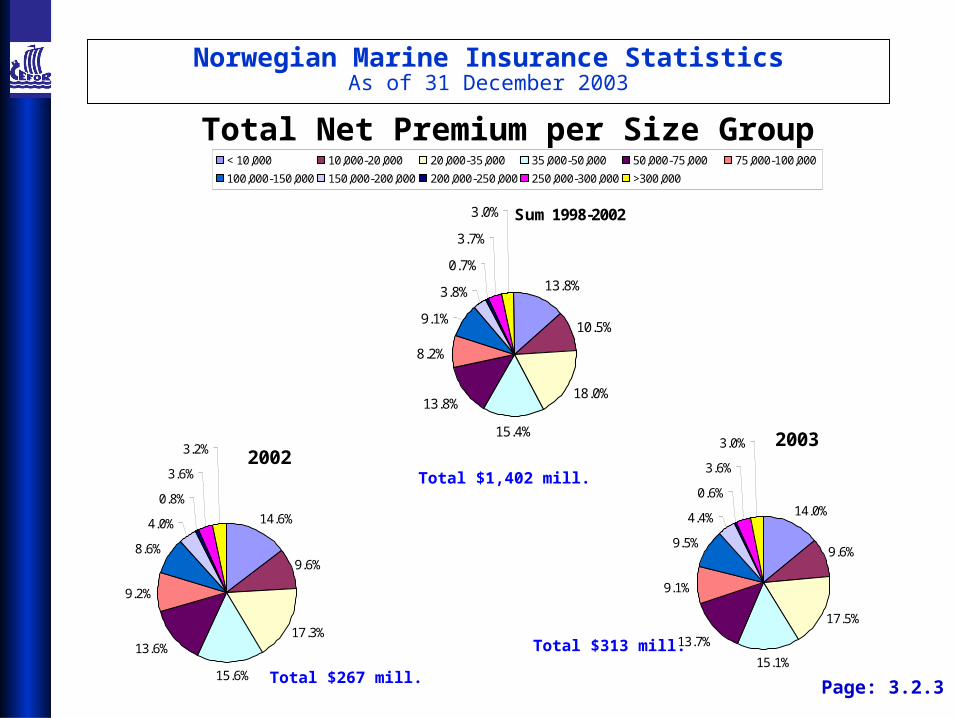
Sum 1998-2002
13.8%
10.5%
18.0%
15.4%
13.8%
8.2%
9.1%
3.8%
0.7%
3.7%
3.0%
< 10,000 10,000-20,000 20,000-35,000 35,000-50,000 50,000-75,000 75,000-100,000
100,000-150,000 150,000-200,000 200,000-250,000 250,000-300,000 >300,000
2003
14.0%
9.6%
17.5%
15.1%
13.7%
9.1%
9.5%
4.4%
0.6%
3.6%
3.0%2002
14.6%
9.6%
17.3%
15.6%
13.6%
9.2%
8.6%
4.0%
0.8%
3.6%
3.2%
Norwegian Marine Insurance StatisticsAs of 31 December 2003
Total Net Premium per Size Group
Total $1,402 mill.
Total $313 mill.
Page: 3.2.3Total $267 mill.
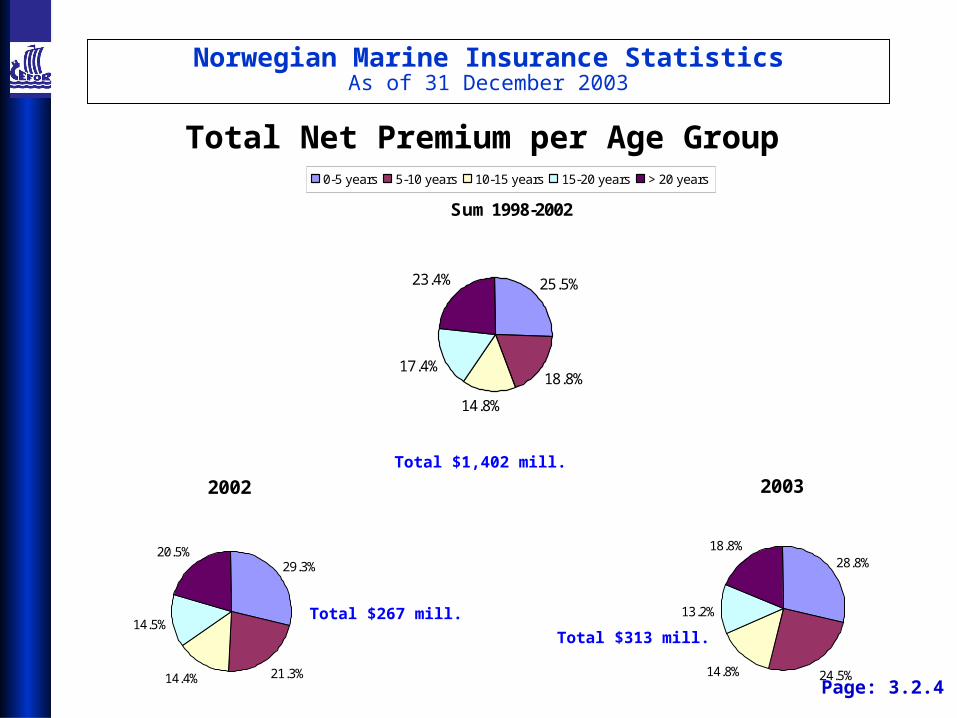
2003
28.8%
24.5%14.8%
13.2%
18.8%
2002
29.3%
21.3%14.4%
14.5%
20.5%
Sum 1998-2002
25.5%
18.8%
14.8%
17.4%
23.4%
0-5 years 5-10 years 10-15 years 15-20 years > 20 years
Norwegian Marine Insurance StatisticsAs of 31 December 2003
Total Net Premium per Age Group
Page: 3.2.4
Total $267 mill.
Total $313 mill.
Total $1,402 mill.
2003
13.8%
4.3%
8.9%
22.1%5.5%
36.4%
8.9%
2002
15.3%
5.6%
7.8%
22.6%7.4%
32.0%
9.3%
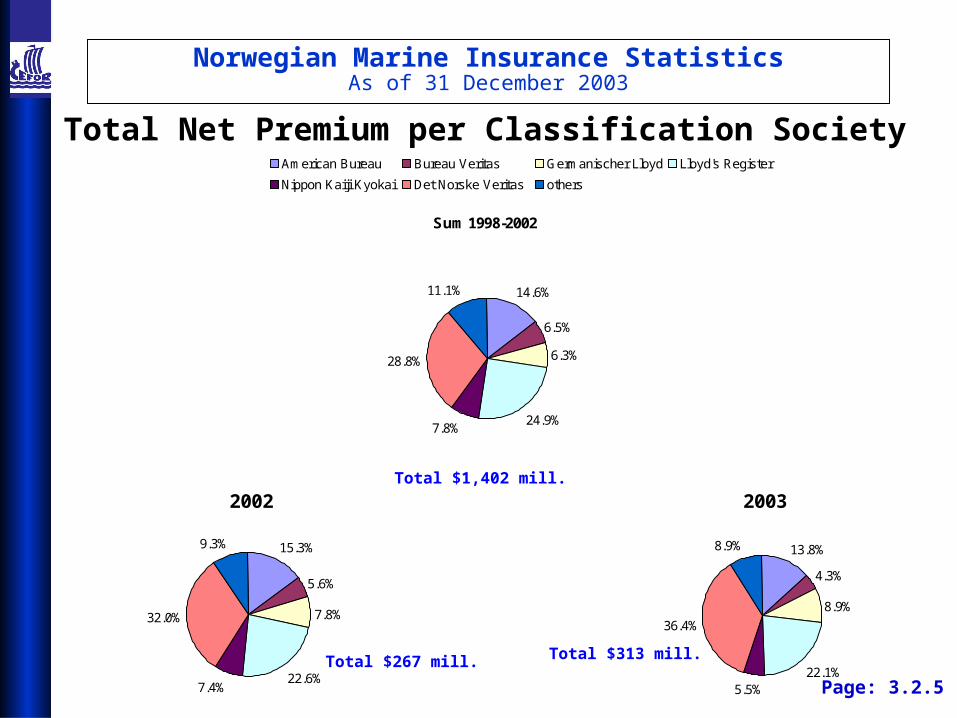
Sum 1998-2002
14.6%
6.5%
6.3%
24.9%7.8%
28.8%
11.1%
American Bureau Bureau Veritas Germanischer Lloyd Lloyd's Register
Nippon Kaiji Kyokai Det Norske Veritas others
Norwegian Marine Insurance StatisticsAs of 31 December 2003
Total Net Premium per Classification Society
Total $313 mill.Total $267 mill.
Page: 3.2.5
Total $1,402 mill.
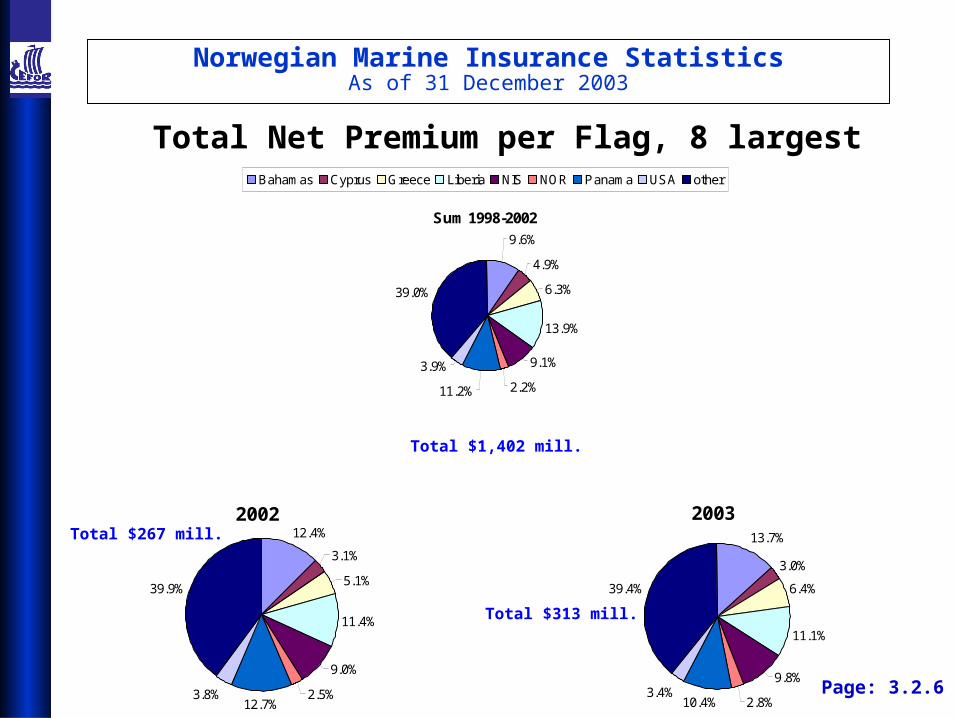
200313.7%
3.0%
6.4%
11.1%
9.8%
2.8%10.4%3.4%
39.4%
200212.4%
3.1%
5.1%
11.4%
9.0%
2.5%12.7%
3.8%
39.9%
Norwegian Marine Insurance StatisticsAs of 31 December 2003
Total Net Premium per Flag, 8 largest
Total $313 mill.
Total $1,402 mill.
Page: 3.2.6
Total $267 mill.
Sum 1998-2002
9.6%
4.9%
6.3%
13.9%
9.1%
2.2%11.2%
3.9%
39.0%
Bahamas Cyprus Greece Liberia NIS NOR Panama USA other


![The Definitive Guide To Marine Business Statistics []When ...The Definitive Guide To Marine Business Statistics AUGUST 2009 A By the numbers, the marine industry has seen better days](https://img.pdfslide.net/doc/110x75/6104cdd47d1ebb42d02268fe/the-definitive-guide-to-marine-business-statistics-when-the-definitive-guide.jpg)