Embed Size (px)
Citation preview
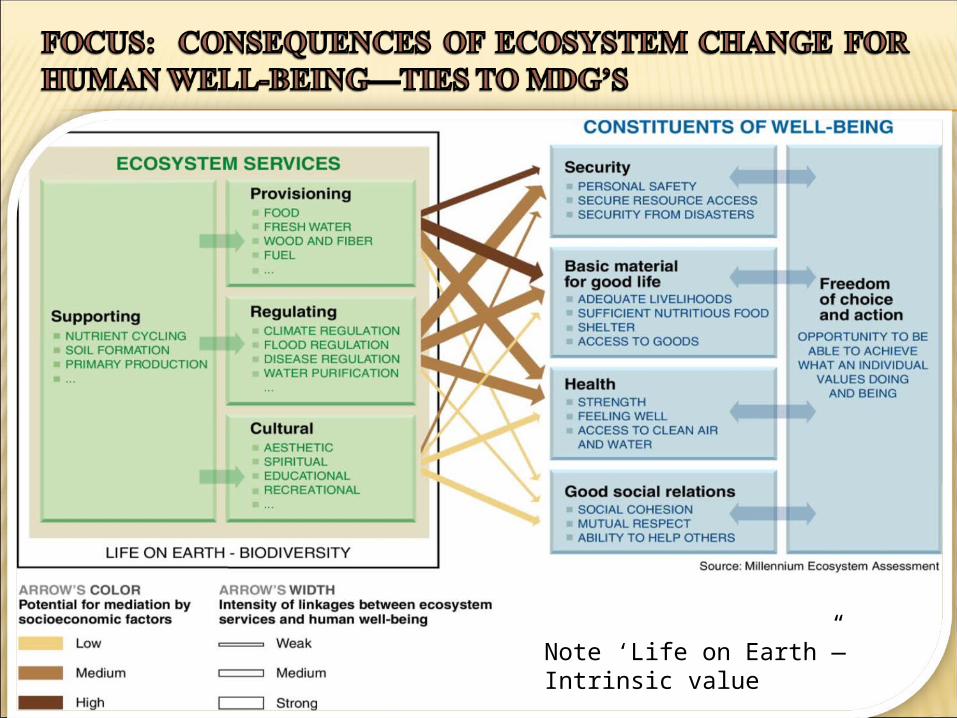
Note ‘Life on Earth”—Intrinsic value
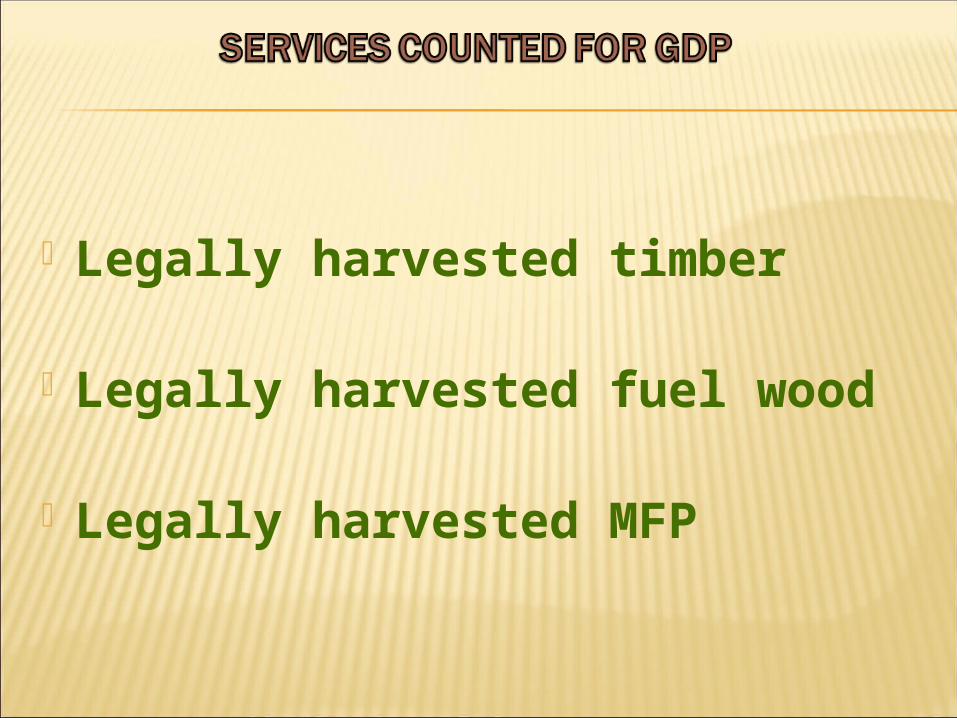
Legally harvested timber
Legally harvested fuel wood
Legally harvested MFP
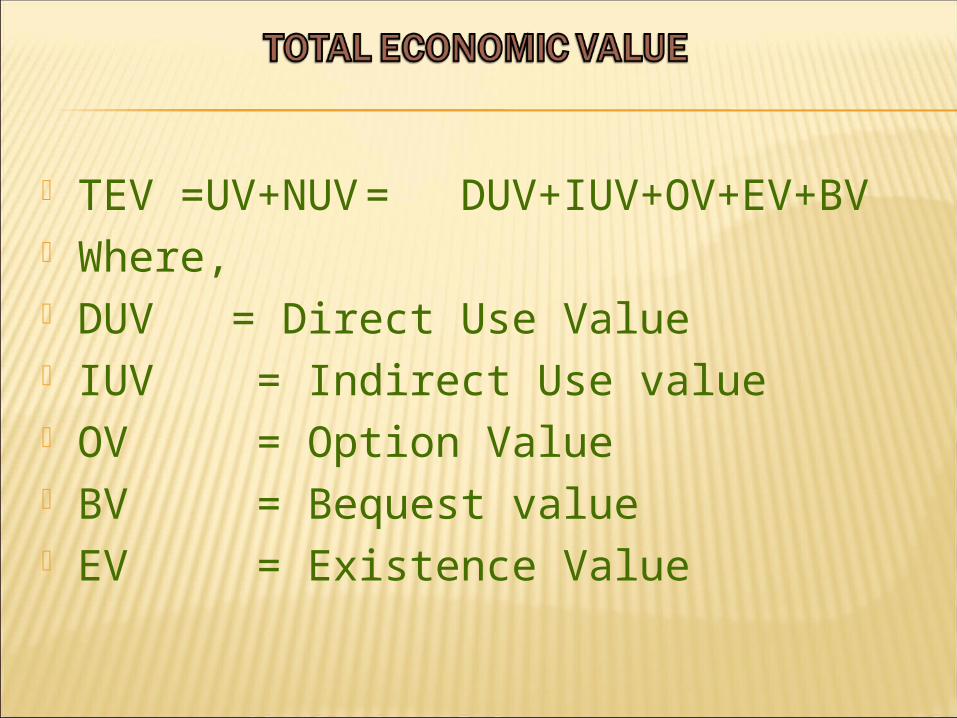
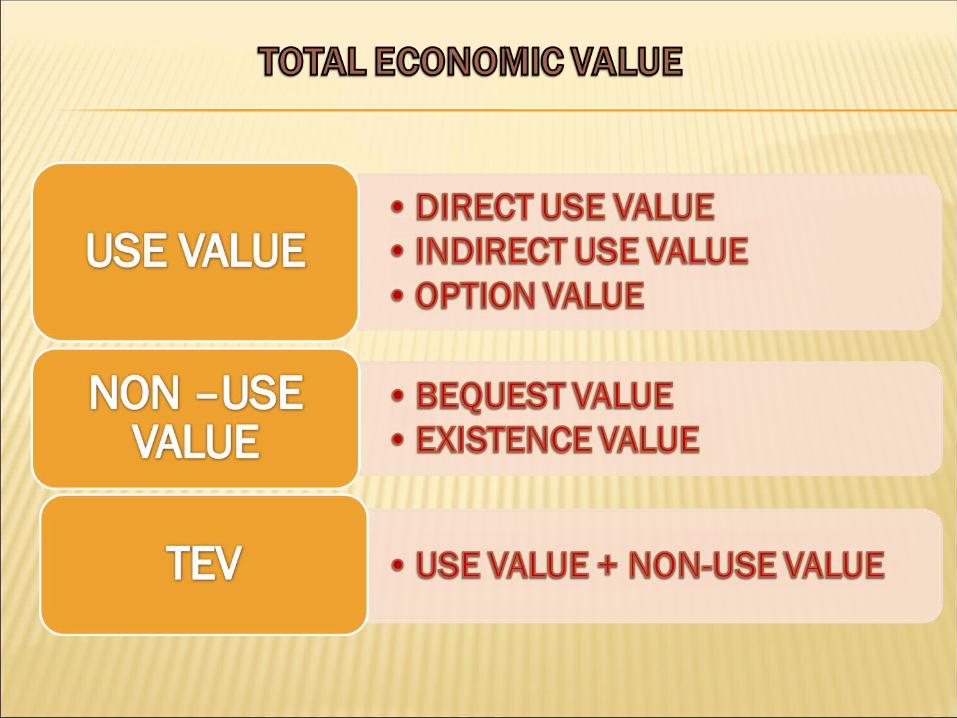
TEV =UV+NUV =DUV+IUV+OV+EV+BV
Where, DUV = Direct Use Value IUV = Indirect Use value OV = Option Value BV = Bequest value EV = Existence Value
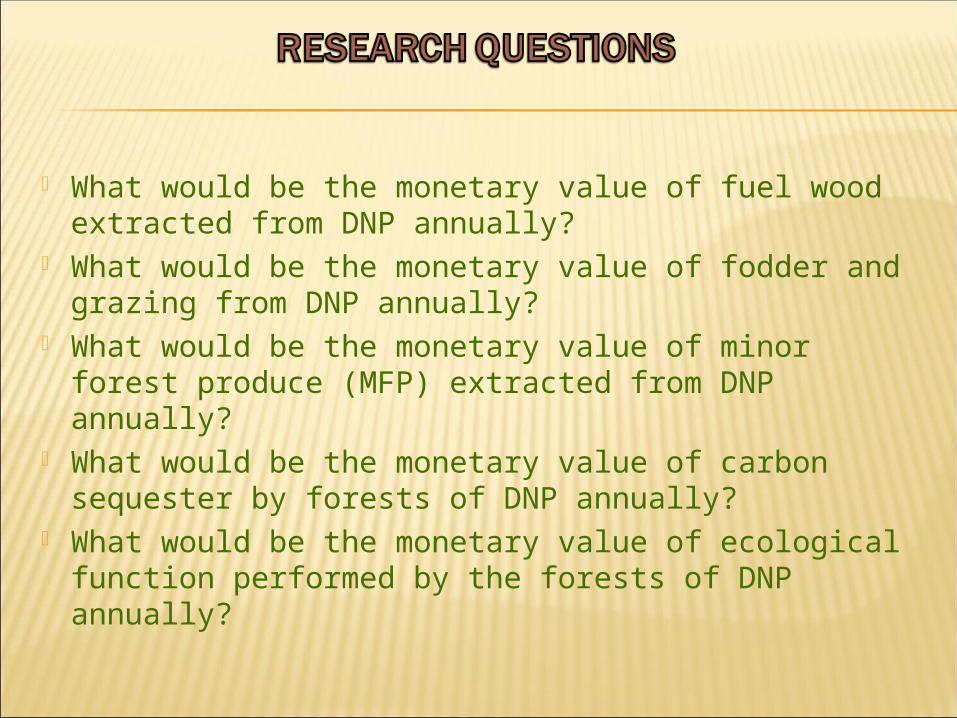
What would be the monetary value of fuel wood extracted from DNP annually?
What would be the monetary value of fodder and grazing from DNP annually?
What would be the monetary value of minor forest produce (MFP) extracted from DNP annually?
What would be the monetary value of carbon sequester by forests of DNP annually?
What would be the monetary value of ecological function performed by the forests of DNP annually?
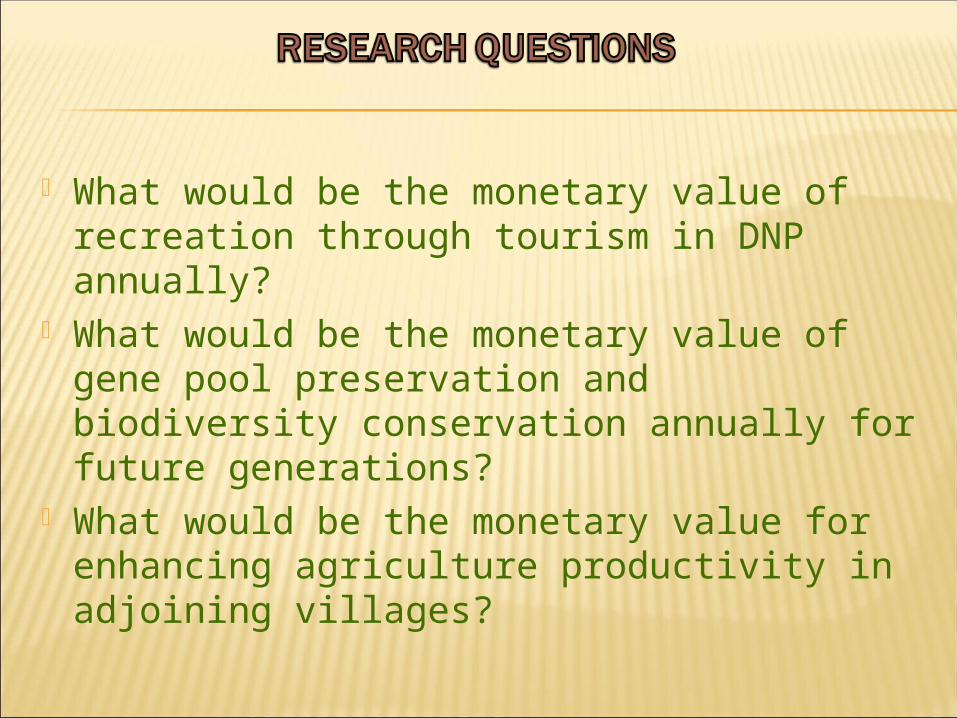
What would be the monetary value of recreation through tourism in DNP annually?
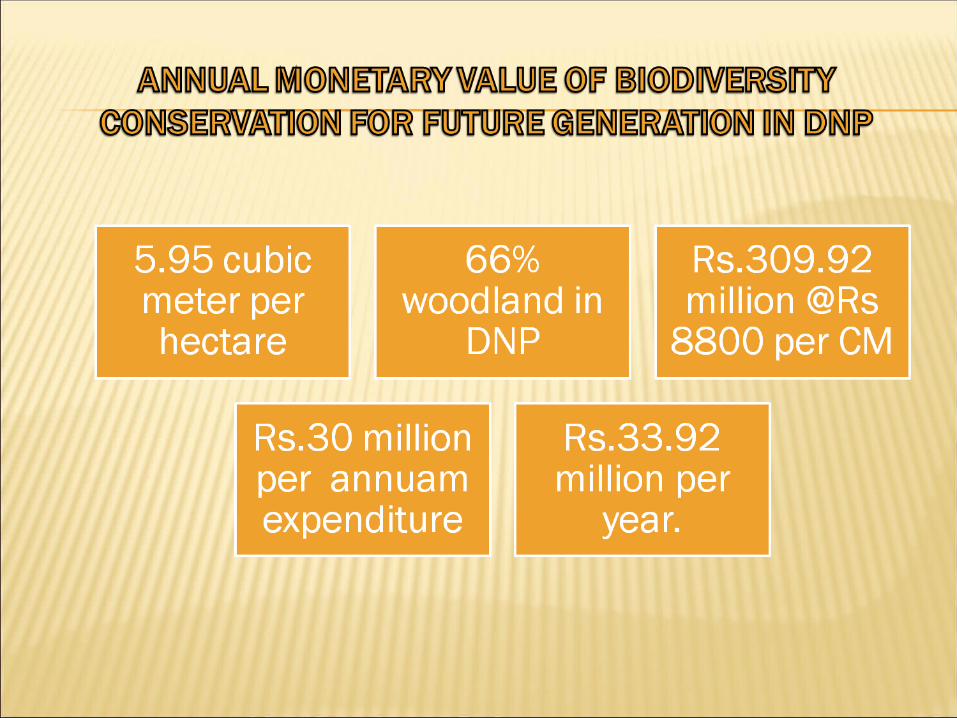
What would be the monetary value of gene pool preservation and biodiversity conservation annually for future generations?
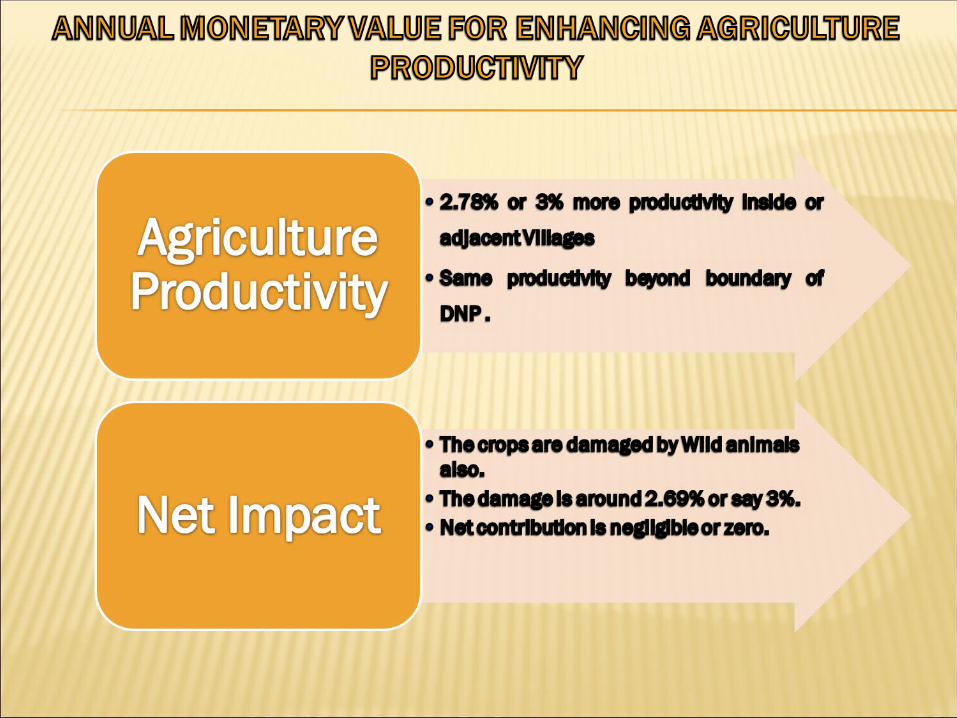
What would be the monetary value for enhancing agriculture productivity in adjoining villages?
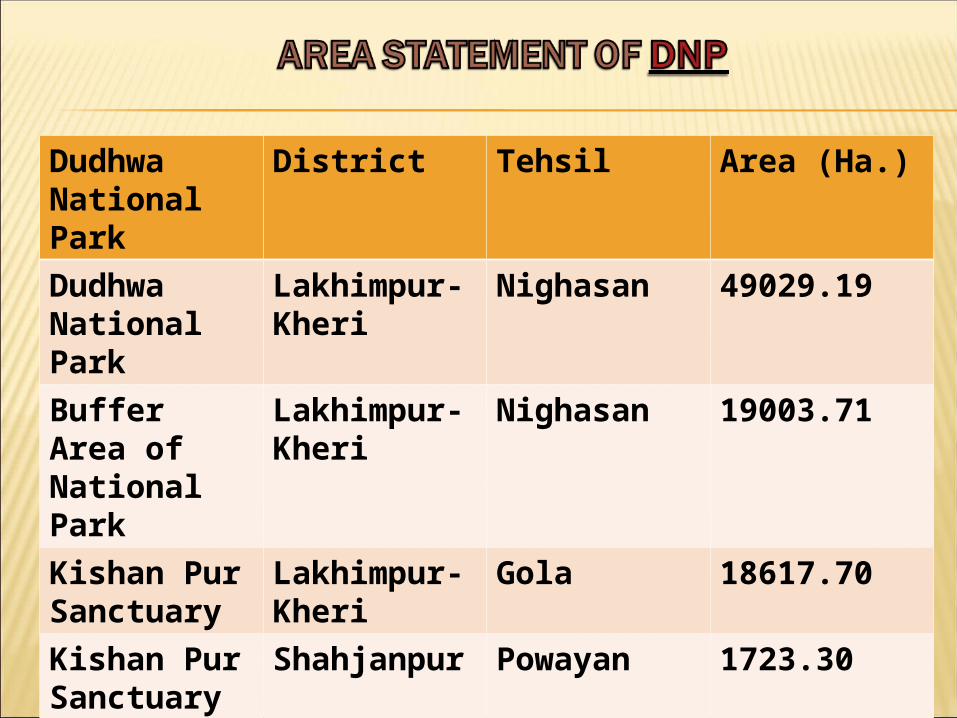
Dudhwa National Park
District Tehsil Area (Ha.)
Dudhwa National Park
Lakhimpur-Kheri
Nighasan 49029.19
Buffer Area of National Park
Lakhimpur-Kheri
Nighasan 19003.71
Kishan Pur Sanctuary
Lakhimpur-Kheri
Gola 18617.70
Kishan Pur Sanctuary
Shahjanpur
Powayan 1723.30
Total 88373.90
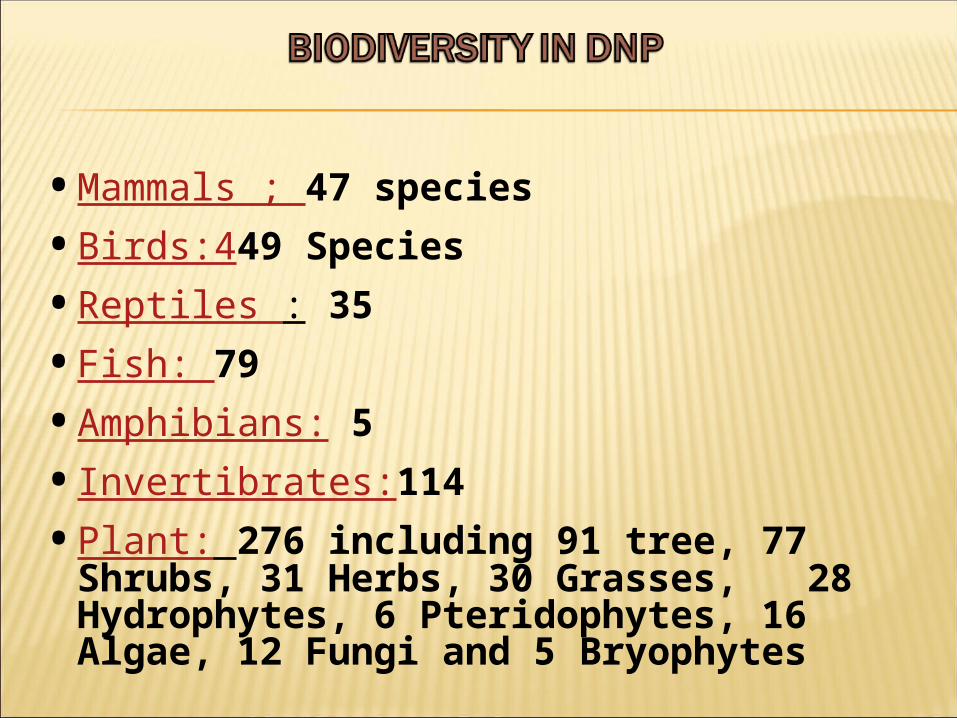
• Mammals ; 47 species
• Birds:449 Species
• Reptiles : 35
• Fish: 79
• Amphibians: 5
• Invertibrates:114
• Plant: 276 including 91 tree, 77 Shrubs, 31 Herbs, 30 Grasses, 28 Hydrophytes, 6 Pteridophytes, 16 Algae, 12 Fungi and 5 Bryophytes
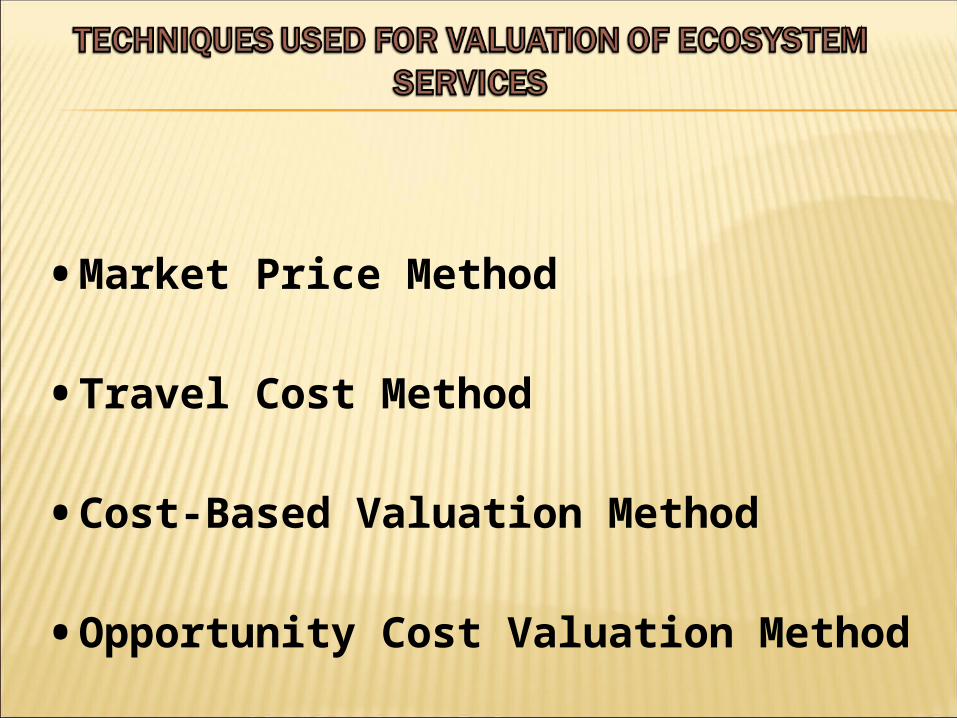
• Market Price Method
• Travel Cost Method
• Cost-Based Valuation Method
• Opportunity Cost Valuation Method
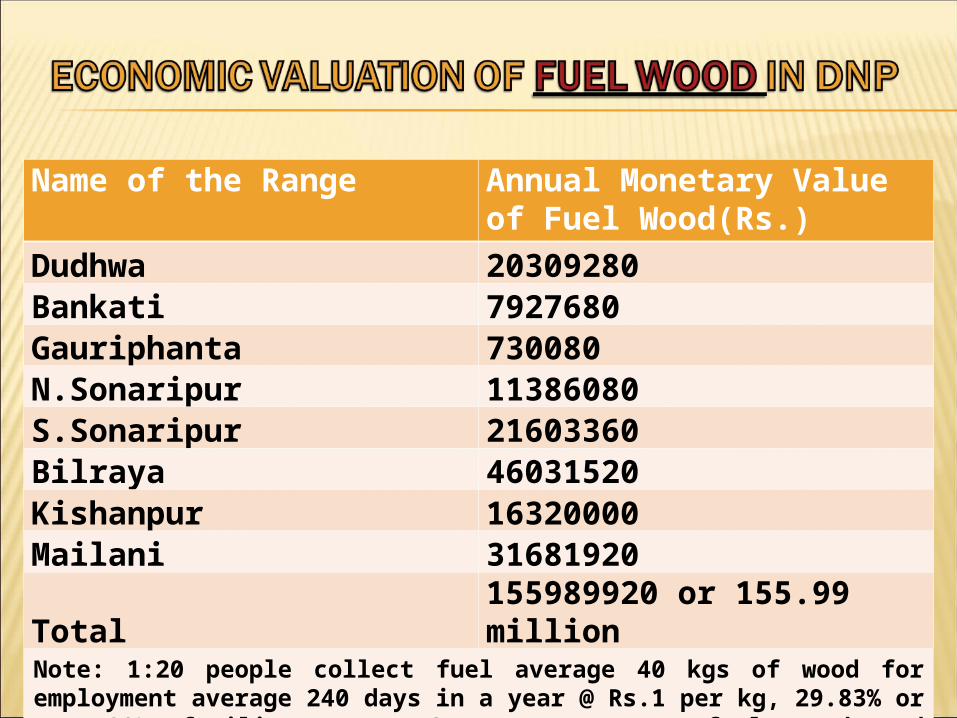
Name of the Range Annual Monetary Value of Fuel Wood(Rs.)
Dudhwa 20309280Bankati 7927680Gauriphanta 730080N.Sonaripur 11386080S.Sonaripur 21603360Bilraya 46031520Kishanpur 16320000Mailani 31681920Total 155989920 or 155.99 millionNote: 1:20 people collect fuel average 40 kgs of wood for employment average 240 days in a year @ Rs.1 per kg, 29.83% or say 30% families use LPG, Rest consume fuel wood and agriculture waste for cooking .
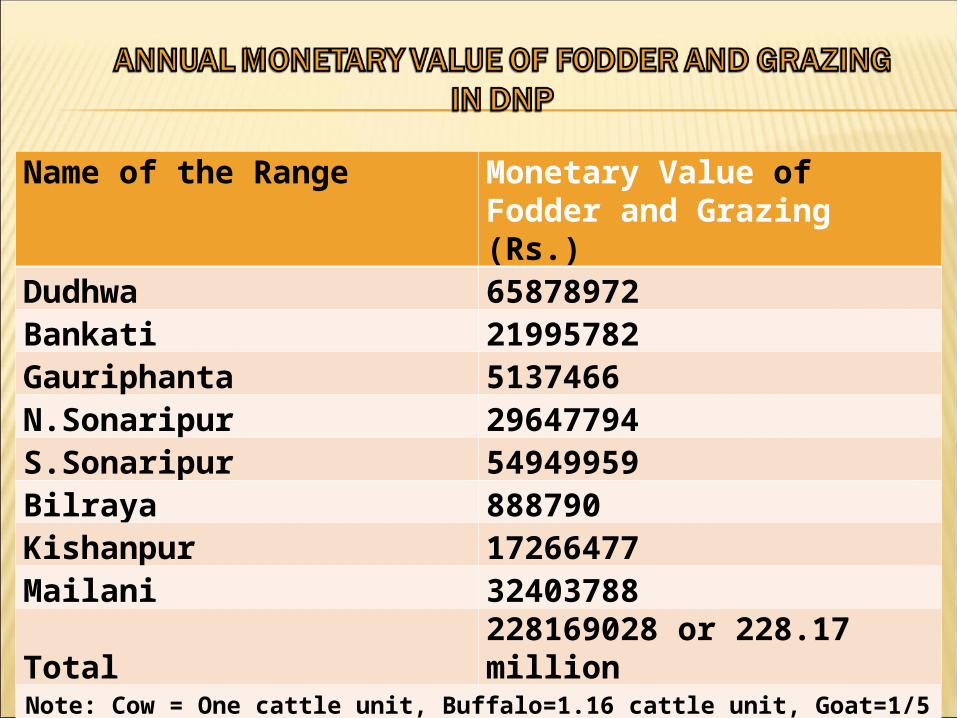
Name of the Range Monetary Value of Fodder and Grazing (Rs.)
Dudhwa 65878972Bankati 21995782Gauriphanta 5137466N.Sonaripur 29647794S.Sonaripur 54949959Bilraya 888790Kishanpur 17266477Mailani 32403788Total 228169028 or 228.17 millionNote: Cow = One cattle unit, Buffalo=1.16 cattle unit, Goat=1/5 cattle unit, Requirement =35 kgs/day, 2/3 stall feeding, fodder @Rs.2 per kg
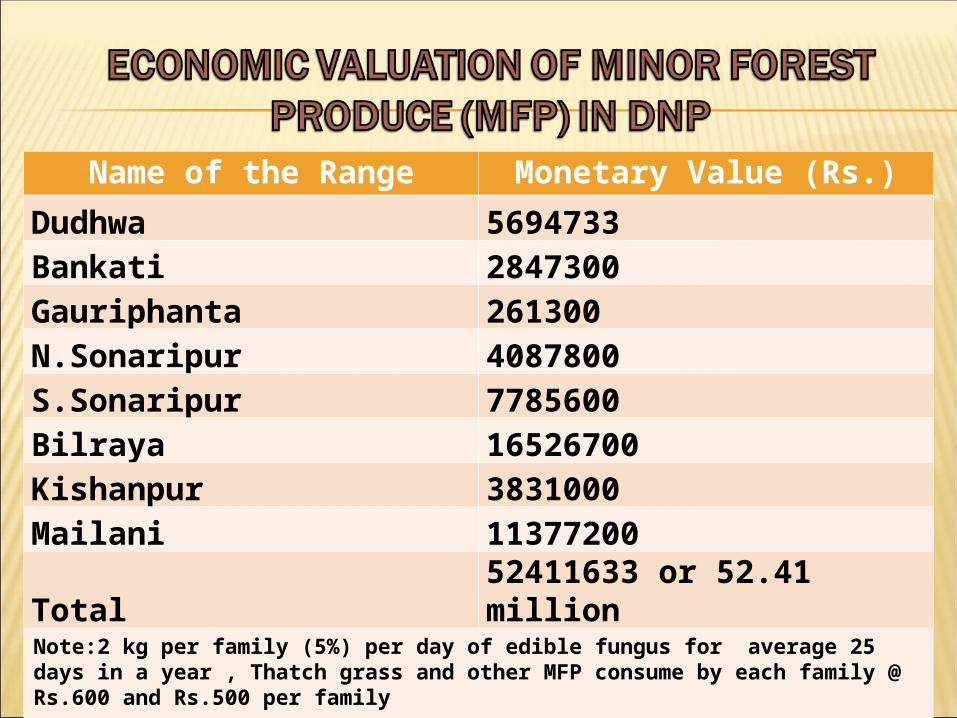
Name of the Range Monetary Value (Rs.)
Dudhwa 5694733Bankati 2847300Gauriphanta 261300N.Sonaripur 4087800S.Sonaripur 7785600Bilraya 16526700Kishanpur 3831000Mailani 11377200Total 52411633 or 52.41 millionNote:2 kg per family (5%) per day of edible fungus for average 25 days in a year , Thatch grass and other MFP consume by each family @ Rs.600 and Rs.500 per family
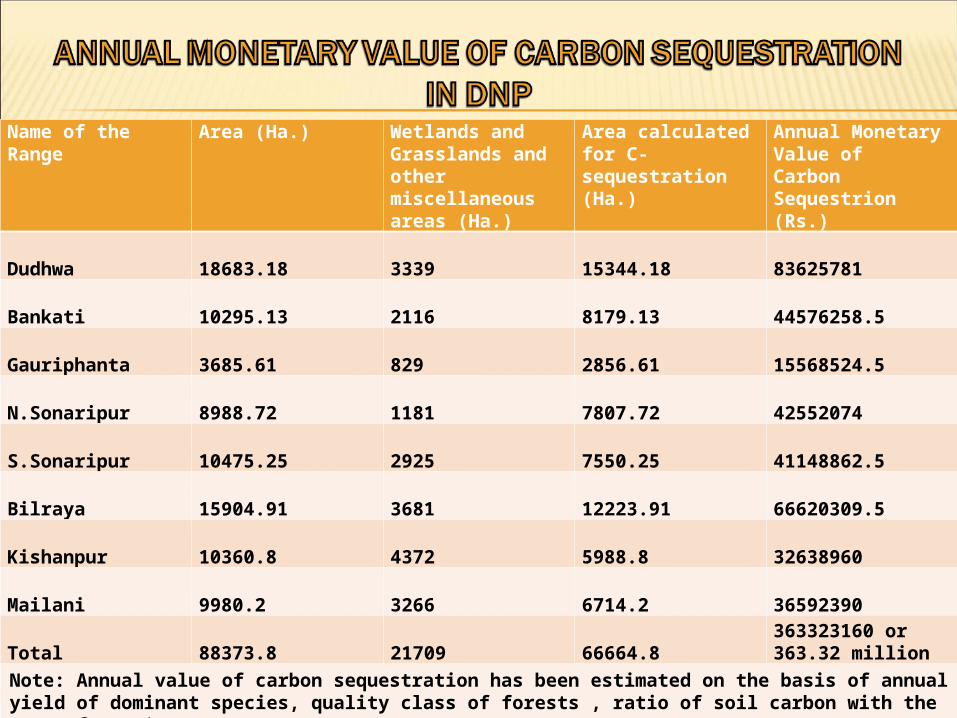
Name of the Range Area (Ha.) Wetlands and Grasslands and other miscellaneous areas (Ha.)
Area calculated for C-sequestration (Ha.)
Annual Monetary Value of Carbon Sequestrion (Rs.)
Dudhwa 18683.18 3339 15344.18 83625781
Bankati 10295.13 2116 8179.13 44576258.5
Gauriphanta 3685.61 829 2856.61 15568524.5
N.Sonaripur 8988.72 1181 7807.72 42552074
S.Sonaripur 10475.25 2925 7550.25 41148862.5
Bilraya 15904.91 3681 12223.91 66620309.5
Kishanpur 10360.8 4372 5988.8 32638960
Mailani 9980.2 3266 6714.2 36592390
Total 88373.8 21709 66664.8363323160 or 363.32 million
Note: Annual value of carbon sequestration has been estimated on the basis of annual yield of dominant species, quality class of forests , ratio of soil carbon with the rate of 20US$ per Tonne .
21
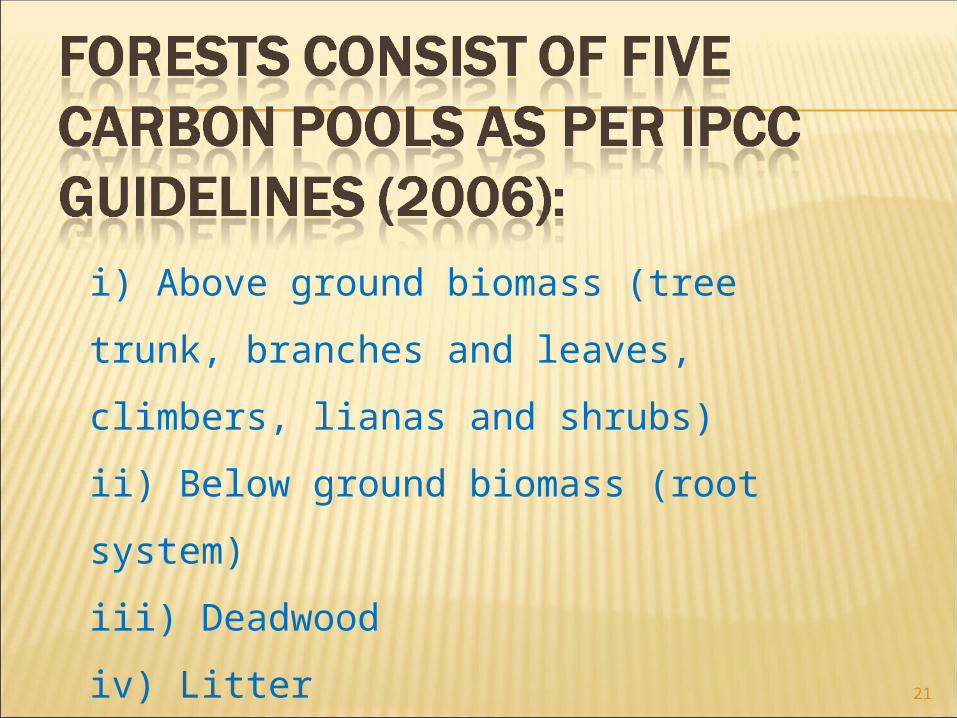
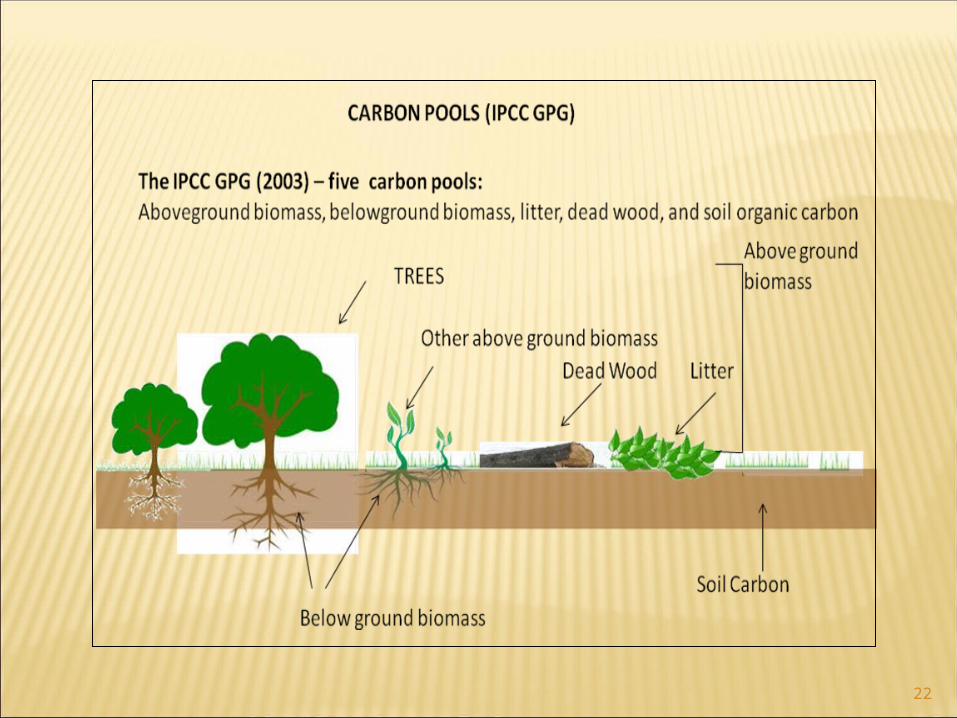
i) Above ground biomass (tree trunk, branches
and leaves, climbers, lianas and shrubs)
ii) Below ground biomass (root system)
iii) Deadwood
iv) Litter
v) Soil organic matter /soil carbon
22
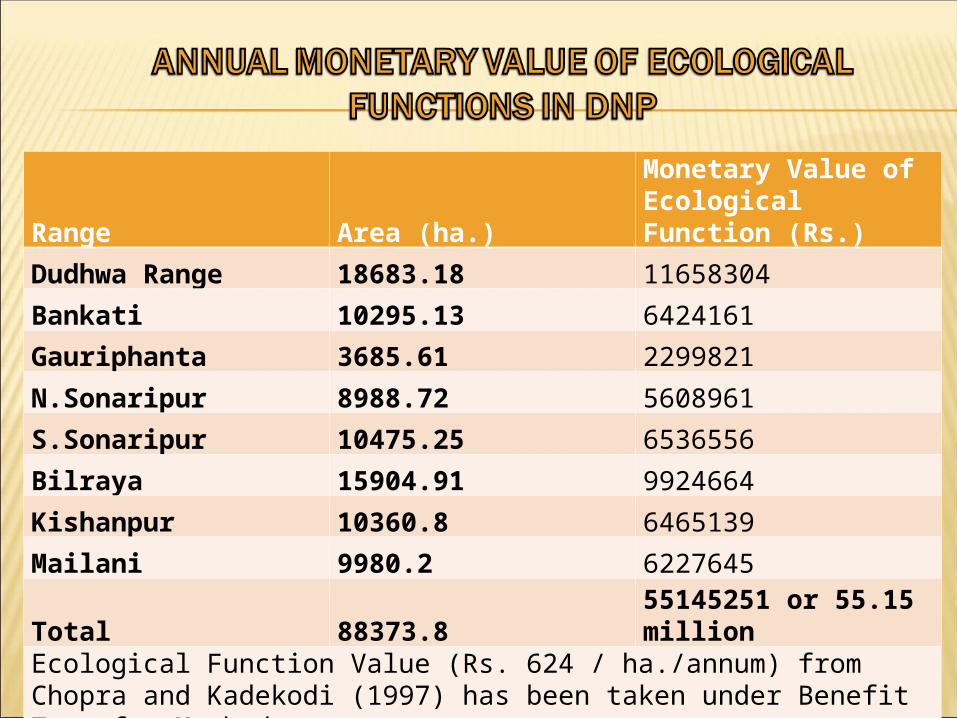
Range Area (ha.)Monetary Value of Ecological Function (Rs.)
Dudhwa Range 18683.18 11658304
Bankati 10295.13 6424161
Gauriphanta 3685.61 2299821
N.Sonaripur 8988.72 5608961
S.Sonaripur 10475.25 6536556
Bilraya 15904.91 9924664
Kishanpur 10360.8 6465139
Mailani 9980.2 6227645
Total 88373.8 55145251 or 55.15 millionEcological Function Value (Rs. 624 / ha./annum) from Chopra and Kadekodi (1997) has been taken under Benefit Transfer Method.
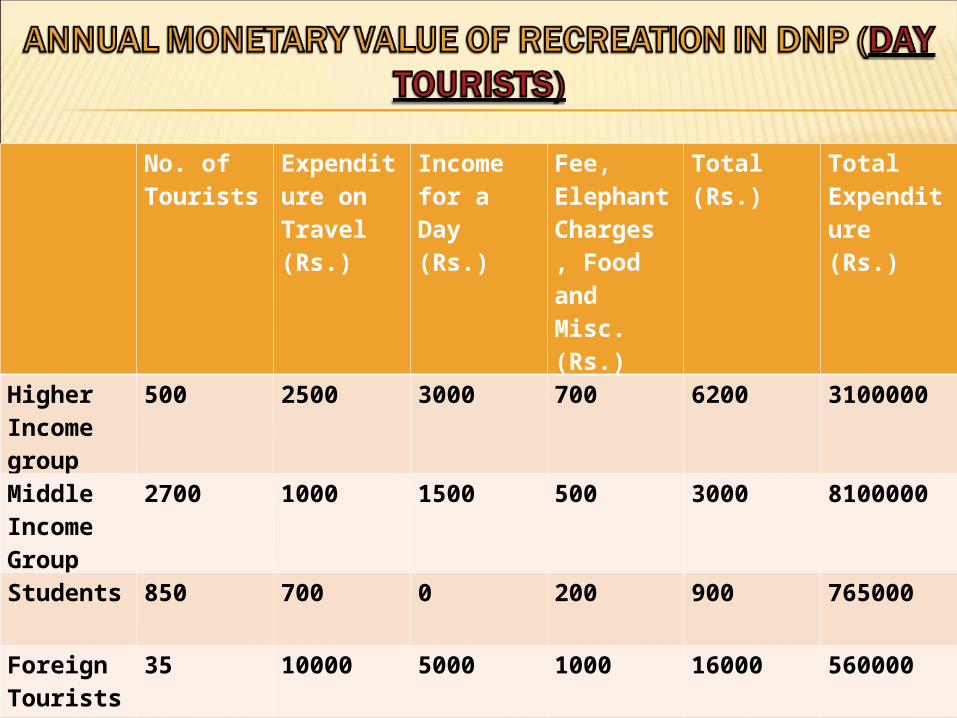
No. of Tourists
Expenditure on Travel (Rs.)
Income for a Day (Rs.)
Fee, Elephant Charges , Food and Misc. (Rs.)
Total (Rs.) Total Expenditure (Rs.)
Higher Income group
500 2500 3000 700 6200 3100000
Middle Income Group
2700 1000 1500 500 3000 8100000
Students 850 700 0 200 900 765000
Foreign Tourists
35 10000 5000 1000 16000 560000
Total 4085 14200 9500 2400 26100 12525000
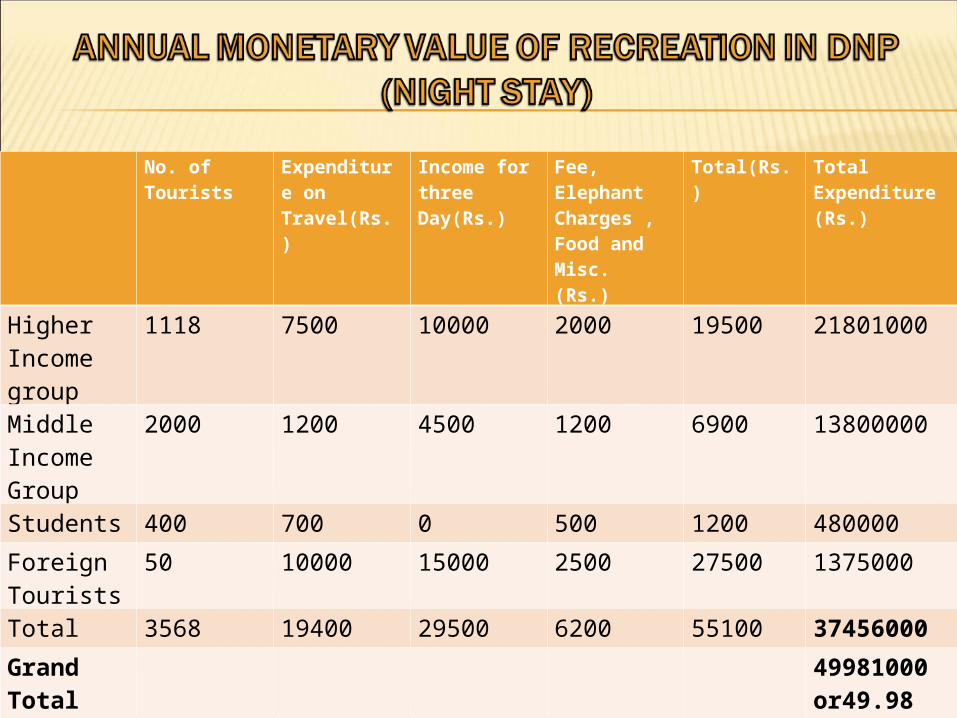
No. of Tourists Expenditure on Travel(Rs.)
Income for three Day(Rs.)
Fee, Elephant Charges , Food and Misc. (Rs.)
Total(Rs.) Total Expenditure (Rs.)
Higher Income group
1118 7500 10000 2000 19500 21801000
Middle Income Group
2000 1200 4500 1200 6900 13800000
Students 400 700 0 500 1200 480000
Foreign Tourists
50 10000 15000 2500 27500 1375000
Total 3568 19400 29500 6200 55100 37456000
Grand Total 49981000 or49.98 million
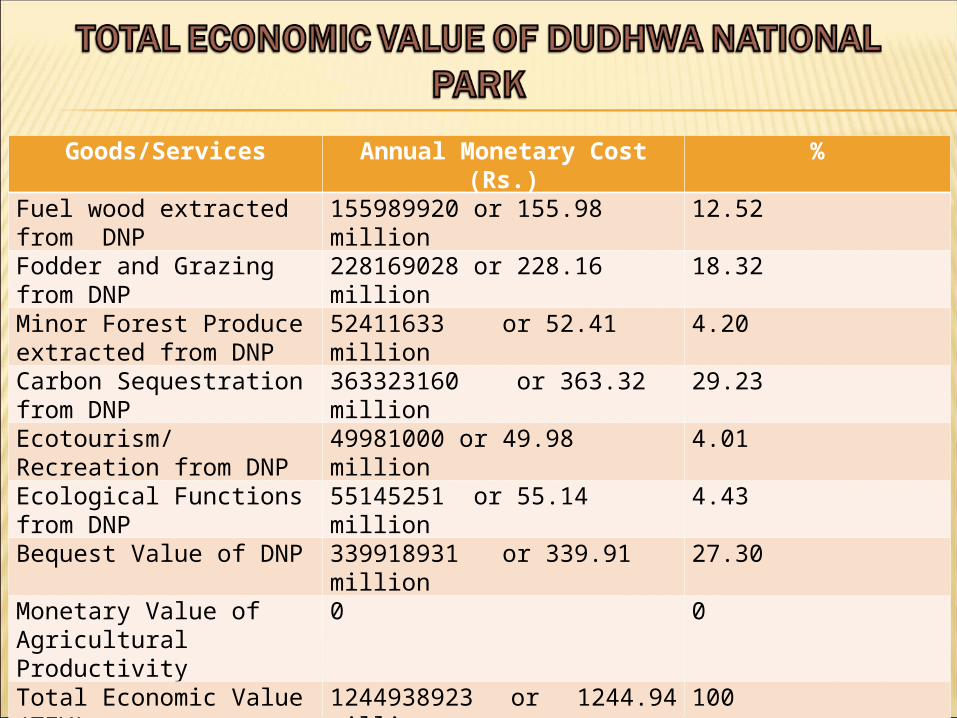
Goods/Services Annual Monetary Cost (Rs.)
%
Fuel wood extracted from DNP
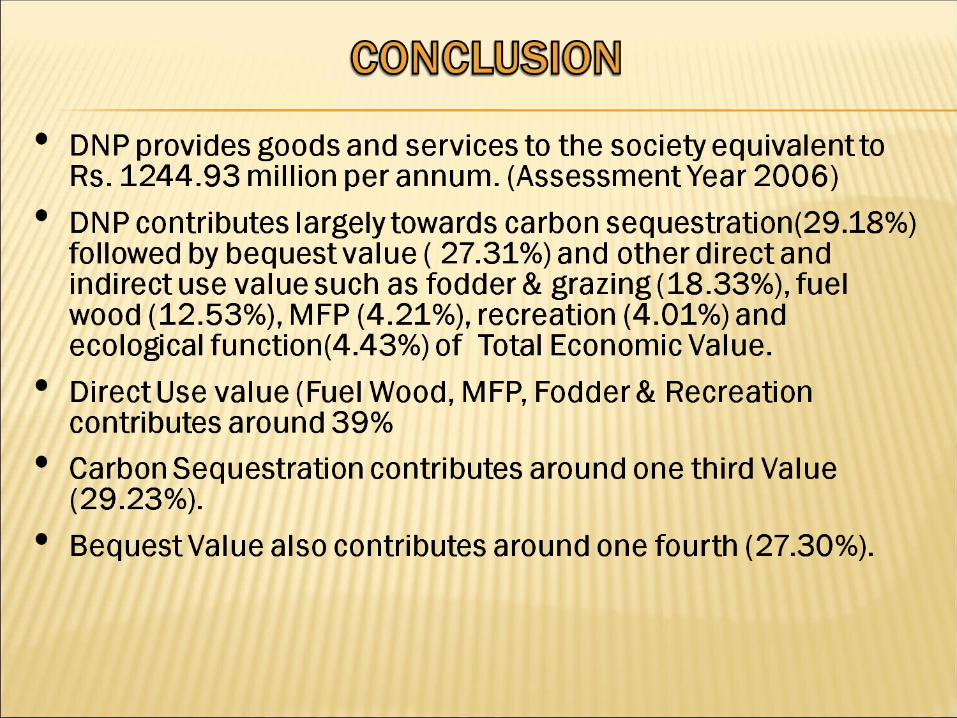
155989920 or 155.98 million
12.52
Fodder and Grazing from DNP
228169028 or 228.16 million
18.32
Minor Forest Produce extracted from DNP
52411633 or 52.41 million 4.20
Carbon Sequestration from DNP
363323160 or 363.32 million
29.23
Ecotourism/Recreation from DNP
49981000 or 49.98 million 4.01
Ecological Functions from DNP
55145251 or 55.14 million 4.43
Bequest Value of DNP 339918931 or 339.91 million
27.30
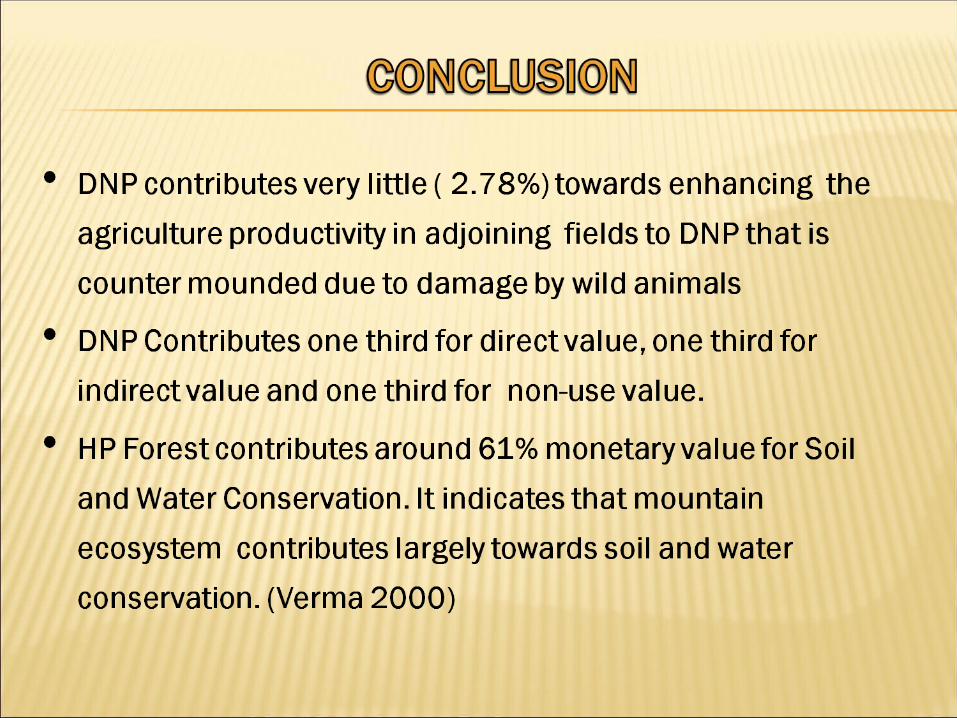
Monetary Value of Agricultural Productivity
0 0
Total Economic Value (TEV)
1244938923 or 1244.94 million
100
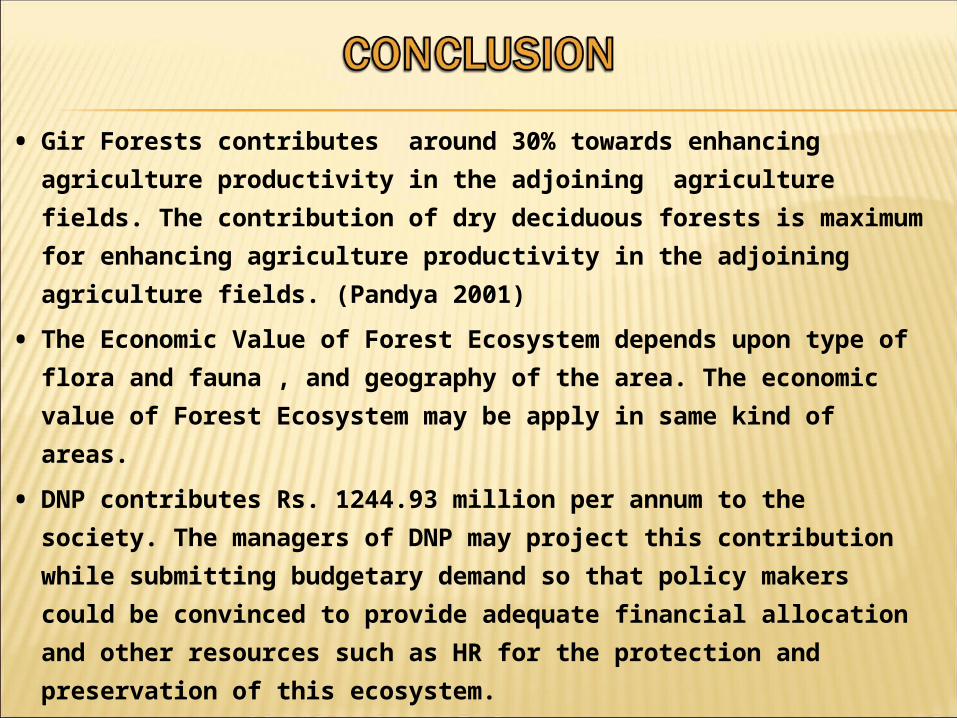
• Gir Forests contributes around 30% towards enhancing
agriculture productivity in the adjoining agriculture fields.
The contribution of dry deciduous forests is maximum for
enhancing agriculture productivity in the adjoining agriculture
fields. (Pandya 2001)
• The Economic Value of Forest Ecosystem depends upon type
of flora and fauna , and geography of the area. The economic
value of Forest Ecosystem may be apply in same kind of
areas.
• DNP contributes Rs. 1244.93 million per annum to the society.
The managers of DNP may project this contribution while
submitting budgetary demand so that policy makers could be
convinced to provide adequate financial allocation and other
resources such as HR for the protection and preservation of
this ecosystem.
• Data collected in 2006 and presented
value is for 2006
• DNP contributes more ecosystem
services but for the purpose of
estimation of TEV, only 8 services
are taken into consideration.
• Royalty of Timber from FC has been
taken instead of open market rates