Embed Size (px)
Citation preview
ARTICLE
Received 5 Mar 2015 | Accepted 29 Jul 2015 | Published 11 Sep 2015
Novel PRD-like homeodomain transcription factorsand retrotransposon elements in early humandevelopmentVirpi Tohonen1,2,*, Shintaro Katayama1,2,3,*, Liselotte Vesterlund1,2, Eeva-Mari Jouhilahti1,2, Mona Sheikhi4,
Elo Madissoon1,2, Giuditta Filippini-Cattaneo5, Marisa Jaconi6, Anna Johnsson7, Thomas R. Burglin1,w,
Sten Linnarsson7, Outi Hovatta4 & Juha Kere1,2,3,8
Transcriptional program that drives human preimplantation development is largely unknown.
Here, by using single-cell RNA sequencing of 348 oocytes, zygotes and single blastomeres
from 2- to 3-day-old embryos, we provide a detailed analysis of the human preimplantation
transcriptome. By quantifying transcript far 50-ends (TFEs), we include in our analysis
transcripts that derive from alternative promoters. We show that 32 and 129 genes are
transcribed during the transition from oocyte to four-cell stage and from four- to eight-cell
stage, respectively. A number of identified transcripts originates from previously unannotated
genes that include the PRD-like homeobox genes ARGFX, CPHX1, CPHX2, DPRX, DUXA, DUXB
and LEUTX. Employing de novo promoter motif extraction on sequences surrounding TFEs,
we identify significantly enriched gene regulatory motifs that often overlap with Alu elements.
Our high-resolution analysis of the human transcriptome during preimplantation
development may have important implications on future studies of human pluripotent stem
cells and cell reprograming.
DOI: 10.1038/ncomms9207 OPEN
1 Department of Biosciences and Nutrition, Karolinska Institutet, Novum, 141 83 Huddinge, Sweden. 2 Center for Innovative Medicine, Karolinska Institutet,Huddinge 141 83, Sweden. 3 Science for Life Laboratory, Tomtebodavagen 23 A, Solna 171 21, Sweden. 4 Department of Clinical Science, Intervention andTechnology, Karolinska Institutet, Karolinska University Hospital Huddinge, Stockholm 141 86, Sweden. 5 ProCreaLab SA, Lugano CH-6900, Switzerland.6 Department of Pathology and Immunology, Faculty of Medicine, Geneva University, 1 rue Michel-Servet, Geneva 4, 1211, Switzerland. 7 Department ofMedical Biochemistry and Biophysics, Karolinska Institutet, Stockholm 171 77, Sweden. 8 Molecular Neurology Research Program, University of Helsinki andFolkhalsan Institute of Genetics, Biomedicum 1, Haartmaninkatu 8, Helsinki 00290, Finland. * These authors contributed equally to this work.w Present address: Department of Biomedicine, University of Basel, Mattenstrasse 28, 4058 Basel, Switzerland. Correspondence and requests for materialsshould be addressed to J.K. (email: [email protected]).
NATURE COMMUNICATIONS | 6:8207 | DOI: 10.1038/ncomms9207 | www.nature.com/naturecommunications 1
& 2015 Macmillan Publishers Limited. All rights reserved.
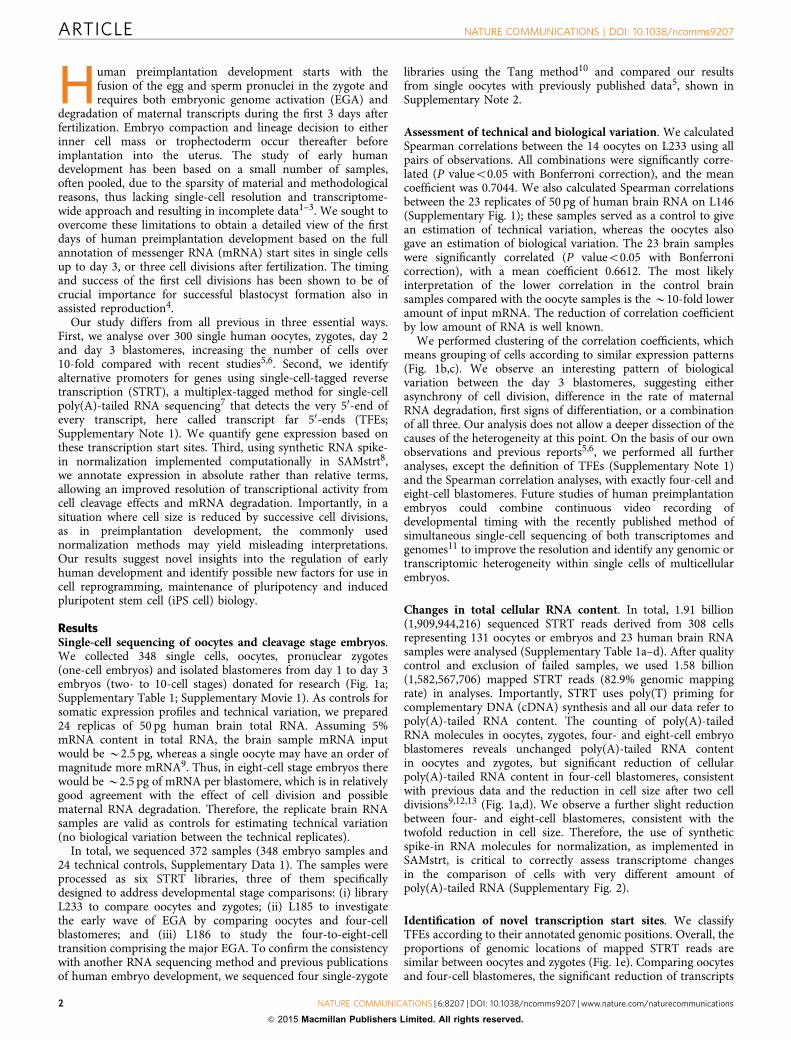
Human preimplantation development starts with thefusion of the egg and sperm pronuclei in the zygote andrequires both embryonic genome activation (EGA) and
degradation of maternal transcripts during the first 3 days afterfertilization. Embryo compaction and lineage decision to eitherinner cell mass or trophectoderm occur thereafter beforeimplantation into the uterus. The study of early humandevelopment has been based on a small number of samples,often pooled, due to the sparsity of material and methodologicalreasons, thus lacking single-cell resolution and transcriptome-wide approach and resulting in incomplete data1–3. We sought toovercome these limitations to obtain a detailed view of the firstdays of human preimplantation development based on the fullannotation of messenger RNA (mRNA) start sites in single cellsup to day 3, or three cell divisions after fertilization. The timingand success of the first cell divisions has been shown to be ofcrucial importance for successful blastocyst formation also inassisted reproduction4.
Our study differs from all previous in three essential ways.First, we analyse over 300 single human oocytes, zygotes, day 2and day 3 blastomeres, increasing the number of cells over10-fold compared with recent studies5,6. Second, we identifyalternative promoters for genes using single-cell-tagged reversetranscription (STRT), a multiplex-tagged method for single-cellpoly(A)-tailed RNA sequencing7 that detects the very 50-end ofevery transcript, here called transcript far 50-ends (TFEs;Supplementary Note 1). We quantify gene expression based onthese transcription start sites. Third, using synthetic RNA spike-in normalization implemented computationally in SAMstrt8,we annotate expression in absolute rather than relative terms,allowing an improved resolution of transcriptional activity fromcell cleavage effects and mRNA degradation. Importantly, in asituation where cell size is reduced by successive cell divisions,as in preimplantation development, the commonly usednormalization methods may yield misleading interpretations.Our results suggest novel insights into the regulation of earlyhuman development and identify possible new factors for use incell reprogramming, maintenance of pluripotency and inducedpluripotent stem cell (iPS cell) biology.
ResultsSingle-cell sequencing of oocytes and cleavage stage embryos.We collected 348 single cells, oocytes, pronuclear zygotes(one-cell embryos) and isolated blastomeres from day 1 to day 3embryos (two- to 10-cell stages) donated for research (Fig. 1a;Supplementary Table 1; Supplementary Movie 1). As controls forsomatic expression profiles and technical variation, we prepared24 replicas of 50 pg human brain total RNA. Assuming 5%mRNA content in total RNA, the brain sample mRNA inputwould be B2.5 pg, whereas a single oocyte may have an order ofmagnitude more mRNA9. Thus, in eight-cell stage embryos therewould be B2.5 pg of mRNA per blastomere, which is in relativelygood agreement with the effect of cell division and possiblematernal RNA degradation. Therefore, the replicate brain RNAsamples are valid as controls for estimating technical variation(no biological variation between the technical replicates).
In total, we sequenced 372 samples (348 embryo samples and24 technical controls, Supplementary Data 1). The samples wereprocessed as six STRT libraries, three of them specificallydesigned to address developmental stage comparisons: (i) libraryL233 to compare oocytes and zygotes; (ii) L185 to investigatethe early wave of EGA by comparing oocytes and four-cellblastomeres; and (iii) L186 to study the four-to-eight-celltransition comprising the major EGA. To confirm the consistencywith another RNA sequencing method and previous publicationsof human embryo development, we sequenced four single-zygote
libraries using the Tang method10 and compared our resultsfrom single oocytes with previously published data5, shown inSupplementary Note 2.
Assessment of technical and biological variation. We calculatedSpearman correlations between the 14 oocytes on L233 using allpairs of observations. All combinations were significantly corre-lated (P valueo0.05 with Bonferroni correction), and the meancoefficient was 0.7044. We also calculated Spearman correlationsbetween the 23 replicates of 50 pg of human brain RNA on L146(Supplementary Fig. 1); these samples served as a control to givean estimation of technical variation, whereas the oocytes alsogave an estimation of biological variation. The 23 brain sampleswere significantly correlated (P valueo0.05 with Bonferronicorrection), with a mean coefficient 0.6612. The most likelyinterpretation of the lower correlation in the control brainsamples compared with the oocyte samples is the B10-fold loweramount of input mRNA. The reduction of correlation coefficientby low amount of RNA is well known.
We performed clustering of the correlation coefficients, whichmeans grouping of cells according to similar expression patterns(Fig. 1b,c). We observe an interesting pattern of biologicalvariation between the day 3 blastomeres, suggesting eitherasynchrony of cell division, difference in the rate of maternalRNA degradation, first signs of differentiation, or a combinationof all three. Our analysis does not allow a deeper dissection of thecauses of the heterogeneity at this point. On the basis of our ownobservations and previous reports5,6, we performed all furtheranalyses, except the definition of TFEs (Supplementary Note 1)and the Spearman correlation analyses, with exactly four-cell andeight-cell blastomeres. Future studies of human preimplantationembryos could combine continuous video recording ofdevelopmental timing with the recently published method ofsimultaneous single-cell sequencing of both transcriptomes andgenomes11 to improve the resolution and identify any genomic ortranscriptomic heterogeneity within single cells of multicellularembryos.
Changes in total cellular RNA content. In total, 1.91 billion(1,909,944,216) sequenced STRT reads derived from 308 cellsrepresenting 131 oocytes or embryos and 23 human brain RNAsamples were analysed (Supplementary Table 1a–d). After qualitycontrol and exclusion of failed samples, we used 1.58 billion(1,582,567,706) mapped STRT reads (82.9% genomic mappingrate) in analyses. Importantly, STRT uses poly(T) priming forcomplementary DNA (cDNA) synthesis and all our data refer topoly(A)-tailed RNA content. The counting of poly(A)-tailedRNA molecules in oocytes, zygotes, four- and eight-cell embryoblastomeres reveals unchanged poly(A)-tailed RNA contentin oocytes and zygotes, but significant reduction of cellularpoly(A)-tailed RNA content in four-cell blastomeres, consistentwith previous data and the reduction in cell size after two celldivisions9,12,13 (Fig. 1a,d). We observe a further slight reductionbetween four- and eight-cell blastomeres, consistent with thetwofold reduction in cell size. Therefore, the use of syntheticspike-in RNA molecules for normalization, as implemented inSAMstrt, is critical to correctly assess transcriptome changesin the comparison of cells with very different amount ofpoly(A)-tailed RNA (Supplementary Fig. 2).
Identification of novel transcription start sites. We classifyTFEs according to their annotated genomic positions. Overall, theproportions of genomic locations of mapped STRT reads aresimilar between oocytes and zygotes (Fig. 1e). Comparing oocytesand four-cell blastomeres, the significant reduction of transcripts
ARTICLE NATURE COMMUNICATIONS | DOI: 10.1038/ncomms9207
2 NATURE COMMUNICATIONS | 6:8207 | DOI: 10.1038/ncomms9207 | www.nature.com/naturecommunications
& 2015 Macmillan Publishers Limited. All rights reserved.
affects proportionately more coding genes than transcripts cor-responding to noncoding genes, consistent with the degradationof maternal coding transcripts (Fig. 1e,f). The four-to-eight-celltransition is characterized by a significant increase in codingtranscripts, while noncoding transcripts are increased in the
oocyte-to-four-cell transition (Fig. 1e,f). At all stages, theproportion of intronic or unannotated TFEs is higher than in thehuman adult brain samples, suggesting transcription fromalternative promoters of defined genes, or completely novel genes,during preimplantation development.
Oocyte
Zygote
Oocyte
4-Cell
4-Cell
8-Cell
8-Cell
50 pg
Aligned reads
0% 25% 50% 75% 100%
Upstream and 1st exon of noncoding Other exon of noncodingIntron Unannotated
L233
L185
L186
a d
L146
Oocyte Zygote Oocyte 4-Cell 4-Cell 8-Cell
e
L233 L185 L186
P=0.376 P=1.68×10⁻⁵ P=0.123
f
Aligned reads
0% 20% 40% 60%
Oocyte
4-Cell
4-Cell
8-Cell
8-Cell
50 pg
L185
L186
L146
Upstream and 1st exon of noncoding
Intron and unannotated
Oocyte22 Cells
Zygote62 Cells
Day 2 embryo51 Cells from 15 embryos
Day 3 embryo208 Cells from 34 embryos
17 h 27 h 24 h
b
c
L185
L186
0.2 1.00.80.60.4
Upstream and 5′-UTR of coding CDS and 3′-UTR of coding
0.4 0.6 0.8 1.0
P=1.63×10⁻³
P=4.87×10⁻⁴
P=8.66×10⁻¹⁰
Upstream and 5′-UTR of coding
Rel
ativ
e po
lyA
+ c
onte
nt
1/64
1/4
1/16
1
4
Ooc
yte
Day
2 e
mbr
yoD
ay 3
em
bryo
Em
bryo
4c
Em
bryo
4d
Em
bryo
4e
Em
bryo
4f
Em
bryo
4g
Em
bryo
4h
Em
bryo
4i
Em
bryo
4j
Em
bryo
7c
Em
bryo
7d
Em
bryo
7e
Em
bryo
7f
Em
bryo
9a
Em
bryo
9b
Em
bryo
Ta
Day
2 e
mbr
yoD
ay 3
em
bryo
Em
bryo
4k
Em
bryo
4l
Em
bryo
4m
Em
bryo
6d
Em
bryo
7g
Em
bryo
7h
Em
bryo
8k
Em
bryo
8l
Em
bryo
8m
Em
bryo
8n
Em
bryo
9c
Em
bryo
9d
Em
bryo
Tb
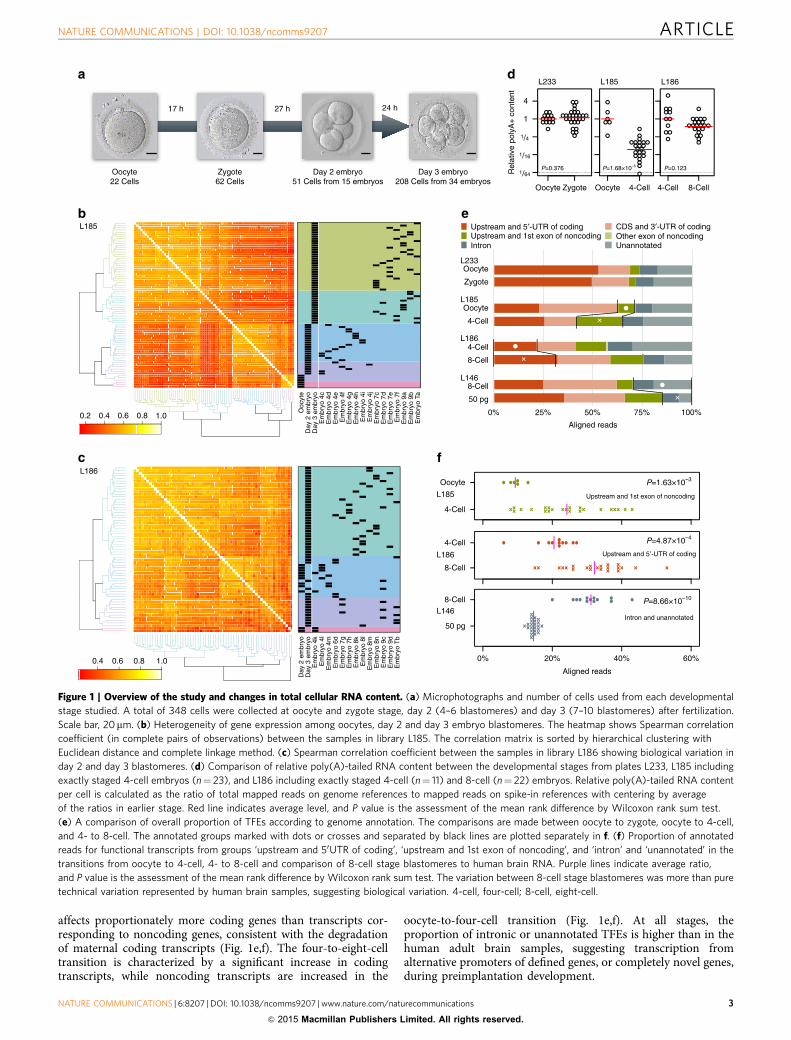
Figure 1 | Overview of the study and changes in total cellular RNA content. (a) Microphotographs and number of cells used from each developmental
stage studied. A total of 348 cells were collected at oocyte and zygote stage, day 2 (4–6 blastomeres) and day 3 (7–10 blastomeres) after fertilization.
Scale bar, 20mm. (b) Heterogeneity of gene expression among oocytes, day 2 and day 3 embryo blastomeres. The heatmap shows Spearman correlation
coefficient (in complete pairs of observations) between the samples in library L185. The correlation matrix is sorted by hierarchical clustering with
Euclidean distance and complete linkage method. (c) Spearman correlation coefficient between the samples in library L186 showing biological variation in
day 2 and day 3 blastomeres. (d) Comparison of relative poly(A)-tailed RNA content between the developmental stages from plates L233, L185 including
exactly staged 4-cell embryos (n¼ 23), and L186 including exactly staged 4-cell (n¼ 11) and 8-cell (n¼ 22) embryos. Relative poly(A)-tailed RNA content
per cell is calculated as the ratio of total mapped reads on genome references to mapped reads on spike-in references with centering by average
of the ratios in earlier stage. Red line indicates average level, and P value is the assessment of the mean rank difference by Wilcoxon rank sum test.
(e) A comparison of overall proportion of TFEs according to genome annotation. The comparisons are made between oocyte to zygote, oocyte to 4-cell,
and 4- to 8-cell. The annotated groups marked with dots or crosses and separated by black lines are plotted separately in f. (f) Proportion of annotated
reads for functional transcripts from groups ‘upstream and 50UTR of coding’, ‘upstream and 1st exon of noncoding’, and ‘intron’ and ‘unannotated’ in the
transitions from oocyte to 4-cell, 4- to 8-cell and comparison of 8-cell stage blastomeres to human brain RNA. Purple lines indicate average ratio,
and P value is the assessment of the mean rank difference by Wilcoxon rank sum test. The variation between 8-cell stage blastomeres was more than pure
technical variation represented by human brain samples, suggesting biological variation. 4-cell, four-cell; 8-cell, eight-cell.
NATURE COMMUNICATIONS | DOI: 10.1038/ncomms9207 ARTICLE
NATURE COMMUNICATIONS | 6:8207 | DOI: 10.1038/ncomms9207 | www.nature.com/naturecommunications 3
& 2015 Macmillan Publishers Limited. All rights reserved.
Single-cell gene expression during EGA. To analyse the up- anddownregulated genes in the two transitions corresponding toearly and major EGA, we compared the oocyte-to-four-celland four-to-eight-cell transitions, respectively. We analysed onlyembryos with exactly four or eight cells to avoid variation arisingfrom inexact timing. The early EGA at oocyte-to-four-celltransition (Fig. 2a–d) is characterized by a significant upregula-tion of 32 TFEs (Supplementary Data 2) and a massive reductionof total TFEs (Supplementary Data 3) consistent with activematernal transcript degradation9,12,13 and passive reduction(mRNA content division between daughter blastomeres). Theanalysis of the 32 upregulated TFEs show that 12 map to the50-untranslated region (UTR) of coding genes (ARHGAP28,DUXA, H2AFZ, KHDC1L, PRAMEF1, RBBP6, SHC4, SRSF,TRIM48, USP29, ZSCAN4 and LOC440563), one to an intron(LEUTX), one maps upstream of a coding gene (LOC649330),and, surprisingly, the rest map to unannotated genomic sites(Fig. 2c). In contrast, intragenic exons or 30UTR sequences ofcoding genes are strongly over-represented among downregulatedTFEs, suggesting partially degraded transcripts resulting in partfrom 50-exonuclease activity14.
The analysis of four-to-eight-cell transition (Fig. 2e–h), that is,the major EGA, reveals 129 significantly upregulated TFEs(Supplementary Data 4) of which nearly 75% correspond to the50-exons of coding genes (Fig. 2g) possessing mostly catalytic andbinding activities (Fig. 2h). The profile of the downregulatedtranscripts (Supplementary Data 5), again, corresponds tounannotated, intronic and middle or 30-exonic transcriptsequences (Fig. 2g), consistent with partially degraded transcripts.
Comparing with the previous report of 2,495 significantlyupregulated genes between 4- and eight-cell stage by Yan et al.5,the much smaller number of genes upregulated in our study mayseem surprising. The obvious reason for the large differences inreported gene numbers is the method used for data normalizationand interpretation. The commonly used mean normalizationworks poorly in situations where there is huge imbalance betweenthe reduction and gain of transcripts, as is the case in theday 2 and day 3 blastomeres (Supplementary Fig. 2). Thus,quantification using synthetic spike-in RNA molecules fornormalization provides an unambiguous method in thisunbalanced situation and allows for a more accurateinterpretation of the data8. Many biological processes work ascascades depending on only a few key genes, one example beingthe four Yamanaka factors needed to achieve reprogramming ofdifferentiated cells to a pluripotent stage15,16. Our implication of32 and 129 genes, respectively, in the consecutive days of EGAmay indeed reflect EGA more accurately than previous studiesand these genes may suffice to initiate the embryo development.
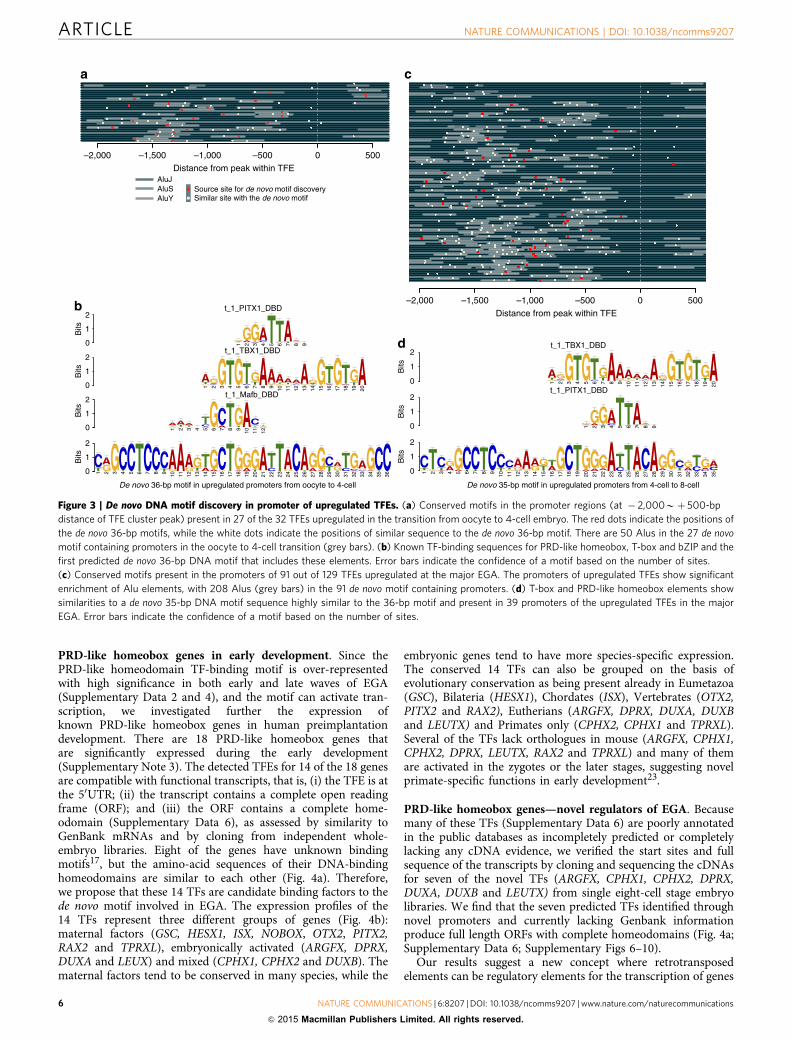
Identification of de novo regulatory motifs within Alu elements.We extracted sequence motifs in the genomic DNA around theupregulated TFEs to identify potential regulatory elementsinvolved in EGA. If any sequence-specific DNA-binding proteinis a candidate for either activating early transcription of nearbygenes in cis or for preventing their leaky transcription beforefertilization, such specific DNA motifs should be over-represented around transcriptional start sites (TSSs) of genesinvolved in EGA. We identify four significant de novo motifs atgenomic positions � 2,000 to þ 500 bp of the 32 upregulatedTFEs in the early EGA (Supplementary Fig. 3). A 36-bp long denovo motif is identified within Alu elements in 23 of the 32promoters at the four-cell stage including 50UTR of H2AFZ,KHDC1L and ZSCAN4 (Fig. 3a,b). The de novo motif overlappingwith the Alu elements is similar to known consensus sequencesof binding sites for bZIP, T-box and PRD-like homeodomaincontaining transcription factors (TFs; Fig. 3b, and the motif basedon database analysis in ref. 17 and Supplementary Data 3). Fur-thermore, we find a highly similar motif, also with frequent Aluelement overlap, in altogether 27 of the 32 TFE promoters(Fig. 3a; Supplementary Fig. 3).
Similar to the early EGA, we identify 13 significant de novomotifs (Supplementary Fig. 4) in the promoter regions of the 129upregulated TFEs at eight-cell stage (Fig. 3c; SupplementaryData 4). We identify a 35-bp motif in 39 promoters of the TFEs(Fig. 3d; Supplementary Data 4). Similar sequences are spreadover altogether 91 out of the 129 promoters, again with frequentoverlap to Alu elements, especially AluY and AluS18 (Fig. 3c). The35-bp motif is also similar to the known motifs for T-box andPRD-like homeodomain TFs (Fig. 3d).
Alu retrotransposon elements are the major short interspersednucleotide element family present in the primate genome18,showing non-random distribution in the human genome withenrichment to GC-rich regions19. Interestingly, our data show anover-representation of Alu elements around 1–2 kb from the TSSof the upregulated TFEs. This is in accordance with Polak et al.20
who suggested a role for Alu elements in transcriptionalregulation on the basis of the enrichment of Alu elements2–5-kb upstream of TSSs and containing many TF-binding sites.Here we observe a frequency of about two Alu elements within2 kb from the TSSs of developmental genes, that is, morefrequently than the expected frequency of up to 1.1 (ref. 20).
PRD-like homeobox genes regulate EGA. Homeodomainproteins function as DNA-binding TFs primarily in developmentand differentiation. The PRD-like homeobox genes encodehomeodomains that are similar to the PRD class homeodomains,but they lack the actual PRD domain21. We find that ZSCAN4,
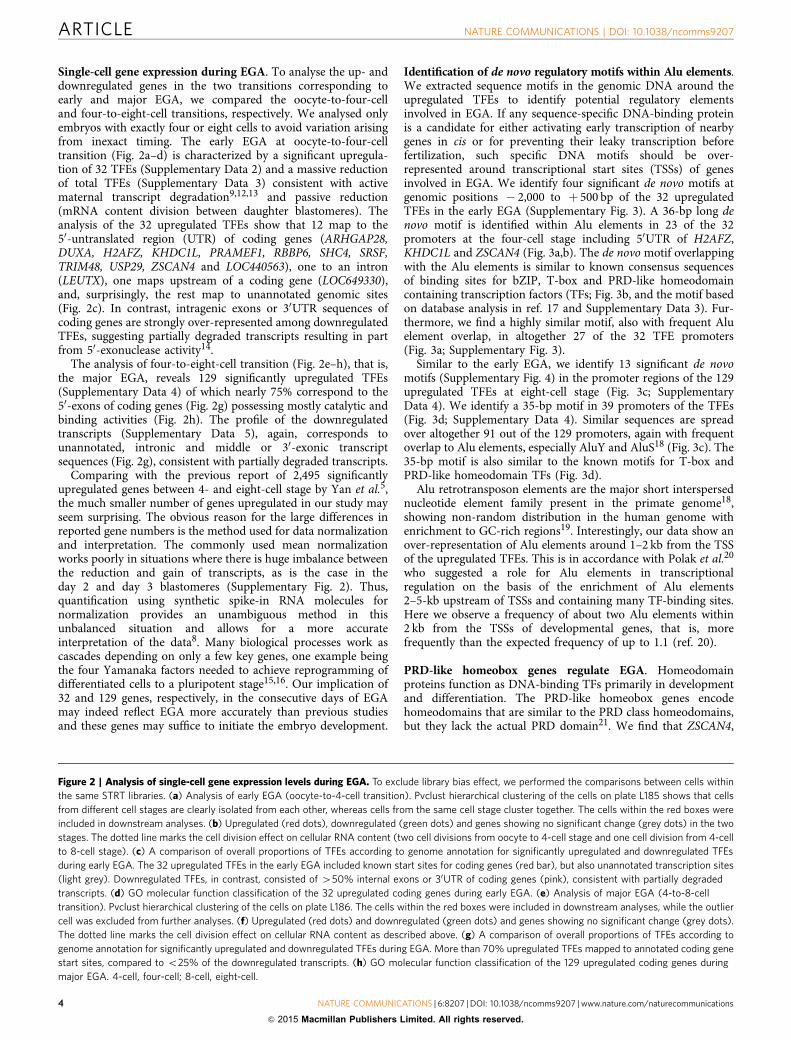
Figure 2 | Analysis of single-cell gene expression levels during EGA. To exclude library bias effect, we performed the comparisons between cells within
the same STRT libraries. (a) Analysis of early EGA (oocyte-to-4-cell transition). Pvclust hierarchical clustering of the cells on plate L185 shows that cells
from different cell stages are clearly isolated from each other, whereas cells from the same cell stage cluster together. The cells within the red boxes were
included in downstream analyses. (b) Upregulated (red dots), downregulated (green dots) and genes showing no significant change (grey dots) in the two
stages. The dotted line marks the cell division effect on cellular RNA content (two cell divisions from oocyte to 4-cell stage and one cell division from 4-cell
to 8-cell stage). (c) A comparison of overall proportions of TFEs according to genome annotation for significantly upregulated and downregulated TFEs
during early EGA. The 32 upregulated TFEs in the early EGA included known start sites for coding genes (red bar), but also unannotated transcription sites
(light grey). Downregulated TFEs, in contrast, consisted of 450% internal exons or 30UTR of coding genes (pink), consistent with partially degraded
transcripts. (d) GO molecular function classification of the 32 upregulated coding genes during early EGA. (e) Analysis of major EGA (4-to-8-cell
transition). Pvclust hierarchical clustering of the cells on plate L186. The cells within the red boxes were included in downstream analyses, while the outlier
cell was excluded from further analyses. (f) Upregulated (red dots) and downregulated (green dots) and genes showing no significant change (grey dots).
The dotted line marks the cell division effect on cellular RNA content as described above. (g) A comparison of overall proportions of TFEs according to
genome annotation for significantly upregulated and downregulated TFEs during EGA. More than 70% upregulated TFEs mapped to annotated coding gene
start sites, compared to o25% of the downregulated transcripts. (h) GO molecular function classification of the 129 upregulated coding genes during
major EGA. 4-cell, four-cell; 8-cell, eight-cell.
ARTICLE NATURE COMMUNICATIONS | DOI: 10.1038/ncomms9207
4 NATURE COMMUNICATIONS | 6:8207 | DOI: 10.1038/ncomms9207 | www.nature.com/naturecommunications
& 2015 Macmillan Publishers Limited. All rights reserved.
a known inducer of iPS cells22, is highly expressed already atfour-cell stage, and further accumulated at eight-cell stage.The TFE peak is within the second exon of ZSCAN4(Supplementary Fig. 5a). The promoter region around theTFE peak contains six sequences similar to the 36-bp de novomotif, all overlapping with three Alu elements on the same strand(Supplementary Fig. 5b). To investigate the activity of the putativepromoters containing the predicted 36-bp de novo motif,we cloned a fragment of the putative ZSCAN4 promoter up to
1,605-bp upstream of the TFE peak (Supplementary Fig. 5b)and placed it upstream of the luciferase reporter gene. Thecloned promoter fragment increases luciferase expressionfivefold, and co-transfection using the PRD-like homeodomaincontaining TFs DUXA or/and OTX2 yields an up to 25-foldincrease in luciferase expression (Supplementary Fig. 5c). Thus,the predicted novel ZSCAN4 promoter containing the 36-bpmotifs can drive the expression of downstream genes, and may beactivated during the EGA.
a23 4-Cell stage blastomeres
6 Oocytes
Oe Of
Og
Oh
Oa
Oc
4c1
4j1
4e0
4c0
4f0
4g3
4g2
4h1
4g0
4g1 4d
34f
24i
04i
1 4h0
4e2
4h3
4f1
4d1
4c3
4c2
4d2
4f3
0.30
0.40
0.50
e
10 4-Cell stage blastomeres
22 8-Cell stage blastomeres
4k0
4k3
4k1
4m1
4l2
4l0
4l3 4l
14k
24m
24m
38l
18k
68l
78k
48l
28l
58m
48l
08m
28m
5 8k3
8k5
8n4
8n6 8l6
8k7
8n2
8n3
8l3
8n5
8l4
8m60.25
0.40
0.55
L185 L186
Up
Down
TFE
0% 25% 50% 75% 100%
Upstream and 1st exon of noncoding Other exons of noncodingIntron Unannotated
Up
Down
TFE
0% 25% 50% 75% 100%
c
32 TFEs
33,794 TFEs
dNucleic acid binding
transcription factor activityBinding
Enzyme regulator activity
Catalytic activity
Gene
0 2 4 6 8
Nucleic acid bindingtranscription factor activity
Binding
Enzyme regulator activity
Catalytic activity
Transporter activity
Translation regulator activityProtein binding
transcription factor activityReceptor activity
Antioxidant activity
Structural molecule activity
129 TFEs
1,511 TFEs
g
h
1
Log10 (median(oocyte)) Log10 (median(4-cell))
Upstream and 5′-UTR of coding CDS and 3′-UTR of coding
Gene
0 10 20 30 40 50
fb
TFE
Log 1
0 (m
edia
n(4-
cell)
)
Log 1
0 (m
edia
n(8-
cell)
)
0
2
4
6
0
2
4
6
0 2 4 6 0 2 4 6
Equivalent2 Cleavage divisions
Up, q-value < 0.05Down, q-value < 0.05
1 Cleavage division
NATURE COMMUNICATIONS | DOI: 10.1038/ncomms9207 ARTICLE
NATURE COMMUNICATIONS | 6:8207 | DOI: 10.1038/ncomms9207 | www.nature.com/naturecommunications 5
& 2015 Macmillan Publishers Limited. All rights reserved.
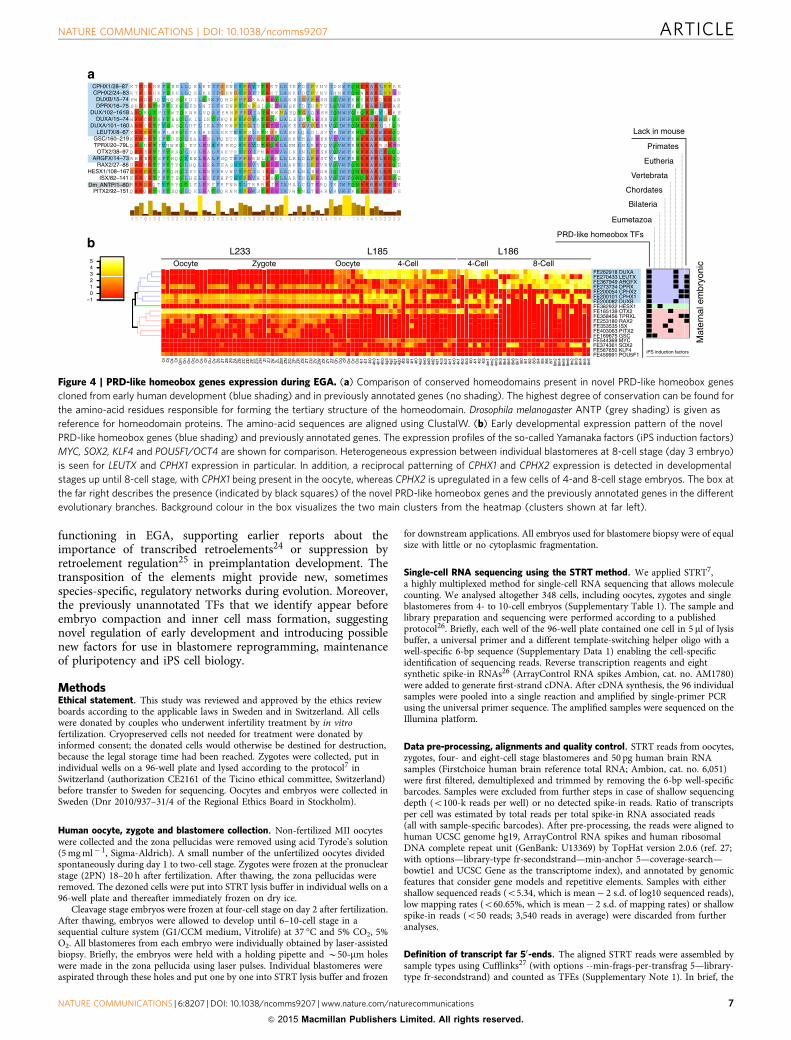
PRD-like homeobox genes in early development. Since thePRD-like homeodomain TF-binding motif is over-representedwith high significance in both early and late waves of EGA(Supplementary Data 2 and 4), and the motif can activate tran-scription, we investigated further the expression ofknown PRD-like homeobox genes in human preimplantationdevelopment. There are 18 PRD-like homeobox genes thatare significantly expressed during the early development(Supplementary Note 3). The detected TFEs for 14 of the 18 genesare compatible with functional transcripts, that is, (i) the TFE is atthe 50UTR; (ii) the transcript contains a complete open readingframe (ORF); and (iii) the ORF contains a complete home-odomain (Supplementary Data 6), as assessed by similarity toGenBank mRNAs and by cloning from independent whole-embryo libraries. Eight of the genes have unknown bindingmotifs17, but the amino-acid sequences of their DNA-bindinghomeodomains are similar to each other (Fig. 4a). Therefore,we propose that these 14 TFs are candidate binding factors to thede novo motif involved in EGA. The expression profiles of the14 TFs represent three different groups of genes (Fig. 4b):maternal factors (GSC, HESX1, ISX, NOBOX, OTX2, PITX2,RAX2 and TPRXL), embryonically activated (ARGFX, DPRX,DUXA and LEUX) and mixed (CPHX1, CPHX2 and DUXB). Thematernal factors tend to be conserved in many species, while the
embryonic genes tend to have more species-specific expression.The conserved 14 TFs can also be grouped on the basis ofevolutionary conservation as being present already in Eumetazoa(GSC), Bilateria (HESX1), Chordates (ISX), Vertebrates (OTX2,PITX2 and RAX2), Eutherians (ARGFX, DPRX, DUXA, DUXBand LEUTX) and Primates only (CPHX2, CPHX1 and TPRXL).Several of the TFs lack orthologues in mouse (ARGFX, CPHX1,CPHX2, DPRX, LEUTX, RAX2 and TPRXL) and many of themare activated in the zygotes or the later stages, suggesting novelprimate-specific functions in early development23.
PRD-like homeobox genes—novel regulators of EGA. Becausemany of these TFs (Supplementary Data 6) are poorly annotatedin the public databases as incompletely predicted or completelylacking any cDNA evidence, we verified the start sites and fullsequence of the transcripts by cloning and sequencing the cDNAsfor seven of the novel TFs (ARGFX, CPHX1, CPHX2, DPRX,DUXA, DUXB and LEUTX) from single eight-cell stage embryolibraries. We find that the seven predicted TFs identified throughnovel promoters and currently lacking Genbank informationproduce full length ORFs with complete homeodomains (Fig. 4a;Supplementary Data 6; Supplementary Figs 6–10).
Our results suggest a new concept where retrotransposedelements can be regulatory elements for the transcription of genes
a
b
–2,000 –1,500 –1,000 –500 0 500
–1,500–2,000 –1,000 –500 0 500
AluJAluSAluY
Source site for de novo motif discoverySimilar site with the de novo motif
Distance from peak within TFE
Distance from peak within TFE
d
t_1_PITX1_DBD
0
1
2
Bits
1 2 3 4 5 6 7 8 9
t_1_TBX1_DBD
0
1
2
Bits
1 2 3 4 5 6 7 8 9 10 11 12 13 14 15 16 17 18 19 20
t_1_Mafb_DBD
0
1
2
Bits
1 2 3 4 5 6 7 8 9 10 11 12
0
1
2
Bits
1 2 3 4 5 6 7 8 9 10 11 12 13 14 15 16 17 18 19 20 21 22 23 24 25 26 27 28 29 30 31 32 33 34 35 36
t_1_TBX1_DBD
0
1
2
Bits
1 2 3 4 5 6 7 8 9 10 11 12 13 14 15 16 17 18 19 20
t_1_PITX1_DBD
0
1
2B
its
1 2 3 4 5 6 7 8 9
0
1
2
Bits
1 2 3 4 5 6 7 8 9 10 11 12 13 14 15 16 17 18 19 20 21 22 23 24 25 26 27 28 29 30 31 32 33 34 35
c
De novo 36-bp motif in upregulated promoters from oocyte to 4-cell De novo 35-bp motif in upregulated promoters from 4-cell to 8-cell
Figure 3 | De novo DNA motif discovery in promoter of upregulated TFEs. (a) Conserved motifs in the promoter regions (at � 2,000Bþ 500-bp
distance of TFE cluster peak) present in 27 of the 32 TFEs upregulated in the transition from oocyte to 4-cell embryo. The red dots indicate the positions of
the de novo 36-bp motifs, while the white dots indicate the positions of similar sequence to the de novo 36-bp motif. There are 50 Alus in the 27 de novo
motif containing promoters in the oocyte to 4-cell transition (grey bars). (b) Known TF-binding sequences for PRD-like homeobox, T-box and bZIP and the
first predicted de novo 36-bp DNA motif that includes these elements. Error bars indicate the confidence of a motif based on the number of sites.
(c) Conserved motifs present in the promoters of 91 out of 129 TFEs upregulated at the major EGA. The promoters of upregulated TFEs show significant
enrichment of Alu elements, with 208 Alus (grey bars) in the 91 de novo motif containing promoters. (d) T-box and PRD-like homeobox elements show
similarities to a de novo 35-bp DNA motif sequence highly similar to the 36-bp motif and present in 39 promoters of the upregulated TFEs in the major
EGA. Error bars indicate the confidence of a motif based on the number of sites.
ARTICLE NATURE COMMUNICATIONS | DOI: 10.1038/ncomms9207
6 NATURE COMMUNICATIONS | 6:8207 | DOI: 10.1038/ncomms9207 | www.nature.com/naturecommunications
& 2015 Macmillan Publishers Limited. All rights reserved.
functioning in EGA, supporting earlier reports about theimportance of transcribed retroelements24 or suppression byretroelement regulation25 in preimplantation development. Thetransposition of the elements might provide new, sometimesspecies-specific, regulatory networks during evolution. Moreover,the previously unannotated TFs that we identify appear beforeembryo compaction and inner cell mass formation, suggestingnovel regulation of early development and introducing possiblenew factors for use in blastomere reprogramming, maintenanceof pluripotency and iPS cell biology.
MethodsEthical statement. This study was reviewed and approved by the ethics reviewboards according to the applicable laws in Sweden and in Switzerland. All cellswere donated by couples who underwent infertility treatment by in vitrofertilization. Cryopreserved cells not needed for treatment were donated byinformed consent; the donated cells would otherwise be destined for destruction,because the legal storage time had been reached. Zygotes were collected, put inindividual wells on a 96-well plate and lysed according to the protocol7 inSwitzerland (authorization CE2161 of the Ticino ethical committee, Switzerland)before transfer to Sweden for sequencing. Oocytes and embryos were collected inSweden (Dnr 2010/937–31/4 of the Regional Ethics Board in Stockholm).
Human oocyte, zygote and blastomere collection. Non-fertilized MII oocyteswere collected and the zona pellucidas were removed using acid Tyrode’s solution(5 mg ml� 1, Sigma-Aldrich). A small number of the unfertilized oocytes dividedspontaneously during day 1 to two-cell stage. Zygotes were frozen at the pronuclearstage (2PN) 18–20 h after fertilization. After thawing, the zona pellucidas wereremoved. The dezoned cells were put into STRT lysis buffer in individual wells on a96-well plate and thereafter immediately frozen on dry ice.
Cleavage stage embryos were frozen at four-cell stage on day 2 after fertilization.After thawing, embryos were allowed to develop until 6–10-cell stage in asequential culture system (G1/CCM medium, Vitrolife) at 37 �C and 5% CO2, 5%O2. All blastomeres from each embryo were individually obtained by laser-assistedbiopsy. Briefly, the embryos were held with a holding pipette and B50-mm holeswere made in the zona pellucida using laser pulses. Individual blastomeres wereaspirated through these holes and put one by one into STRT lysis buffer and frozen
for downstream applications. All embryos used for blastomere biopsy were of equalsize with little or no cytoplasmic fragmentation.
Single-cell RNA sequencing using the STRT method. We applied STRT7,a highly multiplexed method for single-cell RNA sequencing that allows moleculecounting. We analysed altogether 348 cells, including oocytes, zygotes and singleblastomeres from 4- to 10-cell embryos (Supplementary Table 1). The sample andlibrary preparation and sequencing were performed according to a publishedprotocol26. Briefly, each well of the 96-well plate contained one cell in 5 ml of lysisbuffer, a universal primer and a different template-switching helper oligo with awell-specific 6-bp sequence (Supplementary Data 1) enabling the cell-specificidentification of sequencing reads. Reverse transcription reagents and eightsynthetic spike-in RNAs26 (ArrayControl RNA spikes Ambion, cat. no. AM1780)were added to generate first-strand cDNA. After cDNA synthesis, the 96 individualsamples were pooled into a single reaction and amplified by single-primer PCRusing the universal primer sequence. The amplified samples were sequenced on theIllumina platform.
Data pre-processing, alignments and quality control. STRT reads from oocytes,zygotes, four- and eight-cell stage blastomeres and 50 pg human brain RNAsamples (Firstchoice human brain reference total RNA; Ambion, cat. no. 6,051)were first filtered, demultiplexed and trimmed by removing the 6-bp well-specificbarcodes. Samples were excluded from further steps in case of shallow sequencingdepth (o100-k reads per well) or no detected spike-in reads. Ratio of transcriptsper cell was estimated by total reads per total spike-in RNA associated reads(all with sample-specific barcodes). After pre-processing, the reads were aligned tohuman UCSC genome hg19, ArrayControl RNA spikes and human ribosomalDNA complete repeat unit (GenBank: U13369) by TopHat version 2.0.6 (ref. 27;with options—library-type fr-secondstrand—min-anchor 5—coverage-search—bowtie1 and UCSC Gene as the transcriptome index), and annotated by genomicfeatures that consider gene models and repetitive elements. Samples with eithershallow sequenced reads (o5.34, which is mean� 2 s.d. of log10 sequenced reads),low mapping rates (o60.65%, which is mean� 2 s.d. of mapping rates) or shallowspike-in reads (o50 reads; 3,540 reads in average) were discarded from furtheranalyses.
Definition of transcript far 50-ends. The aligned STRT reads were assembled bysample types using Cufflinks27 (with options --min-frags-per-transfrag 5—library-type fr-secondstrand) and counted as TFEs (Supplementary Note 1). In brief, the
K T K H R H K F S E E L LQ E L K E I F G E N C Y P D Y T T R K T L A IK F D C P V N V ID N W FQ N K R A R L P P A EK T K H R H K F S E E L LQ E L K E I F G E N G Y P D F T T R K T L A N K F D C P V N V IN N W FQ N N R A R L P P E EFW R D R IQ Y N Q SQ K D I LQ SW FQ H D P F P D K A A R EQ L A K E IG V P E S N IQ V W F K N Y R V K Q R K L DS H R K R T M F T K K Q L E D L N I L F N E N P Y P N P S LQ K EM A S K ID IH P T V LQ V W F K N H R A K L K K A KA R Q K Q T F IT W T Q K N R L V Q A F E R N P F P D IA T R K K P A EQ T G LQ E S R IQ M W FQ K Q R S L Y L K K SH R R C R T K F T E EQ L K I L IN T F N Q K P Y P G Y A T K Q K L A L E IN T E E S R IQ IW FQ N R R A R H G FQ KA R R C R T T Y S A SQ L H T L IK A FM K N P Y P G ID S R E E L A K E IG V P E S R V Q IW FQ N R R S R L L LQ RY R R P R T R F L S K Q L T A L R E L L E K T M H P S L A T M G K L A S K LQ L D L S V V K IW F K N Q R A K W K R Q QK R R H R T I F T D EQ L E A L E N L FQ E T K Y P D V G T R EQ L A R K V H L R E E K V E V W F K N R R A K W R R Q KQ R Q D R T IY N W K Q Q E V L E N H F K E EQ Y P D Y D T R Q E L A EM L N L R E Y Q V Q V W F K N R R A K R S R E RQ R R E R T T F T R A Q L D V L E A L F A K T R Y P D I FM R E E V A L K IN L P E S R V Q V W F K N R R A K C R Q Q QR H K E R T S F T H Q Q Y E E L E A L F SQ T M F P D R N LQ E K L A L R L D L P E S T V K V W F R N R R F K L K K Q QH R R N R T T F T T Y Q L H Q L E R A F E A S H Y P D V Y S R E E L A A K V H L P E V R V Q V W FQ N R R A K W R R Q EG R R P R T A F T Q N Q I E V L E N V F R V N C Y P G ID IR E D L A Q K L N L E E D R IQ IW FQ N R R A K L K R S HK R R V R T T F T T EQ L H E L E K I F H F T H Y P D V H IR SQ L A A R IN L P E A R V Q IW FQ N Q R A K W R K Q ER K R G R Q T Y T R Y Q T L E L E K E F H F N R Y L T R R R R I E IA H A L C L T E R Q IK IW FQ N R R M K W K K E NQ R R Q R T H F T SQ Q LQ E L E A T FQ R N R Y P D M S T R E E IA V W T N L T E A R V R V W F K N R R A K W R K R E
3 5 7 0 8 3 2 7 5 2 2 7 3 2 2 * 3 2 1 8 2 1 4 2 7 6 5 2 2 3 6 2 5 6 * 1 2 5 2 6 2 3 1 4 9 5 6 * * 7 6 5 * 4 5 3 2 2 2 3
R
–1012345
a
b4-Cell 8-Cell
L186
CPHX1/28–87CPHX2/24–83DUXB/15–74DPRX/16–75
DUX/102–161BDUXA/15–74
DUXA/101–160LEUTX/8–67
GSC/160–219TPRX/20–79L
OTX2/38–97ARGFX/14–73
RAX2/27–86HESX1/108–167
ISX/82–141Dm_ANTP/1–60
PITX2/92–151
PRD-like homeobox TFs
Eumetazoa
Bilateria
Chordates
Vertebrata
Eutheria
Primates
Lack in mouse
Mat
erna
l em
bryo
nic
iPS induction factors
FE169675 GSCFE403063 PITX2FE353535 ISXFE253180 RAX2FE358456 TPRXLFE165139 OTX2FE382932 HESX1FE200082 DUXBFE200101 CPHX1FE200054 CPHX2FE273734 DPRXFE367949 ARGFXFE270433 LEUTXFE262918 DUXA
FE459991 POU5F1FE567650 KLF4FE374361 SOX2FE544369 MYC
Oi
Oj
Ok Ol
Om On
Oo
Oq Or
Os Ot
Ou
Ov
Z6
Z7
Z8
Z9
ZA
ZB
ZC
ZD ZE
ZG ZH ZI
ZJ
ZK ZL
ZM ZN
ZO ZP
ZR ZS ZT
ZU ZV
ZW ZX
ZY ZZ
Oh
Og Of
Oe
Oc
Oa
4j1
4i1
4i0
4h3
4h1
4h0
4g3
4g2
4g1
4g0
4f3
4f2
4f1
4f0
4e2
4e0
4d3
4d2
4d1
4c3
4c2
4c1
4c0
4k1
4k2
4k3
4l0
4l1
4l2
4l3
4m1
4m2
4m3
8k3
8k4
8k5
8k6
8k7
8l0
8l1
8l2
8l3
8l4
8l5
8l6
8l7
8m2
8m4
8m5
8m6
8n2
8n3
8n4
8n5
8n6
L233 L185Oocyte Oocyte 4-CellZygote
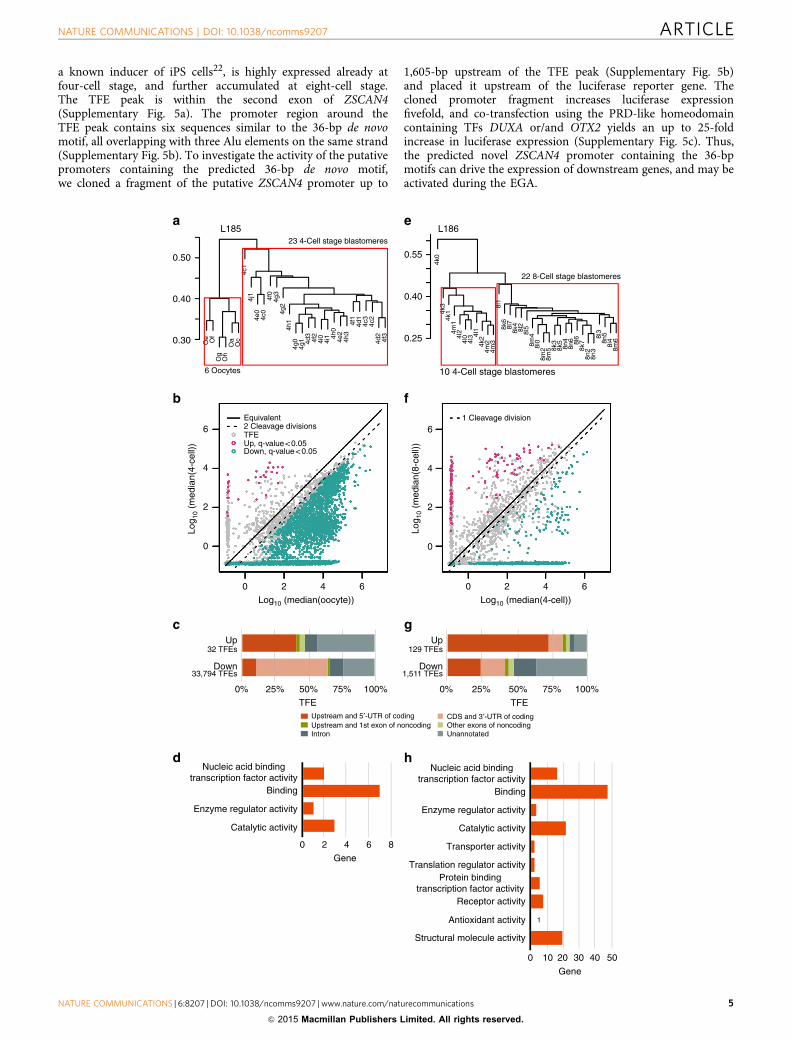
Figure 4 | PRD-like homeobox genes expression during EGA. (a) Comparison of conserved homeodomains present in novel PRD-like homeobox genes
cloned from early human development (blue shading) and in previously annotated genes (no shading). The highest degree of conservation can be found for
the amino-acid residues responsible for forming the tertiary structure of the homeodomain. Drosophila melanogaster ANTP (grey shading) is given as
reference for homeodomain proteins. The amino-acid sequences are aligned using ClustalW. (b) Early developmental expression pattern of the novel
PRD-like homeobox genes (blue shading) and previously annotated genes. The expression profiles of the so-called Yamanaka factors (iPS induction factors)
MYC, SOX2, KLF4 and POU5F1/OCT4 are shown for comparison. Heterogeneous expression between individual blastomeres at 8-cell stage (day 3 embryo)
is seen for LEUTX and CPHX1 expression in particular. In addition, a reciprocal patterning of CPHX1 and CPHX2 expression is detected in developmental
stages up until 8-cell stage, with CPHX1 being present in the oocyte, whereas CPHX2 is upregulated in a few cells of 4-and 8-cell stage embryos. The box at
the far right describes the presence (indicated by black squares) of the novel PRD-like homeobox genes and the previously annotated genes in the different
evolutionary branches. Background colour in the box visualizes the two main clusters from the heatmap (clusters shown at far left).
NATURE COMMUNICATIONS | DOI: 10.1038/ncomms9207 ARTICLE
NATURE COMMUNICATIONS | 6:8207 | DOI: 10.1038/ncomms9207 | www.nature.com/naturecommunications 7
& 2015 Macmillan Publishers Limited. All rights reserved.
50-end regions of each transcript for each sample type represent a specific 50-end ofa poly(A)þ RNA in that particular sample. In any sample, TFEs from several RNAmolecules typically overlap and represent sample specific first exons that we assigna unique ID (‘FE’ followed by number). Overlapping TFE reads were counted bysample and normalized by the spike-in molecules. Also, the TFEs were comparedwith human genome annotation by UCSC Gene (6 February 2012). The TFEs werealigned to the genome and classified as the following: (i) overlapping with 50UTRof coding transcript; (ii) upstream (up to 500 bp) of coding transcript;(iii) overlapping with coding sequence (CDS) of coding transcript; (iv) overlappingwith 30UTR of coding transcript; (v) overlapping with the first exon of noncodingtranscript; (vi) upstream of noncoding transcript; (vii) overlapping with anotherexon of noncoding transcript; (viii) overlapping with an intron of any transcript; or(ix) unannotated position. The method of TFE-based quantification and theannotation are implemented as open-source software (https://github.com/shka/STRTprep with scripts and the documents openly accessible; manuscript inpreparation).
Statistical test for differential expression. Before the differential expressiontests, we applied pvclust28 to exclude outlier samples based on their expressionprofiles. After exclusion, we tested differential expression by SAMstrt8, which isSAMseq29 modified for spike-in-based normalization.
The downregulated TFEs are a mixture of passively reduced transcripts (due tocell volume reduction by cleavage) and actively reduced transcripts (by maternaltranscript degradation). To eliminate the passive reduction effect by cell cleavagesin statistical tests for differential expression between two stages, we correct for thenumber of cell divisions (four for comparison from oocyte to four-cell stage, twofor comparison from four- to eight-cell stage) before SAMstrt and identify activelyreduced TFEs as significantly reduced after the correction. No such correction wasused to identify upregulated TFEs.
Statistical test for correlation analysis. For clustering of samples with correla-tion coefficient matrix (Fig. 1b,c)), (i) zero-read expressions in the normalizedexpression profile were masked, (ii) Spearman correlation coefficients for all pairsof the (partly masked) normalized expression values were calculated and (iii) thecoefficient matrix was clustered by complete linkage and Euclidean distance. Forclustering of TFEs, or of chromosome arms, with the normalized expressionprofile, zero-read expressions were not masked.
Promoter sequence analysis. We applied MEME30 (package version 4.9.0) formotif analysis within the active promoters. The promoters in our analysis arestrand-specific sequences from 2,000-bp upstream to 500-bp downstream of thepeak position within the clustered TFEs, and we assume that each promotersequence may contain at most one occurrence of each motif. The significant motifs(E valueo1.0� 10� 200 by MEME; red dots in Fig. 3a,b) were aligned to thepromoters again by MAST31 (in the MEME package) to reveal actual motifdistributions (P valueo1.0� 10� 10; shown as white dots in Fig. 3a,c). The locationof Alu elements within the promoters was based on Repeating Elements track byRepeatMasker in UCSC Genome Browser. The motifs were also compared withknown motifs17 by TomTom32.
Validation of novel transcripts by mRNA sequencing. To test the validity of ourfindings, we performed sequencing on single-cell mRNAs using the alternativemethod described by Tang et al10. Zygotes were frozen at the pronuclear stage(2PN) 18–20 h after fertilization. After thawing, the zona pellucidas were removedusing Tyrode’s solution followed by three washes in PBS–bovine serum albumin(1 mg ml� 1) droplets. Each single cell was put into a 0.5-ml tube containing 4.45 mlof freshly prepared cell lysis buffer and subsequently treated according to theprotocol by Tang et al10. In total, 12 single-zygote libraries were prepared, out ofwhich four were sequenced on the SOLiD platform version 4 (Applied Biosystems).Cleavage stage embryos were frozen at four-cell stage on day 2 and at eight-cellstage on day 3 after fertilization. After thawing, the four- and eight-cell embryoswere dezoned as previously described, followed by three washes in PBS–bovineserum albumin (1 mg ml� 1) and put into lysis buffer10 for downstream analysis.A total of four eight-cell embryos were collected and prepared for sequencing.The library preparations were stopped before the fragmentation step to use theselibraries for transcript cloning purposes.
cDNA cloning of novel PRD-like homeobox gene transcripts. Single humaneight-cell embryo cDNA libraries were used to clone the PRD-like homeobox TFgene transcripts. The libraries were initially prepared for sequencing according tothe method described by Tang et al.10, but stopped before the fragmentationstep and stored at � 80 �C. ARGFX, DPRX and DUXA were cloned by PCRamplification using primers designed based on human RefSeq NM_001012729.1(NCBI GeneID 503835), NM_001012728.1 (GeneID 503834) and NM_001012659.1(GeneID 503582), respectively. The sequences containing ORFs for CPHX1,CPHX2 and DUXB were predicted based on the TFEs FE200101, FE200082 andFE200054, respectively. The primer design for LEUTX was based on FE270433located in an intron of the human RefSeq sequence, NM_001143832.1 (GeneID
342900), connected to the 30UTR of predicted sequence. All primer sequences weredesigned by Primer-BLAST33 and are given in Supplementary Data 6.
The transcripts were amplified using specific primers (Supplementary Data 6)and Phusion High-Fidelity DNA polymerase (New England Biolabs) according tothe manufacturer’s instructions. ARGFX, CPHX1 and CPHX2 were amplified usinga touchdown PCR program: 98 �C for 30 s; 24 cycles of 98 �C for 10 s, annealing for30 s, temperature decreasing from 63 �C to 56 �C, 1 �C/3 cycles, 72 �C for 30 s;16 cycles of 98 �C for 10 s, 55 �C for 30 s, 72 �C for 30 s; final extension 72 �C for10 min. To amplify DUXA, DPRX and LEUTX, the following program was used:98 �C for 30 s; 40 cycles of 98 �C for 10 s, 65.9 �C (DUXB)/67.9 �C (DPRX)/71.5 �C(DUXA and LEUTX) for 30 s, 72 �C for 1 min; final extension 72 �C for 10 min. ThePCR products were cloned into pCR4Blunt-TOPO vector using Zero Blunt TOPOPCR Cloning kit (Invitrogen) and the inserts were verified by Sanger sequencing(Eurofins Genomics).
Construction of DUXA and OTX2 expression vectors. To overexpress DUXAand OTX2 in mammalian cells, the cDNAs were cloned into a modified pFastBacexpression vector. The modified pFastBac vector called CMVe.EF1a.eGFP-WPRE(kindly provided by Professor Shu Wang, Institute of Bioengineering andNanotechnology, Singapore34) was further modified as follows: the eGFP andWPRE elements were removed from the vector by EcoRI and XbaI restrictiondigestion followed by blunting by T4 DNA Polymerase (Thermo Scientific) anddephoshorylation by Antarctic Phosphatase (New England Biolabs). The IRES,eGFP and WPRE insert was amplified by Phusion DNA Polymerase (New EnglandBiolabs) from the vector FSynIGW (Addgene) with the introduction of the AscIand PacI restriction sites using the following primers: BamHI_AscI_PacI_IRES_Fwd50-tACCGGTGGATCCGGCGCGCCtaTTAATTAAgatccgcccctctccctccc-30
and WPRE_Rev 50-CTCGAGGTCGACGGTATCGAT-30 . The insert wasphosphorylated by T4 Polynucleotide kinase (New England Biolabs) and ligatedinto the vector with T4 DNA Ligase (New England Biolabs). The strandconfirmation was performed by digesting the vector with BamHI, which resultedin a single band for the correct orientation and double band for the oppositeorientation. The final structure of the expression cassette is 50-CMVe-EF1a-AscI-PacI-IRES-eGFP-WPRE-30 in the pFastBac vector.
Construction of novel ZSCAN4 promoter reporter vector. The predictedZSCAN4 promoter region containing several sequences similar to our predicted36 bp de novo DNA-binding motif was PCR amplified and cloned into pGL4.11and pGL4.25 luciferase vectors (Promega), the former being a basic vector and thelatter containing a minimal promoter. The promoter region was amplified with aprimer pair giving a promoter length of 1,605 bp (chr19:58180248–58181870)containing a TATA-box sequence at the very 30-end of the amplified fragment. Theprimer pair was as follows: 2 forward 50-ATGGTACCCCTGGAATTGGCACAGGAGT-30 and 2 reverse 50-ATTGCTAGCTGATGTGCCTCCTAAGGCTG-30 .The primers contained either KpnI or Nhe1 restriction site at their 50-end.
Luciferase reporter assay. The HEK-293 cells (ATCC, Middlesex, UK) wereseeded on 48-well plates in Dulbecco’s modified Eagle medium containing 1 g l� 1
glucose, L-glutamine and pyruvate and supplemented with 10% FBS and 2 mML-glutamine (all from Gibco). Cells were grown overnight at 37 �C in 5% CO2
and subsequently transfected with different combinations of luciferase vectorconstructs, pFastBac vector constructs and Renilla luciferase vector pGL4.74(Promega). The concentrations of single constructs were as follows: Luciferasevector 100 ng per well, pFastBac vector 100 ng per well and Renilla luciferase vector10 ng per well. The transfections were performed using Lipofectamine 2000(Invitrogen) 0.5 ml per well according to the manufacturer’s instructions. Cells wereincubated at 37 �C in 5% CO2, harvested 24 h after transfection and subjectedto Dual luciferase assay (Promega) according to the manufacturer’s protocol.Luciferase signals were measured using a TECAN infinite M200 (Tecan).
References1. Assou, S. et al. Dynamic changes in gene expression during human early
embryo development: from fundamental aspects to clinical applications. Hum.Reprod. Update 17, 272–290 (2011).
2. Galan, A. et al. Functional genomics of 5- to 8-cell stage human embryos byblastomere single-cell cDNA analysis. PloS One 5, e13615 (2010).
3. Zhang, P. et al. Transcriptome profiling of human pre-implantationdevelopment. PloS ONE 4, e7844 (2009).
4. Wong, C. C. et al. Non-invasive imaging of human embryos before embryonicgenome activation predicts development to the blastocyst stage. Nat.Biotechnol. 28, 1115–1121 (2010).
5. Yan, L. et al. Single-cell RNA-Seq profiling of human preimplantationembryos and embryonic stem cells. Nat. Struct. Mol. Biol. 20, 1131–1139(2013).
6. Xue, Z. et al. Genetic programs in human and mouse early embryos revealed bysingle-cell RNA sequencing. Nature 500, 593–597 (2013).
7. Islam, S. et al. Characterization of the single-cell transcriptional landscape byhighly multiplex RNA-seq. Genome Res. 21, 1160–1167 (2011).
ARTICLE NATURE COMMUNICATIONS | DOI: 10.1038/ncomms9207
8 NATURE COMMUNICATIONS | 6:8207 | DOI: 10.1038/ncomms9207 | www.nature.com/naturecommunications
& 2015 Macmillan Publishers Limited. All rights reserved.
8. Katayama, S., Tohonen, V., Linnarsson, S. & Kere, J. SAMstrt: statistical test fordifferential expression in single-cell transcriptome with spike-in normalization.Bioinformatics 29, 2943–2945 (2013).
9. Dobson, A. T. et al. The unique transcriptome through day 3 of humanpreimplantation development. Hum. Mol. Genet. 13, 1461–1470 (2004).
10. Tang, F. et al. RNA-Seq analysis to capture the transcriptome landscape of asingle cell. Nat. Protoc. 5, 516–535 (2010).
11. Dey, S. S., Kester, L., Spanjaard, B., Bienko, M. & van Oudenaarden, A.Integrated genome and transcriptome sequencing of the same cell. Nat.Biotechnol. 33, 285–289 (2015).
12. Hnida, C., Engenheiro, E. & Ziebe, S. Computer-controlled, multilevel,morphometric analysis of blastomere size as biomarker of fragmentation andmultinuclearity in human embryos. Hum. Reprod. 19, 288–293 (2004).
13. Piko, L. & Clegg, K. B. Quantitative changes in total RNA, total poly(A), andribosomes in early mouse embryos. Dev. Biol. 89, 362–378 (1982).
14. Braun, J. E. et al. A direct interaction between DCP1 and XRN1 couplesmRNA decapping to 50 exonucleolytic degradation. Nat. Struct. Mol. Biol. 19,1324–1331 (2012).
15. Takahashi, K. & Yamanaka, S. Induction of pluripotent stem cells from mouseembryonic and adult fibroblast cultures by defined factors. Cell 126, 663–676(2006).
16. Takahashi, K. et al. Induction of pluripotent stem cells from adult humanfibroblasts by defined factors. Cell 131, 861–872 (2007).
17. Jolma, A. et al. DNA-binding specificities of human transcription factors. Cell152, 327–339 (2013).
18. Su, M., Han, D., Boyd-Kirkup, J., Yu, X. & Han, J. D. Evolution of Alu elementstoward enhancers. Cell Rep. 7, 376–385 (2014).
19. Korenberg, J. R. & Rykowski, M. C. Human genome organization: Alu, lines,and the molecular structure of metaphase chromosome bands. Cell 53, 391–400(1988).
20. Polak, P. & Domany, E. Alu elements contain many binding sites fortranscription factors and may play a role in regulation of developmentalprocesses. BMC Genomics 7, 133 (2006).
21. Burglin, T. R. Homeodomain subtypes and functional diversity. Subcell.Biochem. 52, 95–122 (2011).
22. Hirata, T. et al. Zscan4 transiently reactivates early embryonic genesduring the generation of induced pluripotent stem cells. Sci. Rep. 2, 208(2012).
23. Zhong, Y. F. & Holland, P. W. The dynamics of vertebrate homeobox geneevolution: gain and loss of genes in mouse and human lineages. BMC Evol. Biol.11, 169 (2011).
24. Kigami, D., Minami, N., Takayama, H. & Imai, H. MuERV-L is one of theearliest transcribed genes in mouse one-cell embryos. Biol. Reprod. 68, 651–654(2003).
25. Cridland, J. M., Thornton, K. R. & Long, A. D. Gene Expression Variation inDrosophila melanogaster Due to Rare Transposable Element Insertion Allelesof Large Effect. Genetics 199, 85–93 (2014).
26. Islam, S. et al. Highly multiplexed and strand-specific single-cell RNA 50 endsequencing. Nat. Protoc. 7, 813–828 (2012).
27. Trapnell, C. et al. Differential gene and transcript expression analysis ofRNA-seq experiments with TopHat and Cufflinks. Nat. Protoc. 7, 562–578(2012).
28. Suzuki, R. & Shimodaira, H. Pvclust: an R package for assessing the uncertaintyin hierarchical clustering. Bioinformatics 22, 1540–1542 (2006).
29. Li, J. & Tibshirani, R. Finding consistent patterns: a nonparametric approachfor identifying differential expression in RNA-Seq data. Stat. Methods Med. Res.22, 519–536 (2013).
30. Bailey, T. L. & Elkan, C. Fitting a mixture model by expectation maximizationto discover motifs in biopolymers. Proc. Int. Conf. Intell. Syst. Mol. Biol. 2,28–36 (1994).
31. Bailey, T. L. & Gribskov, M. Combining evidence using p-values: application tosequence homology searches. Bioinformatics 14, 48–54 (1998).
32. Gupta, S., Stamatoyannopoulos, J. A., Bailey, T. L. & Noble, W. S. Quantifyingsimilarity between motifs. Genome Biol. 8, R24 (2007).
33. Ye, J. et al. Primer-BLAST: a tool to design target-specific primers forpolymerase chain reaction. BMC Bioinformatics 13, 134 (2012).
34. Du, J., Zeng, J., Zhao, Y., Boulaire, J. & Wang, S. The combined use of viraltranscriptional and post-transcriptional regulatory elements to improvebaculovirus-mediated transient gene expression in human embryonic stemcells. J. Biosci. Bioeng. 109, 1–8 (2010).
AcknowledgementsWe wish to express our gratitude to the anonymous donors of cells that enabled thisstudy. The present study is the result of balanced contributions by the Hovatta, Kere andLinnarsson laboratories. We thank Manuel Pensis, Roberta Pecorari and GianmarcoMomi from Procrea for zygote thawing, and Liselotte Antonsson from KarolinskaInstitutet for embryo thawing procedures. The pFastBac expression vector was a kind giftfrom Professor Shu Wang. This work was supported by the Karolinska InstitutetDistinguished Professor Award to J.K.; the Swedish Research Council to T.R.B., O.H. andJ.K., the Strategic Research Program for Diabetes funding at Karolinska Institutet to J.K.,the ALF (Stockholm County and Karolinska Institutet) to O.H.; the Jane & Aatos ErkkoFoundation and the Instrumentarium Science Foundation to E.-M.J.; and Åke Wibergand Magnus Bergvall foundation to V.T. The computations were performed on resourcesprovided by SNIC through Uppsala Multidisciplinary Center for Advanced Computa-tional Science (UPPMAX) under Project b2010037.
Author contributionsV.T. designed and performed experiments, interpreted results and wrote and edited themanuscript. S.K. designed and performed experiments, analysed and interpreted theresults, and wrote and edited the manuscript. L.V. interpreted results, designed andperformed experiments and wrote the manuscript. E.-M.J. interpreted results, designedand performed experiments and edited the manuscript. M.S. performed single-cell iso-lation experiments. E.M. and A.J. performed sequencing experiments. T.R.B. interpretedresults and edited the manuscript. G.F.-C. collected zygote material and interpreted theresults. M.J. collected part of the material. S.L. designed and directed RNA sequencing,interpreted the data and edited the manuscript. O.H. designed and directed the collectionof cells, interpreted results and edited the manuscript. J.K. designed experiments,interpreted results, edited the manuscript and directed the project. All authors read andapproved the manuscript.
Additional informationAccession codes: RNA-Seq data have been deposited in European Nucleotide Archiveunder accession code PRJEB8994.
Supplementary Information accompanies this paper at http://www.nature.com/naturecommunications
Competing financial interests: The authors declare no competing financial interests.
Reprints and permission information is available online at http://npg.nature.com/reprintsandpermissions/
How to cite this article: Tohonen, V. et al. Novel PRD-like homeodomain transcriptionfactors and retrotransposon elements in early human development. Nat. Commun.6:8207 doi: 10.1038/ncomms9207 (2015).
This work is licensed under a Creative Commons Attribution 4.0International License. The images or other third party material in this
article are included in the article’s Creative Commons license, unless indicated otherwisein the credit line; if the material is not included under the Creative Commons license,users will need to obtain permission from the license holder to reproduce the material.To view a copy of this license, visit http://creativecommons.org/licenses/by/4.0/
NATURE COMMUNICATIONS | DOI: 10.1038/ncomms9207 ARTICLE
NATURE COMMUNICATIONS | 6:8207 | DOI: 10.1038/ncomms9207 | www.nature.com/naturecommunications 9
& 2015 Macmillan Publishers Limited. All rights reserved.