Embed Size (px)
Citation preview
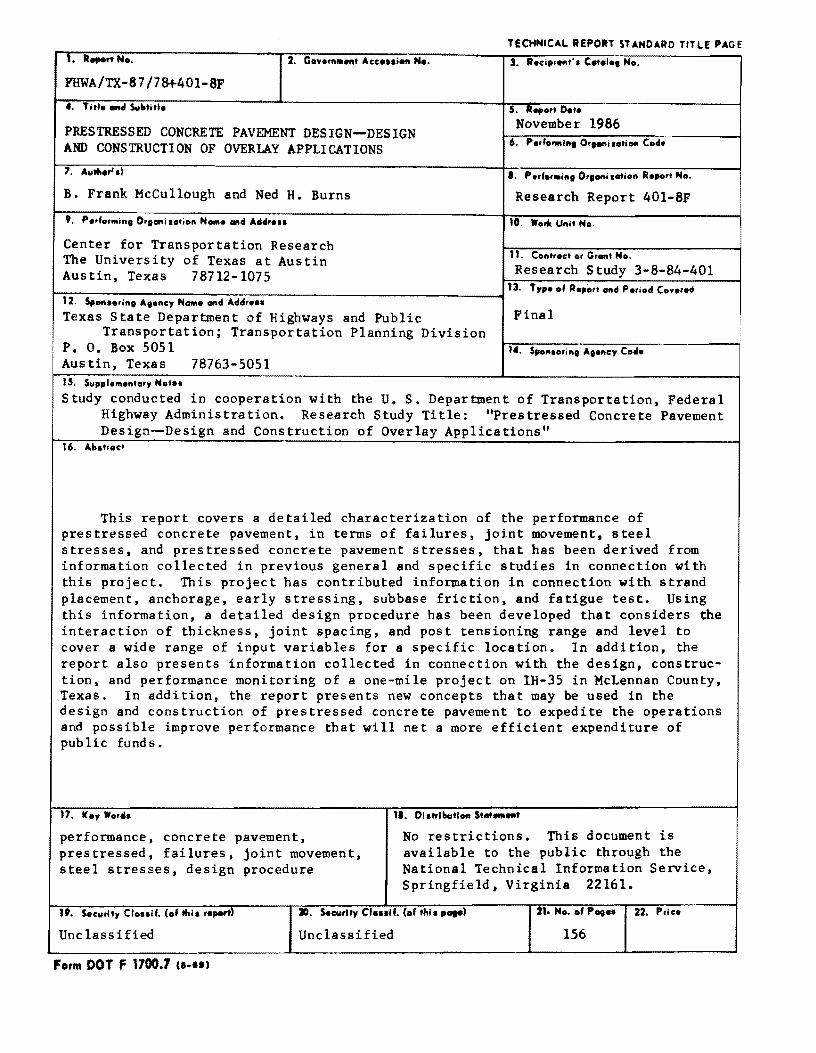
1. R.,." No. 2. GO"O"\IIUHI' Acc ••• I_ N ••
FHWA/TX-87/78+40l-8F
... T itlo aM Sullo.itlo
PRESTRESSED CONCRETE PAVEMENT DESIGN--DESIGN AND CONSTRUCTION OF OVERLAY APPLICATIONS
B. Frank McCullough and Ned H. Burns
TECHNICAL REPORT STANDARD TITLE PAGE
3. Reeip;Oftt', C.t.lo, No.
5. R .... ,' Ooto
November 1986 6. Po,fo""III, 0,,-.10"01'1 Code
Research Report 40l-8F
10. W.tIt Unit No.
Center for Transportation Research The University of Texas at Austin 11. COllt,.cto,GrOfltNo.
Austin, Texas 78712-1075 Research Study 3-8-84-401 1-;-;--:-----:----:-:----:-:-:-::------------------""" 13. Typo.f R.port 01141 P.,iod Cov.rod
12. Spoll •• ,in, A,ency N_o and Add, ...
Texas State Department of Highways and Public Transportation; Transportation Planning Division
P. O. Box 5051
Final
14. Spo",orill, A,oncy Coel. Austin, Texas 78763-5051 15. Supplemollto,,. Noto,
Study conducted in cooperation with the U. S. Department of Transportation, Federal Highway Administration. Research Study Title: "Prestressed Concrete Pavement Design-Design and Cons truction of Overlay Applica tions"
16. Abat,.ct
This report covers a detailed characterization of the performance of prestressed concrete pavement, in terms of failures, joint movement, steel stresses. and prestressed concrete pavement stresses, that has been derived from information collected in previous general and specific studies in connection with this project. This project has contributed information in connection with strand placement, anchorage, early streSSing, subbase friction, and fatigue test. Using this information, a detailed design procedure has been developed that considers the interaction of thickness, joint spacing, and post tensioning range and level to cover a wide range of input variables for a specific location. In addition, the report also presents information collected in connection with the design. construction. and performance monitoring of a one-mile project on IH-35 in McLennan County, Texas. In addition, the report presents new concepts that may be used in the design and construction of prestressed concrete pavement to expedite the operations and possible improve performance that will net a more efficient expenditure of pub lic funds.
17. K.,. W.rel.
performance, concrete pavement, prestressed, failures, joint movement, steel stresses, design procedure
fl. OJ ,trllioutlon Stet_Oft'
No restrictions. This document is available to the public through the National Technical Information Service, Springfield, Virginia 22161.
19. Security CI ... if. (.f thl, f • ...,.)
Unclassified
20. Socurlty CI ... II. Cof thi' , ... )
Un class i fied
21. No •• f POio, 22. Prico
156
Form DOT F 1700.7 , .... ,
PRESTRESSED CONCRETE PAVEMENT DESIGN -DESIGN AND CCNSTRUCTICN OF OVERLAY APPUCATlCNS
by
B. Frank McCullough Ned H. Burns
Research Report 401-8F
Prestressed Concrete Pavement Design-DeSign and Construction of Overlay Applications
Research Project 3-8-84-401
conducted for
Texas State Department of Highways and PubliC Transportation
in cooperation with the U.S. Department of Transportation
Federal Highway Administration
by the
Center for Transportation Research Bureau of Engineering Research
The University of Texas at Austin
November 1986

The contents of this report reflect the views of the authors. who are responsible for
the facts and the accuracy of the data presented herein. The contents do not necessarily reflect
the official views or policies of the Federal Highway Administration. This report does not
constitute a standard. specification, or regulation.
There was no invention or discovery conceived or first actually reduced to practice in
the course of or under this contract, including any art, method, process, machine,
manufacture. design or composition of matter, or any new and useful improvement thereof. or
any variety of plant which is or may be patentable under the patent laws of the United States of
America or any foreign country.
ii

PREFACE
This study has been a most rewarding activity for the principal investigators and CTR
staff and other individuals involved. The project took place over a three year period and has
resulted in numerous reports, including those that cover numerous significant additions to the
state-of-the-art, the last being a very encompassing design procedure that permits a more
reliable design of PCP. Although it is not possible to adequately recognize the contributions of
Neil Cable, Alberto Mendoza, Joe Maffei, Brian Dunn, Way Chia, and Scott O'Brien, these
individuals represent four Master's theses and one Ph.D. dissertation that were developed in
connection with this project. We feel these results validate the use of fresh, young minds
together with individuals with experience. to broaden the state of knowledge and provide for a
better use of tax payers' money in the design, construction, and operation of pavements. The
project also demonstrates how successful interaction with other projects and numerous phases
of one project can be used to pull together one complete design procedure.
We also wish to express our appreciation to James L. Brown, Jerry Daleiden,
Frank Craig, and Bill Wiese of the Texas State Department of Highways and Public
Transportation, who have patiently contributed many ideas and recommendations to the study.
Finally, we also wish to recognize the CTR staff of James Long, Leon Snider, Carl Bertran,
Rachel Hinshaw, Lyn Gabbert, and Sue Tarpley who have contributed to the success of this
project.
iii
B. Frank McCullough
Ned H. Burns

Blank Page
iv
UST OF REPORTS
Report No. 401-1, "Very Early Post-tensioning of Prestressed Concrete Pavements,"
by J. Scott O'Brien, Ned H. Burns, and B. Frank McCullough, presents the results of tests
performed to determine the very early post-tensioning capacity of prestressed concrete
pavement slabs, and gives recommendations for a post-tensioning schedule within the first 24
hours after casting.
Report No. 401-2, "New Concepts in Prestressed Concrete Pavement,· by Neil D.
Cable, Ned H. Burns. and B. Frank McCullough, presents the following: (a) a review of the
available literature to ascertain the current state of the art of prestressed concrete pavement;
(b) a critical evaluation of the design. construction. and performance of several FHWA
sponsored prestressed concrete pavement projects which were constructed during the 1970s;
and (c) several new prestressed concrete pavement concepts which were developed based on
(a) and (b).
Report No. 401-3, "Behavior of Long Prestressed Pavement Slabs and Design
Methodology," by Alberto Mendoza-Diaz, N. H. Burns, and B. Frank McCullough, presents the
development of a model to predict the behavior of long prestressed concrete pavement slabs
and incorporate the predictions from the model into a design procedure.
Report No. 401-4. "Instrumentation and Behavior of Prestressed Concrete
Pavements,· by Joseph R. Maffei. Ned H. Burns, and B. Frank McCullough, describes the
development and implementation of an instrumentation program used to monitor the behavior
of a one-mile-Iong experimental prestressed concrete pavement and presents the results of
measurements of ambient and concrete temperatures, horizontal slab movement, slab curling,
concrete strain, very early concrete strength, concrete modulus of elasticity, and slab
cracking.
Report No. 401-5, "Field Evaluation of Subbase Friction Characteristics," by Way
Seng Chia, Ned H. Burns, and B. Frank McCullough, presents the results of push-off tests
performed on four experimental test slabs at Valley View, Texas, to determine the maximum
coefficient of friction of several friction reducing mediums for future implementation in the
prestressed pavement projects in Cooke and McLennan Counties.
v
Research Report No. 401-6, "Friction Losses in Unbonded Post-Tensioning Tendons,"
by Brian W. Dunn, Ned H. Burns, and B. Frank McCullough, presents results from
experimental tests at Valley View, Texas, to determine friction losses in post-tensioning
tendons to be used in the prestressed concrete pavement project in McLennan County, Texas.
Data collected from the pavement project are also presented.
Research Report No. 401-7, "Effect of Prestress on the Fatigue Life of Concrete," by
Way Seng Chia, Ned H. Burns, and B. Frank McCullough, presents results from fatigue tests on
prestressed concrete beams conducted at the Portland Cement Association and The University of
Texas at Austin to determine the effects of prestressing on the fatigue life of concrete.
Research Report No. 401-SF, "Prestressed Concrete Pavement Design -- DeSign and
Construction of Overlay Applications," by B. Frank McCullough and Ned H. Burns, presents a
detailed characterization of the performance of prestressed concrete pavement, in terms of
failures, joint movement, steel stresses, and PCC stresses, that has been derived from
information collected from previous general and specific studies in connection with this
project. In this report a detailed design procedure has been developed that considers the
interaction of thickness, jOint spacing, and post tensioning range and level to cover a wide
range of input variables for a specific location. In addition, the report presents new concepts
that may be used in the design and construction of PCP to expedite the operations and possibly
improve performance that will net a more efficient expenditure of public funds.
vi

ABSTRACT
This report covers a detailed characterization of the performance of prestressed
concrete pavement, in terms of failures, joint movement, steel stresses, and prestressed
concrete pavement stresses, that has been derived from information collected in previous
general and specific studies in connection with this project. This project has contributed
information in connection with strand placement, anchorage. early stressing, subbase
friction, and fatigue test. Using this information, a detailed design procedure has been
developed that considers the interaction of thickness, joint spacing, and post tensioning range
and level to cover a wide range of input variables for a specific location. In addition, the
report also presents information collected in connection with the design, construction, and
performance monitoring of a one-mile project on IH-35 in McLennan County, Texas. In
addition, the report presents new concepts that may be used in the design and construction of
prestressed concrete pavement to expedite the operations and possibly improve performance
that will net a more efficient expenditure of public funds.
vii

Blank Page
viii

SUMMARY
In order to investigate the potential use of prestressed concrete pavements (PCP) for
highway roads, particularly for overlay applications, the Texas State Department of Highways
and Public Transportation and the Federal Highway Administration sponsored a study on the
design and construction of two one-mile prestressed overlay projects on Interstate Highway
35 in Cooke and McLennan Counties, Texas. The study was conducted by the Center for
Transportation Research at The University of Texas at Austin.
The design phase of the work plan for the project consisted of three distinct aspects:
(a) a thorough review of the available literature on design of PCP to determine the variables
that are relevant to the design of slab length, joint details, thickness, and prestress level in
the longitudinal and transverse directions, (b) development of models and procedures for
accurately predicting the effect of these variables on the elements of the PCP structure, and
(c) development of a PCP design based on (a) and (b) for implementation in both projects.
The design of the PCP slabs was also to include recommendations with regard to adequate time
of slab placement and application of prestress forces.
The McLennan County Project, located 15 miles north of Waco, Texas, was constructed
between September and November 1985. Eighteen 240-foot and fourteen 440-foot PCP slabs
were cast on the two southbound lanes of IH-35. The construction of the Cooke County Project
was cancelled due to cost, considering that it might not provide additional valuable
information, given its similarity to the McLennan County Project.
The completion of the three aspects of the McLennan County Project design led to the
study of the effect of environmental factors on PCP slabs.
Of the variables affecting PCP behavior, frictional resistance was found to be one of
the most influential. The contraction and expansion movements of PCP slabs during daily
temperature cycles are restrained by the subbase frictional resistance. The length of the
PCP slabs commonly ranges from 200 to 600 feet. As the length increases, the magnitude of
the concrete friction restraint stresses becomes more important.
ix

Blank Page
x
IMPLEMENTATION STATEMENT
The design procedure developed in connection with this study may be used on a PCP for
new construction or as an overlay of an existing pavement. The design procedure will permit
the engineer to select the optimum pavement thickness, joint spacing, and post tension level
for a specific set of conditions considering a wide range of input variables. This procedure
may be reliably applied to any project. since it has been developed on the basis of extensive
performance data.
In addition. construction procedures may be studied in more detail for possibly
expediting construction and, thus. lowering cost and also improving performance. For
example. the most effective looping pattern and stress pockets may be developed as well as
criteria for early stressing to prevent premature cracking.
Finally. the new concepts presented in Chapter 6 should be incorporated into an
experimental project to evaluate their capability and adaptability in field situations. It is
quite possible these steps will expedite the time of construction, thus lowering the cost and
permitting a more extensive use of this pavement type.
xi

Blank Page
xii
TABlE OF CCM'ENTS
PREFACE................................................................................................................................. iii
UST OF REPORTS................................................................................................................... v
ABSTRACT............................................................................................................................... vii
SUMMARy............................................................................................................................... ix
IMPLEMENTATION STATEMENT ............................................................................................. xi
CHAPTER 1. INTRODUCTION
BACKGRC>l.tJD ................. ............ .............................. .... .................. ........................ .... 1 OBJECTiVES................................................................................................................ 2 SCXJPE......................................................................................................................... 3
CHAPTER 2. FIELD EVALUATION OF SUBBASE FRICTION CHARACTERISTICS
FIELD TESTS............................................................................................................... 8 EXPERIMENTAL TESTING PROCEDURES..................................................................... 8 C<Jtv1PARIS()N OF TEST RESULTS ................................................................................ 1 0 SUMMARy................................................................................................................... 12
CHAPTER 3. TENDON LOOPING AND STRESS POCKET STUDY
EXPERIMENTAL SLABS· WOBBLE AND FRICTION COEFFICIENT .............................. 1 3 USE OF STRESSING POCKETS ...... .......... .... ............ ........ .... .................. ...... ................. 1 5 McLENNAN COUNTY OVERLAY DATA· WOBBLE AND FRICTION COEFACIENT ........... 16
CHAPTER 4. INITIAL STRESSING AT EARLY AGE OF CONCRETE TO PREVENT CRACKING
PROBLEM OF EARLY CRACKING.................................................................................. 1 9 OBJECTIVES AND SCOPE............................................................................................. 19 THE EXPERIMENT....................................................................................................... 20
Purpose.......................................................................................................... 20 Description of Test......................................................................................... 20 Testing Scheme............................................................................................... 30 General........................................................................................................... 31 Statistical Analysis and Model......... ........................ .................... .................. 31 Design Aids..................................................................................................... 31 Limitations..................................................................................................... 31 Equation.......................................................................................................... 33 Reliability Study............................................................................................ 34
xiii
Calculation Procedure.................................................................................... 34 Example.......................................................................................................... 40 Procedure....................................................................................................... 40
CHAPTER 5. INSTRUMENTATION AND BEHAVIOR OF THE TEXAS PRESTRESSED
CONCRETE PAVEMENT
INSTRUMENTATION ............ ................ .......... ........ ...................... ................................ 43
Instrumentation Development ....................................................................... 43
Field Implementation ..................................................................................... 46
BEHAViOR....................... .................. .......... ........ ............ ............ ...... .......................... 48
Data Collected. ............................ .................... ............ .......... .... ............ .......... 52
Results of Measurements............................................................................... 55
CHAPTER 6. EFFECT OF PRESTRESS ON FATIGUE LIFE OF CONCRETE
FATIGUE DESIGN ASPECT ................................... .................. ....... ....... ........................ 61 DATA FROM PCA TEST ................................................................................................ 62
Regression Analysis 1 (RA1}........................................................................ 64
Regression Analysis 2 (RA2}........................................................................ 64
Regression Analysis 3 (RA3}........................................................................ 64
DATA FROM THE UNIVERSITY OF TEXAS TEST PROGRAM........................................... 64
C<:)\J(jUJSlOlJS............................................................... ...................... ........................ 68
CHAPTER 7. ANALYSIS OF MOVEMENTS, STRESSES, ETC.
IMPORTANCE OF THE SUBBASE FRICTIONAL RESISTANCE IN THE DESIGN OF PCP SLABS...... ............ .............. ...... ........ ........ .......... ..... ............... ...................... 75
EFFECT OF THE FRICTIONAL RESISTANCE ON THE MOVEMENTS OF PCP SLABS........ 76 REVIEW OF BASIC PRINCIPLES FOR FRICTION FORCES............................................. 77 FEATURES OF THE SLAB-SUBBASE FRICTIONAL RESISTANCE OBSERVED DURING
FIELD TESTS............................................................................................................. 81 Goldbeck ............. ........................................ .................. .................................. 81 Timms ............................................................................................................ 83 Other Field Tests............................................................................................ 85
HYSTERETIC BEHAVIOR.............................................................................................. 87
xiv
NATURE OFTHE FRICTIONAL RESISTANCE UNDER RIGID PAVEMENTS..................... 90 Modeling of Friction Forces........................................................................... 93 Implications in Behavior Prediction of Assuming Elastic Friction Forces... 93 Implications in Behavior Prediction of Assuming Inelastic Friction Forces 99
CHAPTER 8. NEW CONCEPTS
DESCRIPTION OF NEW CONCEPTS.................................................................. ............ 1 07 Concept 1: Central Stressing of Slip~Formed Pavement.............................. 1 07 Concept 2: Precast Joint Panels and Slip-Formed Pavement ...................... 11 0 Concept 3: Precast Joint Panels, Central Stressing Panels, and
Slip-Formed Pavement ................................................................................ 110 Concept 4: Composite Prestressed Concrete Pavement Type I (CPCPI) ...... 115 Concept 5: Composite Prestressed Concrete Pavement Type II (CRCPII) .... 115 Concept 6: Segmentally Precast Prestressed Concrete Pavement
(SPPCP) ...... ........................................ ............ .......... .................................. 1 20 Concept 7: Continuous Composite Concrete Pavement (CCCP) ..................... 120
COMPARISON OF CONCEPT CHARACTERiSTiCS........................................................... 1 25
CHAPTER 9. SUMMARY, CONCLUSIONS, AND RECOtv1MENDATIONS
SUMMARy................................................................................................................... 133 c:<:)IJCUJSIa.JS............................................................................................................. 133 RECOMMENDATIONS................................................................................................... 1 34
REFERENCES............................................................ .................. ...... ....... ....... ........ ................ 1 37
xv
CHAPTER 1. INTRODUCTION
This report presents the findings of Research Project 4-8-84-401, entitled
·Prestressed Concrete Pavement DeSign -- DeSign and Construction of Overlay Applications,"
that was conducted by the Center for Transportation Research for the Texas State Department
of Highways and Public Transportation (SDHPT) in cooperation with the Federal Highway
Administration (FHWA). This chapter covers the background and objectives of the study and
the scope of the report.
BACKGRO...ND
After Word War II and during the 1950's, numerous prestressed concrete pavements
for airports and highways were constructed in Europe. During the same period, several PCP
airport pavements were constructed in the United States. By the 1960's the construction of
prestressed concrete had subsided. Most of these projects had been designed on an empirical
basis, and. since performance data were not collected, the basic state-of-the-art for design
experienced only limited improvement.
In the 1970's the FHWA explored the development of prestressed concrete pavements
as one of its primary research and implementation activities. They awarded a research
project with the objective of considering past experience, conducting laboratory testing, and
developing a design procedure. During this same time period, the FHWA worked closely with
four states to construct PCP on in service roadways. Projects of varying lengths were
constructed in Virginia, Pennsylvania, Mississippi, and Arizona. These projects covered a
wide range of environmental regions, from wet and cold to dry and hot. As a result of the
general interest in this topic, substantial performance data were collected from these
projects, though no activity has been instigated to review this information together and revise
the design procedure as needed. The thickness of all pavements was set at 6 inches with
excellent subbases, but there was variation in joint spacing and stressing level for the various
projects.
As a result of these activities in other states and the need for rehabilitation of many
existing pavements, the Texas SDHPT contracted with the FHWA to design, construct. and
monitor PCP overlays in Texas. It was decided to investigate projects for two different
RR401-8F/01 1
2
locations using the Center for Transportation Research to conduct the basic study with
supervision from the Texas SOHPT. Thus, Projects 1-30-84-555 and 1-90-84-556 were
initiated with the CTR in 1984. As a part of this project, the CTR was responsible for
recommending the location for construction of two projects on IH-35 In Cooke and McLennan
Counties. Each project was to be approximately one mile in length in one direction. The CTR
was also responsible for the design of, recommendations for. and monitoring of the
construction and performance of the projects. Although both projects were designed, only the
McLennan County project was constructed. due to cost factors. Although these projects are
separate from the specific topic of this report, and the results have been presented elsewhere,
the studies are highly dependent on and provide supplemental material for this project.
In order to extend the state of knowledge, the Texas SOHPT and the FHWA sponsored a
three year project with the CTR to develop an improved deSign procedure based on past
experience. The principal investigators for the project were Drs. Ned H. Burns and B. Frank
McCullough, with James L. Brown of the Texas SOHPT to provide overall guidance.
OBJECTIVES
The objective of this report is to provide an overview of the findings developed in
connection with the various phases of the project. The detailed findings may be found in the
seven other reports on various phases, as outlined in the list of reports.
The specific objectives of the study may be summarized as follows:
( 1 ) Characterize the performance of PCP in the field in terms of joint movements,
slab stresses, wheel load repetitions. support conditions, subbase friction
characteristics, environmental history, and construction techniques.
(2) From models characterizing the PCP performance as outlined in Item 1 develop
a design procedure that considers the interaction of thickness, joint spacing,
and post tensioning to develop a pavement structure for the deSign life.
(3) Assist in the design of inservice pavements, and then monitor the construction
and performance.
RR401-8F/01
3
( 4 ) Explore new concepts that may be used in the design and construction of PCP
that will make it more cost competitive with other pavement types with the
same performance characteristics.
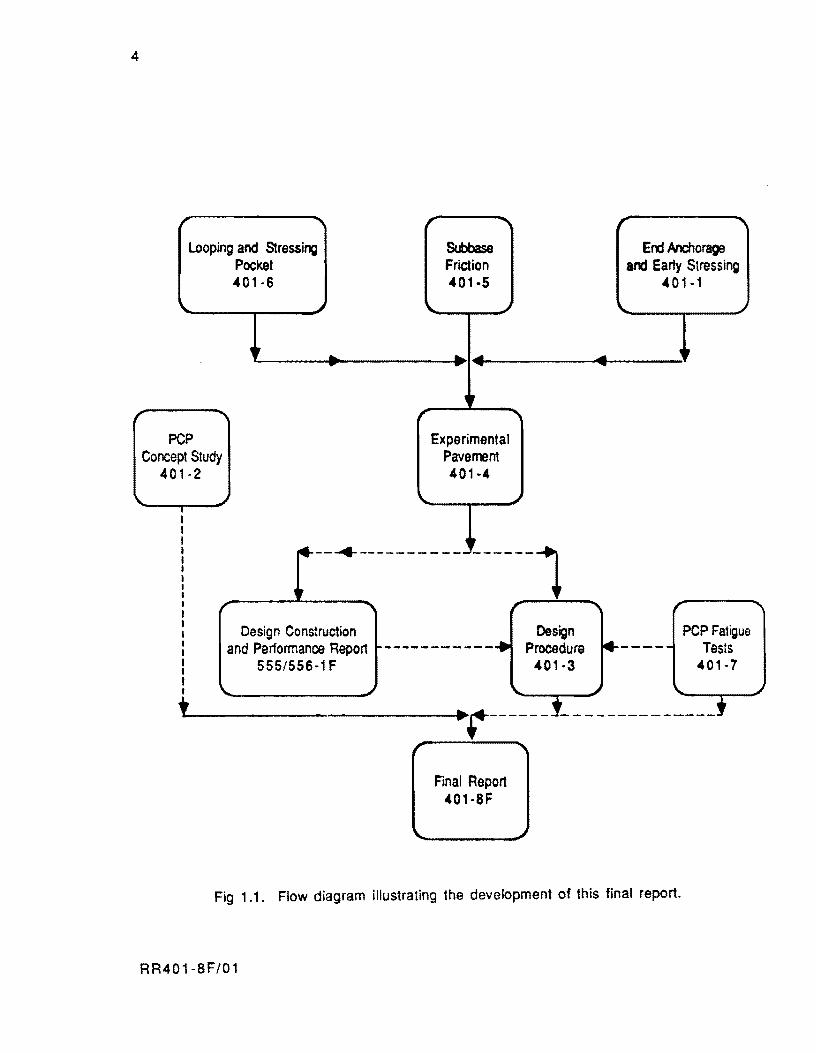
Figure 1.1 is flow diagram illustrating the development of this final report. In moving
from top to bottom the activities may be considered in terms of time. The interaction of the
various phases is shown by the arrows that illustrate the flow of information to the next
phase. The Projects 555/556 report is included in this diagram. since its activities were
instrumental in developing the findings for this particular study. Therefore, its relative
position in the development process is shown. The solid lines indicate a direct flow and
dependency of information. The dashed lines show an interaction between activities.
Chapter 2 presents a summary of the pilot subbase friction study. Chapter 3 presents
the tendon looping and stress pocket study that was conducted on slabs near Greenville. Texas.
Chapter 4 summarizes the findings of an end-anchorage study and the criteria that permit
early stressing of the pavement to prevent cracking during the first day. These studies are
basically concentrated in the first 24 hours of pavement life. Chapter 5 covers the pavement
instrumentation and observations made in connection with the experimental project
constructed on IH-35 in McLennan County. Chapter 6 covers the PCP fatigue test results on a
laboratory fatigue test. This study was conducted to provide supplemental fatigue information
to validate assumptions made relative to fatigue performance of PCP. Chapter 7 presents the
basic concepts used in a design method that permits the balancing of pavement thickness, joint
spacing, and prestress level to account for stresses developed by the input variables. Chapter
8 provides an overview of new concepts that may be used in the construction of PCP to lower
costs and improve performance. The final chapter covers the conclusions and
recommendations of this study.
RR401-8F/01
4
r
looping and Stressing Pocket 401-6
,
PC P Conce pt Study
40 1·2
.. -.
Subbase Friction 401·5
.. .. . ,
Experimental Pavement 401-4
"'
.J
I, ... --.. -----------------1
I I
t
Design Construction and Performance Report
555/556·1 F
,
Design Procedure
401·3
·r------Final Report
401·8F
, End Anchorage
and Early Stressing 401·1
PCP Fatigue Tests
401· 7
Fig 1 .1. Flow diagram illustrating the development of this final report.
RR401-8F/01
CHAPTER 2. FIELD EVALUATION OF SUBBASE FRICTION CHARACTERISTICS
In the design phase of any prestressed concrete pavement, an important factor to be
considered is the friction characteristics of the slab-support interface.
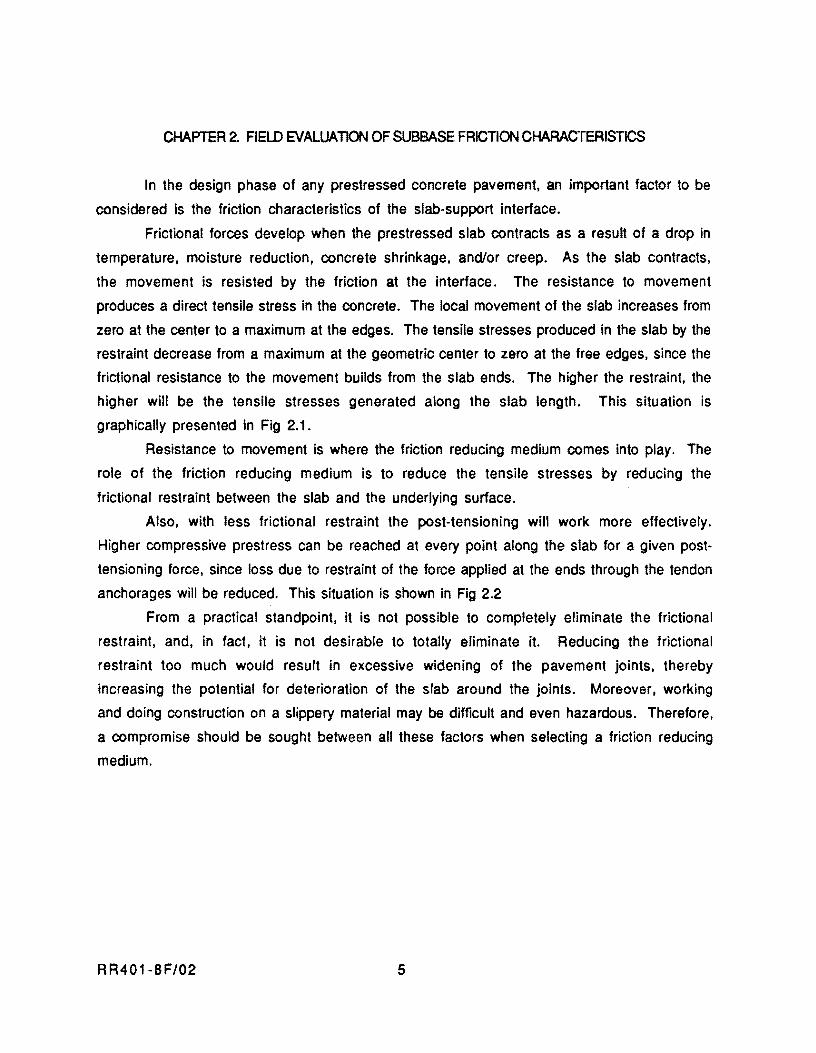
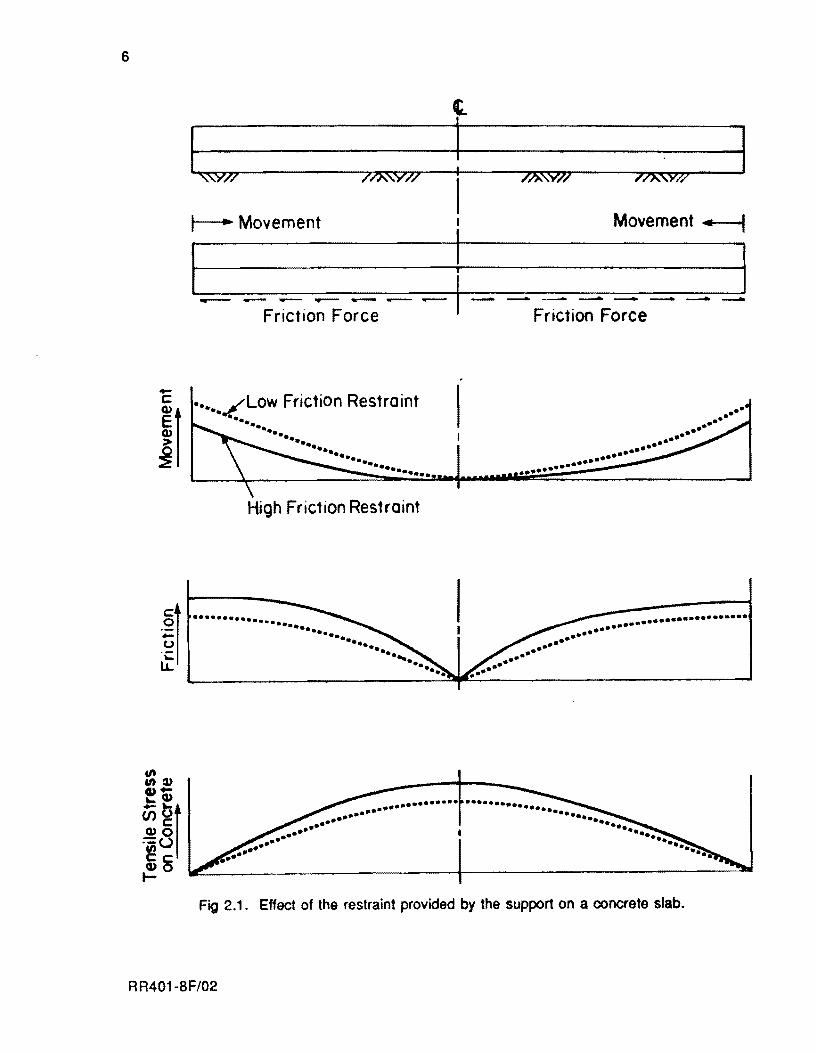
Frictional forces develop when the prestressed slab contracts as a result of a drop in
temperature, moisture reduction, concrete shrinkage, and/or creep. As the slab contracts,
the movement is resisted by the friction at the interface. The resistance to movement
produces a direct tensile stress in the concrete. The local movement of the slab increases from
zero at the center to a maximum at the edges. The tensile stresses produced in the slab by the
restraint decrease from a maximum at the geometric center to zero at the free edges, since the
frictional resistance to the movement builds from the slab ends. The higher the restraint, the
higher will be the tensile stresses generated along the slab length. This situation is
graphically presented in Fig 2.1.
Resistance to movement is where the friction reducing medium comes into play. The
role of the friction reducing medium is to reduce the tensile stresses by reducing the
frictional restraint between the slab and the underlying surface.
Also, with less frictional restraint the post-tensioning will work more effectively.
Higher compressive prestress can be reached at every point along the slab for a given post
tensioning force. since loss due to restraint of the force applied at the ends through the tendon
anchorages will be reduced. This situation is shown in Fig 2.2
From a practical standpoint, it is not possible to completely eliminate the frictional
restraint, and, in fact, it is not desirable to totally eliminate it. Reducing the frictional
restraint too much would result in excessive widening of the pavement joints, thereby
increasing the potential for deterioration of the slab around the joints. Moreover, working
and doing construction on a slippery material may be difficult and even hazardous. Therefore,
a compromise should be sought between all these factors when selecting a friction reducing
medium.
RR401-BF/02 5
6
-c::
J1
I~ r 7/XW7/
1--........... Movement
Friction Force
••• ./Low Friction Restraint •• .,t"
•••• ••• ••• ••• -.. ••• •••••• •••••••• •••
High Friction Restraint
.......•......•.. •••••• ••• --. ••••• ....
•••• --.
I I I I i
. -. . -. .••••......... •••••
. -. •••• ••••
.. -•••
• ••• ..-••
Movement .~-~
Friction Force
.. ......... .
..-• • • •• . -• •
• ••••••• • •• • •••••
• • •••• • •
•• ••
. .....••............. • ••••••
.......•...•..•. • •••••••• -.---. -.. • ••••
• •••
Fig 2.1. Effect of the restraint provided by the support on a concrete slab.
RR401-8F/02
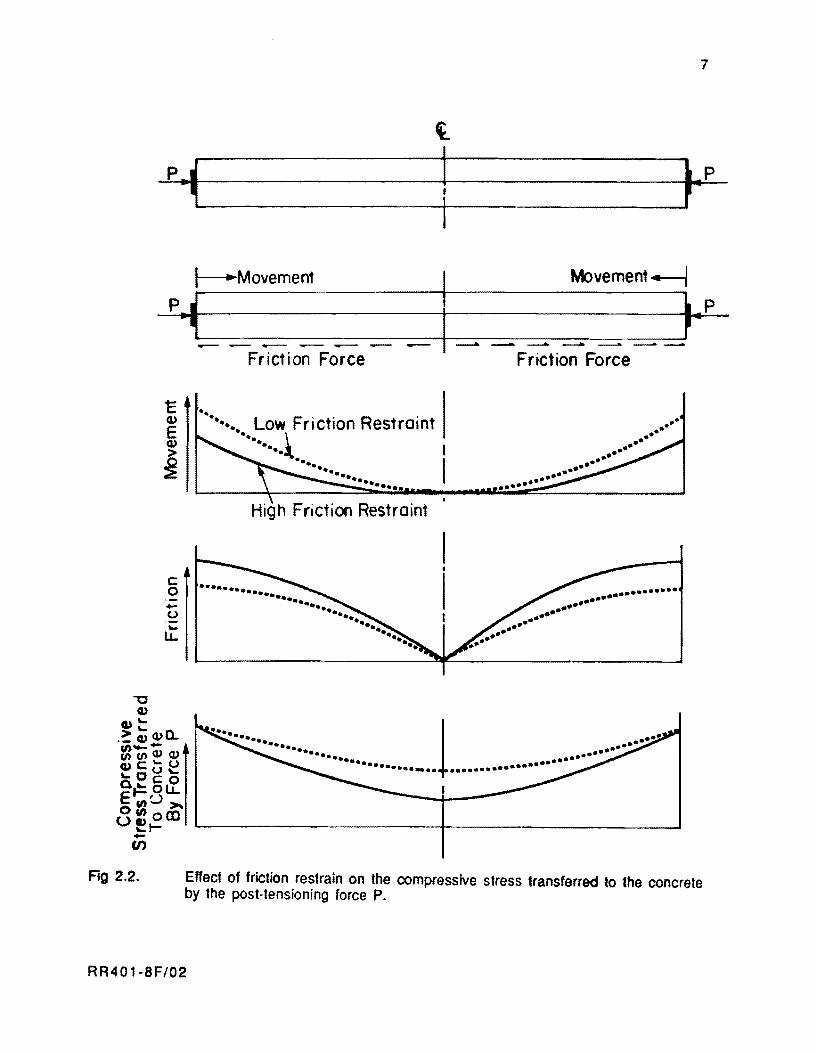
Fig 2.2.
PJ "I
P I
c Q,)
E Q,)
~
c o -u .... IJ..
"I
I I
~Movement vement
.....- -- -- - - - - ----. -- -- --Friction Force FrictIon Force
............ Low Friction Restraint ... ~ •• •• •• •• •• •••
.......•....•••
.. .. ...
••••
... ......•••
••• ••• •••• ••• •• •• .... • •• ••
• •• • •••
• ••••• ••••
•• •• •• •• • •
••• • •• •••••••••••• ••••
• ••• .-• • • •
.... 1 .. -••••••• • •••• ...••... . ....•• •••••••••• • •••••••••• .......... . ••....••.
7
t P
I P I
Effect of friction restrain on the compressive stress transferred to the concrete by the post-tensioning force P.
RR401-BF/02
8
FIELOTESTS
Three friction-reducing mediums were investigated using push-off tests conducted on
four experimental slabs.
(1 ) Test Slab NO.1: a 10 x 12 x O.5-foot rectangular slab on a double layer of 6-
mil polyethylene sheeting.
(2) Test Slab No.2: a 10 x 12 x O.S-foot rectangular slab cast on a spray applied
concrete curing compound to serve as a debonding material.
(3) Test Slab No.3: a 10 x 10 x O.S-foot square slab on a single layer of 6-mil
polyethylene sheeting.
(4) Test Slab No.4: a 10 x 20 x O.S-foot rectangular slab on a single layer of 6-
mil polyethylene sheeting.
To fully utilize the slabs. three separate sets of push-off tests were conducted over a
period of one year.· The first test was conducted on May 31 and June 1, 1984, the second test
on August 22, 1984, and the third test on April 23. 1985.
EXPERIMENTAL TESTING PROCEDURES
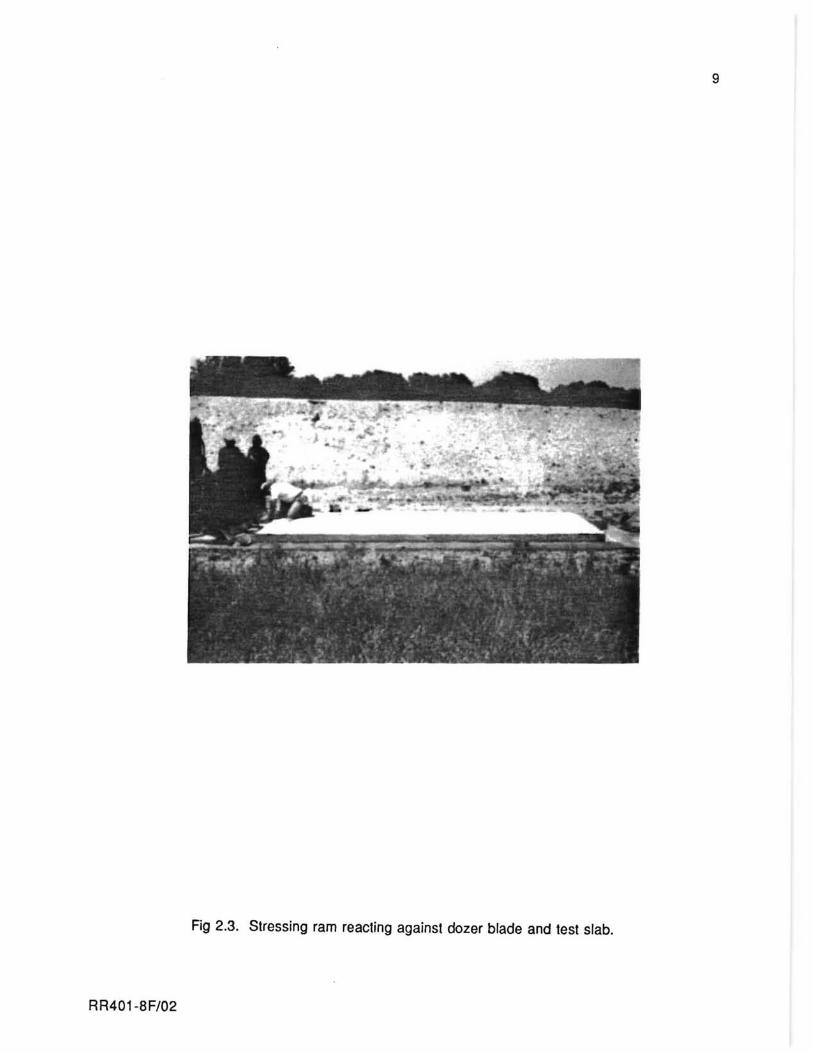
For the push-off tests. a 09 dozer was used as a dead weight to react against. The load
was applied in increments of approximately 0.5 kip with a 60-kip Enerpac center hole
stressing ram reacting against the dozer blade and the test slab, as shown in Fig 2.3. The
applied load was determined from the readings of a 100-kip load cell and checked against the
streSsing ram dial gage. Four O.S-inch travel dial gages were used on each slab to measure the
movements obtained with every load increment. Three dial gages were installed against the
slab face being loaded and a fourth gage was placed on the opposite face to detect any possible
differential movement.
The testing procedures for the third series of tests, which were conducted on April 23.
1985, were slightly different from the first two series. Details of the three series of tests
are presented in another report (Ref 1).
RR401-8F/02
9
Fig 2.3. Stressing ram reacting against dozer blade and test slab.
RR401-8F/02
10
CO\1PARISOI\I OF TEST RESULTS
A summary of test results from the three series of tests is presented in Table 2.1. The
most important parameter for comparison is the maximum coefficient of friction. For Slabs 3
and 4, respectively, the maximum coefficient of friction found in the third series of tests were
16 and 38 percent lower than those found in the first series of tests and 23 and 33 percent
lower than those found in the second series of tests. Two possible explanations are given
below.
( 1 ) The effect of weather or temperature changes in the seven month period
between the second and third series of tests may have caused movement of the
slabs, which loosened the single layer of polyethylene.
( 2) Since the personnel conducting the first and second series of tests were not
present at the third series of tests, differences in testing technique may have
caused some discrepancy. It was noted that the rate of loading affected the peak
load obtained. Differences in testing technique could not, however, be
responsible for the entire discrepancy between the third series of tests and the
first and second series of tests.
For Slab 1, the value of the maximum coefficient of friction for the third series of
tests was 13 percent higher than that for the first series of tests and 24 percent lower than
that for the second series of tests. This is the only slab for which there had been any large
variance between the results of the first and second series of tests. This increase in maximum
coefficient of friction was attributed to a bonding of the two layers of polyethylene. The
ensuing decrease in coefficient of friction recorded in the third series of test is not, however,
due to a subsequent debonding of the two layers of polyethylene. This conclusion is based on the
visual inspection of the double layer membrane, which was conducted after completion of the
third test. When Slab 1 was picked up, the double layers were found to have adhered to the
concrete. Although the two layers were not strongly fused together and could easily be pulled
apart, it was clear that during the push-off tests the two layers of polyethylene moved as one.
Also, a decrease in maximum coefficient of friction was recorded for Slabs 3 and 4, which had
only a single layer of polyethylene.
RR401·8F/02
::0 ::0 .,. o .... . 00 II -o I\)
Test Slab Number
2
3
4
Friction Relieving Material
Double Layer of Polyethylene File
Spray-Applied Bond Breaker
Single Layer of Polyelhylene Film
Single Layer of Polyelhylene Film
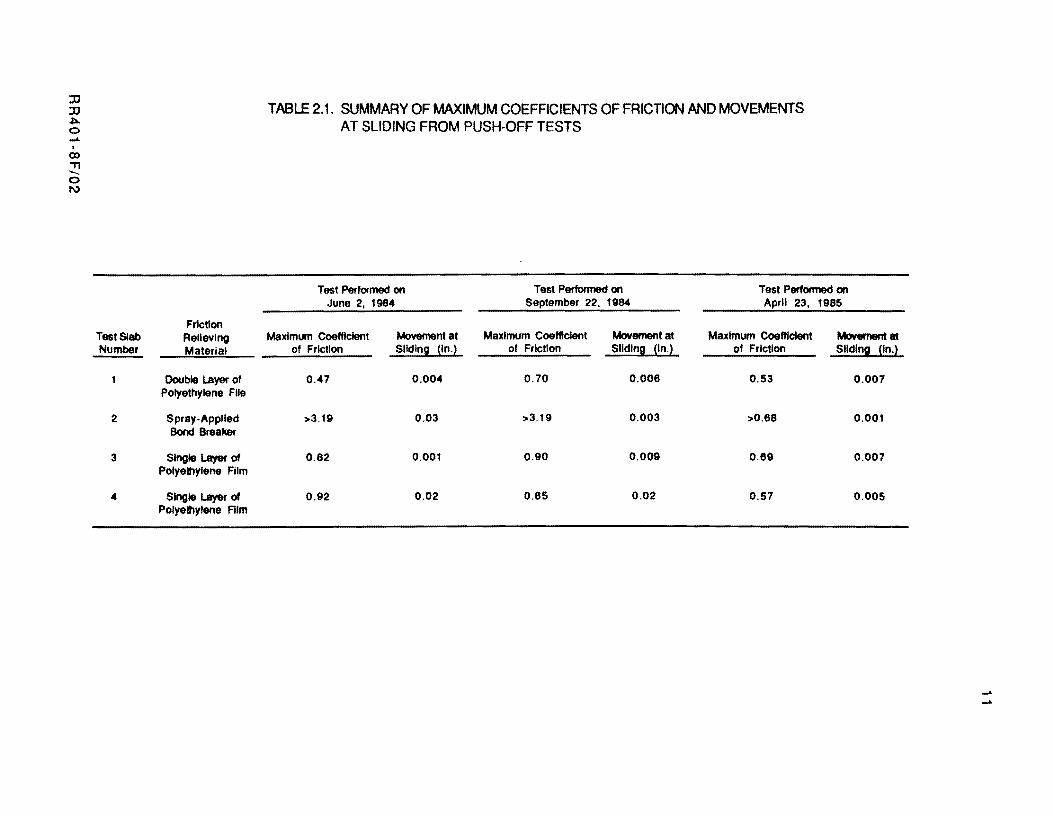
TABLE 2.1. SUMMARY OF MAXIMUM COEFFICIENTS OF FRICTION AND MOVEMENTS AT SLIDING FROM PUSH-OFF TESTS
Test Performed on Test Performed on Test Plllformed on June 2, 1984 September 22. 1984 April 23. 1985
Maximum Coefficient Movement at Maximum Coefficient Movement at Maximum Coefficient Movement at of Friction Sliding (In.) of Friction Sliding (In.) of Friction Sliding (In.)
0.47 0.004 0.70 0.006 0.53 0.007
>3.19 0.03 >3.19 0.003 >0.68 0.001
0.82 0.001 0.90 0.009 0.69 0.007
0.92 0.02 0.85 0.02 0.57 0.005
.... ....

12
SUMMARY
( 1 ) Based on the three series of tests. the best friction reducing medium is the
double layer polyethylene sheeting. Its maximum coefficients of friction range
from 0.47 to 0.70.
(2) The maximum coefficients of friction of the single layer polyethylene sheeting
range from 0.57 and 0.92.
(3) The physical dimensions of the test slabs also seem to affect the maximum
coefficient of friction. The results from the rectangular test slab produce
lower coefficients of friction in two of the three series of tests when compared
to those from the square specimen.
( 4 ) Both the single layer and double layer polyethylene sheeting were observed to
move along with the concrete slab during displacement. This indicates that the
friction measured occurred between the bottom surface of the polyethylene
sheeting and the asphalt surface.
( 5 ) The large variances in the maximum coefficient of friction between the three
series of tests indicate that the weather and temperature may have some
influence on the performance of the friction reducing medium.
(6) The spray-applied bond breaker consisting of white machine oil cut with 1/3
gasoline does not work.
RR401-8F/02
CHAPTER 3. TENDON LOOPING AND STRESS POCKET STUDY
EXPERIMENTAL SLABS - WOBBLE AND FRICTION COEFFICIENT
Prior to construction of the prestressed concrete pavement overlay in McLennan
County, a series of experimental tests were performed to provide information about the type
and arrangement of post-tensioning tendons to be used in the overlay. The test provided
information about loss of prestress due to friction, methods of stressing the tendons, and the
feasibility of certain tendon layouts. This information was helpful in making
recommendations for the construction of the overlay. All of the experimental tests were
performed on the four experimental slabs described in the previous chapter.
Tests were performed on post-tensioning tendons to determine the friction losses that
occur when the tendons are stressed through loops involving different angle changes. Analysis
of this type of friction loss was necessary since some of the alternatives proposed for
providing transverse prestress in the overlay required the looping of the tendons.
Determination of the friction loss occurring in the post-tensioning tendons was also useful in
predicting prestress losses in the straight tendons used in the overlay as well as the looped
tendons.
The frictional losses in all post-tensioning tendons can be divided in two parts: the
length effect and the curvature effect. The length effect is the amount of friction that will be
encountered if the tendon is straight with only unintended curvature in the layout from
construction. This frictional loss is dependent on the length of the tendon, the stress in the
tendon, the method used in aligning the tendon prior to the casting of the concrete, and the
coefficient of friction between the contact materials. The length effect can be substantially
reduced by using tendons which are lubricated and encased in flexible thin wall plastic
sheathing. The loss of prestress due to the intentional curvature effect is also dependent on the
coefficient of friction between the contact materials and the pressure exerted by the tendon on
the concrete as a result of the total angle change. The formula proposed by the Building Code
Requirements for Reinforced Concrete (ACI 318-83) (Ref 2) to compute the frictional losses
due to the length and curvature effects is
RR401-8F/03 13
14
where
Ps Px
k
Ix
~
ex.
.. = = = = =
prestressing tendon force at jacking end. Ib;
prestressing tendon force at point x, Ib;
wobble friction coefficient per foot of prestressing tendon;
length of prestressing tendon from jacking end to any point x in feet;
curvature friction coefficient; and
(3.1 )
total angular change of prestressing tendon from jacking end to any
point x.
In the experiments, the losses produced in loops of 180, 270, and 7200 were analyzed
for tendons coated in a plastic sheathing. The tendons were 0.6-inch-diameter, grade 270,
seven-wire prestressing strand and were lubricated with grease and coated with a 36-mil
plastic sheathing. Two of the experimental slabs had tendons with a 180iloop and the two
additional slabs contained a 2700 or a 7200 loop.
One important aspect of the experimental tests was the investigation of methods of
post-tensioning the tendons. One method consists of stressing the tendons at internal blockouts
or stressing pockets which are filled with concrete after the post-tensioning force has been
applied. In this method of post-tensioning, the stressing pocket is located at the centerline of
the slab with the two segments of the tendon extending from the pocket to anchors set in each
end of the slab. The two segments of the strand overlap in the stressing pocket and are inserted
through a steel stressing sleeve known as a lock-coupler. Anchorages are installed on the
protruding strand ends and the stressing ram is then attached to the end of one of the strand
segments. Both segments are simultaneously stressed as the prestress force is applied. The
dimensions of the stressing pockets were varied in the experiments to determine the most
efficient size for the pockets.
The tests, in part, were conducted so as to quantify the amount of the friction losses
generated through the lock-coupler device. This information, combined with the information
RR401-8 F/03
15
on friction losses due to the length and curvature effects, will enable the total losses due to
friction to be quantified.
A second method of post-tensioning the tendons was also investigated. The two ends of
the tendon to be stressed protruded from the edge of the test slabs approximately 3 feet. To
stress the tendon, one end of the tendon was anchored against the slab edge while a stressing
ram was placed on the other end. The stressing ram uses the edge of the slab to react against
while stressing the tendon. The size of the stressing ram defines how far the end of the tendon
must extend from the edge of the slab. The stressing ram used for all post-tensioning in the
tests was typical of stressing rams used in the industry for stressing single-strand tendons.
As a result of the experimental tests performed on the four test slabs, several
observations were made concerning friction losses, stressing methods, and tendon layouts.
Analysis of the measurements taken during post-tensioning operations resulted in
values for the wobble friction coefficient, k, and the curvature friction coefficient, fl. For
tendons that had no damage to the plastic sheathing, the wobble coefficient was 0.00145 and
the curvature coefficient was 0.0184. The tendons with damaged plastic sheathing had values
for k and fl of 0.00356 and 0.0355, respectively. These last tendons were probably damaged
during transportation and handling. To reduce the values of the friction coefficients and thus
the loss of prestress. it is recommended that damage to the plastic sheathing be minimized.
Using high quality plastic material for the sheathing and having sufficient sheathing thickness
should reduce damage during transportation and handling. The sheathing should be thick
enough not to crack when the tendon is curved or looped.
The loss of prestress in the lock-coupler device was observed to vary from 2.50 kips
to 4.20 kips. This loss of prestress is due to friction between the steel tendon and the steel
coupling device and must be added onto the losses due to length and curvature effects.
USE OF STRESSING POCKETS
For the post-tensioning method that involves the use of stressing pockets, the size of
the pocket is important. The required size of the stressing pocket is dependent on the type of
stressing ram to be used and also the expected tendon elongations. The width of the pocket
should be large enough to provide at least 114 inch of clearance on both sides of the ram. The
pocket length must be long enough to accommodate the fully extended ram. Since the lock-
RR401-8F/03
16
coupler device will change position during post-tensioning, the length of the pocket must be
enough to accommodate this anticipated movement. The Iock-coupler movement depends on the
anticipated tendon elongation, and, therefore, on the length of the tendon and the Slab.
The tests showed that stressing in properly sized pockets would be only slightly more
difficult than stressing the tendons at the edge of the slab. This increase in difficulty is
attributable to the more confined working space. However, on the actual pavement overlay
project, a discrepancy between the anticipated and actual stressing equipment dimensions
could have serious consequences. Since equipment dimensions vary, it is important for the
contractor to work closely with the stressing equipment suppliers in determining required
pocket Sizes when paving is done.
In placing the tendons in the looped configurations, the layouts as originally designed
could not be obtained exactly. The tendons were not flexible enough to allow sharp radius loops
and they had to be wired in all cases to maintain the required shape. Some looped
configurations may be difficult to obtain and might require that the tendon be given its shape
prior to placing it inside the formwork.
McLENNAN COUNTY OVERLAY DATA - WOBBLE AND FRICTION COEFFICIENT
During construction of the prestressed concrete pavement overlay, the post-tensioning
operations were monitored so that the actual amount of friction losses occurring could be
determined. For each tendon, the jacking force and the resulting tendon elongation were
measured. Using Eq 3.1, the wobble and curvature coefficients can be back calculated from the
data obtained from the overlay. The tendons used were the same as in the experimental tests
with the plastic sheathing in good condition. Analysis of the data gives wobble coefficients of
0.001 to 0.003 feet- 1 and a curvature coefficient of 0.089 radian-1.
Factors affecting the analysis of the data include the amount of friction loss through the
lock-coupler and the modulus of elasticity of the tendon. The friction loss assumed was
between 5 and 10 percent of the jacking. This value is an approximation based on the data
obtained in the experimental tests and can vary between lock-couplers depending on the
condition of the coupler (rusted or unrusted).
The modulus of elasticity was taken as 28,000 ksi, which is a value used by the
manufacturer of the type of tendon used and was obtained from Ref 3. The modulus of elasticity
RR401-8F/03

17
of steel is 29,000 ksi. However, in a 7-wire strand such as the one used in the overlay, the
steel wires are wrapped around each other and can twist as the tendon is stressed. If this
occurs, the tendon elongations are larger than they would be If the wires did not twist. How
the tendon is stressed determines if it will twist and thus how much elongation will occur. The
modulus of elasticity used should reflect how much the tendon twists and elongates.
RR401-8F/03

!!!!!!!!!!!!!!!!!!!"#$%!&'()!*)&+',)%!'-!$-.)-.$/-'++0!1+'-2!&'()!$-!.#)!/*$($-'+3!
44!5"6!7$1*'*0!8$($.$9'.$/-!")':!
CHAPTER 4. INITIAL STRESSING AT EARLY AGE OF CONCRETE TO PREVENT CRACKING
PROBLEM OF EARLY CRACKING
One of the attractions of prestressed concrete pavement over conventional concrete
pavement is the large reduction in the number of joints. The span between joints ranged from
400 to 760 feet in the four major U.S. projects.
However, this increased length of span between joints causes a major problem. During
the first night after casting, when the temperature drops, the pavement must contract. The
distance from the middle of the slab to the nearest joint, where movement is possible, is so
long that, as the concrete tries to move, tensile stresses build up because of the frictional
resistance of the subgrade. Then, if these tensile stresses exceed the tensile strength of the
concrete, a crack forms.
Cracks occurring during the first night after casting have been reported in the
Mississippi, Arizona, and Virginia projects. Mississippi reported cracks in 24 of 58 slabs.
Although most of the cracks were closed after post-tensioning, keeping sections uncracked is a
primary reason for prestressing pavements.
OBJECTIVES AND SCOPE
This chapter concludes with recommendations for field use through the use of design
aids and a reliability study. For more details than can be summarized in this chapter, the
reader is referred to Research Report 401-1 (Ref 4).
This study is part of an investigation to develop a design procedure for prestressed
concrete pavements and construct two demonstration projects near Waco and Gainesville,
Texas. This report presents the experimental work on the strength of concrete at very early
ages, the post-tensioning force that will cause cracking near the post-tension anchorage at
very early ages, and the field applications of this research finding to solve the problem of
temperature and shrinkage cracks.
The next section discusses the experimental program and describes the test set-up and
testing technique, and includes an explanation of the experimental parameters.
R R401-8F/04 19
20
THE EXPERIMENT
purpose
An experimental program was performed to discover the earliest possible time at
which concrete slabs could be post-tensioned to overcome tensile stresses due to temperature
and shrinkage effects without causing an anchorage zone failure. Although data from previous
tests exist, no data were available for very early post-tensioning, when concrete properties
are not the same as for more mature concrete.
Description of Test
General. The test slab design simulated the materials and cross-section of two one
mile post-tensioned concrete pavement overlays which were being constructed at Waco and
Gainesville, Texas in 1985. These demonstration projects are part of the experimental study
at The University of Texas at Austin for the development of a design procedure for prestressed
concrete pavements. The test specimens consisted of several single strand full scale concrete
slabs.
The slab width was determined by the strand spacing of the actual pavement design and
the length was taken as 4 feet for convenience of form work. Four feet was more than adequate
to develop the anchorage zone stresses. The thickness also corresponded to the actual pavement
design.
The strand used was 0.6-inch-diameter, 270 ksi, seven wire coated strand
manufactured in accordance with ASTM A-416. The strand was located 1/4 inch above
middepth. simulating the actual design, which called for strand placement 1/4 inch below
middepth. The strand was placed above middepth rather than below so that the side with the
thinner cover was visible.
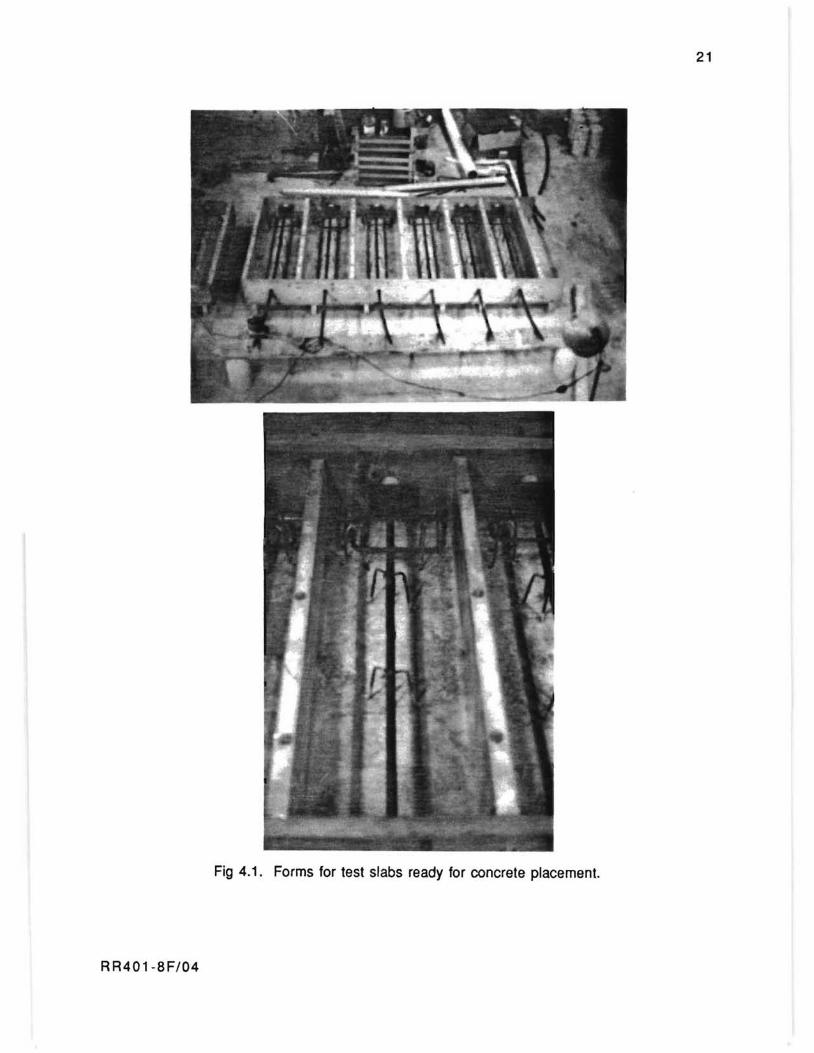
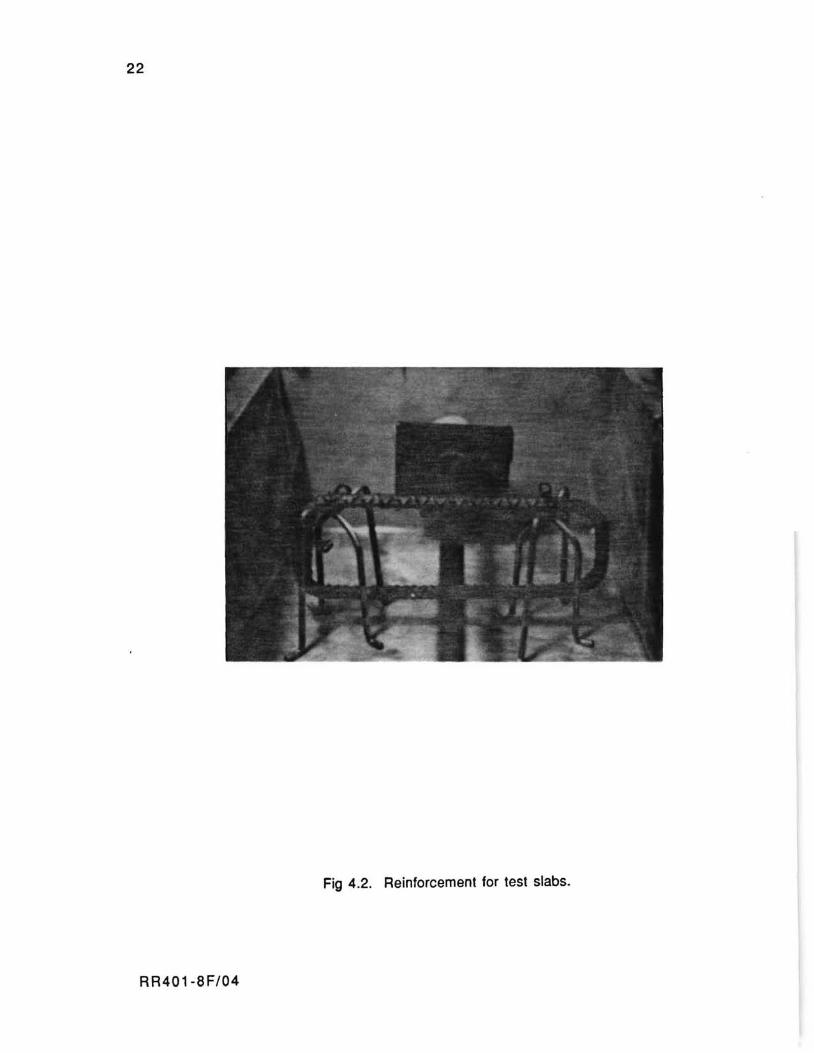
To develop the bar, a closed loop (Figs 4.1 and 4.2) was used in the narrow test slabs.
The design calls for continuous bars at the slab ends. The slabs were reinforced with one
number 4 bar above and one belOW the strand just in front of the anchor.
The forms were lined with polyethylene to be consistent with the actual slabs. which
were to be cast on polyethylene to reduce friction. The specimens could be easily removed
RR401-8F/04
21
Fig 4.1. Forms for test slabs ready for concrete placement.
RR401 -8F/04
22
Fig 4.2. Reinforcement for test slabs.
RR401-8F/04
23
from the forms because of this lining. A typical form for several slabs is shown in Fig 4.1.
Figure 4.2 shows the anchor and reinforcing bars immediately in front of the anchor.
A readymix plant supplied the concrete mix designed in accordance with Item 360 of
the Standard Texas Highway Department Specifications for slip form paving. The mix called
for 5 sacks of Type I cement per cubic yard. Strength was specified as 650 psi minimum for
center point load modulus of rupture tests at seven days. A more complete batch design is
found in Ref 4.
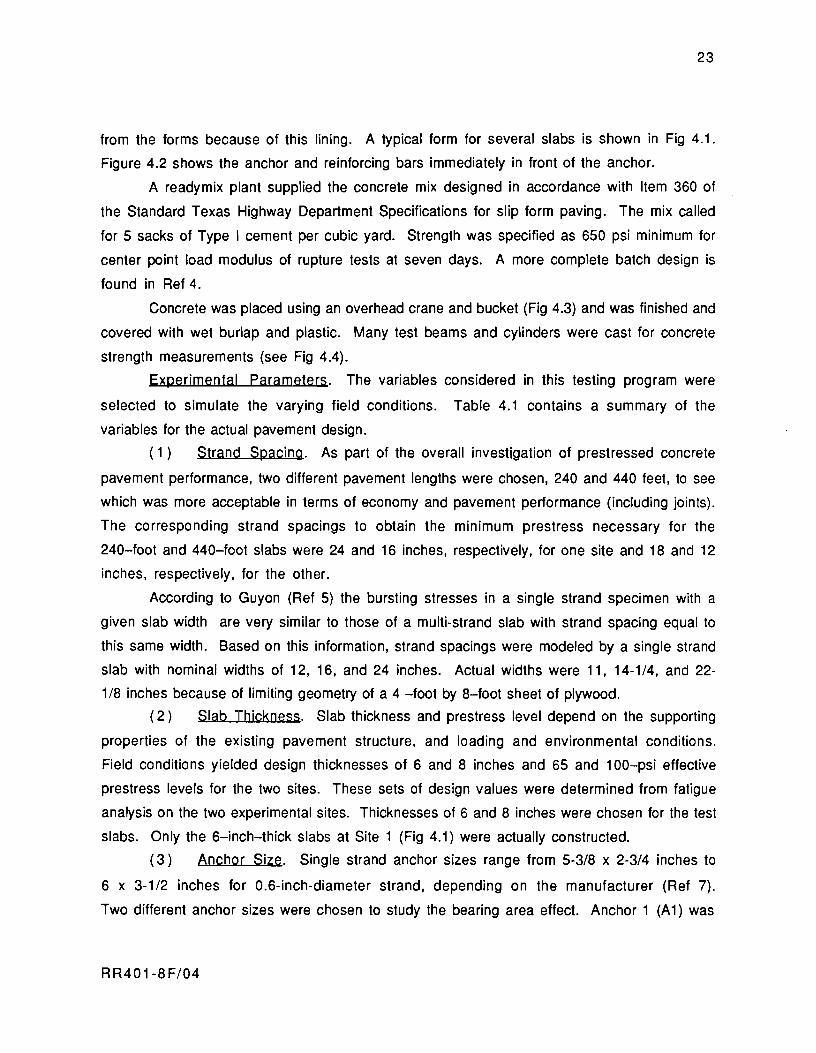
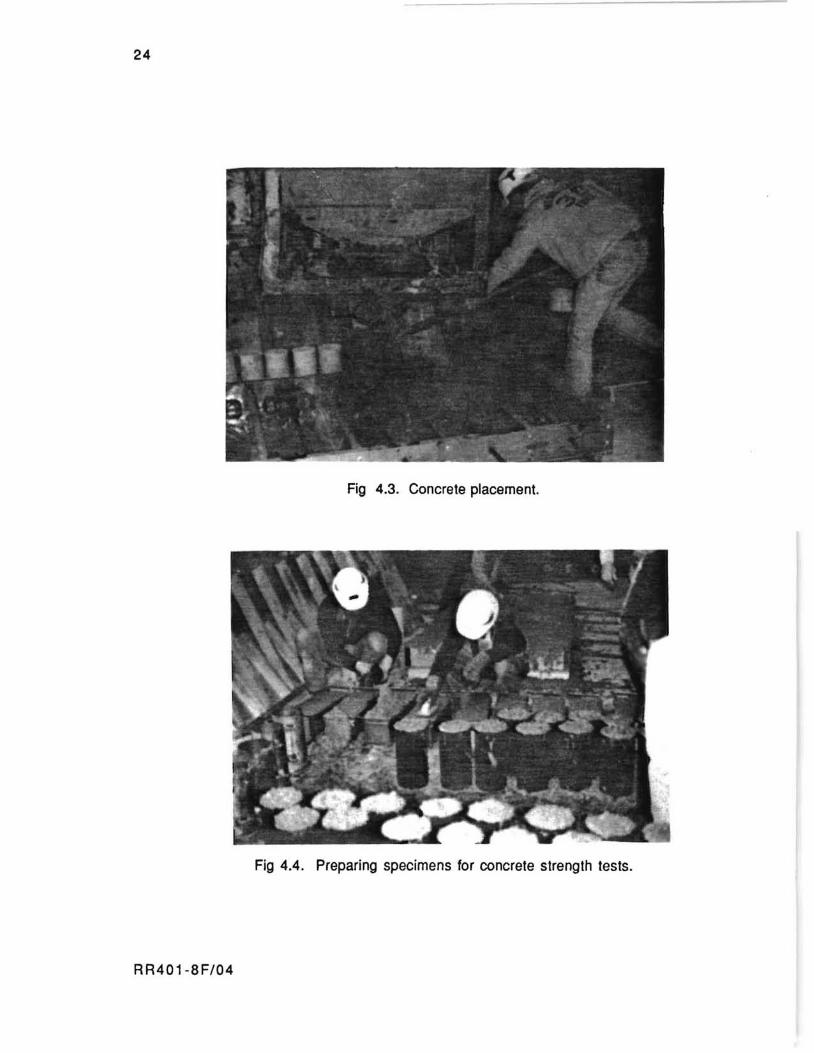
Concrete was placed using an overhead crane and bucket (Fig 4.3) and was finished and
covered with wet burlap and plastic. Many test beams and cylinders were cast for concrete
strength measurements (see Fig 4.4).
Experimental parameters. The variables considered in this testing program were
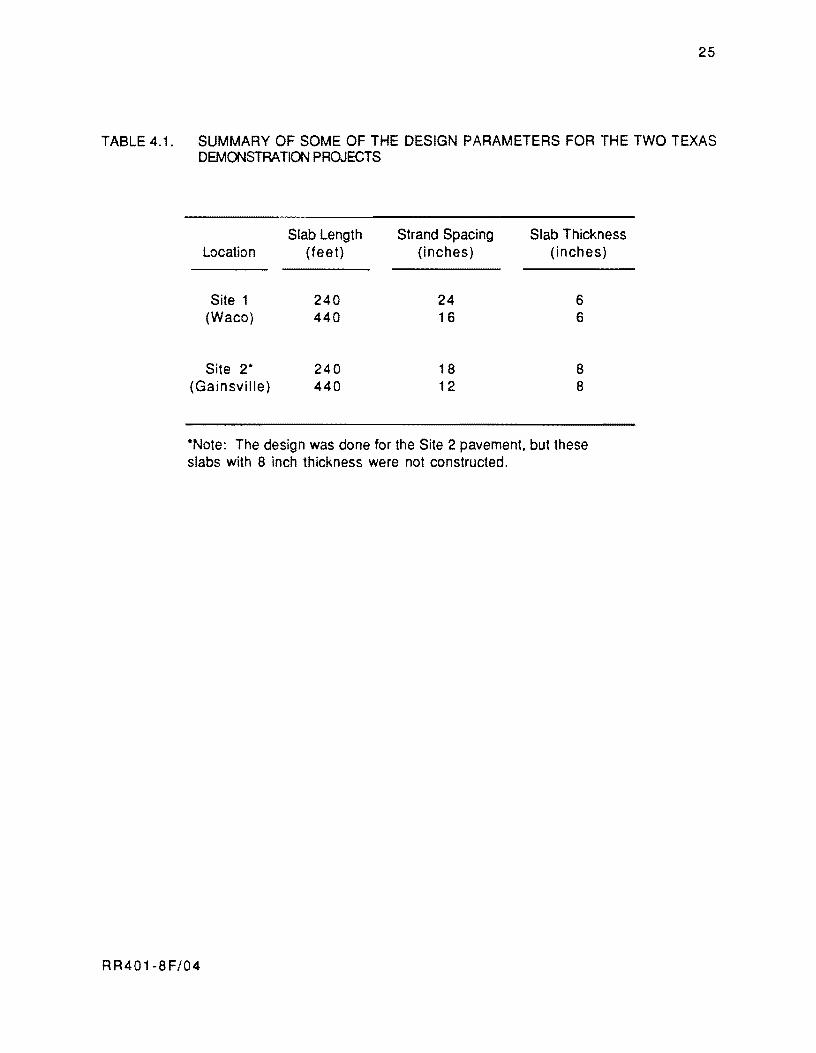
selected to simulate the varying field conditions. Table 4.1 contains a summary of the
variables for the actual pavement design.
( 1 ) Strand Spacing. As part of the overall investigation of prestressed concrete
pavement performance, two different pavement lengths were chosen, 240 and 440 feet, to see
which was more acceptable in terms of economy and pavement performance (including joints).
The corresponding strand spacings to obtain the minimum prestress necessary for the
240-foot and 440-foot slabs were 24 and 16 inches, respectively, for one site and 18 and 12
inches, respectively, for the other.
According to Guyon (Ref 5) the bursting stresses in a single strand specimen with a
given slab width are very similar to those of a multi-strand slab with strand spacing equal to
this same width. Based on this information, strand spacings were modeled by a single strand
slab with nominal widths of 12, 16, and 24 inches. Actual widths were 11, 14-1/4, and 22-
1/8 inches because of limiting geometry of a 4 -foot by 8-foot sheet of plywood.
(2 ) Slab Thickness. Slab thickness and prestress level depend on the supporting
properties of the existing pavement structure, and loading and environmental conditions.
Field conditions yielded design thicknesses of 6 and 8 inches and 65 and 100-psi effective
prestress levels for the two sites. These sets of design values were determined from fatigue
analysis on the two experimental sites. Thicknesses of 6 and 8 inches were chosen for the test
slabs. Only the 6-inch-thick slabs at Site 1 (Fig 4.1) were actually constructed.
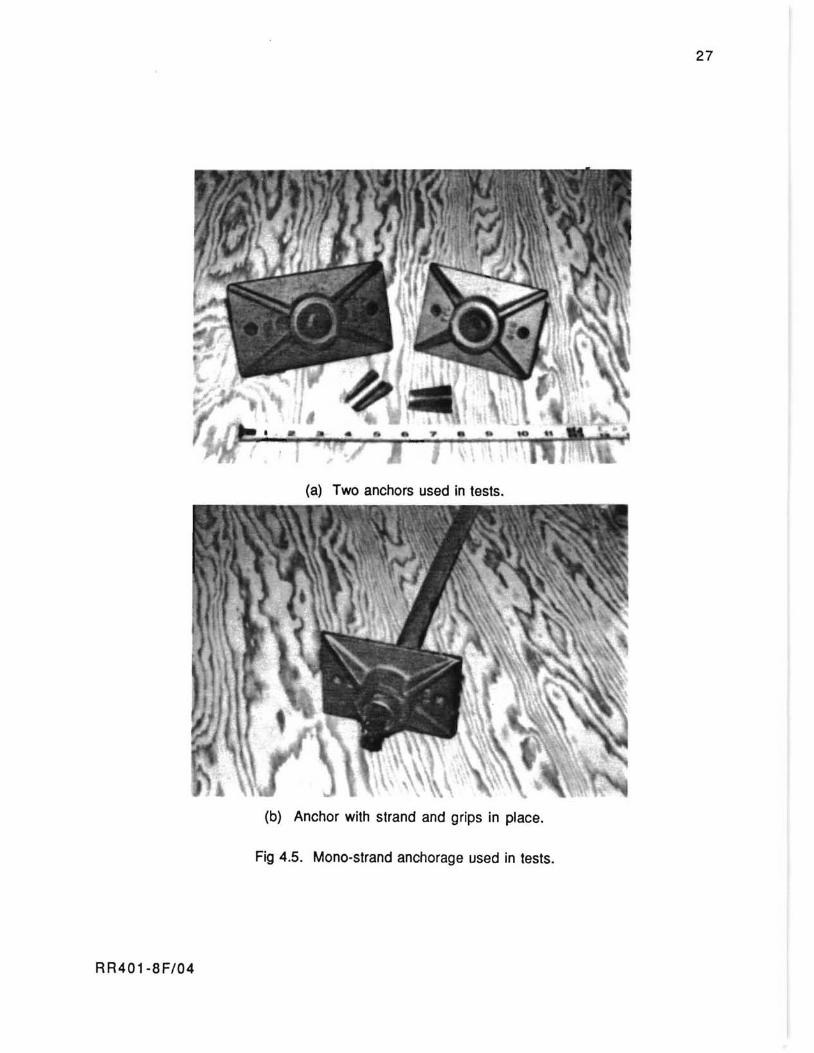
(3 ) Anchor Size. Single strand anchor sizes range from 5-3/8 x 2-3/4 inches to
6 x 3-1/2 inches for 0.6-inch-diameter strand, depending on the manufacturer (Ref 7).
Two different anchor sizes were chosen to study the bearing area effect. Anchor 1 (A 1) was
RR401-8F/04
24
Fig 4.3. Concrete placement.
Fig 4.4. Preparing specimens for concrete strength tests.
RR401-8F/04
25
TABLE 4.1. SUMMARY OF SOME OF THE DESIGN PARAMETERS FOR THE TWO TEXAS DEMONSTRATION PROJECTS
Slab Length Strand Spacing Slab Thickness Location (feet) (inches) (inches)
Site 1 240 24 6 (Waco) 440 16 6
Site 2* 240 18 8 (Gainsville) 440 12 8
*Note: The design was done for the Site 2 pavement, but these slabs with 8 inch thickness were not constructed.
RR401-8F/04
26
4-5/8 x 3-1/2 inches and anchor 2 (A2) was 6 x 3-1/2 inches. These were in the mid to
large size range. The anchors are shown in Fig 4.5.
( 4) I.i.m..e.. Since the objective of the testing program was to determine the earliest
possible time at which post-tension force could be applied, time after casting at which the
slabs were tested was a very important variable. Time since concrete batching was also used,
as a more general indicator. The first crack on previous projects occurred during the first
night. and, therefore, a 24-hour testing schedule was established. For the first two series
testing times of 6, 12, 18, and 24 hours after casting were chosen. The times were revised to
4, 8, 12, and 16 hours for the third series.
Other Parameters Measured. Several parameters were not controlled, but were
measured because they have an influence on the results of the study. These were (1) ambient
temperature, (2) concrete temperature, (3) concrete maturity, and (4) concrete strength.
Concrete strength was measured using three different testing means: compressive
strength, tensile strength, and flexural strength. Compressive strength was measured by
testing three 6-inch-diameter by 12-inch-tall cylinders at each testing time. Tensile
strength was measured using the 6-inch by 12-inch cylinders in a split cylinder test, and
flexural strength was measured using the 6 x 6 x 23-inch beam in a modulus of rupture test
with center point loading on an 18-inch span.
Testing Apparatus. This section describes the manner in which the slab anchorage
zones were tested, including the means of load application and load measurement and the
loading technique.
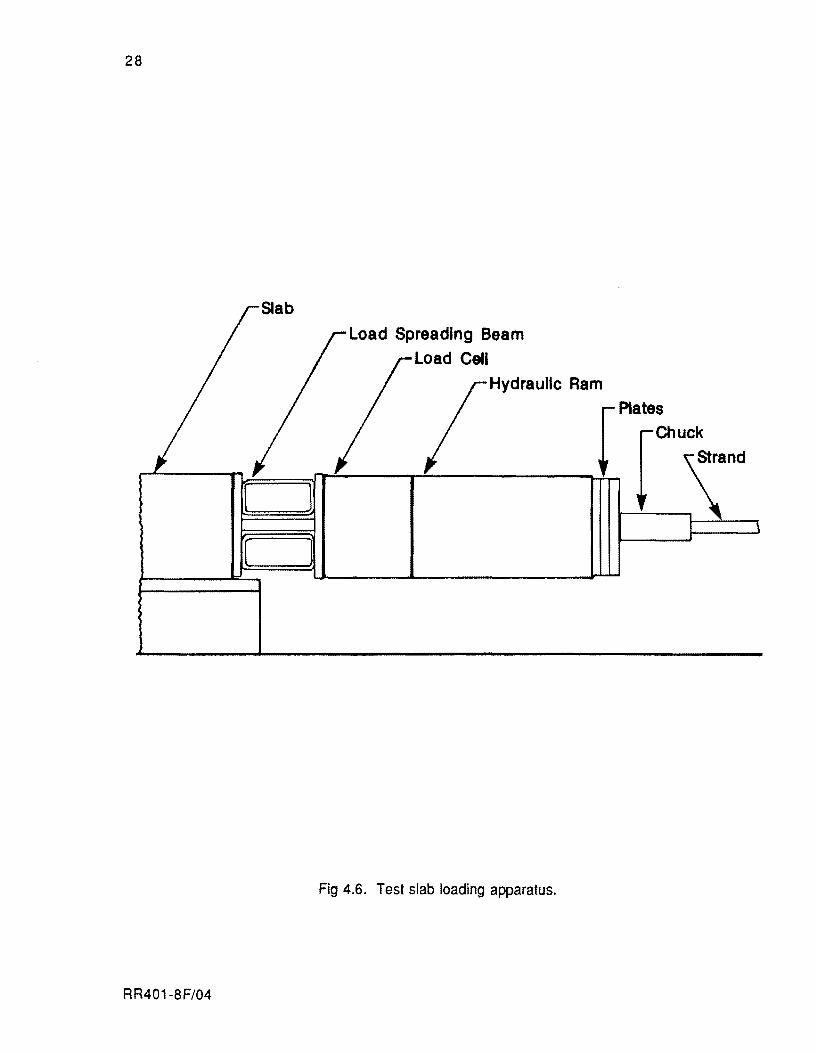
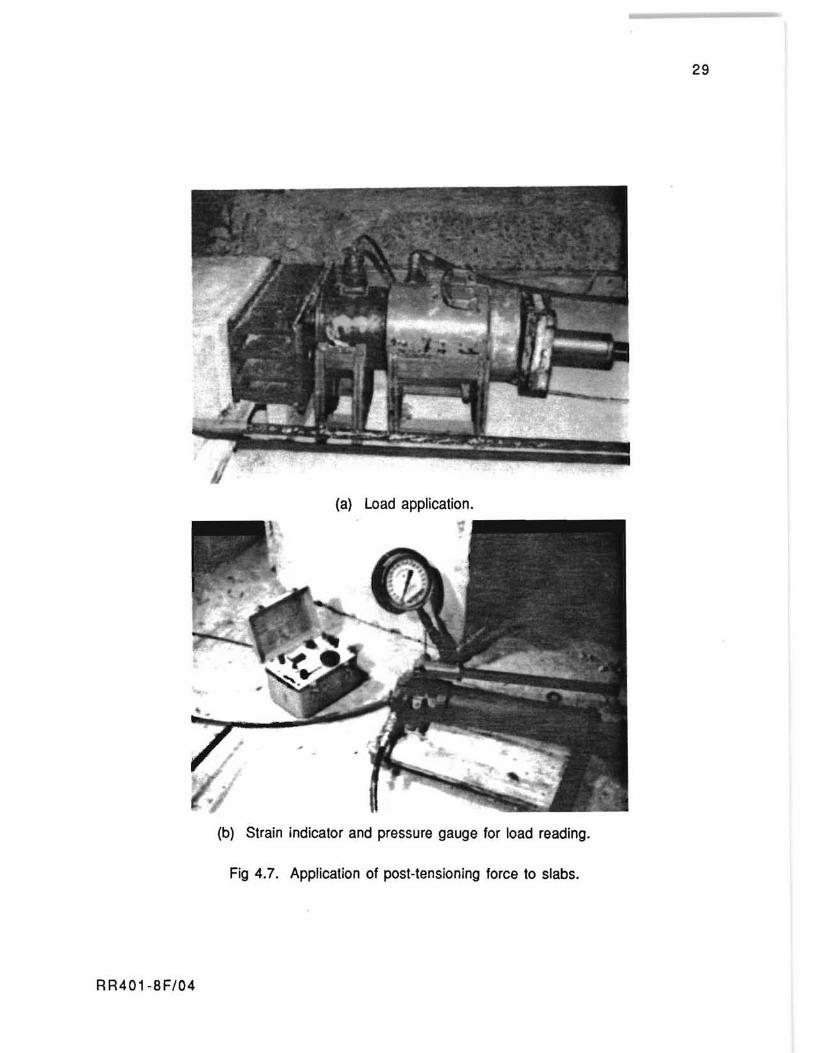
( 1 ) Load Application. For each of the test specimens the strands were stressed
using a hydraulic ram with a hand pump. Load was applied slowly through a stiff spreader
beam so as to distribute the load over the area of the slab end face, thus avoiding concentrated
loads and possible localized failures (see Figs 4.6 and 4.7).
( 2 ) Load Measurement. Loads were measured using a load cell and a strain indicator
which were calibrated before and after the tests. A pressure gauge for the ram was used as a
backup load measuring device (see Fig 4.7).
(3) Loading TechniQue. After removing the forms, loads were applied slowly at
small intervals. Due to the violent nature of some of the failures, crack observation was done
after each load interval rather than during loading. For this reason there is slight uncertainty
RR401-8F/04
27
(a) Two anchors used in tests.
(b) Anchor with strand and grips in place.
Fig 4.5. Mono-strand anchorage used in tests.
RR401-8F/04
28
Slab
( J
RR401-8F/04
Load Spreading Beam Load Cell
Hydraulic Ram
Fig 4.6. Test slab loading apparatus.
Plates Chuck
29
(a) Load application.
(b) Strain indicator and pressure gauge for load reading.
Fig 4.7. Application of post-tensioning force to slabs.
RR401-BF/04
30
as to 'the exact load at which cracking occurred, but the intervals were small enough for the
recorded cracking load accuracy to be within 1 kip.
Testing Scheme
Testing was completed in three different series. Each series had a certain purpose and
set-up. The following sections describe the purpose and set-up of each series.
Series I.
( 1 ) purpose. The purpose of test Series I was threefold: (1) to test the loading
apparatus and overall testing scheme, (2) to check for scatter in data (three identical slabs
were tested each time to find out the range of cracking loads and ultimate loads), and (3) to set
some preliminary data points for the study.
(2) Set-up. The test slabs of Series I were all 6 inches thick, 16 inches wide, and
contained a small anchor.
Series II.
(1 ) purpose. The purpose of Series II was to complete the testing of 6-inch-thick
slabs by varying the specimen width and the anchor size. Only one slab was constructed and
tested for each set of variables. because little scatter of data was observed in Series I.
(2) Set-up. The test slabs in this series were all 6 inches thick and had widths of
16 and 24 inches. The anchor size was varied. The small anchor is designated anchor 1 (A 1),
and the larger anchor is designated anchor 2 (A2).
Series III.
(1 ) purpose. There were three purposes of Series III. The first was to include the
variables slab thickness and strand spacing. The second was to repeat tests of Series I because
of the poor quality of the concrete for the first tests. The final purpose was to test one double
strand slab.
(2) Set-up. All slabs contained the small anchor plate. because the second series of
tests showed that the size of the anchor did not affect the results substantially. Five 6-inch
slabs were cast. Four were 16 inches wide and one was 32 inches wide. The 32-inch slab
RR401-8F/04
31
contained two strands which were stressed simultaneously for comparison with the single
strand slabs.
Ten 8-inch-thick slabs were cast and tested. Four were 24 inches wide, four were 16
inches wide, and two were 12 inches wide., All 8-inch-slabs contained one strand each.
General
One of the major purposes of this study was to obtain practical values for cracking
loads for post-tensioned slabs and to make recommendations for field use. This section
contains a reliability study, some design aids, and an outline for the procedure to follow in
calculating a practical allowable post-tensioning force.
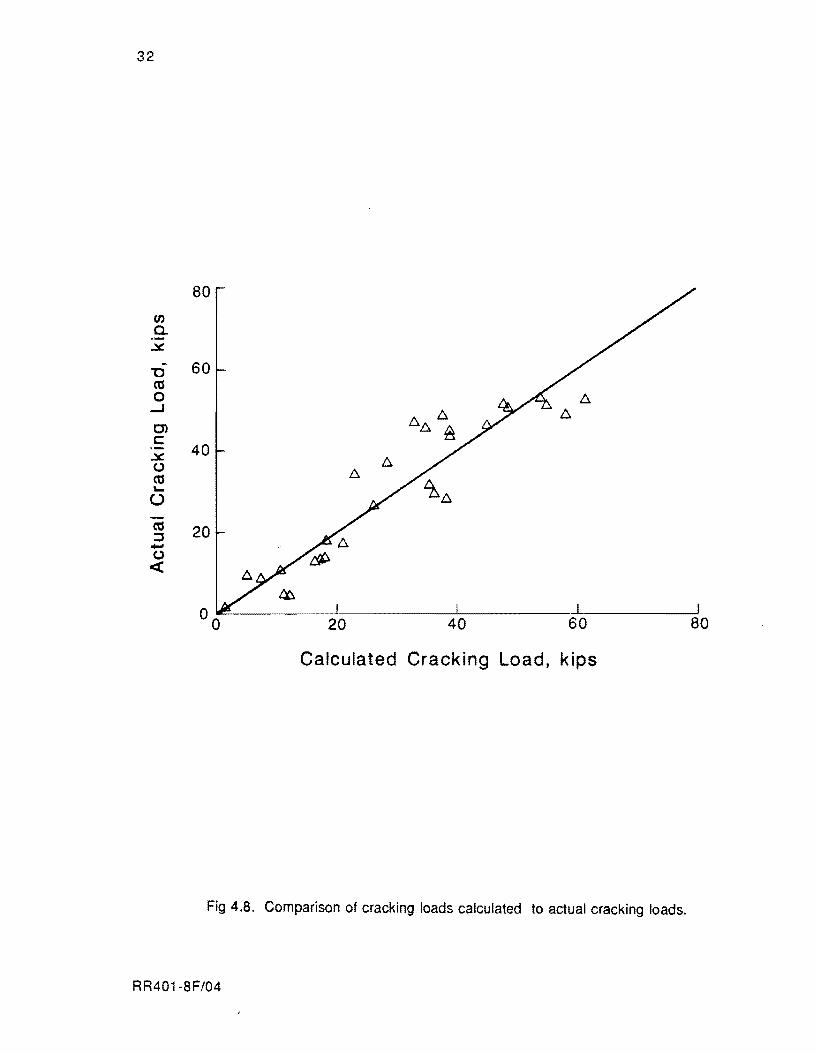
Statistical Analysis and Model
A statistical computer program for stepwise multiple regression (STEP-01) was used
to analyze the test data for the influence of the different variables on the cracking load. From
the data, the program computes a sequence of multiple linear regression equations in a
stepwise manner. Variables are added and removed from the regression equation, depending on
whether or not they improve the accuracy of the equation. The calculated cracking load is
compared to the actual cracking load in Fig 4.8. The regression equation is presented in the
next section.
DesiQn Aids
Three techniques for calculating the cracking load are presented below: a cracking load
equation, tables of cracking loads for different variables, and a graph of cracking load versus
concrete tensile strength for different variables.
Limitations
Due to their empirical nature, each of the three methods for calculating cracking load
is limited to applications similar to those of this study. These are the restrictions:
RR401-8F/04
32
80
en a. ~
- 60 "0 C'CS 0 ~
C) c::
40 ~ 6. 0 6. C'CS '-U
C'CS 20 :::::J +J 0 «
00 I I
20 40 60 80
Calculated Cracking Load, kips
Fig 4.S. Comparison of cracking loads calculated to actual cracking loads.
RR401-SF/04
33
( 1 ) Concrete tensile strengths were between one and 260 psi based on split tensile
tests.
(2) Slab thicknesses were 6 and 8 inches.
(3) Strand spacings were between 12 and 24 inches.
( 4) Anchors were single 0.6-inch·diameter strand flat plate anchors for slabs at
16.19 and 21.00 square inches in areas.
( 5 ) Strands were placed 1/4 inch above middepth. but eccentricity was not varied.
Equation
The data regression program yielded terms for an equation to estimate the cracking
load. The equation in a slightly simplified form is
1
Per = 3.25 t - 0.08 (2a) (a") + 0.002 f!p t (2a) (aft) (4.1 )
where
Pcr = cracking load, kips;
= slab thickness, inches;
2a = strand spacings, inches;
fsp = concrete tensile strength, psi; and
an anchorage area, inches2.
The equation fits the test data well for most combinations of variables. Problems do
arise when cracking loads are calculated for very low concrete strengths. For example. if a
concrete tensile strength of zero psi is input, the cracking load does not come out to equal O.
For low values of thickness and high values of strand spacing and/or anchor size, the
calculated cracking load is negative, which is conservative. For high values of thickness and
low values of strand spacing and/or anchor size, the calculated cracking load is positive, which
is unconservative.
R R40 1-8F/04
34
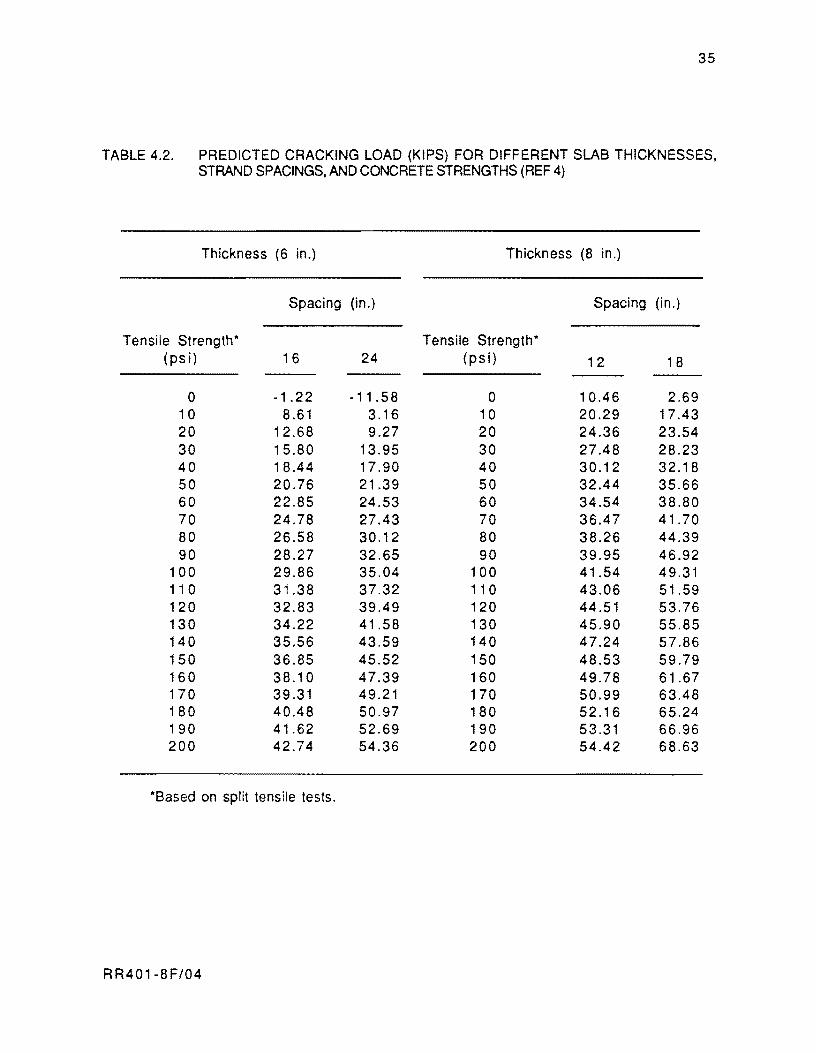
I.a..b..I..e.. Equation 4.1 was used to generate a table of cracking loads for the slab
thicknesses and strand spacings to be used in the actual design of the prestressed concrete
pavement (see Table 4.2). The smaller anchor (A 1) used in the test was used in the
calculations.
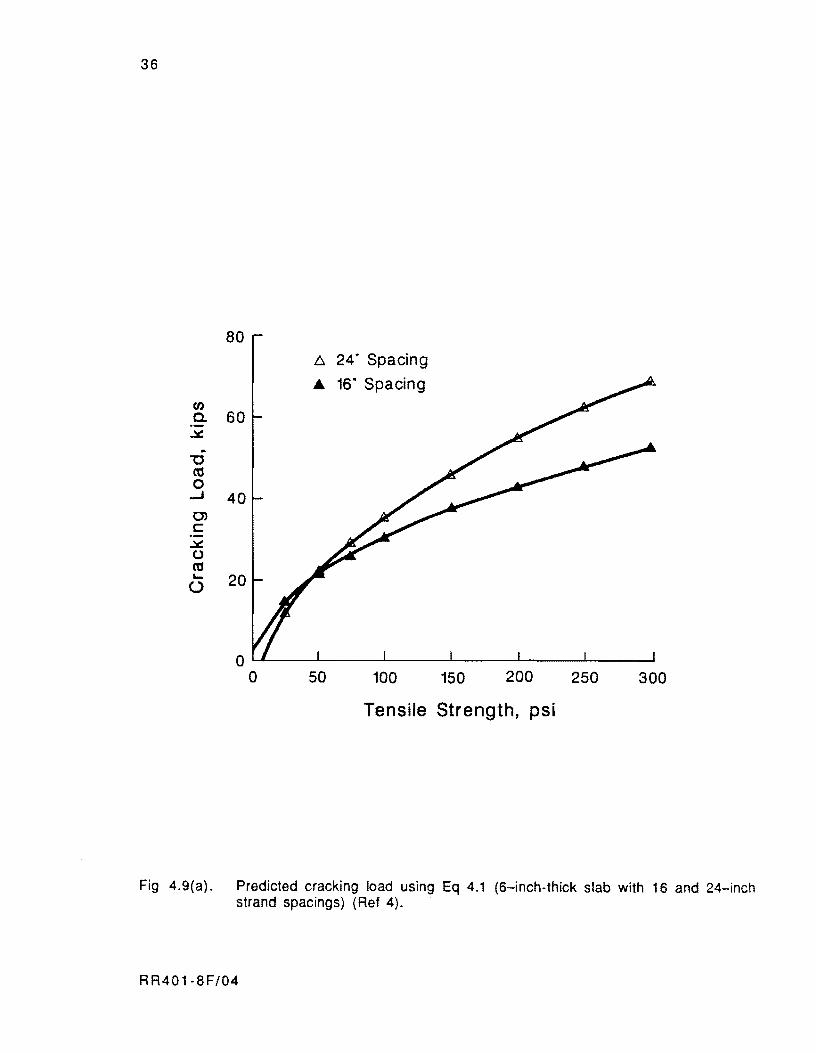
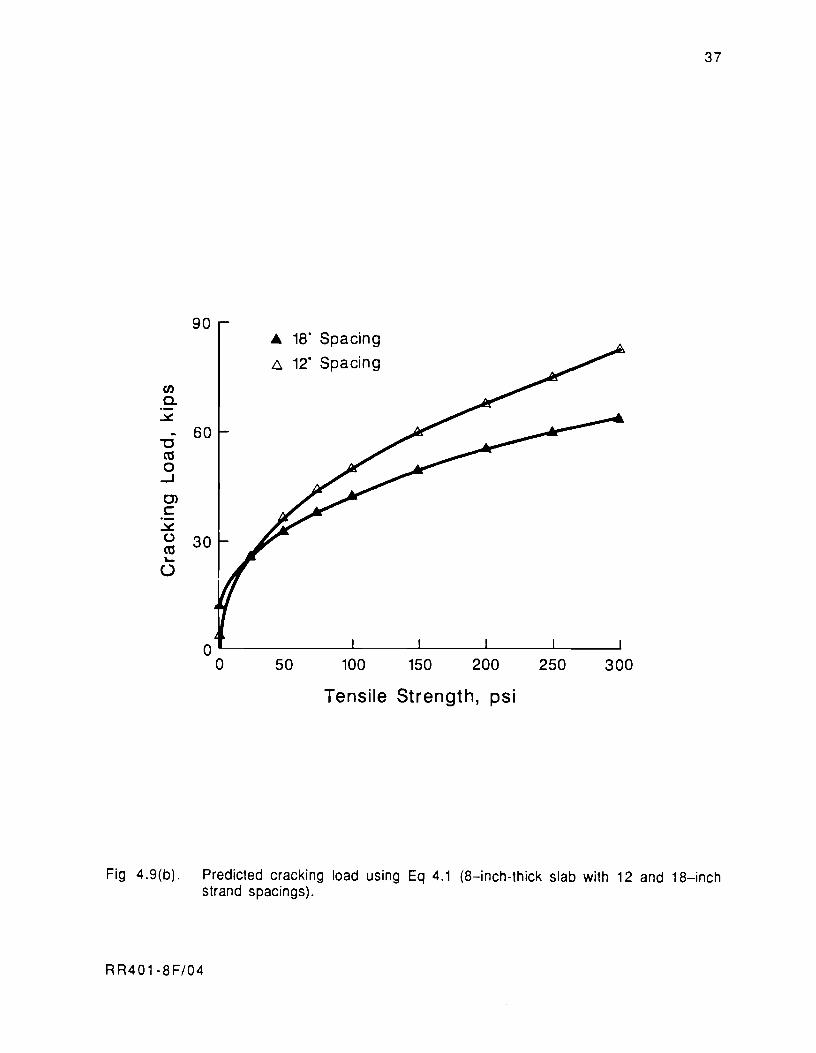
Graphs. Equation 4.1 was used to generate Fig 4.9 for estimating cracking loads for
different concrete strengths. Figure 4.9(a) is for a 6-inch-thick slab and 16 and 24-inch
strand spacing. Figure 4.9(b) is for an 8-inch-thick slab and 12 and 18-inch strand
spacing. Both figures are for the smaller anchor.
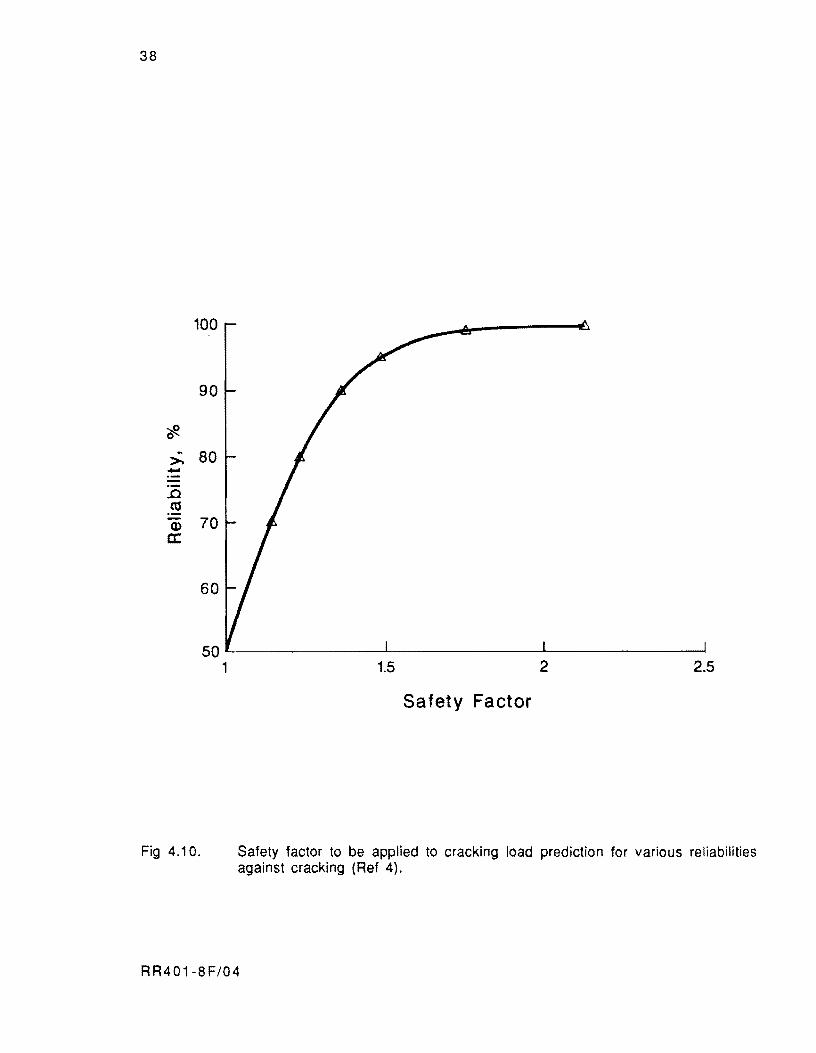
Reliability Study
The safety factor applied to the cracking load depends on the desired reliability. Figure
4.10 shows the safety factor for different reliabilities as developed from the cracking load
predictions and the actual cracking load values.
Calculation Procedure
The procedure for determining the allowable post-tensioning force is extremely
simple. The following steps give the necessary force and the allowable force required to
prevent cracking.
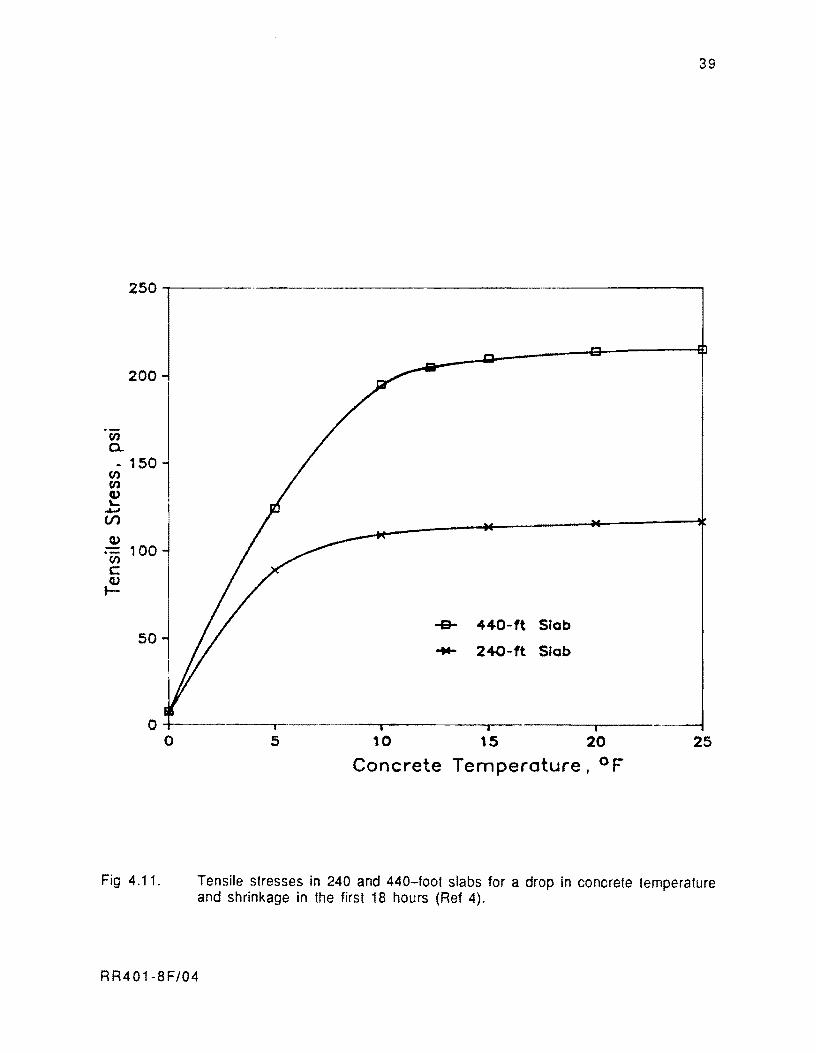
( 1 ) Given slab length and drop in concrete temperature, determine the tensile
stress in the slab using Fig 4.11.
(2) Determine the concrete strength from the cylinder break or a previously
established strength versus maturity curve.
(3) Determine the required safety factor (CSF) for the desired reliability against
cracking from Fig 4.10 and calculate the allowable post-tensioning force
(Pall ow)' Note: Pall ow ~ 0.8 fy x As, where fy = STRAND YIELD.
Pall ow = Pcr + SF.
(4) Check the slab compressive stress due to Pallow to see if it exceeds the tensile
stress due to temperature drop added to the tensile strength of the concrete.
(Note: It is not necessary to overcome 100 percent of the tensile stress because
the concrete has some tensile strength.)
RR401-8F/04
35
TABLE 4.2. PREDICTED CRACKING LOAD (KIPS) FOR DIFFERENT SLAB THICKNESSES, STRAND SPACINGS, AND CONCRETE STRENGTHS (REF 4)
Thickness (6 in.) Thickness (8 in.)
Spacing (in.) Spacing (in.)
Tensile Strength* Tensile Strength* (ps i) 16 24 (psi) 12 18
0 -1.22 -11.58 0 10.46 2.69 10 8.61 3.16 10 20.29 17.43 20 12.68 9.27 20 24.36 23.54 30 15.80 13.95 30 27.48 28.23 40 18.44 17.90 40 30.12 32.18 50 20.76 21.39 50 32.44 35.66 60 22.85 24.53 60 34.54 38.80 70 24.78 27.43 70 36.47 41.70 80 26.58 30.12 80 38.26 44.39 90 28.27 32.65 90 39.95 46.92
100 29.86 35.04 100 41.54 49.31 110 31.38 37.32 110 43.06 51.59 120 32.83 39.49 120 44.51 53.76 130 34.22 41.58 130 45.90 55.85 140 35.56 43.59 140 47.24 57.86 150 36.85 45.52 150 48.53 59.79 160 38.10 47.39 160 49.78 61.67 170 39.31 49.21 170 50.99 63.48 180 40.48 50.97 180 52.16 65.24 190 41.62 52.69 190 53.31 66.96 200 42.74 54.36 200 54.42 68.63
*8ased on split tensile tests.
RR401-8F/04
36
80
D.. 24" Spacing
• 16" Spacing (/)
c. 60 ~
~
'"0 Cd 0
...J 40 0> C
~ (J Cd "- 20 U
o WL ____ ~ ____ _L ____ ~ ______ ~ ____ ~ ____ ~
o 50 100 150 200 250 300
Tensile Strength, psi
Fig 4.9(a). Predicted cracking load using Eq 4.1 (6-inch-thick slab with 16 and 24-inch strand spacings) (Ref 4). '
RR401-8F/04
37
90 A 18" Spacing
t:::. 12" Spacing
f/)
a. ~
~ 60 "'C co 0 ~
Cl c:: ~ (.) 30 co ~
()
o L-____ ~ ____ ~ ______ L_ ____ _L ____ ~ ____ ~
o 50 100 150 200 250 300
Tensile Strength, psi
Fig 4.9(b). Predicted cracking load using Eq 4.1 (8-inch-thick slab with 12 and 18-inch strand spacings).
RR401-8F/04
38
100
90
#->. 80 --.0 <a - 70 Q)
a:
60
50L-------------~--------------~------------~
1 1.5 2 2.5
Sa fety Factor
Fig 4.10. Safety factor to be applied to cracking load prediction for various reliabilities against cracking (Ref 4).
RR401-8F/04
39
250~----------------------------------------------------,
200
.-en a. - 150
en en ~ ..... Ul
100 en c: ~
50 ~ -e- 440-ft Slab
..... 240-ft Slab !
o -+----------.,------ I I I
o 5 10 15 20
Concrete Temperature, 0 F 25
Fig 4.11. Tensife stresses in 240 and 440-foot slabs for a drop in concrete temperature and shrinkage in the first 18 hours (Ref 4).
RR401-8F/04
40
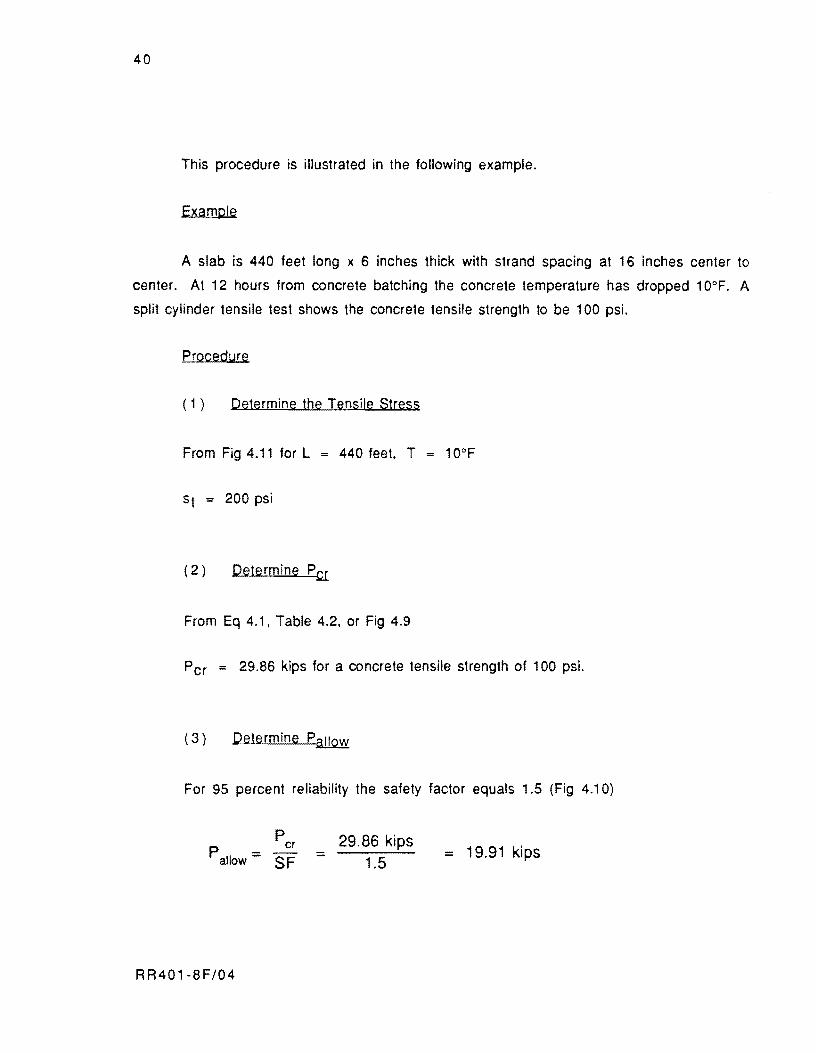
This procedure is illustrated in the following example.
Example
A slab is 440 feet long x 6 inches thick with strand spacing at 16 inches center to
center. At 12 hours from concrete batching the concrete temperature has dropped 10°F. A
split cylinder tensile test shows the concrete tensile strength to be 100 psi.
Procedure
( 1 ) Determine the Tensile Stress
From Fig 4.11 for L = 440 feet, T = 10°F
St = 200 psi
(2) Determine Per
From Eq 4.1, Table 4.2, or Fig 4.9
Pc r = 29.S6 kips for a co ncrete tensile strength of 100 psi.
(3) Determine P~
For 95 percent reliability the safety factor equals 1.5 (Fig 4.10)
29.86 kips :::
1.5 ::: 19.91 kips
RR401-SF/04

( 4 ) .c.b.ec!$
The compressive stress in the slab equals
Pallow
sc = "2at
RR401 8F/04
= 19.91 kips
(16 in.) (6 in.) = 0.207 ksi
= 100 psi
41
= 207 psi

!!!!!!!!!!!!!!!!!!!"#$%!&'()!*)&+',)%!'-!$-.)-.$/-'++0!1+'-2!&'()!$-!.#)!/*$($-'+3!
44!5"6!7$1*'*0!8$($.$9'.$/-!")':!
CHAPTER 5. INSTRUMENTATION AND BEHAVIOR OF THE TEXAS PRESTRESSED CONCRETE PAVEMENT
INSTRUMENTATION
This chapter describes the development and implementation of an instrumentation
program used to monitor the behavior of the Texas prestressed concrete pavement. The
measurements taken include continuous measurement of ambient and concrete temperature,
horizontal slab movement, slab curling, and concrete strain. Other measurements include
tendon elongation, very early concrete strength, concrete modulus of elasticity, and slab
cracking. For a more detailed report on the instrumentation program, the reader is referred
to Research Report 401-4 (Ref 6).
Instrumentation Development
This development of an instrumentation program for Texas prestressed concrete
pavement is based on a review of the instrumentation of previous projects, an examination of
instrumentation objectives, and the testing of instrumentation on a pavement test-slab.
Before proposing an instrumentation scheme for the Waco site, instrumentation
arrangements used on similar pavement projects were reviewed. These projects include
prestressed concrete pavement installations in Pennsylvania, Virginia, Mississippi, and
Arizona, and slab tests conducted at Rolla, Missouri, and Slidell, Louisiana (Refs 7 through
12). Reports of these projects provided useful information on instrumentation equipment
and procedures.
Before specifying an instrumentation scheme or any instrumentation equipment, the
particular objectives of the instrumentation were defined. The instrumentation objectives are
divided into two categories: objectives for short-term measurements and objectives for long
term measurement.
In general, short-term instrumentation was needed to verify the values of slab
movement and concrete stress. This verification is important because the design of the slab
lengths and the amount of prestressing are based on the critical stresses predicted analytically
by the method discussed in Chapter 7. In addition, slab length design and transverse joint
design are based on expected horizontal movement of the pavement slab.
RR401-8F/05 43
44
The purpose of for making long-term measurements was to determine how the
pavement holds up over time. Readings of transverse joint openings indicate whether or not
the friction properties of the base are changing with time and show the effects of creep and
shrinkage of the concrete. Load transfer measurements at the transverse joint can show if
joint opening width affects load-transfer and if the effects of traffic have caused any
deterioration of the joint. Measurement of the deflection characteristics of the prestressed
overlay can be compared to similar measurements taken on the pavement before the overlay
construction and thus indicate the increase in pavement stiffness due to the overlay. All of
these measurements give an indication of the long-term performance of prestressed concrete
pavements.
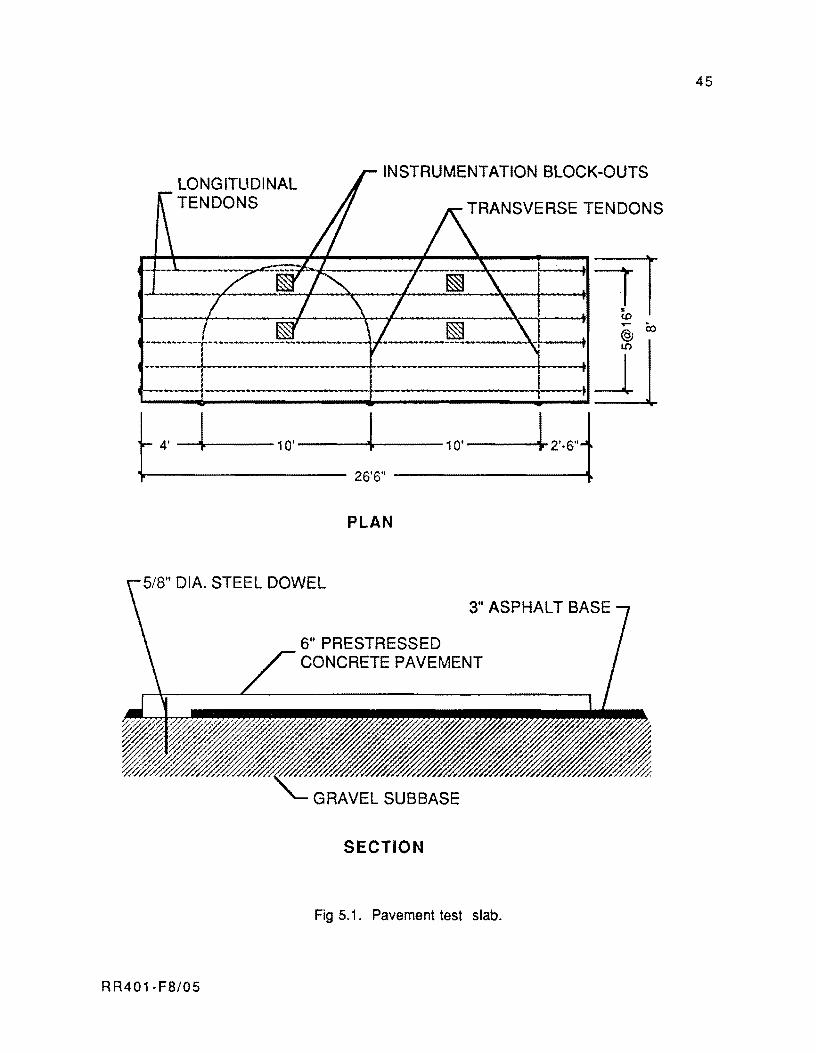
Before installing the instrumentation in the pavement at Waco, a pavement test-slab
was built to test the functioning of the instrumentation. This slab was constructed at the
Balcones Research Center at The University of Texas at Austin on an existing asphalt base. The
test-slab is shown in Fig 5.1. It incorporated the following instrumentation:
Electronic Instrumentation:
1 ambient temperature thermocouple
6 embedded thermocouples
10 embedment strain gages
2 surface strain gages
3 displacement transducers
Mechanical Instrumentation:
3 movement dial gages
2 sets of Demac strain reference points
The purpose of the test slab was three-fold. It provided an opportunity to (1) get
familiar with the procedures for implementing the instrumentation, (2) verify that the
electronic instrumentation functioned accurately, and (3) program the data acquisition
system. The test slab was also used for other purposes, including testing post-tensioning
anchor-zone strength and pocket stressing techniques.
RR401-F8/05
LONGITUDINAL TENDONS
INSTRUMENTATION BLOCK~OUTS
TRANSVERSE TENDONS
PLAN
5/8" DIA. STEEL DOWEL
RR401-F8/05
3" ASPHALT BASE
6" PRESTRESSED CONCRETE PAVEMENT
GRAVEL SUBBASE
SECTION
Fig 5.1. Pavement test slab.
45
46
The results of the experimentation on the test slab indicate the following conclusions:
( 1 ) Thermocouples are effective in recording both ambient and concrete
temperatures and can be considered accurate to 1°F or better.
( 2 ) Displacement transducers are very effective in recording horizontal slab
movement. The transducers are capable of resolving slab movements
accurately to the nearest 0.001 inch.
( 3 ) Embedded and surface strain gages, positioned longitudinally, are generally
effective in recording changes in concrete strain due to longitudinal post
tensioning. One embedment strain gage, however, gave errant results which
cannot fully be explained. In most cases, the strain gages could accurately
resolve strain changes of 5 microstrain.
( 4) Embedded strain gages positioned transversely were not effective or consistent
in recording the changes in concrete strain due to transverse post-tensioning.
This is probably because the change in strain due to the transverse post
tensioning is small in comparison to the resolution capabilities of the gages.
Field Implementation
Following the instrumentation objectives given above, the instrumentation for the
Texas prestressed pavement is divided into two categories: short-term instrumentation and
long-term instrumentation.
The short-term instrumentation for the Texas prestressed pavement consists of (1)
continuously recorded electronic instrumentation, (2) mechanical instrumentation to back
up the continuously recording measurements, and (3) intermittently recorded measurements.
During construction in the fall of 1985, short-term instrumentation was implemented on two
of the prestressed pavement slabs. Since the slabs are staked at mid-length, behavior of the
two halves of a slab is symmetric, and only one half of the pavement slab needs to be
monitored. One 240--fool-long slab and one 440--foot-long slab were instrumented. The same
instrumentation was used for the 240--foot slab and the 440-foot slab.
A listing of the continuously recorded electronic instrumentation used in the two
instrumented slabs is shown in Table 5.1. This instrumentation consists of thermocouples for
measuring temperature, strain gages for measuring concrete strain, and displacement
RR401-F8/05
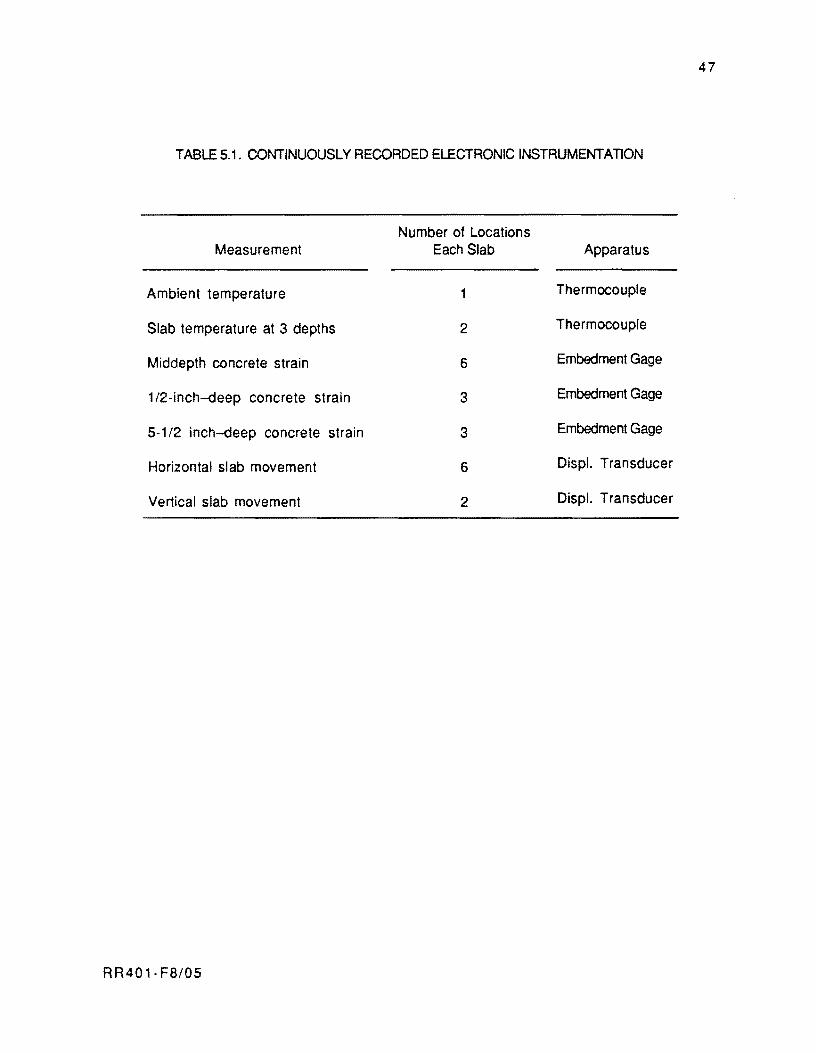
47
TABLE 5.1. CONTINUOUSLY RECORDED ELECTRONIC INSTRUMENTATION
Number of Locations Measurement Each Slab Apparatus
Ambient temperature 1 Thermocouple
Slab temperature at 3 depths 2 Thermocouple
Middepth concrete strain 6 Embedment Gage
1/2-inch-deep concrete strain 3 Embedment Gage
5-1/2 inch-deep concrete strain 3 Embedment Gage
Horizontal slab movement 6 Displ. Transducer
Vertical slab movement 2 Displ. Transducer
RR401- Fa/OS
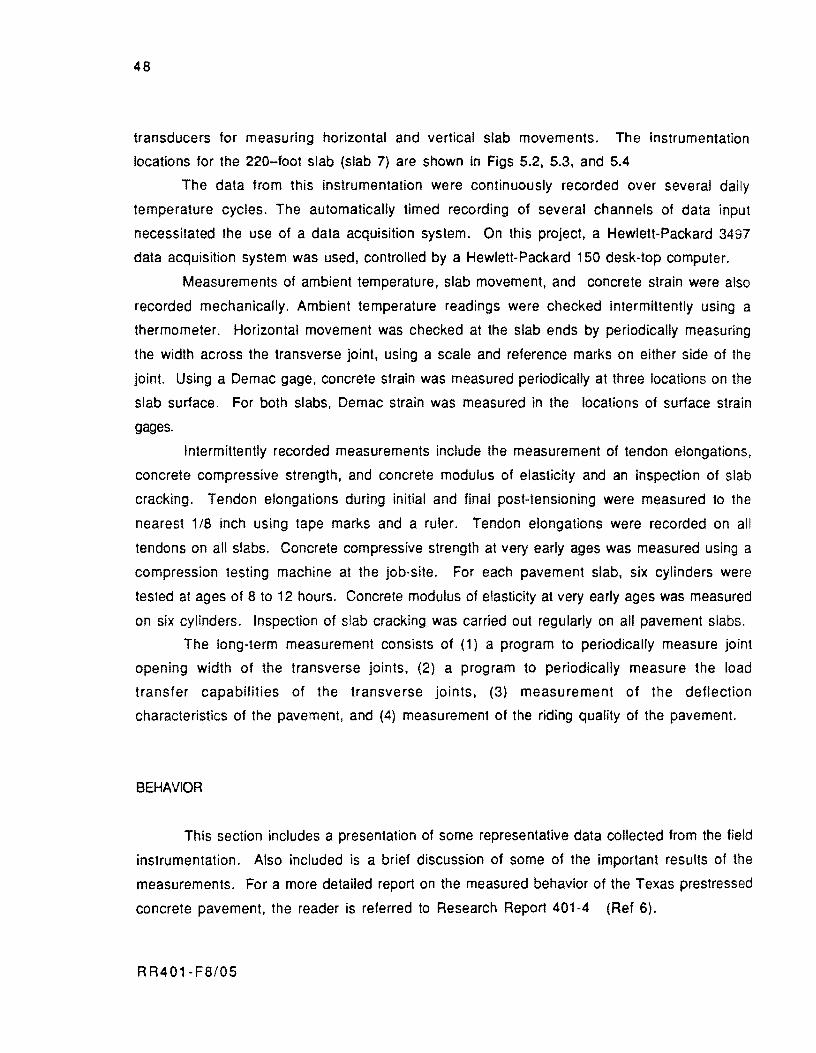
48
transducers for measuring horizontal and vertical slab movements. The instrumentation
locations for the 220-foot slab (slab 7) are shown in Figs 5.2, 5.3, and 5.4
The data from this instrumentation were continuously recorded over several daily
temperature cycles. The automatically timed recording of several channels of data input
necessitated the use of a data acquisition system. On this project, a Hewlett-Packard 3497
data acquisition system was used. controlled by a Hewlett-Packard 150 desk-top computer.
Measurements of ambient temperature, slab movement, and concrete strain were also
recorded mechanically. Ambient temperature readings were checked intermittently using a
thermometer. Horizontal movement was checked at the slab ends by periodically measuring
the width across the transverse joint. using a scale and reference marks on either side of the
joint. Using a Demac gage, concrete strain was measured periodically at three locations on the
slab surface. For both slabs, Demac strain was measured in the locations of surface strain
gages.
Intermittently recorded measurements include the measurement of tendon elongations.
concrete compressive strength. and concrete modulus of elasticity and an inspection of slab
cracking. Tendon elongations during initial and final post-tensioning were measured to the
nearest 118 inch using tape marks and a ruler. Tendon elongations were recorded on all
tendons on all slabs. Concrete compressive strength at very early ages was measured using a
compression testing machine at the job-site. For each pavement slab, six cylinders were
tested at ages of 8 to 12 hours. Concrete modulus of elasticity at very early ages was measured
on six cylinders. Inspection of slab cracking was carried out regularly on all pavement slabs.
The long-term measurement consists of (1) a program to periodically measure joint
opening width of the transverse jOints, (2) a program to periodically measure the load
transfer capabilities of the transverse joints. (3) measurement of the deflection
characteristics of the pavement, and (4) measurement of the riding quality of the pavement.
BEHAVIOR
This section includes a presentation of some representative data collected from the field
instrumentation. Also included is a brief discussion of some of the important results of the
measurements. For a more detailed report on the measured behavior of the Texas prestressed
concrete pavement, the reader is referred to Research Report 401-4 (Ref 6).
RR401-F8/05
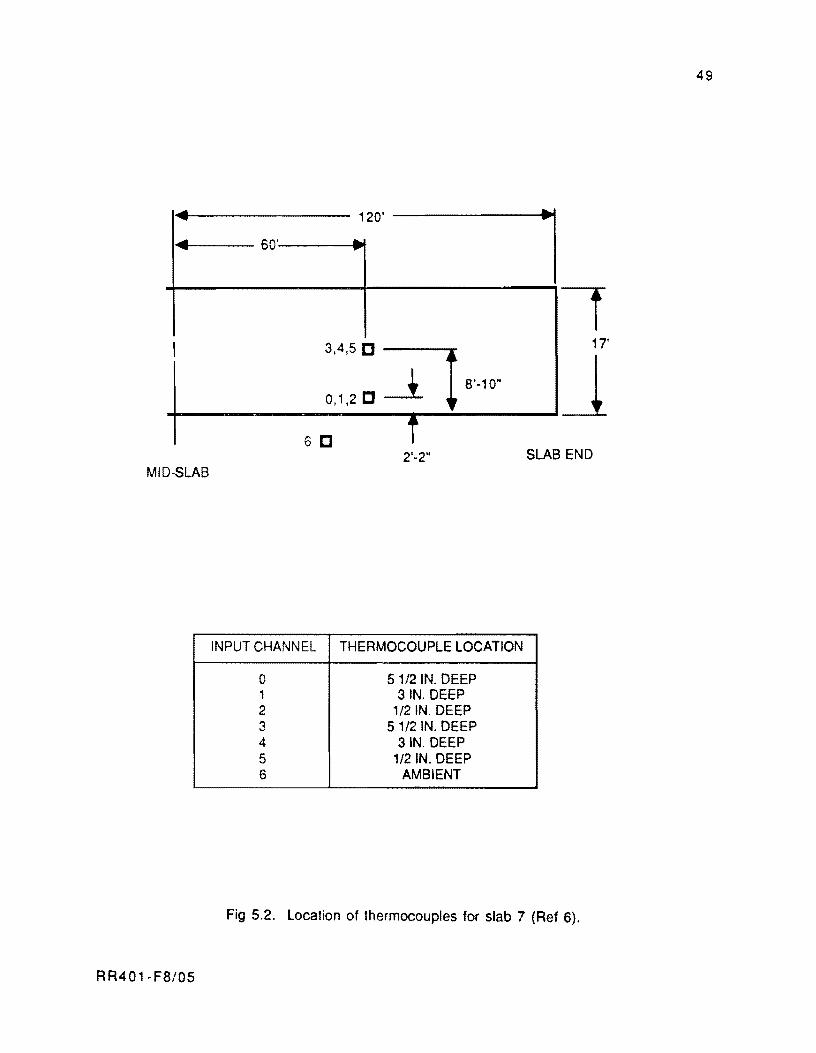
49
• 12O'
l • 60' ... ....
I I 3,4,5 [] =:l'l
--.t. 8'-10" 0,1,2 C
17'
j 6[] i
2'-2" SLAB END MID-SLAB
INPUT CHANNEL THERMOCOUPLE LOCATION
0 51/2IN. DEEP 1 3IN.DEEP 2 112 IN. DEEP 3 5 1/2 IN. DEEP 4 31N. DEEP 5 1/2 IN. DEEP 6 AMBIENT
Fig 5.2. Location of thermocouples for slab 7 (Ref 6).
RR401-F8/05
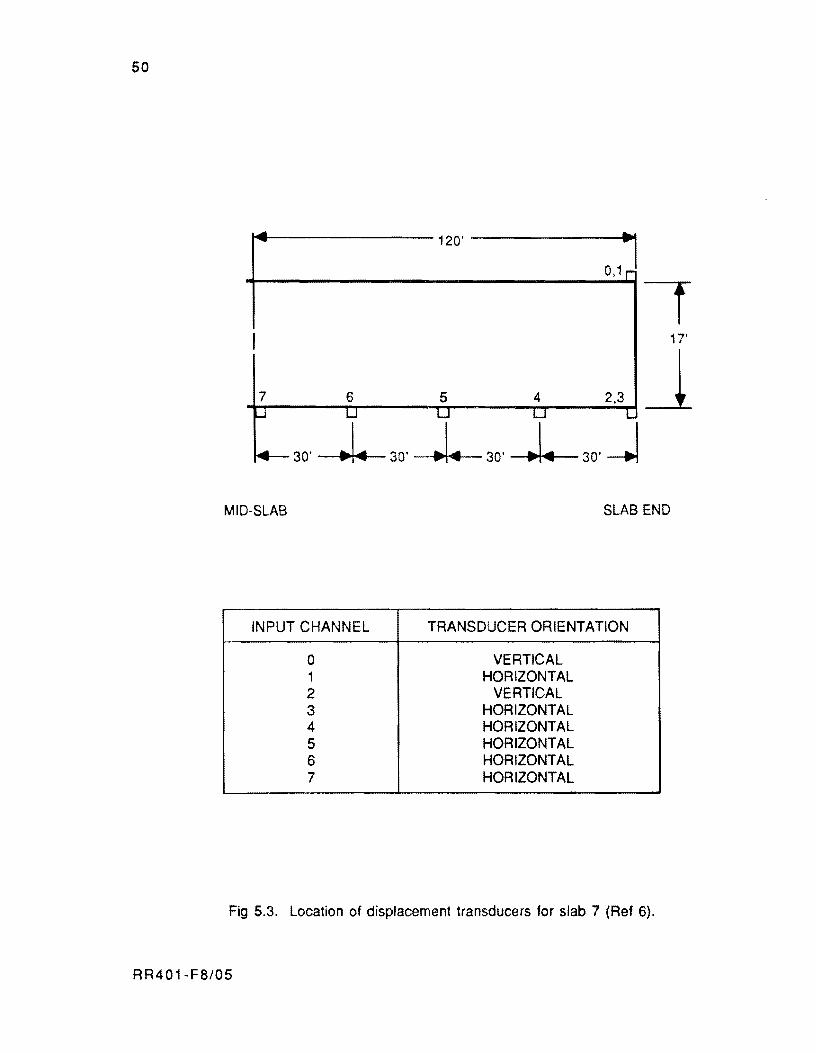
50
~~~--------------120'------------~~~
0.1 rl
7 6 5 4 2.3 ~ u L.J L.J L
~30' --J- 30' -J-30' J-30' j
I 17'
J MID-SLAB SLAB END
INPUT CHANNEL TRANSDUCER ORIENTATION
0 VERTICAL 1 HORIZONTAL 2 VERTICAL 3 HORIZONTAL 4 HORIZONTAL 5 HORIZONTAL 6 HORIZONTAL 7 HORIZONTAL
Fig 5.3. Location of displacement transducers for slab 7 (Ref 6).
RR401-F8/05
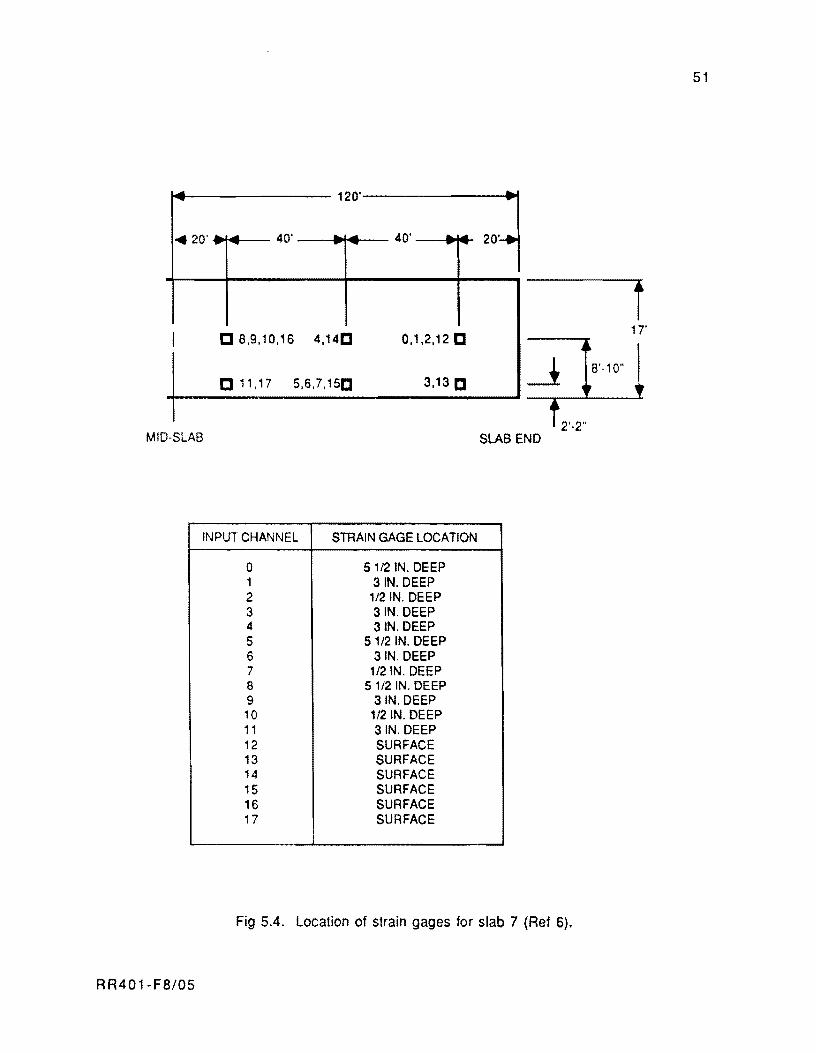
51
- 120' • -"'20'" ... 40' • - 40' .. .. 20· .... -- -- --
i I [] 8,9,10,16 4,14C 0,1,2,12 C
17'
[]11,17 5,6,7,15C 3,13 C
MID-SLAB SLAB END
INPUT CHANNEL STRAIN GAGE LOCATION
0 5 1/2 IN. DEEP 1 3IN.DEEP 2 1/2 IN. DEEP 3 3IN.DEEP 4 31N. DEEP 5 5 1/2 IN. DEEP 6 3IN.DEEP 7 1/2 IN. DEEP 8 5112 IN. DEEP 9 31N. DEEP 10 1/2 IN. DEEP 11 31N. DEEP 12 SURFACE 13 SURFACE 14 SURFACE 15 SURFACE 16 SURFACE 17 SURFACE
Fig 5.4. Location of strain gages for slab 7 (Ref 6).
RR401-F8/05
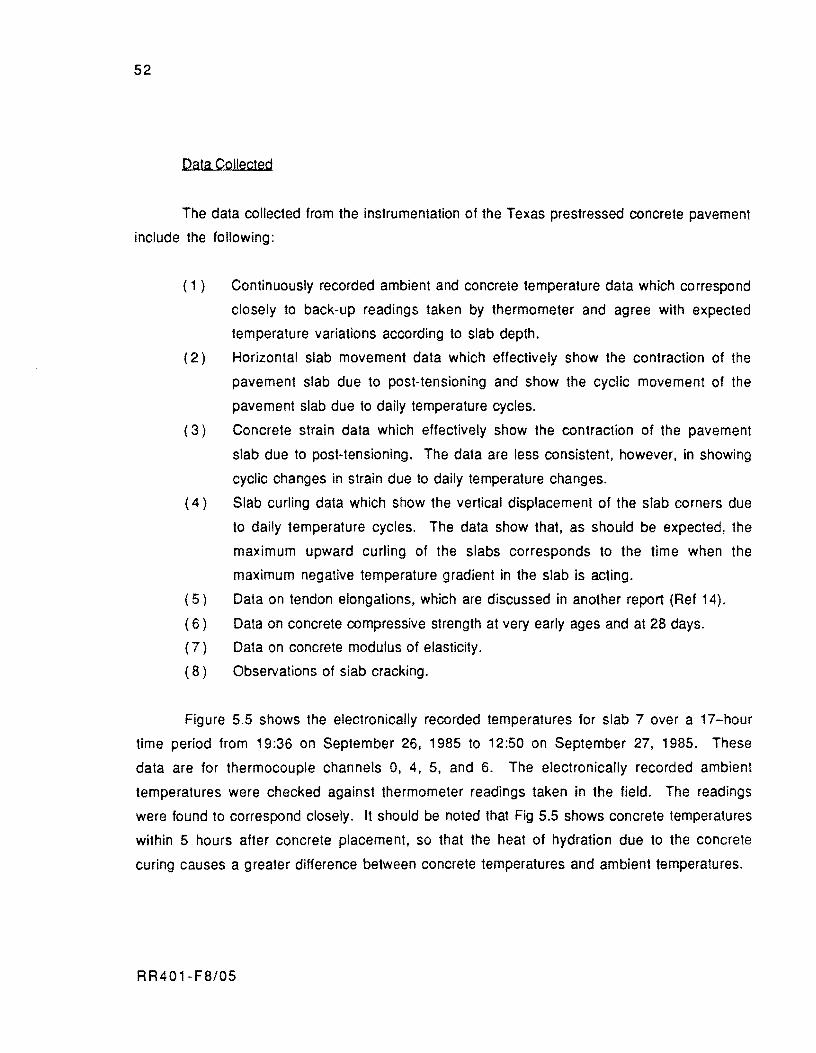
52
Data Collected
The data collected from the instrumentation of the Texas prestressed concrete pavement
include the following:
(1 ) Continuously recorded ambient and concrete temperature data which correspond
closely to back-up readings taken by thermometer and agree with expected
temperature variations according to slab depth.
(2) Horizontal slab movement data which effectively show the contraction of the
pavement slab due to post-tensioning and show the cyclic movement of the
pavement slab due to daily temperature cycles.
( 3 ) Concrete strain data which effectively show the contraction of the pavement
slab due to post-tensioning. The data are less consistent, however, in showing
cyclic changes in strain due to daily temperature changes.
(4) Slab curling data which show the vertical displacement of the slab corners due
to daily temperature cycles. The data show that, as should be expected, the
maximum upward curling of the slabs corresponds to the time when the
maximum negative temperature gradient in the slab is acting.
( 5 ) Data on tendon elongations, which are discussed in another report (Ref 14).
( 6 ) Data on concrete compressive strength at very early ages and at 28 days.
(7) Data on concrete modulus of elasticity.
( 8 ) Observations of slab cracking.
Figure 5.5 shows the electronically recorded temperatures for slab 7 over a 17-hour
time period from 19:36 on September 26, 1985 to 12:50 on September 27, 1985. These
data are for thermocouple channels 0, 4, 5, and 6. The electronically recorded ambient
temperatures were checked against thermometer readings taken in the field. The readings
were found to correspond closely. It should be noted that Fig 5.5 shows concrete temperatures
within 5 hours after concrete placement, so that the heat of hydration due to the concrete
curing causes a greater difference between concrete temperatures and ambient temperatures.
RR401-F8/05
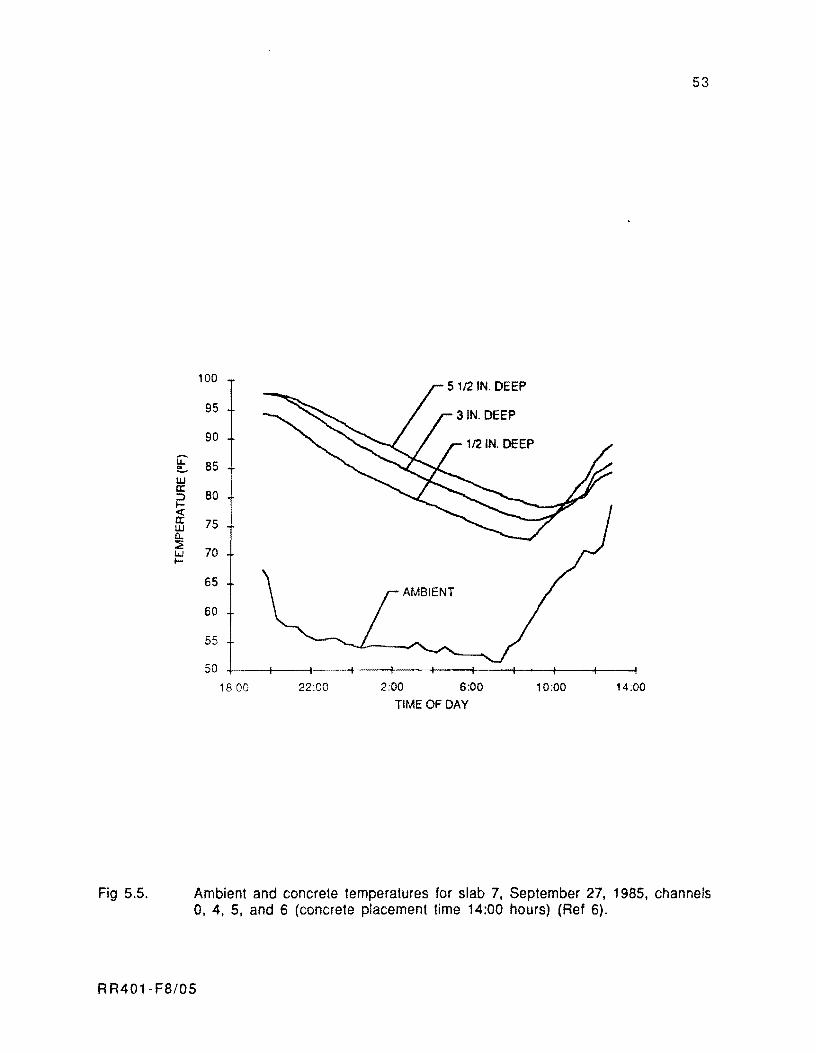
u:-!!.-w c: ::> to-e:( c: w 0.. ::iE w to-
Fig 5.5.
53
100 5 1/2 IN. DEEP
95
90 112 IN. DEEP
85
80
75
70
65
60
55
50 I , I
1800 22:00 2:00 6:00 10:00 14:00
TIME OF DAY
Ambient and concrete temperatures for slab 7, September 27, 1985, channels 0, 4, 5, and 6 (concrete placement time 14:00 hours) (Ref 6).
RR401-F8/05
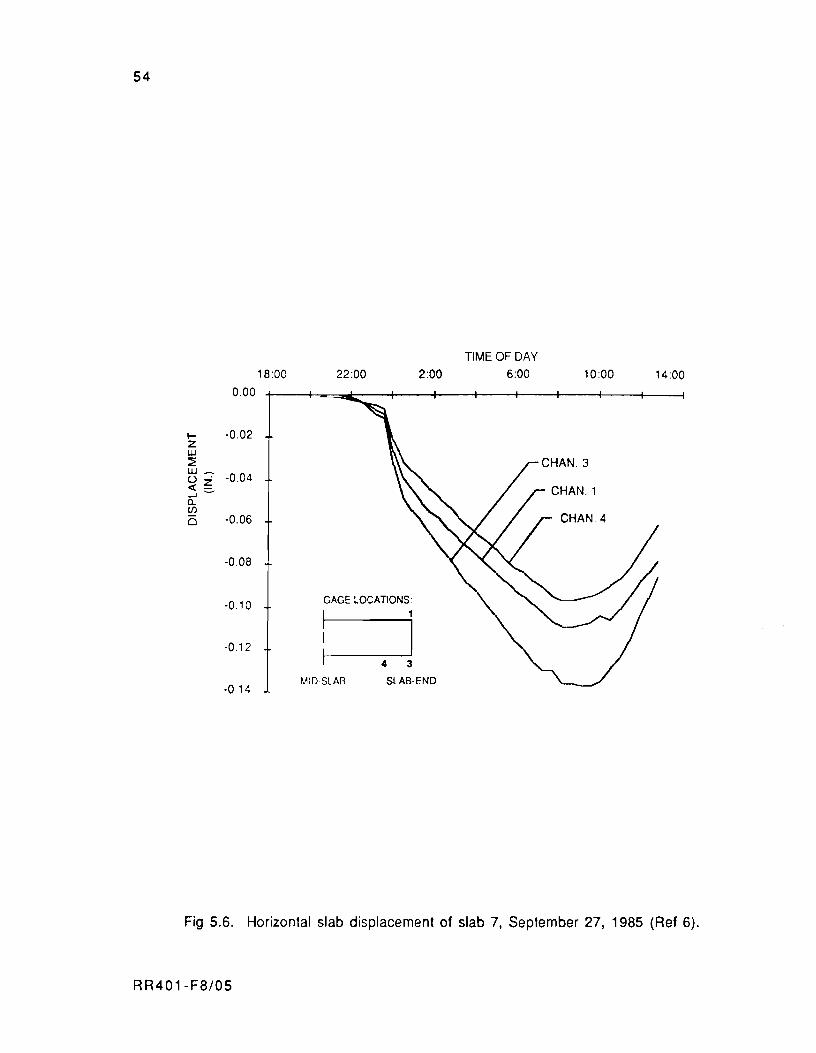
54
TIME OF DAY 18:00 22:00 2:00 6:00 10:00 14:00
0.00
~ -0.02 z UJ ~ UJ ~
-0.04 U . «~ -l~
a.. rJ)
15 -0.06
-0.08
-0.10 GAGE LOCATIONS:
-0.12 W, -0.14
MID·SLAB SLAB-END
Fig 5_6_ Horizontal slab displacement of slab 7, September 27, 1985 (Ref 6).
R R40 1- F8/05
55
Figure 5.6 shows the recorded values of horizontal slab displacement for slab 7,
recorded continuously over a 17-hour period. The rapid change in displacement seen in Fig
5.6 around 23:50 corresponds to the initial post-tensioning operation. Displacement
transducer channels 1, 3, and 4 correspond to the slab locations indicated on the figure itself.
Mechanical measurements of joint opening width covering the same time periods as the
electronic data show good correspondence with the displacement readings.
The output of three of the embedment strain gages for slab 7, recorded continuously
over a 17 -hour period, is shown in Fig 5.7 The strain gage locations are as indicated on the
figure. The effect of the initial post-tensioning for slab 7 is evident in Fig 5.7 by the drop in
concrete strain, by about 25 microstrain, of all of the channels at times corresponding to the
post-tensioning time, 23:45 to 00:08.
Results of Measurements
This section presents a discussion of some of the results of the field measurements.
These discussions include an examination of horizontal slab movement and concrete strain due
to post-tensioning, discussions of concrete strength and modulus of elasticity results, and the
observation of slab cracking.
Movement and Strain Due to Post-Tensioning. Taking into account both friction along
the post-tensioning tendon and base friction (assumed to be constant) concrete strain due to
post-tensioning can be calculated according to the equation
where
(5.1 )
E (x) concrete strain at x (negative for contraction);
x distance away from the streSSing location;
= concrete modulus of elasticity;
= concrete cross-sectional area for each tendon;
= applied post-tensioning force per tendon, at the stressing location;
wobble coefficient for the friction loss in the tendons;
= coefficient of base friction;
RR401-F8/05
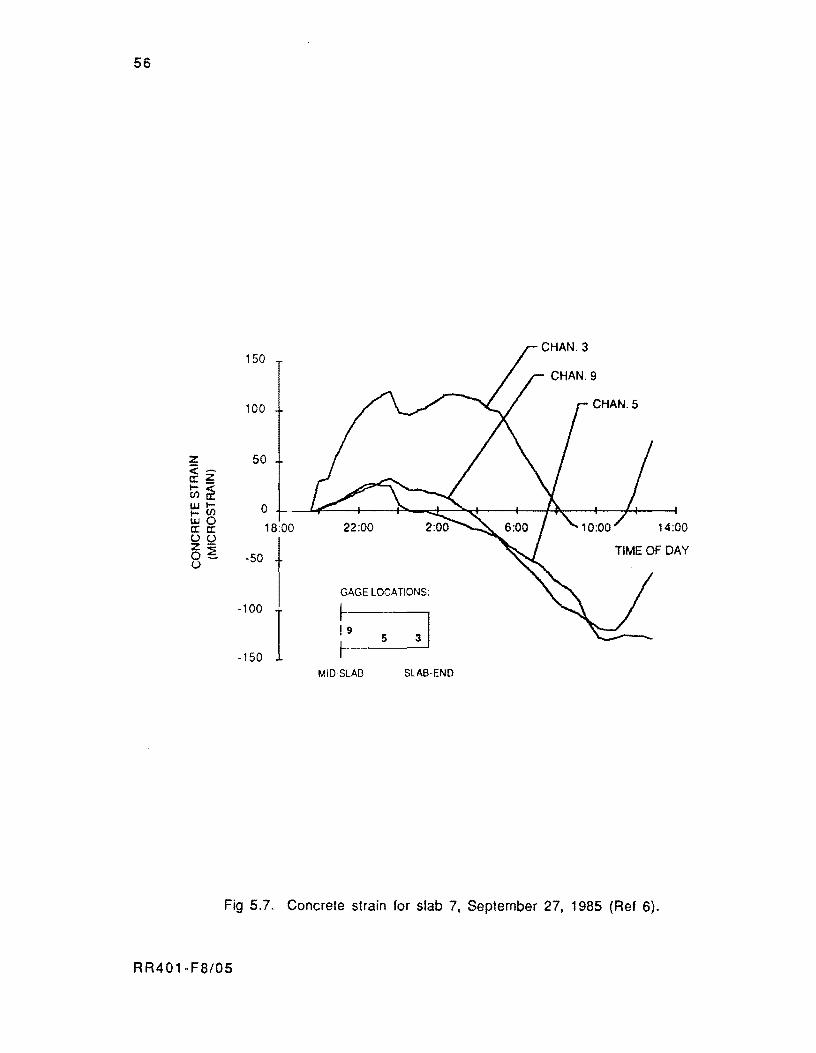
56
150
100
z 50 <~ cr:~ t;(ii wt; 0 Ijjo
18:00 cr:cr: 14:00 (.)(.) z-oe ·50 (.)
GAGE LOCATIONS:
·100
·150
~-------,
~~ . __ 5 __ 3_1
MID-SLAB SLAB·END
Fig 5.7. Concrete strain for slab 7, September 27, 1985 (Ref 6).
RR401-F8/05
y
'-0 ==
==
concrete unit weight; and
slab length.
57
An expression for horizontal slab movement at any point x can be found by integrating
the expression of concrete strain, Eq 5.1. The expression can be written
[ -Kx 2 ]
z(x) = 1 lEe P /Ae K (1 - e ) - ~y/2 (Lox - X ) , (5.2)
where
z(x) = horizontal slab movement at x (negative for contraction).
The measured values of slab movement and concrete strain were compared to those
predicted by the above equations. A statistical analysis of slab movement and concrete strain
data corresponding to the post-tensioning of the pavement slabs was used to back-calculate the
coefficient of base friction and concrete modulus of elasticity for the pavement.
The coefficient of base friction was found to be 0.51 according to the initial post
tensioning of slab 7, and 0.45 according to the final post-tensioning of slab 14. Although
these values are much lower than the conservative design value of 0.96, they are considered
an accurate indication of the actual coefficient of base friction.
The concrete modulus of elasticity for the initial post-tensioning of slab 7 was found
to be 2,900,000 psi. The age of the concrete at the time of this post-tensioning was about 13
hours. For the final post-tensioning of slab 14, the concrete modulus of elasticity was found
to be 3,700,000 psi. The age of the concrete at the time of this final post-tensioning was
about 60 hours. These values are in line with the results of the concrete modulus of elasticity
tests performed on concrete cylinder specimens.
~ Early Concrete Strengths. The results of 61 compressive cylinder tests showed
that very early concrete strengths for the project did not depend solely on age and curing
temperature. The dosage of set retarder in the concrete appears to have been a factor. It had
been suggested that, in future prestressed concrete pavement projects where very early
initial post-tensioning is applied, maturity curves could be used to estimate concrete strength
at very early ages. Based on the evidence of the compressive cylinder strength results, it can
be concluded that the maturity curve approach would not have been the best approach to use on
RR401-FB/05
58
the Texas prestressed pavement. It is possible however that concrete strength at very early
ages could be effectively determined with an insitu method of testing. such as using a rebound
hammer. This would eliminate the need for a compression testing machine at the job site and
would save labor in casting and testing cylinder specimens.
Concrete Modulus of Elasticity. The results of concrete modulus of elasticity tests
performed on compressive cylinder specimens were compared to those from using the ACI
formula in which concrete modulus of elasticity is written as a function of compressive
strength: Ec = 57000 ~ For concrete strengths around 600 psi, the measured values of
concrete modulus of elasticity correspond closely to those calculated by the ACI formula, but,
for concrete strengths of 1500 to 3300 psi, the measured values exceed the calculated values
by as much as 68 percent. Since it has been noted that concrete at very early ages gains
stiffness faster than it gains strength. the discrepancy is probably due to the fact that all of
the data are for concrete at early ages. It is recommended that, in the analysis and design of
prestressed concrete pavements, the determination of concrete modulus of elasticity should be
based on the most accurate data available.
Slab Cracking. A transverse crack which formed in slab 5 gave positive evidence of the
importance of very early initial post-tensioning. Slab 5 was the only one of the pavement
slabs in which initial post-tensioning was not applied during the day of concrete placement.
Not coincidentally. slab 5 was the only pavement slab to develop a transverse crack. Although
the crack closed after the application of prestress. even a small amount of initial prestress
applied during the day of casting would have prevented the crack from ever forming.
RR401-F8/05
CHAPTER 6. EFFECT OF PRESTRESS ON FATIGUE UFE OF CONCRETE
An important consideration in the design of prestressed concrete pavements is the
amount of pre-compressive force to be applied on the pavements. Since the compressive
strength is high compared to its flexural strength, there is a wide range of precompression
levels from which to choose.
This is especially evident if we consider prestressed pavements on a world-wide scale.
The hig hest pre-compressive stress applied was found to be 1,138 psi, in a pavement
constructed in 1958 in Anif-Saltzburg, Austria. The lowest was 42 psi, in a highway
constructed in 1976 in the city of Tempe, Arizona.
A survey of the prestressed concrete pavements built in the United States in the last 15
years is shown in Table 6.1. The average pavement thickness was found to be 6 inches, with
slab length varying from 300 feet to 760 feet long. The prestressed level applied ranged from
200 psi to 331 psi.
Currently the amount of prestress to be applied is governed by two main
considerations:
(1 ) The thickness of the pavement. Since prestressed pavements are usually
thinner than reinforced concrete pavements, higher stresses are developed at
the base.
( 2) The slab length. The longer slab length used in prestressed pavements produces
higher frictional resistance during low temperature cycles, resulting in higher
tensile stresses in concrete.
However, the amount of pre-compressive stress applied must at least be sufficient to
compensate for the increase in flexural/tensile stresses.
A survey of the prestressed concrete pavements built in the United States in the last 15
years shows an average pavement thickness of 6 inches with prestress level applied ranging
from 42 psi to 331 psi (7 percent to 50 percent of flexural strength of plain concrete).
RR401-8F/06 59
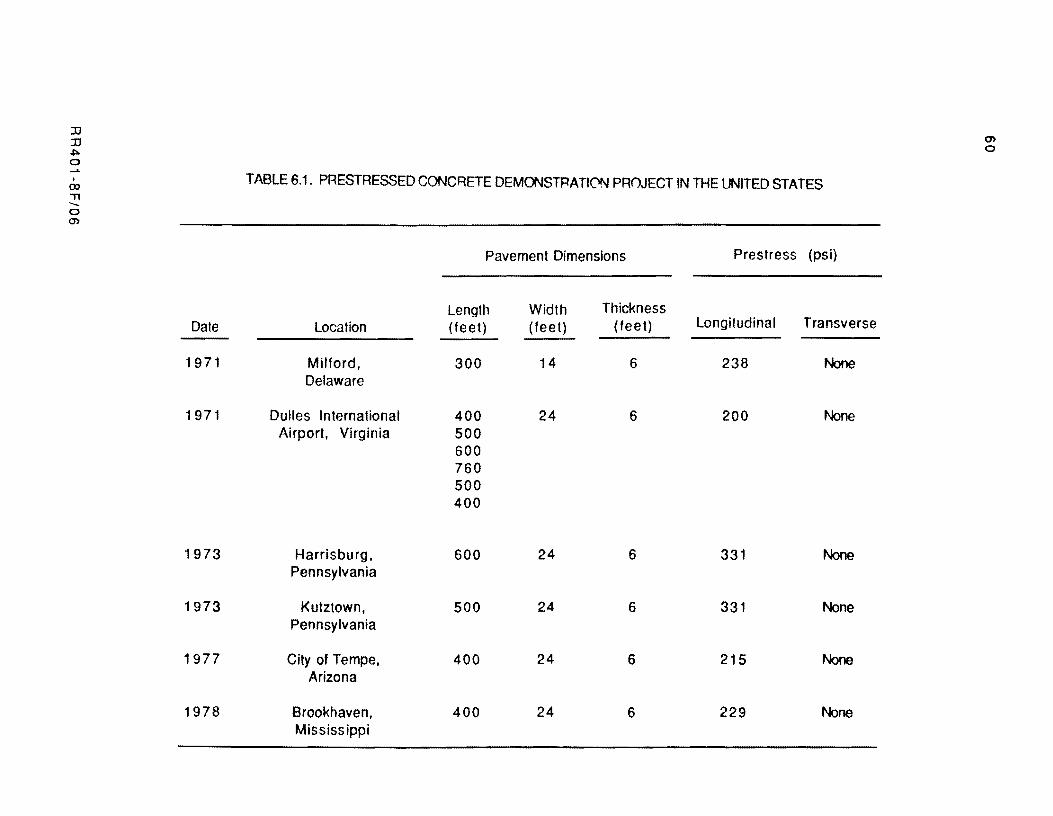
::u en ::u
~ 0
0
, TABLE 6.1. PRESTRESSED CONCRETE DEMONSTRATION PROJECT IN THE UNITED STATES <XI .,.,
-.... 0 en
Pavement Dimensions Prestress (psi)
Length Width Thickness Date Location (feet) ( feet) (feet) Longitudinal Transverse
1971 Milford, 300 14 6 238 None Delaware
1971 Dulles International 400 24 6 200 None Airport, Virginia 500
600 760 500 400
1973 H arrisbu rg. 600 24 6 331 None Pennsylvania
1973 Kutztown, 500 24 6 331 None Pennsylvania
1977 City of Tempe. 400 24 6 215 None Arizona
1978 Brookhaven, 400 24 6 229 None Mississippi
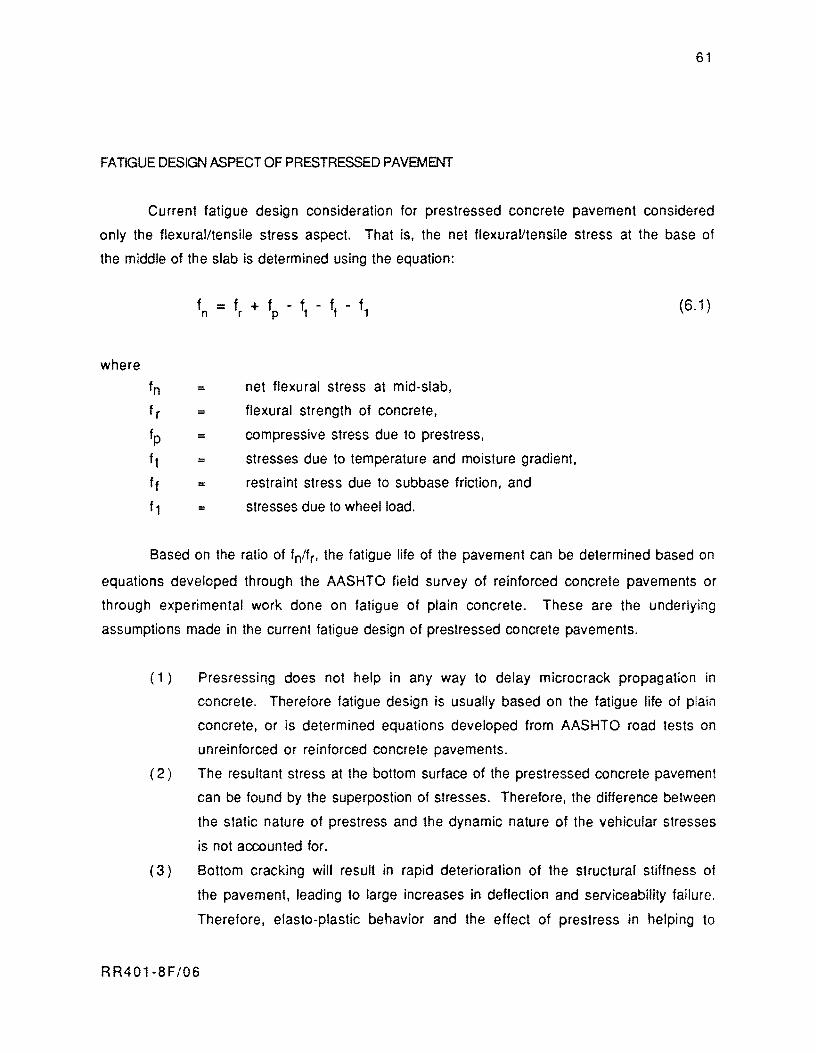
61
FATIGUE DESIGN ASPECT OF PRESTRESSED PAVEMENT
Current fatigue design consideration for prestressed concrete pavement considered
only the flexural/tensile stress aspect. That is, the net flexural/tensile stress at the base of
the middle of the slab is determined using the equation:
f =f+f -f-f-f n r p t f 1 (6.1 )
where
fn = net flexural stress at mid-slab,
fr = flexural strength of concrete,
fp compressive stress due to prestress,
ft = stresses due to temperature and moisture gradient,
ff = restraint stress due to subbase friction, and
f1 = stresses due to wheel load.
Based on the ratio of fn/fr• the fatigue life of the pavement can be determined based on
equations developed through the AASHTO field survey of reinforced concrete pavements or
through experimental work done on fatigue of plain concrete. These are the underlying
assumptions made in the current fatigue design of prestressed concrete pavements.
(1 ) Presressing does not help in any way to delay microcrack propagation in
concrete. Therefore fatigue design is usually based on the fatigue life of plain
concrete, or is determined equations developed from AASHTO road tests on
unreinforced or reinforced concrete pavements.
(2) The resultant stress at the bottom surface of the prestressed concrete pavement
can be found by the superpostion of stresses. Therefore, the difference between
the static nature of prestress and the dynamic nature of the vehicular stresses
is not accounted for.
(3) Bottom cracking will result in rapid deterioration of the structural stiffness of
the pavement, leading to large increases in deflection and serviceability failure.
Therefore, elasto-plastic behavior and the effect of prestress in helping to
RR401-8F/06
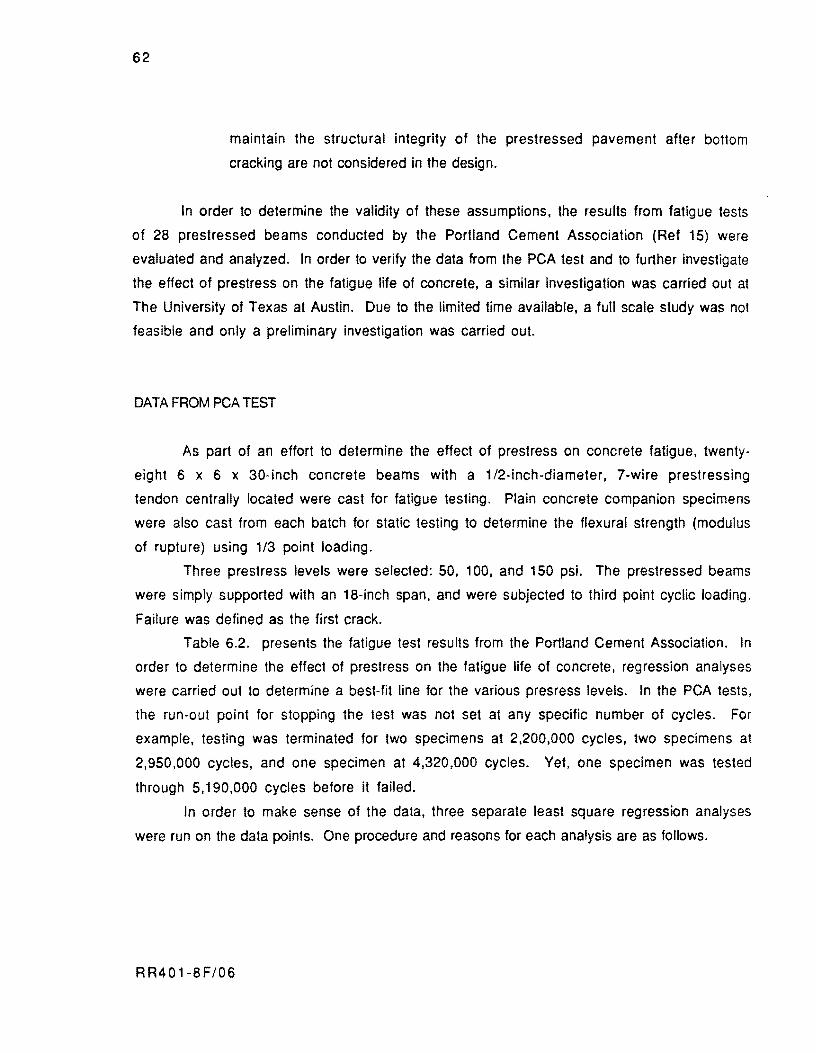
62
maintain the structural integrity of the prestressed pavement after bottom
cracking are not considered in the design.
In order to determine the validity of these assumptions, the results from fatigue tests
of 28 prestressed beams conducted by the Portland Cement Association (Ref 15) were
evaluated and analyzed. In order to verify the data from the PCA test and to further investigate
the effect of prestress on the fatigue life of concrete, a similar investigation was carried out at
The University of Texas at Austin. Due to the limited time available, a full scale study was not
feasible and only a preliminary investigation was carried out.
DATA FROM PCA TEST
As part of an effort to determine the effect of prestress on concrete fatigue, twenty
eight 6 x 6 x 30-inch concrete beams with a 1/2-inch-diameter, 7-wire prestressing
tendon centrally located were cast for fatigue testing. Plain concrete companion specimens
were also cast from each batch for static testing to determine the flexural strength (modulus
of rupture) using 1/3 point loading.
Three prestress levels were selected: 50, 100, and 150 psi. The prestressed beams
were simply supported with an 18-inch span, and were subjected to third point cyclic loading.
Failure was defined as the first crack.
Table 6.2. presents the fatigue test results from the Portland Cement Association. In
order to determine the effect of prestress on the fatigue life of concrete, regression analyses
were carried out to determine a best-fit line for the various presress levels. In the PCA tests,
the run-out point for stopping the test was not set at any specific number of cycles. For
example, testing was terminated for two specimens at 2,200,000 cycles, two specimens at
2,950,000 cycles, and one specimen at 4,320,000 cycles. Yet, one specimen was tested
through 5,190,000 cycles before it failed.
In order to make sense of the data, three separate least square regression analyses
were run on the data points. One procedure and reasons for each analysis are as follows.
RR401-8F/06

:n :n .&::0. 0 ..... • TABLE 6.2. FATIGUE TEST RESULTS FROM PORTLAND CEMENT ASSOCIATION CXI
"T1 ....... 0 (J')
Repeated Load Stressl Modulus of Prestress Beam Cracking Concrete Stressl Rupture, Level, Stength, Modulus of Rupture Number of Cycles
(psi) (psi) (percent) (percent) to Failure
646 100 70 65 4,320,000' 653 100 80 76 39,800 590 100 70 65 1,140,000 590 100 80 76 13,300 571 100 90 88 2,300 571 100 90 88 870 695 100 75 71 113,000 692 100 75 71 19,800 550 150 70 62 2,200,000' 550 150 70 62 2,190,000' 625 150 80 75 6,340 567 150 75 68 876,000 661 150 80 75 67,900 672 150 90 88 1,650 672 150 90 88 5,050 717 150 75 70 16,800 717 150 75 70 56,200 609 50 70 68 5,190,000 636 50 80 78 4,230 636 50 80 78 1,050 675 50 90 89 170 675 50 90 89 180 590 50 70 67 2,950,000' 590 50 70 67 2,950,000' 610 50 75 73 17 ,100 610 50 75 73 57,100 668 50 75 73 42,800 668 50 75 73 337,000
0> w
°No failure occurred, test was terminated.
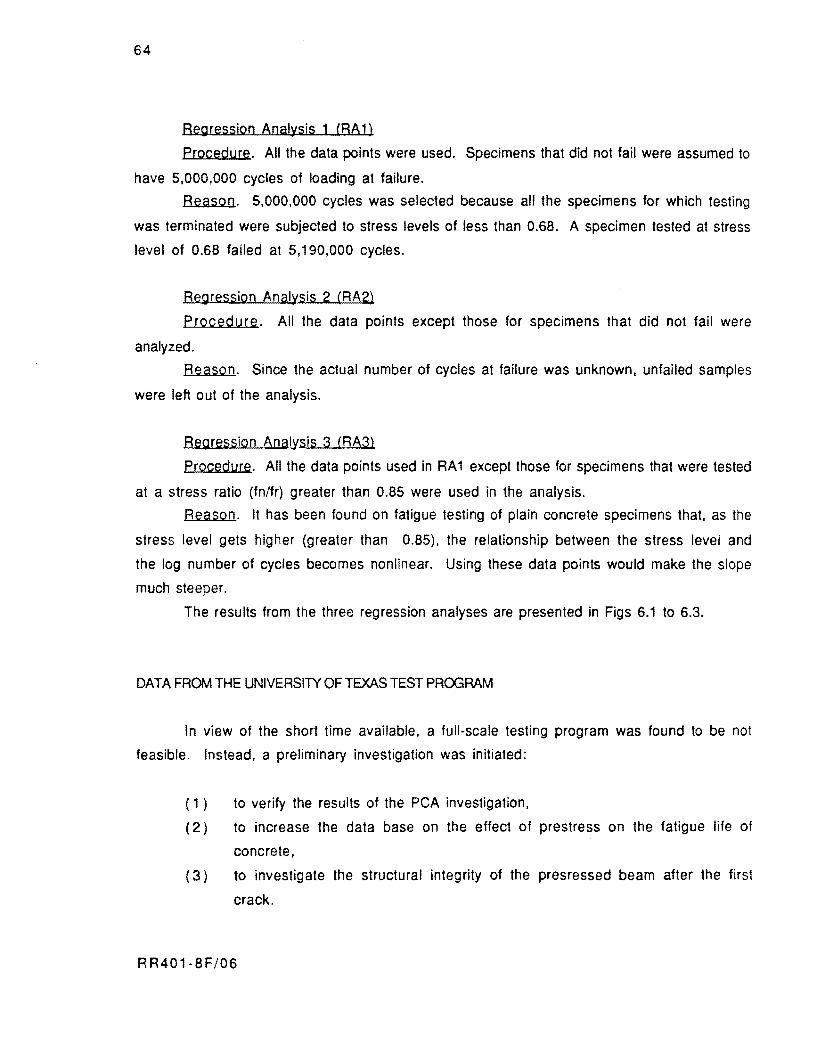
64
Beg ression Analysis 1 (RA1)
Procedure. All the data points were used. Specimens that did not fail were assumed to
have 5.000,000 cycles of loading at failure.
Reason. 5.000.000 cycles was selected because all the specimens for which testing
was terminated were subjected to stress levels of less than 0.68. A specimen tested at stress
level of 0.68 failed at 5,190,000 cycles.
Regression Analysis 2 (RA2)
Procedure. All the data points except those for specimens that did not fail were
analyzed.
Reason. Since the actual number of cycles at failure was unknown, unfailed samples
were left out of the analysis.
Regression Analysis 3 (RA3)
Procedure. All the data points used in RA 1 except those for specimens that were tested
at a stress ratio (fn/fr) greater than 0.85 were used in the analysis.
Reason. It has been found on fatigue testing of plain concrete specimens that, as the
stress level gets higher (greater than 0.85), the relationship between the stress level and
the log number of cycles becomes nonlinear. Using these data points would make the slope
much steeper.
The results from the three regression analyses are presented in Figs 6.1 to 6.3.
DATA FROM THE UNIVERSITY OF TEXAS TEST PROGRAM
In view of the short time available, a full-scale testing program was found to be not
feasible. Instead, a preliminary investigation was initiated:
( 1 ) to verify the results of the PCA investigation,
(2) to increase the data base on the effect of prestress on the fatigue life of
concrete.
(3) to investigate the structural integrity of the presressed beam after the first
crack.
RR401-8F/06
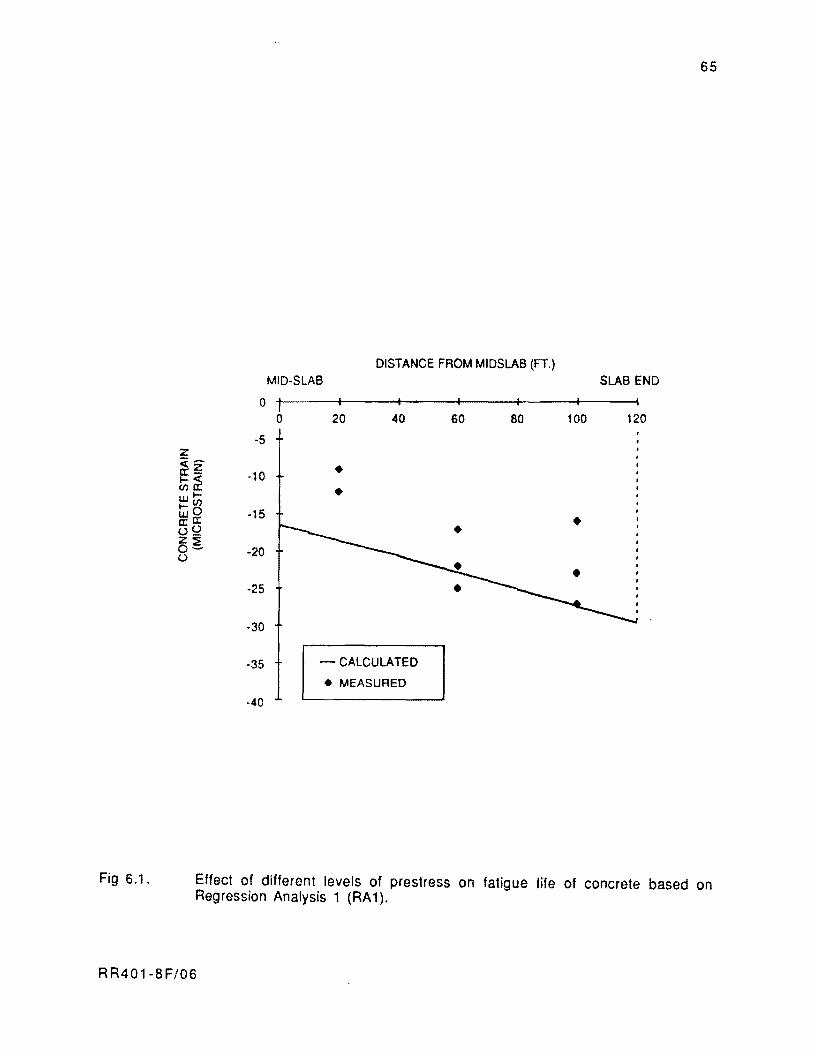
Fig 6.1.
65
DISTANCE FROM MIDSLAB (FT.) MID-SLAB SLAB END
0 1 I I • I
0 20 40 60 80 100 120
·5 z <~ • a:~ -10 1-< C/)a: • wI-.... C/) w O -15 • a: a: 02 z;:e 0- -20 0
-25
·30
-35 - CALCULATED
• MEASURED
-40
Effect of different levels of prestress on fatigue life of concrete based on Regression Analysis 1 (RA 1).
RR401-8F/06
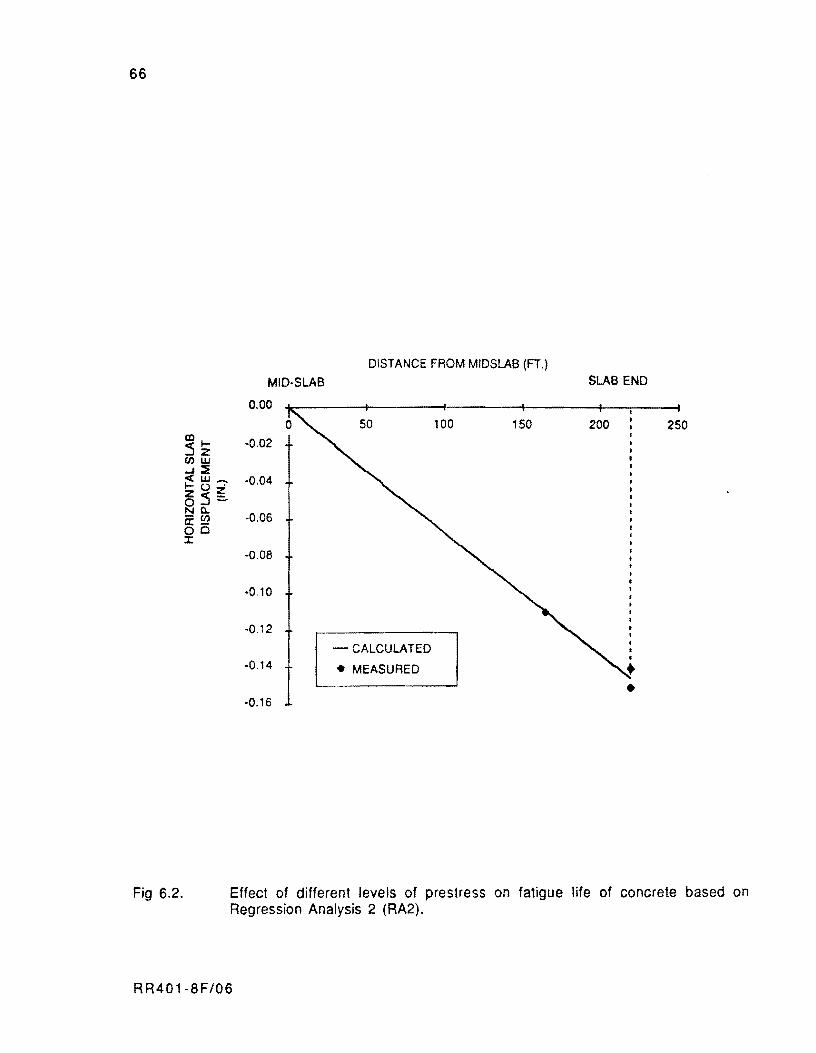
66
Fig 6.2.
MID-SLAB
0.00
5 ~ -0.02 C/)w .j~ < w - -0.04 I- (,) . Z<~ 0..:1-!:::! g, -0.06 0:-00 ::t:
-0.08
-0.10
-0.12
DISTANCE FROM MID SLAB (FT.)
50 100 150
- CALCULATED
-0.14 • MEASURED
-0.16
SLAB END
200 250
•
Effect of different levels of prestress on fatigue life of concrete based on Regression Analysis 2 (RA2).
RR401-8F/06
Fig 6.3.
67
DISTANCE FROM MIDSLAB (FT.)
MID-SLAB SLAB END 0 I I I I I I
0 50 100 150 200 250
z :cc-- -10 c::~ ti;~ w~ ~C/) w O -20 c::C:: u9 z~ - CALCULATED 0-u -30 • MEASURED
-40
• •
-50 • • • • -60 • •
Effect of different levels of prestress on the fatigue life of concrete based on Regression Analysis 3 (RA3).
RR401-8F/06
68
For this study, twelve 6 x 6 x 42-inch concrete beams with a 1I2-inch-diameter, 7-
wire strand centrally positioned were constructed for repeated loading. Twenty-four 6 x 6 x
21-inch plain concrete comparison specimens and eight cylinders were also cast from the
same batch of concrete for static testing to determine the flexural and compressive strength,
respectively.
The prestress levels selected ranged from 0 to 300 psi. The three stress ratios
(fn/fr) the specimen were subjected to were 0.60, 0.70, and 0.85. The specimens were
supported on a 36-inch span and loaded at the third points.
Table 6.3 presents the fatigue test results based on the modului of rupture determined
by the companion beams as well as test results using the modulus of rupture from the broken
"halves" of the failed specimen. The regression analysis carried out on the results of
specimens stressed at 100 psi and 300 psi is presented in Fig 6.4. The mid-span deflections
of specimens tested at stress ratio levels of 0.6 and 0.7 are presented in Figs 6.5 and 6.6.
CO\ICWSla-.JS
The following summary should not be considered as the final conclusions as the analysis
was carried out on a small sample size, only 40 specimens: 28 specimens from the PCA test
prog ram and 12 specimens from The University of Texas at Austin.
Despite the shortcomings, some salient facts seem to emerge as a result of this
investigatio n:
( 1 ) Prestressing helps to delay the propagation of microcracks in concrete. The
higher the level of prestress, the more profound is the effect in delaying the
propagation of the microcracks. However, it does not seem that a direct
proportional increase is obtained by a similar increase in prestress level.
(2) The absolute value of the slopes of the equations representing the relationship
between stress levels and the logarithm of number of cycles at failure will
increase (be steeper) with an increase in the amount of prestress applied.
(3) No fatigue limits exist for prestressed concrete beams subjected to 50 to 300
psi of prestress.
RR401-8F/06
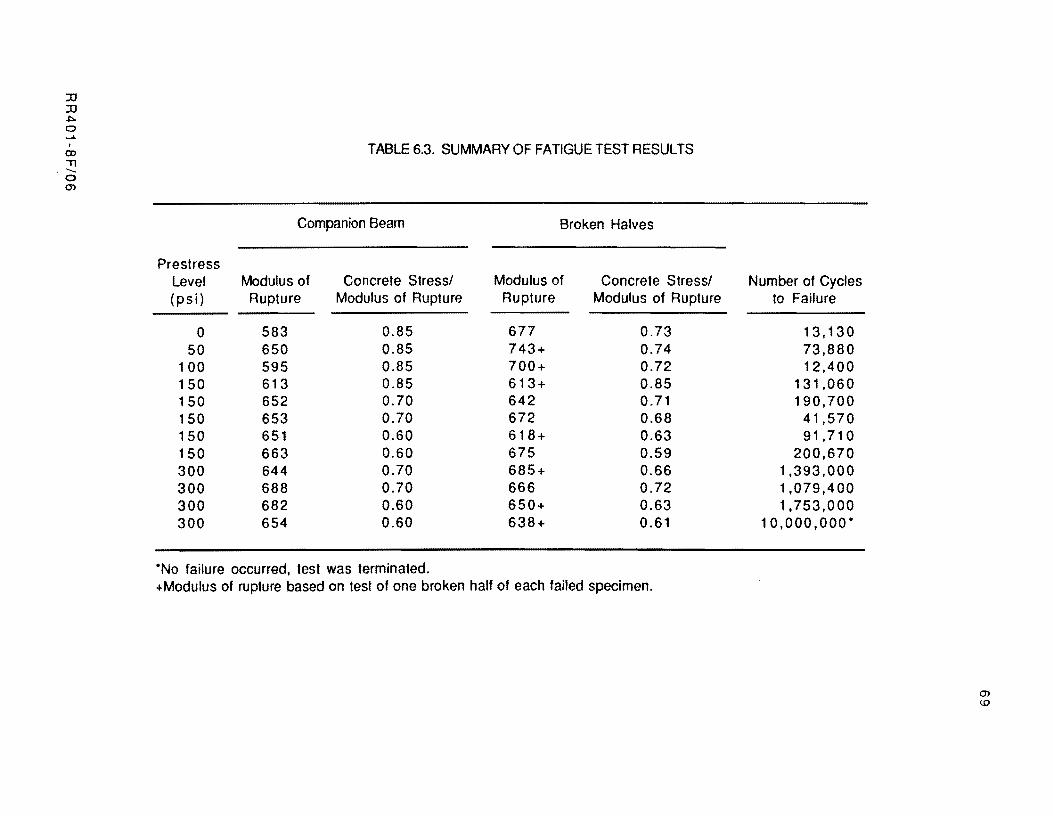
:0 :0 ~ o ...... , (XI
" --o m
TABLE 6.3. SUMMARY OF FATIGUE TEST RESULTS
Prestress Level ( psi)
o 50
100 150 150 150 150 150 300 300 300 300
Companion Beam
Modulus of Rupture
583 650 595 613 652 653 651 663 644 688 682 654
Concrete Stressl Modulus of Rupture
0.85 0.85 0.85 0.85 0.70 0.70 0.60 0.60 0.70 0.70 0.60 0.60
"No failure occurred, test was terminated.
Broken Halves
Modulus of Concrete Stressl Rupture Modulus of Rupture
677 0.73 743+ 0.74 700+ 0.72 613+ 0.85 642 0.71 672 0.68 618+ 0.63 675 0.59 685+ 0.66 666 0.72 650+ 0.63 638+ 0.61
+Modulus of rupture based on test of one broken half of each failed specimen.
Number of Cycles to Failure
13,130 73,880 12,400
131,060 190,700
41,570 91,710
200,670 1,393,000 1,079,400 1,753,000
10,000,000·
en \:.D
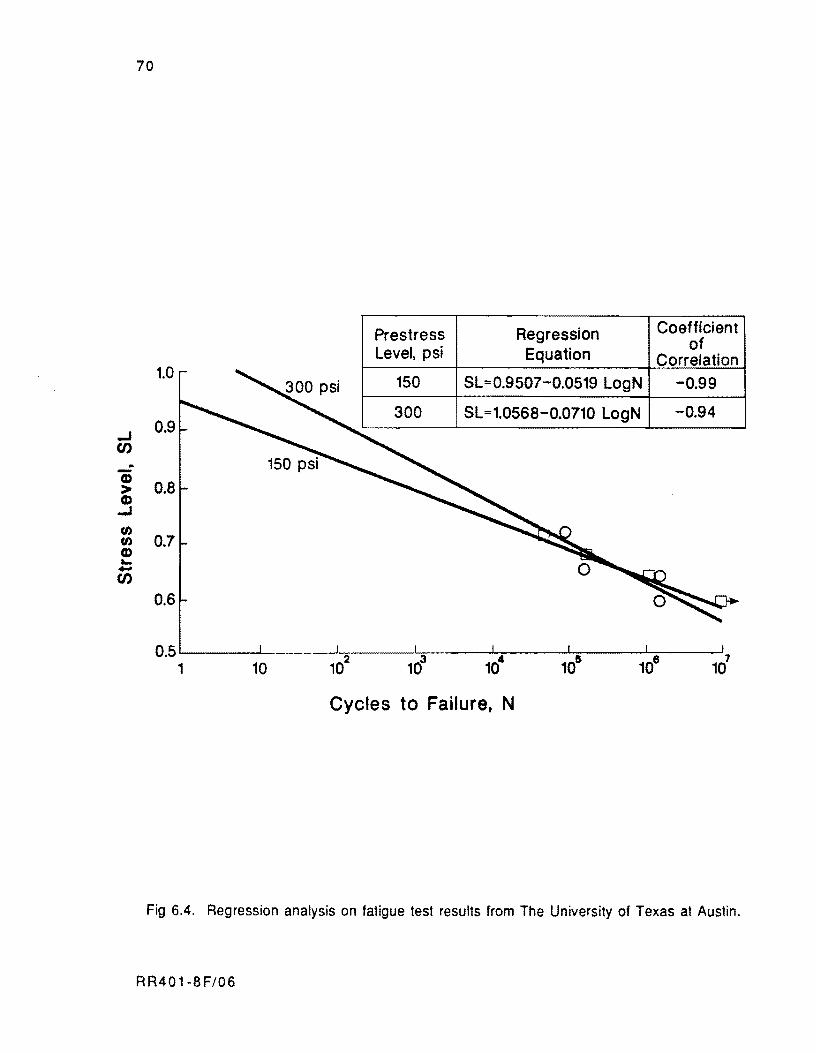
70
Prestress Regression Coefficient of Level, psi Equation Correlation
1.0 150 SL=0.9507-0.0519 LogN -0.99
300 SL=1.0568-0.0710 LogN -0.94
...J 0.9
CJ) . -Q) 0.8 >
Q) ...J
en 0.7 en
Q) "--CJ)
0.6
0.5 1 10 10
2 10
3 10
4 10& 106
107
Cycles to Failure, N
Fig 6.4. Regression analysis on fatigue test results from The University of Texas at Austin.
RR401-8F/06
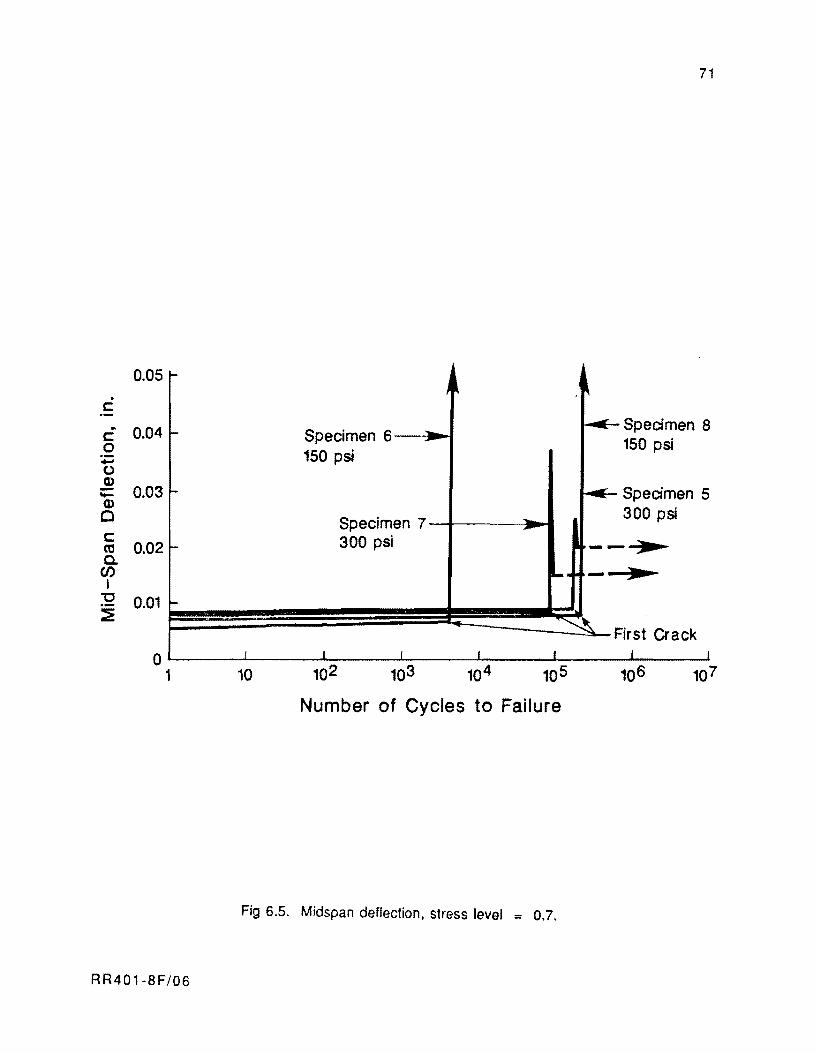
. c ~
c 0 .... 0 Q) -Q)
0 c: m c. 00 I
1J
::E
0.05 '-
0.04 r-
0.03 f-
0.02 r-
0.01 r-
o 1
RR401-8F/06
71
J~ ,~
Specimen 6 - --- Specimen 8 .- 150 psi
150 psi
~ Specimen 5
Specimen 7 - 300 psi .-
300 psi --~ .... - .. ~ First Crack
( I I I I I I
10 102 103 104 105
Number of Cycles to Failure
Fig 6.5. Midspan deflection, stress level = 0.7.
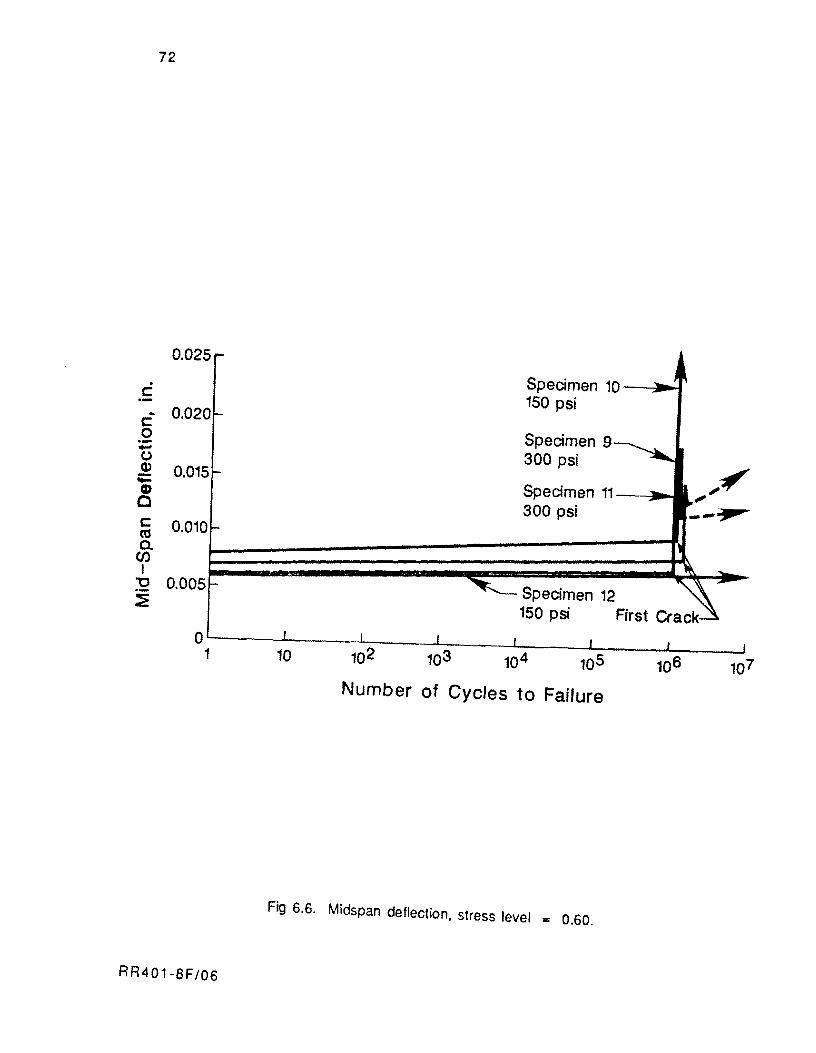
72
0.025
. c: ~
c: 0 .--(J Q)
-= I) c c: as a.
00 I
"0 0.005 ~
0 1
RR401-BF/06
Specimen 10 --a ..... 150 psi
Specimen 9 300 psi
Specimen 11-___ .... 300 psi
Specimen 12
,,~ " --3f/II""
150 psi First Crack
10
Number of Cycles to Faifure
Fig 6.6. Midspan deflection, stress level = 0.60.
73
( 4) The fatigue strength at 10 million cycles decreases with an increase in the level
of prestress. However, all the prestressed beams have a higher fatigue
strength than plain concrete. Therefore current fatigue design based on fatigue
life of plain concrete is conservative for prestressed pavements subjected to a
prestress level of 300 psi or less. Based on the results of this investigation,
the fatigue strength at 10 million cycles for the 50, 100, 150, and 300 psi
specimens are 0.652, 0.583, 0.595 (or 0.587), and 0.560, respectively.
While The University of Texas study had a very limited number of samples,
making the results less statistically significant, the same trend of decrease in
fatigue strength at 10 million cycles with increase in the level of prestress was
observed.
( 5 ) The assumption of superposition of stresses is not be valid because the fatigue
life of prestressed concrete is dependent on the interaction of the static nature
of prestress and the dynamic nature of the loading stresses. While prestressing
provides a constant benefit throughout the life of the concrete, detrimental
effects due to dynamic stresses accumulate linearly as the number of cycles of
loading increases. In general, when comparing the fatigue lives with two
different prestress levels, the specimens with a higher prestress level will
have a higher fatigue life if the specimens are subjected to a stress level higher
than the stress level at which the two equations intercept. On the other hand,
specimens with a lower prestress level will have a higher fatigue life if they
are subjected to a stress level lower than the stress level at which the two
equations intercept.
(6) The structural integrity of the specimens is highly dependent on the amount of
prestress. Specimens subjected to a higher prestress level were able to
maintain better elasto-plastic behavior after the first cracking.
RR401-8F/06

!!!!!!!!!!!!!!!!!!!"#$%!&'()!*)&+',)%!'-!$-.)-.$/-'++0!1+'-2!&'()!$-!.#)!/*$($-'+3!
44!5"6!7$1*'*0!8$($.$9'.$/-!")':!
CHAPTER 7. ANALYSIS OF MOVEMENTS, STRESSES, ETC.
In the course of designing the PCP slabs for the McLennan County overlay, a
comprehensive study of the nature of frictional resistance was carried out by the authors. An
understanding of this phenomenon is essential for developing mathematical models to simulate
the behavior of long PCP slabs. The objective of this chapter is to present the salient features
of this study phase (Ref 17).
First, the importance of frictional resistance in the design of long slabs of PCP is
demonstrated. Then, the behavior of the slabs in terms of temperature and moisture change
movements as affected by the subbase friction is described. This description summarizes
important results obtained from past studies on the subject. As a starting point for the
discussion herein, the basic principles of friction are reviewed. Relevant features of the
frictional resistance as observed during field and laboratory testing are subsequently
described. A discussion is then presented of the nature of the frictional resistance under rigid
pavements to explain the observed behavior of actual PCP slabs. Finally, several
implications from behavior prediction based on modeling the subbase friction forces as
inelastic forces are addressed.
IMPORTANCE OF THE SUBBASE FRICTIONAL RESISTANCE IN THE DESIGN OF PCP SLABS
Environmental variables cause stresses and time dependent variations of the net
prestress level longitudinally and vertically in long PCP slabs. Environmental factors
producing stresses are
(1 ) temperature and moisture stresses due to resistance of horizontal movements
by the subbase friction,
( 2 ) restrained curling produced by temperature differentials from top to bottom
of the slabs, and
(3) restrained warping produced by moisture differentials from top to bottom.
The importance of studying the frictional resistance for the design of PCP slabs is
centered on two aspects:
R R401-8F/07 75
76
( 1 ) Before application of prestress forces, the tensile stresses produced in the
slabs due to temperature drops may cause premature cracking of the pavement.
especially during the first night if the slabs are placed at the peak daily
temperatures. Predictions of the friction restraint stresses during the first
hours after concrete placement are required in this case, along with
knowledge of the strength gain properties of concrete at very early ages. The
prediction of these stresses permits assessment of the applied prestress forces
at the earliest possible time following placement, to minimize the risks of
developing premature cracking in the slab and, also, to avoid applying excessive
forces which may cause failure of the concrete near the anchor zone.
( 2 ) Predictions of friction restraint stresses, primarily as a result of the daily
temperature change movements, represent an essential part of the design of
thickness and longitudinal prestress level. Slab thickness and longitudinal
prestress are designed so that the concrete flexural strength is not exceeded by
the stresses due to (a) frictional resistance, (b) restrained curling and
warping, and (c) wheel loads.
If thickness and prestress level are determined so that the fatigue strength of the
concrete is not exceeded by the tensile stress due to frictional resistance, restrained curling
and warping, and the static application of the wheel load produCing the maximum tensile stress
in the PCP, then a premature fatigue failure of the pavement is unlikely and the elastic
behavior of the concrete is assured. This design criterion is usually referred to as elastic
design of PCP slabs (Ref 17). The damage to the pavement is more significant if wheel loads
are applied when the temperature decreases. In this case, the subbase frictional resistance
induces tensile stresses in the slab when the PCP tends to contract (Ref 18). With both
design criteria, the prediction of the friction restraint stresses is, therefore, essential.
EFFECT OF THE FRICTIONAL RESISTANCE ON THE MOVEMENTS OF PCP SLABS
Length changes of PCP slabs occur due to post-tensioning and they are restrained or
unrestrained by the subbase friction depending on the construction.. Long prestressed and
RR401-8F/07

77
conventionally reinforced pavements have been explored in this respect in recent years, and
excellent data on movements have been obtained. In a 1312-foot PCP in Germany (Ref 19). it
was observed that the central portion of the pavement was fully restrained by the friction
from the movements due to the daily temperature changes, as illustrated in Fig 7.1. Cashell
and Benham (Ref 20) report daily temperature change movements restrained by the friction
in a 1310-foot continuously reinforced pavement (CRCP) but not movement from seasonal
temperature changes, as shown in Fig 7.2. The daily movements of the CRCP were smaller
than those of the PCP slabs due to the internal relief provided by the cracks of the CRCP. The
large end movements in the CRCP due to seasonal influences corresponded closely to
contraction or expansion without frictional resistance.
In accordance with the outlined behavior, the slab movements can be classified with
respect to the frictional resistance as follows:
( 1 ) Movements partially restrained by the friction. This category includes the
movements produced by daily temperature changes.
( 2) Movements unrestrained by the friction. These movements include concrete
swelling, shrinkage, and creep.
( 3 ) Elastic shortening which is diminished by the friction when the prestress force
is applied. but which affects the full slab length shortly after post-tensioning
(Ref 21). This movement is, therefore, a temporarily restrained movement.
REVIEW OF BASIC PRINCIPLES FOR FRICTION FORCES
In classical mechanics, the friction force is defined as the tangential force that develops
when two surfaces which are in contact tend to move, one with respect to the other. The nature
of the friction force is not completely known; however, it is assumed to be produced by two
factors: (1) molecular attraction and the nature of the surfaces in contact and (2) the
irregularities between the surfaces in contact. In a block model, as shown in Fig 7.3. if a
horizontal force is applied to the block, the friction force that develops before the block
experiences any movement is called static friction force. The friction coefficient
corresponding to the maximum static friction force is named static coefficient of friction. The friction force that develops after the maximum static friction force, F m' is
RR401-BF/07
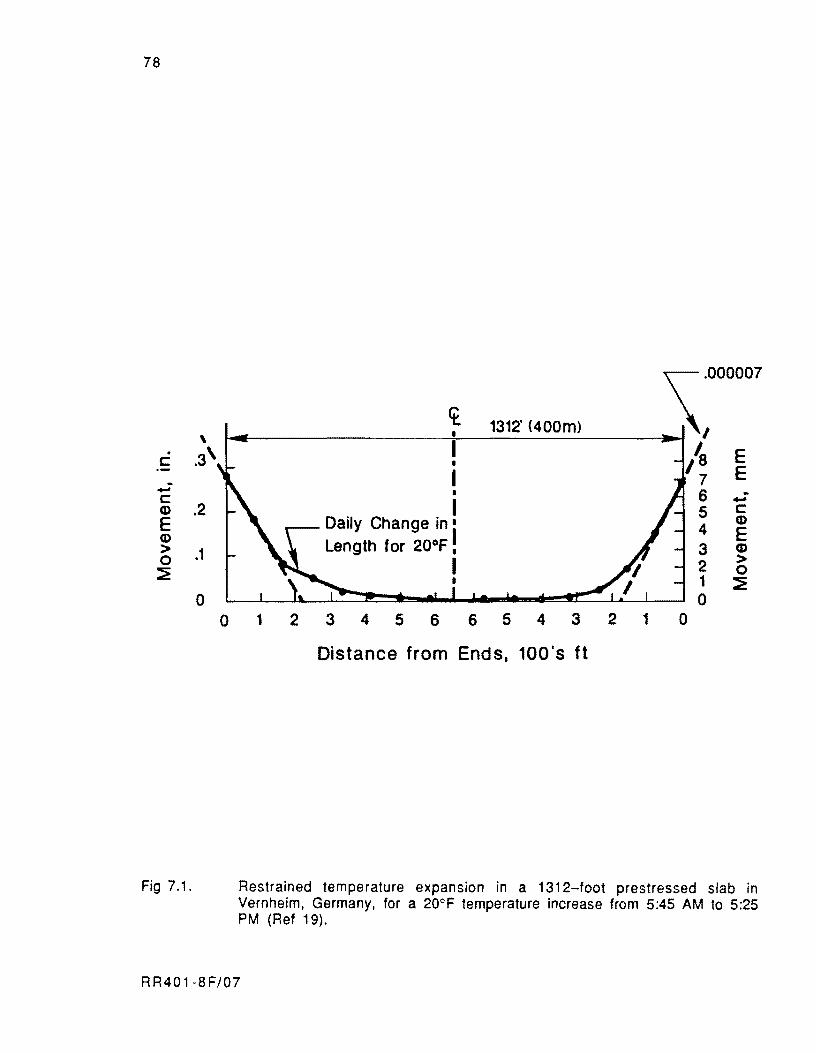
78
\ . .3' c:
-c: Q) .2 E Q)
> .1 0 :2
0 0
Fig 7.1.
ct 1312' (400m)
\~OOOOO7
'S E '7 E I 6 .. I -5 c:
Daily Change in i 4 Q)
E Length for 20°F. 3 CD
I 2 > 0
1 ~ 0
1 2 3 4 5 6 6 5 4 3 2 1 0
Distance from Ends, 100's ft
Restrained temperature expansion in a 1312-foot prestressed slab in Vernheim, Germany, for a 20°F temperature increase from 5:45 AM to 5:25 PM (Ref 19).
R R40 1-8 F/07
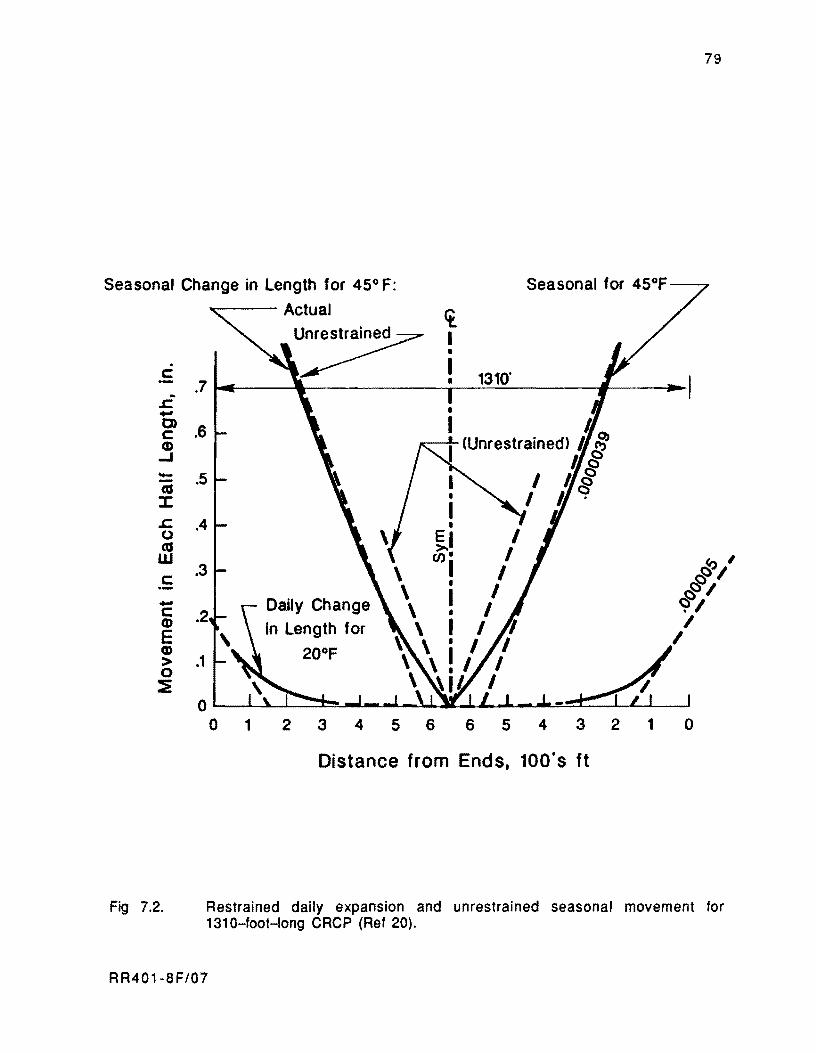
79
Seasonal Change in Length for 45° F: Seasonal for 45°F
. c:: -.r. -0)
c:: CD
-oJ --as ::t: .r. 0 as w c:: --c:: CD E CD > 0 ::;
Fig 7.2.
Actual ct
~ I • I 1310' . 7 •
.6
.5
.4
.3 ~I' ~I
Daily Change ~I .2 in Length for I
I .1 20°F
0 0 1 2 3 4 5 6 6 5 4 3 2 1 0
Distance from Ends, 100's ft
Restrained daily expansion and unrestrained seasonal movement for 1310-foot-long CRCP (Ref 20).
RR401-8F/07
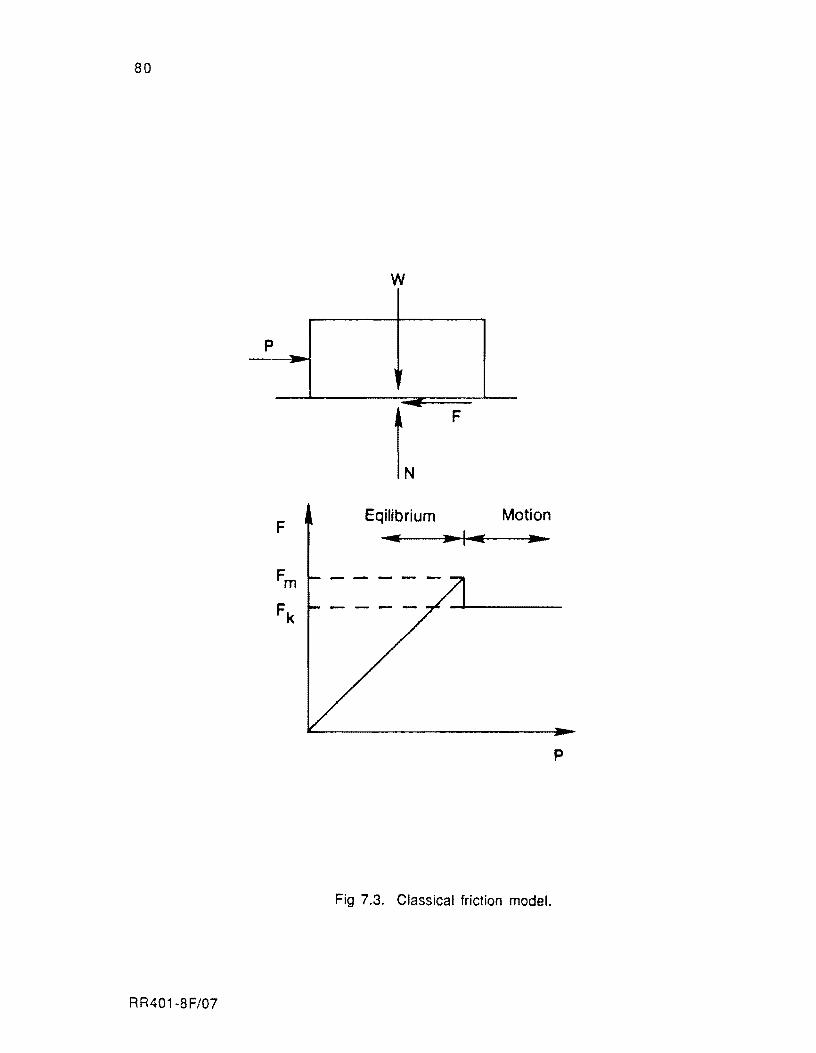
80
w
p .... -
t F
Eqilibrium Motion F
... 1...-...... .... Fm
Fk
p
Fig 7.3. Classical friction model.
RR401-8F/07
81
exceeded and the block slides is named the kinetic friction coefficient. It is interesting that.
if the block is pushed until sliding occurs in both directions, the movements of the block are
governed by perfect hysteretic friction force versus displacement curves, as shown in Fig
7.4.
The friction coefficient that corresponds to the kinetic friction force is called the
kinetic friction coefficient. and it is lower than the static friction coefficient. The relevant
properties of these coefficients are that (1) both coefficients are independent of the normal
force, (2) both coefficients depend on the nature of the surfaces in contact and the exact
condition of the surfaces, and (3) both coefficients are independent of the area of the surfaces
in contact.
FEATURES OF THE SLAB-SUBBASE FRICTIONAL RESISTANCE OBSERVED DURING FIELD TESTS
Studies have been conducted since 1924 to investigate the nature of the frictional
resistance under rigid pavements. Some of the features observed during field tests are
presented below.
Goldbeck
Studies conducted in 1924 by the U.S. Bureau of Public Roads (Ref 22) gave the first
relevant features on the nature of the frictional resistance offered by different materials to
horizontal movements of concrete pavement slabs. The following important conclusions may
be drawn from these studies:
( 1 ) If a pushing force is exerted on a pavement slab cast over a certain subbase
material, the irregularities between the surfaces in contact act as resistance to
slab movements. This resistance results in the development at shear stresses
at the surface of the subbase material and which tends to elastically deform it
when the slab tends to move. More roughness in the subbase results in more
resistance for the slab, with a consequent increase of the amount of subbase
RR401-8F/07
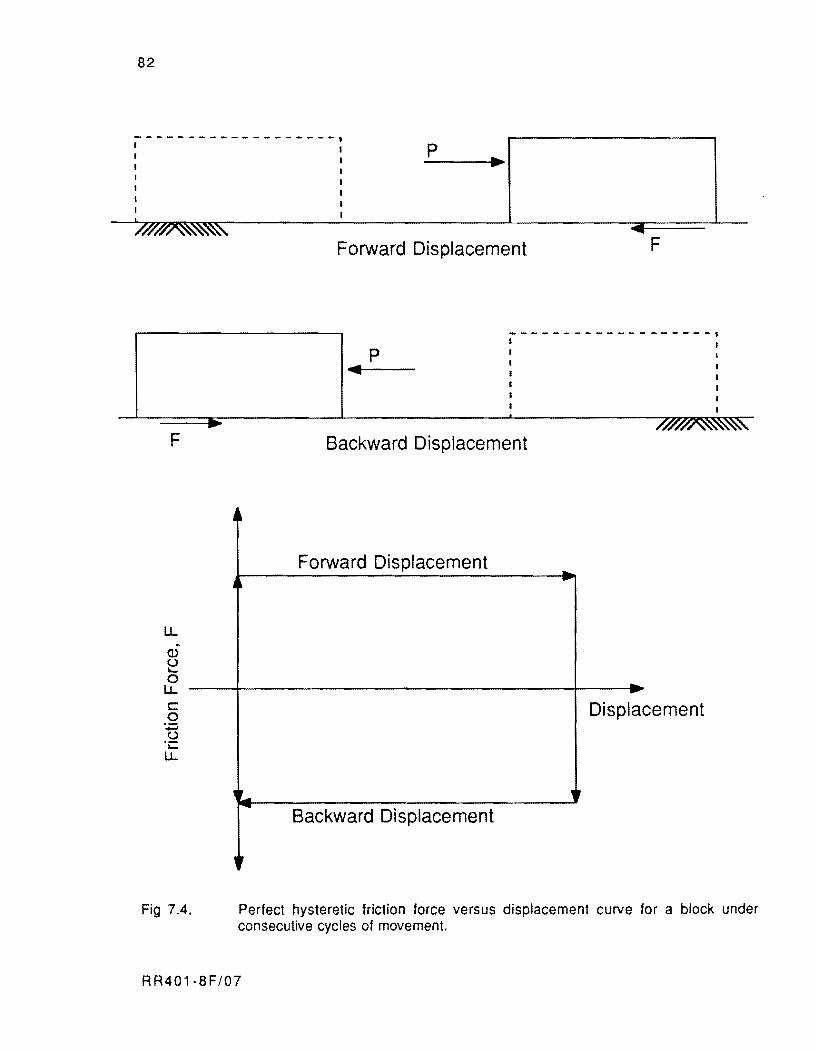
82
-------------------, I I p
F
u... Q) 0 "-0
u... c: 0 .~
0 ·c u...
Fig 7.4.
.~
.~
,r_ -
"
I ....
Forward Displacement
-------------------, p ...
I
Backward Displacement
Forward Displacement
Backward Displacement
.. -
.. ... Displacement
,
Perfect hysteretic friction force versus displacement curve for a block under consecutive cycles of movement.
RR401·8F/07

83
material pushed by the slab and. therefore. a subsequent increase of the
frictional resistance.
(2) The frictional resistance may be greatly reduced in concrete pavements if more
slippage of the slab is allowed by the elimination of ridges and depressions in
the subbase or if a sand layer is introduced between the subbase and the
pavement.
( 3 ) A secondary observation of interest to this research is that the frictional
resistance is considerably lower when subbase materials are tested under
saturated conditions. This is due to the fact that the water acts as a lubricant
which permits the slabs to slip easier and the moisture affects the consistency
of most subbase materials.
After the studies conducted by Goldbeck were reported. a thick layer of sand was
introduced under highway pavement slabs. However. in prestressed concrete pavements, the
slabs are relatively thin and tend to experience large deformations at edges and joints of the
pavement under wheel loads. These deformations may cause voids beneath the pavement due to
pumping, which may eventually lead to other serious problems. This led highway engineers
to study other types of friction relieving materials.
Timms
Relevant results pertaining to the behavior of friction are reported by Timms (Ref
23). His study. conducted for the U. S. Bureau of Public Roads in 1963, consisted of pushing
concrete slabs cast on different types of materials. The following conclusions are important.
( 1 ) The friction coefficient is greater when the slabs are pushed initially and
decreases for the average of subsequent movements. Figure 7.5 shows this
condition for the materials tested.
( 2) On release of the thrusting force, a slab slightly tends to return its original
position. This slight return is a semi-elastic recovery of the subbase material
being tested. This particular feature is also reported by Friberg in tests with
100-foot -long slabs (Ref 24).
RR401·8F/07
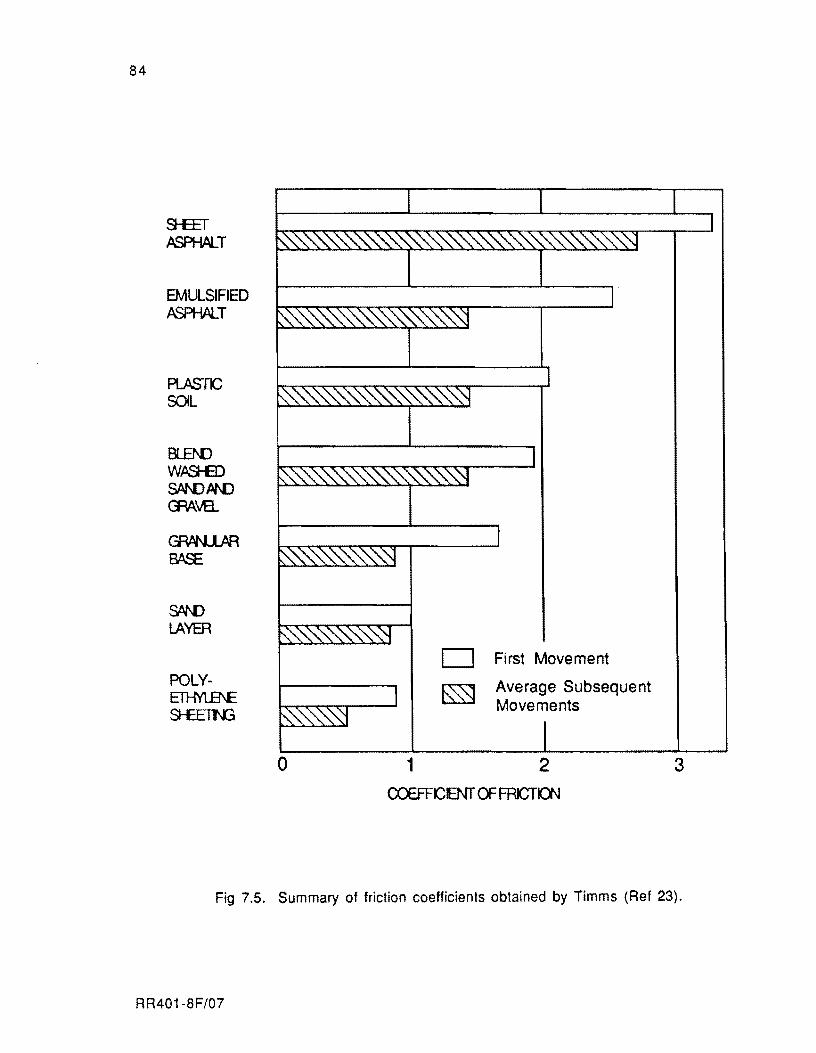
84
EMULSIFIED ASPHALT
PlASTC SOIL
Bl.B\()
WA9-ED S/lJ\DN-IJ <RA.V9..
<?PwAN..l..AR BA..':E
SAN)
LAYER
POLY· Ell-M..f3\E SI-E.ETI\G
0
First Movement
Average Subsequent Movements
1 2 COEFFCENT OF FRCTO'J
3
Fig 7.5. Summary of friction coefficients obtained by Timms (Ref 23).
RR401-8F/07

85
(3) From Fig 7.5, it is evident that the lowest friction coefficients are obtained
with double layers of polyethylene films, followed by sand subbases, granular
subbases, plastic clays, and emulsified and asphalt sheet layers.
Other Field Tests
The results from other field tests that evaluate the properties of particular materials
are reported in the literature. Two of these tests are reported herein.
Saudi Arabia Tests. The design of the apron zone of the King Fahd International Airport
(KFIA) in Dhahran, Saudi Arabia, was conducted by Austin Research Engineers (Ref 18). The
severe climatological conditions in Dhahran, where large daily temperature changes are
characteristic, required that the merits of different subbase types be carefully assessed to
avoid premature cracking of the pavement. Concrete cylinders 22.5 inches in diameter and
16 inches deep were cast and pushed over the following materials:
( 1 ) an aggregate subbase coated with a medium curing asphalt cutback (MC-70),
( 2 ) a fine grade bituminous subbase course, and
( 3 ) one-sheet of visqueen over a bituminous subbase course.
The testing procedure is described in Ref 25. The results from these tests are
graphically depicted in Fig 7.6.
Field Tests at Gainesville. Texas. A series of field tests were conducted by The
University of Texas at Austin, as part of a program for deSigning the PCP overlay in McLennan
County (Ref 26). In these tests, 6-inch-thick concrete slabs were cast and tested over the
following materials:
(1 ) an asphalt subbase,
(2) a 6-mil polyethylene sheeting on an asphalt subbase, and
( 3 ) a double layer of 6-mil polyethylene sheeting on an asphalt subbase.
The testing procedure is described in great detail in Refs 27 and 28. The results are in
complete agreement with the results obtained in Saudi Arabia, and thus are independent of the
difference in geographical locations of the testing sites. The results from both tests are,
RR401-8F/07
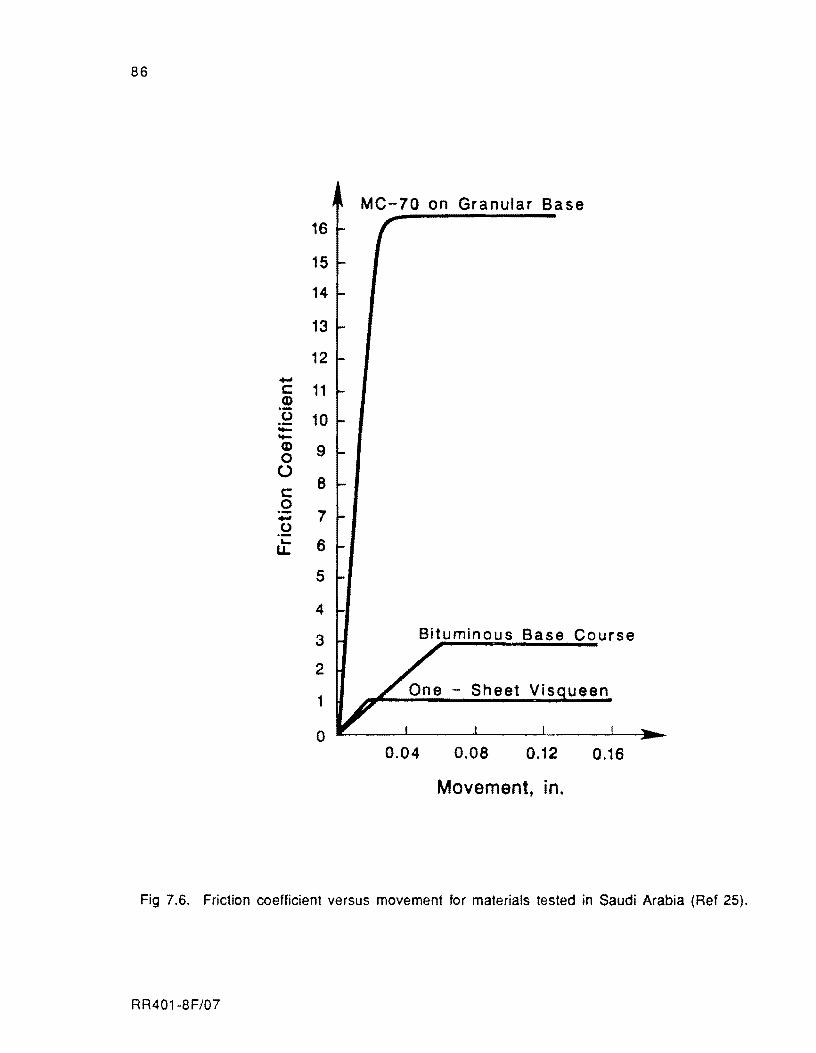
86
MC-70 on Granular Base
16
15
14
13
12 -c: 11 0)
'0 10 .---0) 9 0 U
8 c: 0 - 7 0 ... 6 LL
5
4
3 Bituminous Base Course
2
1
0 0.04 0.08 0.12 0.16
Movement, in.
Fig 7.6. Friction coefficient versus movement for materials tested in Saudi Arabia (Ref 25).
RR401-8F/07
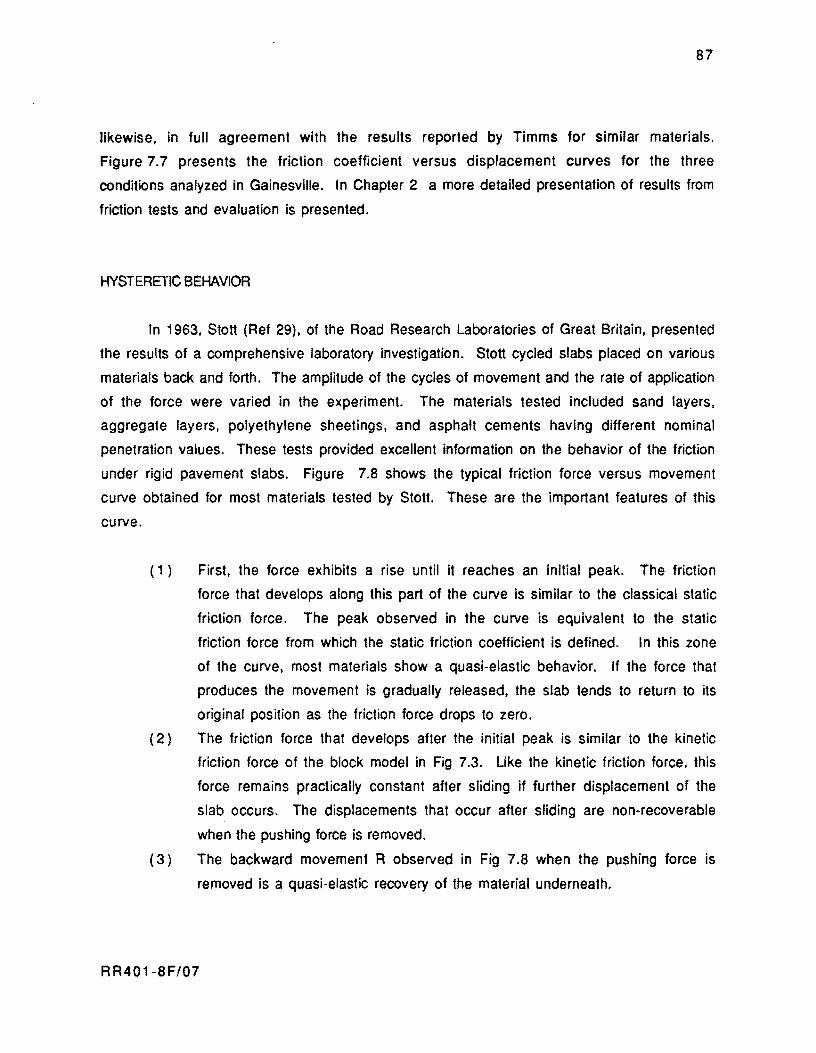
87
likewise, in full agreement with the results reported by Timms for similar materials.
Figure 7.7 presents the friction coefficient versus displacement curves for the three
conditions analyzed in Gainesville. In Chapter 2 a more detailed presentation of results from
friction tests and evaluation is presented.
HYSTERETIC BEHAVIOR
In 1963, Stott (Ref 29), of the Road Research Laboratories of Great Britain, presented
the results of a comprehensive laboratory investigation. Stott cycled slabs placed on various
materials back and forth. The amplitude of the cycles of movement and the rate of application
of the force were varied in the experiment. The materials tested included sand layers,
aggregate layers, polyethylene sheetings, and asphalt cements having different nominal
penetration values. These tests provided excellent information on the behavior of the friction
under rigid pavement slabs. Figure 7.8 shows the typical friction force versus movement
curve obtained for most materials tested by Stott. These are the important features of this
curve.
( 1 ) First, the force exhibits a rise until it reaches an initial peak. The friction
force that develops along this part of the curve is similar to the classical static
friction force. The peak observed in the curve is equivalent to the static
friction force from which the static friction coefficient is defined. In this zone
of the curve, most materials show a quasi-elastic behavior. If the force that
produces the movement is gradually released, the slab tends to return to its
original pOSition as the friction force drops to zero.
(2) The friction force that develops after the initial peak is similar to the kinetic
friction force of the block model in Fig 7.3. Like the kinetic friction force, this
force remains practically constant after sliding if further displacement of the
slab occurs. The displacements that occur after sliding are non-recoverable
when the pushing force is removed.
( 3 ) The backward movement R observed in Fig 7.S when the pushing force is
removed is a quasi-elastic recovery of the material underneath.
RR401-SF/07
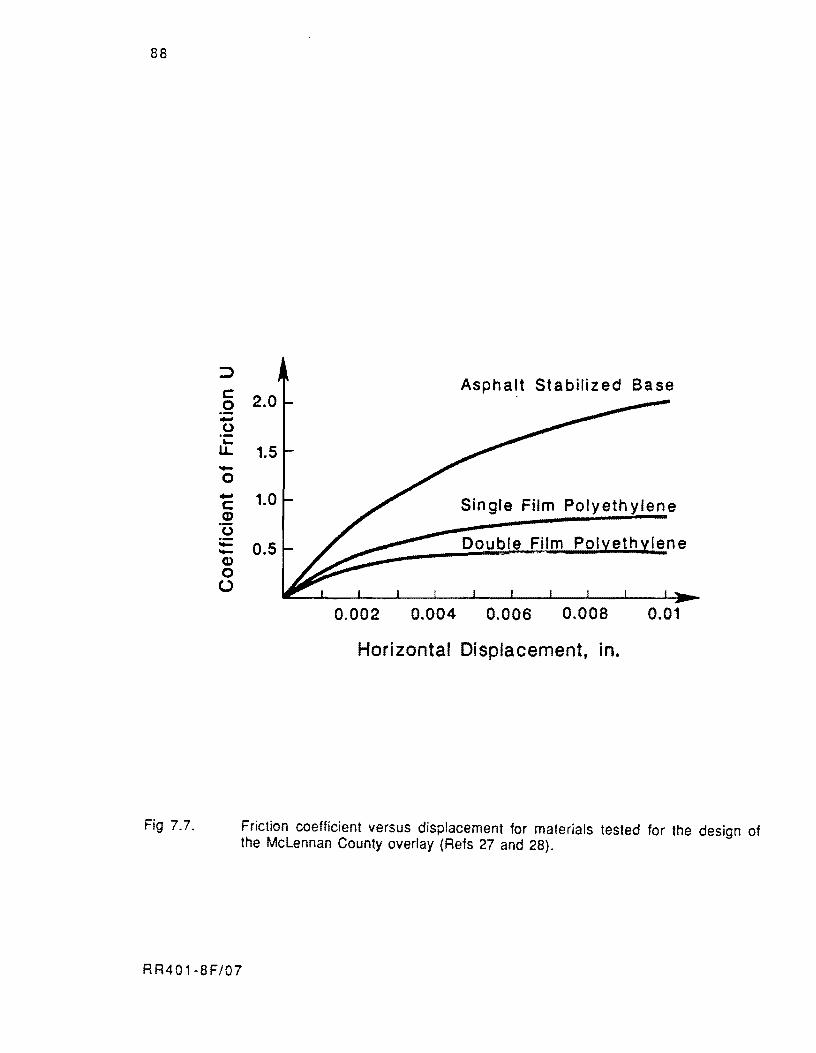
88
:::> c: 0 -0 .... u.. -0 -c Q)
'0 :;:: -Q)
0 U
Fig 7.7.
Asphalt Stabilized Base 2.0
1.0 Single Film Polyeth ylene
0.5
0.002 0.004 0.006 0.008 0.01
Horizontal Displacement, in.
Friction coefficient versus displacement for materials tested for the design of the McLennan County overlay (Refs 27 and 28).
RR401-8F/07
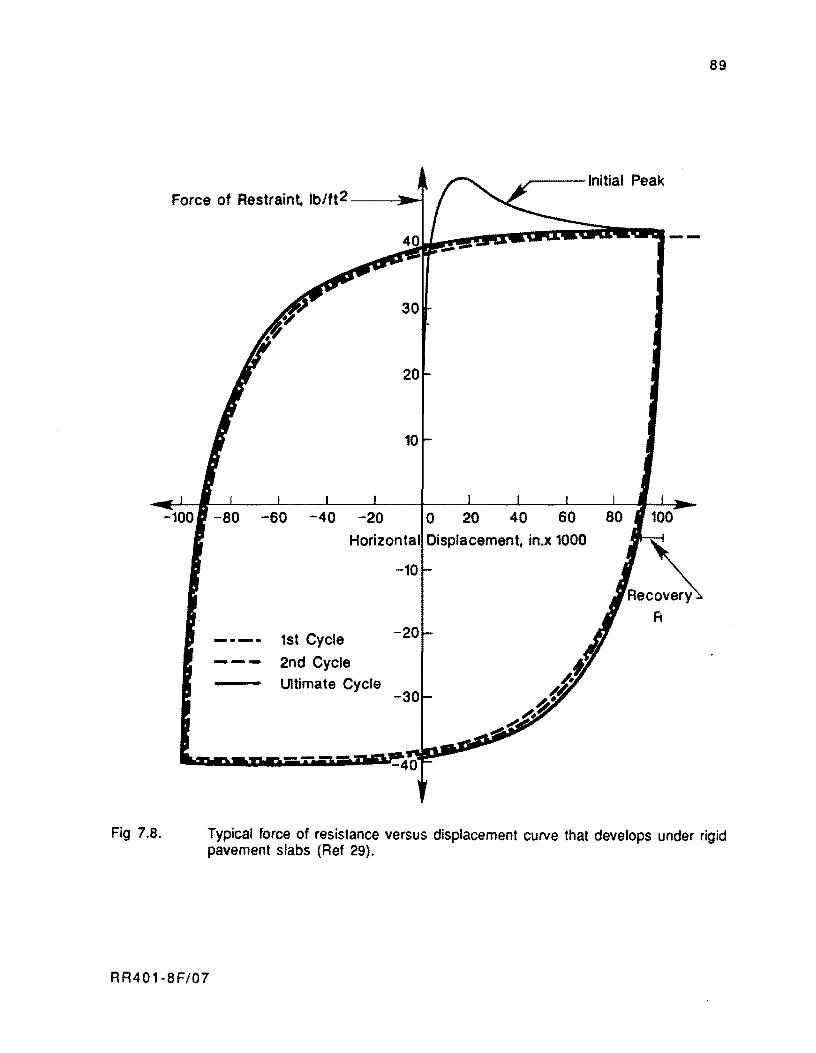
Fig 7.8.
89
---Initial Peak Force of Restraint, Ib/ft2 --_.."'"1
30
20
10
-100 -80 -60 -40 -20 o 20 40 60 80 100
Horizontal Displacement. in.x 1000
Rec~ -10
A
---- 1st Cycle
- - - 2nd Cycle Ultimate Cycle
Typical force of resistance versus displacement curve that develops under rigid pavement slabs (Ref 29).
RR401-8F/07
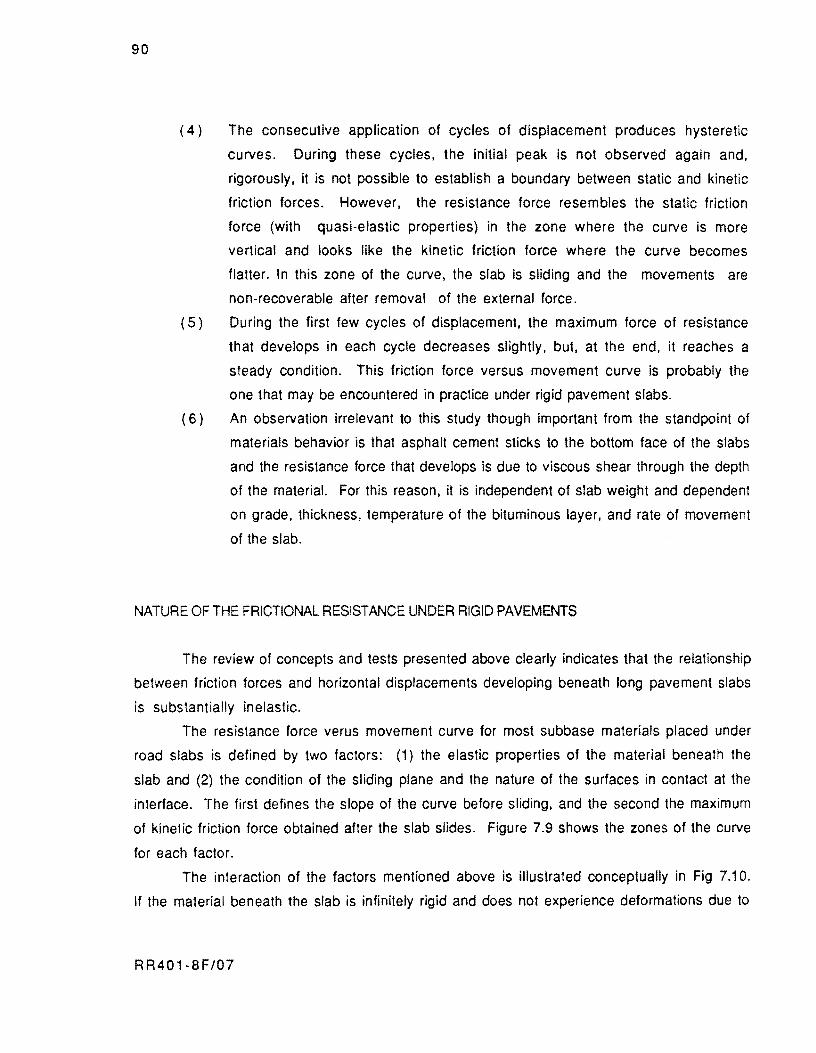
90
( 4 ) The consecutive application of cycles of displacement produces hysteretic
curves. During these cycles, the initial peak is not observed again and,
rigorously, it is not possible to establish a boundary between static and kinetic
friction forces. However, the resistance force resembles the static friction
force (with quasi-elastic properties) in the zone where the curve is more
vertical and looks like the kinetic friction force where the curve becomes
flatter. In this zone of the curve, the slab is sliding and the movements are
non-recoverable after removal of the external force.
( 5 ) During the first few cycles of displacement, the maximum force of resistance
that develops in each cycle decreases slightly, but, at the end, it reaches a
steady condition. This friction force versus movement curve is probably the
one that may be encountered in practice under rigid pavement slabs.
( 6 ) An observation irrelevant to this study though important from the standpoint of
materials behavior is that asphalt cement sticks to the bottom face of the slabs
and the resistance force that develops is due to viscous shear through the depth
of the material. For this reason, it is independent of slab weight and dependent
on grade, thickness, temperature of the bituminous layer, and rate of movement
of the slab.
NATURE OF THE FRICTIONAL RESISTANCE UNDER RIGID PAVEMENTS
The review of concepts and tests presented above clearly indicates that the relationship
between friction forces and horizontal displacements developing beneath long pavement slabs
is substantially inelastic.
The resistance force verus movement curve for most subbase materials placed under
road slabs is defined by two factors: (1) the elastic properties of the material beneath the
slab and (2) the condition of the sliding plane and the nature of the surfaces in contact at the
interface. The first defines the slope of the curve before sliding, and the second the maximum
of kinelic friction force obtained after the slab slides. Figure 7.9 shows the zones of the curve
for each factor.
The interaction of the factors mentioned above is illustrated conceptually in Fig 7.10.
If the material beneath the slab is infinitely rigid and does not experience deformations due to
R R40 1-8F/07
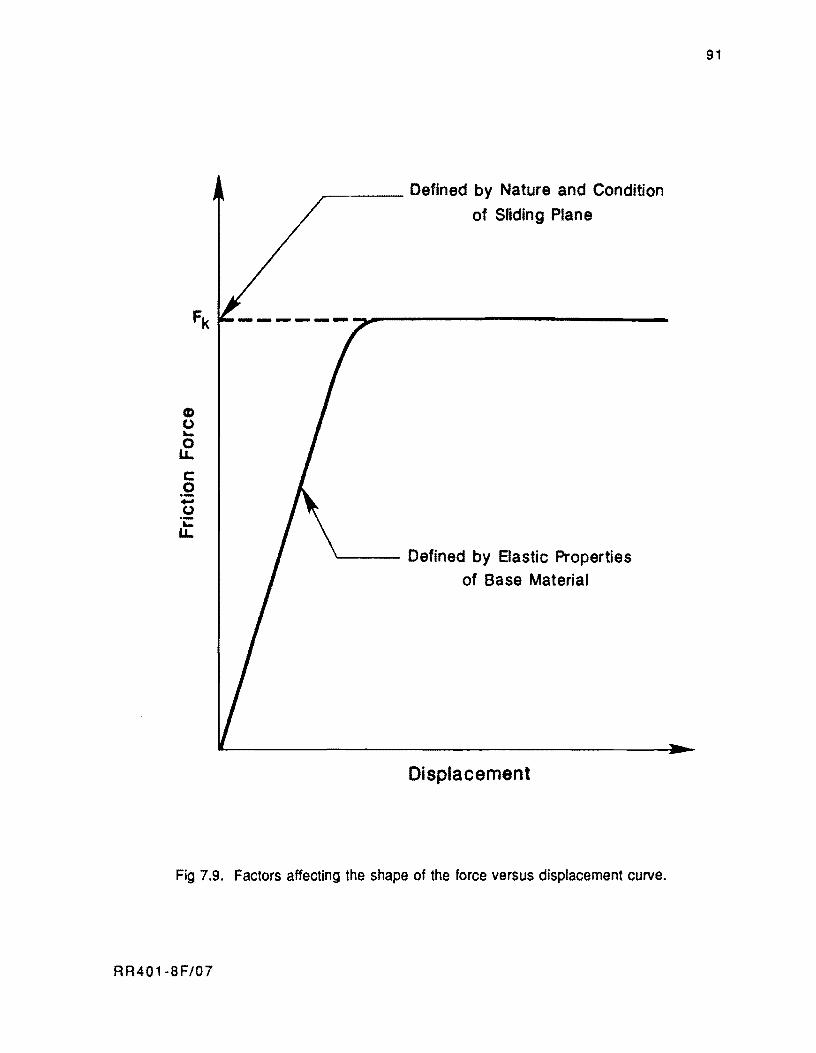
Q) u .... o u.. c:: .2 -u 'i: u..
,--___ Defined by Nature and Condition
of Sliding Plane
'---- Defined by Elastic Properties of Base Material
Displacement
Fig 7.9. Factors affecting the shape of the force versus displacement curve.
RR401-8F/07
91
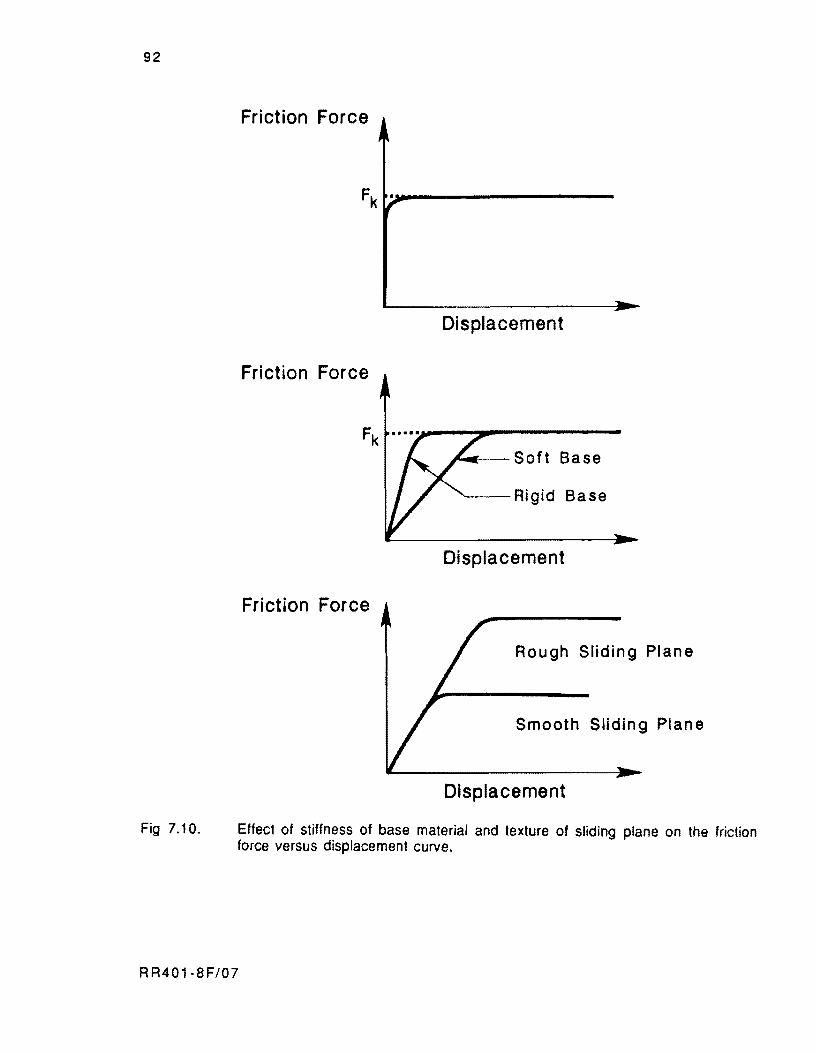
92
Fig 7.10.
Friction Force
Displacement
Friction Force
~~-Soft Base
'---- Rigid Base
Displacement
Friction Force
Rough Sliding Plane
Smooth Sliding Plane
Displacement
Effect of stiffness of base material and texture of sliding plane on the friction force versus displacement curve.
RR401·8F/07
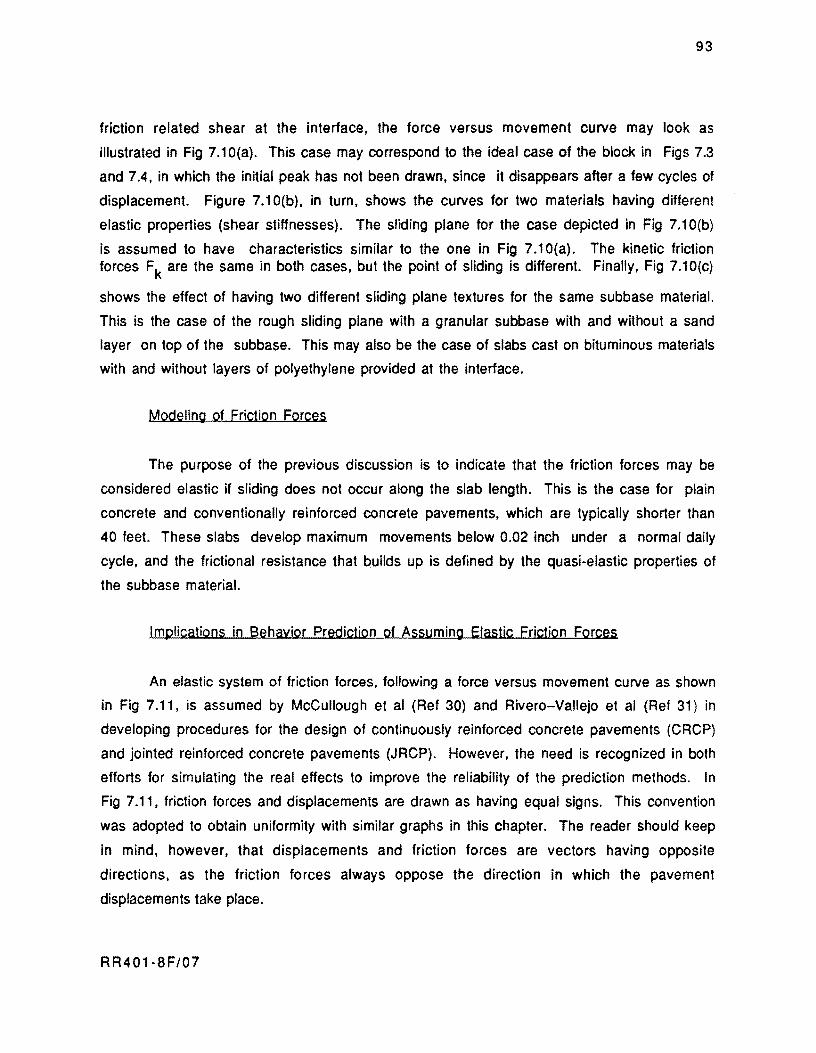
93
friction related shear at the interface, the force versus movement curve may look as
illustrated in Fig 7.10(a). This case may correspond to the ideal case of the block in Figs 7.3
and 7.4, in which the initial peak has not been drawn, since it disappears after a few cycles of
displacement. Figure 7.10(b). in turn, shows the curves for two materials having different
elastic properties (shear stiffnesses). The sliding plane for the case depicted in Fig 7.10(b)
is assumed to have characteristics similar to the one in Fig 7.1 O(a). The kinetic friction forces Fk are the same in both cases, but the point of sliding is different. Finally, Fig 7.10(c)
shows the effect of having two different sliding plane textures for the same subbase material.
This is the case of the rough sliding plane with a granular subbase with and without a sand
layer on top of the subbase. This may also be the case of slabs cast on bituminous materials
with and without layers of polyethylene provided at the interface.
Modeling of Friction Forces
The purpose of the previous discussion is to indicate that the friction forces may be
considered elastic if sliding does not occur along the slab length. This is the case for plain
concrete and conventionally reinforced concrete pavements, which are typically shorter than
40 feet. These slabs develop maximum movements below 0.02 inch under a normal daily
cycle, and the frictional resistance that builds up is defined by the quasi-elastic properties of
the subbase material.
Implications in Behavior Prediction of Assuming Elastic Friction Forces
An elastic system of friction forces, following a force versus movement curve as shown
in Fig 7.11, is assumed by McCullough et al (Ref 30) and Rivero-Vallejo et al (Ref 31) in
developing procedures for the design of continuously reinforced concrete pavements (CRCP)
and jointed reinforced concrete pavements (JRCP). However, the need is recognized in both
efforts for simulating the real effects to improve the reliability of the prediction methods. In
Fig 7.11. friction forces and displacements are drawn as having equal signs. This convention
was adopted to obtain uniformity with similar graphs in this chapter. The reader should keep
in mind, however, that displacements and friction forces are vectors having opposite
directions, as the friction forces always oppose the direction in which the pavement
displacements take place.
RR401-SF/07
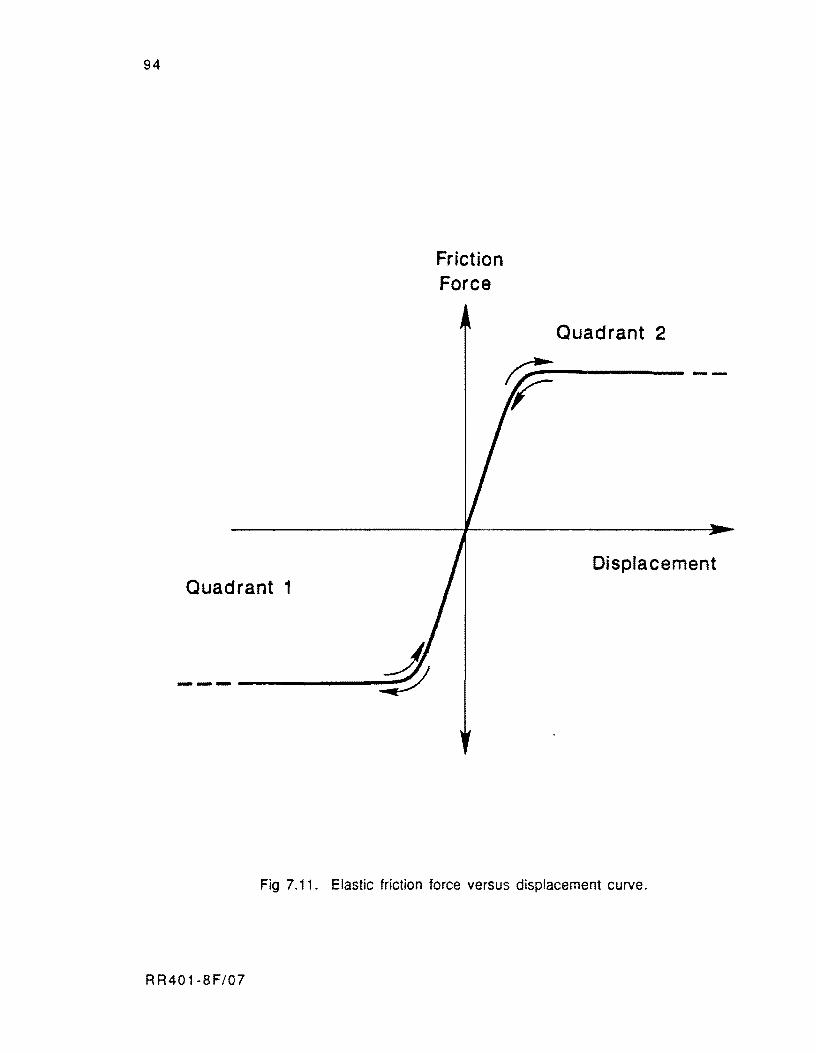
94
Quadrant 1
----------
Friction Force
Quadrant 2
;p----
Displacement
Fig 7.11. Elastic friction force versus displacement curve.
R R401-8F/07
95
Some relevant implications in behavior prediction of assuming elastic friction forces
are given here.
( 1 ) The slab will develop compressive stresses when the temperature exceeds an
initial reference temperature, usually referred to as the slab setting
temperature (Ref 17). At this reference temperature, all the slab points are
considered as having zero movements and their behavior can be located at the
origin in Fig 7.11. Friction forces and stresses are zero for this initial
condition. When the points of the half slab shown in Fig 7.12(a) are displaced
to the right of their initial position, they are assumed as behaving in
Quadrant 2 in Fig 7.11, thus developing compressive stresses as shown in
Fig 7.12(b). This is the case for higher temperatures than the reference
temperature. Accordingly, a slab cast at the minimum temperature of the day
will develop exclusively compressive stresses during the entire day.
Furthermore, a slab cast at the minimum temperature of the year will develop
compressive stresses during the year only if shrinkage and other sources of
slab contraction are ignored.
(2) Figure 7.13 shows an extension of implication (1) for a series of consecutive temperature cycles. For times t1, t2, t3, t4, and ts' with equal temperature
T 1 above the reference temperature TO' the slabs will develop compressive
stresses of the same magnitude irrespective of whether the slab is contracting
or expanding. likewise. equal stresses are obtained for other temperatures
representing equal temperature changes with respect to the reference
temperature.
(3) Shrinkage and other sources of long term longitudinal movement do not occur
without frictional resistance. but accumulate on a daily rate basis. resulting eventually in the
build up of maximum friction forces and concrete restraint stresses. This mechanism is
illustrated in Fig 7.14. If the slab starts contracting from the maximum temperature of the day. Point A in Fig 7.14 moves from its initial position, ZAO' to position ZA1 after the
maximum contraction of the day. The part of the movement Z A 1 due to the daily
temperature drop is ZAT1, whereas the rest of the movement is produced by shrinkage
and other sources of long-term contraction. If the temperature
RR401-8F/07
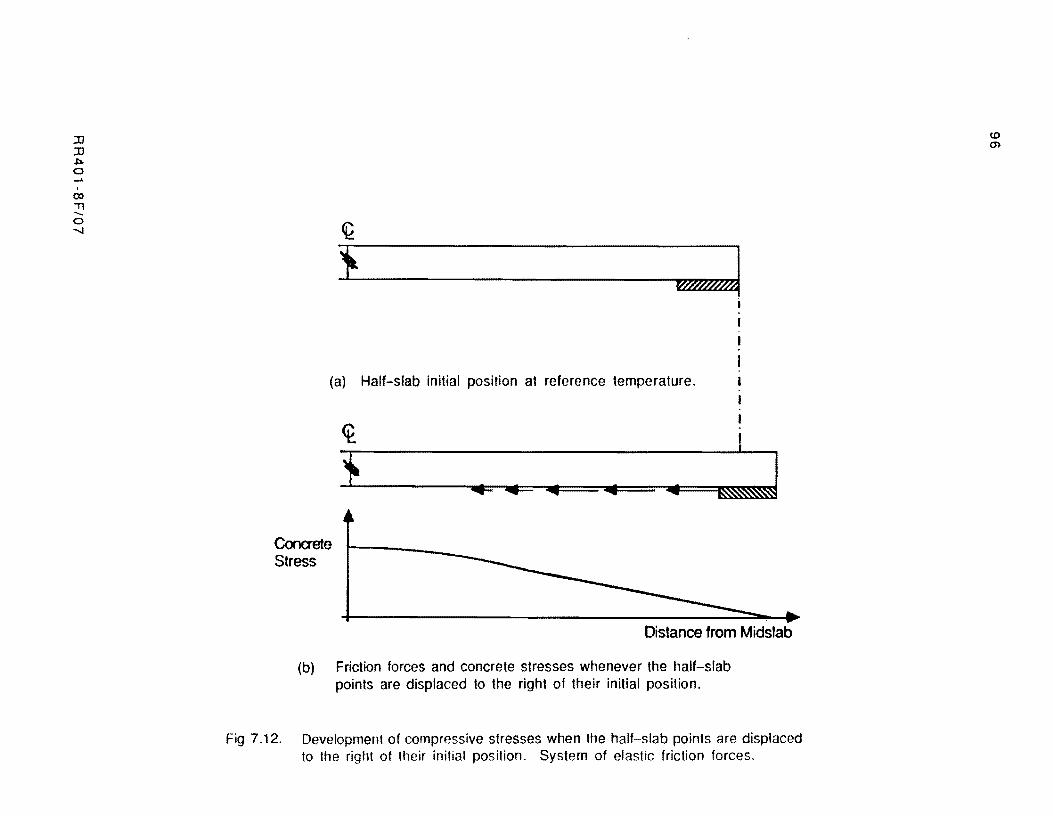
::D ::D .l:>e -"
())
"T1 --e -...,J <i!
} V&##J
(a) Half-slab initial position at reference temperature.
~
i I
I
I
i .... 4= ••• :J Conaete Stress
Distance from Midslab
(b) Friction forces and concrete stresses whenever the half-slab points are displaced to the right of their initial position.
Fig 7.12. Development of compressive stresses when the half-slab points are displaced to the riaht of their initial position. System of elastic friction forces.
<D en
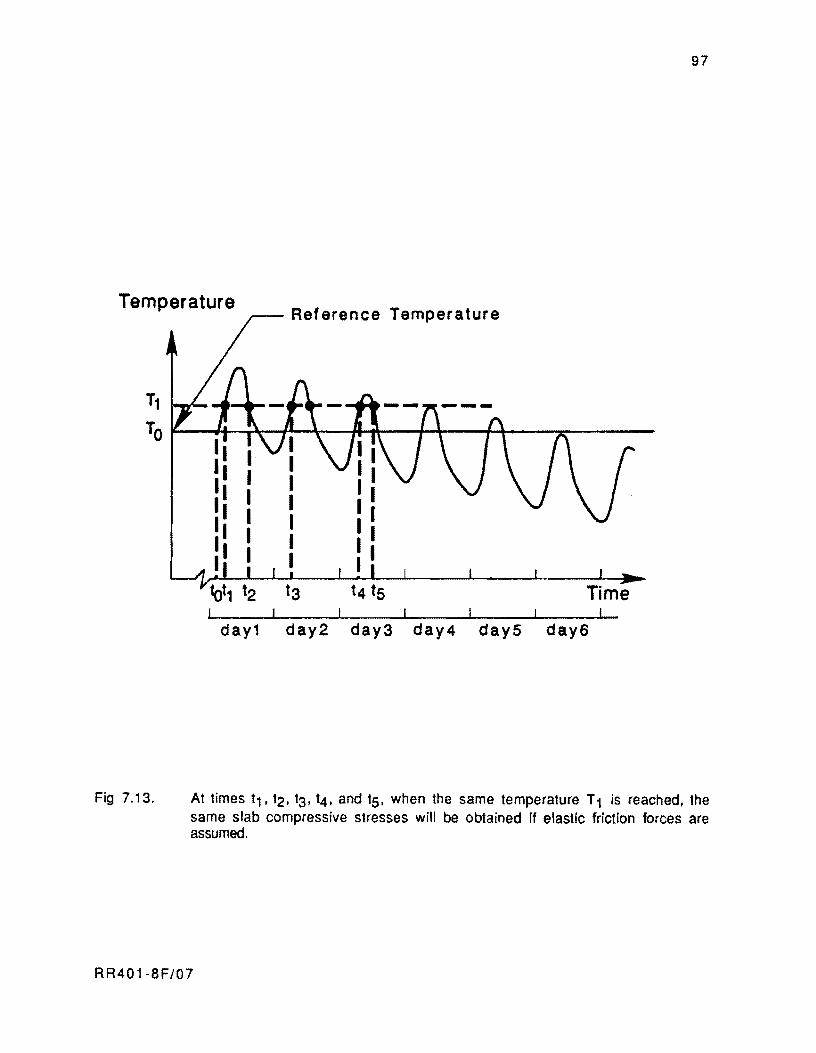
97
Temperature Reference Temperature
Fig 7.13.
tot1 I I I
day1 day2 day3 day4 day5 day6
At times t1, t2, t3. t4, and tS. when the same temperature T 1 is reached, the same slab compressive stresses will be obtained if elastic friction forces are assumed.
RR401-8F/07

98
Maximum Force
Beneath Point A
1" Point A <t.
Maximum Force Fk - - - - - - - - .... "...:-:::;. .... ~--~ ..... I I I I I I I
ZAN-1 Movement of Point
Fig 7.14. Eventual build-up of maximum friction forces under assumption of elastic system of friction forces.
RR401 8F/07
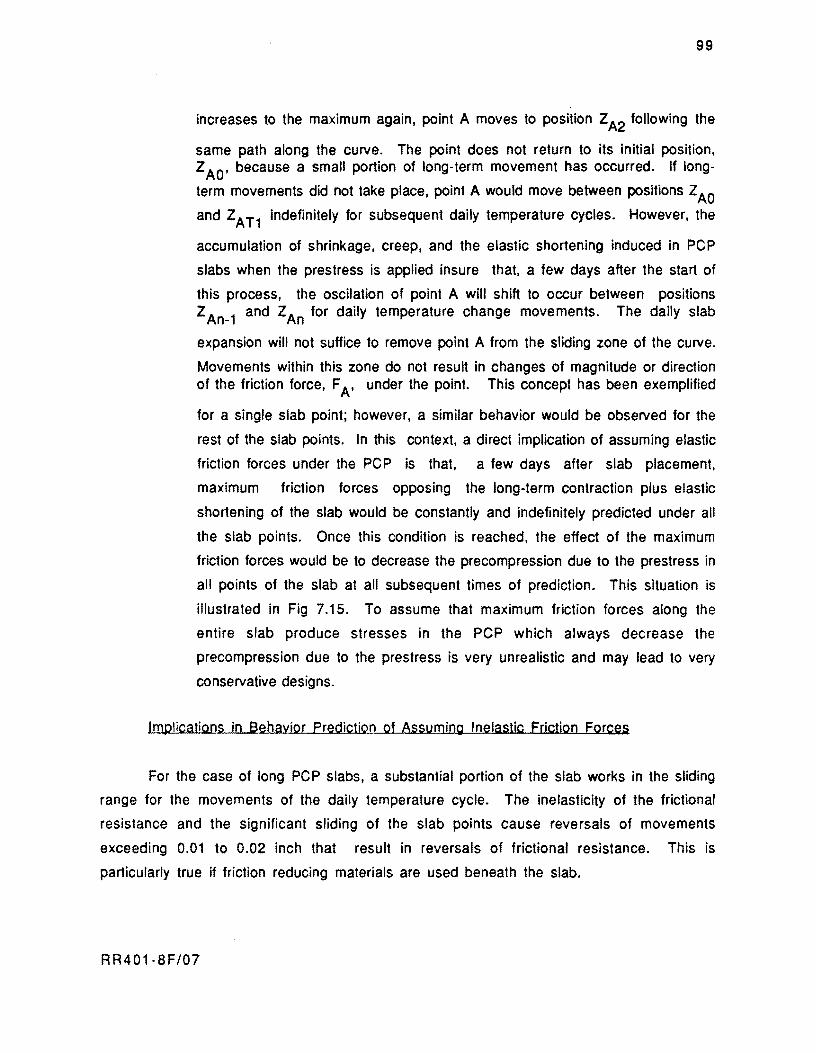
99
increases to the maximum again, point A moves to position ZA2 following the
same path along the curve. The point does not return to its initial position, Z AO' because a small portion of long-term movement has occurred. If long-
term movements did not take place, point A would move between positions ZAO
and ZAT1 indefinitely for subsequent daily temperature cycles. However, the
accumulation of shrinkage, creep, and the elastic shortening induced in PCP
slabs when the prestress is applied insure that, a few days after the start of
this process, the oscilation of point A will shift to occur between positions ZAn-1 and ZAn for daily temperature change movements. The daily slab
expansion will not suffice to remove point A from the sliding zone of the curve.
Movements within this zone do not result in changes of magnitude or direction of the friction force, FA' under the point. This concept has been exemplified
for a single slab point; however, a similar behavior would be observed for the
rest of the slab points. In this context, a direct implication of assuming elastic
friction forces under the PCP is that, a few days after slab placement,
maximum friction forces opposing the long-term contraction plus elastic
shortening of the slab would be constantly and indefinitely predicted under all
the slab points. Once this condition is reached, the effect of the maximum
friction forces would be to decrease the precompression due to the prestress in
all points of the slab at all subsequent times of prediction. This situation is
illustrated in Fig 7.15. To assume that maximum friction forces along the
entire slab produce stresses in the PCP which always decrease the
precompression due to the prestress is very unrealistic and may lead to very
conservative designs.
Implications in Behavior Prediction of Assuming Inelastic Friction Forces
For the case of long PCP slabs, a substantial portion of the slab works in the sliding
range for the movements of the daily temperature cycle. The inelasticity of the frictional
resistance and the significant sliding of the slab points cause reversals of movements
exceeding 0.01 to 0.02 inch that result in reversals of frictional resistance. This is
particularly true if friction reducing materials are used beneath the slab.
RR401-8F/07
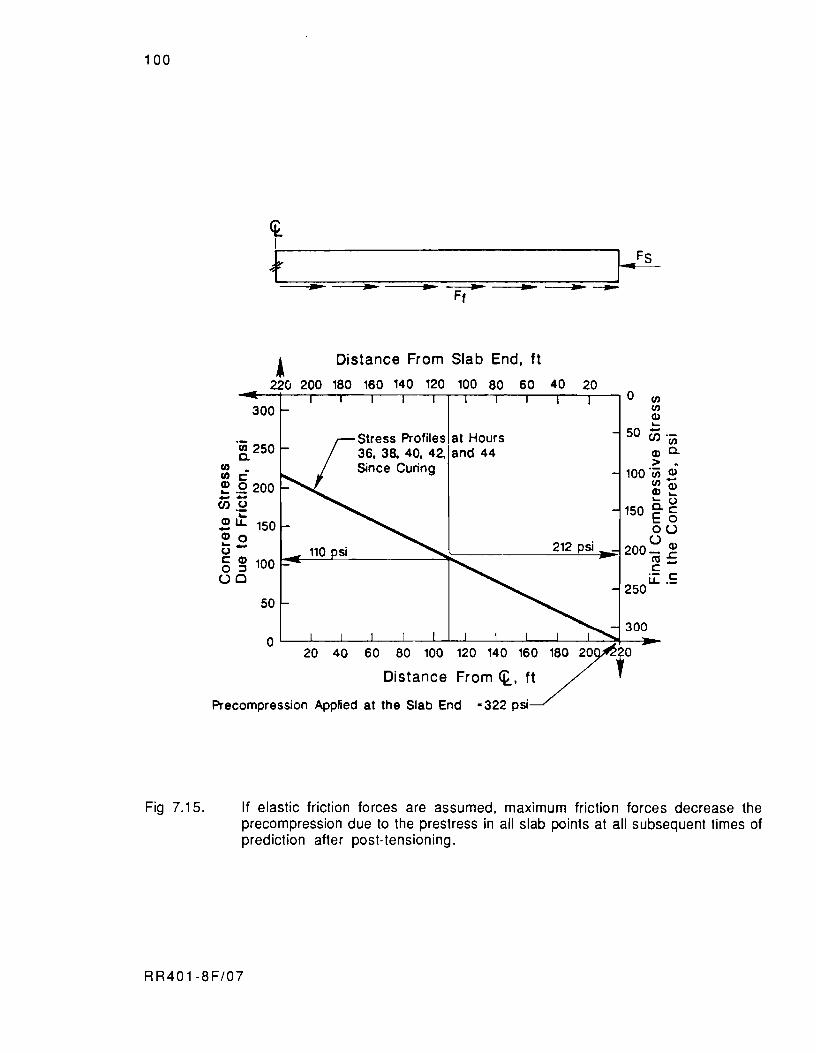
100
Fig 7.15.
Cf. I
• Distance From Slab End, ft
220 200 180 160 140 120 100 80 60 40
300
20 II) II) Q) ....
Stress Profiles at Hours 50 en .-·iii 250 36, 38, 40, 42, and 44 Q) ~ ~ > -
en Since Curing 100·- Q) en c.- II) _
~ .S! 200 ~ ~ -- .... u (/) .~ 150 @" § ~~1~ OU Q)o UQ) Q- ,.~~~ ________ ~~~ __________ 2_1_2~P_~_·~~_i200- ~ c. Q) 100.... ~ -o ~ .- c. UO u..._
250 50
300 o ~~--~--~--~~~~--~--~--~~~~--~
20 40 60 80 100 120 140 16~ 180 r20 Distance From <k. 'y •
Precompression Applied at the Slab End ~322 psi
If elastic friction forces are assumed, maximum friction forces decrease the precompression due to the prestress in all slab points at all subsequent times of prediction after post-tensioning.
RR401-8F/07
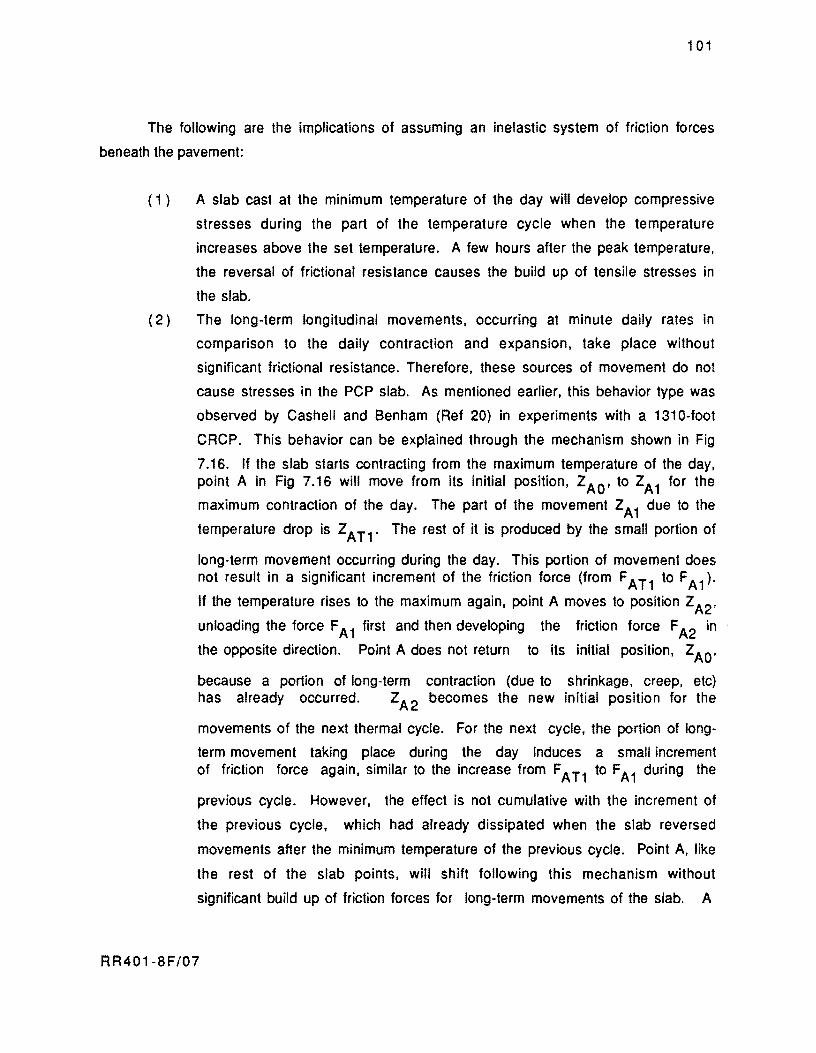
101
The following are the implications of assuming an inelastic system of friction forces
beneath the pavement:
( 1 ) A slab cast at the minimum temperature of the day will develop compressive
stresses during the part of the temperature cycle when the temperature
increases above the set temperature. A few hours after the peak temperature,
the reversal of frictional resistance causes the build up of tensile stresses in
the slab.
( 2 ) The long-term longitudinal movements, occurring at minute daily rates in
comparison to the daily contraction and expansion, take place without
significant frictional resistance. Therefore. these sources of movement do not
cause stresses in the PCP slab. As mentioned earlier, this behavior type was
observed by Cashell and Benham (Ref 20) in experiments with a 1310-foot
CRCP. This behavior can be explained through the mechanism shown in Fig
7.16. If the slab starts contracting from the maximum temperature of the day, point A in Fig 7.16 will move from its initial position, Z A 0' to Z A 1 for the
maximum contraction of the day. The part of the movement ZA1 due to the
temperature drop is ZAT1' The rest of it is produced by the small portion of
long-term movement occurring during the day. This portion of movement does not result in a significant increment of the friction force (from F AT1 to FA 1)'
If the temperature rises to the maximum again, point A moves to position ZA2'
unloading the force FA 1 first and then developing the friction force F A2 in
the opposite direction. Point A does not return to its initial position, ZAO'
because a portion of long-term contraction (due to shrinkage, creep, etc) has already occurred. ZA2 becomes the new initial position for the
movements of the next thermal cycle. For the next cycle, the portion of long
term movement taking place during the day induces a small increment of friction force again, similar to the increase from F AT1 to FA 1 during the
previous cycle. However, the effect is not cumulative with the increment of
the previous cycle, which had already dissipated when the slab reversed
movements after the minimum temperature of the previous cycle. Point A, like
the rest of the slab points, will shift following this mechanism without
significant build up of friction forces for long-term movements of the slab. A
RR401-8F/07
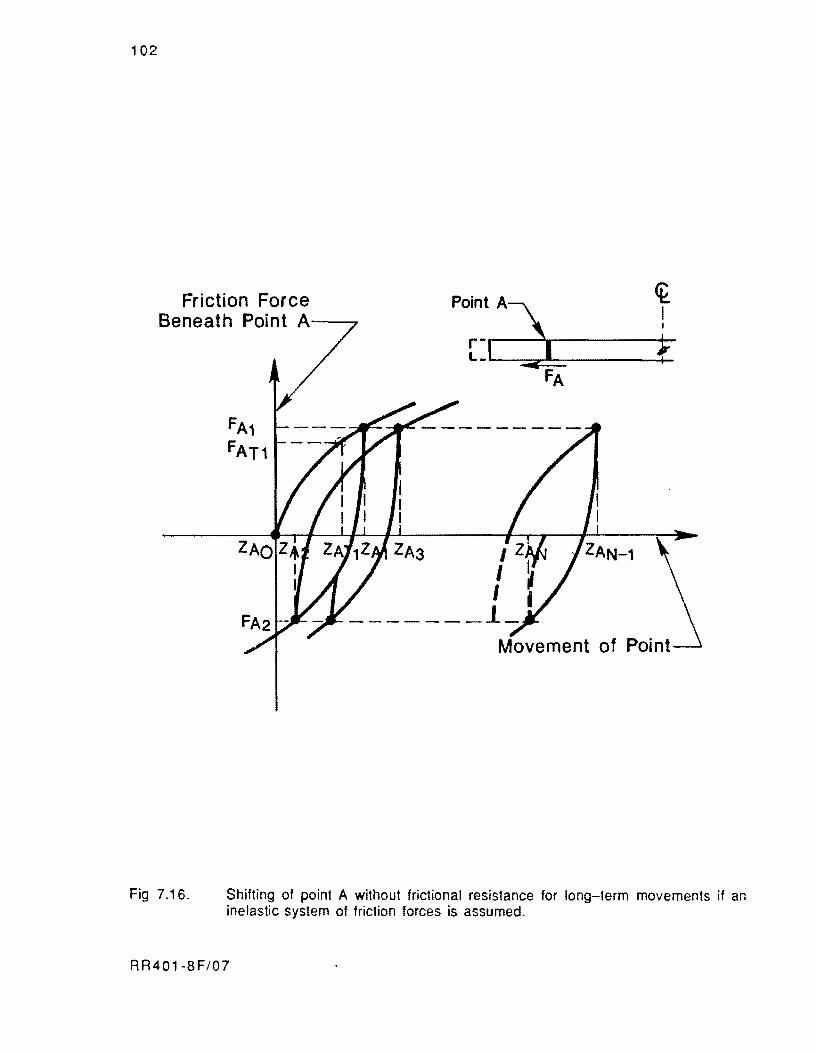
102
Friction Force Beneath Point A--
Cf. I I
Fig 7.16. Shifting of point A without frictional resistance for long-term movements if an inelastic system of friction forces is assumed.
RR401-8F/07
103
direct implication of assuming inelastic friction forces is, then, that the
magnitude of the friction forces depends almost exclusively on the magnitude of
the daily temperature change. Likewise, the direction of friction forces and
related concrete stresses depends on the nature of the temperature change. The
stresses generated by the friction decrease the precompression due to the
prestress if the slab contracts when the temperature drops. Vice versa, the
friction forces increase the precompression due to the prestress if the slab
expands with the temperature increments of the daily thermal cycle. This
situation is iIIu strated in Fig 7.17.
RR401-8F/07
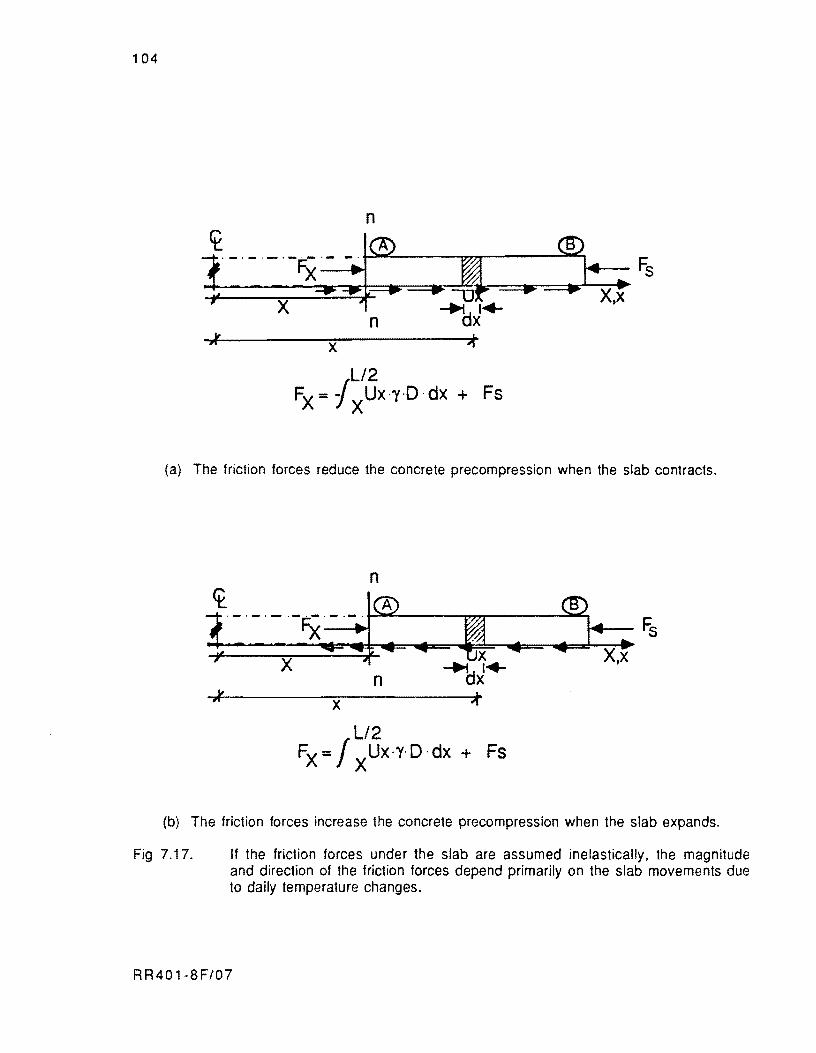
104
x L/2
FX= f xUX-y.O-dx + Fs
(a) The friction forces reduce the concrete precompression when the slab contracts.
n L
" x ., L/2
FX:: I XUx·Y-O·dx + Fs
(b) The friction forces increase the concrete precompression when the slab expands.
Fig 7.17. If the friction forces under the slab are assumed inelastically, the magnitude and direction of the friction forces depend primarily on the slab movements due to daily temperature changes.
RR401·8F/07
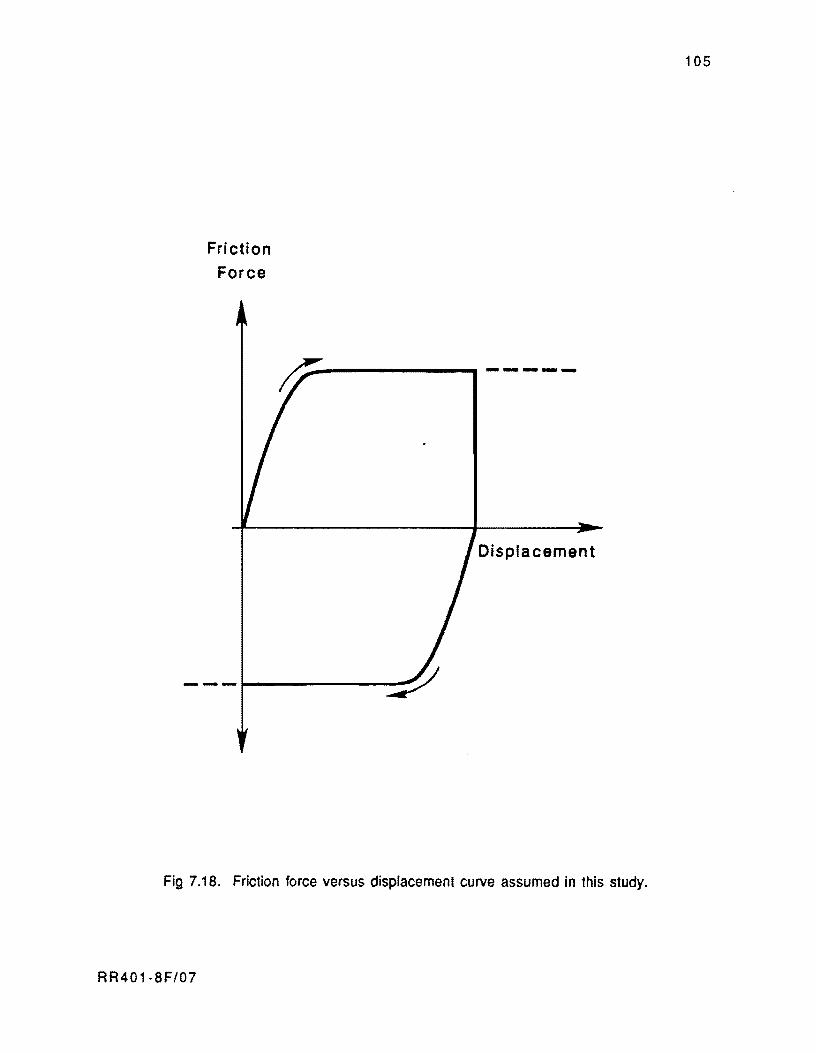
Friction Force
-------...... -----
Displacement
- - -1---------
Fig 7.18. Friction force versus displacement curve assumed in this study.
RR401·8F/07
105

!!!!!!!!!!!!!!!!!!!"#$%!&'()!*)&+',)%!'-!$-.)-.$/-'++0!1+'-2!&'()!$-!.#)!/*$($-'+3!
44!5"6!7$1*'*0!8$($.$9'.$/-!")':!
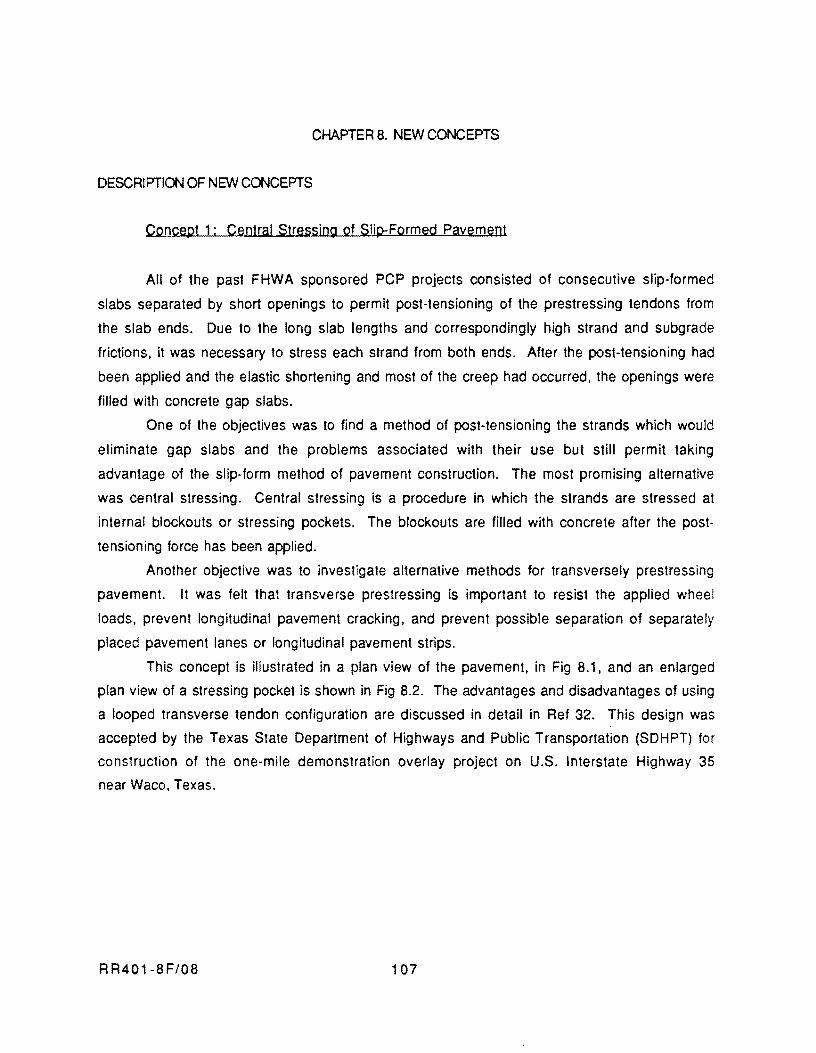
CHAPTER 8. NEW CONCEPTS
DESCRIPTION OF NEW CONCEPTS
Concept 1: Central Stressing of Snp-Formed Pavement
All of the past FHWA sponsored PCP projects consisted of consecutive slip-formed
slabs separated by short openings to permit post-tensioning of the prestressing tendons from
the slab ends. Due to the long slab lengths and correspondingly high strand and subgrade
frictions, it was necessary to stress each strand from both ends. After the post-tensioning had
been applied and the elastic shortening and most of the creep had occurred, the openings were
filled with concrete gap slabs.
One of the objectives was to find a method of post-tensioning the strands which would
eliminate gap slabs and the problems associated with their use but still permit taking
advantage of the slip-form method of pavement construction. The most promising alternative
was central stressing. Central stressing is a procedure in which the strands are stressed at
internal blockouts or stressing pockets. The blockouts are filled with concrete after the post
tensioning force has been applied.
Another objective was to investigate alternative methods for transversely prestressing
pavement. It was felt that transverse prestressing is important to resist the applied wheel
loads, prevent longitudinal pavement cracking, and prevent possible separation of separately
placed pavement lanes or longitudinal pavement strips.
This concept is illustrated in a plan view of the pavement, in Fig 8.1, and an enlarged
plan view of a stressing pocket is shown in Fig 8.2. The advantages and disadvantages of using
a looped transverse tendon configuration are discussed in detail in Ref 32. This design was
accepted by the Texas State Department of Highways and Public Transportation (SDHPT) for
construction of the one-mile demonstration overlay project on U.S. Interstate Highway 35
near Waco, Texas.
RR401-8F/08 107
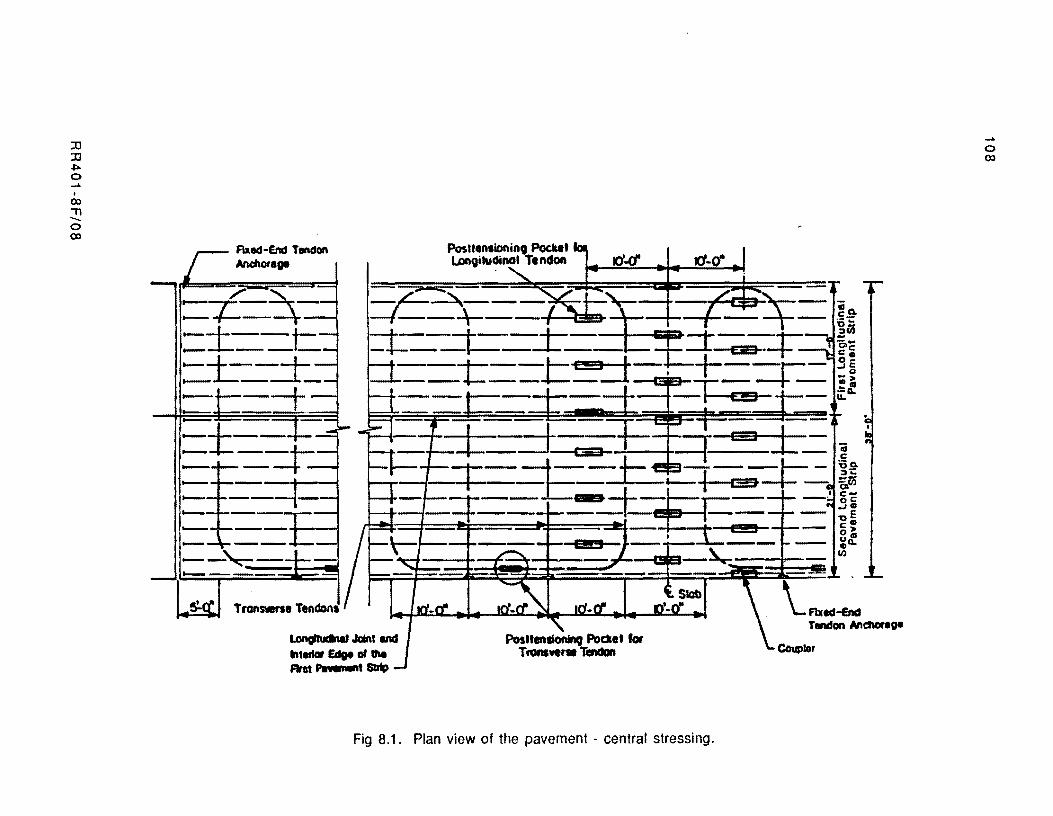
::JJ ::JJ ~ o .-. , Q)
" ....... o Q)
~,
flied-end Tlftdon Andlora.,. rJ.(f r:I-ct
=t=~~--At:~=+:~-+- lift. -- -- n - -.:-'0;
=1--=--=t--..=-±--= ::t--:a .. +-- ~~ -::-t=-t:=-'=l-, +=. I -= i~ -==.t=:-+--t==t-=r cw-+-- :.:.
~fbtd~ Tendon AndKnO.
~JalnIIt1d Ihlertar Edge of the RGt~_
Coupler
Fig 8.1. Plan view of the pavement - central stressing.
.-.. o Q)
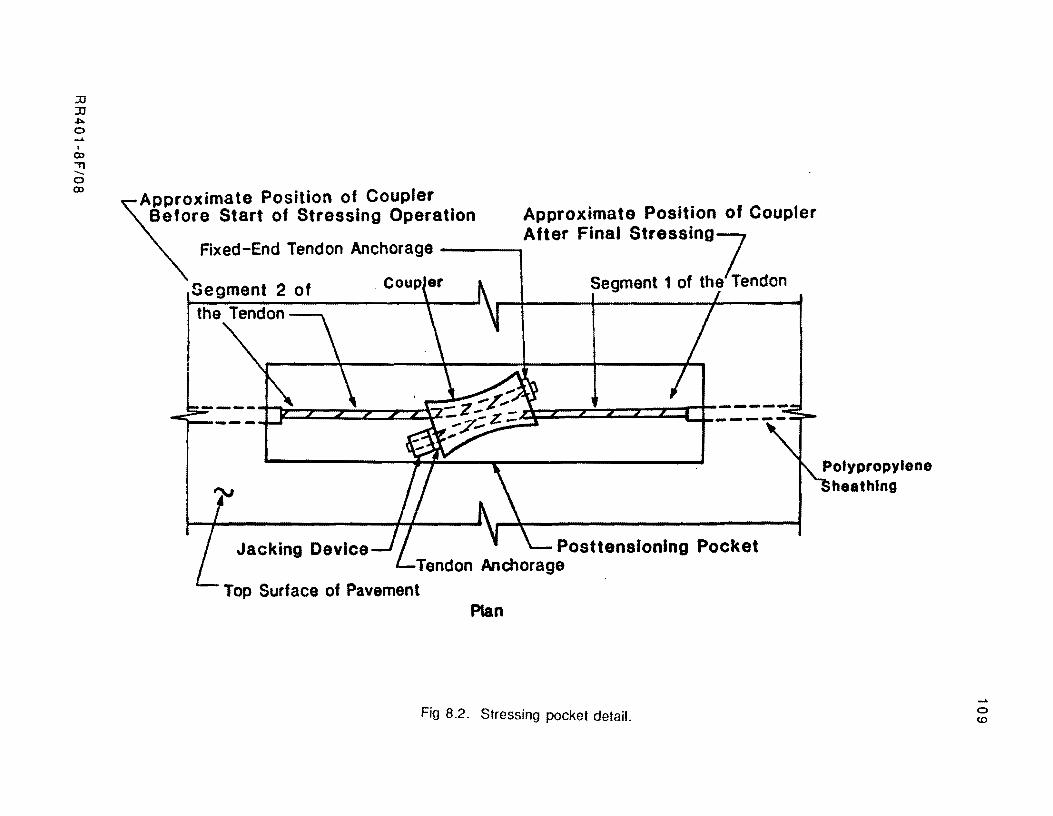
:D :D .". o ..... . (X)
'"l1 -o (X)
~APproXimate Position of Coupler Before Start of Stressing Operation Approximate Position of Coupler
After Final StresSing, Fixed-End Tendon Anchorage ~ .1..._
Segment 2 of . Couple, tt t Segment 1 of the Tendon
the Tendon
Jacking Device -1 I .. "- Posttenslonlng Pocket Tendon Anchorage
Top Surface of Pavement Plan
Fig 8.2. Stressing pocket detail.
Polypropylene heathlng
..... o <D
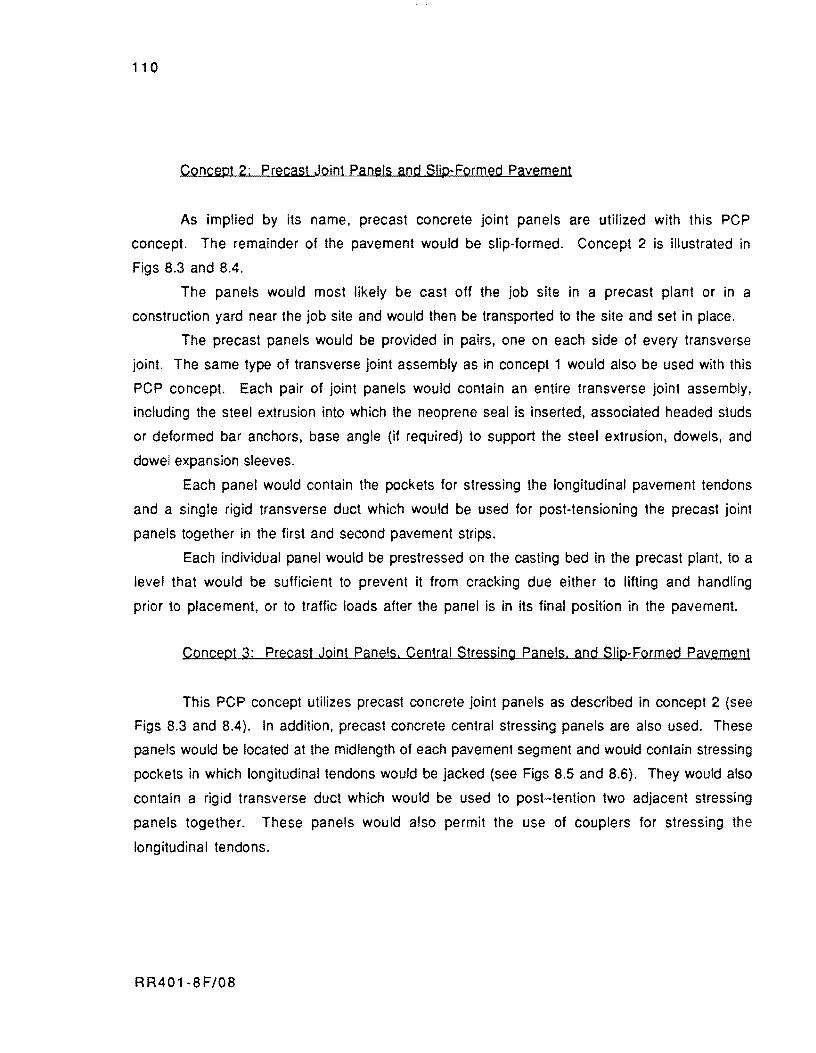
110
Concept 2: Precast Joint Panels and Slip-Formed Pavement
As implied by its name, precast concrete joint panels are utilized with this PCP
concept. The remainder of the pavement would be slip-formed. Concept 2 is illustrated in
Figs 8.3 and 8.4.
The panels would most likely be cast off the job site in a precast plant or in a
construction yard near the job site and would then be transported to the site and set in place.
The precast panels would be provided in pairs, one on each side of every transverse
joint. The same type of transverse joint assembly as in concept 1 would also be used with this
PCP concept. Each pair of joint panels would contain an entire transverse joint assembly,
including the steel extrusion into which the neoprene seal is inserted, associated headed studs
or deformed bar anchors. base angle (if required) to support the steel extrusion, dowels, and
dowel expansion sleeves.
Each panel would contain the pockets for stressing the longitudinal pavement tendons
and a single rigid transverse duct which would be used for post-tensioning the precast joint
panels together in the first and second pavement strips.
Each individual panel would be prestressed on the casting bed in the precast plant, to a
level that would be sufficient to prevent it from cracking due either to lifting and handling
prior to placement, or to traffic loads after the panel is in its final position in the pavement.
Concept 3: Precast Joint Panels. Central Stressing Panels. and Slip-Formed Pavement
This PCP concept utilizes precast concrete joint panels as described in concept 2 (see
Figs 8.3 and 8.4). In addition, precast concrete central stressing panels are also used. These
panels would be located at the mid length of each pavement segment and would contain stressing
pockets in which longitudinal tendons would be jacked (see Figs 8.5 and 8.6). They would also
contain a rigid transverse duct which would be used to post-tention two adjacent stressing
panels together. These panels would also permit the use of couplers for stressing the
longitudinal tendons.
RR401-8F/08
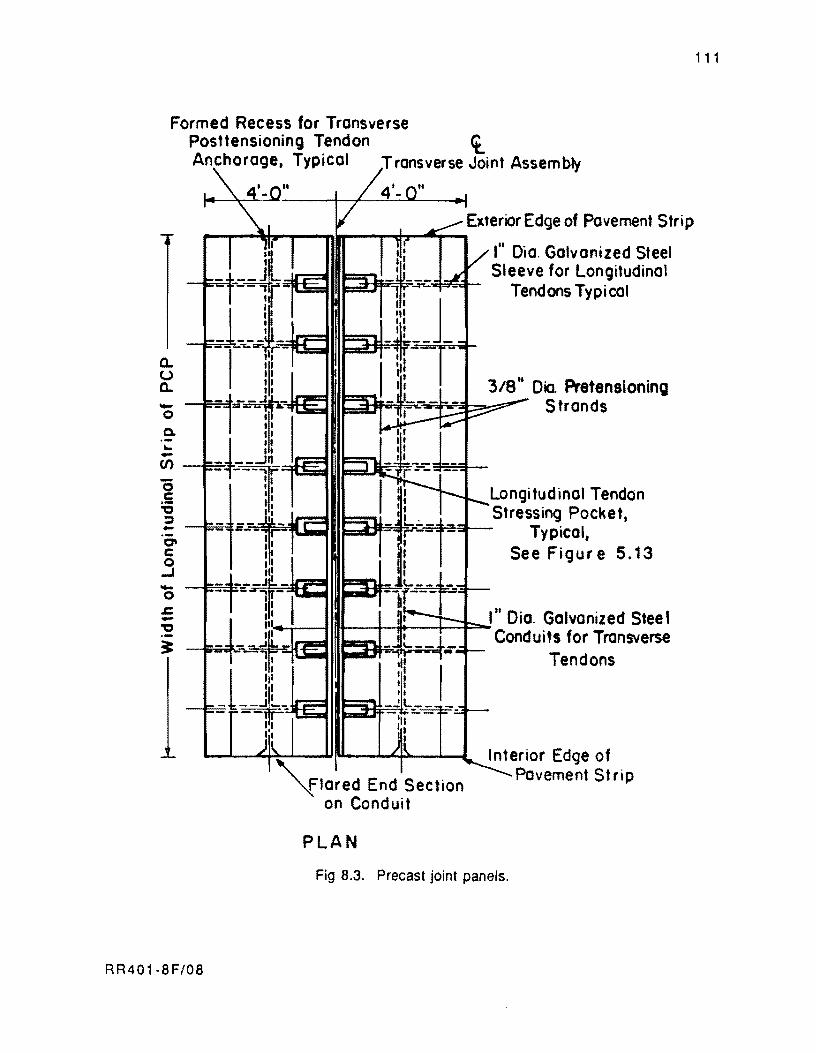
ct Formed Recess for Transverse
Posttensioning Tendon Anchorage. Typical Transverse Joint Assembly
a. u a. -0 Q. ... -(f)
'0 .5 "0 ::» -C'I c 0 ...J -0 .c -"0
~
RR401·BF/OB
ExteriOr Edge of Pavement Strip ~~~~~--nM--~~~-r-,
--
--
~Jared End Section on Conduit
PLAN
I" Dia. Galvanized Steel Sleeve for Longitudinal
Tendons Typical
3/8 II Die. Pretensionino Strands
Longitudinal Tendon Stressing Pocket,
Typical, See Figur e 5.13
I It Dia. Galvanized Stee I Conduits for Transverse
Tendons
Interior Edge of Pavement Strip
Fig B.3. Precast joint panels.
111
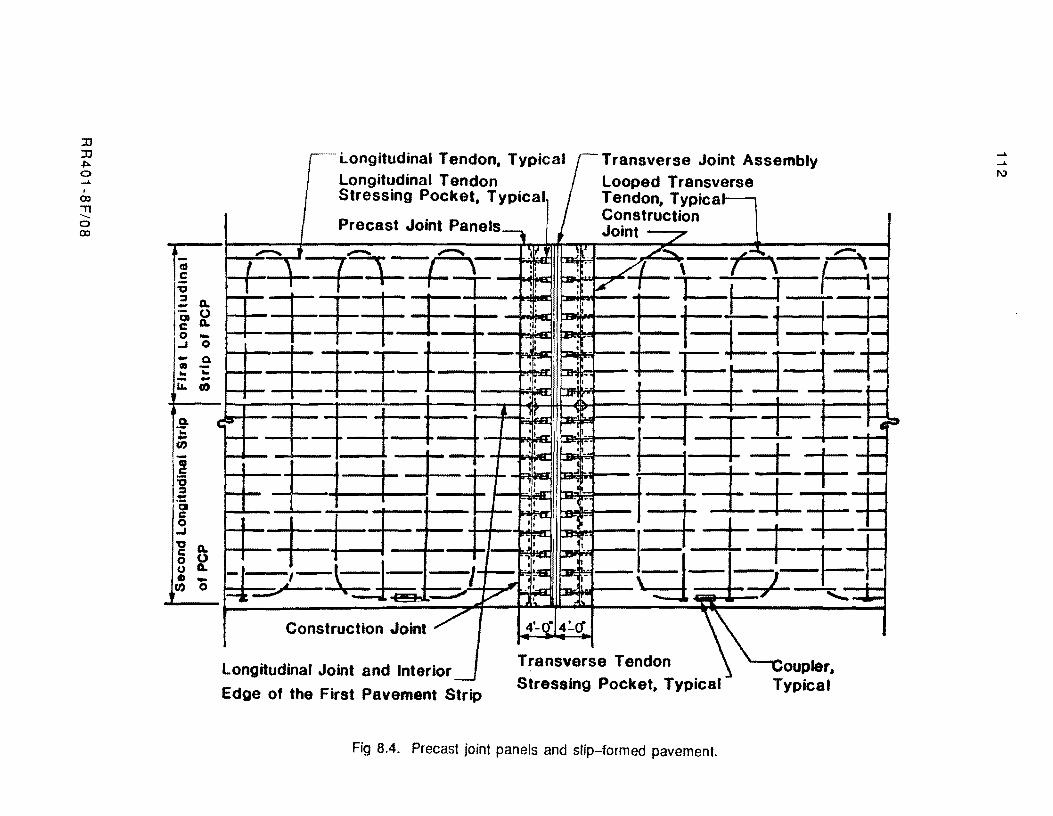
::D ::D ~ a ..... , IX)
"T1 ..... a IX)
-x: (It c -"CJ :J a. - ~ Q C 0 -.... 0 - Q. lID .. .. -I.&. en
,-Longitudinal Tendon. Typical Transverse Joint Assembly Longitudinal Tendon Looped Transverse Stressing Pocket. Typical Tendon, Typical--,
. Construction Precast JOint Panels Joint
~ ~~-t~,-(- . ---,- :r .. EE~-=f~~-t :: tt:~-£-i=-a ~:~.. +--
Q. c;-- - ""If""'" --I- _ , "] ~.,., { -t~- f - 1"-~
: ~c--±" _.- :;-:~ !=L ± -r-I ~ I ':~.. i=± I I -r- .
o +=1 -,- f'" - I .... '.!-11 .. .- - _ _ g ~ -' -, 1-::- Ir-~~'Jra ~~-\-=-l-l -r I i • - F-f I -' I'~ ....... - _I ~ '-.....&.-01 ,0 0 ~ _______.." V ~~~,. 'T'1Ii _
! Construction Joint /' !'-C[ 4~Cf \\
Transverse Tendon \ oupler. Longitudinal Joint and Interior --.J Stressing Pocket, Typical Typical Edge of the First Pavement Strip
Fig 8.4. Precast joint panels and slip-formed pavement.
.....
..... IIJ
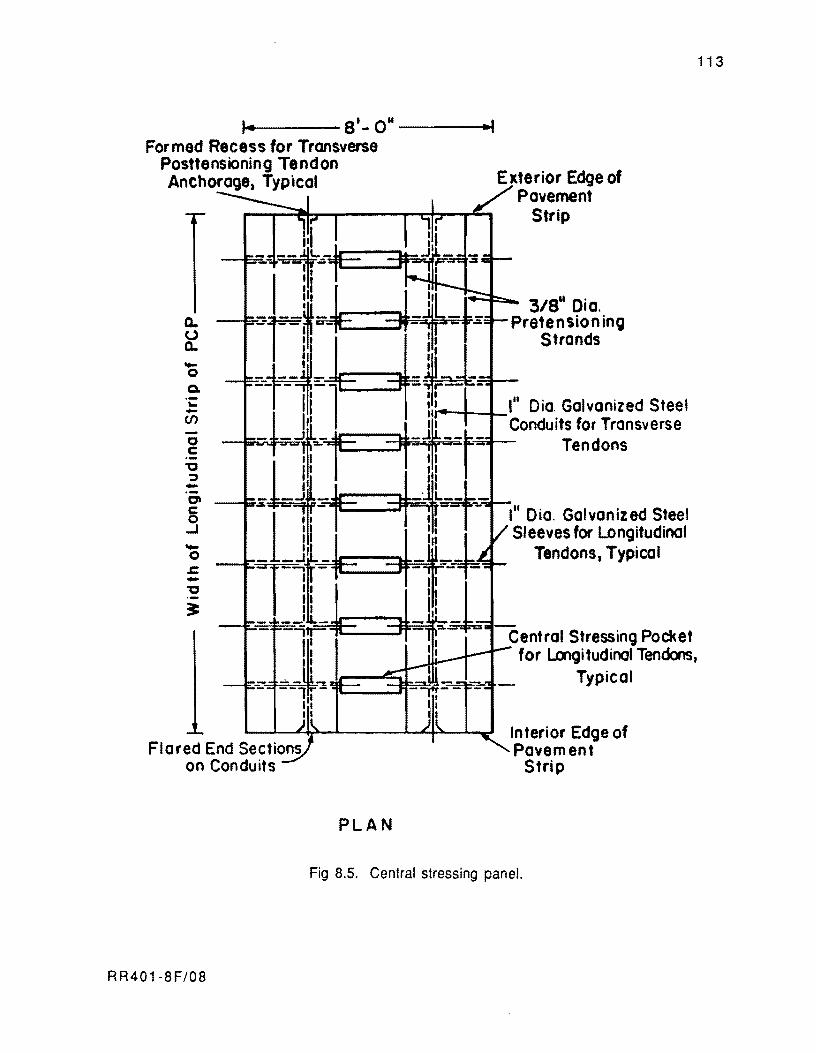
,.. 8' - 0" ----~., Formed Recess for Transverse
Posttensioning Tendon Anchorage. Typical
a.. (J a. -0 Q. 'i: -en 0 c .--0 ::J -0 c 0 II ..J II -0 r. T---0 .. ~
.. II
- --' -- -4r I. " I
Flared End Sections on Conduits
PLAN
Exterior Edge of Pavement
Strip
3/8" Oia. Pretensioning
Strands
........ -I---L_ltt Dia. Galvanized Steel Conduits for Transverse
Tendons
I" Dia. Galvanized Steel Sleeves for Longitudinal
Tendons, Typical
Central Stressing Pocket for Loogitudinol Tendons,
Typical
In terior Edge of Pavement
Strip
Fig B.S. Central stressing panel.
RR401-BF/OB
113
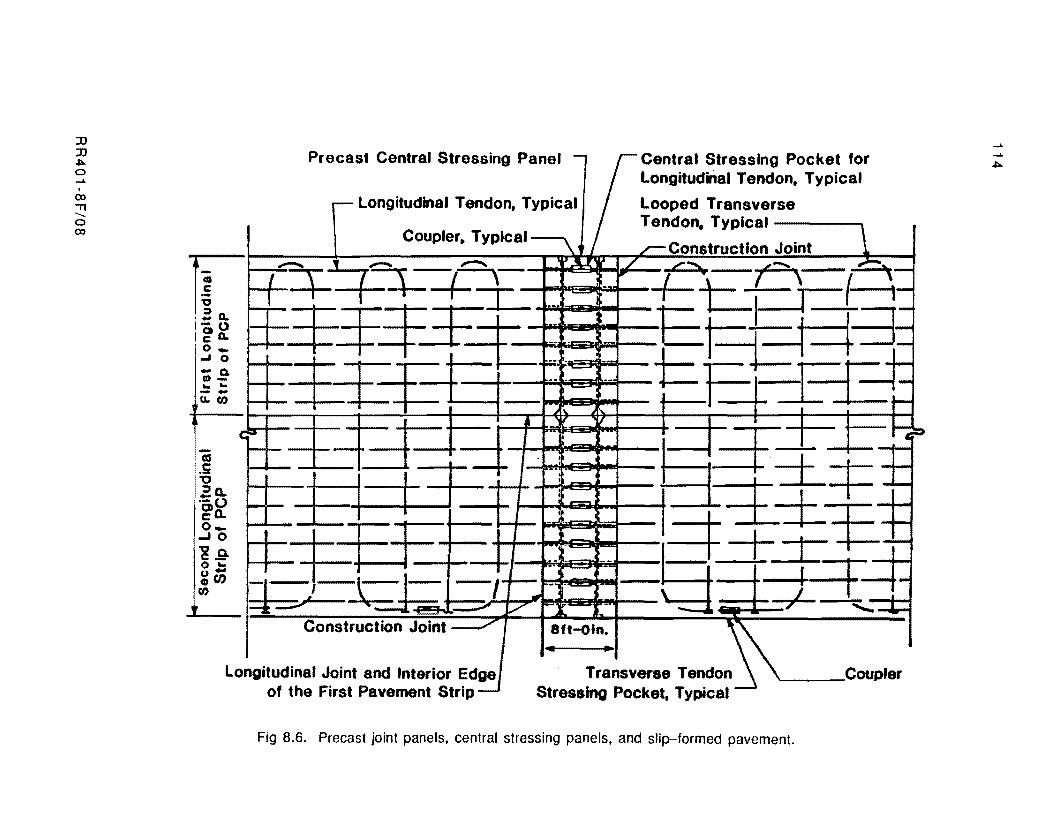
JJ JJ ~ o ..... , CD -n ...... o CD
-co c -v =a. -0
I ~ a. '0 _
.... 0
-a. 11)-... ... - -1.L.C1)
Iii C
Uii
I~Q. 1'-0 g'Q. 0_ -JO '00. c_ o ... u-oCt)
C1)
!
p c IS P anel - (;enlral S Pocket f longitud
~ LUIIW"UUUIGI I UIIUUII •• "ypical looped
Coupler. Typical ~ Tendon. I ypIC81
\ ~ Construction Joint
I~' '-, +~-..lI...t / c..... -F\ ~ ... ~-+-t, I f ~,: -
~=~~-=f~-t -
E8=1 1=:1= --~~~-£T:- - i=E~-E~
• - . -+3: .. ~ ~ -± I--r.-- -I-
B±+:~ ~~ ! I ! I-~ , , . ±± -~ ,
..-:"l
~ . I I ~
~-CJ;:-=r . -- f 1·_·-~
till ~ ,~ V Construction Joint
811-oln. ,~ • Tr:nsverse Tendon Coupler
J of the First Pavement Strip Stressing Pocket. Typical
Fig 8.6. Precast joint panels, central stressing panels, and slip-formed pavement.
.....
..... ~
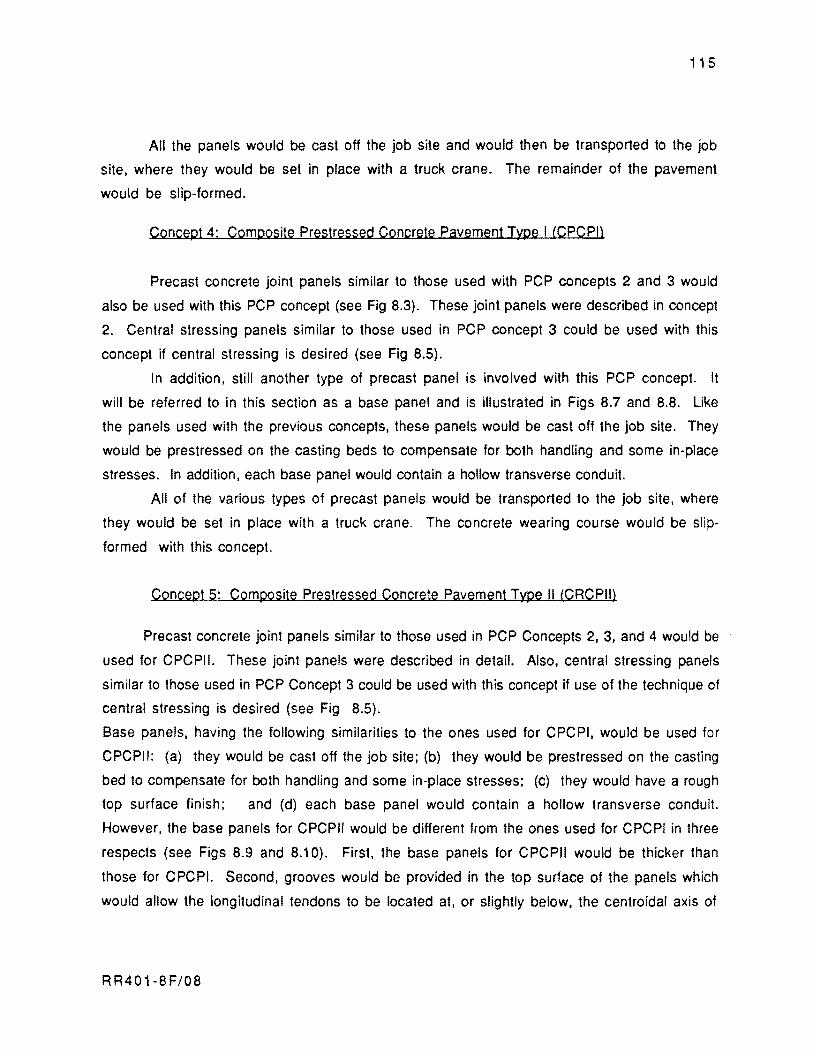
115
All the panels would be cast off the job site and would then be transported to the job
site, where they would be set in place with a truck crane. The remainder of the pavement
would be slip-formed.
Concept 4: Composite Prestressed Concrete Pavement Type I (CPCPI)
Precast concrete joint panels similar to those used with PCP concepts 2 and 3 would
also be used with this PCP concept (see Fig 8.3). These joint panels were described in concept
2. Central stressing panels similar to those used in PCP concept 3 could be used with this
concept if central stressing is desired (see Fig 8.5).
In addition, still another type of precast panel is involved with this PCP concept. It
will be referred to in this section as a base panel and is illustrated in Figs 8.7 and 8.8. Like
the panels used with the previous concepts, these panels would be cast off the job site. They
would be prestressed on the casting beds to compensate for both handling and some in-place
stresses. In addition, each base panel would contain a hollow transverse conduit.
All of the various types of precast panels would be transported to the job site, where
they would be set in place with a truck crane. The concrete wearing course would be slip
formed with this concept.
Concept 5: Composite Prestressed Concrete Pavement Type II (CRCPII)
Precast concrete joint panels similar to those used in PCP Concepts 2, 3, and 4 would be
used for CPCPII. These joint panels were described in detail. Also, central stressing panels
similar to those used in PCP Concept 3 could be used with this concept if use of the technique of
central stressing is desired (see Fig 8.5).
Base panels. having the following similarities to the ones used for CPCPI, would be used for
CPCPII: (a) they would be cast off the job site; (b) they would be prestressed on the casting
bed to compensate for both handling and some in-place stresses; (c) they would have a rough
top surface finish; and (d) each base panel would contain a hollow transverse conduit.
However, the base panels for CPCPII would be different from the ones used for CPCPI in three
respects (see Figs 8.9 and 8.10). First. the base panels for CPCPII would be thicker than
those for CPCPI. Second. grooves would be provided in the top surface of the panels which
would allow the longitudinal tendons to be located at. or slightly below, the centroidal axis of
RR401-8F/08
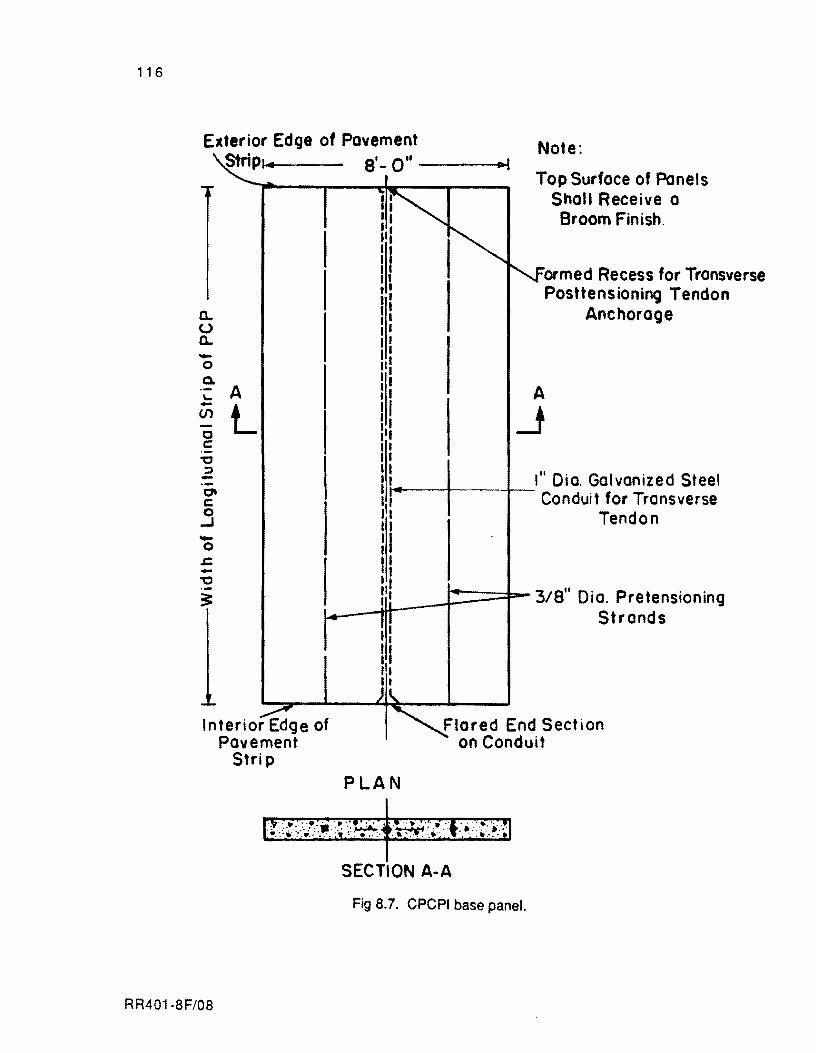
116
Exterior Edge of Pavement Note: Strip, ..
a.. U a.. -0 Q.
to.. A - L en 0 c -0 :l -0'11 c .3 -0 s::. -"0
3
Interior Edge of Povement
Strip
RR401-8F/08
81
- 0"
I ; II I, :
if I , , . I I • I , I I I I , I I III I I , . II II I I Iii I I .. II I I I II' II II
II t' I I JlI , I
PLAN
.. I Top Surface of Ponels
Sholl Receive 0
Broom Finish.
ormed Recess for Transverse Posttensioning Tendon
Anchoroge
A
..J I" Dio. Golvanized Steel Conduit for Transverse
Tendon
3/8" Dio. Pretensioning Strands
Flared End Section on Conduit
SECTION A-A
Fig 8.7. CPCPI base panel.
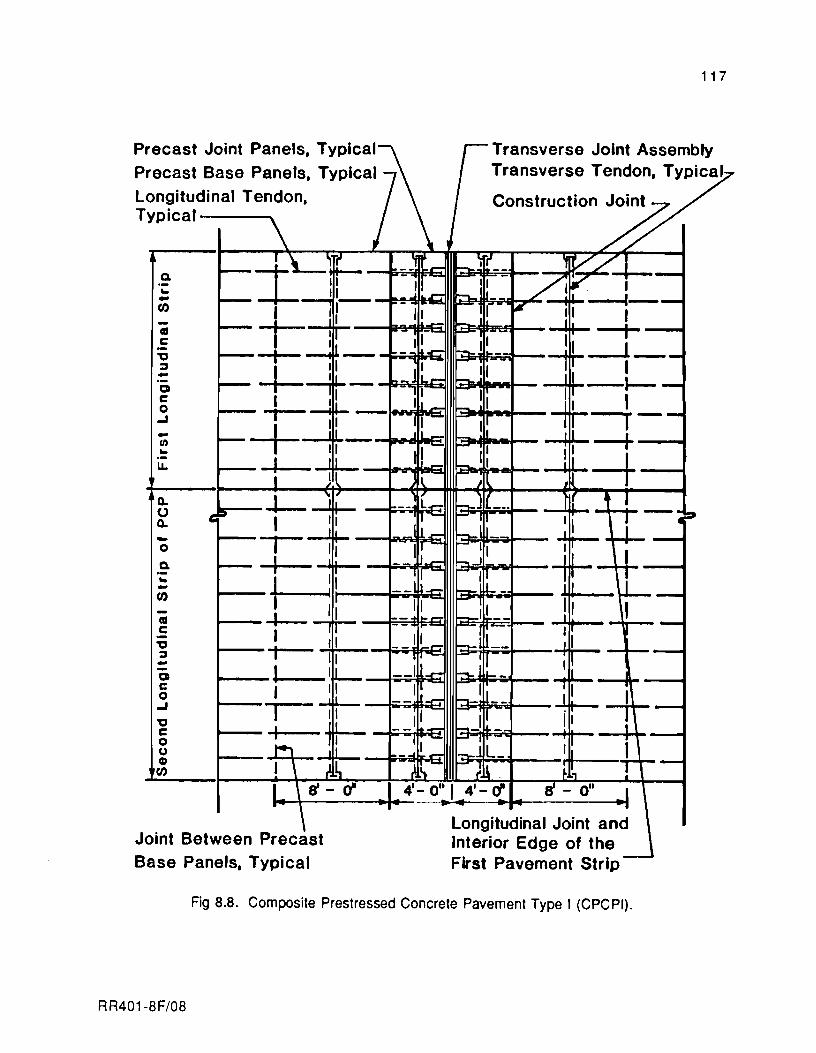
117
Precast Joint Panels, Typical Transverse Joint Assembly
Longitudinal Tendon, Construction JOin~
Precast Base Panels, TYPica'i Transverse Ten~on, Typical
Typical \ • //
Q. .. .. o III C -" ~ .. Q C o ..J .. II) .. . -
Q. () Q. -o Q. .-.. -III C -" ~ --Q C o ..J
" C o u ~ o
~ '\ ~u:- --~ .- ~ ~r(__ ~V ./ ._ --;- ~ II I ~ II :?!1'7" i
~ --l--~I:- _j ~ h.. u_ ~I&---I __ I I, II Ir 16 II I
I-- T Ilf - - ..... - -- I I I ~l 11.- ---- II~_- '-flrl )'_-~ 1- 1-
"-- I : _ _ II r-- -t- ~,""*IIE'-:ill ....... III -1---
I I I ,I 111 III I ~+' ir- .~ ~ -rr-r--~ i _ ___ ~ I[ III --+_ ....... >- I i: :: ... ~: ~L-+_---.I
I \ Ii - (j' 4' - 0'· I 4 1 - rf ri - 0"
. \ Joint Between Precast
Longitudinal Joint and Interior Edge of the ~ First Pavement Strip Base Panels, Typical
Fig 8.8. Composite Prestressed Concrete Pavement Type I (CPCPI).
RR401-8F/08
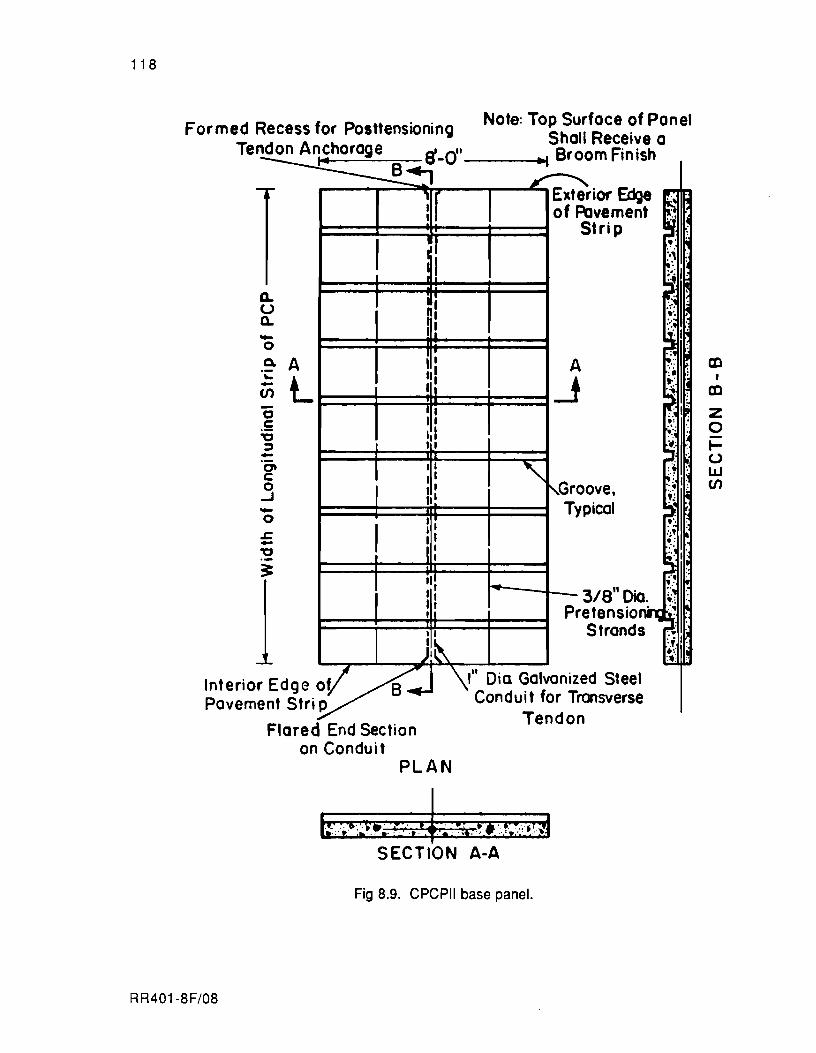
1 1 B
Formed Recess for Posttensionino Tendon Anchorage 8 II
~~ -0
0-U ~ -0 ~ ... -(/) c .s "C :::t -C' c: o ..J -o .£: -"C
~
A
L
Ilf
I 1:1
I I
I • I
d
I r I I,' d I,
I'
I 1,1 , I
i ,I
" , I
II'
, , I " I:
1'\ I
I, I, III
I j[~
Note: Top Surface of Panel
'-
~l
"
Sholl Receive a B omFinish ro
Exte rior ~e Pavement Strip
of
A
..J
Groo ve, col Typi
- -3 Pret
S
Interior E Pavemen
dge oV 8 \1" Dia Galvanized
Conduit for Tron Steel
sverse t Stri p
Flared End Section Tendon
on Conduit PLAN
b:;";;! ~;5;"".:'.i'~ ! !;::i~' 1I SECTION A-A
Fig B.9. CPCPII base panel.
RR401-BF/OB
CD I
CD
Z o tU W (/)
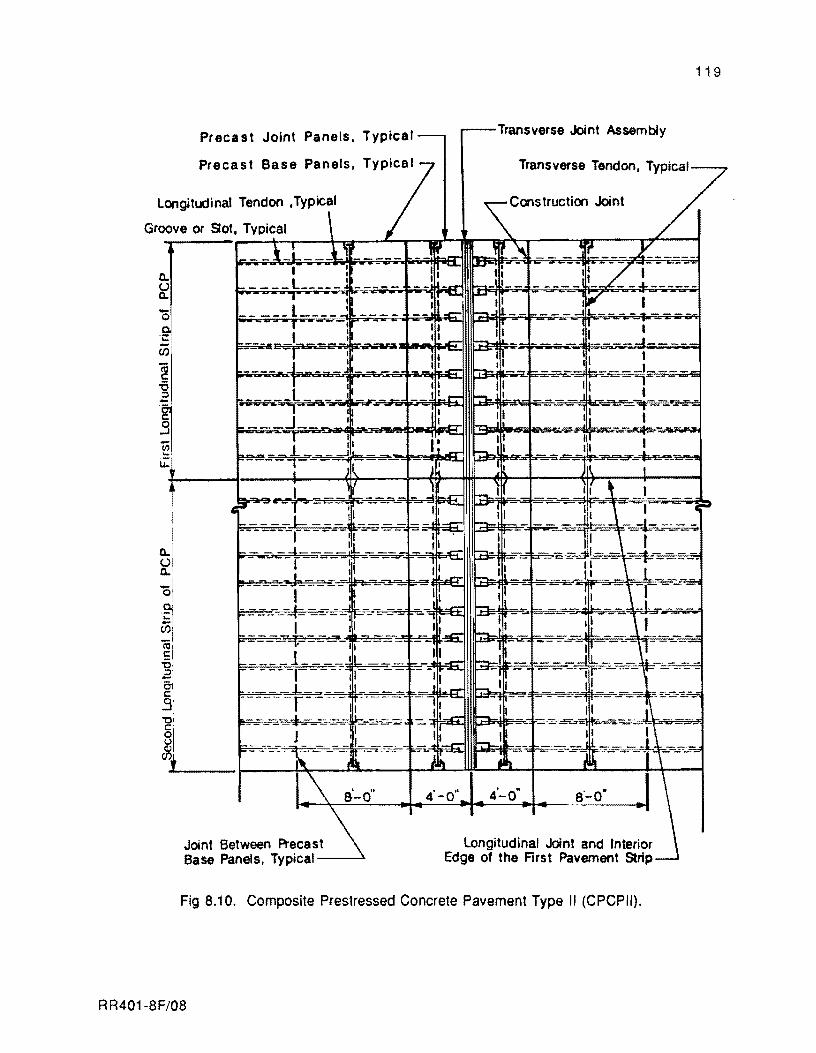
119
Precast Joint Panels. Typical- .--Transverse Joint Assembly
Precast Sase p~nelS. TYPP7'cal
Longitudinal Tendon ,TypICal
Groove or Sot, Tvpical '
Transverse Tendon, TYPiC.'7 \.Ca>struttia> Joint LI
-en
i I i
a.i ~!
!-L i Ijf _ _' ...... - I - r!-......
I I II .... _ __ L _____ I _ __ I __
-. I II _____ 1 ___ I _ _ 'il-. " I~ I _ It ____ ..... L. ___ _
r- I 11'-
=__ E--r' 1&"..... :, ~ I I ."...,.. _ II J 11'_ ...0;.;>00, I I
J. I I I I I __ II~, __ I _
_ . IT ----II
- -- .I - ~ !-,-. - ~"'=*~~~--',==""'-;;;_;:,;;;;.'-s~ T I II""" II II l'
___ -L-;a--' - ,I.r-:- ~ I _ It. ~="'i~~i!ffi',--=t-................. ,""- , I' II 11"",-
J I I. ,_ ~ ,...... - ,~--
5-0"
Joint aetween Ptec •• t \ Sase Panels. Typical---"
Longitudinal Joint and Interior Edge of the First Pavement Strip
Fig B.10. Composite Prestressed Concrete Pavement Type II (CPCPII).
RR401-BF/OB
120
the panels. Third, the edge of the panel would be formed in a manner to permit grouting of
the joints between adjacent panels after they are set in place at the job site.
All of the various types of precast panels would be transported to the job site, where
they would be set in place with a truck crane. The concrete wearing course would be
slip-formed with this concept.
Concept 6: Segmentally Precast Prestressed Concrete Pavement (SPPCP)
Precast concrete joint panels similar to those used in PCP Concepts 2 through 5 would
also be used with this concept (see Fig 8.3). In addition, central stressing panels similar to
those used in PCP Concept 3 could be used with this concept if use of the technique of central
stressing is desired (see Fig 8.5).
A panel type, referred to in this section as a "full-depth pavement panel" (for reasons
that will become obvious in the following discussion), would be used with this PCP concept.
This panel is illustrated in Figs 8.11 and 8.12. Like all the panels used with the previous
concepts, these panels would also be cast off the job site. They would be prestressed on the
casting beds to compensate for both handling and some in-place stresses. In addition, each
full-depth panel would contain hollow longitudinal conduits and a single hollow transverse
conduit.
All of the various types of precast panels would be transported to the job site, where
they would be set in place with a truck crane.
Concept 7: Continuous Composite Concrete Pavement (CCCP)
CCCP is very different from any of the concepts discussed thus far, and, in reality, is
more similar to the concept of continuously reinforced concrete pavement, as will become
apparent in the following discussion.
No joint panels would be used with CCCP because no transverse joints would be
required, except where construction joints are required when the paving operation is
interrupted or where expansion joints are required, such as at bridges. Only precast concrete
base panels (as shown in Figs 8.13 and 8.14) would be used in CCCP construction. These
panels would be cast off the job site similar to panels used in the previously discussed
concepts. They would be prestressed in both directions on the casting bed to compensate for all
handling and in-place stresses. In addition, the panels would contain grooves or slots which
RR401-8F/08
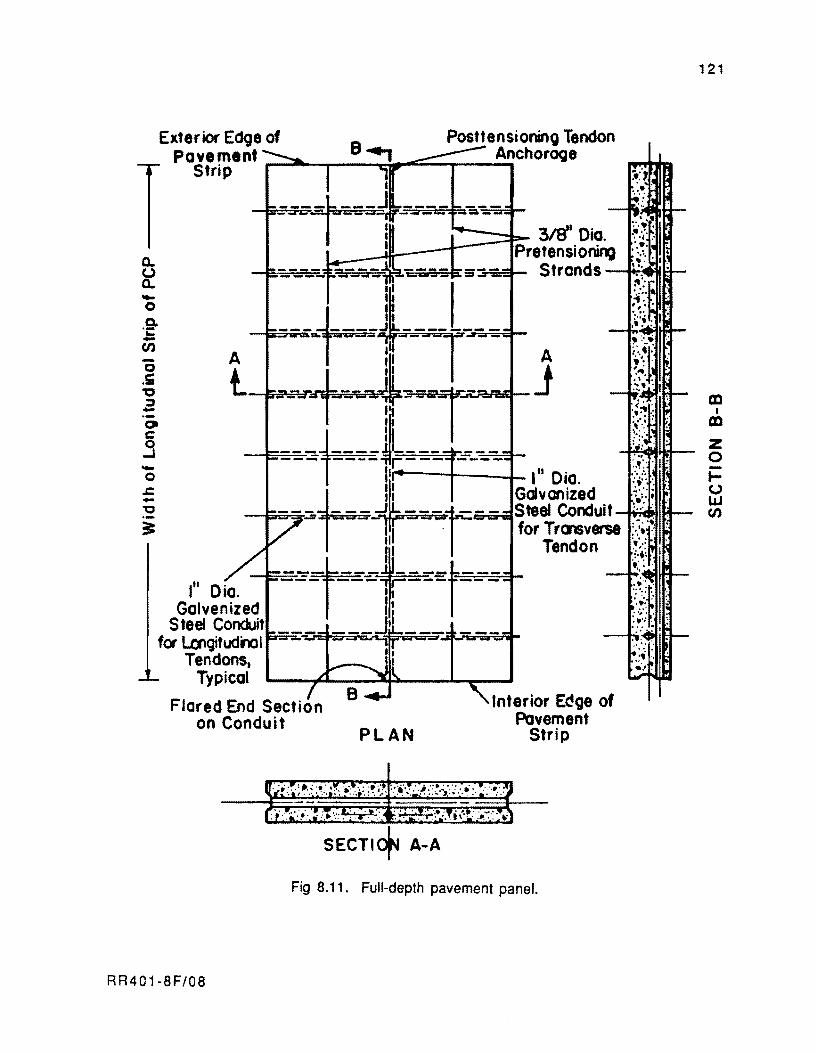
Q. 0 Q. -0 a. ·c -CI) -0
•• "0 ::::I -
Exterior Edge of Posttensionino Tendon Pave ment _..;a..--,..------" ..... ~ ___ A_ncho'OQe
Strip
A
t.
:--...L 3/g' Oia. ;~_--U~--t--lpp.retensio~
Strands
! I I --s.::;.-~--+ .. __ J I ______ _ ---. a.. _ _ _
ClIt
~=H,~--~j --E=-=-=-~+ _ iL__ =_==_~ c:
~ -0 .s:::. -"'0
3:
--- ----~r--- ---- :'.,:"1'
hili I" Dia. .;-.: ....
--~1u=-jl ---r-- ~:~an~~uit ~::.~~ I for Tr0'6verse : . .' •. :
--E:::::::-::;'!~- --.,:- - - -.l/:)!I --- - ~'.':"": . T rill t Tendon r~( . I:
--- ---- r--- --.... " ," D' la. I: ~V~; ~ Galvenized Steel Conduit
for lalgitudnol Tendons,
Typical
J11 :~.;: " J " .... t "
---- --- --- --- -oj: : .
Flared End Section on Conduit
PLAN
Interior E~oe of Pavement
Strip
Fig 8.11. Full-depth pavement panel.
:':.: : ~.:" .~. -
RR401-8F/08
121
o -I-o f.LJ
- CI)
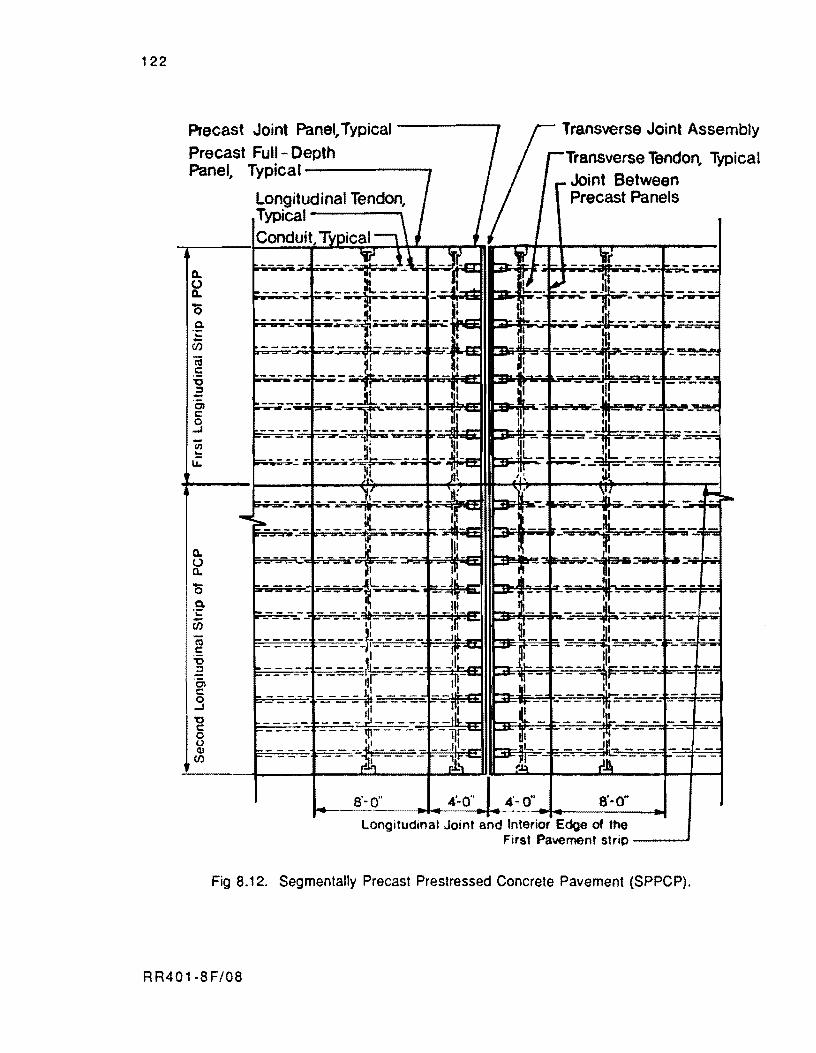
122
Precast Joint Panel, Typical Precast Full- Depth
Transverse Joint Assembly
rTransverse Tendon, Typical r Joint Between Panel, Typical I
Longitudinal Tendon, Typical \
Precast Panels
Q. (J Q.
'0 .9: .. Ci5
u.
Q. U C.
Conduit, Typical-, \ J •
~-~ ,;....- - - .l~ - - :j:' :::. .' -L.=.=.= t = _- - -_ ---!! ~;ao. ~""'---!-~·-=iif"""""""'-" - '-. ---- '---:-,
- ""- - - - - - - - - - ~ - - -- - __ I ----.---t ...... "'" W'io~ ""
u_u -- -=f~--~ ~'=;: --r" - Jr ..
c..:::.::;;r;;;-s:-..::]"'-=-'5--:;;,.-_-~L----- ... -K.- - - _~i ---- -- -... - ~- ... -- :~.- - ----.,.----... _ .. - _ _ - _ -d..- _____ 111 .. _ _ ~ _ _~L _ _ __ .. - - - - - --~- - -'" - .. ~fi -- - ~ - --- ijip-
I- - - -.. .. - - - - t!. .. - - - _. ,,==--=...J~IIL~dlllt::D:~~F-=E -__ - -_ ~-_-_-_-_- .... - - - -- - - .. - - -~I- - - -"'.:II - • rr. -- --- ~ ... -
----------~,L---.- - .. II~- _ ........ ~= _:::.. ___ ]~== __ .. .. .. - - - - -'Ir, - .. .. :nIl' '-.~ !Ir
E-::--=_-=--'::=-'1==~-=.:-iit~ - _ .. _="=" .. 1:£ _.i! _ .. -+-- :. :..-_-.. .-........ - .... - $ - .. -...... tIL-. __ Ji. ....... - -)!. - - .. .. ----- .. ~ .. -.. -lr- ~ ill- -1ft----
I- • .. - -.~ .. .... hi . __ .8'- .. -.il!-::: - - - - _ .. -.. .. .. i~-- ;1\- ~ ~- -- fi--
8'-0"
Longitudinal Joint and Interior Edge of the First Pavement strip ----'
Fig S.12. Segmentally Precast Prestressed Concrete Pavement (SPPCP).
RR401-SF/OS
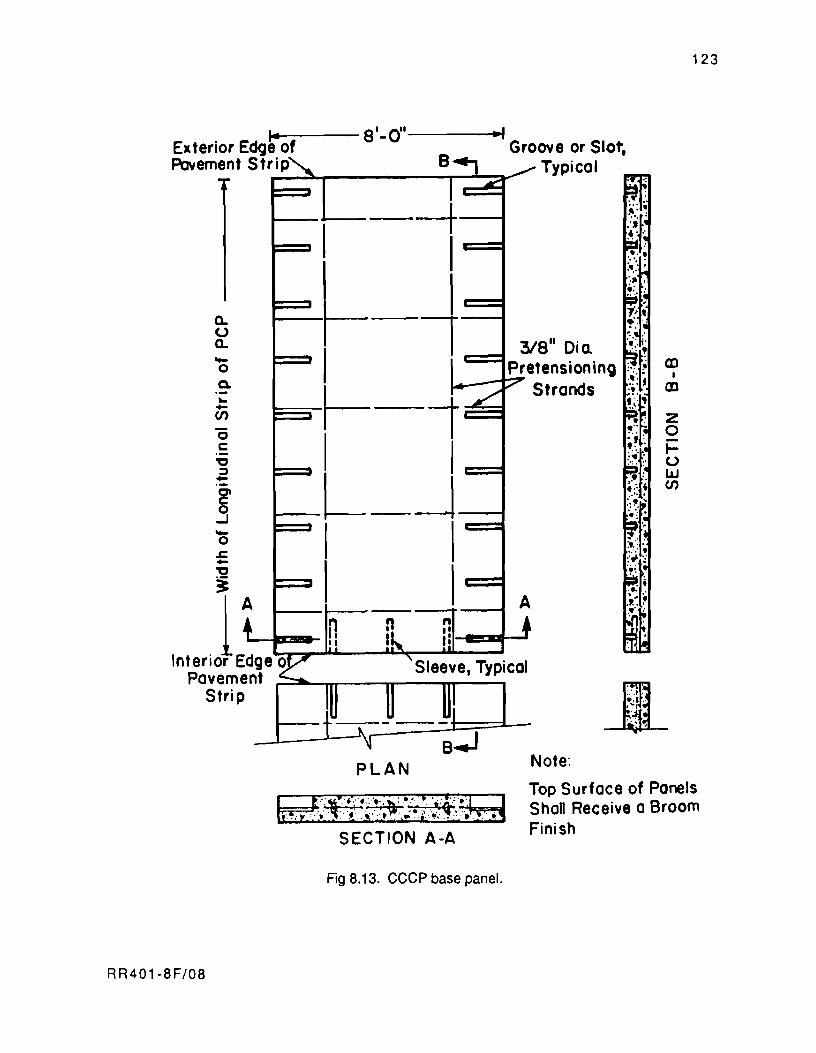
123
&..~------ 81_0"----·~, Ex terior Edc1e of Groove or Slot, Pavement Strip Typical
a. u a. -o Q. ~ -Cf)
o C
'a :I -g' o
.....J -o ~ -'a
~
--t I I I r-I ~ 1 I I L----J I
lA~~ Interior Edge 0
Pavement Strip
n n n II .. I I:
PLAN
Fig 8.13. CCCP base panel.
RR401-8F/08
3/8" Dio. Pretensionin~ CD
I
Strands CD
z 0 ~ u w Cf)
A
jl .... .I. .. , .' l~
.. -... ,
Note:
Top Surface of Panels Shall Receive a Broom Finish
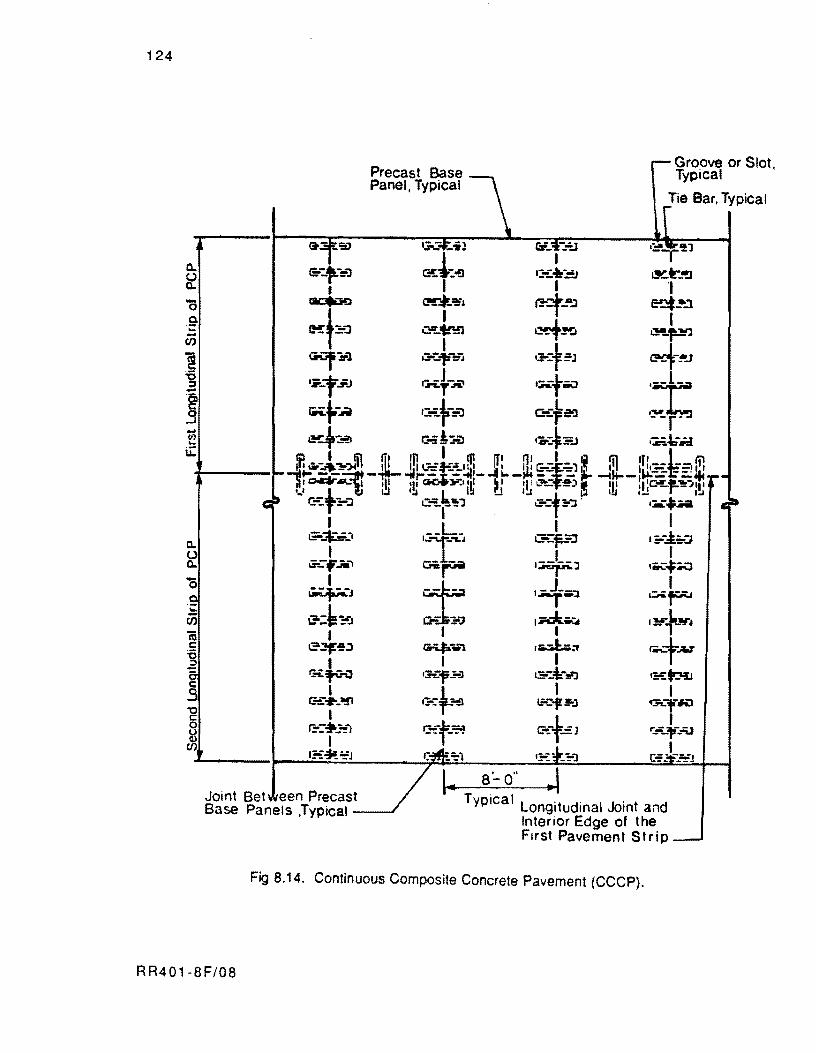
124
-III ... u:
c.. u c..
c S "0 c: o
~
Joint Bet een Precast
Precast Base Panel, Typical
Base Panels ,Typical--J Typical Longitudinal Joint and Interior Edge of the First Pavement Strip
Fig 8.14. Continuous CompOSite Concrete Pavement (CCCP).
RR401-8F/08
Tie Bar, Typical

125
would be perpendicular to the panel edges. These grooves would accommodate tie bars between
adjacent panels.
The precast concrete panels would be transported to the job site to be set in place with
a truck crane. The concrete wearing course would be slip-formed in place after placement of
the precast panels.
CClv1PARISON OF CONCEPT CHARACTERISTICS
Table 8.1 summarizes the relative ability of each of these new concepts to address the
problems encountered on previous projects and to effectively utilize the potentials of PCP,
together with possible new problems created with each concept. The comparison is made with
regard to the following aspects:
( 1 ) bonded versus unbonded tendons,
( 2 ) transverse prestressing and looped tendons,
(3) friction reducing mediums,
( 4 ) gap slabs versus central stressing,
( 5 ) prestress force transference,
( 6 ) tendon placement,
(7) transverse joints,
(8) multiple longitudinal strip construction,
( 9 ) concrete compaction,
( 1 0) protection of tendon anchorages,
( 1 1) adverse construction conditions,
( 1 2) alternate uses,
( 1 3) alternate materials and methods, and
(14) unfamiliarity.
RR401-8F/08
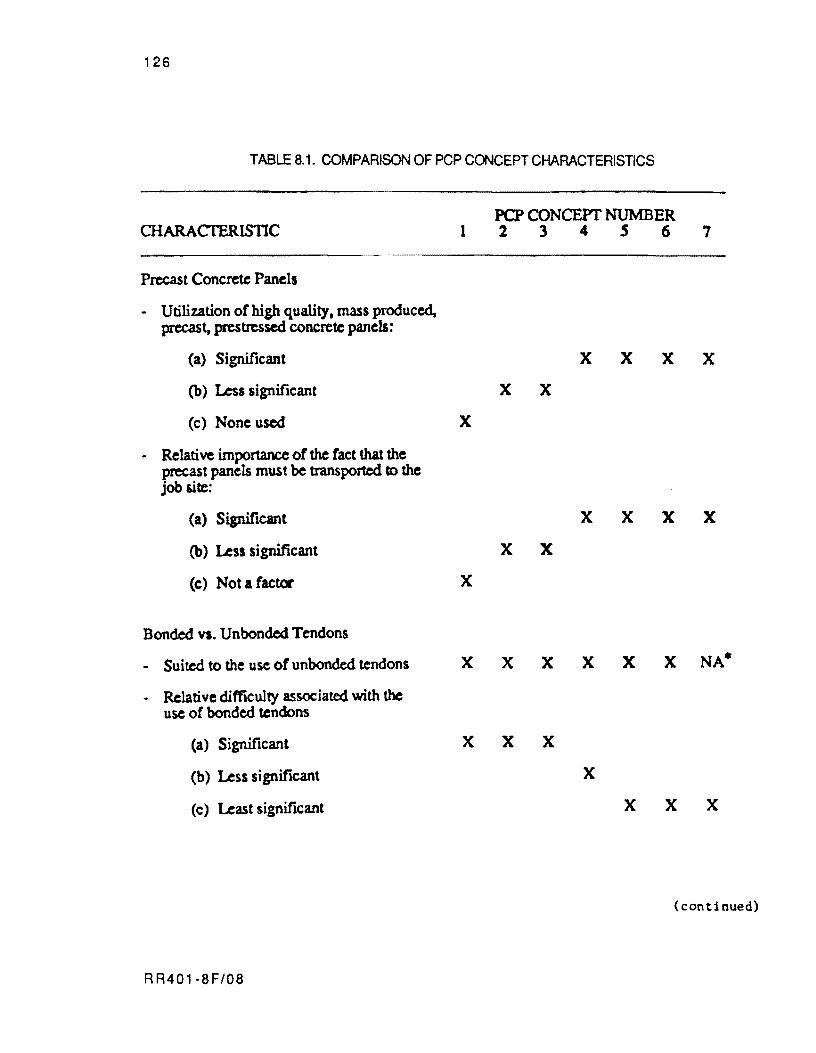
126
TABLE 8.1. COMPARISON OF PCP CONCEPT CHARACTERISTICS
PCP CONCEPT NUMBER CHARACfERISTIC 1 2 3 4 5 6 7
Precast Concrete Panels
- Utilization of high quality, mass produced, precast. prestressed concrete panels:
(a) Significant X X X X
(b) Las significant X X
(c) None used X
• Relati ve importance of the fact that the precast panels must be transported to the job site:
(a) Significant X X X X
(b) Less significant X X
(c) Not a factor X
Bonded VI. Unbonded Tendons
- Suited to the use of unbonded tendons X X X X X X NA*
- Relative difficulty associated with the use of bonded tendons
(a) Significant X X X
(b) Less significant X
(c) Least significant X X X
(con ti nued)
RR401-8F/08
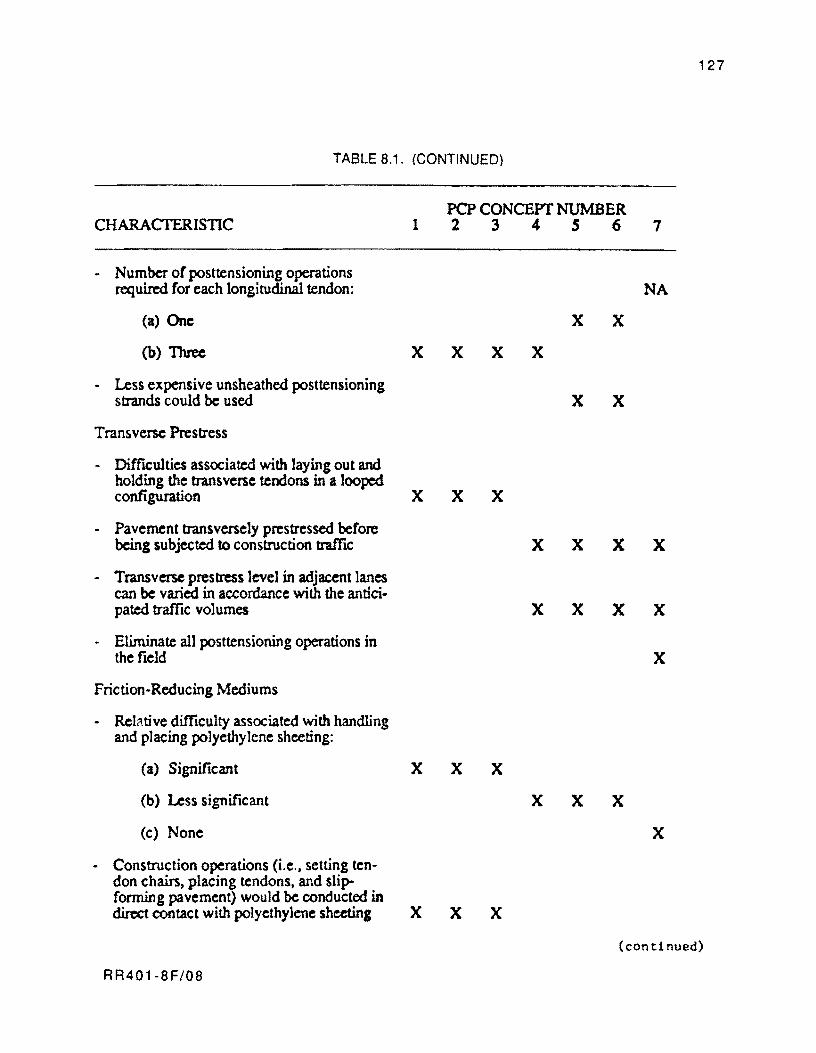
127
TABLE B.1. (CONTINUED)
PCP CONCEPT NUMBER CHARACfERISTIC 1 2 3 4 5 6 7
* Number of posttensioning operations required for each longitudinal tendon: NA
(a) One X X
(b) Three X X X X
- Less expensive unsheathed posttensioning strands could be used X X
Transverse Prestress
- DiffiCulties associated with laying out and holding the transvene tendons in a looped configuration X X X
- Pavement transversely prestressed before being subjected to construction traffic X X X X
- Transverse prestress level in adjacent lanes can be varied in accordance with the antici-pated traffic volumes X X X X
- Eliminate all posttensioning operations in the field X
Friction-Reducing Mediums
- Rel~tive difficulty associated with handling and placing polyethylene sheeting:
(a) Significant X X X
(b) Less significant X X X
(c) None X
- Construction operations (i.e., setting ten-don chairs, placing tendons, and slip-forming pavement) would be conducted in direct contact with polyethylene sheeting X X X
(continued)
RR401-BF/OB
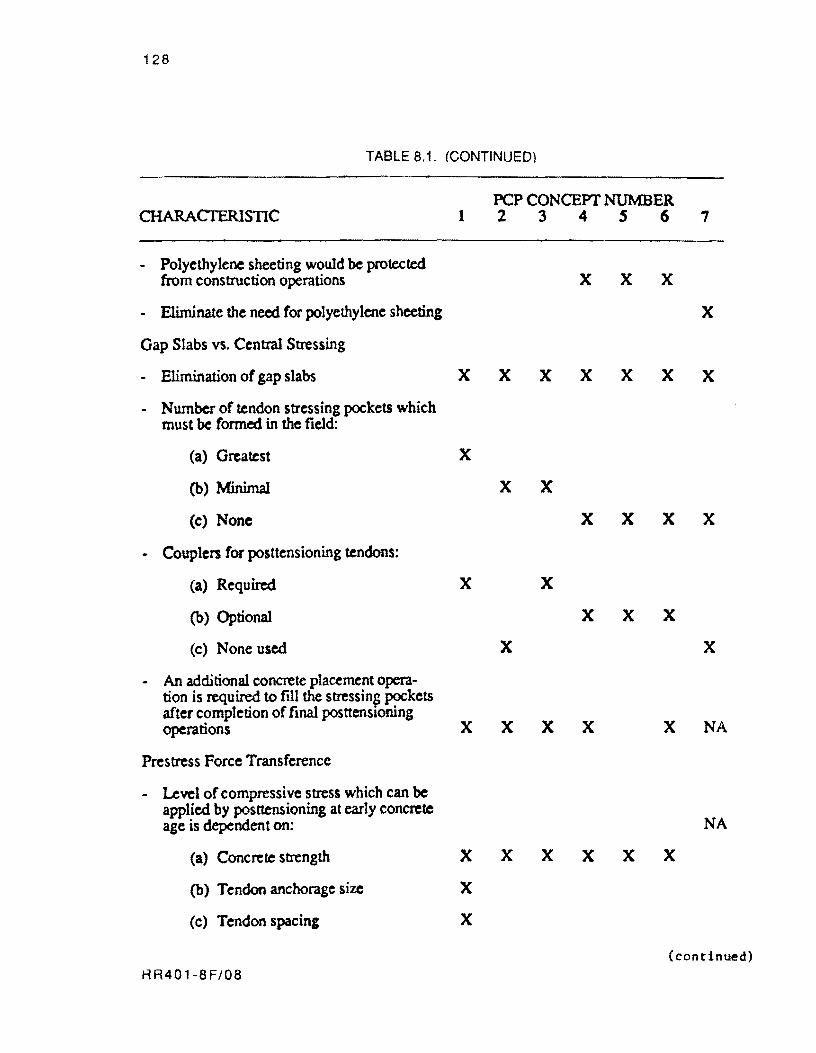
128
TABLE 8.1. (CONTINUED)
PCP CONCEPT NUMBER CHARACTERISTIC 1 2 3 4 S 6 7
- Polyethylene sheeting would be protected from construction operations X X X
- Eliminate the need for polyethylene sheeting X
Gap Slabs vs. Central Stressing
- Elimination of gap slabs X X X X X X X
. Number of tendon stressing pockets which must be formed in the field:
(a) Greatest X
(b) Minimal X X
(c) None X X X X
- Couplers for posttensioning tendons:
(a) Required X X
(b) Optional X X X
(e) None used X X
- An adc:litional concrete placement opera-tion is required to rul the stressing pockets after completion of final posttensioning operations X X X X X NA
Prestress Force Transference
- Level of compressive stresS which can be applied by posttensioning at early concrete age is dependent on: NA
(a) Concrete strength X X X X X X
(b) Tendon anchorage size X
(e) Tendon spacing X
(continued) RR401-8F/08
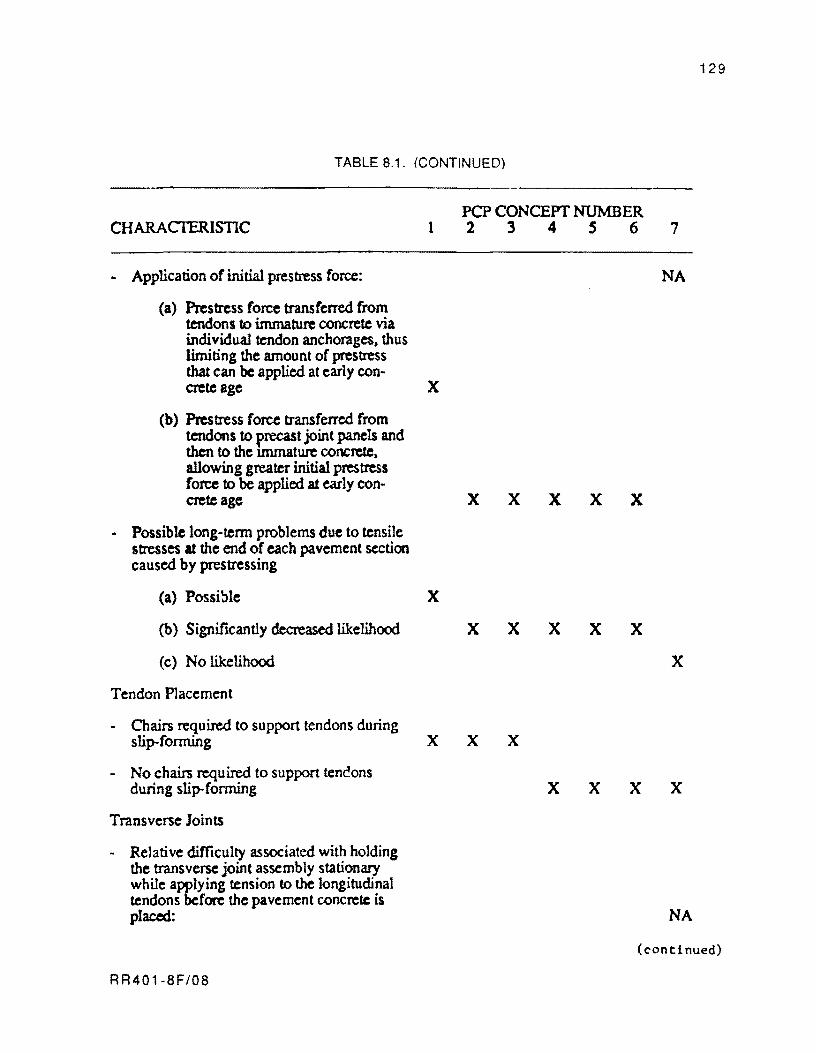
129
TABLE 8.1. (CONTINUED)
PCP CONCEPT NUMBER CHARACfERISTIC 1 2 3 4 S 6 7
- Application of initial prestress force: NA
(a) Prestress (orce transferred from tendons to immature concrete via individual tendon anchorages, thus limiting the amount of prestress that can be applied at early con-crete age X
(b) Prestress force transferred from tendons to precast joint panels and then to the unmature concrete. allowing greater initial prestress force to be applied at early con-crete age X X X X X
. Possible long-tenn problems due to tensile stresses at the end of each pavement section caused by prestressing
(a) Possible X
(b) Significantly decreased likelihood X X X X X
(c) No likelihood X
Tendon Placement
- Chairs required to support tendons during slip-ronning X X X
- No chairs required to support tencons during slip-forming X X X X
Transverse Joints
- Relative difficulty associated with holding the transverse joint assembly stationary while applying tension to the longitudinal tendons before the pavement concrete is placed: NA
(continued)
RR401-8F/08
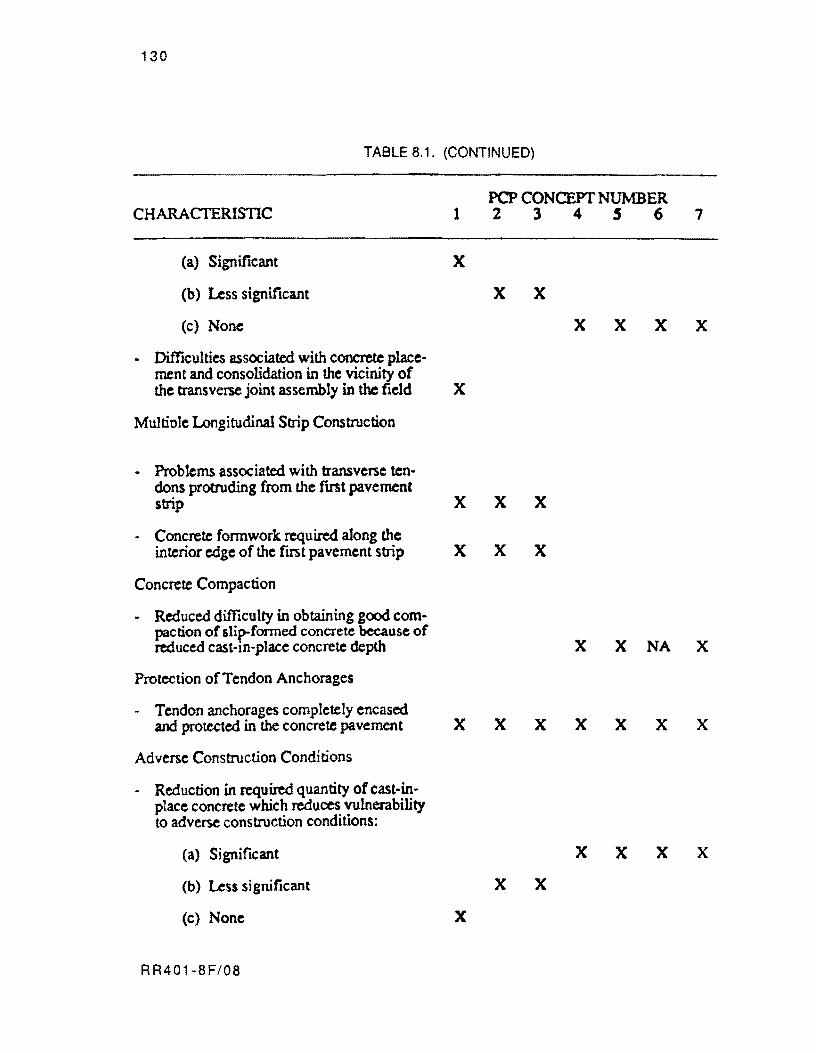
130
TABLE B.1. (CONTINUED)
PCP CONCEPT NUMBER CHARACTERISTIC 1 2 3 4 .5 6 7
(a) Significant X
(b) Less significant X X
(c) None X X X X
- Difficulties associated with concrete place-ment and consolidation in the vicinity of the transverse joint assembly in the field X
Multiole Longitudinal Strip Construction
- Problems associated with transverse ten-dons protruding from the fInt pavement strip X X X
- Concrete fonnwork required along the interior edge of the fIrSt pavement strip X X X
Concrete Compaction
- Reduced difficulty in obtaining good com-paction of slip-formed concrete because of
X X reduced cast-m-place concrete depth NA X
Protection of Ten don Anchorages
- Tendon anchorages completely encased and protected in the concrete pavement X X X X X X X
Adverse Construction Conditions
- Reduction in required quantity of cast-in-place concrete which reduces vulnerability to adverse construction conditions:
(a) Significant X X X X
(b) Less significant X X
(c) None X
R R401-BF/OB
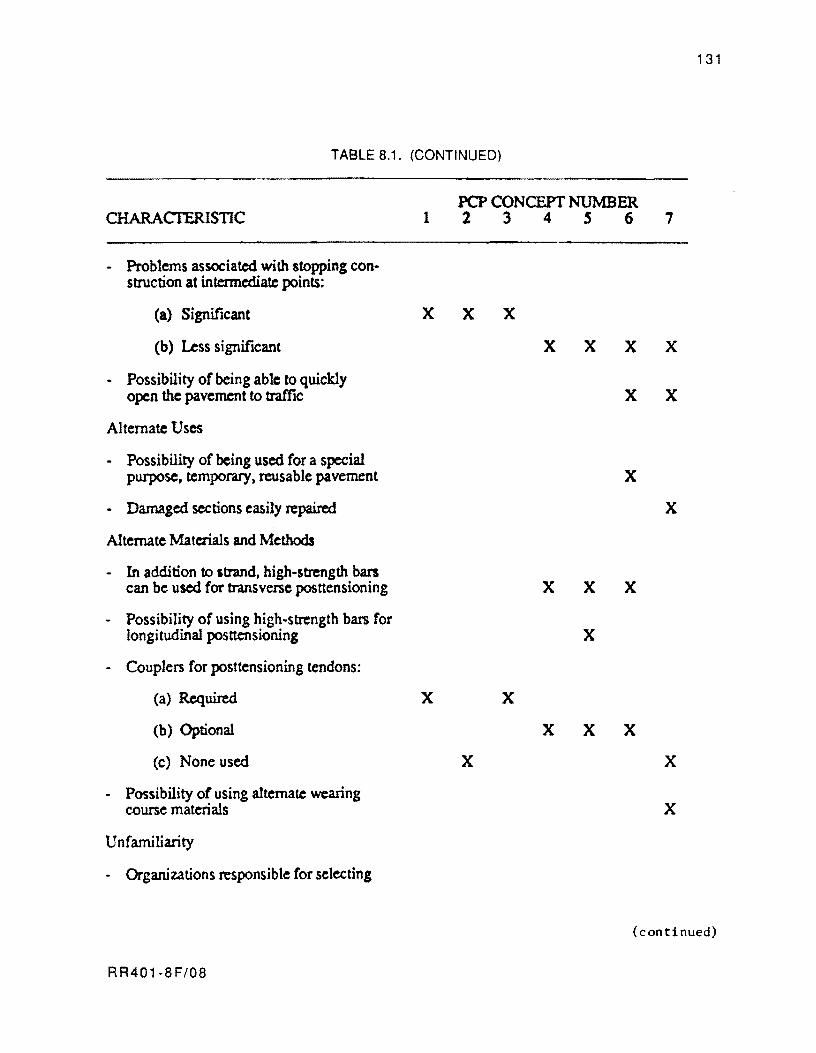
131
TABLE B.1. (CONTINUED)
PCP CONCEPT NUMBER CHARACTERISTIC 1 2 3 4 S 6 7
- Problems associated with stopping con-struction at intermediate points:
(a) Significant X X X
(b) Less significant X X X X
- Possibility of being able to quickly open the pavement to traffic X X
Alternate Uses
- Possibility of being used for a special purpose, temporary, reusable pavement X
- Damaged sections easiJy repaired X
Alternate Materials and Methods
- In addition to strand. high-strength ban can be used for transverse posttensioning X X X
- Possibility of using high-strength bars for longitudinal posttensioning X
- Couplers for posttensioning tendons:
(a) Required X X
(b) Optional X X X
(c) None used X X
- Possibility of using alternate wearing course materials X
Unfamiliarity
- Organizations responsible for selecting
(continued)
RR401·BF/OB
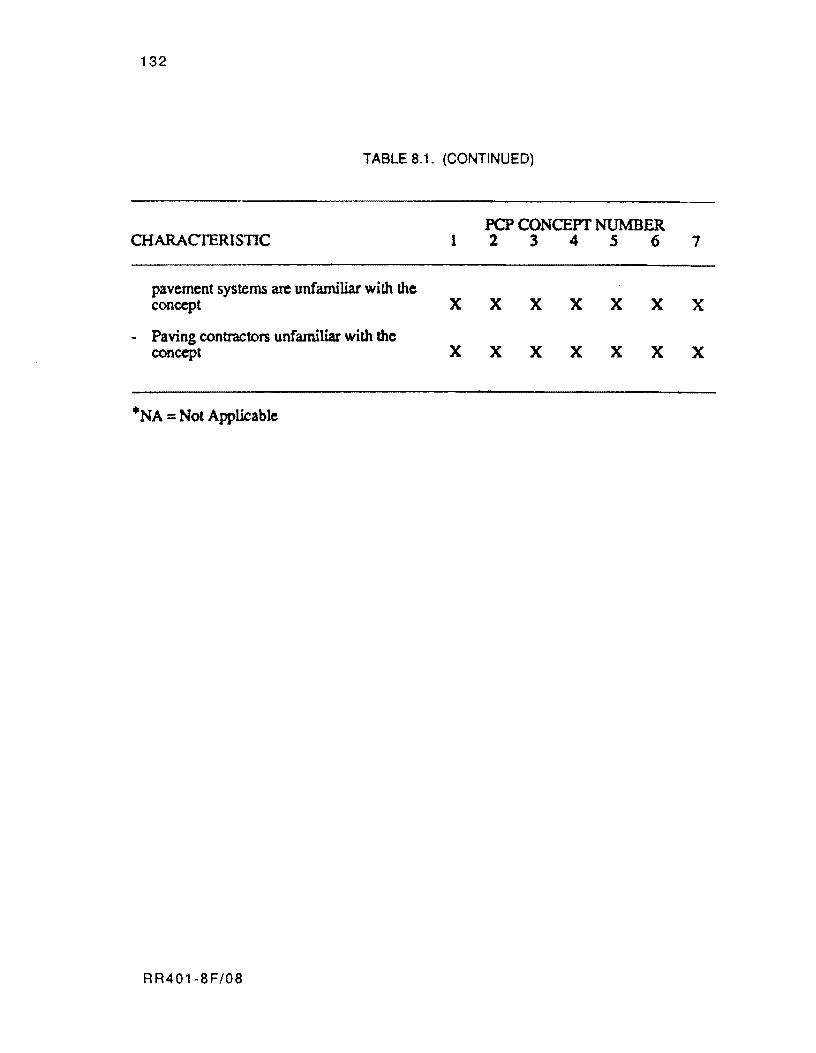
132
TABLE 8.1. (CONTINUED)
PCP CONCEPT NUMBER CHARACTERISTIC 1 2 3 4 5 6 7
pavement systems are unfamiliar with the concept X X X X X X X
- Paving contractors unfamiliar with the concept X X X X X X X
·NA = Not Applicable
RR401·8F/08
CHAPTER 9. SUMMARY, CONCLUSIONS, AND RECOMMENDATIONS
This project has fully explored the use of PCP in a number of areas by numerous
engineers. In the following sections the summary, conclusions. and recommendations derived
from this study are presented.
SUMMARY
Based on the results of this study, PCP is a viable pavement type that may be used as a
new pavement or as a rehabilitation alternative on Texas highways. The general warrants for
this pavement type are high traffic volumes, low maintenance, and vertical clearance problem
areas. The report presents information and procedures, in accordance with the objectives,
related to
( 1 ) pavement thickness. joint spacing, and post-tensioning design for the wheel
loads, material properties, and environmental factors for a specific project.
(2) The characterization of performance of an in service pavement on IH-35 in
McLennan County is reported.
(3) evaluation of various post-tensioning techniques.
(4) new concepts that may be used in the design and construction of PCP.
CQ\JCWSlONS
After each chapter a summary and/or conclusions are presented. Following are the
pertinent conclusions:
( 1 ) The double layer of polyethylene gives the lowest friction values, but
observations of performance and the mechanism indicated a single layer was the
most cost effective method of reducing the friction at the pavement-subbase
interface.
RR401-8F/09 133
134
(2) The use of stressing pockets has been demonstrated to be an efficient method of
post-tensioning that provides the maximum stress level at critical locations
and eliminates the need for the use of gap slabs. The pocket sizes must be
tailored to the anticipated stressing jacks since many sizes are currently
available.
( 3 ) The most efficient tendon looping patterns may be developed using the equations
and tables presented in Chapter 4.
( 4 ) The study has shown that initial stressing at an early age (less than 12 hours)
will eliminate premature cracking, thereby reducing future problem areas.
Equation 4.1 may be used to estimate the permissible early loading based on
slab thickness, strand spacing, concrete tensile strength, and anchorage areas.
(5) A design procedure is summarized in Chapter 7 that permits the derivation of
the most effective combination of slab thickness, post-tensioning level, and
joint spacing for a specific set of design conditions. The pavement may be
designed rather than extrapolated from past experience based on Ref 17 from
which Chapter 7 is taken.
(6) Field measurements of in-service pavements and test slabs indicate the design
models reliably predict concrete stress and joint movement for a range of
environmental conditions and age.
(7) Fatigue tests of prestressed laboratory beams indicate that the predicted life
from the equations used in fatigue analysis is conservative.
( S ) Seven new concepts are presented that may increase the viable alternate uses of
PCP. The design procedures presented herein may be used to investigate their
viability for specific projects.
RECOMMENDATIONS
Following are key recommendations from this study:
(1 ) A location should be selected so a larger project may be designed and constructed
using the concepts in this report. A large project along with the experience
codified herein should lead to a more cost competitive pavement.
RR401-SF/09

135
( 2 ) The new concepts presented in Chapter 8 should be explored with a feasibility
study to select the most promising and economical approach; then this approach
should be implemented in a full scale construction project.
RR401-8F/09

!!!!!!!!!!!!!!!!!!!"#$%!&'()!*)&+',)%!'-!$-.)-.$/-'++0!1+'-2!&'()!$-!.#)!/*$($-'+3!
44!5"6!7$1*'*0!8$($.$9'.$/-!")':!
REFERENCES
1. Chia, Way Seng, N. H. Burns, and B. Frank McCullough, "Field Evaluation of Subbase
Friction Characteristics," Research Report 401-5, Center for Transportation
Research, The University of Texas at Austin, November 1986.
2. American Concrete Institute, Committee 318, Building Code ReQuirements for
Reinforced Concrete lACI 318-83), Second Printing, September 1984.
3. Post-Tensioning Institute, Post-Tensioning Manual. 1976.
4. O'Brien, J. S., N. H. Burns, and B. F. McCullough, "Very Early Post-Tensioning of
Prestressed Concrete Pavement," Research Report 401-1, Center for
Transportation Research, The University of Texas at Austin, June 1985.
5. Guyon, Yves, prestressed Concrete, John Wiley & Sons, Inc., New York, 1953.
6. Maffei, Joseph, B. Frank McCullough, and Ned H. Burns, "Instrumentation and
Behavior of Prestressed Concrete Pavements," Research Report 401-4, Center
for Transportation Research, The University of Texas at Austin.
7. Brunner, Raymond J., "Prestressed Pavement Demonstration Project," Research
Project No. 72-22(2), Pennsylvania Department of Transportation, Bureau of
Materials, Testing, and Research, Annual Meeting of the Transportation
Research Board, 1975.
8. Friberg, Bengt F., and T. J. Pasko, "Prestressed Concrete Highway Pavement at Dulles
International Airport: Research Progress Report to 100 Days," Report No.
FHWA-RD-72-29, U. S. Department of Transportation, Federal Highway
Administration, August 1973.
9. Albrittion, Gayle E, "Prestressed Concrete Highway Pavement: Construction -- As
Built Performance, Brookhaven, Mississippi (Research Supplement),· U. S.
Department of Transportation, Federal Highway Administration, Region 15,
Demonstration Projects Division, Arlington, Virginia, August 1978.
10. Morris, Gene R., and Hal C. Emery, "The Design and Construction of Arizon'a
Prestressed Concrete Pavement," Research Section, Highway Division, Arizona
Department of Transportation, Fifteenth Paving Conference, University of New
Mexico, Department of Civil Engineering, Albuquerque, New Mexico, January
1978.
RR401-8F/RR 137
138
11. Friberg, Bengt F., "Investigations of Prestressed Concrete for Pavements," Bulletin
No. 332, Highway Research Board, 1962, pp 40-94.
12. Wray, Warren K. (Principle Investigator), "Interim Report: Measurement of Slab-
Subgrade Friction on a Full Scale 80 ft. x 150 ft. Slab at Slidell, La.,"
Department of Civil Engineering, Texas Tech University, October 3, 1984.
13. Texas State Department of Highways and Public Transportation, Standard
Specifications for the Construction of Highways, Streets. and Bridges, 1982.
14. Dunn, Brian W., Ned H. Burns, and B. Frank McCullough, "Friction Losses in Unbonded
Post-Tensioning Tendons," Research Report 401-6, Center for Transportation
Research, The University of Texas at Austin, November 1986.
15. Nussbaum, Peter J., Adrian T. Ciolko, and Shiraz D. Tayabji, prestressed Pavement
Volume 1. Joint Design, U. S. Department of Transportation, Federal Highway
Administration, Offices of Research and Development, Report No. FHWAlRD-
811090. Springfield, Virginia: NTIS, June 1983.
16. Chia, Way Seng, Ned H. Burns, and B. Frank McCullough, "Effect of Prestress on
Fatigue Life of Concrete," Research Report 401-7, Center for Transportation
Research, The University of Texas at Austin, November 1986.
17. Mendoza, A., B.F. McCullough, and Ned H. Burns, "Behavior of Long Prestressed
Pavement Slabs and Design Methodology," Research Report 401-6, Center for
Transportation Research, The University of Texas at Austin, August 1986.
18. McCullough. B.F., and A. Mendoza, "Report on a Mechanistic Analysis of the PCC Aprons
at King Fahd International Airport, Kingdom of Saudi Arabia," Austin Research
Engineers, October 1985.
19. Weil, G., "Der Verschiebewiderstand von Betonfahrbahnplatten," Betonstein
Jahrbuch, Bauverlag GMBH, Wiesbaden, 1960.
20. Cashell, H.D., and Benham, S.W., "Experiments with Continuous Reinforcement in
Concrete Pavements," proceedings. V.29, Highway Research Board, 1949, pp.
44-80.
21. ACI Committee 325, "Proposed Design of Experimental Prestressed Pavement Slab, and
Restrained Temperature Movements in Long Slabs," ACI Journal. Proceedings
Vol. 64, No.4, April 1968, pp. 249-265.
22. Godbeck, A.T., "Friction Tests of Concrete on Various Subbases," Public Roads 5. July
1924.
RR401-8F/RR
139
23. Timms, A.G., "Evaluating Subgrade Friction Reducing Mediums for Rigid Pavements,"
Highway Research Record 60. Highway Research Board, 1963, pp. 28-38.
24. Friberg, B.F., "Frictional Resistance Under Concrete Pavements and Restraint Stresses
in Long Reinforced Slabs," Proceedings. V.33, Highway Research Board, 1954,
pp.167-184.
25. Ware, K.R., "KFIA Friction Test Results, Arabian Bechtel Company Ltd., January
1982," ARE Inc., August 28, 1984.
26. Mendoza, A., B.F. McCullough, and Ned H. Burns, "Design of the Texas Prestressed
Concrete Overlays in Cooke and McLennan County and Construction of the
McLennan County Project," Research Report 556-1, Center for
Transportation Research, The University of Texas at Austin, February 1986.
27. Mendoza, A., and Neil D. Cable, "Field Tests Conducted Near Valley View, Texas, for the
Design of the Prestressed Highway Pavement Demonstration Projects in Cooke
and McLennan Counties," Technical Memorandum 401-17, Center for
Transportation Research, The University of Texas at Austin, September 19,
1984.
28. Mendoza, A., "Repetition of the Friction Tests on the Test Slabs Constructed Near Valley
View, Texas, for the Design of Prestressed Highway Project in Cooke County,"
Technical Memorandum 401-20, Center for Transportation Research, The
University of Texas at Austin, November 1984.
29. Stott, J.P., "Tests on Materials for Use as Sliding Layers Under Concrete Road Slabs,"
Civil Engineering 56. 1961, pp. 663-665.
30. McCullough, B.F., A. Abou-Ayyash, W.R. Hudson, and J.P. Randall, "Design of
Continuously Reinforced Concrete Pavements for Highways," NCHRP 1-15,
Center for Transportation Research, The University of Texas at Austin, August
1974.
31. Rivero-Vallejo, F., and B.F. McCullough, "Drying Shrinkage and Temperature Drop
Stresses in Jointed Reinforced Concrete Pavements," Research Report 177-1,
Center for Transportation Research, The University of Texas at Austin, August
1975.
32. Cable, Neil D., N. H. Burns, and B. Frank McCullough. "New Concepts in Prestressed
Concrete Pavement," Research Report 401-2, Center for Transportation
Research, The University of Texas at Austin, December 1985.
RR401-8F/RR