Embed Size (px)
Citation preview
November 2017
3
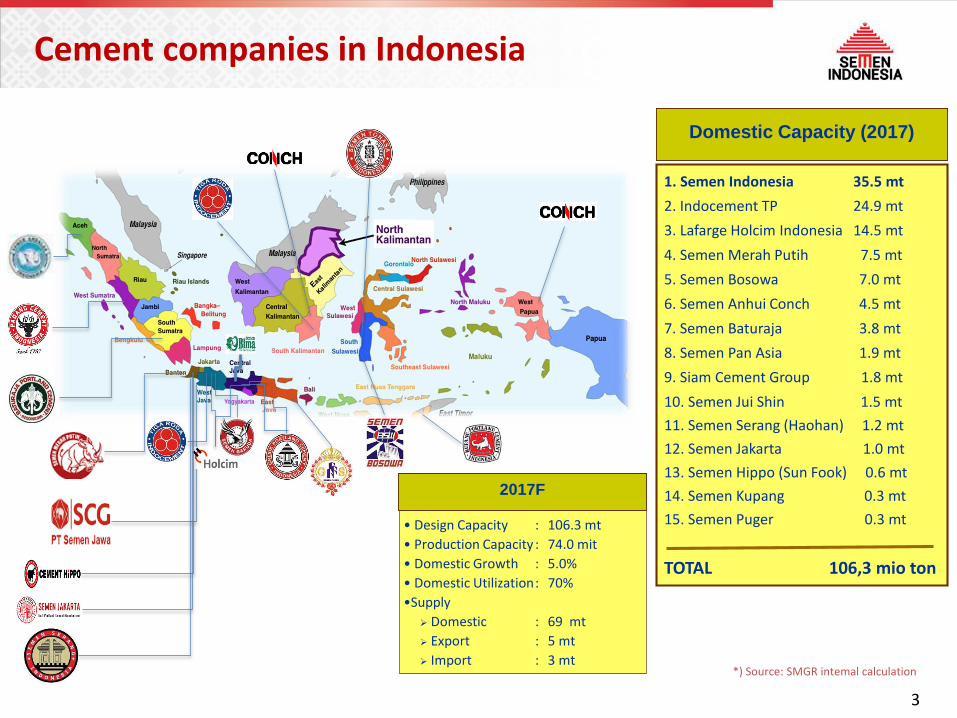
• Design Capacity : 106.3 mt
• Production Capacity : 74.0 mit
• Domestic Growth : 5.0%
• Domestic Utilization: 70%
•Supply
Domestic : 69 mt
Export : 5 mt
Import : 3 mt
Domestic Capacity (2017)
2017F
Cement companies in Indonesia
1. Semen Indonesia 35.5 mt
2. Indocement TP 24.9 mt
3. Lafarge Holcim Indonesia 14.5 mt
4. Semen Merah Putih 7.5 mt
5. Semen Bosowa 7.0 mt
6. Semen Anhui Conch 4.5 mt
7. Semen Baturaja 3.8 mt
8. Semen Pan Asia 1.9 mt
9. Siam Cement Group 1.8 mt
10. Semen Jui Shin 1.5 mt
11. Semen Serang (Haohan) 1.2 mt
12. Semen Jakarta 1.0 mt
13. Semen Hippo (Sun Fook) 0.6 mt
14. Semen Kupang 0.3 mt
15. Semen Puger 0.3 mt
TOTAL 106,3 mio ton
*) Source: SMGR intemal calculation
4
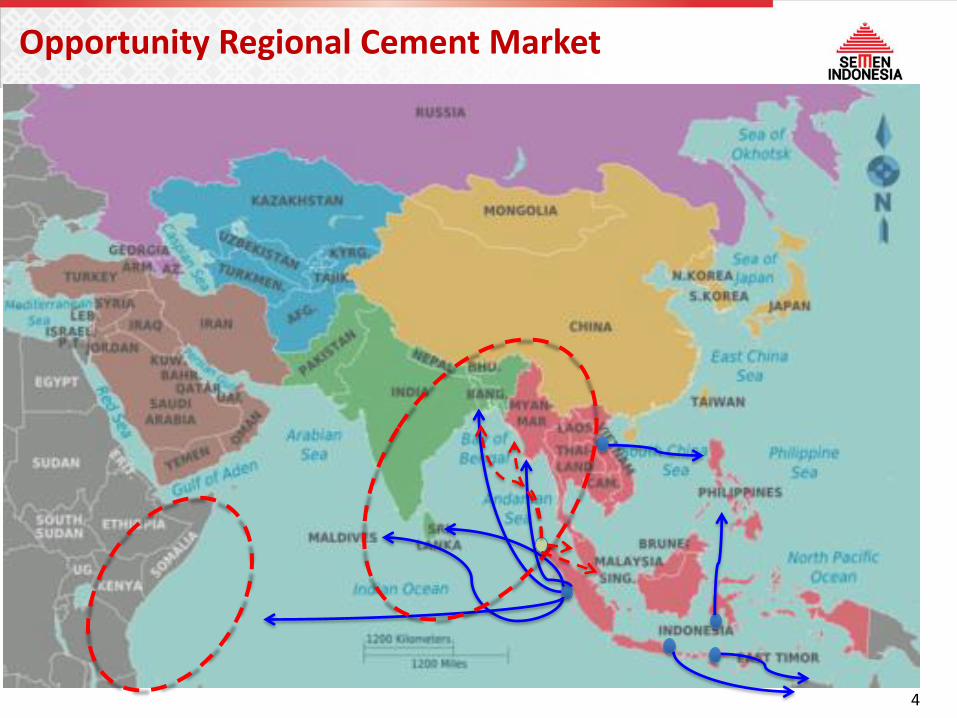
Opportunity Regional Cement Market
5
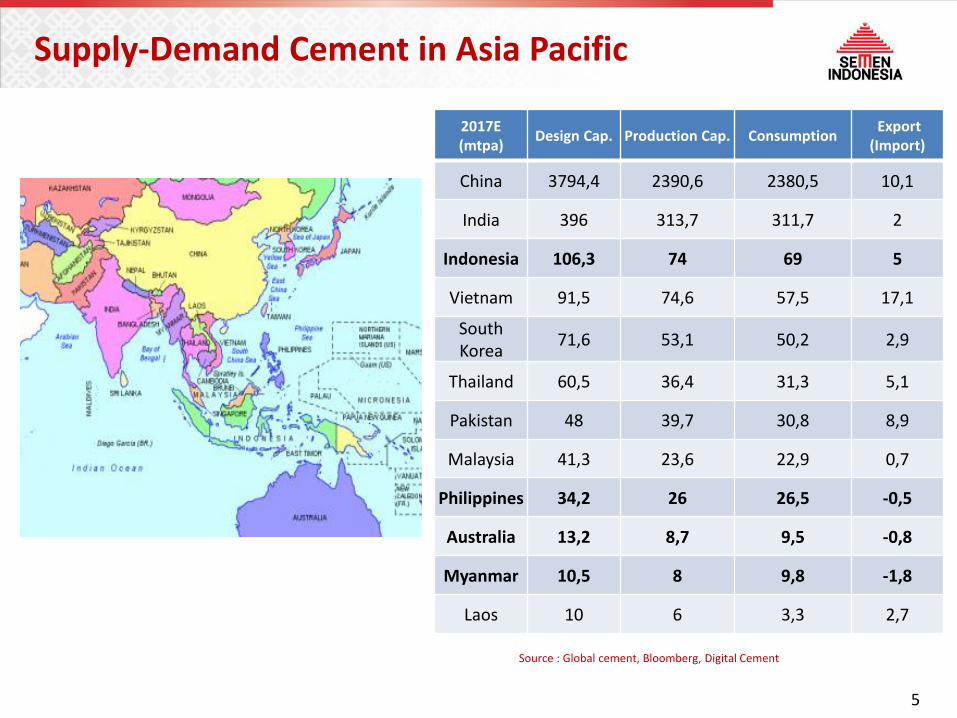
Supply-Demand Cement in Asia Pacific
2017E (mtpa)
Design Cap. Production Cap. ConsumptionExport
(Import)
China 3794,4 2390,6 2380,5 10,1
India 396 313,7 311,7 2
Indonesia 106,3 74 69 5
Vietnam 91,5 74,6 57,5 17,1
South Korea
71,6 53,1 50,2 2,9
Thailand 60,5 36,4 31,3 5,1
Pakistan 48 39,7 30,8 8,9
Malaysia 41,3 23,6 22,9 0,7
Philippines 34,2 26 26,5 -0,5
Australia 13,2 8,7 9,5 -0,8
Myanmar 10,5 8 9,8 -1,8
Laos 10 6 3,3 2,7
Source : Global cement, Bloomberg, Digital Cement
6Source: Company data, Indonesia Cement Association
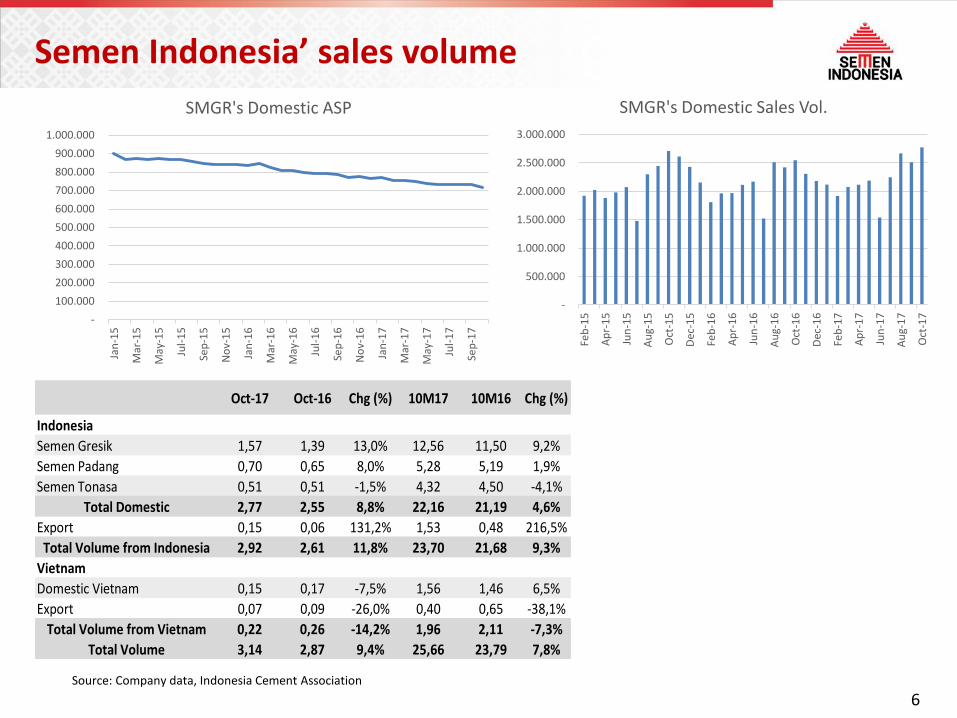
Semen Indonesia’ sales volume
-
500.000
1.000.000
1.500.000
2.000.000
2.500.000
3.000.000
Feb
-15
Ap
r-1
5
Jun
-15
Au
g-1
5
Oct
-15
Dec
-15
Feb
-16
Ap
r-1
6
Jun
-16
Au
g-1
6
Oct
-16
Dec
-16
Feb
-17
Ap
r-1
7
Jun
-17
Au
g-1
7
Oct
-17
SMGR's Domestic Sales Vol.
-
100.000
200.000
300.000
400.000
500.000
600.000
700.000
800.000
900.000
1.000.000
Jan
-15
Mar
-15
May
-15
Jul-
15
Sep
-15
No
v-1
5
Jan
-16
Mar
-16
May
-16
Jul-
16
Sep
-16
No
v-1
6
Jan
-17
Mar
-17
May
-17
Jul-
17
Sep
-17
SMGR's Domestic ASP
Oct-17 Oct-16 Chg (%) 10M17 10M16 Chg (%)
Indonesia
Semen Gresik 1,57 1,39 13,0% 12,56 11,50 9,2%
Semen Padang 0,70 0,65 8,0% 5,28 5,19 1,9%
Semen Tonasa 0,51 0,51 -1,5% 4,32 4,50 -4,1%
Total Domestic 2,77 2,55 8,8% 22,16 21,19 4,6%
Export 0,15 0,06 131,2% 1,53 0,48 216,5%
Total Volume from Indonesia 2,92 2,61 11,8% 23,70 21,68 9,3%
Vietnam
Domestic Vietnam 0,15 0,17 -7,5% 1,56 1,46 6,5%
Export 0,07 0,09 -26,0% 0,40 0,65 -38,1%
Total Volume from Vietnam 0,22 0,26 -14,2% 1,96 2,11 -7,3%
Total Volume 3,14 2,87 9,4% 25,66 23,79 7,8%
7
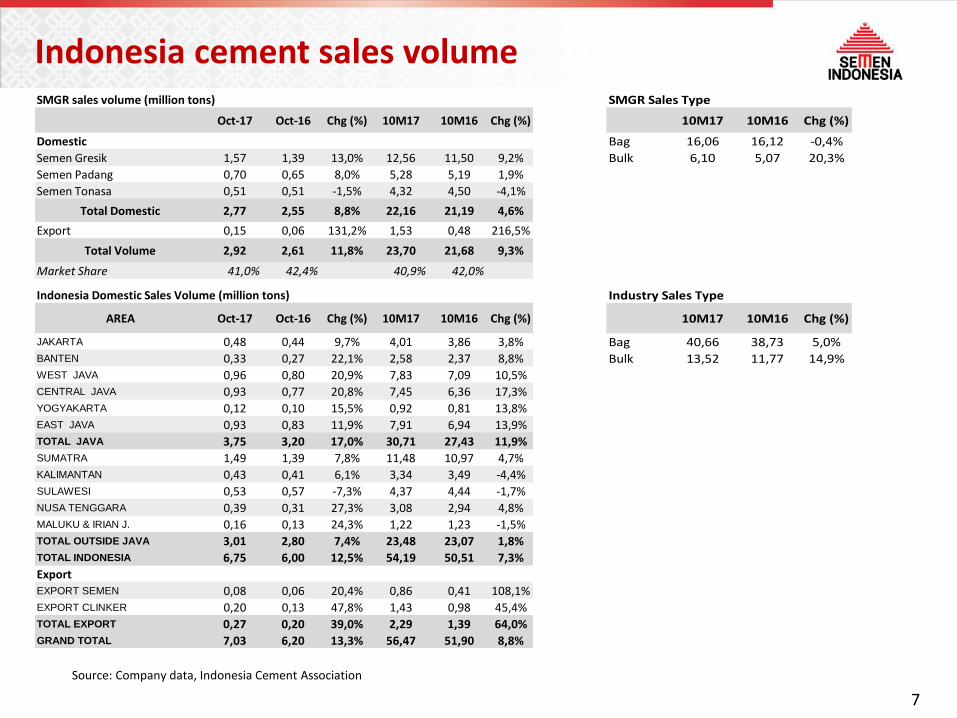
Source: Company data, Indonesia Cement Association
Indonesia cement sales volumeSMGR sales volume (million tons)
Oct-17 Oct-16 Chg (%) 10M17 10M16 Chg (%)
Domestic
Semen Gresik 1,57 1,39 13,0% 12,56 11,50 9,2%
Semen Padang 0,70 0,65 8,0% 5,28 5,19 1,9%
Semen Tonasa 0,51 0,51 -1,5% 4,32 4,50 -4,1%
Total Domestic 2,77 2,55 8,8% 22,16 21,19 4,6%
Export 0,15 0,06 131,2% 1,53 0,48 216,5%
Total Volume 2,92 2,61 11,8% 23,70 21,68 9,3%
Market Share 41,0% 42,4% 40,9% 42,0%
Indonesia Domestic Sales Volume (million tons)
AREA Oct-17 Oct-16 Chg (%) 10M17 10M16 Chg (%)
JAKARTA 0,48 0,44 9,7% 4,01 3,86 3,8%BANTEN 0,33 0,27 22,1% 2,58 2,37 8,8%WEST JAVA 0,96 0,80 20,9% 7,83 7,09 10,5%CENTRAL JAVA 0,93 0,77 20,8% 7,45 6,36 17,3%YOGYAKARTA 0,12 0,10 15,5% 0,92 0,81 13,8%EAST JAVA 0,93 0,83 11,9% 7,91 6,94 13,9%TOTAL JAVA 3,75 3,20 17,0% 30,71 27,43 11,9%SUMATRA 1,49 1,39 7,8% 11,48 10,97 4,7%KALIMANTAN 0,43 0,41 6,1% 3,34 3,49 -4,4%SULAWESI 0,53 0,57 -7,3% 4,37 4,44 -1,7%NUSA TENGGARA 0,39 0,31 27,3% 3,08 2,94 4,8%MALUKU & IRIAN J. 0,16 0,13 24,3% 1,22 1,23 -1,5%TOTAL OUTSIDE JAVA 3,01 2,80 7,4% 23,48 23,07 1,8%TOTAL INDONESIA 6,75 6,00 12,5% 54,19 50,51 7,3%
ExportEXPORT SEMEN 0,08 0,06 20,4% 0,86 0,41 108,1%EXPORT CLINKER 0,20 0,13 47,8% 1,43 0,98 45,4%TOTAL EXPORT 0,27 0,20 39,0% 2,29 1,39 64,0%GRAND TOTAL 7,03 6,20 13,3% 56,47 51,90 8,8%
SMGR Sales Type
10M17 10M16 Chg (%)
Bag 16,06 16,12 -0,4%
Bulk 6,10 5,07 20,3%
Industry Sales Type
10M17 10M16 Chg (%)
Bag 40,66 38,73 5,0%
Bulk 13,52 11,77 14,9%
8
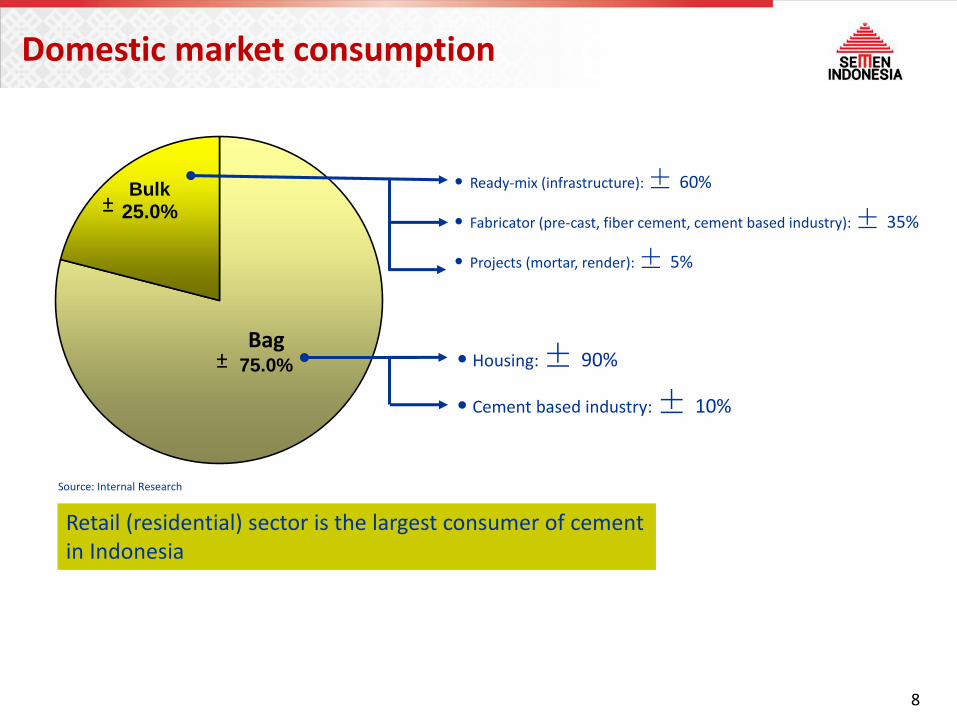
Retail (residential) sector is the largest consumer of cement in Indonesia
Bag75.0%
Bulk
25.0%
• Ready-mix (infrastructure):± 60%
• Fabricator (pre-cast, fiber cement, cement based industry):± 35%
• Projects (mortar, render):± 5%
• Housing:± 90%
• Cement based industry:± 10%
±
±
Source: Internal Research
Domestic market consumption
9
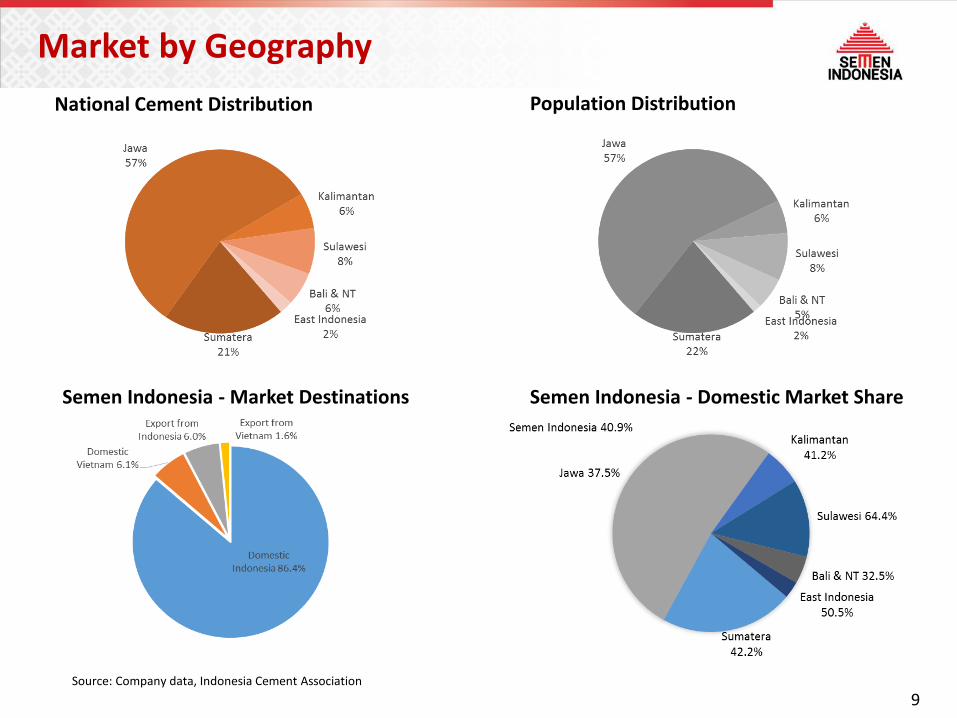
Market by Geography
Semen Indonesia - Domestic Market ShareSemen Indonesia - Market Destinations
National Cement Distribution Population Distribution
Source: Company data, Indonesia Cement Association
10
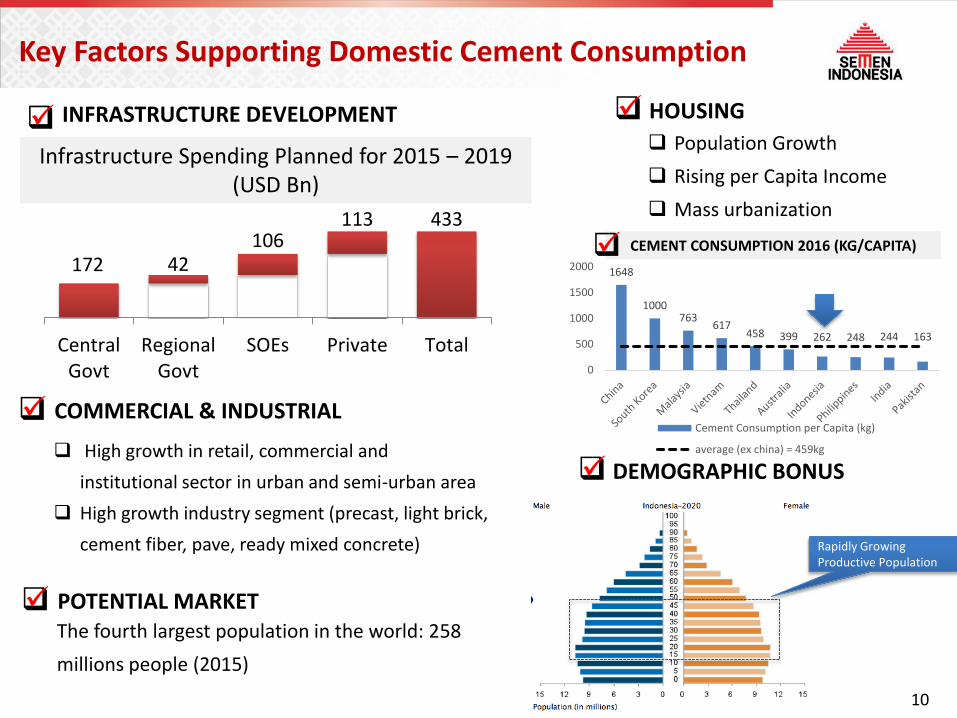
Infrastructure Spending Planned for 2015 – 2019 (USD Bn)
INFRASTRUCTURE DEVELOPMENT
COMMERCIAL & INDUSTRIAL
High growth in retail, commercial and
institutional sector in urban and semi-urban area
High growth industry segment (precast, light brick,
cement fiber, pave, ready mixed concrete)
HOUSING
Population Growth
Rising per Capita Income
Mass urbanization
CEMENT CONSUMPTION 2016 (KG/CAPITA)
Rapidly Growing Productive Population
Key Factors Supporting Domestic Cement Consumption
172 42106
113 433
CentralGovt
RegionalGovt
SOEs Private Total
POTENTIAL MARKET
The fourth largest population in the world: 258
millions people (2015)
DEMOGRAPHIC BONUS
1648
1000763
617458 399 262 248 244 163
0
500
1000
1500
2000
Cement Consumption per Capita (kg)
average (ex china) = 459kg
11
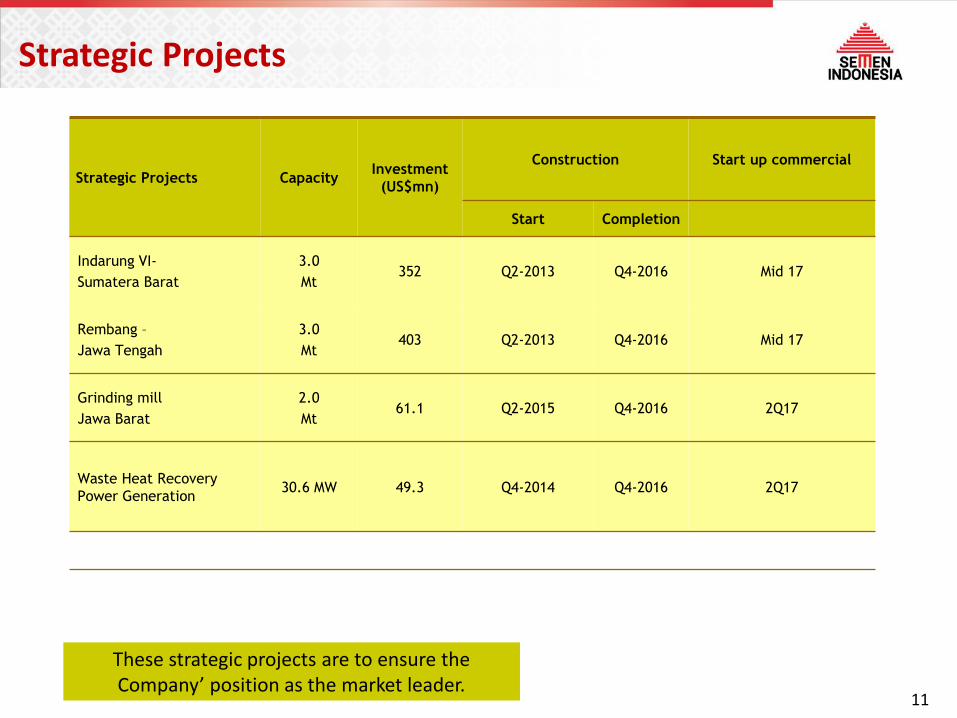
Strategic Projects
These strategic projects are to ensure the Company’ position as the market leader.
Strategic Projects CapacityInvestment
(US$mn)
Construction Start up commercial
Start Completion
Indarung VI-
Sumatera Barat
3.0
Mt352 Q2-2013 Q4-2016 Mid 17
Rembang –
Jawa Tengah
3.0
Mt403 Q2-2013 Q4-2016 Mid 17
Grinding mill
Jawa Barat
2.0
Mt61.1 Q2-2015 Q4-2016 2Q17
Waste Heat Recovery
Power Generation30.6 MW 49.3 Q4-2014 Q4-2016 2Q17
12
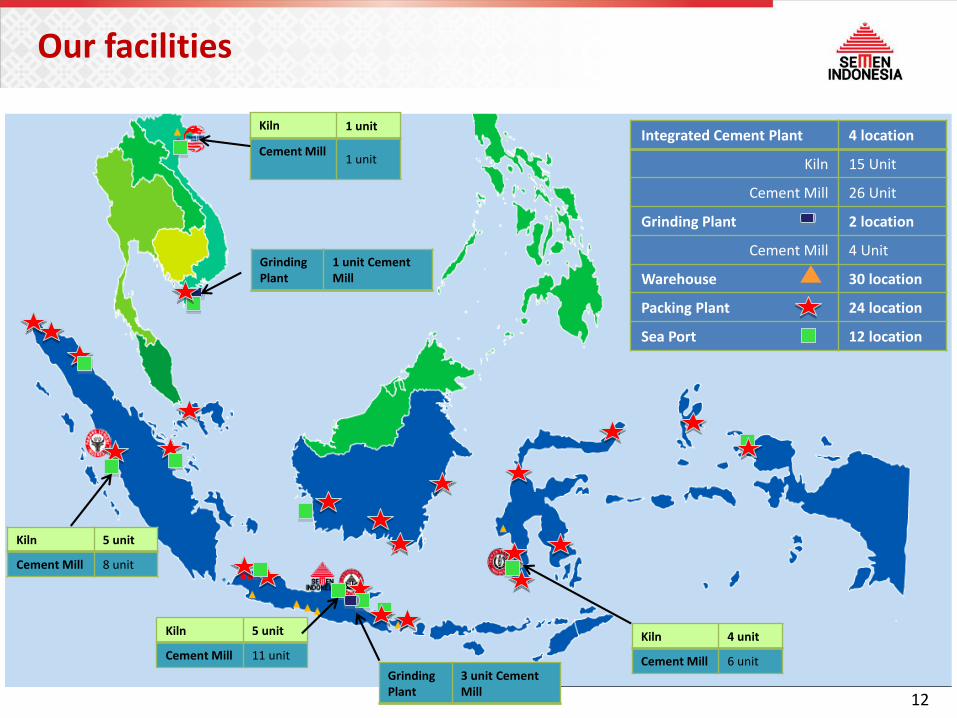
Integrated Cement Plant 4 location
Kiln 15 Unit
Cement Mill 26 Unit
Grinding Plant 2 location
Cement Mill 4 Unit
Warehouse 30 location
Packing Plant 24 location
Sea Port 12 location
Kiln 1 unit
Cement Mill1 unit
Kiln 5 unit
Cement Mill 8 unit
Kiln 5 unit
Cement Mill 11 unit
Grinding Plant
1 unit Cement Mill
Kiln 4 unit
Cement Mill 6 unitGrinding Plant
3 unit Cement Mill
Our facilities
14
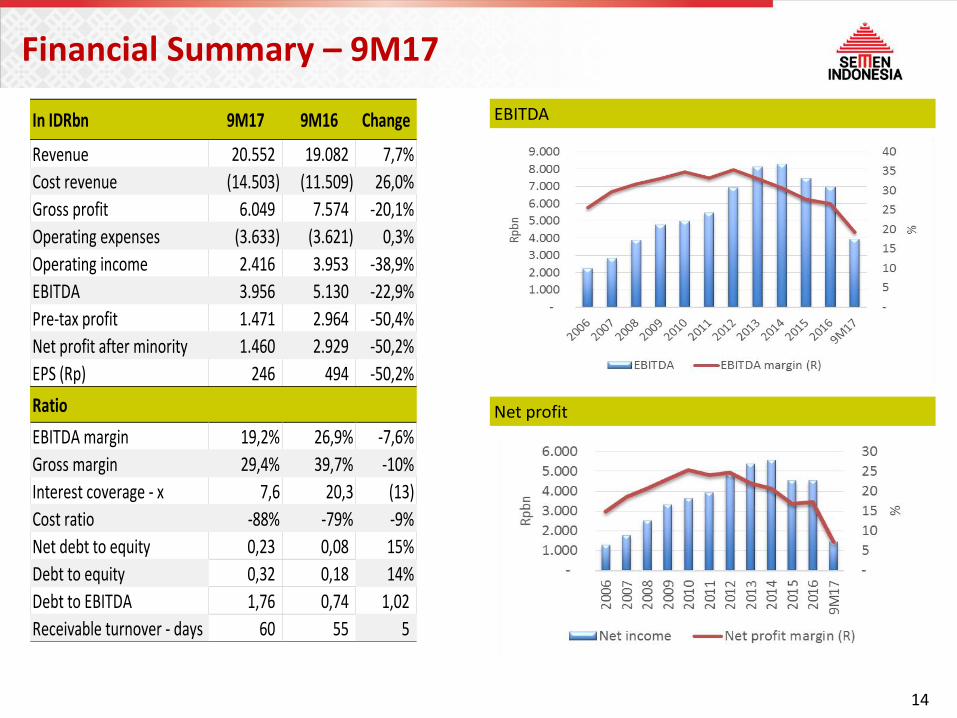
Financial Summary – 9M17
EBITDA
Net profit
In IDRbn 9M17 9M16 Change
Revenue 20.552 19.082 7,7%
Cost revenue (14.503) (11.509) 26,0%
Gross profit 6.049 7.574 -20,1%
Operating expenses (3.633) (3.621) 0,3%
Operating income 2.416 3.953 -38,9%
EBITDA 3.956 5.130 -22,9%
Pre-tax profit 1.471 2.964 -50,4%
Net profit after minority 1.460 2.929 -50,2%
EPS (Rp) 246 494 -50,2%
Ratio
EBITDA margin 19,2% 26,9% -7,6%
Gross margin 29,4% 39,7% -10%
Interest coverage - x 7,6 20,3 (13)
Cost ratio -88% -79% -9%
Net debt to equity 0,23 0,08 15%
Debt to equity 0,32 0,18 14%
Debt to EBITDA 1,76 0,74 1,02
Receivable turnover - days 60 55 5
15
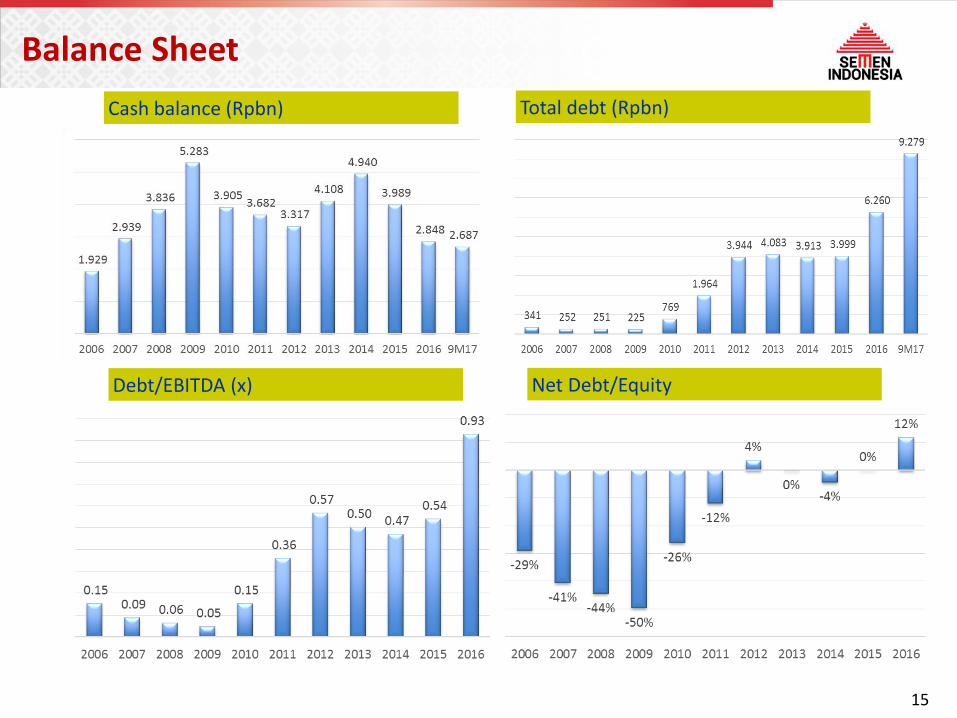
Balance Sheet
Cash balance (Rpbn) Total debt (Rpbn)
Debt/EBITDA (x) Net Debt/Equity
16
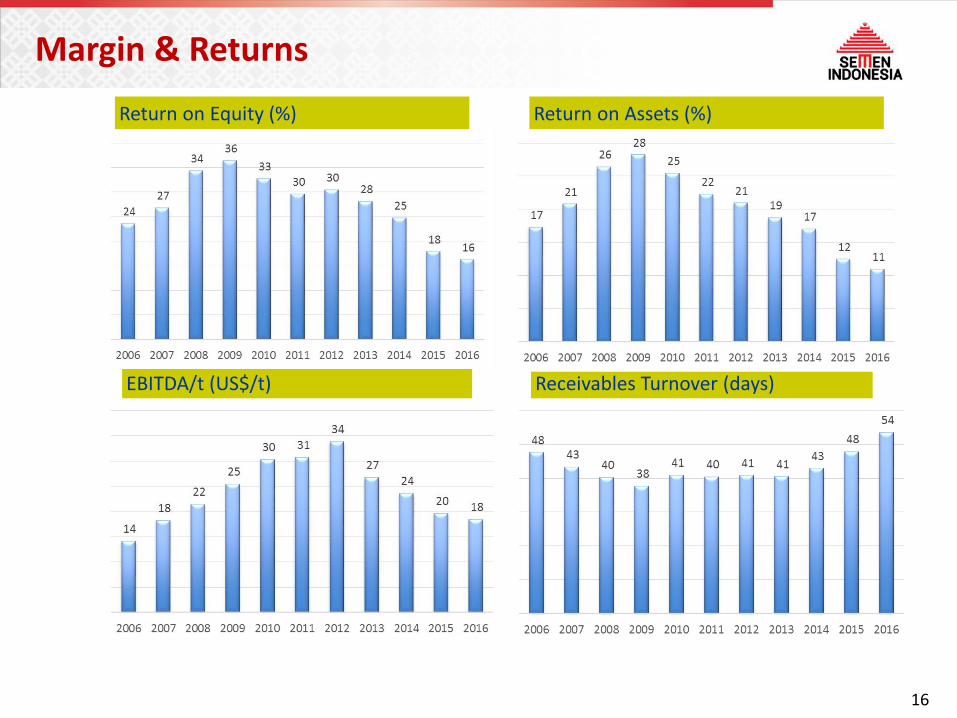
Margin & Returns
Return on Equity (%) Return on Assets (%)
EBITDA/t (US$/t) Receivables Turnover (days)
17
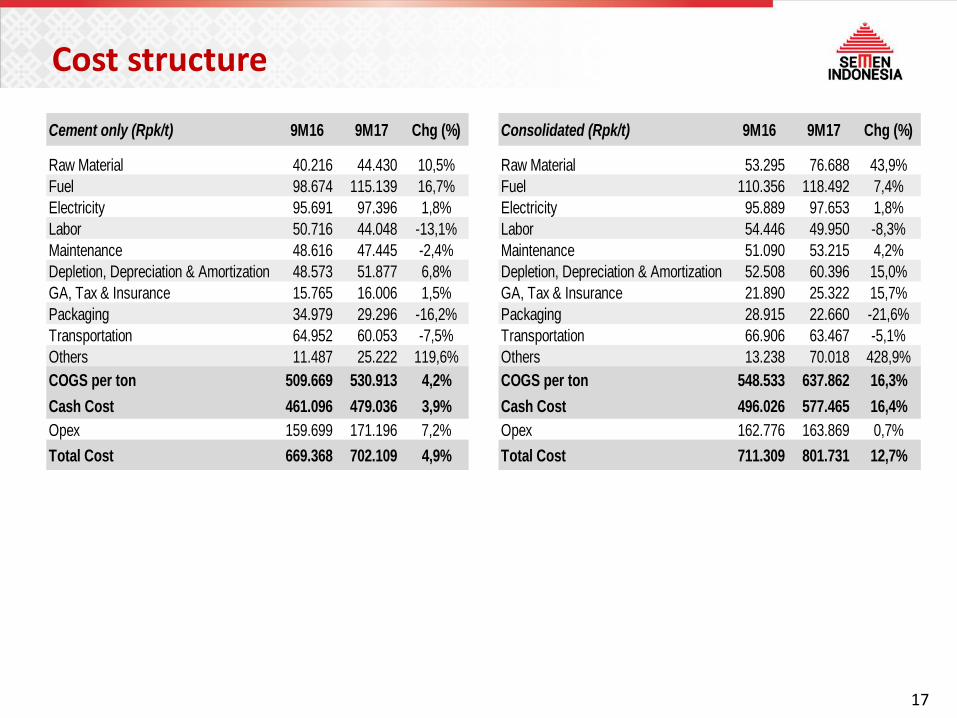
Cost structure
Cement only (Rpk/t) 9M16 9M17 Chg (%) Consolidated (Rpk/t) 9M16 9M17 Chg (%)
Raw Material 40.216 44.430 10,5% Raw Material 53.295 76.688 43,9%
Fuel 98.674 115.139 16,7% Fuel 110.356 118.492 7,4%
Electricity 95.691 97.396 1,8% Electricity 95.889 97.653 1,8%
Labor 50.716 44.048 -13,1% Labor 54.446 49.950 -8,3%
Maintenance 48.616 47.445 -2,4% Maintenance 51.090 53.215 4,2%
Depletion, Depreciation & Amortization 48.573 51.877 6,8% Depletion, Depreciation & Amortization 52.508 60.396 15,0%
GA, Tax & Insurance 15.765 16.006 1,5% GA, Tax & Insurance 21.890 25.322 15,7%
Packaging 34.979 29.296 -16,2% Packaging 28.915 22.660 -21,6%
Transportation 64.952 60.053 -7,5% Transportation 66.906 63.467 -5,1%
Others 11.487 25.222 119,6% Others 13.238 70.018 428,9%
COGS per ton 509.669 530.913 4,2% COGS per ton 548.533 637.862 16,3%
Cash Cost 461.096 479.036 3,9% Cash Cost 496.026 577.465 16,4%
Opex 159.699 171.196 7,2% Opex 162.776 163.869 0,7%
Total Cost 669.368 702.109 4,9% Total Cost 711.309 801.731 12,7%
19
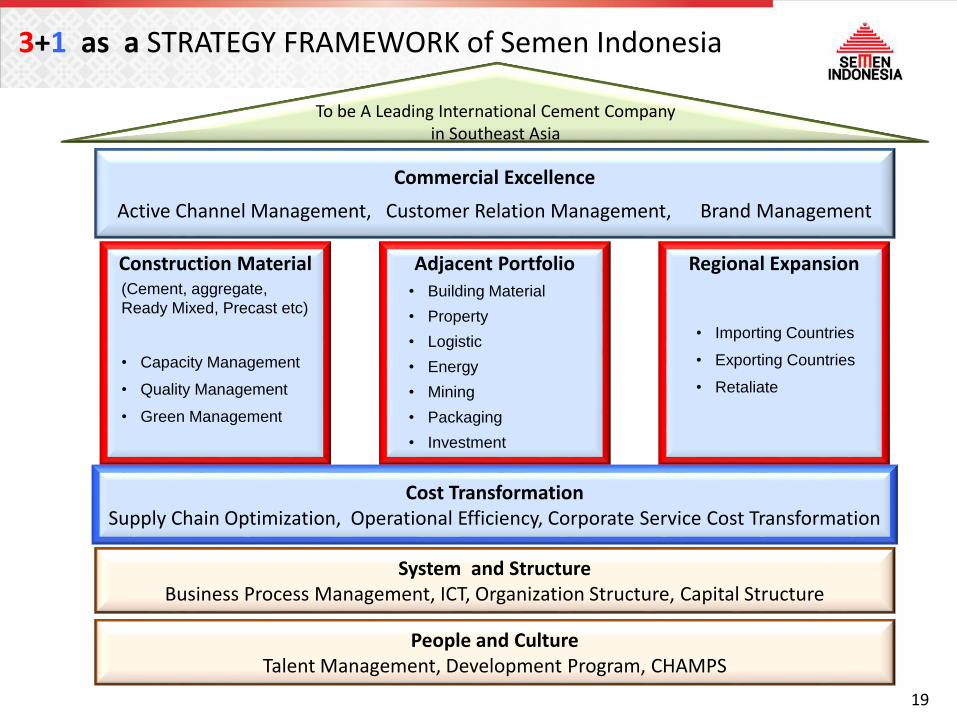
3+1 as a STRATEGY FRAMEWORK of Semen Indonesia
Construction Material Adjacent Portfolio Regional Expansion
Cost TransformationSupply Chain Optimization, Operational Efficiency, Corporate Service Cost Transformation
System and StructureBusiness Process Management, ICT, Organization Structure, Capital Structure
People and CultureTalent Management, Development Program, CHAMPS
To be A Leading International Cement Companyin Southeast Asia
Commercial Excellence
Active Channel Management, Customer Relation Management, Brand Management
• Importing Countries
• Exporting Countries
• Retaliate
• Building Material
• Property
• Logistic
• Energy
• Mining
• Packaging
• Investment
(Cement, aggregate,
Ready Mixed, Precast etc)
• Capacity Management
• Quality Management
• Green Management
20
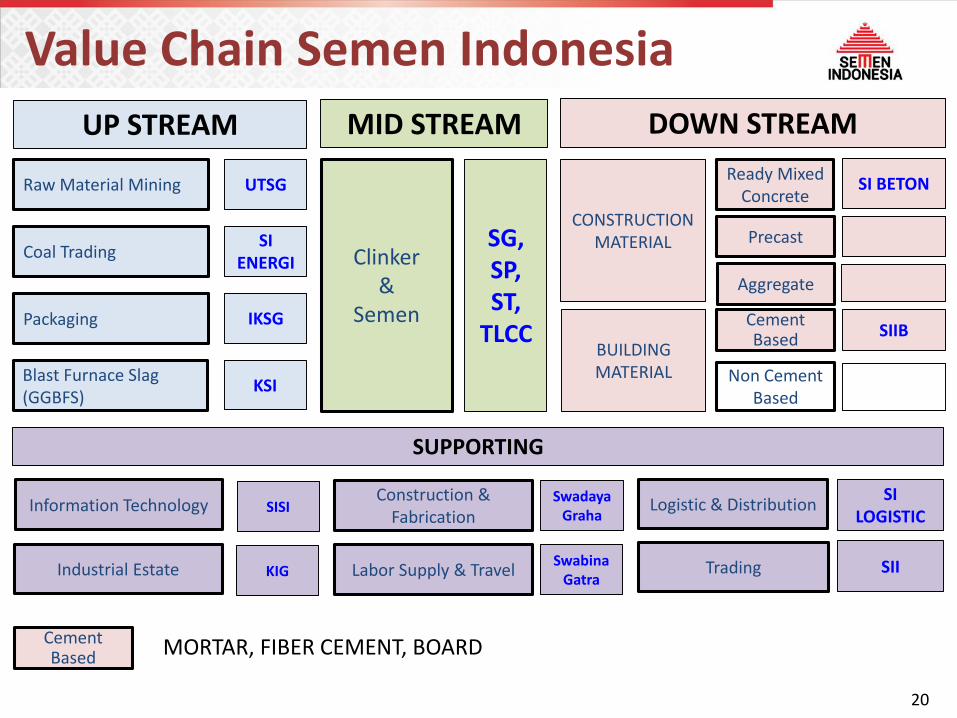
Value Chain Semen Indonesia
UP STREAM MID STREAM DOWN STREAM
Raw Material Mining UTSG
Coal TradingSI
ENERGI
Packaging IKSG
Clinker&
Semen
SG, SP, ST,
TLCC
CONSTRUCTION MATERIAL
SI BETON
Blast Furnace Slag (GGBFS)
KSI
BUILDING MATERIAL
SIIB
SUPPORTING
Logistic & DistributionSI
LOGISTICConstruction &
FabricationSwadaya
GrahaInformation Technology SISI
Labor Supply & TravelSwabina
GatraIndustrial Estate KIG
Ready Mixed Concrete
Precast
Cement Based
Non Cement Based
Aggregate
Trading SII
Cement Based MORTAR, FIBER CEMENT, BOARD
21
IMPORTANT NOTICE
THIS PRESENTATION IS NOT AND DOES NOT CONSTITUTE OR FORM PART OF, AND IS NOT MADE IN CONNECTION WITH, ANY OFFER FOR SALE OR SUBSCRIPTION OF OR SOLICITATION,RECOMMENDATION OR INVITATION OF ANY OFFER TO BUY OR SUBSCRIBE FOR ANY SECURITIES NOR SHALL IT OR ANY PART OF IT FORM THE BASIS OF OR BE RELIED ON IN CONNECTIONWITH ANY CONTRACT, COMMITMENT OR INVESTMENT DECISION WHATSOEVER.
THE SLIDES USED IN THIS PRESENTATION ARE STRICTLY CONFIDENTIAL AND HAVE BEEN PREPARED AS A SUPPORT FOR ORAL DISCUSSIONS ONLY. THE INFORMATION CONTAINED INTHIS PRESENTATION IS BEING PRESENTED TO YOU SOLELY FOR YOUR INFORMATION AND MAY NOT BE REPRODUCED OR REDISTRIBUTED TO ANY OTHER PERSON, IN WHOLE OR INPART.
This presentation includes forward-looking statements, which are based on current expectations and forecast about future events. Such statements involve known / unknown risks uncertainties and other factors,which could cause actual results to differ materially from historical results or those anticipated. Such factors include, among others:
● economic, social and political conditions in Indonesia, and the impact such conditions have on construction and infrastructure spending in Indonesia;
● the effects of competition;
● the effects of changes in laws, regulations, taxation or accounting standards or practices;
● acquisitions, divestitures and various business opportunities that we may pursue;
● changes or volatility in inflation, interest rates and foreign exchange rates;
● accidents, natural disasters or outbreaks of infectious diseases, such as avian influenza, in our markets;
● labor unrest or other similar situations; and
● the outcome of pending or threatened litigation.
We can give no assurance that our expectations will be attained.
DISCLAIMER
The information contained in this report has been taken from sources which we deem reliable. However, none of PT Semen Indonesia (Persero) Tbk and/or its affiliated companies and/or their respective employees and/or agents make any representation or warranty (express or implied) or accepts any responsibility or liability as to, or in relation to, the accuracy or completeness of the information and opinions contained in this report or as to any information contained in this report or any other such information or opinions remaining unchanged after the issue thereof.
We expressly disclaim any responsibility or liability (express or implied) of PT Semen Indonesia (Persero) Tbk, its affiliated companies and their respective employees and agents whatsoever and howsoever arising (including, without limitation for any claim, proceedings, action, suits, losses, expenses, damages or costs) which may be brought against or suffered by any person as a result of acting in reliance upon the whole or any part of the contents of this report and neither PT Semen Indonesia (Persero) Tbk, its affiliated companies or their respective employees or agents accepts liability for any errors, omission or mis-statements, negligent or otherwise, in the report and any liability in respect of the report or any inaccuracy therein or omission therefrom which might otherwise arise is hereby expresses disclaimed.
Thank You
Main Office:
Main Building of Semen GresikJln. Veteran Gresik 61122 – IndonesiaPhone: (62-31) 3981731 -2, 3981745
Fax: (62-31) 3983209, 3972264
Representative Office:
The East Building, 18 floorJl. Lingkar Mega Kuningan Blok E 3.2 No. 1,JAKARTA – 12950Telp.: 021 – 5261174, 5261175; Faks : 021 – 5261176
www.semenindonesia.com