Embed Size (px)
Citation preview
NBER WORKING PAPER SERIES
NOWCASTING AND PLACECASTING ENTREPRENEURIAL QUALITY ANDPERFORMANCE
Jorge GuzmanScott Stern
Working Paper 20954http://www.nber.org/papers/w20954
NATIONAL BUREAU OF ECONOMIC RESEARCH1050 Massachusetts Avenue
Cambridge, MA 02138February 2015
This paper was prepared for the NBER/CRIW Measuring Entrepreneurial Businesses: Current Knowledgeand Challenges conference, Washington, DC, December, 2014. We are thankful to David Audretsch,Pierre Azoulay, Erik Brynjolfsson, Georgina Campbell, Christian Catalini, Iain Cockburn, MercedesDelgado, Catherine Fazio, Joshua Gans, Karen Mills, Fiona Murray, Abhishek Nagaraj, Ramana Nanda,Hal Varian, Ezra Zuckerman, Sam Zyontz, and the conference organizers John Haltiwanger, Erik Hurst,Javier Miranda, and Antoinette Schoar for comments and suggestions. We would also like to thankparticipants in NBER/CRIW pre-conference, the MIT Regional Entrepeneurship Acceleration Program,and seminar participants at the MIT Initiative on the Digital Economy, Micro@Sloan, and the 2014NBER-AIEA Conference, and the 2014 DRUID Meetings. We thank Raymond J. Andrews for hissuperb development of the visualizations in Figures 3, 6, and 8. Carlos Garay provided RA support,and Alex Caracuzzo and MIT Libraries provided important data support. We are thankful to PatrickFennelly and the Massachusetts Corporation Division for their help getting this data. We also acknowledgeand thank the Jean Hammond (1986) and Michael Krasner (1974) Entrepreneurship Fund and the EdwardB. Roberts (1957) Entrepreneurship Fund at MIT for financial support. All errors and omissions areof course our own. The views expressed herein are those of the authors and do not necessarily reflectthe views of the National Bureau of Economic Research.
At least one co-author has disclosed a financial relationship of potential relevance for this research.Further information is available online at http://www.nber.org/papers/w20954.ack
NBER working papers are circulated for discussion and comment purposes. They have not been peer-reviewed or been subject to the review by the NBER Board of Directors that accompanies officialNBER publications.
© 2015 by Jorge Guzman and Scott Stern. All rights reserved. Short sections of text, not to exceedtwo paragraphs, may be quoted without explicit permission provided that full credit, including © notice,is given to the source.
Nowcasting and Placecasting Entrepreneurial Quality and PerformanceJorge Guzman and Scott SternNBER Working Paper No. 20954February 2015JEL No. C43,C51,C81,E27,L25,L26,R12
ABSTRACT
A central challenge in the measurement of entrepreneurship is accounting for the wide variation inentrepreneurial quality across firms. This paper develops a new approach for estimating entrepreneurialquality by linking the probability of a growth outcome (e.g., achieving an IPO or a significant acquisition)as a function of start-up characteristics observable at or near the time of initial business registration(e.g., the firm name or filing for a trademark/patent). Our approach allows us to characterize entrepreneurialquality at an arbitrary level of geographic granularity (placecasting) and in advance of observing theultimate growth outcomes associated with any cohort of start-ups (nowcasting). We implement thisapproach in Massachusetts from 1988-2014, yielding several key findings. First, consistent with Guzmanand Stern (2015), we find that a small number of observable start-up characteristics allow us to distinguishthe potential for a significant growth outcome: in an out-of-sample test, more than 75% of growthoutcomes occur in the top 5% of our estimated quality distribution. Second, we propose two new economicstatistics for the measurement of entrepreneurship: the Entrepreneurship Quality Index (EQI) andthe Regional Entrepreneurship Cohort Potential Index (RECPI). We use these indices to offer a novelcharacterization of changes in entrepreneurial quality across space and time. For example, we areable to document changes in entrepreneurial quality leadership between the Route 128 corridor, Cambridgeand Boston, as well as more granular assessments that allow us to distinguish variation in averageentrepreneurial quality down to the level of individual addresses. Third, we find a high correlationbetween an index that depends only on information directly observable from business registrationrecords (and so can be calculated on a real-time basis) with an index that allows for a two-year lagthat allows the estimate of entrepreneurial quality to incorporate early milestones such as patent ortrademark application or being featured in local newspapers. Finally, we find that the most significant“gap” between our index and the realized growth outcomes of a given cohort seem to be closely relatedto investment cycles: while the most successful cohort of Massachusetts start-ups was founded in1995, the year 2000 cohort registered the highest estimated quality.
Jorge GuzmanMIT Sloan School of Management100 Main Street, E62-343Cambridge, MA [email protected]
Scott SternMIT Sloan School of Management100 Main Street, E62-476Cambridge, MA 02142and [email protected]

3
“When any estimate is examined critically, it becomes evident that the maker, wittingly or unwittingly, has used one or more criteria of productivity. The statistician who supposes that he can make a purely objective estimate of national income, not influenced by preconceptions concerning the ‘facts’, is deluding himself; for whenever he includes one item or excludes another he is implicitly accepting some standard of judgment, his own or that of the compiler of his data. There is no escaping this subjective element in the work, or freeing the results from its effects”.
Simon Kuznets. National Income and its Composition, 1919-1938. Volume I. p. 3. (1941)
A central challenge of economic measurement arises from the inevitable gap between the
theoretical rationale for an economic statistic and the phenomena being measured. Not simply
an abstract concern, the ability to reliably and systematically link economic phenomena closely
linked to productivity or economic growth is central to the ability of policymakers and
researchers to evaluate policy or understand the drivers of economic performance.
These concerns are particularly salient in the measurement of entrepreneurship. Though
entrepreneurship is often cited by economists and policymakers as central to the process of
economic growth and performance (Schumpeter, 1942; Aghion and Howitt, 1992; Davis and
Haltiwanger, 1992), measuring the “type” of entrepreneurship that seems likely to be associated
with overall economic performance has been challenging. While studies of high-performance
ventures primarily rely on samples that select a population of firms that have already achieved
relatively rare milestones such as the receipt of venture capital, broader population studies of
entrepreneurs and small business emphasize the low growth prospects of the average self-
employed individual (Hamilton, 2000; Hurst and Pugsley, 2011). As emphasized by Schoar
(2010) in her synthesis of entrepreneurship on a global basis, there is a gap between the small
4
number of transformative entrepreneurs whose ambition and capabilities are aligned with scaling
a dynamic and growing business and the much more prevalent incidence of subsistence
entrepreneurs whose activities are an (often inferior) substitute to low-wage employment.
It is important to emphasize that, though luck and unobserved ability undoubtedly play an
important role in the entrepreneurial process, the gap in the outcomes and impact of different
ventures also reflect ex ante fundamental differences in the potential of those ventures. While
most “Silicon Valley”-type start-ups fail, their intention at the time of founding is to build a
company with a high level of equity and/or employment growth (and often are premised on
exploiting new technology or serving an entirely new customer segment). At the same time, the
ambition and potential for even a “successful” local business is often quite modest, and might
involve building a firm of a small number of employees and yielding income comparable to that
which would have been earned through wage-based employment. In other words, as emphasized
by Hurst and Pugsley (2010), though policymakers and theory often treat entrepreneurs as a
homogenous group (at least from an ex ante perspective), entrepreneurs seem to be very
heterogeneous in terms of the ambition and potential of their ventures. For the purposes of
measurement, then, it is critical that we not only capture variation in entrepreneurial outcomes
but also develop the capability to measure variation in the quality of entrepreneurial ventures
from the time of founding.
Building on Guzman and Stern (2015), 1 this paper develops a novel approach to the
estimation of entrepreneurial quality that allows us to characterize regional clusters of
1 Guzman and Stern (2015) introduces the distinction between entrepreneurial quality and quantity and the broad methodology in this paper of predicting growth outcomes from start-up characteristics available at or around the time of founding for a population sample of business registrants. At some points in describing the methodology and data, we draw from that paper to accurately describe our procedures and sample. This paper significantly extends and expands upon Guzman and Stern (2015) in several respects, including the formal definition and proposal for two new economic statistics (EQI and RECPI), the inclusion of additional start-up characteristics variables such as media mentions and a

5
entrepreneurship at an arbitrary level of granularity (placecasting), and examine the dynamics of
entrepreneurial quality over time on a near real-time basis (nowcasting). Our approach combines
three interrelated insights. First, because the challenges to reach a growth outcome as a sole
proprietorship are formidable, a practical requirement for any growth-oriented entrepreneur is
business registration (as a corporation, partnership, or limited liability company). We take
advantage of the public nature of business registration records (in this paper, from the state of
Massachusetts from 1988-2014) to define a population sample of entrepreneurs observed at a
similar (and foundational) stage of the entrepreneurial process. Second, moving beyond simple
counts of business registrants (Klapper, Amit, and Guillen, 2010), we are able to measure
characteristics related to entrepreneurial quality at or close to the time of registration. For
example, we can measure start-up characteristics such as whether the founders name the firm
after themselves (eponymy), whether the firm is organized in order to facilitate equity financing
(e.g., registering as a corporation or in Delaware), or whether the firm acquires or develops
measurable innovations (e.g., a patent or trademark). Third, we leverage the fact that, though
rare, we observe meaningful growth outcomes for some firms (e.g., those that achieve an IPO or
high-value acquisition within six years of founding), and are therefore able to estimate the
relationship between these growth outcomes and start-up characteristics.
We apply our approach in the context of Massachusetts from 1988-20142. First, consistent
with Guzman and Stern (2015) (which uses our approach on California data), we find that a
measure for serial founders, extending the method to a second state (Massachusetts), evaluating the dynamics over time at both the state level as well at more granular regional levels, and explicitly comparing an index that can be computed in real-time versus one that incorporates information from early milestones over the first two years of the venture.
2 Our current results depend on a cross section of firms using the locations listed as of November, 2014, rather than their founding location. In a series of tests, we find the probability of changing location to be low – for example, for cohorts from 2008-2012, the probability of changing zip codes is 0.12. We are currently undertaking a data effort to account, to the extent feasible using public data, for the full history of location changes for all firms.
6
small number of characteristics allow us to develop a robust predictive model that distinguishes
firm quality. In an out-of-sample test, we find that 77% of realized growth outcomes occur in
the top 5% of our estimated quality distribution (and nearly 50% in the top 1% of the estimated
quality distribution). Importantly, we find that there is significant benefit in predictive accuracy
from including multiple start-up characteristics (relative to, say, exclusively relating quality to a
single characteristic such as applying for a patent), and, at the same time, the quantitative
significance of different start-up characteristics are roughly similar in our sample here and our
sample of California firms in Guzman and Stern (2015).
We then use these estimates to propose two new economic statistics for the measurement of
entrepreneurship: the Entrepreneurship Quality Index (EQI) and the Regional Entrepreneurship
Cohort Potential Index (RECPI). EQI is a measure of average quality within any given group of
firms, and allows for the calculation of the probability of a growth outcome for a firm within a
specified population of start-ups. RECPI multiples EQI and the number of start-ups within a
given geographical region (e.g., a town or even the state of Massachusetts). Whereas EQI
compares entrepreneurial quality across different groups (and so facilitates apples-to-apples
comparisons across groups of different sizes), RECPI allows the direct calculation of the
expected number of growth outcomes from a given start-up cohort within a given regional
boundary.
We use these indices to offer a novel characterization of changes in entrepreneurial quality
across space and time. We start with an overall assessment of Massachusetts, where RECPI
increased dramatically during the second half of the 1990s, and then falls dramatically in the
wake of the dot-com crash. RECPI then increased by more than 25% from its low in 2003
through 2012. We find that RECPI has predictive power: while there is no meaningful
7
relationship between the pattern of growth outcomes and the number of new firms (i.e., a
measure of quantity), RECPI at the county-year level has a strong quantitative and statistical
relationship with the number of realized growth outcomes.
We then turn to our placecasting applications, where we characterize entrepreneurial
quality at different levels of geographic granularity (but do not directly use information about the
location itself). We document striking variation in the level of average entrepreneurial quality
across different Massachusetts towns: the area around Boston has a much higher average level
of entrepreneurial quality than the rest of the state, and there is striking variation within the
Boston metro area, with Kendall Square, the northeast Route 128 corridor and the Boston
Innovation District registering a very high level of average entrepreneurial quality. Over time,
we document a striking change in entrepreneurial quality leadership as the Route 128 corridor
has ceded EQI leadership to Cambridge. We are also able to offer more granular assessments,
including comparing the areas immediately surrounding MIT / Kendall Square versus Harvard
Square, and illustrating the micro-geography of entrepreneurial quality with an address-level
visualization of the area immediately surrounding MIT.
We then examine the potential for nowcasting entrepreneurial quality, where we evaluate
whether it is possible to make timely entrepreneurial quality predictions in advance of observing
the ultimate growth outcomes associated with any cohort of start-ups. We specifically compare
an index which relies only on start-up characteristics immediately observable at the time of
business registration (name, Delaware registration, etc) with an index that allows for a two-year
lag in order to incorporate early milestones such as patent or trademark application or being
featured in local newspapers. Our results suggest that, though there is information that is

8
gleaned from allowing for a lag, a nowcasted EQI is feasible and closely correlated with a more
patient index.
Finally, we begin to consider the relationship between our measures and issues of
theoretical or policy interest. Specifically, we find that the most significant “gap” between our
index and the realized growth outcomes of a given cohort seem to be closely related to
investment cycles: while the most successful cohort of Massachusetts start-ups was founded in
1995, the year 2000 cohort registered the highest estimated quality. This finding is particularly
important in the light of recent work on capital market cycles, the need for follow-on financing
and innovative entrepreneurship (Nanda and Rhodes-Kropf, 2013; Nanda and Rhodes-Kropf,
2014). Though we are cautious in interpreting our results, our results are consistent with the idea
that an important loss from variation in the level of risk capital financing is the lack of follow-on
investment for precisely the cohort of ventures that actually registered the highest overall
potential impact. More generally, consistent with earlier studies of the concentration of
innovation such as Audretsch and Feldman (1996) and Furman, Porter and Stern (2002), our
findings highlight the idea that, relative to the overall level of entrepreneurial activity,
entrepreneurial quality is highly clustered in both space and time. Uncovering why
entrepreneurial quality is concentrated remains an important topic for future research.
The rest of this paper proceeds as follows. We motivate our approach by discussing the
need for a measure of entrepreneurial quality in Section II, and then present a methodology for
constructing such a measure in Section III. Section IV introduces the data, and Sections V and
VI present our key findings. A final section concludes.
9
II. Why is the Measurement of Entrepreneurial Quality Important?
Our motivation for developing an index of entrepreneurial quality stems from a growing
agreement within entrepreneurship scholars that while new firms seem to have a positive effect
in regional economic growth on average (Davis and Haltiwanger, 1992; Haltiwanger, Jarmin and
Miranda, 2013; Kortum and Lerner, 2000; Glaeser, Kerr, and Kerr, 2014), there is very
significant heterogeneity across firms from the time of their founding, and only a very small
fraction of start-ups seem to be driving the economy-wide benefits from entrepreneurship (Kerr,
Nanda, and Rhodes-Kropf, 2014). As emphasized by Schoar, even if entrepreneurship has a net
positive effect, policy efforts that aim to increase the supply of entrepreneurship without regard
to quality could have a negative economic effect: “I argue that unless we understand the
differences between those two types of entrepreneurs more clearly, many policy interventions
may have unintended consequences and may even have an adverse impact on the economy.”
(Schoar, 2010; also see Hurst and Pugsley, 2010, Lerner, 2010, and Decker, Haltiwanger,
Jarmin, and Miranda, 2014, for further discussion).
While there is increasing understanding of the importance of accounting for
heterogeneity among entrepreneurs in the measurement of entrepreneurship, developing
systematic measures of entrepreneurial quality has been challenging. In the area of
entrepreneurial finance, researchers have often proceeded by simply examining samples of firms
that have reached relatively rare milestones such as venture capital: while this facilitates the
examination of the dynamics of high-potential firms, it nonetheless creates a disconnect between
these small samples of selected firms and the overall population of start-up firms.3 At the same
3 Self selection into the sample can result in a different type of selectivity. For example, the Startup Genome Project is a
10
time, researchers have attempted to use publicly available data to develop specific indices of
entrepreneurship, often at the regional level. Most of these indices have focused either on
measures of entrepreneurial quantity (e.g., the Kauffman Index of Entrepreneurial Activity
measures the rate of start-ups per capita using data from the Current Population Survey, and
work by Leora Klapper and co-authors has provided benchmarking data for the rate of business
registration across countries and time (Klapper, Amit, and Guillen, 2010), or on surveys that
measure entrepreneurial attention, attitudes, or entrepreneurial activity (with the Global
Entrepreneurship Monitor being the most influential and systematic effort based on surveys on a
global basis (see Amoros and Bosma, 2014)). While these efforts have provided significant
insight into the overall rate and attitudes towards entrepreneurial activity, these approaches have
yet to directly address the interplay between the heterogeneity among entrepreneurs and the
process of economic growth. Finally, research exploiting establishment-level data such as the
Longitudinal Business Data (or the more aggregated Business Dynamics Statistics) have been
able to document the role of entrepreneurship in job creation (e.g., emphasizing the importance
of young firms rather than small firms in that process), and also highlighting an observed
reduction in the rate of business dynamism in the United States over time (Haltiwanger, 2012;
Decker, Haltiwanger, Jarmin, and Miranda, 2014; Hathaway and Litan, 2014a). But, as
emphasized by Hathaway and Litan, the challenge in directly incorporating heterogeneity is a
measurement problem: “The problem is that it is very difficult, if not impossible, to know at the
private effort to characterize regional start-ups aiming to address challenges of measuring the nature of start-up activity (Reister, 2014). However, the data they have gathered through self-submission and curated methods is very far from comprehensive. For example, in the Cambridge Innovation Center at 1 Broadway, in Cambridge, MA, Startup Genome identifies only 9 (presumably active) firms at the time of writing, while business registration records show 229 new firms at this address between 2007 and 2012.
11
time of founding whether or not firms are likely to survive and/or grow.” (Hathaway and Litan,
2014b).
Establishing a measurement framework for entrepreneurial quality would not simply be
of interest for policymakers but would also allow for the direct assessment of key questions in
entrepreneurship. For example, while clusters of entrepreneurship such as Silicon Valley or
Boston are associated with a disproportionate share of companies that achieve a meaningful
growth outcome (e.g., an IPO or acquisition), is this due simply to the fact that these areas are
home to higher quality ventures or is there a separate impact of being located in a fertile
entrepreneurial ecosystem? How does the quality of entrepreneurship vary across different types
of founders (e.g., men versus women, or other demographic distinctions)? Finally, how does
entrepreneurial quality vary with investment cycles (i.e., how does the level of entrepreneurial
quality change during an investment boom, and what happens to high-quality entrepreneurial
ventures that are founded just before an investment slowdown)? A measure of entrepreneurial
quality could also be used to evaluate the impact of specific policy changes and programs, and
also evaluate the role of institutions that impact some start-ups but not others. More generally,
systematic measurement of entrepreneurial quality has the potential to serve as a tool for a broad
range of questions relating to the causes and consequences of entrepreneurship.
III. Methodology
Building on this motivation, we now develop a novel methodology for estimating
entrepreneurial quality for a population sample of start-ups at the time of founding, and propose
preliminary candidates for two novel economic statistics to track and evaluate regional
entrepreneurial performance: an Entrepreneurial Quality Index (EQI), a measure of the average
12
quality of new firms, and a Regional Entrepreneurship Cohort Potential Index (RECPI), equal to
the average quality of new firms multiplied by the number of new firms within a given cohort-
region. Our approach combines three interrelated elements: the ability to observe a population
sample of entrepreneurs, a procedure to estimate entrepreneurial quality for each start-up at the
firm level, and a procedure to aggregate across quality into regional indices.
Data Requirements. A first requirement for a timely and granular index of entrepreneurial
quality is an unbiased (ideally population) sample of new firms, and the ability to identify the
quantity and quality of entrepreneurship of new cohorts on a timely basis.4 As discussed further
in the Data section, we exploit publicly available business registration records to satisfy this first
requirement. Since business registration is a practical (and straightforward) requirement for
growth, the sample of business registrants in a given time period composes a meaningful cohort
of start-ups for which one could evaluate quantity (the number of business registrants, or the
number of business registrants of a certain type) as well as quality (by assessing the underlying
quality of each business registrant in a standardized way).
Estimating Entrepreneurial Quality. To assess quality (at any level of granularity), we
must first be able to estimate entrepreneurial quality for any given firm. To do so, we take
advantage of the fact that, both directly within business registration records as well as through
other publicly available data sources (such as the patent and trademark record, the news media,
etc), we are able to potentially observe a set of “start-up characteristics.” The central challenge
is to develop a systematic approach that allows one to rank different start-ups based on these
start-up characteristics. We do so by creating a mapping between a meaningful growth outcome
4 Limiting the sample to firms having achieved a meaningful intermediate outcome (e.g., the receipt of venture capital) will inevitably conflate the process of selection into the intermediate outcome (which itself is likely to be changing over time and location) with the variation in underlying quality of ventures across time and location.

13
(observed of course with a lag) and the characteristics observable at or near the time of founding.
More precisely, for a firm i born in region r at time t, with start-up characteristics , we
observe a growth outcome s years after founding and estimate:
(1)
Using this predictive model, we are able to predict quality as the probability of achieving a
growth outcome given start-up characteristics at birth, and so estimate entrepreneurial quality as
.5 To operationalize this idea, we draw on standard approaches in predictive modeling and
divide our sample into three separate elements: a training sample, a test sample, and a prediction
sample. The training sample is composed of the majority of observations for which we can
observe both start-up characteristics and the growth outcome (i.e., the observable growth sample
ends s years prior to the present) and is the sample we use to estimate (1).6 We are then able to
use the remaining data from the observable growth sample to conduct out-of-sample validation
of our estimates (and of course are able to draw these samples multiple times to evaluate the
robustness of our results to alternative draws of both samples). Finally, we are able to construct
a prediction sample in which we observe start-up characteristics but have not yet observed the
growth outcome. As long as the process by which start-up characteristics map to growth remain
stable over time (an assumption which is itself testable), we are able to then develop an estimate
for entrepreneurial quality even for very recent cohorts. In particular, we can examine the
tradeoff between relying exclusively on start-up characteristics immediately observable at the
time of business registration (which will allow one to create real-time statistics) with estimates
5 While there exist several data mining methods to build a predictive model (including linear regression, binary regression, and neural networks), our methodology uses a logit regression, which performs well in quality of predictions (relative to a linear probability model) while still allowing interpretability of the economic magnitudes and significance of the coefficients for the measures used (Pohlman and Leitner, 2003). 6 We reserve 30% of the sample for which we observe both the growth outcome and start-up characteristics for the test sample.
14
that allow for a lag in order to incorporate early milestones such as patent or trademark
application or being featured in local newspapers.
Calculating an Entrepreneurial Quality Index. To create an index of entrepreneurial
quality for any group of firms (e.g., all the groups within a particular cohort or a group of firms
satisfying a particular condition), we simply take the average quality within that group.
Specifically, in our regional analysis, we define the Entrepreneurial Quality Index (EQI) as an
aggregate of quality at the region-year level by simply estimating the average of over that
region:
(2)
where represents the set of all firms in region r and year t, and represents the number
of firms in that region-year. To ensure that our estimate of entrepreneurial quality for region r
reflects the quality of start-ups in that location rather than simply assuming that start-ups from a
given location are associated with a given level of quality, we exclude any location-specific
measures Xr,t from the vector of observable start-up characteristics.
Three particular features of EQI are notable. First, while the general form of is a
panel format, it is possible to construct a cross-sectional distribution of quality at a moment in
time (i.e., ) to facilitate analyses such as spatial mapping. Second, the level of
geographical aggregation is arbitrary: while the discussion of a “region” may connote a large
geographic area, it is possible to calculate EQI at the level of a city, ZIP code, or even individual
addresses. Finally, we can extend EQI in order to study an arbitrary grouping of firms (i.e., we
do not need to select exclusively on geographic boundaries). For example, we can examine start-
ups whose founder share a common demographic characteristic (e.g., sex), or firms that
undertake a specific strategic action (e.g., engage in crowdfunding).
15
The Regional Entrepreneurship Cohort Potential Index (RECPI). From the perspective
of a given region, the overall potential for a cohort of start-ups requires combining both the
quality of entrepreneurship in a region and the number of firms in such region (a measure of
quantity). To do so, we define RECPI as simply multiplied by the number of firms in that
region-year:
(3)
Since our index multiplies the average probability of a firm in a region-year to achieve
growth (quality) by the number of firms, it is, by definition, the expected number of growth
events from a region-year given the start-up characteristics of a cohort at birth. Under the
assumption of excluding regional effects (e.g., agglomeration economies) or time-based effects
(e.g., changes in available financing), our index can be interpreted as a measure of the
“potential” of a region given the “intrinsic” quality of firms at birth, which can then be affected
by the impact of the entrepreneurial ecosystem, or shocks to the economy and the cohort between
the time of founding and a growth outcome.
Assessing the Merit of our Quality Estimates. Our methodology estimates the quality of
new firms through a predictive model of probability of achieving a growth outcome, and as such
the predictive accuracy of the model must be evaluated before relying on its estimates to draw
economic inference. Specifically, given concerns about the potential for over-fitting (Taddy,
2013), we reserve 30% of the observable growth outcome sample in order to conduct out-of-
sample validation. In particular, we conduct the analysis multiple times to evaluate the
robustness of our estimates to the sample from which it is drawn, and also plot the share of
realized outcomes (in the test sample) associated with different percentiles of our estimated

16
quality distribution. Robustness of the coefficients to different samples, and a model with
strong predictive accuracy in out-of-sample testing are stronger candidates as economic statistics.
IV. Data
As mentioned earlier, our analysis leverages publicly available business registration
records, a potentially rich and systematic data for entrepreneurship and business dynamics.
Business registration records are public records created when individuals register a business.
This analysis focuses on the state of Massachusetts from 1988-2014 (see Appendix I for a short
description and discussion of these records). During the time of our sample, it was possible to
register several types of businesses: corporations, limited liability companies, limited liability
partnerships, and general partnerships. While it is possible to found a new business without
business registration (e.g., a sole proprietorship), the benefits of registration are substantial,
including limited liability, protection of the entrepreneur’s personal assets, various tax benefits,
the ability to issue and trade ownership shares, credibility with potential customers, and the
ability to deduct expenses. Furthermore, all corporations, partnerships, and limited liability must
register with the state in order to take advantage of these benefits: the act of registering the firm
triggers the legal creation of the company. As such, these records form the population of
Massachusetts businesses that take a form that is a practical prerequisite for growth.7
Concretely, our analysis draws on the complete population of firms satisfying one of the
following conditions: (a) a for-profit firm whose jurisdiction is in Massachusetts or (b) a for-
7 This section draws on Guzman and Stern (2015), where we introduce the use of business registration records in the context of entrepreneurial quality estimation.
17
profit firm whose jurisdiction is in Delaware but whose principal office address is in
Massachusetts. In other words, our analysis excluded non-profit organizations as well as
companies whose primary location is external to Massachusetts. Applied over the years 1988-
2014, the resulting dataset is composed of 541,666 observations8 . For each observation we
construct variables related to (a) the growth outcome for each start-up, (b) start-up characteristics
based on business registration observables and (c) start-up characteristics based on external
observables that can be linked directly to the startup. Table 1 reports the summary statistics,
both for the overall sample (divided out by our estimation and prediction sample periods) and
conditional on whether the firm achieved a growth outcome or not.
Growth. The growth outcome utilized in this paper, Growth, is a dummy variable equal to
1 if the startup achieves an initial public offering (IPO) or is acquired at a meaningful positive
valuation within 6 years of registration9. Both outcomes are drawn from Thomson Reuters SDC
Platinum.10 We observe 462 positive growth outcomes for the 1988-2005 startup cohorts (used
in all our regressions), yielding a mean of Growth of 0.0014. The median acquisition price is $77
million (ranging from a minimum of $11.9 million at the 5th percentile to $1.92 billion at the 95th
percentile).11
8 The number of firm births in our sample is substantially higher than the US Census Longitudinal Business Database
(LBD), done from tax records. For Massachusetts in the period 2003-2012, the LBD records an average of 9,450 new firms per year and we record an average of 24,066 firm registrations. While the reasons for this difference are still to be explored, there are at least two reasons which we expect will be in part causing this difference: (i) partnerships and LLCs who do not have income during the year do not file a tax returns and are thus not included in the LBD, and (ii) firms that have zero employees are not included in the LBD.
9 Our results are robust to changes in the time allowed for a firm to achieve growth. See Guzman and Stern (2015, Supplementary Materials) for a subset of those robustness tests. 10 While the coverage of IPOs is likely to be nearly comprehensive, the SDC dataset excludes some acquisitions. However, though the coverage of significant acquisitions is not universal in the SDC dataset, previous studies have “audited” the SDC data to estimate its reliability, finding a nearly 95% accuracy (Barnes et al, 2014). 11 In our main results, we assign acquisitions with an unrecorded acquisitions price as a positive growth outcome, since an evaluation of those deals suggests that most reported acquisitions were likely in excess of $5 million. All results are robust to the assignment of these acquisitions as equal to a growth outcome.
18
Start-Up Characteristics. The core of the empirical approach is to map growth outcomes
to observable characteristics of start-ups at or near the time of business registration. We develop
two types of measures: (a) measures based on business registration observables, and (b)
measures based on external indicators of start-up quality that are observable at or near the time of
business registration. We review each of these in turn.
Measures Based on Business Registration Observables. We construct ten measures based
on information observable in the business registration records. Four are measures that we
anticipate are associated with firm potential, four are dummy variables based on the industry
cluster most closely linked to the start-up, and two are associated with measures of serial
entrepreneurship to capture the underlying quality of the founder.
We first create two binary measures that relate to how the firm is registered, Corporation,
whether the firm is a corporation rather than an LLC or partnership, and Delaware Jurisdiction,
whether the firm is registered in Delaware. Corporation is an indicator equal to 1 if the firm is
registered as a corporation and 0 if it is registered either as an LLC or partnership.12 In the period
of 1988 to 2005, 0.19% of corporations achieve a growth outcome versus only 0.03% of non-
corporations.13 Delaware jurisdiction is equal to 1 if the firm is registered under Delaware, but
has its main office in Massachusetts (all other foreign firms are dropped before analysis).
Delaware jurisdiction is favorable for firms which, due to more complex operations, require
more certainty in corporate law, but it is associated with extra costs and time to establish and
maintain two registrations. Between 1988 and 2005, 5.8% of the sample registers in Delaware;
74% of firms achieving a growth outcome do so. 12 Previous research highlights performance differences between incorporated and unincorporated entrepreneurs (Levine and Rubinstein, 2014). 13 It is important to note that the share of corporations in Massachusetts has moved dramatically after limited liability companies where introduced in 1995, from around 92% in 1994, to 36% in 2013.
19
We then create two additional measures based directly on the name of the firm. Drawing
on the recent work of Belenzon, Chatterji, and Daley (2014) (BCD), we use the firm and founder
name to establish whether the firm name is eponymous (i.e., named after one or more of the
founders). Eponymy is equal to 1 if the first, middle, or last name of the top managers is part of
the name of the firm itself.14,15 15% of the firms in our training sample are eponymous (an
incidence rate similar to BCD), though only 1.08% for whom Growth equals one. It is useful to
note that, while we draw on BCD to develop the role of eponymy as a useful start-up
characteristic, our hypothesis is somewhat different than BCD: we hypothesize that eponymous
firms are likely to be associated with lower entrepreneurial quality. Whereas BCD evaluates
whether serial entrepreneurs are more likely to invest and grow companies which they name after
themselves, we focus on the cross-sectional difference between firms with broad aspirations for
growth (and so likely avoid naming the firm after the founders) versus less ambitious enterprises,
such as family-owned “lifestyle” businesses.
Our second measure relates to the length of the firm name. Based on our review of
naming patterns of growth-oriented start-ups versus the full business registration database, a
striking feature of growth-oriented firms is that the vast majority of their names are at most two
words (plus perhaps one additional word to capture organizational form (e.g., “Inc.”)).
Companies such as Akamai or Biogen have sharp and distinctive names, whereas more
traditional businesses often have long and descriptive names (e.g., “New England Commercial
Realty Advisors, Inc.”). We define Short Name to be equal to one if the entire firm name has
14 We consider the top manager any individual with one of the following titles: President, CEO, or Manager. 15 We require names be at least four characters to reduce the likelihood of making errors from short names. Our results are robust to variations of the precise calculation of eponymy (e.g., names with a higher or lower number of minimum letters).

20
three of less words, and zero otherwise. 47% of firms within the 1988-2005 period have a short
name, but the incidence rate among growth firms is more than 80%.16
We then create four measures based on how the firm name reflects the industry or sector
that the firm within which the firm is operating. To do so, we take advantage of two features of
the US Cluster Mapping Project (Delgado, Porter, and Stern, 2015), which categorizes industries
into (a) whether that industry is primarily local (demand is primarily within the region) versus
traded (demand is across regions) and (b) among traded industries, a set of 51 traded clusters of
industries that share complementarities and linkages. We augment the classification scheme
from the US Cluster Mapping Project with the complete list of firm names and industry
classifications contained in Reference USA, a business directory containing more than 10 million
firm names and industry codes for companies across the United States. Using a random sample
of 1.5 million Reference USA records, we create two indices for every word ever used in a firm
name. The first of these indices measures the degree of localness, and is defined as the relative
incidence of that word in firm names that are in local versus non-local industries (i.e.,
). We then define a list of Top Local Words, defined as those
words that are (a) within the top quartile of and (b) have an overall rate of incidence greater
than 0.01% within the population of firms in local industries (see Guzman and Stern, (2015,
Table S10) for the complete list). Finally, we define local to be equal to one for firms that have
at least one of the Top Local Words in their name, and zero otherwise. We then undertake a
similar exercise for the degree to which a firm name is associated with a traded name. It is
16 We have also investigated a number of other variants (allowing more or less words, evaluating whether the name is “distinctive” (in the sense of being both non-eponymous and also not an English word). While these are promising areas for future research, we found that the three-word binary variable provides a useful measure for distinguishing entrepreneurial quality.

21
important to note that there are firms which we cannot associate either with traded or local and
thus leave out as a third category. Just more than 15% of firms have local names, though only
3.7% of firms for whom growth equals one, and while 53% of firms are associated with the
traded sector, 57% of firms for whom growth equals one do.
We additionally examine the type of traded cluster a firm is associated with, focusing in
particular on whether the firm is in a high-technology cluster or a cluster associated with
resource intensive industries. For our high technology cluster group (Traded High Technology),
we draw on firm names from industries include in ten USCMP clusters: Aerospace Vehicles,
Analytical Instruments, Biopharmaceuticals, Downstream Chemical, Information Technology,
Medical Devices, Metalworking Technology, Plastics, Production Technology and Heavy
Machinery, and Upstream Chemical. From 1988 to 2005, while only 5.6% firms are associated
with high technology, this rate increases to 20% within firms that achieve our growth outcome.
For our resource intensive cluster group, we draw on firms names from fourteen USCMP
clusters: Agricultural Inputs and Services, Coal Mining, Downstream Metal Products, Electric
Power Generation and Transmission, Fishing and Fishing Products, Food Processing and
Manufacturing, Jewelry and Precious Metals, Lighting and Electrical Equipment, Livestock
Processing, Metal Mining, Nonmetal Mining, Oil and Gas Production and Transportation,
Tobacco, Upstream Metal Manufacturing. While 14% of firms are associated with resource
intensive industries, the rate drops to 8% amongst growth firms.
Finally, we sought to develop measures that would link entrepreneurial quality to the
quality and potential of the firm founders. Specifically, we construct two measures based on
whether the individuals connected to the firm have been associated with start-up activity in the
past. Repeat Entrepreneurship, equals 1 if the president, CEO, or manager of a firm is also listed

22
as a president, CEO, or manager in a deceased firm that became inactive before the current firm
was registered. To guarantee we match the same individual we require an exact match on both
name and address. We then interact Repeat Entrepreneurship with the High Tech cluster dummy
to create High Tech. Repeat Entrepreneurship, a measure of serial entrepreneurship in high
technology start-ups.17
Measures based on External Observables. We construct two measures related to start-up
quality based on information in intellectual property data sources and one measure related to
media presence close to birth.18
Building on prior research matching business names to intellectual property
(Balasubramanian and Sivadasan, 2009; Kerr and Fu, 2008), we rely on a name-matching
algorithm connecting the firms in the business registration data to external data sources.
Importantly, since we match only on firms located in Massachusetts, and since firms names
legally must be “unique” within each state’s company registrar, we are able to have a reasonable
level of confidence that any “exact match” by a matching procedure has indeed matched the
same firm across two databases. Our main results use “exact name matching” rather than “fuzzy
matching”; in small-scale tests using a fuzzy matching approach (the Levenshtein edit distance
(Levenshtein, 1965)), we found that fuzzy matching yielded a high rate of false positives due to
the prevalence of similarly named but distinct firms (e.g., Capital Bank v. Capitol Bank,
Pacificorp Inc v. Pacificare Inc.).19
17 While we only use these two founder measures in this paper, we have explored other measures including estimating gender and ethnicity and plan to investigate these types of social and demographic variables in future work. 18 While this paper only measures external observables related to intellectual property and media, our approach can be utilized to measure other externally observable characteristics that may be related to entrepreneurial quality (e.g., measures related to the quality of the founding team listed in the business registration (e.g., through LinkedIn profiles), or measures of early investments in scale (e.g., a web presence)).
19 Our matching algorithm works in three steps. (1) First, we clean the firm name by: (a) expanding 8 common abbreviations (“Ctr.”, “Svc.”, “Co.”, “Inc.”, “Corp.”, “Univ.”, “Dept.”, “LLC.”) in a consistent way (e.g., “Corp.” to
23
We construct two measures related to start-up quality based on intellectual property data
sources from the U.S. Patent and Trademark Office. Patent is equal to 1 if a firm holds a patent
application within the first year and 0 otherwise. We include patents that are filed by the firm
within the first year of registration and patents that are assigned to the firm within the first year
from another entity (e.g., an inventor or another firm). While only 0.6% of the firms
Massachusetts have a patent application, 7.2% of growth firms do. Our second measure,
Trademark, is equal to 1 if a firm applies for a trademark within the first year of registration.
While only 0.2% of firms have a trademark 3.7% of growth firms do.
Finally, we construct a measure based on the firm’s presence in media outlets. Media
Mentions is equal to 1 if a firm has a news story with its name in the business section of the
Boston Globe, within a year of its founding date. To do so, we search for all firms names in the
historical records of the Boston Globe allowing a one year window before and after the founding
date and finding those that have articles on the business section.20 While we can identify an
early media mention for only 0.14% of firms, this number increases to 3.6% when considering
growth firms.21
“Corporation”); (b) removing the word “the” from all names; (c) replacing “associates” for “associate”; and (d) deleting the following special characters from the name: . | ’ ” - @ _ . Second, we create three variables that hold (a) the organization type (e.g., Corporation, Incorporated, Limited Liability Company), (b) the firm name without the organization type, and (c) the firm name without the organization type and without spaces. Finally, we proceed to do the actual matching of data sets. First on firm name and organization type, then only on name, and finally on collapsed name. Our companion paper contains further tests on the name matching procedure and all our scripts are available in the online appendix. 20 We identify articles in the business section by using the journalist name and only keeping those that often report business-related news. 21 While this result might lead to some bias due to the geographic nature of the Boston Globe, the state of Massachusetts is sufficiently small that we expect high potential firms to be mentioned in the Boston Globe regardless of specific locations. Furthermore, all of our results are robust to excluding this measure.
24
V. Estimating Entrepreneurial Quality and Performance
We undertake our analysis in several stages. First, we examine the relationship between our
growth outcome and various start-up characteristics, identifying a candidate set of start-up
characteristics from which to estimate entrepreneurial quality, and evaluate the performance of
our estimator in an out-of-sample test. We then turn to the calculation of our two proposed
indices, EQI and RECPI, implement and evaluate our key placecasting and nowcasting
applications, and consider the overall performance of our estimator and indices as well as the
interpretation of our results in the context of the broader literature.
We begin in Table 2 with a series of univariate logit regressions of Growth on each of our
measured start-up characteristics. As mentioned earlier, these regressions (and all subsequent
regressions) are conducted on a random 70% training sample of the complete 1988-2005 dataset,
reserving 30% of the 1988-2005 data as a test sample. To facilitate the interpretation of our
results, we present the results in terms of the odds-ratio coefficient and the pseudo-R2.
These univariate results are suggestive. Various simple measures directly captured from the
registration record (such as whether the firm is a Corporation or registered in Delaware, or is
named after the founder or using less than two words) are each highly significant and associated
with a large increase in the probability that a given firm achieves a growth outcome. For
example, corporations are associated with a more than 5X increase in the probability of growth,
and those that register in Delaware are associated with more than a 40X increase in the
probability of growth. Conversely, firms named after their founders have only a 5% chance of a
growth outcome relative to those with a non-eponymous name. Equally intriguing results are
associated with measures of the degree of innovativeness and novelty of the start-up: Patent is

25
associated with nearly a 60X increase in the probability of growth, and Trademark and
Mentioned in Boston Globe are each associated with more than a 30X increase in the probability
of growth. Importantly, not all candidate measures are associated with a meaningful statistical
relationship: both of our founder measures are associated with much smaller and statistically
insignificant effects on the probability of growth.
It is of course important to emphasize that each of these coefficients must be interpreted with
care. While we are capturing start-up characteristics that are associated with growth, we are not
claiming a causal relationship between the two: if a firm with low growth potential changes its
legal jurisdiction to Delaware that is unlikely to have any impact on its overall growth
prospects. 22 Instead, Delaware registration is an informative signal, based on the fact that
external investors often prefer to invest in firms governed under Delaware law, of the ambition
and potential of the start-up, as observed at the time of business registration. Reliance on a
univariate measure makes inference particularly tricky: in isolation, one cannot evaluate whether
any particular start-up characteristic is more or less important than others.
We therefore proceed in Table 3 to consider these effects in tandem. We begin by
simply examining the impact of three measures directly observable from the business registration
record: Corporation, Short Name, and Eponymous. Each are statistically and quantitatively
significant: while corporations and short names are each associated with a more than 4X
22 One important concern in policy applications of this methodology, is that our measures might change incentives of
firms, such that they try to “game” the result by select into high-quality measures they previously did not care about (e.g. changing its name form long to short). We note that this possibility, though real, is bounded by the incentives of the founders. For example, it is unlikely that a founder with no intention to grow would incur the significant yearly expense require to keep a registration in Delaware (which we estimate around $1000). Similarly, firms that signal in their name being a local business (e.g. “Taqueria”) are unlikely to change their names in ways that affect their ability to attract customers. Finally, we also note that any effects from “gaming” would be short-lived since, as low quality firms select into a specific measure the correlation between such measure and growth – and therefore the weight our prediction model would assign to it – weakens.
26
increase in the probability of growth, eponymy reduces the probability of growth by nearly 95%.
When we introduce cluster dummies in (2), the results for these business registration measures
remains similar; at the same time, the results suggest that businesses whose names are associated
with a traded high technology cluster are more than 3X more likely to grow and local businesses
register a 64% growth probability penalty. In (3), the inclusion of a dummy for whether the firm
registers in Delaware has several effects. First, and most importantly, Delaware registration is
associated with more than 40X increase in the probability of growth (we once again caution that
this effect is not causal but instead helps identify firms whose underlying potential both makes
them more likely to register in Delaware and more likely to realize a growth outcome). At the
same time, the inclusion of the Delaware dummy reduces the measured penalty associated with
eponymy and being associated with a local business name, and reduces the boost associated with
being in a high technology cluster. Interestingly, the pseudo-R2 increases from 11% to 31%
with the inclusion of the Delaware dummy. The specification in (3) is particularly interesting
since these data rely only on information directly observable from the registration record, and so
in principle can be observed on a nearly real-time basis for the purposes of a nowcasting version
of EQI.
In (4), we move towards incorporating measures that capture key early milestone
achievements for a start-up that might serve as informative signals for their likelihood of
entrepreneurial success. Events such as the assignment of a patent, a patent or trademark
application, or mention in the media can only occur once the venture has been launched, but
might occur in a timely enough manner to still provide information for the purposes of
entrepreneurial quality estimation (particularly for EQI applications in which we would like to
examine particular regions and places on an historical basis). Model 4 includes two measures of

27
intellectual property. Since the patent and Delaware indicators are highly correlated (62% of
patenting firms are also registered in Delaware), we separate the effect into distinct interaction
components. Having a patent increases the likelihood of growth 40 times, and Delaware firms
are 40 times more likely to achieve growth. Interestingly, the combined effect (131.9) is smaller
than the joint product of the individual effects. Finally, a firm with an early trademark is more
than 3 times more likely to grow. Importantly, the business registration coefficients remain
similar in magnitude and statistical significance to the results in (3). Model 5 includes one
additional measure, Mentioned in Boston Globe, which captures whether the start-up was
mentioned in the business section of the primary Massachusetts newspaper within the first year
after registration. Media is associated with more than a 5X increase in the probability of
growth, and the coefficients associated with the other variables remains similar.
Finally, (6) and (7) include two measures to capture the impact of serial entrepreneurship
– one based on whether at least one of the founders has ever been associated with a
Massachusetts start-up before and the other interacting that measure with our high-technology
cluster variable. Though the direction of each of these measures is as predicted, neither is
significant nor large (relative to many of the other coefficients in these regressions). We should
emphasize that, since we require that the serial entrepreneur maintains their address between the
two ventures, we may be not yet capturing and tracking serial entrepreneurship in a meaningful
way. Identifying more precise and nuanced information from founders is an important agenda
for future research using this methodology.
Overall, these regressions offer striking indicators of the relationship between observable
start-up characteristics and the realization of growth. There is dramatic variation in the estimated
probability of growth for individual firms. For example, using the estimates from (5), comparing

28
the growth probability of a Delaware corporation with a patent and trademark (116.3 * 3.4 * 7.9)
to a Massachusetts LLC without intellectual property yields an odds-ratio of 3097:1. 23
Importantly, the overall results accord well with Guzman and Stern (2015), which uses the same
methodology on California data: if supported by further evidence from other states and
jurisdictions going forward, the stable nature of the markers of entrepreneurial quality provide an
important foundation for the creation of robust economic statistics in this area.
Candidate Specification Choice and Evaluation. Before turning to the calculation of our
indices and exploration of our nowcasting and placecasting applications, we first investigate
whether it is possible to identify a preferred benchmark candidate specification that we can use
as our basis for entrepreneurial quality estimation going forward. To do so, we first compare
models that include or exclude specific sets of regressors using a standard likelihood ratio test.
Specifically, in each row of Table 4, we compare the likelihood function (as well as differences
in pseudo-R2 (McFadden, 1974)) between two models, one of which (M) is nested in the other
(N). For the first five rows (where we introduce different combinations of restricted and
unrestricted specifications), we can reject the null hypothesis associated with the restricted
model. In other words, regardless of which variables we include first, we find significant
explanatory effects from the Media, IP, and full range of Business Registration measures.
However, regardless of specification, we find no robust effects associated with our founder
measures. As such, for the remainder of our analysis, we adopt (3-5) as our preferred
specification in evaluating our estimator.
23 More dramatically, at the (near) extreme, comparing the growth probability of a Delaware corporation with a patent (7.8 * 116.3), trademark (3.4), media mention (5.7) and non-eponymous short name (6.9 * 2.4) with an eponymous partnership or LLC with a long name but no intellectual property or media mentions, the odds-ratio is 295,115 to one!
29
We then evaluate our estimates using the 30% test sample of observations which have not
been used in the estimation but for which we observe both the growth outcome and start-up
characteristics. In particular, using only data from the test sample (but relying on the estimates
from (3-5) to estimate entrepreneurial quality), Figure 1 presents the relationship between the
distribution of realized growth events versus the distribution of firm-level entrepreneurial
quality. The results are striking. 77% of all growth firms are in the top 5% of our estimated
growth probability distribution, and 49% are within the top 1% (interestingly, these results are
extremely similar to the findings for California from Guzman and Stern (2015)). To be clear,
growth is still a relatively rare event even among the elite: the average firm within the top 1% of
estimated entrepreneurial quality has only a 14% chance of realizing a growth outcome.
As well, we evaluate whether our results are driven by the particular sample which was
drawn for the training sample. This is particularly relevant as growth is rare in our dataset (only
462, or 0.14%) and several of our measures are also relatively rare (e.g., less than one per cent of
all firms patent or receive a trademark). To evaluate whether our sampling matters, we repeat
the process of separating out the sample into a training and test sample 100 times, implement (3-
5) with each draw to estimate entrepreneurial quality for each firm in that draw’s test sample,
and then calculate a test statistic which is equal to the number of realized growth outcomes in the
test sample which we estimate to be in the top 5% of the estimated quality distribution. Relative
to our baseline sample result of 77%, the mean of this test statistic is 79% (with a 95%
confidence interval between 73% and 84%). At least within the overall Massachusetts sample in
this paper, our estimates of entrepreneurial quality are robust to the sample that we draw.
VI. Calculating Entrepreneurial Quality and Performance Indices
30
We now turn to the centerpiece of our analysis: the calculation of EQI and RECPI at
different levels of geographic agglomeration and across time in order to evaluate a number of
different placecasting and nowcasting applications. We now incorporate the full sample of
Massachusetts firms from 1988 through 2012, and so include the part of the prediction sample
for which we can observe the full set of start-up characteristics (recall that our baseline candidate
(3-5) involves a two-year lag between founding date and the incorporation of early patenting,
trademark, and media data).
We begin with the calculation of RECPI for the state of Massachusetts for each year
between 1988 and 2012. In Figures 2(A) and 2(B), we compare the realized level of growth
events (per start-up cohort) with two different entrepreneurship indices: a simple measure of
entrepreneurial quantity (the number of newly registered businesses for that cohort) versus
RECPI which scales the number of registered businesses by the EQI for those businesses for
each cohort year. While there appears to be no correlation between the realized growth events
from a cohort and entrepreneurial quantity, there is a much closer relationship with RECPI,
where we are incorporating entrepreneurial quality. RECPI grows at a rapid rate from 1991-
2000 (with a very large spike in 1999-2000) and then falls dramatically (along with the realized
level of exits between 2001-2004). From 2004-2012, Massachusetts RECPI has increased by
approximately 17%. Intriguingly, as we discuss in the Conclusion (and consistent with the
emphasis on investment cycles and start-up dynamics by Nanda and Rhodes-Kropf (2013)), the
notable divergence between realized growth events and RECPI is coincident with the rapid rise
and collapse of the early-stage risk capital market in the late 1990s: realized growth events were
much “higher” than predicted for the 1995-1998 cohorts, essentially on-target for the 1999
cohort, and much lower for all subsequent cohorts.
31
Placecasting Entrepeneurial Quality
We now turn to a set of placecasting applications where we calculate EQI and RECPI for
different regions in Massachusetts (and during different time periods); in order to illustrate the
range of potential applications with these tools, we begin at a relatively aggregate level of
geographic scope and then focus in on much more granular analyses (i.e., we move from the
state to the city to the neighborhood to the individual address level). We begin in Figure 3 where
we calculate EQI for all firms registered in each of 351 distinct municipalities in Massachusetts
from 2007-2012. Though this map completely abstracts away from quantity (EQI is simply the
average quality for each town), there is a striking concentration of quality around the Boston
metropolitan area. Relative to an average EQI for the state of 0.8, Cambridge records the highest
level of average quality at 5.7 (i.e., the average firm founded in Cambridge has a 5 in 1000
chance in realizing growth which is nearly 8 times higher than an average firm in
Massachusetts). Cambridge is followed by a cluster of cities around the north-west section
between the Route 128 and 495 corridors, including Bedford, Waltham, Burlington, Lexington,
and Woburn. Maynard (the founding town for DEC Computers) ranks seventh with an EQI of
3.4. Though by far the largest city in Massachusetts (and the clear leader in the total number of
business registrations), Boston ranks 23rd in the state with an EQI of 2.0 between 2007-2012.
Though quality is highly concentrated around Boston, there are clusters of entrepreneurial
quality around different parts of the Commonwealth, including Amherst, Foxborough, and
Beverly. Importantly, quality is in the bottom half of the distribution in several former industrial
cities, including Worcester. Finally, quality is consistently low in popular vacation destinations
such as Cape Cod, Martha’s Vineyard, and the Berkshires.

32
These overall patterns of concentrated quality hold more generally over time. In Figure
4, we calculate EQI for the five largest counties in Massachusetts (associated with more than
95% of all growth outcomes) between 1988 and 2012. Over the past twenty-five years,
Middlesex County (which includes both Cambridge and many of the key Route 128 towns) has
held a distinctive advantage in EQI, with a more recent period of convergence with Suffolk
County (i.e., Boston). Within this broad pattern, there are striking dynamics among
entrepreneurial clusters within Boston. In Figure 5, we plot RECPI for three distinct areas: the
Route 128 Corridor (which we define as Waltham, Burlington, Lexington, Lincoln, Concord,
Acton and Wellesley), Cambridge, and Boston. During the 1990s, Route 128 contained the
highest level of RECPI, even though the combined populations of the Route 128 cities are only
29% of the total population of Boston. Over the past decade, there has been a dramatic shift in
overall entrepreneurial leadership in the Boston area. Cambridge now outpaces both Boston and
the Route 128 corridor, though both Boston and Cambridge experienced a significant estimated
increase in RECPI between 2009 and 2012. These changes are consistent with more qualitative
accounts: a range of media and academic commentators have highlighted the rise of Cambridge
as a hub of high-growth entrepreneurship (Katz and Wagner, 2014), and our estimates provide
direct evidence for this phenomena and also suggest that this rise is not simply the result of a
localized expansion of risk capital but instead reflects an increase in the intrinsic quality of start-
ups within Cambridge relative to more suburban locations.
We further enhance the granularity of our analysis in Figure 6, where we calculate EQI
for each zip code in the Boston metropolitan area for the 2007-2012 period. Here we can see
that, even within cities such as Cambridge or Boston, there is considerable heterogeneity:
Kendall Square (02142) register the single highest level of EQI in the state, followed by the zip

33
code associated with the Harvard Business School (02163). Other notable areas of
entrepreneurial quality include the area surrounding the Boston Innovation District (02210) as
well as a set of zip codes along the Route 128 corridor surrounding Lincoln Laboratories, as well
as the remaining zip codes within Cambridge. Wealthy residential districts such as Newton,
Brookline and Weston are associated with lower levels of average entrepreneurial quality.
Looking over time at a comparison between MIT/Kendall Square (02142), the area
surrounding Harvard University (02138 and 02163) and the Boston Seaport area (which now
includes the Boston Innovation District) (02210), we see that each of these areas registered a
similar level of entrepreneurial quality in the late 1980s and early 1990s. However, beginning
around 1994, the MIT/Kendall Square area began to experience a significant and sustained rise
in average entrepreneurial quality, and (contra the overall pattern of risk capital financing)
actually reached its highest level (in terms of an average) in 2003. The average for the
MIT/Kendall Square area again increased over the second half of the last decade, and
experienced a very sharp increase in 2011 and 2012. A higher level of stability is observed in
the Harvard and Seaport District, though the Seaport District registers a significant rise starting
in 2010, coincident with the establishment of the Boston Innovation District in this area by
Mayor Thomas Menino. While the rise of the MIT/Kendall Square area has been much
discussed (Katz and Wagner, 2010), it is nonetheless striking to see the impact of this sustained
pattern of economic on the geography of entrepreneurial quality.
We further refine our analysis and illustrate the potential of our approach by examining
the micro-geography of entrepreneurial quality at the level of individual addresses. Figure 8
shows the complete set of new business registrants between 2008-2012 in the three zip codes
adjacent to MIT: 02139, 02141, and 02142. For each address where at least one start-up

34
registers, we include a circle whose radius is proportional to the number of business registrants,
and whose color is determined by the average level of entrepreneurial quality at that location.
The results are striking, with a very significant level of variation across individual addresses.
Across these two square miles, the average level of entrepreneurial quality (weighted by address)
is 6.0 but the median is 0.1, reflecting a highly skewed distribution. On the one hand, the area
around Central Square and Cambridgeport (to the north and west of MIT) are characterized by a
large number of addresses with a very small number of start-up events, each of which is
estimated to have a low level of quality (with EQI registering at 0.1 and lower for the majority of
individual addresses). While there are some addresses in Central Square and Cambridgeport
registering significant levels of entrepreneurial quality (particularly along Massachusetts
Avenue), these are dwarfed by the intensive concentration of entrepreneurial quality (both in
terms of EQI and RECPI at each location) that immediately surrounds the Kendall Square area
(to the east of MIT). One Broadway, the home of the Cambridge Innovation Center, is the home
to 229 business registrants, with an average entrepreneurial quality score of 15. The Atheneum
(215 1st Street, a space that includes dedicated wet lab space for life sciences companies) hosted
15 firms with an average entrepreneurial quality score of more than 70. While entrepreneurship
is distributed across the MIT ecosystem, the cluster of world-class entrepreneurial quality
surrounding MIT is concentrated in an even smaller geographic area.
Nowcasting Entrepeneurial Quality
While our placecasting applications offer significant insight into the geography or
entrepreneurial quality and change in entrepreneurial quality over longer time periods, the
development of a measurement approach for entrepreneurial quality for policymakers must be
able to be calculated in a timely manner in order for it to be relevant and useful for policy
35
decisionmaking. Indeed, a contribution of our method is the ability to predict entrepreneurial
quality for recent start-up cohorts (that have not yet realized growth outcomes or not) based on
observable start-up characteristics. However, in our discussion of an estimation model in
Section V, we prioritized the inclusion of start-up characteristics that allow us to differentiate
between start-ups in nuanced ways rather than prioritizing the timeliness and ease of calculating
entrepreneurial quality. Most notably, our key measures associated with intellectual property
(either patents or trademarks) as well as our measure of media mentions are only observed with a
lag. For example, in the case of patents, inclusion of a measure of whether a firm files a patent
within one year after business registration necessitates a 2.5 year lag between business
registration and the inclusion of that firm in an entrepreneurial quality estimate (since patent
applications are not disclosed until 18 months after filing). Alternatively, one could prioritize
being able to calculate a perhaps more noisy estimate of entrepreneurial quality with real-time
data that could be directly estimated from data available within the business registration record
itself. In Figure 9, we compare the patterns of indices that are based on EQI estimates that
depends only on information directly observable from business registration records (i.e., based
on (3-3)) with our baseline index that allows for a two-year lag that allows the estimate of
entrepreneurial quality to incorporate early milestones such as patent or trademark application or
being featured in local newspapers (i.e., (3-5)). In Figure 9(A), we simply compare the overall
RECPI for Massachusetts based on our baseline index versus an index that is explicitly
prioritizes nowcasting. The results are intriguing: there is a very close relationship between the
two through 2000, and, while there is divergence over time, the correlation between the two
36
indices is very high through the end of 2012. Interestingly, Massachusetts continues to register
an improving level of RECPI in 2013 and through November 24, 2014. 24
We then turn in Figures B and C to evaluate how our more granular analyses fare when
comparing the baseline and nowcasting indices. In Figure 9(B), we revisit the comparison
between Route 128, Cambridge and Boston. On the one hand, nowcasting advantages Boston
over these two other areas in terms of an overall ranking (presumably because Cambridge and
Route 128 are associated with firms that are more focused on formal intellectual property). At
the same time, beyond this level effect for Boston, the historical patterns are quite similar, with a
clear transition of entrepreneurial leadership from Route 128 to Cambridge over time. Indeed,
this gap sees to have only increased in the last two years. Finally, Figure 9(C) compares three
neighborhood clusters: MIT/Kendall Square, Harvard, and the Boston Innovation District. As in
Figure 9(B), the overall historical patterns are similar, though the absolute size of the gap
between the MIT area and the others is smaller. From a nowcasting perspective, the use of more
recent data documents the rise of the Boston Innovation District in a more sustained way, and
only suggests that the rate of new firm formation may have slowed after a dramatic rise between
2010 and 2011 (presumably because the initial firms within the District created an bump during
2011).
Evaluating Entrepreneurial Quality and Performance.
As a final exercise, we examine how our proposed measures perform in terms of
predicting the number of realized growth events associated with a given regional cohort. In
Table 5, we perform a series of regressions in which the dependent variable is the number of
24 For the sake of comparison, we scale the measure for 2014 by estimating the number of firms that will register from
November 24 to December 31 in 2014 through an adjustment equivalent to the share of firms that were registered over these dates in 2013 (i.e., we multiply our estimate by 1.09).
37
Growth events per county-year, and examine various measures of entrepreneurship (and include
county fixed effects to account for differences in county overall size and composition). In (5-1),
we simply examine a measure of quantity (ln(# of births)): the coefficient is small, noisy, and
negative. In (5-2), we employ churn, a standard measure of business dynamism (Haltiwanger, et
al) to examine the impact of this measure on the number of growth events within a conty.
Though positive, the coefficient is small and remains insignificant. Even taken at face value, the
effect would be modest: doubling the level of churn would be associated with just an 8%
increase in the total number of expected growth events. Turning to EQI, we find a far more
encouraging result: EQI is not only statistically significant but also associated with a meaningful
increase in the realized number of growth events. Finally, RECPI is associated with a very large
increase in the overall elasticity: doubling RECPI is associated with more than a 50% increase in
the number of expected growth events in a region-cohort-year. Though we caution that we
need to investigate this result further, it points to an important potential additional lens through
which to utilize these tools: an important share of realized growth events are due to “intrinsic”
factors observable at the time of founding, with other factors such as regional ecosystems,
timing, and idiosyncratic factors playing separate roles. The variance decomposition of
entrepreneurial growth remains an important topic for future research.
VII. Conclusion
Motivated by the need to account directly for heterogeneity among entrepreneurial
ventures, this paper has developed and applied a methodology that allows for the estimation of
entrepreneurial quality that facilitates both placecasting (identifying clusters of entrepreneurial
quality without direct use of location information in the prediction) and nowcasating (forecasting

38
the realized entrepreneurial quality of recent cohorts based on start-up characteristics but in
advance of realizing growth outcomes). We specifically introduce very preliminary exemplars
for two new economic statistics – an entrepreneurial quality index (EQI) and a regional
entrepreneurship cohort potential index (RECPI). While we emphasize that our approach is still
preliminary, we believe that the more general methodology offered here has the potential for
application by policymakers and analysts. Given the possibility that entrepreneurial quality is a
leading indicator for other outcomes in regional performance, tracking EQI would allow
government analysts to measure and manage entrepreneurial quality, and so track entrepreneurial
dynamics in a more proactive and informed way. Not simply a tool for direct measurement, our
methodology further allows government organizations (e.g., the Small Business Administration)
to design and evaluate interventions that focus on the quality of entrepreneurship rather than only
increasing rates of firm formation, thus facilitating an approach that could potentially increase
the impact of such interventions substantially.
While our focus in this paper has been in the development and preliminary application of
our methodology to address key challenges in the measurement of entrepreneurship, our results
also highlight potential linkages with areas of theoretical or policy interest. For example,
RECPI, our quantity-adjusted index, estimates the expected number of growth events from a
cohort given its start-up characteristics, without accounting for regional effects or financial
cycles. Thus, RECPI can be interpreted as the “potential” of a cohort of new firms given their
intrinsic qualities. In close interplay with recent theory that relates changes in the demand for
quality entrepreneurship to investment cycles dynamics (Nanda and Rhodes-Kropf, 2013), our
index documents substantial year to year changes in the supply of quality of entrepreneurship.
The relationship is pro-cyclical – cohorts increase in quality as the investment opportunities

39
improve and the market gets “hotter”. However, the realized performance of a cohort is affected
by two opposing effects from the investment cycle: while later cohorts in the cycle have more
intrinsic potential to generate growth, earlier cohorts have more time in the “hot” market (before
a recession like the dot-com bust) to achieve it. The changing time dynamics of the supply of
entrepreneurial quality and its interplay with regional outcomes is an open area of research.
Spatially, in similarity to previous results that find substantial agglomeration of
innovation relative to overall industrial activity (Furman, Porter, and Stern,2002; Audretsch and
Feldman, 1996), we find entrepreneurial quality is substantially more concentrated than
entrepreneurial quantity or population. While there are several potential reasons for this pattern,
we find no reason to conclude any a-priori, and thus suggest this as an interesting finding with
potential for future research.
Finally, our results highlight the micro-geography of the quality of entrepreneurship and
suggest that clusters of entrepreneurial quality may benefit from being analyzed at a very low
level of aggregation. In the spirit of recent work emphasizing the highly local nature of
knowledge spillovers and the nuanced shapes of entrepreneurial clusters (Arzhagi and
Henderson, 2008; Kerr and Kominers, 2015), examining the factors that shape the boundaries of
high-quality entrepreneurship is an important area for future research.

40
References
Aghion, Philippe and Peter Howitt. (1992) “A Model of Growth Through Creative Destruction” Econometrica,
60(2): 323–351.
Amoros, Jose E., and Neils Bosma. (2014) “Global Entrepreneurship Monitor: 2013 Executive Report” London,
GB: London Business School, and Wellesley, MA: Babson College.
Arzaghi, Mohammad, and J. Vernon Henderson. (2008) “Networking of Madison Avenue” Review of Economic
Studies. 75 (4): 1011-1038
Audretsch, David B & Maryann P. Feldman. (1996) "R&D Spillovers and the Geography of Innovation and
Production," American Economic Review. 86(3): 630-640.
Balasubramanian, Natarajan, and Jagadeesh Sivadasan. (2009) “NBER Patent Data-BR Bridge: User Guide and
Technical Documentation”. Working Paper.
Barnes, Beau, Harp, Nancy, Oler, Derek. (2014) “Evaluating the SDC Mergers and Acquisitions Database” SSRN
Working Paper #2201743
Belenzon, Sharon, Chatterji, Aaron and Brendan Daley. (2014) “Eponymous Entrepreneurs” Working Paper
Carlino, Geraldo, Catterjee, Satyajit, and Robert Hunt. (2007) “Urban Density and the Rate of Invention”. Journal of
Urban Economics. 61 (3): 389-419
Davis, Steven, and John Haltiwanger. (1992) “Gross Job Creation, Gross Job Destruction, and Employment
Reallocation”. The Quarterly Journal of Economics. 107 (3): 819-862
Decker, Ryan, Haltiwanger, John, Jarmin, Ron and Javier Miranda. (2014) “The Role of Entrepreneurship in US Job
Creation and Economic Dynamism”. Journal of Economic Perspectives. 28(3): 3-24`
Delgado, Mercedes, Porter, Michael, and Scott Stern. (2015) “Defining Clusters in Related Industries.” Journal of
Economic Geography. forthcoming
Fairlie, Robert W.. (2014) “Kaufman Index of Entrepreneurial Activity: 1996-2013.” Ewing Marion Kaufman
Foundation, Kansas City, MS.
Feldman, Maryann, and David Audrestch. (1999) “Innovation in cities: Science-based diversity, specialization and
localized competition”. European Economic Review. 43(2): 409-429.
Furman, Jeffrey, Porter, Michael and Scott Stern. (2002) “The determinants of national innovative capacity”.
Research Policy. 31:899-933
Graham, Stuart, Hancock, Galen, Marco, Alan, and Amanda Fila Myers. The USPTO Case Files Dataset:
Descriptions, Lessons and Insights. United States Patent and Trademark Office. SSRN Working Paper
#2188621 (2013)
Gompers, Paul, Kovner, Anna, Lerner, Josh, and David Scharfstein. (2010) “Performance Persistence in
Entrepreneurship.” Journal of Financial Economics. 96(1): 18-32.
Guzman, Jorge, and Scott Stern. (2015) “Where is Silicon Valley?” Science. Vol. 347. Issue #6222.

41
Hamilton, Barton. (2000) “Does Entrepreneurship Pay? An Empirical Analysis on the Returns to Self-
Employment”. Journal of Political Economy. 108(3): 604-631.
Hastie, Trevor, Tibshirani, Robert, and John Friedman. (2001) “The Elements of Statistical Learning”. Second
Edition. Springer.
Hurst, Erik, and Benjamin Pugsley. (2011) “What do Small Businesses Do?”. Brookings Papers on Economic
Activity.
Jaffe, Adam, Trajtenberg, Manuel, and Rebecca Henderson. (1993) “Geographic Localization of Knowledge
Spillovers as Evidenced by Patent Citations.” Quarterly Journal of Economics. 108 (3): 577-598.
Jovanovic, Boyan. (1982) “Selection and the Evolution of Industry.” Econometrica. 50(3): 649–670.
Katz, Bruce, and Julie Wagner. (2014) “The Rise of Innovation Districts: A New Geography of Innovation in
America”. Brookings Institution – Metropolitan Policy Program.
Kerr, William, Nanda, Ramana, and Matthew Rhodes-Kropf. (2014) “Entrepreneurship as Experimentation”.
Journal of Economic Perspectives. 28 (3): 25-48.
Kerr, William, and Shihe Fu. (2008) "The Survey of Industrial R&D--Patent Database Link Project." Journal of
Technology Transfer. 33 (2):173-186
Kerr, William, and Scott Kominers. (2015) Review of Economics and Statistics. forthcoming
Klapper, Leora, Amit, Raphael, Guillen, Mauro. (2010) “Entrepreneurship and Firm Formation across Countries”.
NBER Volume: International Differences in Entrepreneurship. Edited by Josh Lerner and Antoinette
Schoar.
Kuznets, Simon. (1941) “National Income and its Composition, 1919-1938. Volume I” p. 3.
Lafontaine, Francine, and Kathryn Shaw. (2014) “Serial Entrepreneurship: Learning by Doing?” NBER Working
Paper #20312
Levenshtein, V. I. (1965), "Binary codes capable of correcting deletions, insertions, and reversals.", Doklady
Akademii Nauk SSSR 163 (4): 845–848
Levine, Ross, and Yona Rubinstein. (2013) “Smart and Illicit: Who Becomes an Entrepreneur and Does it Pay?”
NBER Working Paper #19276
Hathaway, Ian, and Robert Litan. (2014) “Declining Business Dynamism in the United States: A Look at States and
Metros”. Economic Studies at Brookings. Brookings Institution.
Hathaway, Ian, and Robert Litan. (2014) “Declining Business Dynamism: It’s For Real” Comment.
McFadden, Daniel. (1974) “Conditional logit analysis of qualitative choice behavior”. Frontiers in Econometrics.
Chapter 4. Academic Press. p. 105-142.
Moskowitz, T., & Vissing-Jorgensen, A. (2002). “The Returns to Entrepreneurial Investment: A Private Equity
Premium Puzzle?” American Economic Review. 92(4): 745-778.
Nanda, Ramana, and Matthew Rhodes-Kropf. (2014) “Financing Risk and Innovation”. HBS Working Paper 11-
013.

42
Nanda, Ramana, and Matthew Rhodes-Kropf. (2013) "Investment Cycles and Startup Innovation." Journal of
Financial Economics (110): 403–418.
Pohlman, John, and Dennis Leitner. (2003) “A Comparison of Ordinary Least Squares and Logistic Regression.”
The Ohio Journal of Science. 103 (5): 118-125
Reister, Shane. (2014) “Why Should we Actively Track and Measure Startup Communities.” Available in:
Kauffman Thoughtbook 2015 – Entrepreneurship: New Directions for a New Era. Retrieved from:
http://www.kauffman.org/thoughtbook2015/paths-to-entrepreneurship#startupcommunities on December,
2014.
Schumpeter, Joseph A. (1942) “Capitalism, Socialism, and Democracy”. New York: Harper.
Schoar, Antoinette. (2010) “The Divide Between Subsistence and Transformational Entrepreneurship”. Innovation
Policy and the Economy, Volume 10. Edited by Josh Lerner and Scott Stern.
Taddy, Mathew. (2013) “Big Data Analysis”. Lecture on NBER Summer Institute: Econometric Methods for High-
Dimensional Data.
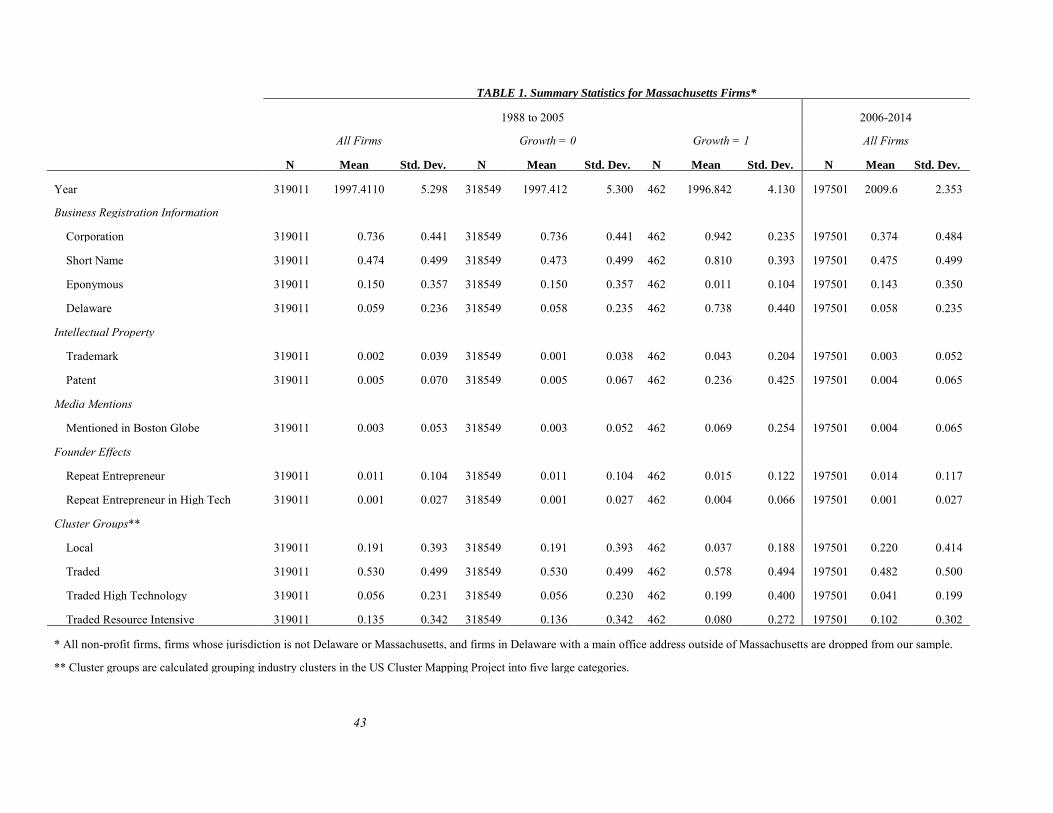
43
TABLE 1. Summary Statistics for Massachusetts Firms*
1988 to 2005 2006-2014
All Firms Growth = 0 Growth = 1 All Firms
N Mean Std. Dev. N Mean Std. Dev. N Mean Std. Dev. N Mean Std. Dev.
Year 319011 1997.4110 5.298 318549 1997.412 5.300 462 1996.842 4.130 197501 2009.6 2.353
Business Registration Information
Corporation 319011 0.736 0.441 318549 0.736 0.441 462 0.942 0.235 197501 0.374 0.484
Short Name 319011 0.474 0.499 318549 0.473 0.499 462 0.810 0.393 197501 0.475 0.499
Eponymous 319011 0.150 0.357 318549 0.150 0.357 462 0.011 0.104 197501 0.143 0.350
Delaware 319011 0.059 0.236 318549 0.058 0.235 462 0.738 0.440 197501 0.058 0.235
Intellectual Property
Trademark 319011 0.002 0.039 318549 0.001 0.038 462 0.043 0.204 197501 0.003 0.052
Patent 319011 0.005 0.070 318549 0.005 0.067 462 0.236 0.425 197501 0.004 0.065
Media Mentions
Mentioned in Boston Globe 319011 0.003 0.053 318549 0.003 0.052 462 0.069 0.254 197501 0.004 0.065
Founder Effects
Repeat Entrepreneur 319011 0.011 0.104 318549 0.011 0.104 462 0.015 0.122 197501 0.014 0.117
Repeat Entrepreneur in High Tech 319011 0.001 0.027 318549 0.001 0.027 462 0.004 0.066 197501 0.001 0.027
Cluster Groups**
Local 319011 0.191 0.393 318549 0.191 0.393 462 0.037 0.188 197501 0.220 0.414
Traded 319011 0.530 0.499 318549 0.530 0.499 462 0.578 0.494 197501 0.482 0.500
Traded High Technology 319011 0.056 0.231 318549 0.056 0.230 462 0.199 0.400 197501 0.041 0.199
Traded Resource Intensive 319011 0.135 0.342 318549 0.136 0.342 462 0.080 0.272 197501 0.102 0.302
* All non-profit firms, firms whose jurisdiction is not Delaware or Massachusetts, and firms in Delaware with a main office address outside of Massachusetts are dropped from our sample.
** Cluster groups are calculated grouping industry clusters in the US Cluster Mapping Project into five large categories.
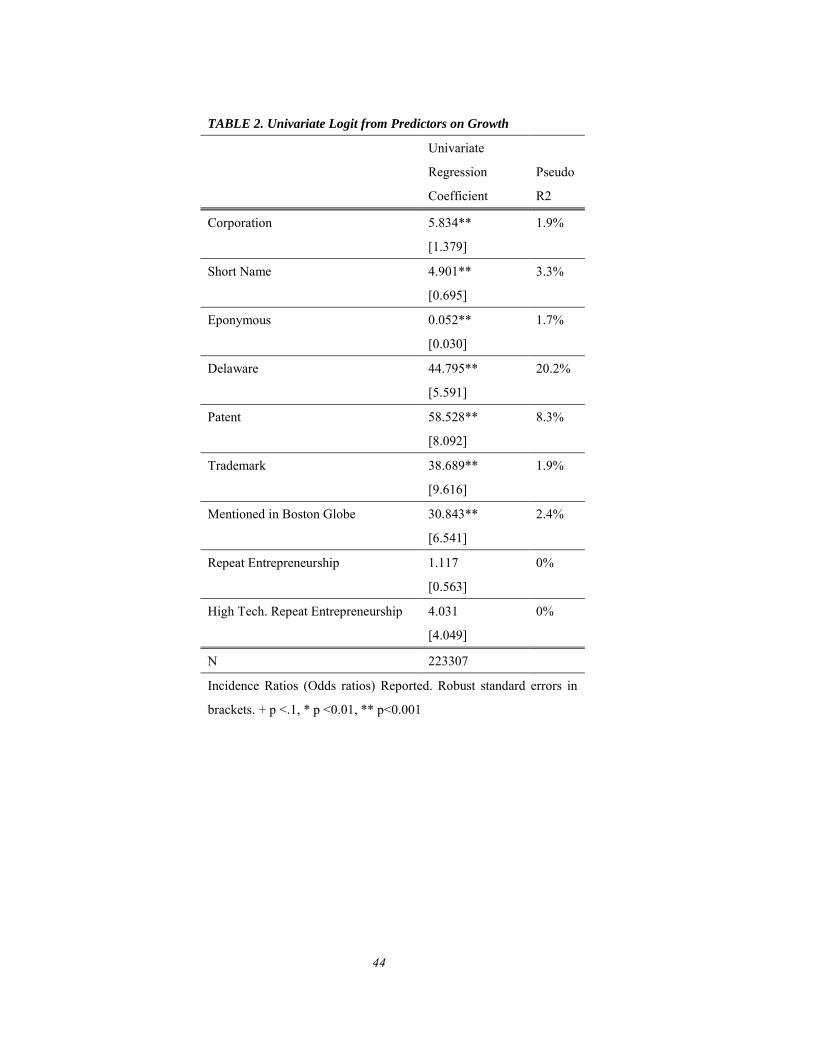
44
TABLE 2. Univariate Logit from Predictors on Growth
Univariate
Regression
Coefficient
Pseudo
R2
Corporation 5.834** 1.9%
[1.379]
Short Name 4.901** 3.3%
[0.695]
Eponymous 0.052** 1.7%
[0.030]
Delaware 44.795** 20.2%
[5.591]
Patent 58.528** 8.3%
[8.092]
Trademark 38.689** 1.9%
[9.616]
Mentioned in Boston Globe 30.843** 2.4%
[6.541]
Repeat Entrepreneurship 1.117 0%
[0.563]
High Tech. Repeat Entrepreneurship 4.031 0%
[4.049]
N 223307
Incidence Ratios (Odds ratios) Reported. Robust standard errors in
brackets. + p <.1, * p <0.01, ** p<0.001
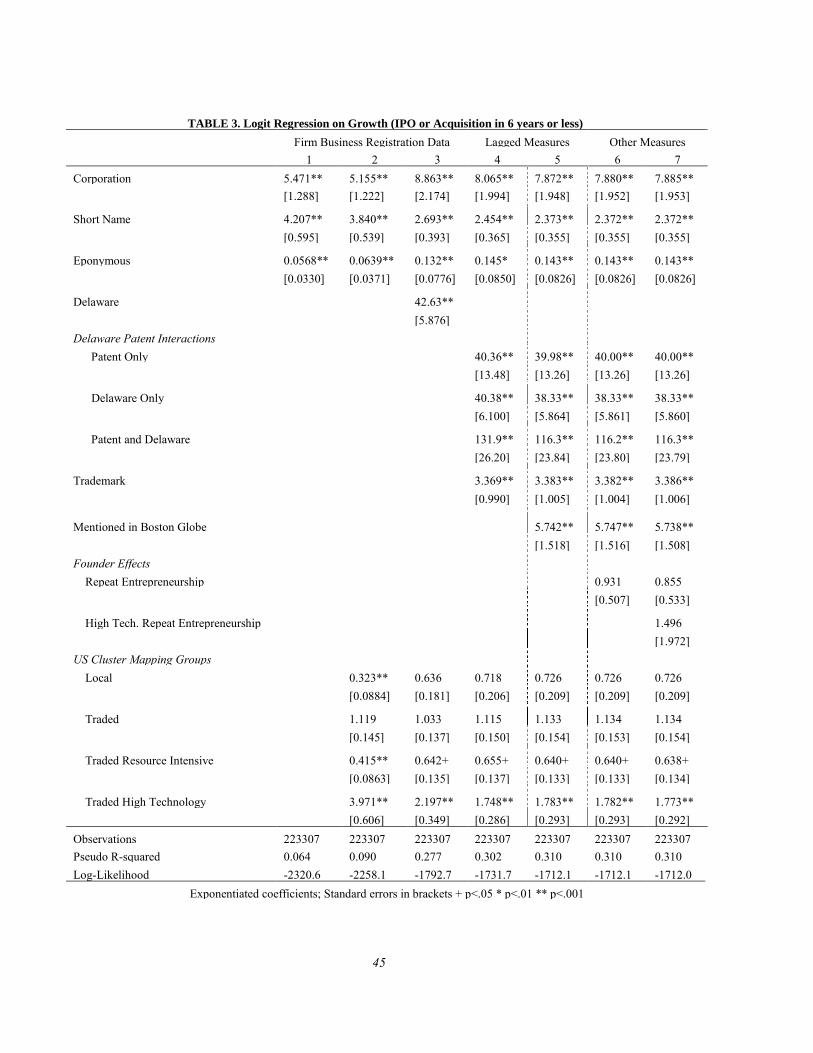
45
TABLE 3. Logit Regression on Growth (IPO or Acquisition in 6 years or less)
Firm Business Registration Data Lagged Measures Other Measures
1 2 3 4 5 6 7
Corporation 5.471** 5.155** 8.863** 8.065** 7.872** 7.880** 7.885**
[1.288] [1.222] [2.174] [1.994] [1.948] [1.952] [1.953]
Short Name 4.207** 3.840** 2.693** 2.454** 2.373** 2.372** 2.372**
[0.595] [0.539] [0.393] [0.365] [0.355] [0.355] [0.355]
Eponymous 0.0568** 0.0639** 0.132** 0.145* 0.143** 0.143** 0.143**
[0.0330] [0.0371] [0.0776] [0.0850] [0.0826] [0.0826] [0.0826]
Delaware
42.63**
[5.876]
Delaware Patent Interactions
Patent Only
40.36** 39.98** 40.00** 40.00**
[13.48] [13.26] [13.26] [13.26]
Delaware Only
40.38** 38.33** 38.33** 38.33**
[6.100] [5.864] [5.861] [5.860]
Patent and Delaware
131.9** 116.3** 116.2** 116.3**
[26.20] [23.84] [23.80] [23.79]
Trademark
3.369** 3.383** 3.382** 3.386**
[0.990] [1.005] [1.004] [1.006]
Mentioned in Boston Globe
5.742** 5.747** 5.738**
[1.518] [1.516] [1.508]
Founder Effects
Repeat Entrepreneurship
0.931 0.855
[0.507] [0.533]
High Tech. Repeat Entrepreneurship
1.496
[1.972]
US Cluster Mapping Groups
Local
0.323** 0.636 0.718 0.726 0.726 0.726
[0.0884] [0.181] [0.206] [0.209] [0.209] [0.209]
Traded
1.119 1.033 1.115 1.133 1.134 1.134
[0.145] [0.137] [0.150] [0.154] [0.153] [0.154]
Traded Resource Intensive
0.415** 0.642+ 0.655+ 0.640+ 0.640+ 0.638+
[0.0863] [0.135] [0.137] [0.133] [0.133] [0.134]
Traded High Technology
3.971** 2.197** 1.748** 1.783** 1.782** 1.773**
[0.606] [0.349] [0.286] [0.293] [0.293] [0.292]
Observations 223307 223307 223307 223307 223307 223307 223307 Pseudo R-squared 0.064 0.090 0.277 0.302 0.310 0.310 0.310 Log-Likelihood -2320.6 -2258.1 -1792.7 -1731.7 -1712.1 -1712.1 -1712.0
Exponentiated coefficients; Standard errors in brackets + p<.05 * p<.01 ** p<.001
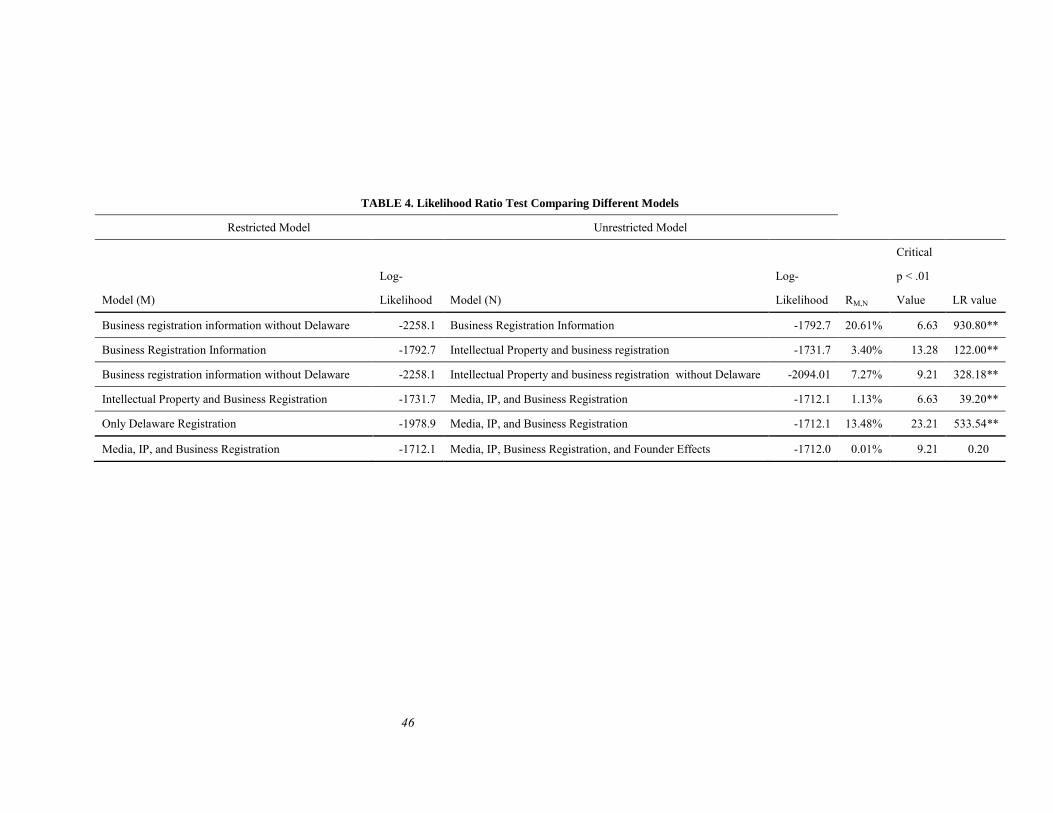
46
TABLE 4. Likelihood Ratio Test Comparing Different Models
Restricted Model Unrestricted Model
Model (M)
Log-
Likelihood Model (N)
Log-
Likelihood RM,N
Critical
p < .01
Value LR value
Business registration information without Delaware -2258.1 Business Registration Information -1792.7 20.61% 6.63 930.80**
Business Registration Information -1792.7 Intellectual Property and business registration -1731.7 3.40% 13.28 122.00**
Business registration information without Delaware -2258.1 Intellectual Property and business registration without Delaware -2094.01 7.27% 9.21 328.18**
Intellectual Property and Business Registration -1731.7 Media, IP, and Business Registration -1712.1 1.13% 6.63 39.20**
Only Delaware Registration -1978.9 Media, IP, and Business Registration -1712.1 13.48% 23.21 533.54**
Media, IP, and Business Registration -1712.1 Media, IP, Business Registration, and Founder Effects -1712.0 0.01% 9.21 0.20
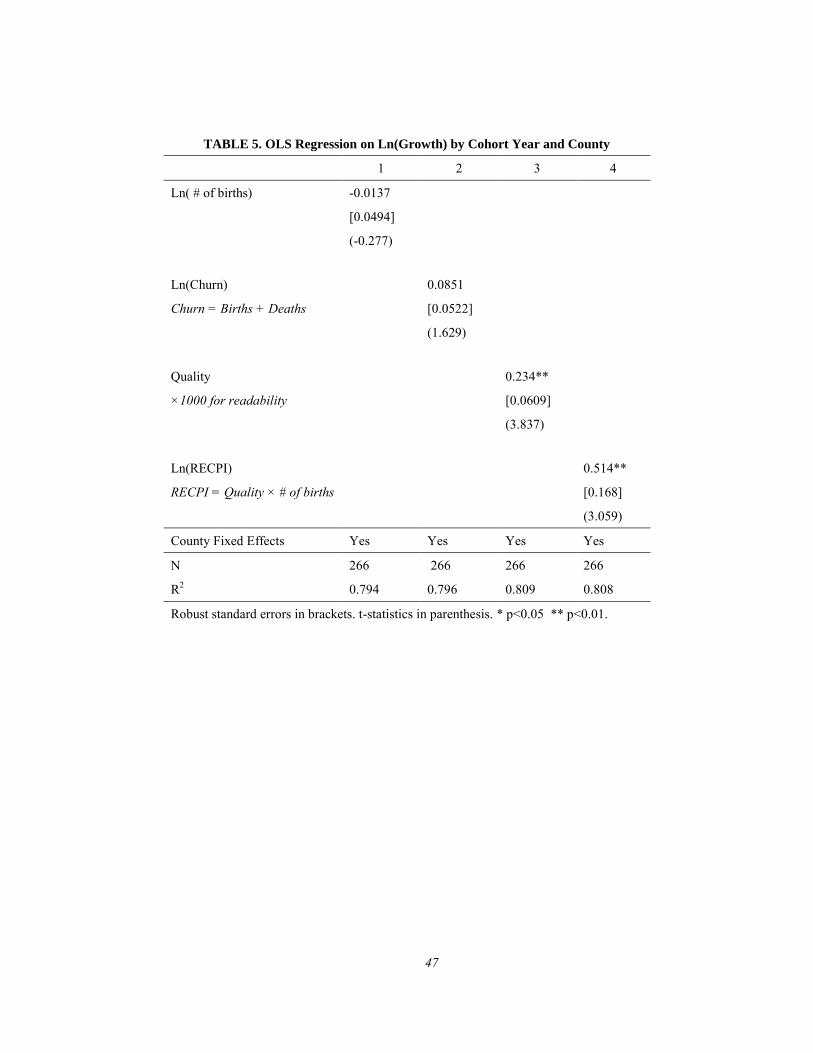
47
TABLE 5. OLS Regression on Ln(Growth) by Cohort Year and County
1 2 3 4
Ln( # of births) -0.0137
[0.0494]
(-0.277)
Ln(Churn)
0.0851
Churn = Births + Deaths [0.0522]
(1.629)
Quality
0.234**
×1000 for readability
[0.0609]
(3.837)
Ln(RECPI)
0.514**
RECPI = Quality × # of births
[0.168]
(3.059)
County Fixed Effects Yes Yes Yes Yes
N 266 266 266 266
R2 0.794 0.796 0.809 0.808
Robust standard errors in brackets. t-statistics in parenthesis. * p<0.05 ** p<0.01.
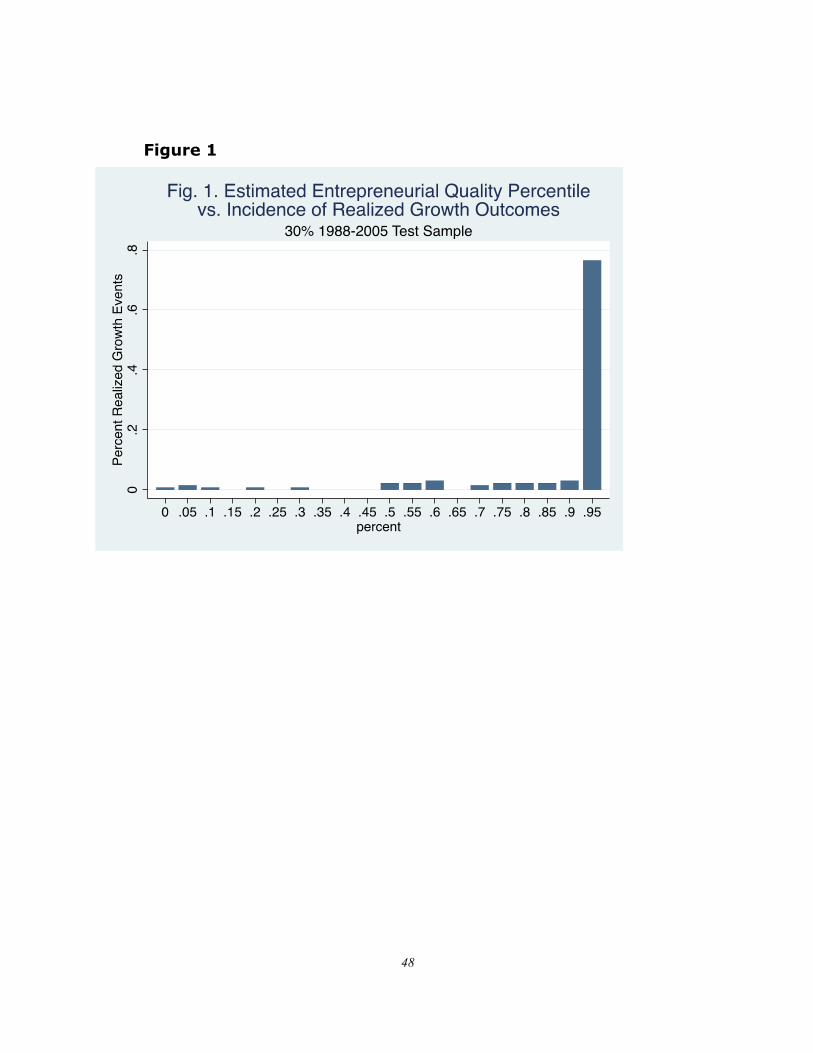
48
Figure 1
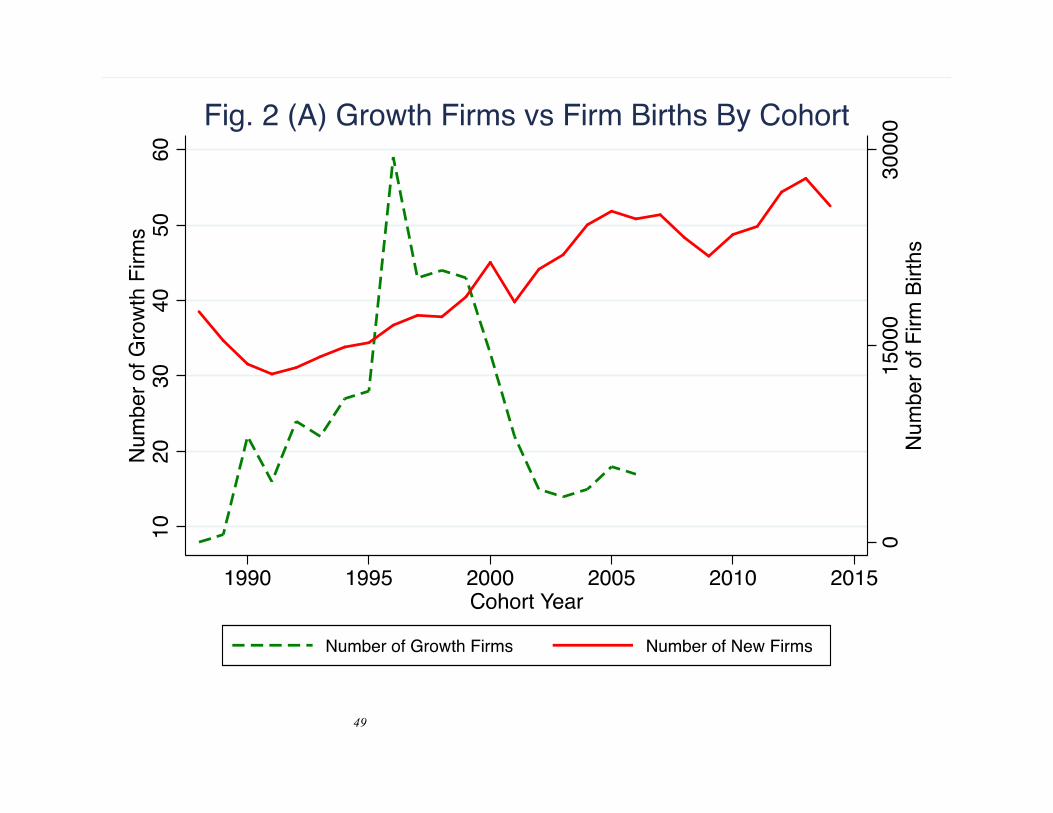
49
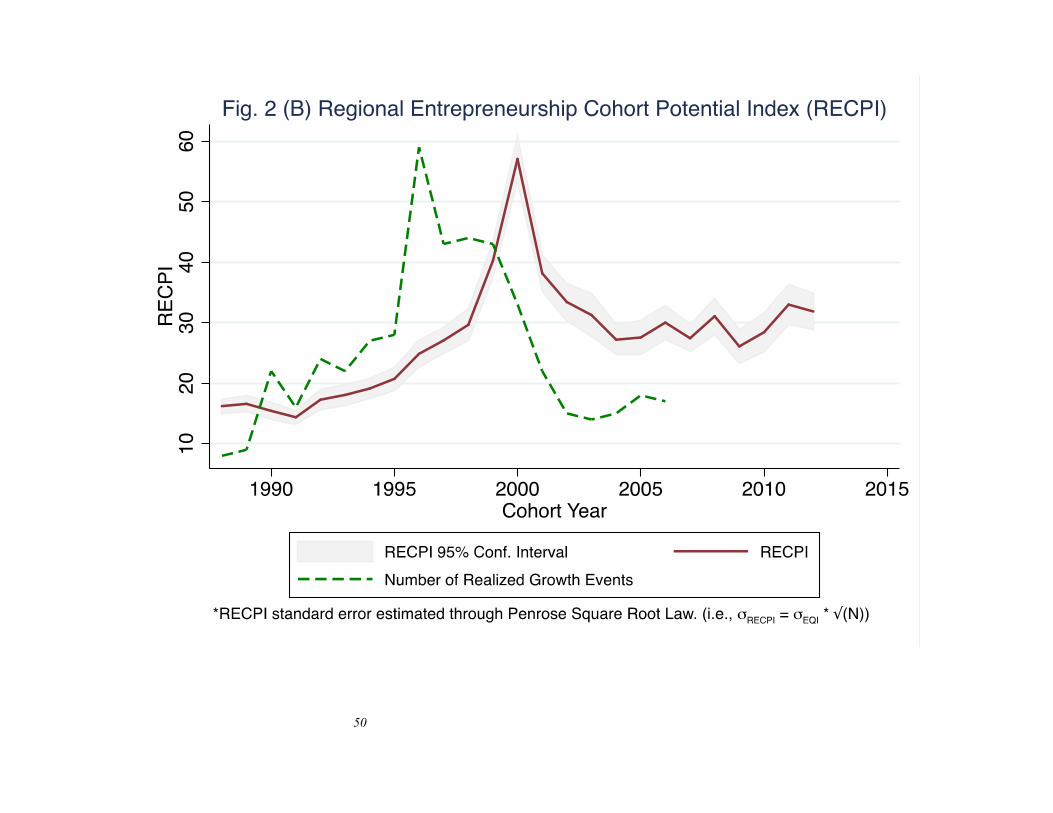
50
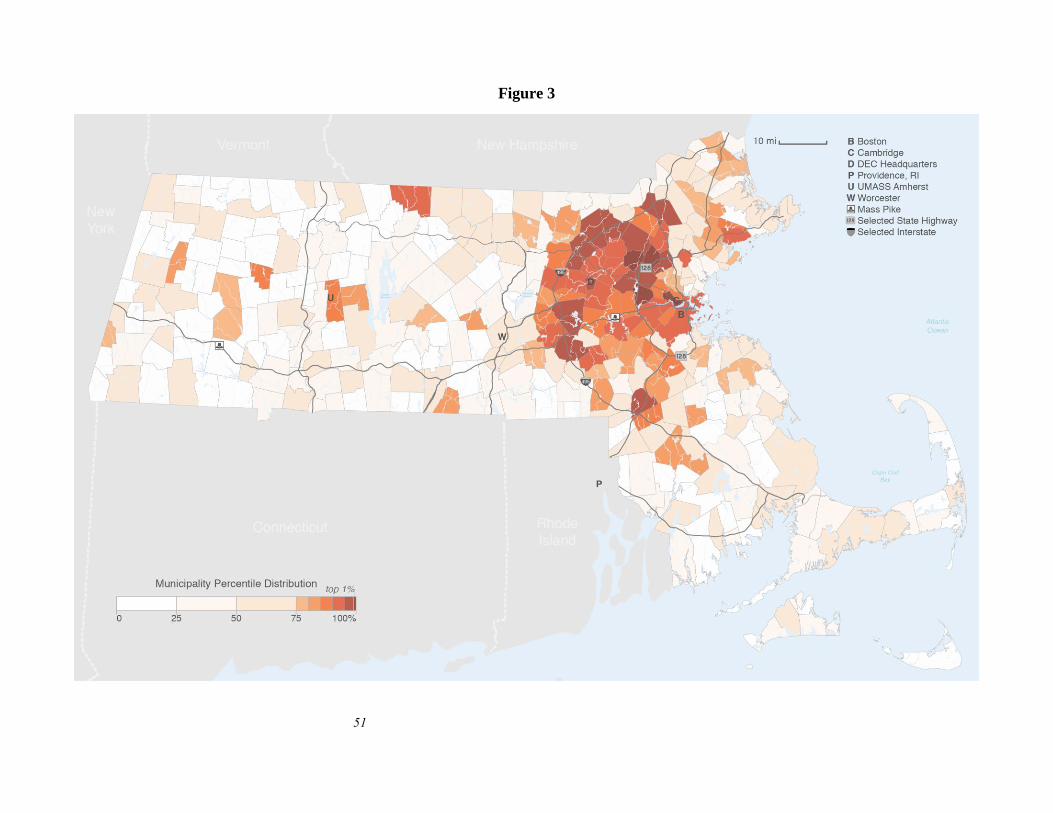
51
Figure 3
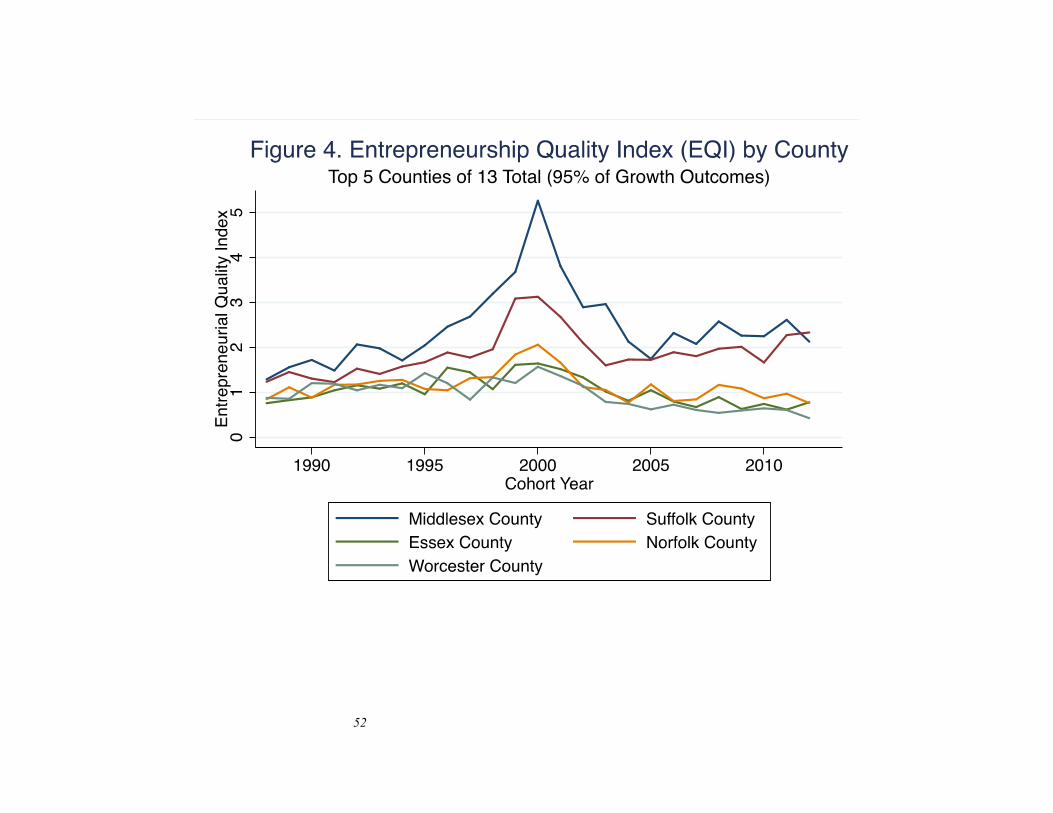
52
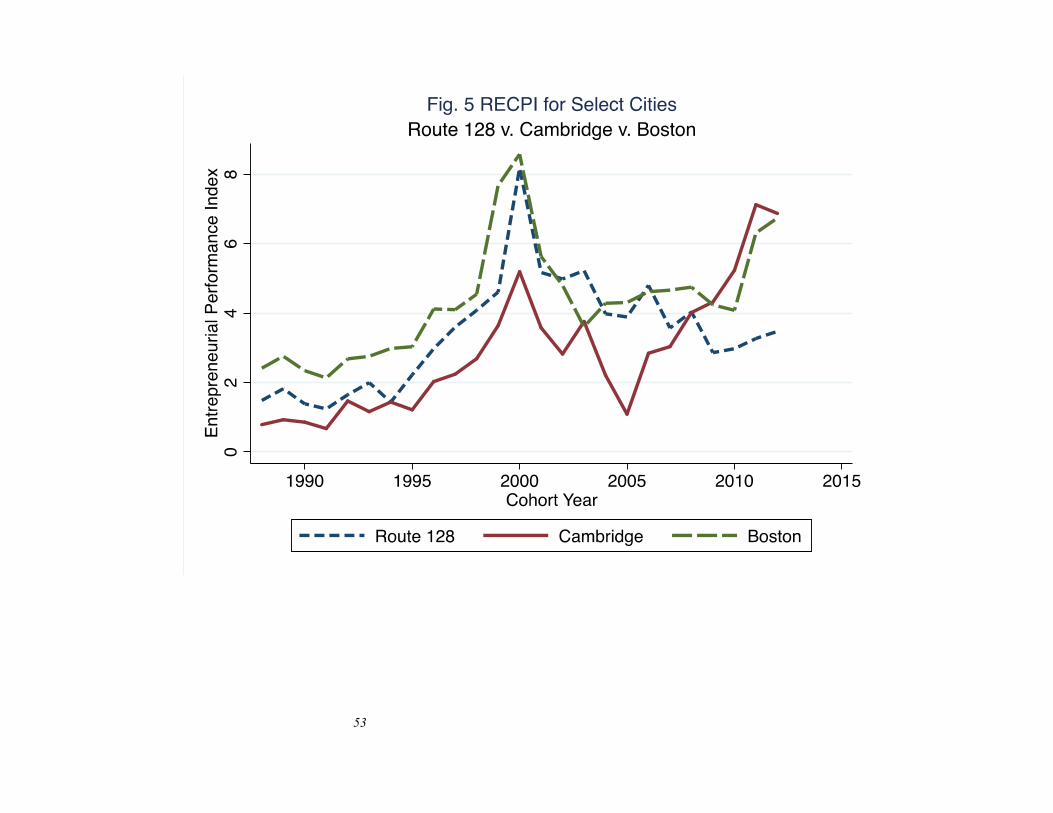
53
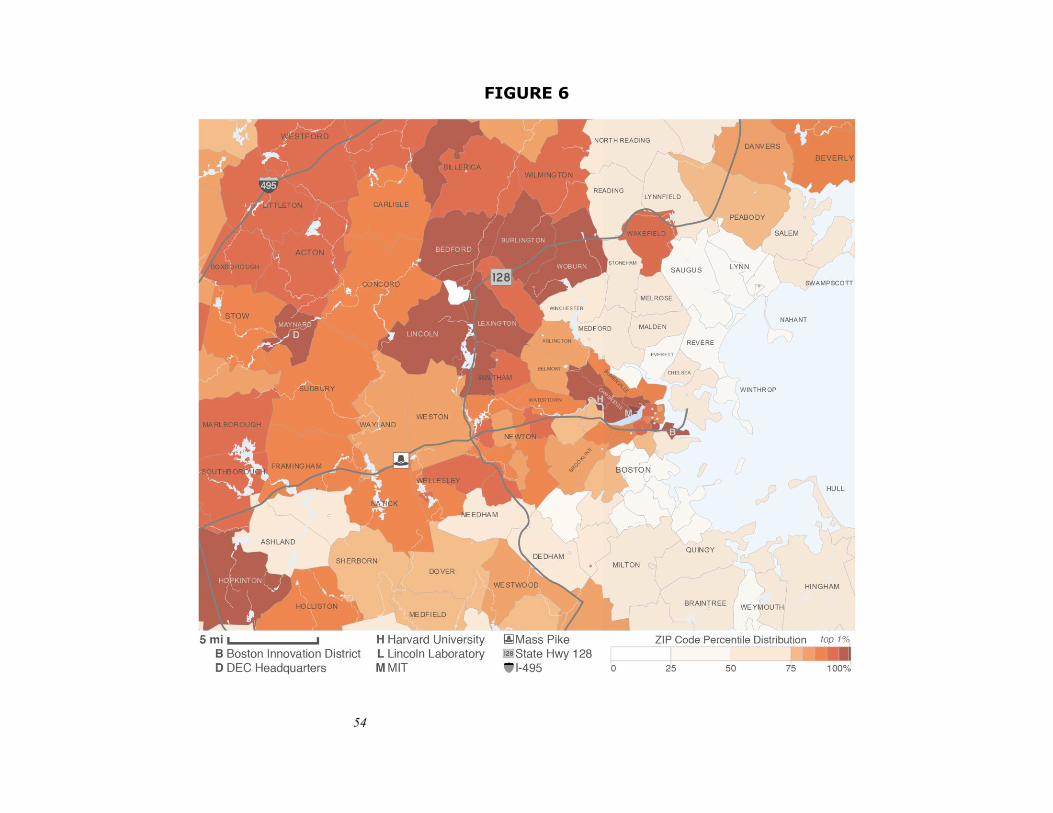
54
FIGURE 6
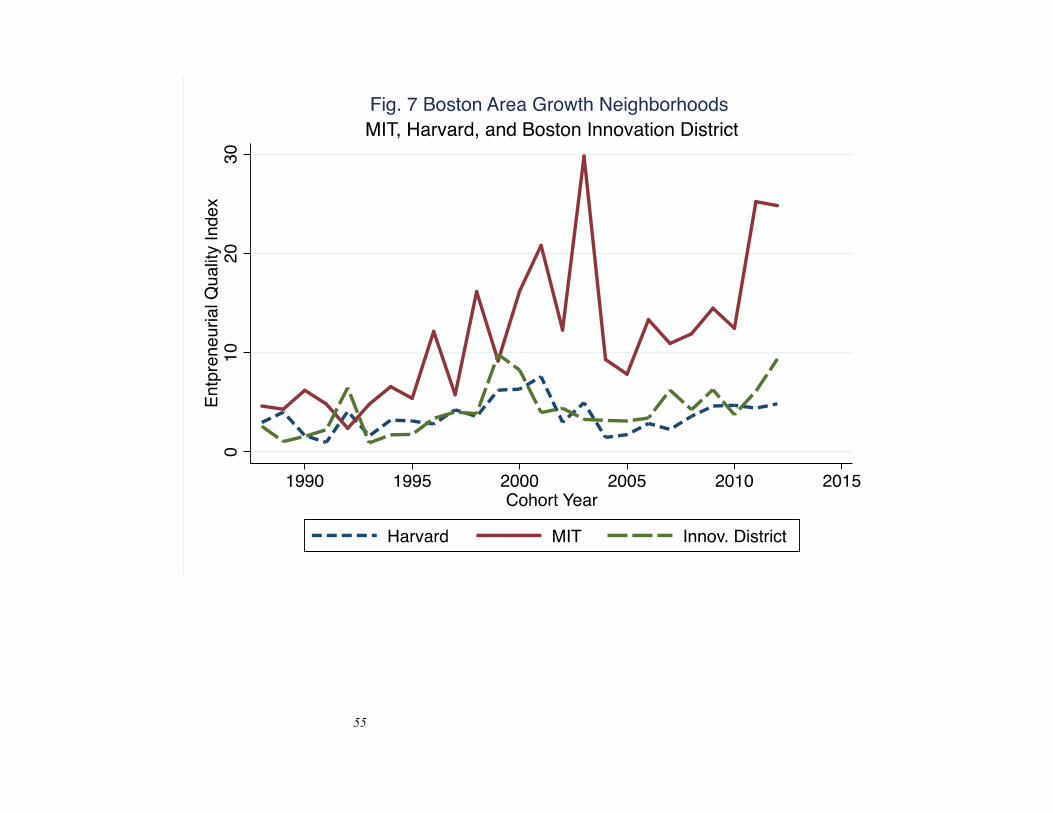
55
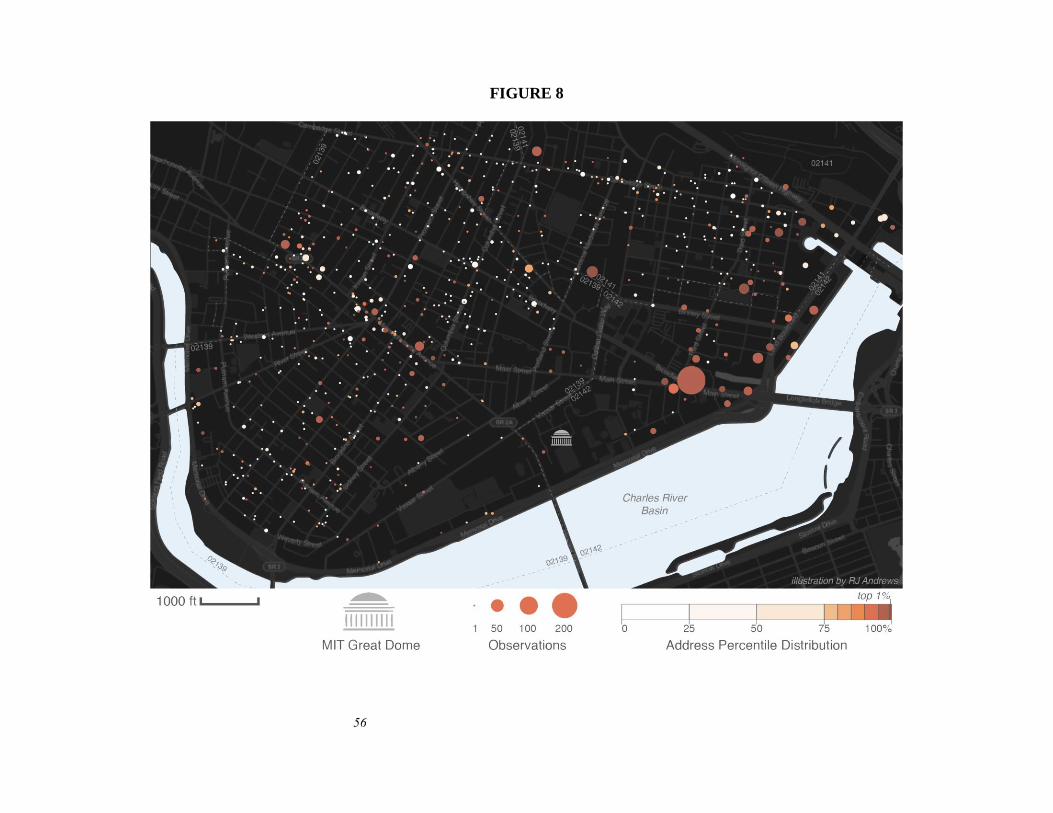
56
FIGURE 8
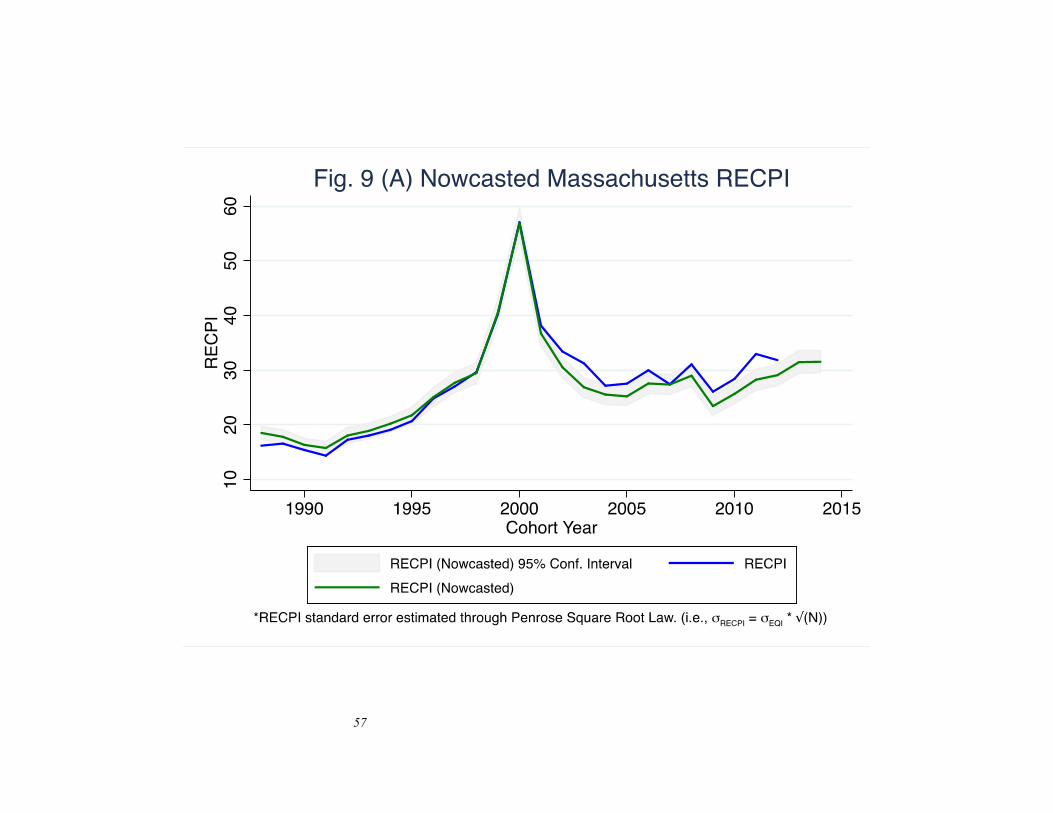
57
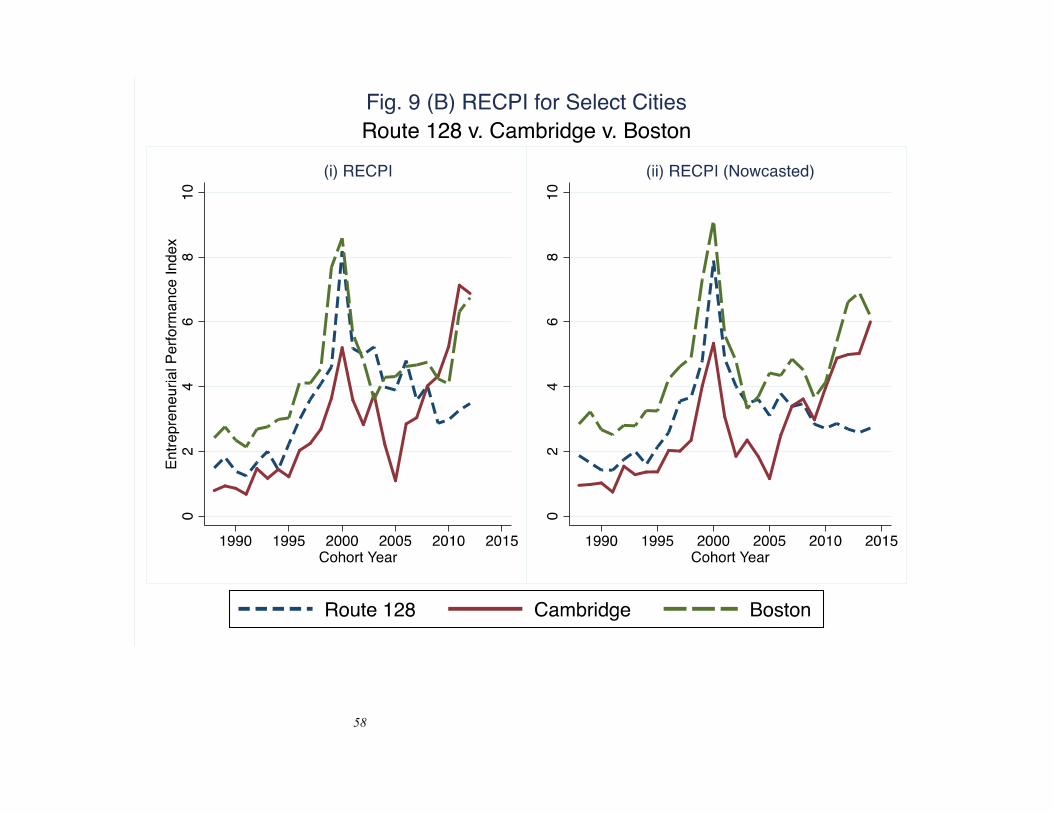
58
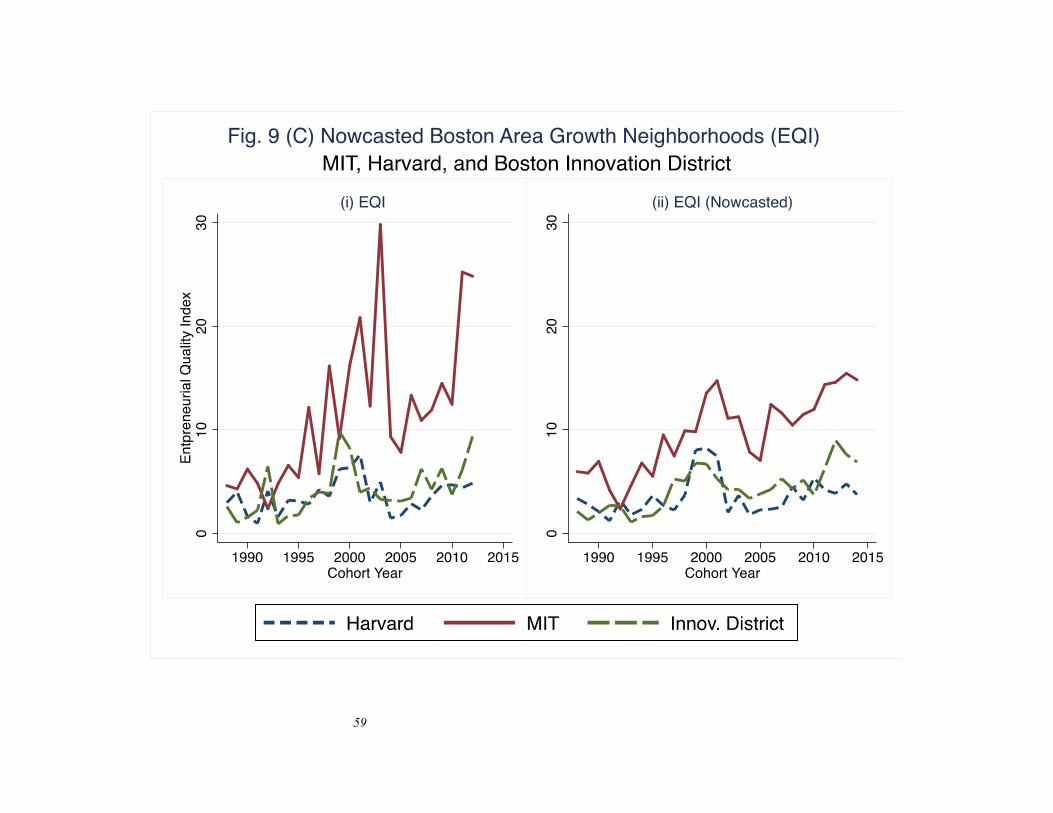
59

60
APPENDIX I. Massachusetts Business Registration Records
Business registration records are a potentially rich and systematic data source for
entrepreneurship and business dynamics. While it is possible to found a new business without
business registration (e.g., a sole proprietorship), the benefits of registration are substantial,
including limited liability, protection of the entrepreneur’s personal assets, various tax benefits,
the ability to issue and trade ownership shares, credibility with potential customers, and the
ability to deduct expenses. Among business registrants, there are several categories, and the
precise rules governing each categories vary by jurisdiction and time. This study focuses on the
state of Massachusetts from 1988-2014, at which point one could register the following:
corporations, limited liability companies, limited liability partnerships, limited partnerships,
professional limited liability partnerships, and general partnerships (see (1) for further
information).
The data in this paper comes from the Secretary of the Commonwealth of Massachusetts,
Corporations Division (http://www.sec.state.ma.us/cor/coridx.htm, data received on November
27, 2014) containing four files, a master file, containing a master record for all firms ever
registered in Massachusetts at the moment of extraction; an individuals file, containing all the
directors and titles of each firm; a name history file, with previous names of each firm; and a
merger history file, with all mergers that have occurred in Massachusetts. The master file
includes the following fields: firm id, tax status (non-profit or for profit), firm type (corporation,
limited liability company, etc.), firm status (active, deceased, merged, etc.), jurisdiction
(Massachusetts, or another US state), address, firm name, Massachusetts incorporation date,
jurisdiction incorporation date (for foreign firms), address of the principal office (for firms

61
foreign to California), and Doing Business As names. The individual file includes the following
fields: firm id, title, first name, middle name, last name, business address and residential address.
After combining these files, we generate unique firm identifiers. For this paper, we select
a dataset of the for-profit firms first registered in Massachusetts from January 1, 1988 to
November 25, 2014, satisfying one of the following two conditions: for-profit firms whose
jurisdiction is Massachusetts, and for-profit Delaware firms whose main office is in
Massachusetts. Table A1 lists the number of observations in our dataset for each annual cohort
year from 1988 to 2014. It is useful to note that, for those firms registered in Delaware, we use
the year they register in Delaware, not in Massachusetts, as their founding date. Both the links
to the underlying data and the program files used to construct the dataset are available as
requested from the authors.
As a final note, this paper uses a subset of the business registration records we have now
gathered from several states, including California, Texas, Florida, Washington, and New York.
Though our evaluation of Texas, Florida, Washington and New York is at a more preliminary
stage, we have found very similar qualitative findings in terms of the impact of factors
observable at or near the time of registration on subsequent growth outcomes, and the ability of
these models to offer detailed characterization of growth entrepreneurship clusters.
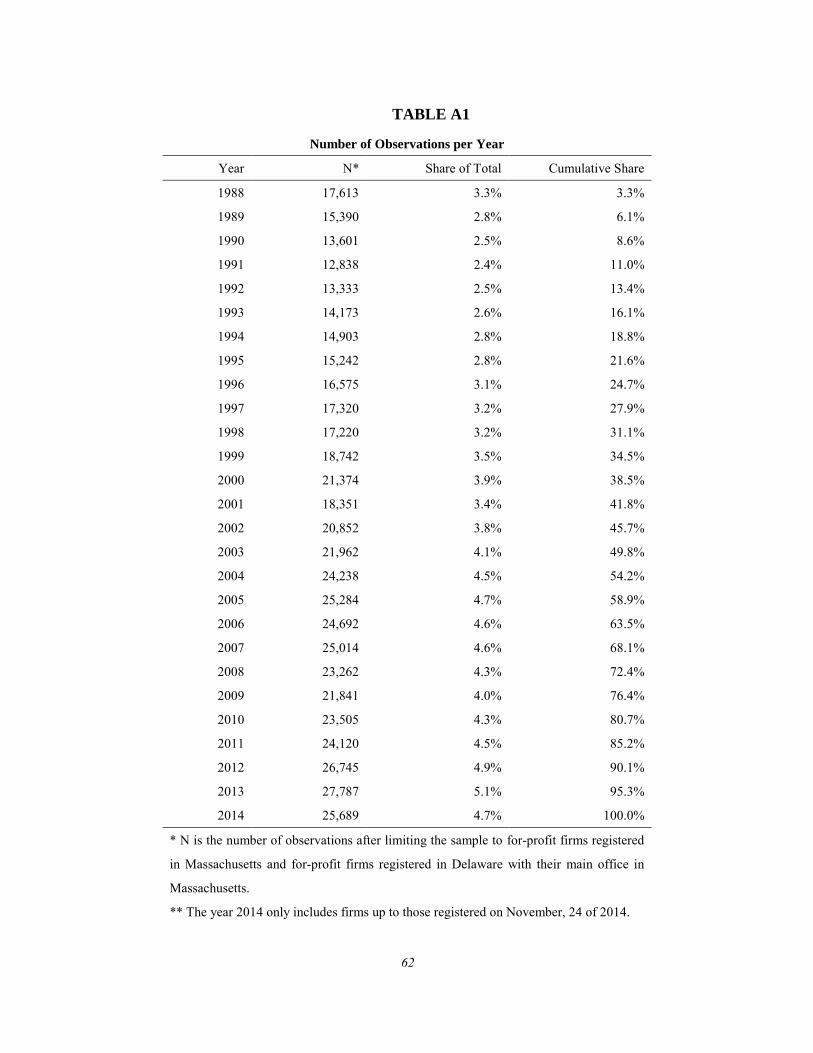
62
TABLE A1
Number of Observations per Year
Year N* Share of Total Cumulative Share
1988 17,613 3.3% 3.3%
1989 15,390 2.8% 6.1%
1990 13,601 2.5% 8.6%
1991 12,838 2.4% 11.0%
1992 13,333 2.5% 13.4%
1993 14,173 2.6% 16.1%
1994 14,903 2.8% 18.8%
1995 15,242 2.8% 21.6%
1996 16,575 3.1% 24.7%
1997 17,320 3.2% 27.9%
1998 17,220 3.2% 31.1%
1999 18,742 3.5% 34.5%
2000 21,374 3.9% 38.5%
2001 18,351 3.4% 41.8%
2002 20,852 3.8% 45.7%
2003 21,962 4.1% 49.8%
2004 24,238 4.5% 54.2%
2005 25,284 4.7% 58.9%
2006 24,692 4.6% 63.5%
2007 25,014 4.6% 68.1%
2008 23,262 4.3% 72.4%
2009 21,841 4.0% 76.4%
2010 23,505 4.3% 80.7%
2011 24,120 4.5% 85.2%
2012 26,745 4.9% 90.1%
2013 27,787 5.1% 95.3%
2014 25,689 4.7% 100.0%
* N is the number of observations after limiting the sample to for-profit firms registered
in Massachusetts and for-profit firms registered in Delaware with their main office in
Massachusetts.
** The year 2014 only includes firms up to those registered on November, 24 of 2014.
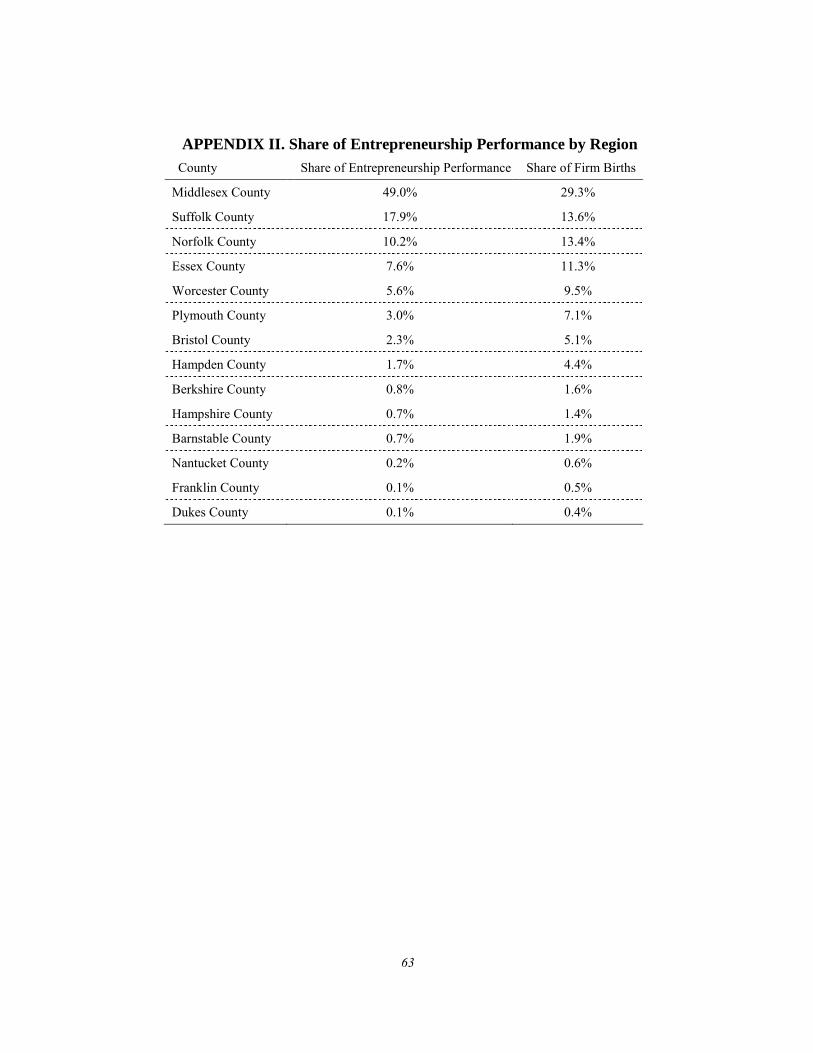
63
APPENDIX II. Share of Entrepreneurship Performance by Region
County Share of Entrepreneurship Performance Share of Firm Births
Middlesex County 49.0% 29.3%
Suffolk County 17.9% 13.6%
Norfolk County 10.2% 13.4%
Essex County 7.6% 11.3%
Worcester County 5.6% 9.5%
Plymouth County 3.0% 7.1%
Bristol County 2.3% 5.1%
Hampden County 1.7% 4.4%
Berkshire County 0.8% 1.6%
Hampshire County 0.7% 1.4%
Barnstable County 0.7% 1.9%
Nantucket County 0.2% 0.6%
Franklin County 0.1% 0.5%
Dukes County 0.1% 0.4%
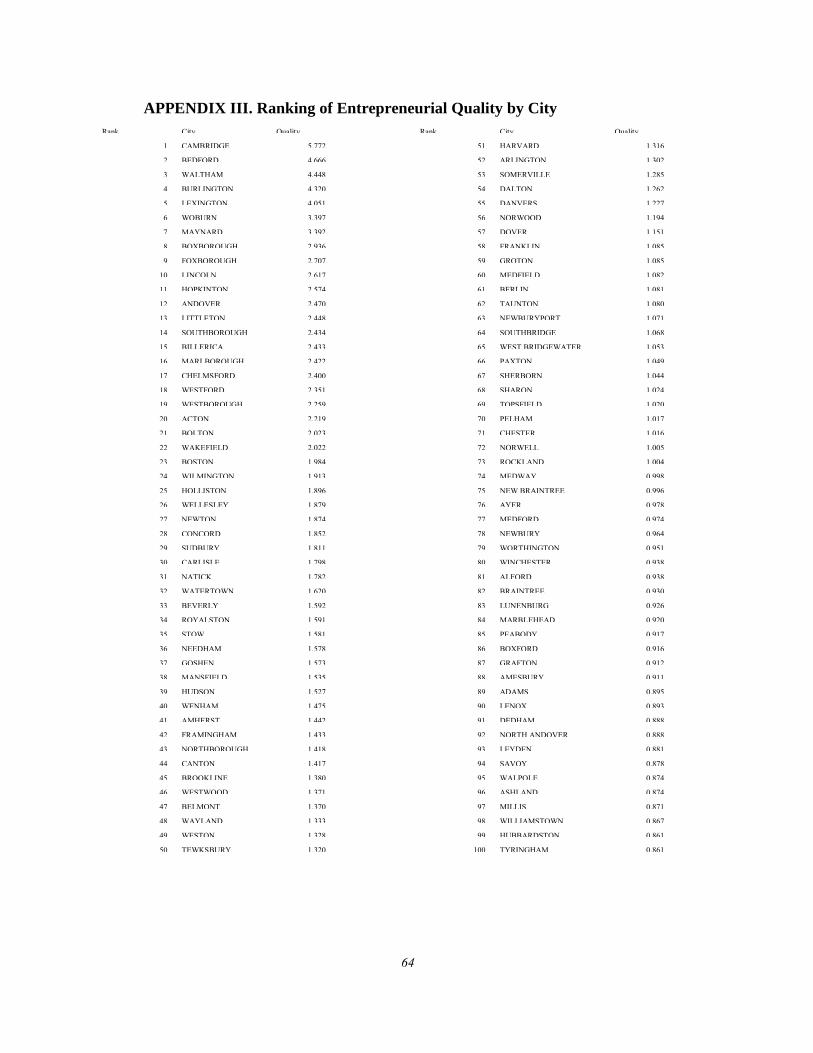
64
APPENDIX III. Ranking of Entrepreneurial Quality by City
Rank City Quality
Rank City Quality
1 CAMBRIDGE 5.772
51 HARVARD 1.316
2 BEDFORD 4.666
52 ARLINGTON 1.302
3 WALTHAM 4.448
53 SOMERVILLE 1.285
4 BURLINGTON 4.320
54 DALTON 1.262
5 LEXINGTON 4.051
55 DANVERS 1.227
6 WOBURN 3.397
56 NORWOOD 1.194
7 MAYNARD 3.392
57 DOVER 1.151
8 BOXBOROUGH 2.936
58 FRANKLIN 1.085
9 FOXBOROUGH 2.707
59 GROTON 1.085
10 LINCOLN 2.617
60 MEDFIELD 1.082
11 HOPKINTON 2.574
61 BERLIN 1.081
12 ANDOVER 2.470
62 TAUNTON 1.080
13 LITTLETON 2.448
63 NEWBURYPORT 1.071
14 SOUTHBOROUGH 2.434
64 SOUTHBRIDGE 1.068
15 BILLERICA 2.433
65 WEST BRIDGEWATER 1.053
16 MARLBOROUGH 2.422
66 PAXTON 1.049
17 CHELMSFORD 2.400
67 SHERBORN 1.044
18 WESTFORD 2.351
68 SHARON 1.024
19 WESTBOROUGH 2.259
69 TOPSFIELD 1.020
20 ACTON 2.219
70 PELHAM 1.017
21 BOLTON 2.023
71 CHESTER 1.016
22 WAKEFIELD 2.022
72 NORWELL 1.005
23 BOSTON 1.984
73 ROCKLAND 1.004
24 WILMINGTON 1.913
74 MEDWAY 0.998
25 HOLLISTON 1.896
75 NEW BRAINTREE 0.996
26 WELLESLEY 1.879
76 AYER 0.978
27 NEWTON 1.874
77 MEDFORD 0.974
28 CONCORD 1.852
78 NEWBURY 0.964
29 SUDBURY 1.811
79 WORTHINGTON 0.951
30 CARLISLE 1.798
80 WINCHESTER 0.938
31 NATICK 1.782
81 ALFORD 0.938
32 WATERTOWN 1.620
82 BRAINTREE 0.930
33 BEVERLY 1.592
83 LUNENBURG 0.926
34 ROYALSTON 1.591
84 MARBLEHEAD 0.920
35 STOW 1.581
85 PEABODY 0.917
36 NEEDHAM 1.578
86 BOXFORD 0.916
37 GOSHEN 1.573
87 GRAFTON 0.912
38 MANSFIELD 1.535
88 AMESBURY 0.911
39 HUDSON 1.527
89 ADAMS 0.895
40 WENHAM 1.475
90 LENOX 0.893
41 AMHERST 1.442
91 DEDHAM 0.888
42 FRAMINGHAM 1.433
92 NORTH ANDOVER 0.888
43 NORTHBOROUGH 1.418
93 LEYDEN 0.881
44 CANTON 1.417
94 SAVOY 0.878
45 BROOKLINE 1.380
95 WALPOLE 0.874
46 WESTWOOD 1.371
96 ASHLAND 0.874
47 BELMONT 1.370
97 MILLIS 0.871
48 WAYLAND 1.333
98 WILLIAMSTOWN 0.867
49 WESTON 1.328
99 HUBBARDSTON 0.861
50 TEWKSBURY 1.320
100 TYRINGHAM 0.861
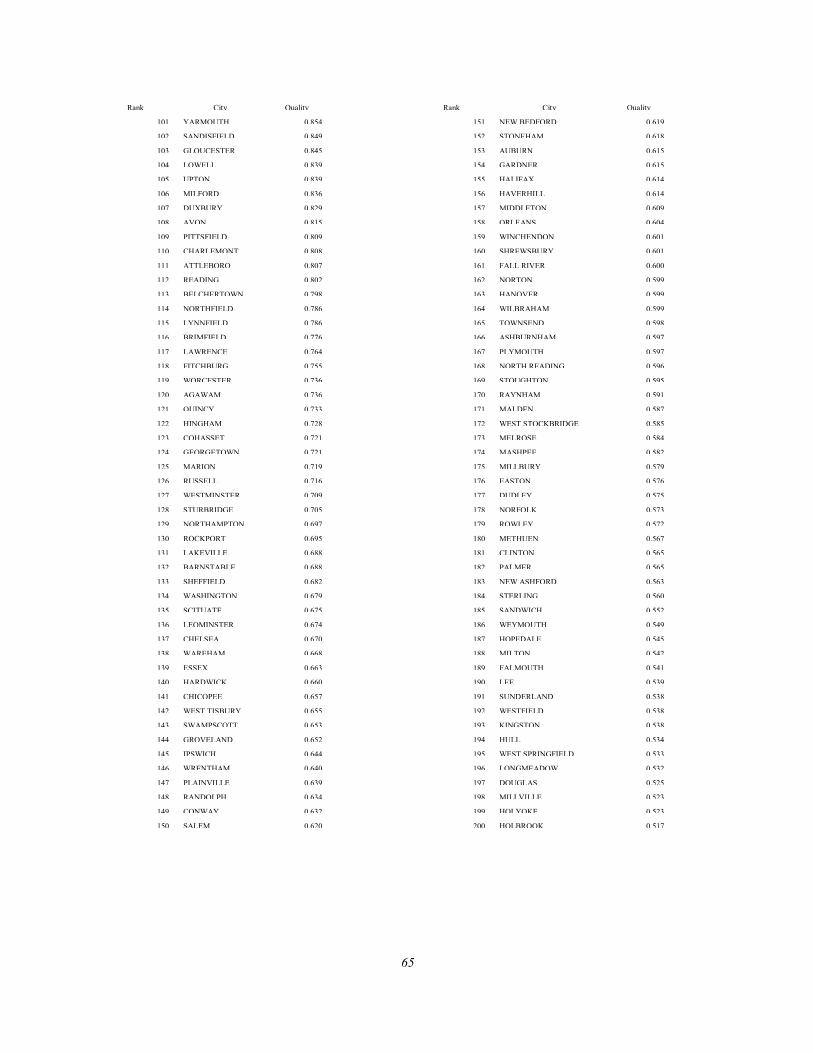
65
Rank City Quality
Rank City Quality
101 YARMOUTH 0.854
151 NEW BEDFORD 0.619
102 SANDISFIELD 0.849
152 STONEHAM 0.618
103 GLOUCESTER 0.845
153 AUBURN 0.615
104 LOWELL 0.839
154 GARDNER 0.615
105 UPTON 0.839
155 HALIFAX 0.614
106 MILFORD 0.836
156 HAVERHILL 0.614
107 DUXBURY 0.829
157 MIDDLETON 0.609
108 AVON 0.815
158 ORLEANS 0.604
109 PITTSFIELD 0.809
159 WINCHENDON 0.601
110 CHARLEMONT 0.808
160 SHREWSBURY 0.601
111 ATTLEBORO 0.807
161 FALL RIVER 0.600
112 READING 0.802
162 NORTON 0.599
113 BELCHERTOWN 0.798
163 HANOVER 0.599
114 NORTHFIELD 0.786
164 WILBRAHAM 0.599
115 LYNNFIELD 0.786
165 TOWNSEND 0.598
116 BRIMFIELD 0.776
166 ASHBURNHAM 0.597
117 LAWRENCE 0.764
167 PLYMOUTH 0.597
118 FITCHBURG 0.755
168 NORTH READING 0.596
119 WORCESTER 0.736
169 STOUGHTON 0.595
120 AGAWAM 0.736
170 RAYNHAM 0.591
121 QUINCY 0.733
171 MALDEN 0.587
122 HINGHAM 0.728
172 WEST STOCKBRIDGE 0.585
123 COHASSET 0.721
173 MELROSE 0.584
124 GEORGETOWN 0.721
174 MASHPEE 0.582
125 MARION 0.719
175 MILLBURY 0.579
126 RUSSELL 0.716
176 EASTON 0.576
127 WESTMINSTER 0.709
177 DUDLEY 0.575
128 STURBRIDGE 0.705
178 NORFOLK 0.573
129 NORTHAMPTON 0.697
179 ROWLEY 0.572
130 ROCKPORT 0.695
180 METHUEN 0.567
131 LAKEVILLE 0.688
181 CLINTON 0.565
132 BARNSTABLE 0.688
182 PALMER 0.565
133 SHEFFIELD 0.682
183 NEW ASHFORD 0.563
134 WASHINGTON 0.679
184 STERLING 0.560
135 SCITUATE 0.675
185 SANDWICH 0.552
136 LEOMINSTER 0.674
186 WEYMOUTH 0.549
137 CHELSEA 0.670
187 HOPEDALE 0.545
138 WAREHAM 0.668
188 MILTON 0.542
139 ESSEX 0.663
189 FALMOUTH 0.541
140 HARDWICK 0.660
190 LEE 0.539
141 CHICOPEE 0.657
191 SUNDERLAND 0.538
142 WEST TISBURY 0.655
192 WESTFIELD 0.538
143 SWAMPSCOTT 0.653
193 KINGSTON 0.538
144 GROVELAND 0.652
194 HULL 0.534
145 IPSWICH 0.644
195 WEST SPRINGFIELD 0.533
146 WRENTHAM 0.640
196 LONGMEADOW 0.532
147 PLAINVILLE 0.639
197 DOUGLAS 0.525
148 RANDOLPH 0.634
198 MILLVILLE 0.523
149 CONWAY 0.632
199 HOLYOKE 0.523
150 SALEM 0.620
200 HOLBROOK 0.517
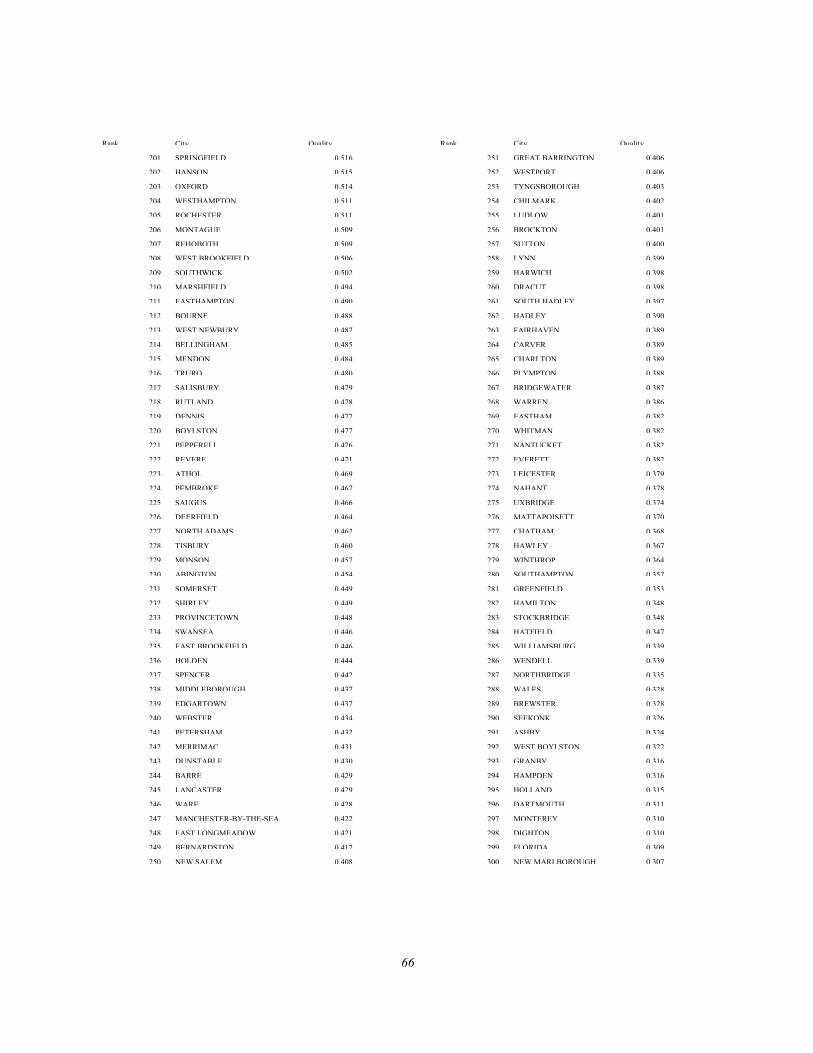
66
Rank City Quality
Rank City Quality
201 SPRINGFIELD 0.516
251 GREAT BARRINGTON 0.406
202 HANSON 0.515
252 WESTPORT 0.406
203 OXFORD 0.514
253 TYNGSBOROUGH 0.403
204 WESTHAMPTON 0.511
254 CHILMARK 0.402
205 ROCHESTER 0.511
255 LUDLOW 0.401
206 MONTAGUE 0.509
256 BROCKTON 0.401
207 REHOBOTH 0.509
257 SUTTON 0.400
208 WEST BROOKFIELD 0.506
258 LYNN 0.399
209 SOUTHWICK 0.502
259 HARWICH 0.398
210 MARSHFIELD 0.494
260 DRACUT 0.398
211 EASTHAMPTON 0.490
261 SOUTH HADLEY 0.397
212 BOURNE 0.488
262 HADLEY 0.390
213 WEST NEWBURY 0.487
263 FAIRHAVEN 0.389
214 BELLINGHAM 0.485
264 CARVER 0.389
215 MENDON 0.484
265 CHARLTON 0.389
216 TRURO 0.480
266 PLYMPTON 0.388
217 SALISBURY 0.479
267 BRIDGEWATER 0.387
218 RUTLAND 0.478
268 WARREN 0.386
219 DENNIS 0.477
269 EASTHAM 0.382
220 BOYLSTON 0.477
270 WHITMAN 0.382
221 PEPPERELL 0.476
271 NANTUCKET 0.382
222 REVERE 0.471
272 EVERETT 0.382
223 ATHOL 0.469
273 LEICESTER 0.379
224 PEMBROKE 0.467
274 NAHANT 0.378
225 SAUGUS 0.466
275 UXBRIDGE 0.374
226 DEERFIELD 0.464
276 MATTAPOISETT 0.370
227 NORTH ADAMS 0.462
277 CHATHAM 0.368
228 TISBURY 0.460
278 HAWLEY 0.367
229 MONSON 0.457
279 WINTHROP 0.364
230 ABINGTON 0.454
280 SOUTHAMPTON 0.357
231 SOMERSET 0.449
281 GREENFIELD 0.353
232 SHIRLEY 0.449
282 HAMILTON 0.348
233 PROVINCETOWN 0.448
283 STOCKBRIDGE 0.348
234 SWANSEA 0.446
284 HATFIELD 0.347
235 EAST BROOKFIELD 0.446
285 WILLIAMSBURG 0.339
236 HOLDEN 0.444
286 WENDELL 0.339
237 SPENCER 0.442
287 NORTHBRIDGE 0.335
238 MIDDLEBOROUGH 0.437
288 WALES 0.328
239 EDGARTOWN 0.437
289 BREWSTER 0.328
240 WEBSTER 0.434
290 SEEKONK 0.326
241 PETERSHAM 0.432
291 ASHBY 0.324
242 MERRIMAC 0.431
292 WEST BOYLSTON 0.322
243 DUNSTABLE 0.430
293 GRANBY 0.316
244 BARRE 0.429
294 HAMPDEN 0.316
245 LANCASTER 0.429
295 HOLLAND 0.315
246 WARE 0.428
296 DARTMOUTH 0.311
247 MANCHESTER-BY-THE-SEA 0.422
297 MONTEREY 0.310
248 EAST LONGMEADOW 0.421
298 DIGHTON 0.310
249 BERNARDSTON 0.417
299 FLORIDA 0.309
250 NEW SALEM 0.408
300 NEW MARLBOROUGH 0.307
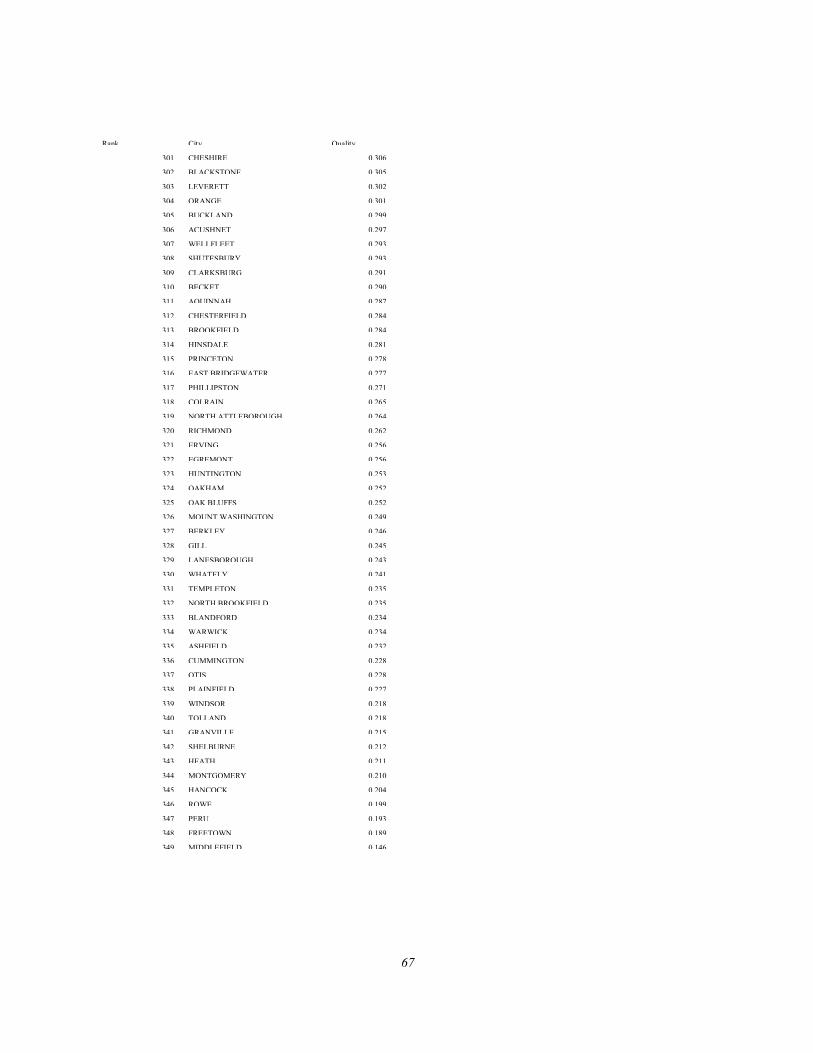
67
Rank City Quality
301 CHESHIRE 0.306
302 BLACKSTONE 0.305
303 LEVERETT 0.302
304 ORANGE 0.301
305 BUCKLAND 0.299
306 ACUSHNET 0.297
307 WELLFLEET 0.293
308 SHUTESBURY 0.293
309 CLARKSBURG 0.291
310 BECKET 0.290
311 AQUINNAH 0.287
312 CHESTERFIELD 0.284
313 BROOKFIELD 0.284
314 HINSDALE 0.281
315 PRINCETON 0.278
316 EAST BRIDGEWATER 0.277
317 PHILLIPSTON 0.271
318 COLRAIN 0.265
319 NORTH ATTLEBOROUGH 0.264
320 RICHMOND 0.262
321 ERVING 0.256
322 EGREMONT 0.256
323 HUNTINGTON 0.253
324 OAKHAM 0.252
325 OAK BLUFFS 0.252
326 MOUNT WASHINGTON 0.249
327 BERKLEY 0.246
328 GILL 0.245
329 LANESBOROUGH 0.243
330 WHATELY 0.241
331 TEMPLETON 0.235
332 NORTH BROOKFIELD 0.235
333 BLANDFORD 0.234
334 WARWICK 0.234
335 ASHFIELD 0.232
336 CUMMINGTON 0.228
337 OTIS 0.228
338 PLAINFIELD 0.227
339 WINDSOR 0.218
340 TOLLAND 0.218
341 GRANVILLE 0.215
342 SHELBURNE 0.212
343 HEATH 0.211
344 MONTGOMERY 0.210
345 HANCOCK 0.204
346 ROWE 0.199
347 PERU 0.193
348 FREETOWN 0.189
349 MIDDLEFIELD 0.146

68