Embed Size (px)
Citation preview
Annals of Nuclear Energy 43 (2012) 1–7
Contents lists available at SciVerse ScienceDirect
Annals of Nuclear Energy
journal homepage: www.elsevier .com/locate /anucene
Nuclear safeguard assessment in nuclear power plants (NPPs) using lossfunction with modified random numbers
Tae Ho Woo ⇑Department of Nuclear Engineering, Seoul National University, Gwanak 599, Gwanak-ro, Gwanak-gu, Seoul 151-742, Republic of Korea
a r t i c l e i n f o
Article history:Received 28 June 2011Received in revised form 11 December 2011Accepted 15 December 2011Available online 12 January 2012
Keywords:Nuclear power plants (NPPs)Life extensionLoss functionSafeguard Factor (SF)Nuclear Safeguard Protocol (NSP)
0306-4549/$ - see front matter � 2011 Elsevier Ltd. Adoi:10.1016/j.anucene.2011.12.022
⇑ Tel.: +82 2 880 8337; fax: +82 2 889 2688.E-mail address: [email protected]
a b s t r a c t
The energy production in nuclear power plants (NPPs) is investigated for the safeguard risk managementusing economic factors. The economic loss function is used for the life quality in the social and naturalobjects. For the basic event elements, the game theory is applied for the basic elements of the incidentsin non-secure situations. The Safeguard Factor (SF) is introduced for the quantifications of simulation. Theresults are shown by the standard productivity comparisons with the designed power operations, whichis obtained as the range of secure life extension in 2000 MWe is between 0.0000 and 9.1985 and the rangein 600 MWe is between 0.0000 and 2.7600. So, the highest value in the range of secure power operationincreases about 3.33 times higher than that of the interested power operation in this study, which meansthe safeguard assessment is quantified by the power rate in the life extension of the NPPs. The NuclearSafeguard Protocol (NSP) is constructed for the safe operation successfully.
� 2011 Elsevier Ltd. All rights reserved.
1. Introduction
By the increasing of the secure operation demand in nuclearpower plants (NPPs), it has been interested to consider the safe-guard in the power plants for reliable electricity productions. Thelife extensions of NPPs have been performed after the safety eval-uation for the plant facility in order to meet the electricity demandand the saving of construction costs. It, however, is necessary toestimate the stability of the plant security due to the aged systemsof NPPs. Serious attacks like the terror or sabotage are not benotified before incidents. So, the frequencies of the terrors couldbe estimated just by the random number samplings. It was ana-lyzed that the safeguards meant the regulations of the relatedsystems. The safeguard regulations had begun in the late 1950sand the 1960s, when nations started to trade in nuclear plantsand fuel. The purpose of the safeguard was that the trade did notgo the supply of nuclear bombs. The importance of the perceptionsis that pending nuclear disarmament, world security is betterserved with fewer rather than more nuclear weapons and nuclearweapon states (IAEA, 2004).
The list of the life extension in the Republic of Korea is shown inTable 1 which is from 1978 (KHNP, 2009). Due to the lifetime expi-ration of operations, the life extension has been performed in theRepublic of Korea. The first case was a life extension for 10 yearsin Kori Unit #1. The size and characteristics of the system are re-lated with the power generations, which are factors in the modeling
ll rights reserved.
of this paper including the refueling periods. There are new NPPs inTable 2 (KHNP, 2009), which increase up to 1400 MWe in electricaloutput. Those are two kinds of plants that the optimized powerreactor (OPR) has 1000 MWe and the advanced power reactor(APR) has 1400 MWe. The comparisons between the modeled plantand the standard plant will be considered as the secure operationassessment of the modeling.
The zero-sum method of the game theory is used for the basicevent quantifications. That is, the event means the ideal state tar-get value, which will be send in Eq. (1). The random number sam-pling is applied for the quantity of the basic events. For the lifeextension with safeguard emphasis, a loss function is modifiedfor the life quality in the simulation. There is a study for the gametheory in security in which the stochastic modeling is applied tothe reward and cost concept instead of a loss function (Sallhammaret al., 2006). The application of the production function is to the lifeextension in the case of radiation exposures (Jones et al., 2006). Thecase of the life extension in radiation exposure by the workers isshown in another paper (Thomas and Jones, 2009).
The Section 2 shows the modeling. The dynamical method forthe modeling is given in the Section 3. The Section 4 shows resultsof this paper. There are some conclusions in the Section 5.
2. Modeling
2.1. Game theory
The game theory is used for the quantifications of the values forthe events, where the events are the ideal state target value and
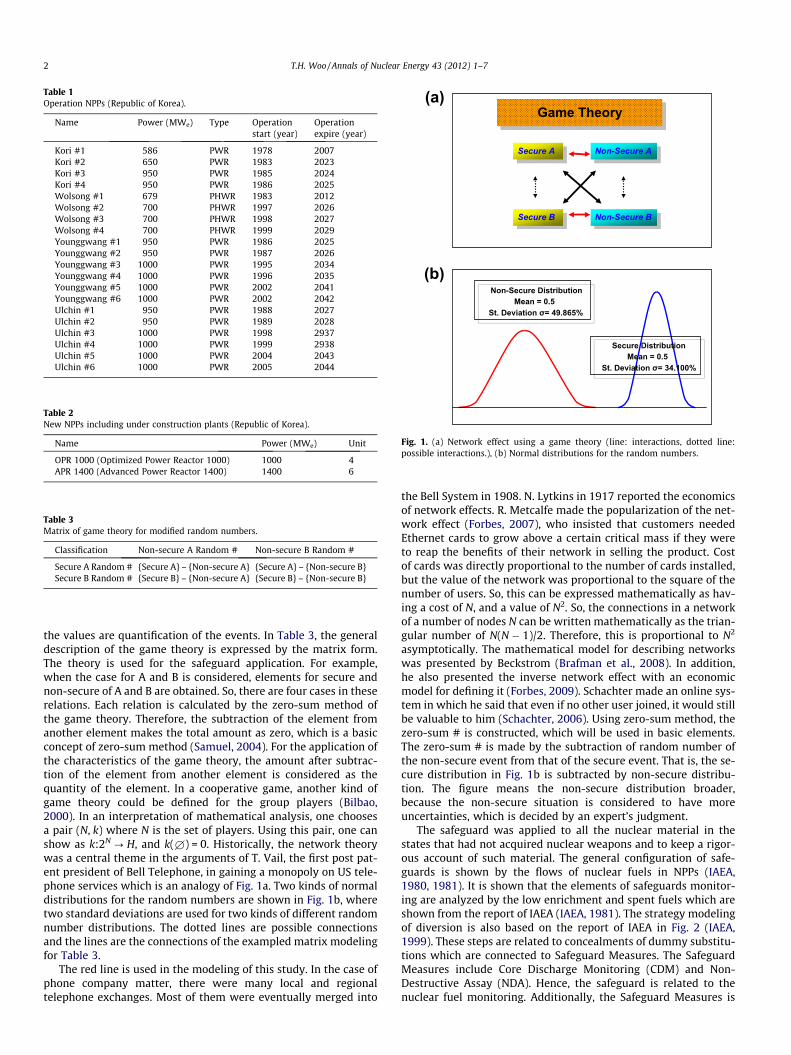
Table 1Operation NPPs (Republic of Korea).
Name Power (MWe) Type Operationstart (year)
Operationexpire (year)
Kori #1 586 PWR 1978 2007Kori #2 650 PWR 1983 2023Kori #3 950 PWR 1985 2024Kori #4 950 PWR 1986 2025Wolsong #1 679 PHWR 1983 2012Wolsong #2 700 PHWR 1997 2026Wolsong #3 700 PHWR 1998 2027Wolsong #4 700 PHWR 1999 2029Younggwang #1 950 PWR 1986 2025Younggwang #2 950 PWR 1987 2026Younggwang #3 1000 PWR 1995 2034Younggwang #4 1000 PWR 1996 2035Younggwang #5 1000 PWR 2002 2041Younggwang #6 1000 PWR 2002 2042Ulchin #1 950 PWR 1988 2027Ulchin #2 950 PWR 1989 2028Ulchin #3 1000 PWR 1998 2937Ulchin #4 1000 PWR 1999 2938Ulchin #5 1000 PWR 2004 2043Ulchin #6 1000 PWR 2005 2044
Table 2New NPPs including under construction plants (Republic of Korea).
Name Power (MWe) Unit
OPR 1000 (Optimized Power Reactor 1000) 1000 4APR 1400 (Advanced Power Reactor 1400) 1400 6
Table 3Matrix of game theory for modified random numbers.
Classification Non-secure A Random # Non-secure B Random #
Secure A Random # {Secure A} – {Non-secure A} {Secure A} – {Non-secure B}Secure B Random # {Secure B} – {Non-secure A} {Secure B} – {Non-secure B}
(a)
(b)
Secure DistributionMean = 0.5
St. Deviation σ= 34.100%
Non-Secure DistributionMean = 0.5
St. Deviation σ= 49.865%
Game Theory
Secure A
Secure B
Non-Secure A
Non-Secure B
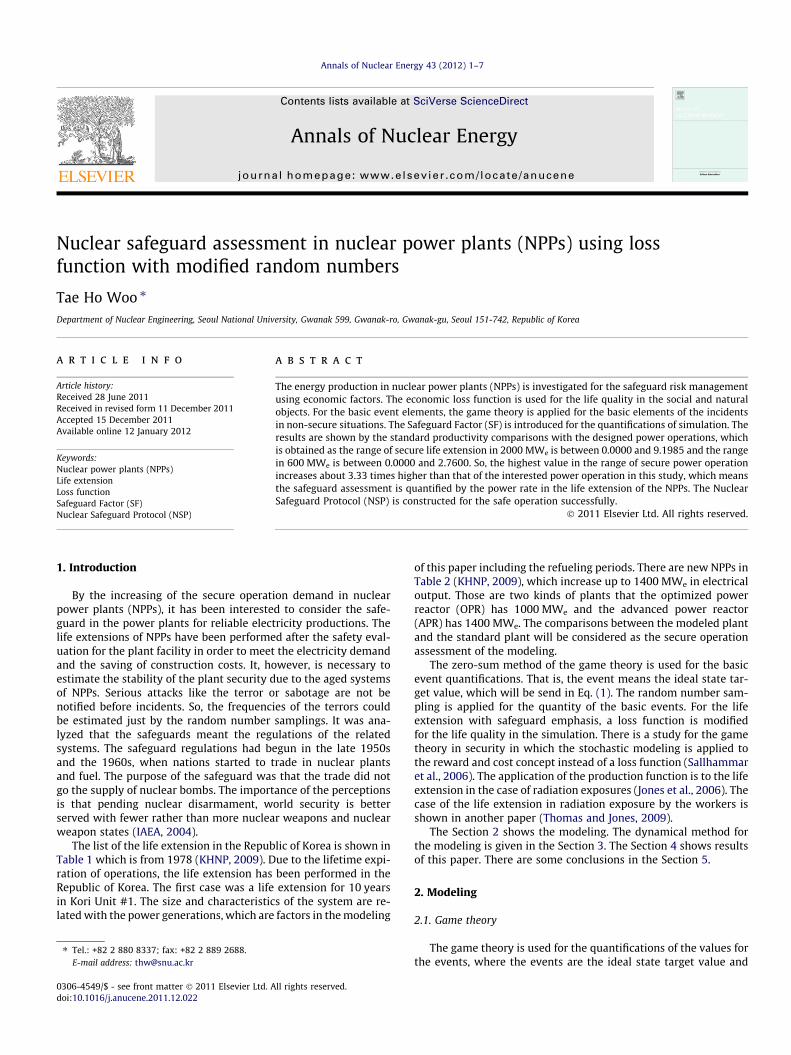
Fig. 1. (a) Network effect using a game theory (line: interactions, dotted line:possible interactions.), (b) Normal distributions for the random numbers.
2 T.H. Woo / Annals of Nuclear Energy 43 (2012) 1–7
the values are quantification of the events. In Table 3, the generaldescription of the game theory is expressed by the matrix form.The theory is used for the safeguard application. For example,when the case for A and B is considered, elements for secure andnon-secure of A and B are obtained. So, there are four cases in theserelations. Each relation is calculated by the zero-sum method ofthe game theory. Therefore, the subtraction of the element fromanother element makes the total amount as zero, which is a basicconcept of zero-sum method (Samuel, 2004). For the application ofthe characteristics of the game theory, the amount after subtrac-tion of the element from another element is considered as thequantity of the element. In a cooperative game, another kind ofgame theory could be defined for the group players (Bilbao,2000). In an interpretation of mathematical analysis, one choosesa pair (N, k) where N is the set of players. Using this pair, one canshow as k:2N ? H, and k(£) = 0. Historically, the network theorywas a central theme in the arguments of T. Vail, the first post pat-ent president of Bell Telephone, in gaining a monopoly on US tele-phone services which is an analogy of Fig. 1a. Two kinds of normaldistributions for the random numbers are shown in Fig. 1b, wheretwo standard deviations are used for two kinds of different randomnumber distributions. The dotted lines are possible connectionsand the lines are the connections of the exampled matrix modelingfor Table 3.
The red line is used in the modeling of this study. In the case ofphone company matter, there were many local and regionaltelephone exchanges. Most of them were eventually merged into
the Bell System in 1908. N. Lytkins in 1917 reported the economicsof network effects. R. Metcalfe made the popularization of the net-work effect (Forbes, 2007), who insisted that customers neededEthernet cards to grow above a certain critical mass if they wereto reap the benefits of their network in selling the product. Costof cards was directly proportional to the number of cards installed,but the value of the network was proportional to the square of thenumber of users. So, this can be expressed mathematically as hav-ing a cost of N, and a value of N2. So, the connections in a networkof a number of nodes N can be written mathematically as the trian-gular number of N(N � 1)/2. Therefore, this is proportional to N2
asymptotically. The mathematical model for describing networkswas presented by Beckstrom (Brafman et al., 2008). In addition,he also presented the inverse network effect with an economicmodel for defining it (Forbes, 2009). Schachter made an online sys-tem in which he said that even if no other user joined, it would stillbe valuable to him (Schachter, 2006). Using zero-sum method, thezero-sum # is constructed, which will be used in basic elements.The zero-sum # is made by the subtraction of random number ofthe non-secure event from that of the secure event. That is, the se-cure distribution in Fig. 1b is subtracted by non-secure distribu-tion. The figure means the non-secure distribution broader,because the non-secure situation is considered to have moreuncertainties, which is decided by an expert’s judgment.
The safeguard was applied to all the nuclear material in thestates that had not acquired nuclear weapons and to keep a rigor-ous account of such material. The general configuration of safe-guards is shown by the flows of nuclear fuels in NPPs (IAEA,1980, 1981). It is shown that the elements of safeguards monitor-ing are analyzed by the low enrichment and spent fuels which areshown from the report of IAEA (IAEA, 1981). The strategy modelingof diversion is also based on the report of IAEA in Fig. 2 (IAEA,1999). These steps are related to concealments of dummy substitu-tions which are connected to Safeguard Measures. The SafeguardMeasures include Core Discharge Monitoring (CDM) and Non-Destructive Assay (NDA). Hence, the safeguard is related to thenuclear fuel monitoring. Additionally, the Safeguard Measures is
Fuel Rod Removal from New Fuel Storage
Fuel AssembliesRemoval from Core
Material Removal from Facilities
Fuel Rod Removal from Spent Fuel Pool
Fuel Rod Removal from Consignment
Concealment Methods
Safeguard MeasuresCore Discharge Monitor (CDM) Non-Destructive Assay (NDA)
Fig. 2. Safeguard Measures by monitoring (line: safeguard monitoring direction).
Table 4Values in basic elements.
Basic element Value (0 or 1)
Safeguardmatters
Fuel Monitoring Zero-sum # < Safeguard MeasuresFactor (SMF)
StructuralVariations
Zero-sum # < 0.6
HandlingTroubles
Zero-sum # < 0.2
Human Errors Zero-sum # < 0.3
Table 5Values for concealment in Safeguard Measures Factor (SMF).
Basic element Value (0 or 1)
Fuel Rod Removal from New Fuel Storage Random # < 0.9Fuel Assemblies Removal from Core Random # < 0.7Material Facilities Removal Random # < 0.5Fuel Rod Removal from Spent Fuel Pool Random # < 0.3Fuel Rod Removal from Consignment Random # < 0.1
T.H. Woo / Annals of Nuclear Energy 43 (2012) 1–7 3
quantified as Safeguard Measures Factor (SMF) in Fig. 2. The list ofvalues of basic element in Table 4 is the basic elements for Safe-guard Matters. In the case of Fuel Monitoring, the zero-sum # iscompared with the SMF. If the zero-sum # is lower than SMF,the value is 0.0. If it is not, the value is 1.0. So, the value is obtainedas the binary number. The SMF is found by the comparison withrandom # which is generated uniformly between 0.0 and 1.0. Thisshows in Table 5. The zero-sum # is compared with 0.6 which isdecided by expert’s judgment in the case of Structural Variations.This could make the uncertainty of event, since the expert’sjudgment is not an exact value. This value, however, is decidedby expert comparing to the other two events, Handling Troublesand Human Errors. Some similar ways to the previous case areused for the other cases. This limit value is decided by the expert’sjudgment. Expert should be familiar with the nuclear fuel cycle
which is related to the safeguards. After calculating zero-sumvalues of two different random numbers, these are considered asthe 1 or 0 comparing the limiting values of expert’s judgments.In case of concealment, the maximum value is decided by the ex-pert’s judgment, too. The uniform distribution is also decided bythe expert.
In order to interpret the obscure state of terror incident, it isneeded to analysis any situation by the quantified algorithm. Thequantification is useful to make a decision-making, because the ex-pert can compare the different cases to find a securer situation. Inaddition, the quantified analysis can allow the expert to explain thegeneral people how much the situation is dangerous. For example,the holiday season can increase the terror attack possibility intransportation systems, which could be explained by the numericalvalue to understand easily. So, the zero-sum method of this work isused to construct the quantified analysis and to explain the otherparty easily.
Terrorist could understand just general feature of NPPs. How-ever, the expert analyzes the dangerous state of the NPPs by thesimulation of this study. Eventually, the terrorist act is relatedthe diversion of material by the home country. The meanings of Se-cure A, Non-secure A, Secure B, and Non-secure B are possiblestates of interested situations. The arrows in game theory are thedirection of event flows which show the event relationships inthe possible incidents. All lines are possible for the event flowcases. Especially, the solid lines are very likely cases for the terrorincident. The red line is exampled for the study, because this case isvery clearer than any other cases for the terror modeling. In case ofdotted line, this case would be happed rarely.
2.2. Safeguard Factor (SF)
The statistical methods have relied on mean-unbiased estima-tors of treatment effects. The least squares estimators haveminimum variance among all mean-unbiased estimators in theconditions of the Gauss–Markov theorem. This is applied as Safe-guard Factor (SF) in this work. It is emphasized that the compari-sons of means draws (limiting) comfort from the law of largenumbers, according to which the sample means converge to thetrue mean. Fisher emphasized comparisons of treatment means.In addition, Gauss proved that the sample-mean minimizes the ex-pected squared-error loss-function. Otherwise, Laplace proved thata median-unbiased estimator minimizes the absolute-error lossfunction. In statistical theory, the central role of the loss functionwas renewed by the statistical decision theory of Abraham Wald.But, loss functions were avoided by Fisher. Taguchi methods arestatistical methods developed by Genichi Taguchi to improve thequality of manufactured goods, and more recently also appliedto, engineering (Jorge et al., 2009) biotechnology (Rao et al.,2004, 2008), marketing and advertising (Selden, 1997). The profes-sional statisticians have used the goals and improvements broughtabout by Taguchi methods, particularly by Taguchi’s developmentof designs for studying variation, but have criticized the ineffi-ciency of some of Taguchi’s proposals (Logothetis and Wynn,1989).
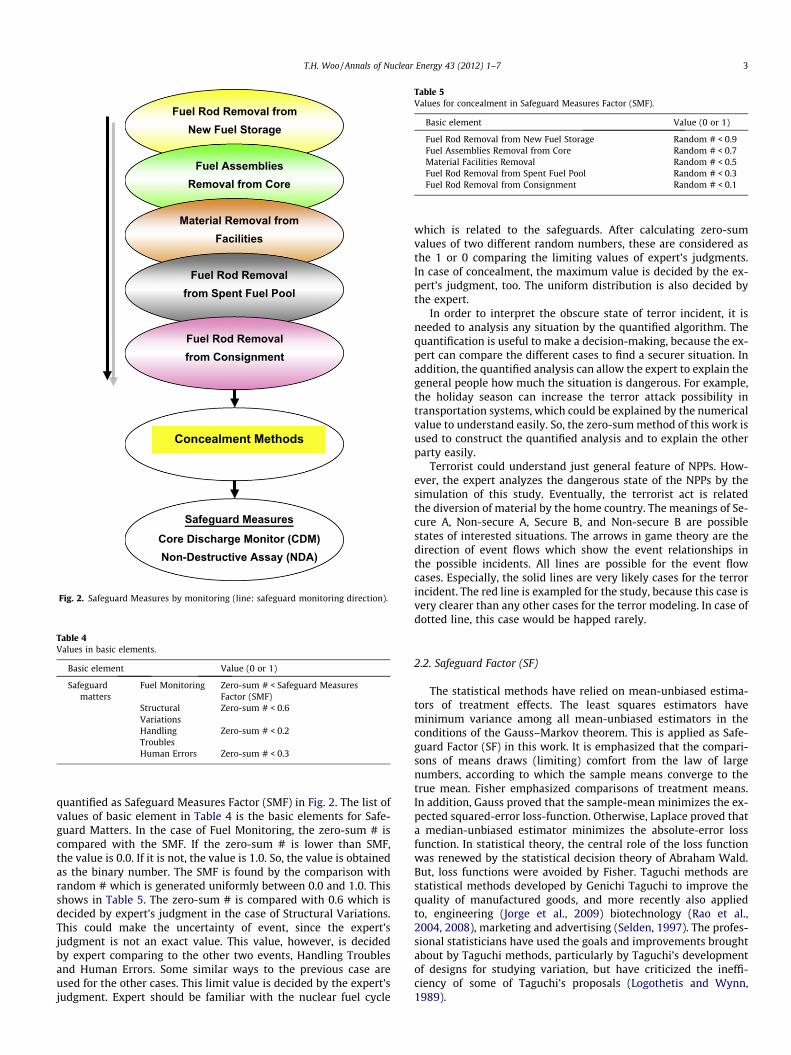
18 19 37(Month)0
Refueling period
Fig. 3. Configuration of refueling period.
Modified Random Number
1
0.75
0.5
0.25
0
0 12 24 36 48 60 72 84 96 108 120
Time (Month)Modified Random Number : Current
Ran
dom
num
ber
11
Fig. 4. Trend of random number.
4 T.H. Woo / Annals of Nuclear Energy 43 (2012) 1–7
On statistics, decision theory, and economics, a loss function is afunction that maps an event onto a real number representing theeconomic cost or regret associated with the event. The loss func-tion means the loss which includes the cost in money or the lossin utility in some other sense. This is associated with an estimatebeing ‘wrong’ (different from either a desired or a true value) asa function of a measure of the degree of wrongness. Generally,there are differences between the estimated value and the trueor desired value). The Definition of the loss function is written bysome notations. Given a random variable X over the probabilityspace (x, R, Ph) determined by a parameter h e H, and a set A ofpossible actions, a decision rule is a function d: x ? A. A loss func-tion is a real lower-bounded function L on H � A. The value L(h,d(X)) is the cost of action d (X) under parameter h (Hazewinkel,2001). For the practical applications, the use of a quadratic lossfunction is common, for example, when using least squares tech-niques or Taguchi methods. It is often more mathematically tracta-ble than other loss functions, because of the properties ofvariances, as well as being symmetric. An error above the targetcauses the same loss as the same magnitude of error below the tar-get. If the target is a, then a quadratic loss function is (Taguchiet al., 1989),
LðxÞ ¼ kðx� aÞ2 ð1Þ
where L(x) is the loss to society of a unit of output at value x; a theideal state target value, where at a, L = 0; k is a constant for someconstant k, the value of the constant makes no difference to a deci-sion, and can be ignored by setting it equal to 1. In common statis-tics, including t-tests, regression models, design of experiments, andmuch else use least squares linear models theory, which is based onthe Taguchi loss function. The quadratic loss function is also used inlinear-quadratic optimal control problems (Berger, 1985).
By derivation of L(x),
ddx
LðxÞ ¼ �2kðx� aÞ ð2Þ
Then, the minimum value is obtained in zero of derivation, so,
a ¼ x ð3Þ
That is, when the target is same to the x, the values is mini-mized. The loss is minimized. The safeguard factor is calculatedby this value.
3. Dynamical method
There are some comparisons using the value SF in Section 2. Therefueling is done in every 18 months, which is seen in Fig. 3. Therandom number generation is done during the 120 months(10 years) in Fig. 4. The circle of Fig. 4 means the highest valueas 1.0. Random numbers are generated as the values between 0.0and 1.0. It is possible to extend the period as 10 more years aftersafety evaluation, which is a general procedure of life extensionin nuclear industry. The lifetime extension of NPPs affects on oper-ation and maintenance strategies, decommissioning schedule andstrategy, radioactive waste management and disposal require-ments. So, these tasks are related to the security of the operations.Dynamical variations of the simulation reflect the situations ofplant. In addition, this life extension impacts on the future nuclearenergy development schedules.
The Vensim software package is used for the quantificationswhich, has been used for developing, analyzing, and packaginghigh quality dynamic models (Vensim, 2009). The models are con-structed graphically or in a text editor. The features include dy-namic functions, subscripting (arrays), Monte-Carlo sensitivityanalysis, optimization, data handling, application interfaces, and
more (Vensim, 2009). In the modeling, the x of Eq. (1) is obtainedby random number. The value is calculated by the game theoryin Fig. 1b.
4. Results
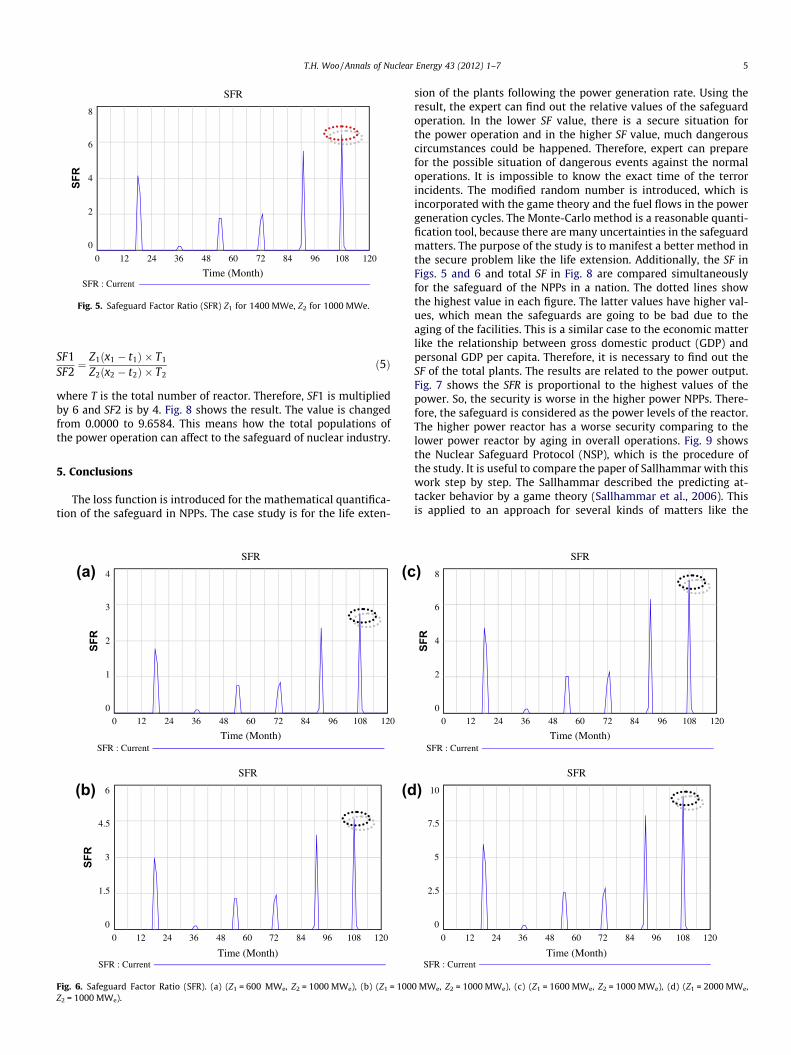
The results of the study are obtained by SF values. There aredynamical quantifications for the life extension in NPPs which isin Fig. 5 by Safeguard Factor Ratio (SFR) which is seen in Eq. (4).
SF1SF2¼ Z1ðx1 � t1Þ
Z2ðx2 � t2Þð4Þ
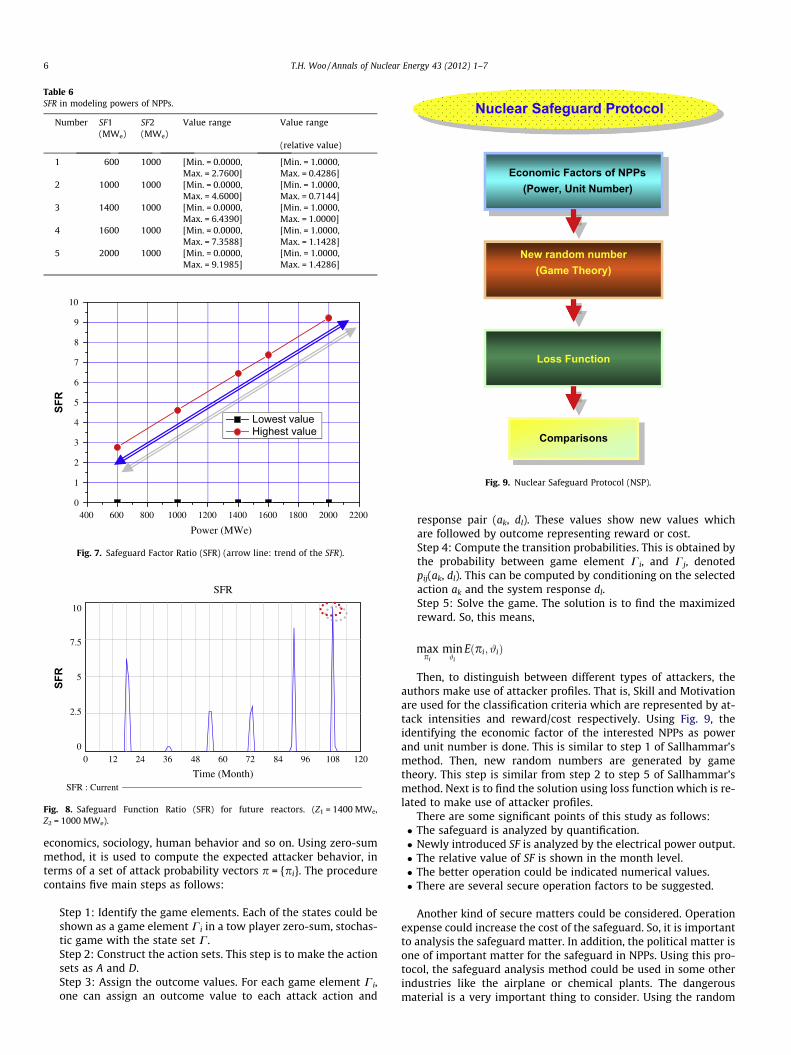
For the case of 1400 MWe in SF1 and 1000 MWe in SF2, the SFRis higher than 6.43, which is a standard value for the safeguard pro-ductions. This means the Z1 of 1400 MWe case has the dangerouspower generation considering the safeguard aspect. Fig. 6a showsthe case of 600 MWe and 1000 MWe for SF1 and SF2 respectively.Fig. 6b–d show the case of 1000 MWe, 1600 MWe and 2000 MWe
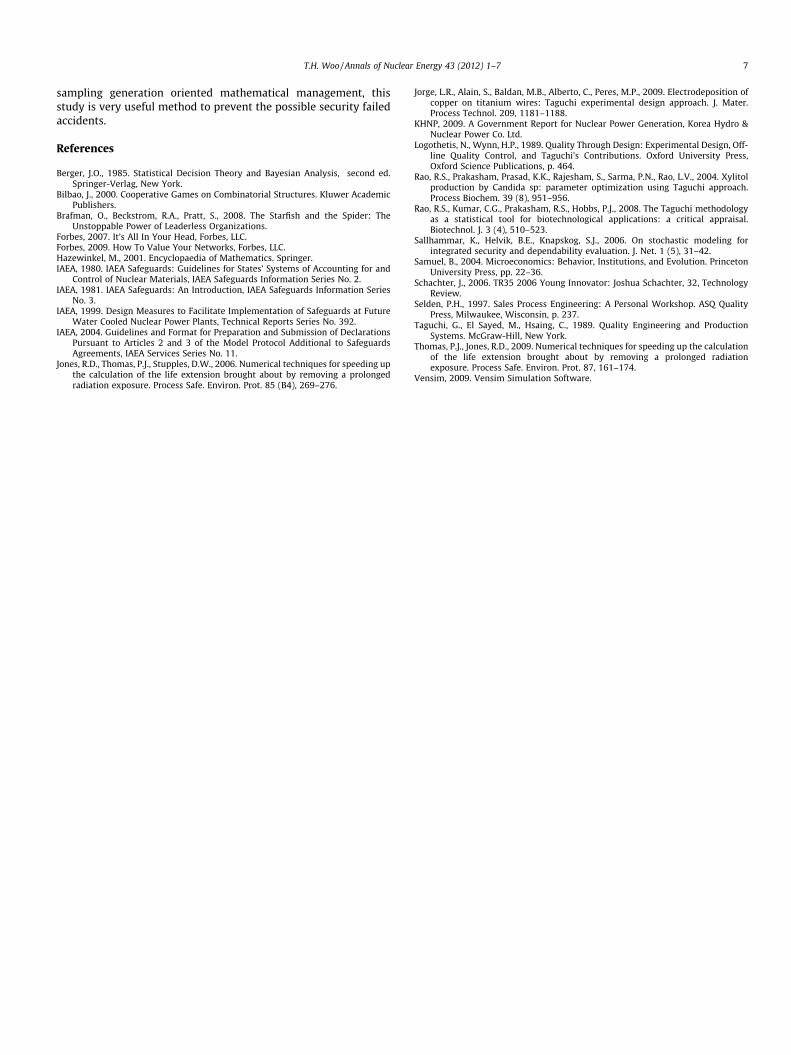
for SF1 respectively and 1000 MWe for Z2. Table 6 shows the SFranges of selective powers. The range of secure life extension in2000 MWe is between 0.0000 and 9.1985 and the rangein 600 MWe is between 0.0000 and 2.7600. So, the highest rangein the secure power operation increases about 3.33 times higherthan that of the interested power operation in this study, whichmeans the safeguard assessment is quantified mathematically inthe life extension of the NPPs. The relative values to 1000 MWe
and 1000 MWe for SF1 and SF2 is seen in last column of Table 6.There are SF values as the lowest and highest values in Fig. 7.The double line shows the trend of highest value line of SF.
It is written as follows considering the population of NPPs in fu-ture case of the optimized power reactor (OPR) 1000 and the ad-vance power reactor (APR) 1400;
SFR
8
6
4
2
0
0 12 24 36 48 60 72 84 96 108 120
Time (Month)SFR : Current
SFR
Fig. 5. Safeguard Factor Ratio (SFR) Z1 for 1400 MWe, Z2 for 1000 MWe.
T.H. Woo / Annals of Nuclear Energy 43 (2012) 1–7 5
SF1SF2¼ Z1ðx1 � t1Þ � T1
Z2ðx2 � t2Þ � T2ð5Þ
where T is the total number of reactor. Therefore, SF1 is multipliedby 6 and SF2 is by 4. Fig. 8 shows the result. The value is changedfrom 0.0000 to 9.6584. This means how the total populations ofthe power operation can affect to the safeguard of nuclear industry.
5. Conclusions
The loss function is introduced for the mathematical quantifica-tion of the safeguard in NPPs. The case study is for the life exten-
SFR
6
4.5
3
1.5
0
0 12 24 36 48 60 72 84 96 108 120
Time (Month)SFR : Current
(b)
(c
SFR
(d
SFR
4
3
2
1
0
0 12 24 36 48 60 72 84 96 108 120
Time (Month)SFR : Current
(a)
SFR
Fig. 6. Safeguard Factor Ratio (SFR). (a) (Z1 = 600 MWe, Z2 = 1000 MWe), (b) (Z1 = 100Z2 = 1000 MWe).
sion of the plants following the power generation rate. Using theresult, the expert can find out the relative values of the safeguardoperation. In the lower SF value, there is a secure situation forthe power operation and in the higher SF value, much dangerouscircumstances could be happened. Therefore, expert can preparefor the possible situation of dangerous events against the normaloperations. It is impossible to know the exact time of the terrorincidents. The modified random number is introduced, which isincorporated with the game theory and the fuel flows in the powergeneration cycles. The Monte-Carlo method is a reasonable quanti-fication tool, because there are many uncertainties in the safeguardmatters. The purpose of the study is to manifest a better method inthe secure problem like the life extension. Additionally, the SF inFigs. 5 and 6 and total SF in Fig. 8 are compared simultaneouslyfor the safeguard of the NPPs in a nation. The dotted lines showthe highest value in each figure. The latter values have higher val-ues, which mean the safeguards are going to be bad due to theaging of the facilities. This is a similar case to the economic matterlike the relationship between gross domestic product (GDP) andpersonal GDP per capita. Therefore, it is necessary to find out theSF of the total plants. The results are related to the power output.Fig. 7 shows the SFR is proportional to the highest values of thepower. So, the security is worse in the higher power NPPs. There-fore, the safeguard is considered as the power levels of the reactor.The higher power reactor has a worse security comparing to thelower power reactor by aging in overall operations. Fig. 9 showsthe Nuclear Safeguard Protocol (NSP), which is the procedure ofthe study. It is useful to compare the paper of Sallhammar with thiswork step by step. The Sallhammar described the predicting at-tacker behavior by a game theory (Sallhammar et al., 2006). Thisis applied to an approach for several kinds of matters like the
SFR
8
6
4
2
0
0 12 24 36 48 60 72 84 96 108 120
Time (Month)SFR : Current
)
SFR
SFR
10
7.5
5
2.5
0
0 12 24 36 48 60 72 84 96 108 120
Time (Month)SFR : Current
)
0 MWe, Z2 = 1000 MWe), (c) (Z1 = 1600 MWe, Z2 = 1000 MWe), (d) (Z1 = 2000 MWe,
400 600 800 1000 1200 1400 1600 1800 2000 22000
1
2
3
4
5
6
7
8
9
10
SFR
Power (MWe)
Lowest value Highest value
Fig. 7. Safeguard Factor Ratio (SFR) (arrow line: trend of the SFR).
SFR
10
7.5
5
2.5
00 12 24 36 48 60 72 84 96 108 120
Time (Month)SFR : Current
SFR
Fig. 8. Safeguard Function Ratio (SFR) for future reactors. (Z1 = 1400 MWe,Z2 = 1000 MWe).
Comparisons
Economic Factors of NPPs(Power, Unit Number)
New random number (Game Theory)
Loss Function
Nuclear Safeguard Protocol
Fig. 9. Nuclear Safeguard Protocol (NSP).
Table 6SFR in modeling powers of NPPs.
Number SF1(MWe)
SF2(MWe)
Value range Value range
(relative value)
1 600 1000 [Min. = 0.0000,Max. = 2.7600]
[Min. = 1.0000,Max. = 0.4286]
2 1000 1000 [Min. = 0.0000,Max. = 4.6000]
[Min. = 1.0000,Max. = 0.7144]
3 1400 1000 [Min. = 0.0000,Max. = 6.4390]
[Min. = 1.0000,Max. = 1.0000]
4 1600 1000 [Min. = 0.0000,Max. = 7.3588]
[Min. = 1.0000,Max. = 1.1428]
5 2000 1000 [Min. = 0.0000,Max. = 9.1985]
[Min. = 1.0000,Max. = 1.4286]
6 T.H. Woo / Annals of Nuclear Energy 43 (2012) 1–7
economics, sociology, human behavior and so on. Using zero-summethod, it is used to compute the expected attacker behavior, interms of a set of attack probability vectors p = {pi}. The procedurecontains five main steps as follows:
Step 1: Identify the game elements. Each of the states could beshown as a game element Ci in a tow player zero-sum, stochas-tic game with the state set C.Step 2: Construct the action sets. This step is to make the actionsets as A and D.Step 3: Assign the outcome values. For each game element Ci,one can assign an outcome value to each attack action and
response pair (ak, dl). These values show new values whichare followed by outcome representing reward or cost.Step 4: Compute the transition probabilities. This is obtained bythe probability between game element Ci, and Cj, denotedpij(ak, dl). This can be computed by conditioning on the selectedaction ak and the system response dl.Step 5: Solve the game. The solution is to find the maximizedreward. So, this means,
maxpi
min#i
Eðpi; #iÞ
Then, to distinguish between different types of attackers, theauthors make use of attacker profiles. That is, Skill and Motivationare used for the classification criteria which are represented by at-tack intensities and reward/cost respectively. Using Fig. 9, theidentifying the economic factor of the interested NPPs as powerand unit number is done. This is similar to step 1 of Sallhammar’smethod. Then, new random numbers are generated by gametheory. This step is similar from step 2 to step 5 of Sallhammar’smethod. Next is to find the solution using loss function which is re-lated to make use of attacker profiles.
There are some significant points of this study as follows:� The safeguard is analyzed by quantification.� Newly introduced SF is analyzed by the electrical power output.� The relative value of SF is shown in the month level.� The better operation could be indicated numerical values.� There are several secure operation factors to be suggested.
Another kind of secure matters could be considered. Operationexpense could increase the cost of the safeguard. So, it is importantto analysis the safeguard matter. In addition, the political matter isone of important matter for the safeguard in NPPs. Using this pro-tocol, the safeguard analysis method could be used in some otherindustries like the airplane or chemical plants. The dangerousmaterial is a very important thing to consider. Using the random
T.H. Woo / Annals of Nuclear Energy 43 (2012) 1–7 7
sampling generation oriented mathematical management, thisstudy is very useful method to prevent the possible security failedaccidents.
References
Berger, J.O., 1985. Statistical Decision Theory and Bayesian Analysis, second ed.Springer-Verlag, New York.
Bilbao, J., 2000. Cooperative Games on Combinatorial Structures. Kluwer AcademicPublishers.
Brafman, O., Beckstrom, R.A., Pratt, S., 2008. The Starfish and the Spider: TheUnstoppable Power of Leaderless Organizations.
Forbes, 2007. It’s All In Your Head, Forbes, LLC.Forbes, 2009. How To Value Your Networks, Forbes, LLC.Hazewinkel, M., 2001. Encyclopaedia of Mathematics. Springer.IAEA, 1980. IAEA Safeguards: Guidelines for States’ Systems of Accounting for and
Control of Nuclear Materials, IAEA Safeguards Information Series No. 2.IAEA, 1981. IAEA Safeguards: An Introduction, IAEA Safeguards Information Series
No. 3.IAEA, 1999. Design Measures to Facilitate Implementation of Safeguards at Future
Water Cooled Nuclear Power Plants, Technical Reports Series No. 392.IAEA, 2004. Guidelines and Format for Preparation and Submission of Declarations
Pursuant to Articles 2 and 3 of the Model Protocol Additional to SafeguardsAgreements, IAEA Services Series No. 11.
Jones, R.D., Thomas, P.J., Stupples, D.W., 2006. Numerical techniques for speeding upthe calculation of the life extension brought about by removing a prolongedradiation exposure. Process Safe. Environ. Prot. 85 (B4), 269–276.
Jorge, L.R., Alain, S., Baldan, M.B., Alberto, C., Peres, M.P., 2009. Electrodeposition ofcopper on titanium wires: Taguchi experimental design approach. J. Mater.Process Technol. 209, 1181–1188.
KHNP, 2009. A Government Report for Nuclear Power Generation, Korea Hydro &Nuclear Power Co. Ltd.
Logothetis, N., Wynn, H.P., 1989. Quality Through Design: Experimental Design, Off-line Quality Control, and Taguchi’s Contributions. Oxford University Press,Oxford Science Publications, p. 464.
Rao, R.S., Prakasham, Prasad, K.K., Rajesham, S., Sarma, P.N., Rao, L.V., 2004. Xylitolproduction by Candida sp: parameter optimization using Taguchi approach.Process Biochem. 39 (8), 951–956.
Rao, R.S., Kumar, C.G., Prakasham, R.S., Hobbs, P.J., 2008. The Taguchi methodologyas a statistical tool for biotechnological applications: a critical appraisal.Biotechnol. J. 3 (4), 510–523.
Sallhammar, K., Helvik, B.E., Knapskog, S.J., 2006. On stochastic modeling forintegrated security and dependability evaluation. J. Net. 1 (5), 31–42.
Samuel, B., 2004. Microeconomics: Behavior, Institutions, and Evolution. PrincetonUniversity Press, pp. 22–36.
Schachter, J., 2006. TR35 2006 Young Innovator: Joshua Schachter, 32, TechnologyReview.
Selden, P.H., 1997. Sales Process Engineering: A Personal Workshop. ASQ QualityPress, Milwaukee, Wisconsin, p. 237.
Taguchi, G., El Sayed, M., Hsaing, C., 1989. Quality Engineering and ProductionSystems. McGraw-Hill, New York.
Thomas, P.J., Jones, R.D., 2009. Numerical techniques for speeding up the calculationof the life extension brought about by removing a prolonged radiationexposure. Process Safe. Environ. Prot. 87, 161–174.
Vensim, 2009. Vensim Simulation Software.


![Advanced nuclear plant design options to cope with ... · innovative design” [1.1]. Multiple concepts and projects of nuclear power plants (NPPs) with evolutionary or innovative](https://img.pdfslide.net/doc/110x75/6000f650903bbf6dc814744e/advanced-nuclear-plant-design-options-to-cope-with-innovative-designa-11.jpg)