Embed Size (px)
Citation preview
Int.J.Curr.Microbiol.App.Sci (2018) 7(3): 558-569
558
Original Research Article https://doi.org/10.20546/ijcmas.2018.703.067
Nutrient Uptake in Rice Crop as Influenced by Vermicompost and
Nitrogen Application
Amit Kumar1*
, B.P. Dhyani2, Vipin Kumar
3*, Ashish Rai
3,
Arvind Kumar4 and Karamveer
5
1Department of Soil Science, Navjeevan Kisan Degree College, Mawana, Meerut,
Uttar Pradesh, India 2Department of Soil Science, Sardar Vallabhbhai Patel University of Agriculture and
Technology, Meerut, Uttar Pradesh, India 3Department of Soil Science and Agricultural Chemistry, Institute of Agricultural Sciences,
Banaras Hindu University, Varanasi, 221005, Uttar Pradesh, India 4Department of Agricultural Chemistry, R. K. (P.G.) College, Shamli, Uttar Pradesh, India
5Department of Agricultural Chemistry, Kisan (P.G.) College, Simbhaoli, Hapur,
Uttar Pradesh, India
*Corresponding author
A B S T R A C T
International Journal of Current Microbiology and Applied Sciences ISSN: 2319-7706 Volume 7 Number 03 (2018) Journal homepage: http://www.ijcmas.com
Vermicompost scheduling on nutrient uptake at different growth stages of rice crop
were assessed at two field experiments conducted during 2011-12 and 2012-13 in the
Sardar Vallabhbhai Patel University of Agriculture and Technology, Meerut. Different
levels of vermicompost along with nitrogen (N) were included in the study. Initially
higher nutrient availability in soil in these treatments responded well to plant growth
and plant nutrient contents and a significant variation in dry matter accumulation and
plant nutrient contents was noticed. Since dry matter yield and nutrient content were
maximum/significantly higher in these treatments therefore significantly higher
nutrient uptake is obvious. Application of sub optimal level of inorganic N also
reflected its impact on dry matter production, plant nutrient content and there by
recorded lower quantities of plant nutrient uptake by recorded lower quantities. The
nutrients uptake in plant samples at different growth stages differed significantly with
the application of Vermicompost and NPK. Plant nutrient uptake was declined with
the advancement in crop growth. Plant nutrient uptake was higher in T2 (100% NPK)
at different growth stages of rice during both the years while minimum was found in
control. Plant iron, zinc, copper and manganese uptake at different growth stages
differ significantly with the application of different treatments. The maximum plant
uptake of these micronutrients during entire growth period was found with the
application of 100% NPK and it was followed by T3 where Two ton vermicompost
was applied as basal.
K e y w o r d s
Nutrient uptake,
Vermicompost,
Nitrogen, Rice and
growth stages
Accepted:
07 February 2018
Available Online: 10 March 2018
Article Info
Int.J.Curr.Microbiol.App.Sci (2018) 7(3): 558-569
559
Introduction
Since soils have become starved for primary,
secondary and micronutrients for decade.
Deficiency of secondary and micro plant
nutrients is mainly attributed to almost neglect
of organic manures by farmers. To sustain or
increase the productivity of rice-wheat system,
it is important that soil status must be perfect
the level of organic matter in soil should be
enough and overall the soil must be without
any constraints. Long term experiments have
indicated that continuous and intensive use of
chemical fertilizers have resulted in numerous
problems like micronutrients deficiencies,
nutrient imbalances in soil and plant system,
pest infestation, environmental degradation,
deterioration of soil health stagnation of crop
yields.Use of both organic and inorganic
fertilizers to increase crop production is called
integrated nutrient management. Rai et al.,
2011 also reported that he effect of phosphate
and sulphur were found effective in increasing
the availability of P at higher doses and the
amount of P was found greater in the surface
soil in comparison to sub-soil. INM system
refers to a balanced use of chemical fertilizer
in combination with organic sources. These
organic sources may be organic manures,
green manure, rural wastes, crop residues,
biofertilizers and vermicompost. Country wide
different organic sources of plant nutrients had
been evaluated as a possible component of
INM and among these vermicompost is most
important.
Vermicompost had slight edge over most
commonly used organic source farm yard
manure by virtue of its higher nutrient content
and easily decomposability owing to slightly
lower C: N ratio. Conversion of natural
ecosystems into agricultural lands for
intensive cultivation severely depletes SOC
pools (Kumar et al., 2013). The positive effect
of vermicompost application on crop growth,
yield and soil properties is well documented
and established. Rao et al., (2000), Zahid
(2001) had reported better growth of chickpea,
tomato and rice with the application of
vermicompost. Kumar et al., 2017 and Kumar
et al., 2017 have also been reported significant
use of vermicompost along with nitrogen in
rice crop. Dussere (1992) reported that
vermicompost helps to improve and protect
fertility of top soil and also helps to boost up
productivity by 40% with 20 to 60% lower
inputs, It also enhance the quality of end
products and thereby creating significant
impact on flexibility in marketing as well as
increases the storage time. Vermicompost
contain 30 to 50 percent substance which help
in the stimulation of plant growth, particularly
that of roots. Reduction in soil pH was also
observed with the addition of vermicompost
which is obvious due to production of various
organic acids on the decomposition of
vermicompost (Duhan and Singh, 2002) and
(Rai et al., 2012) which helps in nutrient
availability especially micronutrient in soil.
Robinson et al., (1992) reported that the
nutrients present in vermicompost are readily
available which signifies the effect of
vermicompost in soil. There is no doubt about
the role of organic sources on the crop
productivity and soil sustainability but the
question is timing of its application. Most of
the organic sources are applied in soil well
before sowing or as basal so that it may
stabilize its C: N ratio to an ideal value. In the
present study an attempt was made to study
the effect of timing of vermicompost
application in integrated mode onNutrient
uptake in rice crop at different growth stages
as influenced by vermicompost and nitrogen
application.
Materials and Methods
Two field experiments were conducted during
2011-12 and 2012-13 in the CRC of Sardar
Vallabhbhai Patel University of Agriculture
and Technology, Meerut (U.P.) which is
Int.J.Curr.Microbiol.App.Sci (2018) 7(3): 558-569
560
located at latitude of 290
40′ north and
longitude of 770
42′ east. The experimental
soil was sandy loam in texture having, low
organic carbon, available nitrogen and
medium in phosphorus and potassium. To
study the effect of vermicompost scheduling
on plant nutrient uptake at different growth
stages of rice crop consisting ten treatments
including; T1-Control (without NPK) in rice,
T2-100% RDF to rice, T3-75% N,100% P and
K + Vermicompost @ 2 ton ha-1
as basal to
rice, T4-75% N, 100% P and K
+Vermicompost @ 2 ton ha-1
at tillering stage
to rice, T5-75% N, 100% P and K +
Vermicompost @ 2 ton ha-1
at panicle
initiation, T6-75% N, 100% P and K +
Vermicompost @ 2 ton ha-1
at flowering stage
to rice, T7-50% N, 100% P and K +
Vermicompost @ 4 ton ha-1
as basal to rice,
T8-50% N, 100% P and K + Vermicompost @
4 ton ha-1
at tillering stage to rice, T9-50% N,
100% P and K + Vermicompost @ 4 ton ha-1
at panicle initiation to rice and T10-50% N,
100% P and K + Vermicompost @ 4 ton ha-1
at flowering stage to rice. Recommended dose
of fertilizers (NPK) for rice crop was 120, 60
and 60 kg ha-1
, respectively. The pH was
determined in (1:2) soil water suspension
(Jackson, 1973), The soluble salts in soils
were measured with a conductivity meter, the
electrical conductivity was expressed as deci
Siemens per meter (dSm-1), organic carbon
was estimated by modified Walkley and Black
(1934) method as described by Jackson
(1967), available nitrogen was determined by
alkaline permanganate method (Subbiah and
Asija, 1956), determination of available
phosphorus was done by Olsen’s method
(Olsen et al., 1954), available potassium was
determined by using neutral ammonium
acetate as an extractant (Hanway and Heidal,
1952), available zinc, iron, manganese and
copper in soil were extracted by DTPA
extractant (Lindsay and Norvell, 1978). The
raw data collected for all parameters at
different crop stages during the course of
investigation was compiled and subjected to
statistical analysis using the analysis of
variance technique (Gomez and Gomez,
1984). The critical difference (at 5 % level of
probability) was computed for comparing
treatment mean.
Results and Discussion
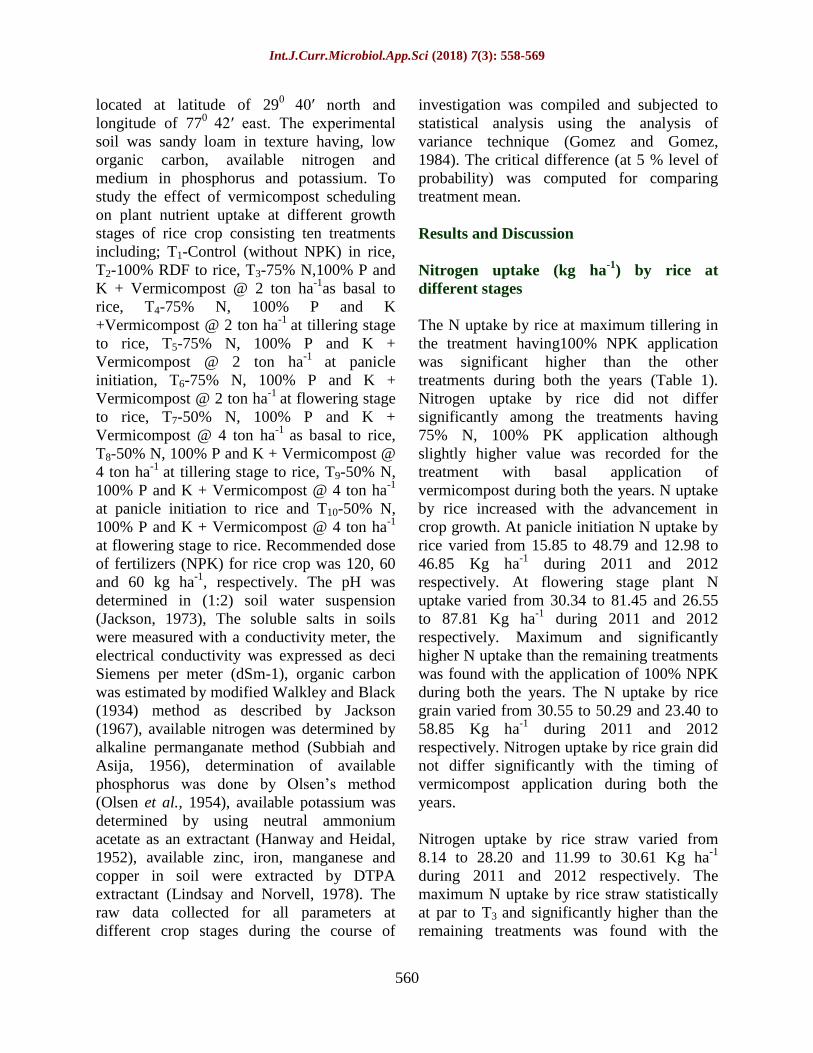
Nitrogen uptake (kg ha-1
) by rice at
different stages
The N uptake by rice at maximum tillering in
the treatment having100% NPK application
was significant higher than the other
treatments during both the years (Table 1).
Nitrogen uptake by rice did not differ
significantly among the treatments having
75% N, 100% PK application although
slightly higher value was recorded for the
treatment with basal application of
vermicompost during both the years. N uptake
by rice increased with the advancement in
crop growth. At panicle initiation N uptake by
rice varied from 15.85 to 48.79 and 12.98 to
46.85 Kg ha-1
during 2011 and 2012
respectively. At flowering stage plant N
uptake varied from 30.34 to 81.45 and 26.55
to 87.81 Kg ha-1
during 2011 and 2012
respectively. Maximum and significantly
higher N uptake than the remaining treatments
was found with the application of 100% NPK
during both the years. The N uptake by rice
grain varied from 30.55 to 50.29 and 23.40 to
58.85 Kg ha-1
during 2011 and 2012
respectively. Nitrogen uptake by rice grain did
not differ significantly with the timing of
vermicompost application during both the
years.
Nitrogen uptake by rice straw varied from
8.14 to 28.20 and 11.99 to 30.61 Kg ha-1
during 2011 and 2012 respectively. The
maximum N uptake by rice straw statistically
at par to T3 and significantly higher than the
remaining treatments was found with the
Int.J.Curr.Microbiol.App.Sci (2018) 7(3): 558-569
561
application 100% NPK (T2). Application of
vermicompost with 75%N, 100% PK at
flowering stage resulted in significantly lower
N uptake than the treatment where
vermicompost was applied as basal which was
statistically at par to T4and T5 during both the
years.
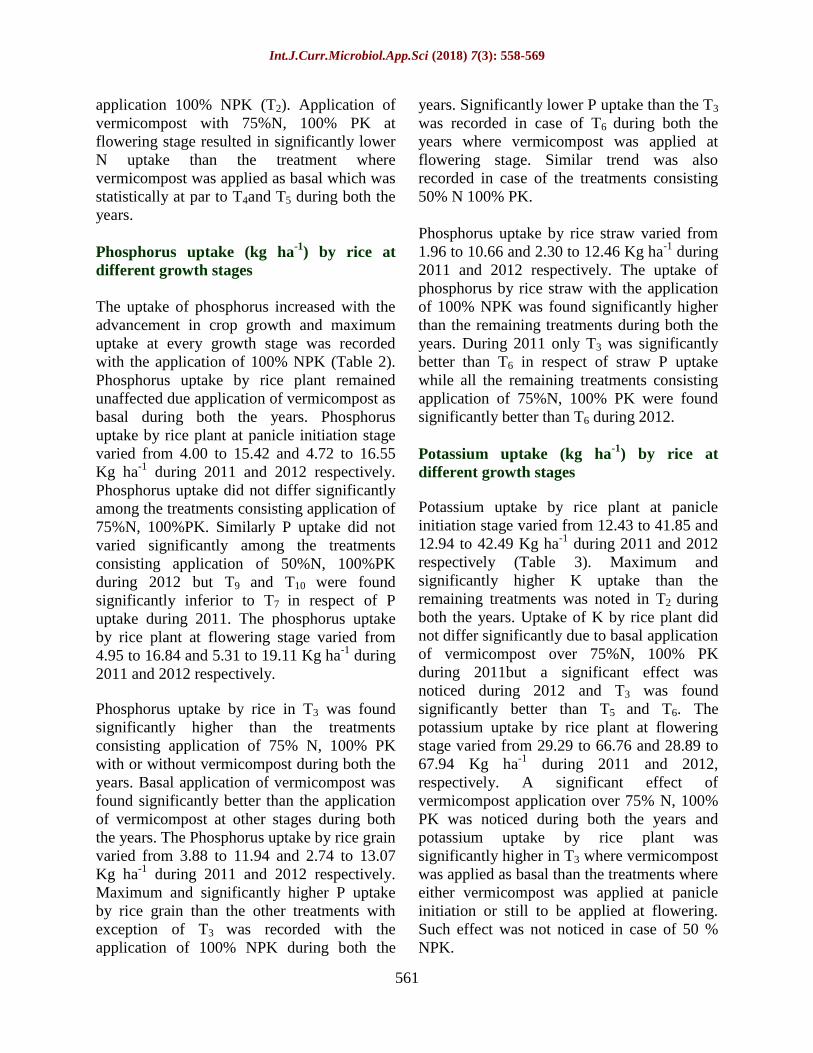
Phosphorus uptake (kg ha-1
) by rice at
different growth stages
The uptake of phosphorus increased with the
advancement in crop growth and maximum
uptake at every growth stage was recorded
with the application of 100% NPK (Table 2).
Phosphorus uptake by rice plant remained
unaffected due application of vermicompost as
basal during both the years. Phosphorus
uptake by rice plant at panicle initiation stage
varied from 4.00 to 15.42 and 4.72 to 16.55
Kg ha-1
during 2011 and 2012 respectively.
Phosphorus uptake did not differ significantly
among the treatments consisting application of
75%N, 100%PK. Similarly P uptake did not
varied significantly among the treatments
consisting application of 50%N, 100%PK
during 2012 but T9 and T10 were found
significantly inferior to T7 in respect of P
uptake during 2011. The phosphorus uptake
by rice plant at flowering stage varied from
4.95 to 16.84 and 5.31 to 19.11 Kg ha-1
during
2011 and 2012 respectively.
Phosphorus uptake by rice in T3 was found
significantly higher than the treatments
consisting application of 75% N, 100% PK
with or without vermicompost during both the
years. Basal application of vermicompost was
found significantly better than the application
of vermicompost at other stages during both
the years. The Phosphorus uptake by rice grain
varied from 3.88 to 11.94 and 2.74 to 13.07
Kg ha-1
during 2011 and 2012 respectively.
Maximum and significantly higher P uptake
by rice grain than the other treatments with
exception of T3 was recorded with the
application of 100% NPK during both the
years. Significantly lower P uptake than the T3
was recorded in case of T6 during both the
years where vermicompost was applied at
flowering stage. Similar trend was also
recorded in case of the treatments consisting
50% N 100% PK.
Phosphorus uptake by rice straw varied from
1.96 to 10.66 and 2.30 to 12.46 Kg ha-1
during
2011 and 2012 respectively. The uptake of
phosphorus by rice straw with the application
of 100% NPK was found significantly higher
than the remaining treatments during both the
years. During 2011 only T3 was significantly
better than T6 in respect of straw P uptake
while all the remaining treatments consisting
application of 75%N, 100% PK were found
significantly better than T6 during 2012.
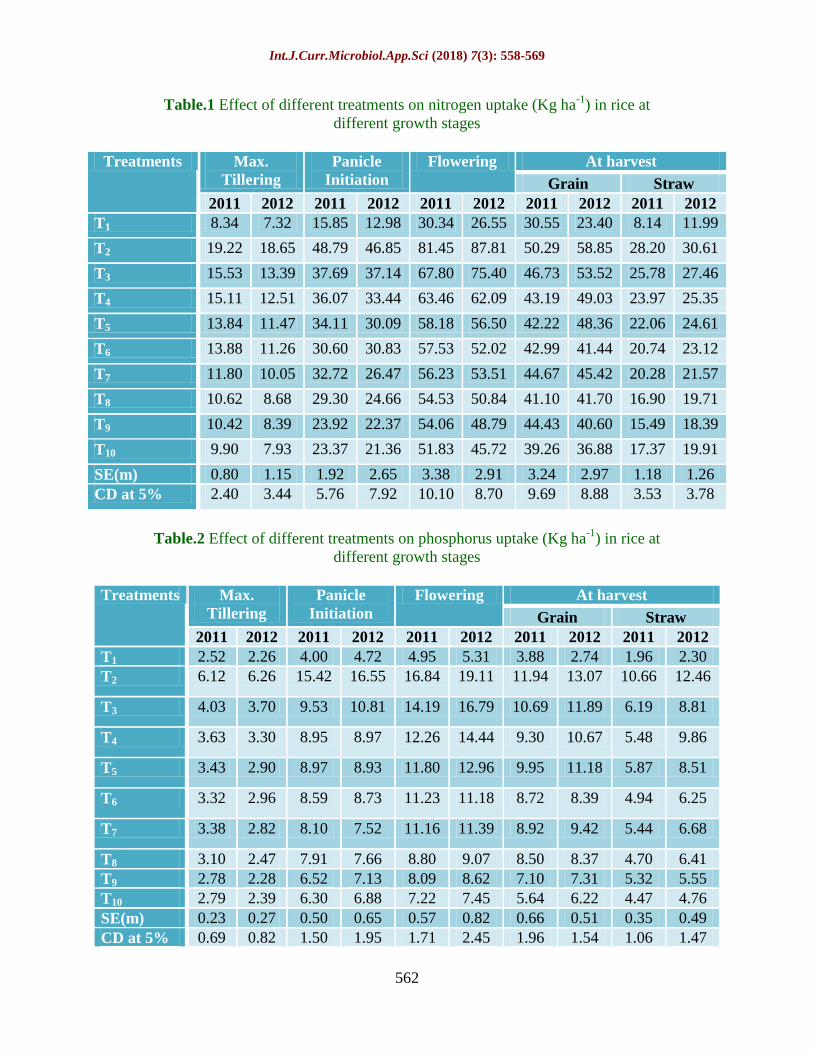
Potassium uptake (kg ha-1
) by rice at
different growth stages
Potassium uptake by rice plant at panicle
initiation stage varied from 12.43 to 41.85 and
12.94 to 42.49 Kg ha-1
during 2011 and 2012
respectively (Table 3). Maximum and
significantly higher K uptake than the
remaining treatments was noted in T2 during
both the years. Uptake of K by rice plant did
not differ significantly due to basal application
of vermicompost over 75%N, 100% PK
during 2011but a significant effect was
noticed during 2012 and T3 was found
significantly better than T5 and T6. The
potassium uptake by rice plant at flowering
stage varied from 29.29 to 66.76 and 28.89 to
67.94 Kg ha-1
during 2011 and 2012,
respectively. A significant effect of
vermicompost application over 75% N, 100%
PK was noticed during both the years and
potassium uptake by rice plant was
significantly higher in T3 where vermicompost
was applied as basal than the treatments where
either vermicompost was applied at panicle
initiation or still to be applied at flowering.
Such effect was not noticed in case of 50 %
NPK.
Int.J.Curr.Microbiol.App.Sci (2018) 7(3): 558-569
562
Table.1 Effect of different treatments on nitrogen uptake (Kg ha-1
) in rice at
different growth stages
Treatments Max.
Tillering
Panicle
Initiation
Flowering At harvest
Grain Straw
2011 2012 2011 2012 2011 2012 2011 2012 2011 2012
T1 8.34 7.32 15.85 12.98 30.34 26.55 30.55 23.40 8.14 11.99
T2 19.22 18.65 48.79 46.85 81.45 87.81 50.29 58.85 28.20 30.61
T3 15.53 13.39 37.69 37.14 67.80 75.40 46.73 53.52 25.78 27.46
T4 15.11 12.51 36.07 33.44 63.46 62.09 43.19 49.03 23.97 25.35
T5 13.84 11.47 34.11 30.09 58.18 56.50 42.22 48.36 22.06 24.61
T6 13.88 11.26 30.60 30.83 57.53 52.02 42.99 41.44 20.74 23.12
T7 11.80 10.05 32.72 26.47 56.23 53.51 44.67 45.42 20.28 21.57
T8 10.62 8.68 29.30 24.66 54.53 50.84 41.10 41.70 16.90 19.71
T9 10.42 8.39 23.92 22.37 54.06 48.79 44.43 40.60 15.49 18.39
T10 9.90 7.93 23.37 21.36 51.83 45.72 39.26 36.88 17.37 19.91
SE(m) 0.80 1.15 1.92 2.65 3.38 2.91 3.24 2.97 1.18 1.26
CD at 5% 2.40 3.44 5.76 7.92 10.10 8.70 9.69 8.88 3.53 3.78
Table.2 Effect of different treatments on phosphorus uptake (Kg ha-1
) in rice at
different growth stages
Treatments Max.
Tillering
Panicle
Initiation
Flowering At harvest
Grain Straw
2011 2012 2011 2012 2011 2012 2011 2012 2011 2012
T1 2.52 2.26 4.00 4.72 4.95 5.31 3.88 2.74 1.96 2.30
T2 6.12 6.26 15.42 16.55 16.84 19.11 11.94 13.07 10.66 12.46
T3 4.03 3.70 9.53 10.81 14.19 16.79 10.69 11.89 6.19 8.81
T4 3.63 3.30 8.95 8.97 12.26 14.44 9.30 10.67 5.48 9.86
T5 3.43 2.90 8.97 8.93 11.80 12.96 9.95 11.18 5.87 8.51
T6 3.32 2.96 8.59 8.73 11.23 11.18 8.72 8.39 4.94 6.25
T7 3.38 2.82 8.10 7.52 11.16 11.39 8.92 9.42 5.44 6.68
T8 3.10 2.47 7.91 7.66 8.80 9.07 8.50 8.37 4.70 6.41
T9 2.78 2.28 6.52 7.13 8.09 8.62 7.10 7.31 5.32 5.55
T10 2.79 2.39 6.30 6.88 7.22 7.45 5.64 6.22 4.47 4.76
SE(m) 0.23 0.27 0.50 0.65 0.57 0.82 0.66 0.51 0.35 0.49
CD at 5% 0.69 0.82 1.50 1.95 1.71 2.45 1.96 1.54 1.06 1.47
Int.J.Curr.Microbiol.App.Sci (2018) 7(3): 558-569
563
Table.3 Effect of different treatments on potassium uptake (Kg ha-1
) in rice at
different growth stages
Treatments Max.
Tillering
Panicle
Initiation
Flowering At harvest
Grain Straw
2011 2012 2011 2012 2011 2012 2011 2012 2011 2012
T1 8.19 6.68 12.43 12.94 29.29 28.89 3.94 5.33 36.15 40.76
T2 18.30 17.58 41.85 42.49 66.76 67.94 16.19 21.16 77.30 80.38
T3 13.86 12.50 31.59 32.31 59.60 62.05 14.02 18.45 73.26 75.71
T4 13.19 11.00 29.59 29.60 53.30 54.41 12.41 16.59 67.08 71.33
T5 12.39 10.39 27.96 26.89 46.25 47.86 11.34 15.36 64.12 68.53
T6 12.20 10.31 27.42 26.98 45.87 46.13 10.20 13.28 62.86 68.07
T7 10.97 8.87 24.71 23.28 41.95 42.80 8.68 12.39 60.83 67.58
T8 10.10 7.63 24.31 22.15 40.01 40.50 7.81 11.01 57.24 61.49
T9 9.45 7.50 20.26 20.85 38.44 39.49 7.09 10.48 52.66 58.09
T10 9.10 7.51 19.64 20.04 37.39 36.86 6.25 9.34 52.20 56.26
SE(m) 0.58 0.76 1.478 1.44 3.52 1.72 0.70 0.91 2.67 2.79
CD at 5% 1.73 2.27 4.425 4.30 10.54 5.16 2.10 2.70 7.99 8.36
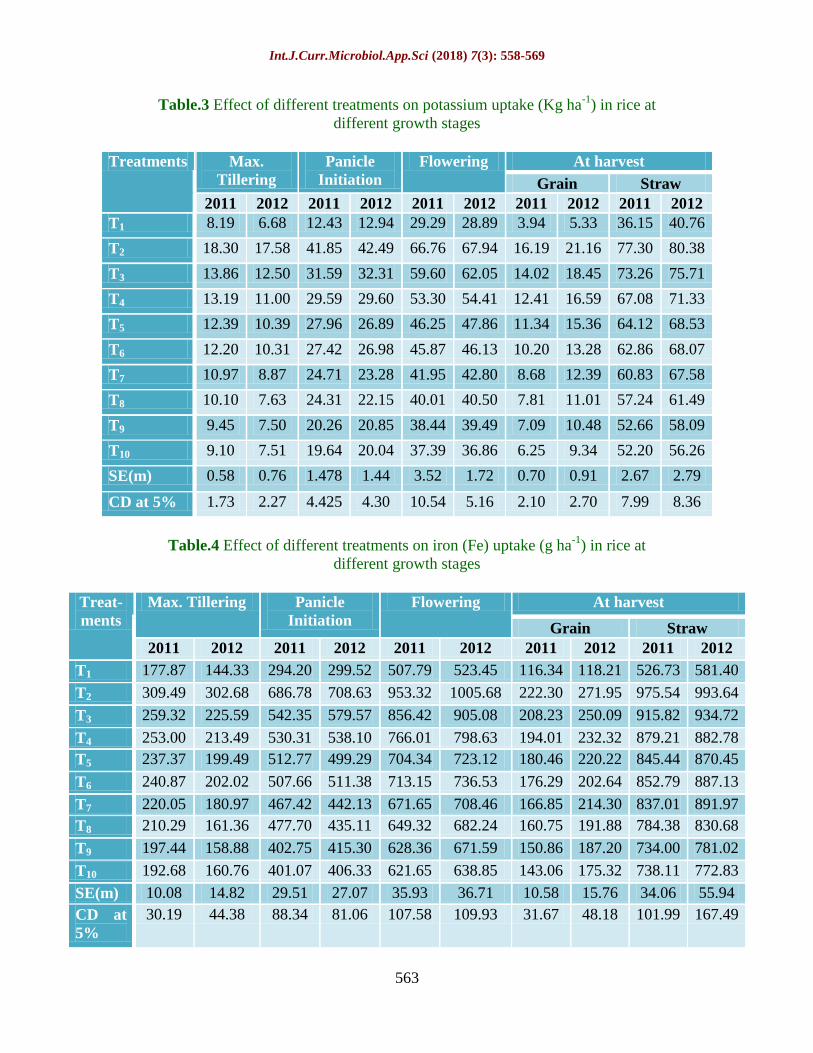
Table.4 Effect of different treatments on iron (Fe) uptake (g ha-1
) in rice at
different growth stages
Treat-
ments
Max. Tillering Panicle
Initiation
Flowering At harvest
Grain Straw
2011 2012 2011 2012 2011 2012 2011 2012 2011 2012
T1 177.87 144.33 294.20 299.52 507.79 523.45 116.34 118.21 526.73 581.40
T2 309.49 302.68 686.78 708.63 953.32 1005.68 222.30 271.95 975.54 993.64
T3 259.32 225.59 542.35 579.57 856.42 905.08 208.23 250.09 915.82 934.72
T4 253.00 213.49 530.31 538.10 766.01 798.63 194.01 232.32 879.21 882.78
T5 237.37 199.49 512.77 499.29 704.34 723.12 180.46 220.22 845.44 870.45
T6 240.87 202.02 507.66 511.38 713.15 736.53 176.29 202.64 852.79 887.13
T7 220.05 180.97 467.42 442.13 671.65 708.46 166.85 214.30 837.01 891.97
T8 210.29 161.36 477.70 435.11 649.32 682.24 160.75 191.88 784.38 830.68
T9 197.44 158.88 402.75 415.30 628.36 671.59 150.86 187.20 734.00 781.02
T10 192.68 160.76 401.07 406.33 621.65 638.85 143.06 175.32 738.11 772.83
SE(m) 10.08 14.82 29.51 27.07 35.93 36.71 10.58 15.76 34.06 55.94
CD at
5%
30.19 44.38 88.34 81.06 107.58 109.93 31.67 48.18 101.99 167.49
Int.J.Curr.Microbiol.App.Sci (2018) 7(3): 558-569
564
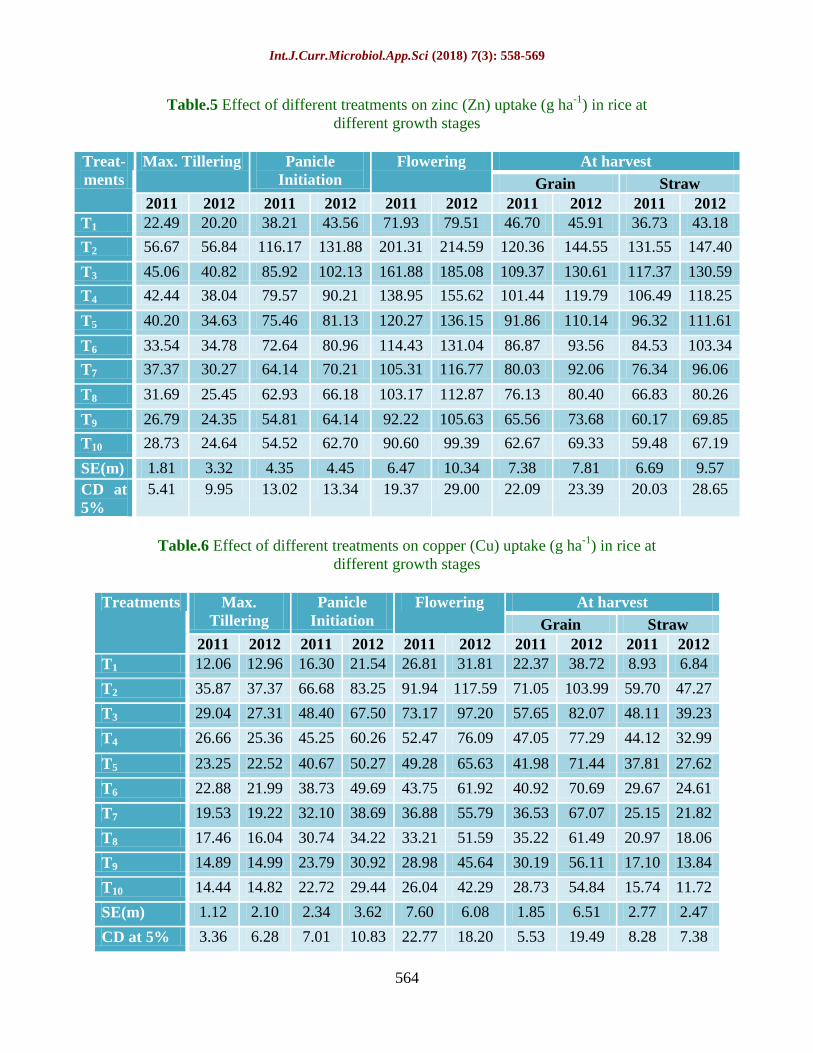
Table.5 Effect of different treatments on zinc (Zn) uptake (g ha-1
) in rice at
different growth stages
Treat-
ments
Max. Tillering Panicle
Initiation
Flowering At harvest
Grain Straw
2011 2012 2011 2012 2011 2012 2011 2012 2011 2012
T1 22.49 20.20 38.21 43.56 71.93 79.51 46.70 45.91 36.73 43.18
T2 56.67 56.84 116.17 131.88 201.31 214.59 120.36 144.55 131.55 147.40
T3 45.06 40.82 85.92 102.13 161.88 185.08 109.37 130.61 117.37 130.59
T4 42.44 38.04 79.57 90.21 138.95 155.62 101.44 119.79 106.49 118.25
T5 40.20 34.63 75.46 81.13 120.27 136.15 91.86 110.14 96.32 111.61
T6 33.54 34.78 72.64 80.96 114.43 131.04 86.87 93.56 84.53 103.34
T7 37.37 30.27 64.14 70.21 105.31 116.77 80.03 92.06 76.34 96.06
T8 31.69 25.45 62.93 66.18 103.17 112.87 76.13 80.40 66.83 80.26
T9 26.79 24.35 54.81 64.14 92.22 105.63 65.56 73.68 60.17 69.85
T10 28.73 24.64 54.52 62.70 90.60 99.39 62.67 69.33 59.48 67.19
SE(m) 1.81 3.32 4.35 4.45 6.47 10.34 7.38 7.81 6.69 9.57
CD at
5%
5.41 9.95 13.02 13.34 19.37 29.00 22.09 23.39 20.03 28.65
Table.6 Effect of different treatments on copper (Cu) uptake (g ha-1
) in rice at
different growth stages
Treatments Max.
Tillering
Panicle
Initiation
Flowering At harvest
Grain Straw
2011 2012 2011 2012 2011 2012 2011 2012 2011 2012
T1 12.06 12.96 16.30 21.54 26.81 31.81 22.37 38.72 8.93 6.84
T2 35.87 37.37 66.68 83.25 91.94 117.59 71.05 103.99 59.70 47.27
T3 29.04 27.31 48.40 67.50 73.17 97.20 57.65 82.07 48.11 39.23
T4 26.66 25.36 45.25 60.26 52.47 76.09 47.05 77.29 44.12 32.99
T5 23.25 22.52 40.67 50.27 49.28 65.63 41.98 71.44 37.81 27.62
T6 22.88 21.99 38.73 49.69 43.75 61.92 40.92 70.69 29.67 24.61
T7 19.53 19.22 32.10 38.69 36.88 55.79 36.53 67.07 25.15 21.82
T8 17.46 16.04 30.74 34.22 33.21 51.59 35.22 61.49 20.97 18.06
T9 14.89 14.99 23.79 30.92 28.98 45.64 30.19 56.11 17.10 13.84
T10 14.44 14.82 22.72 29.44 26.04 42.29 28.73 54.84 15.74 11.72
SE(m) 1.12 2.10 2.34 3.62 7.60 6.08 1.85 6.51 2.77 2.47
CD at 5% 3.36 6.28 7.01 10.83 22.77 18.20 5.53 19.49 8.28 7.38
Int.J.Curr.Microbiol.App.Sci (2018) 7(3): 558-569
565
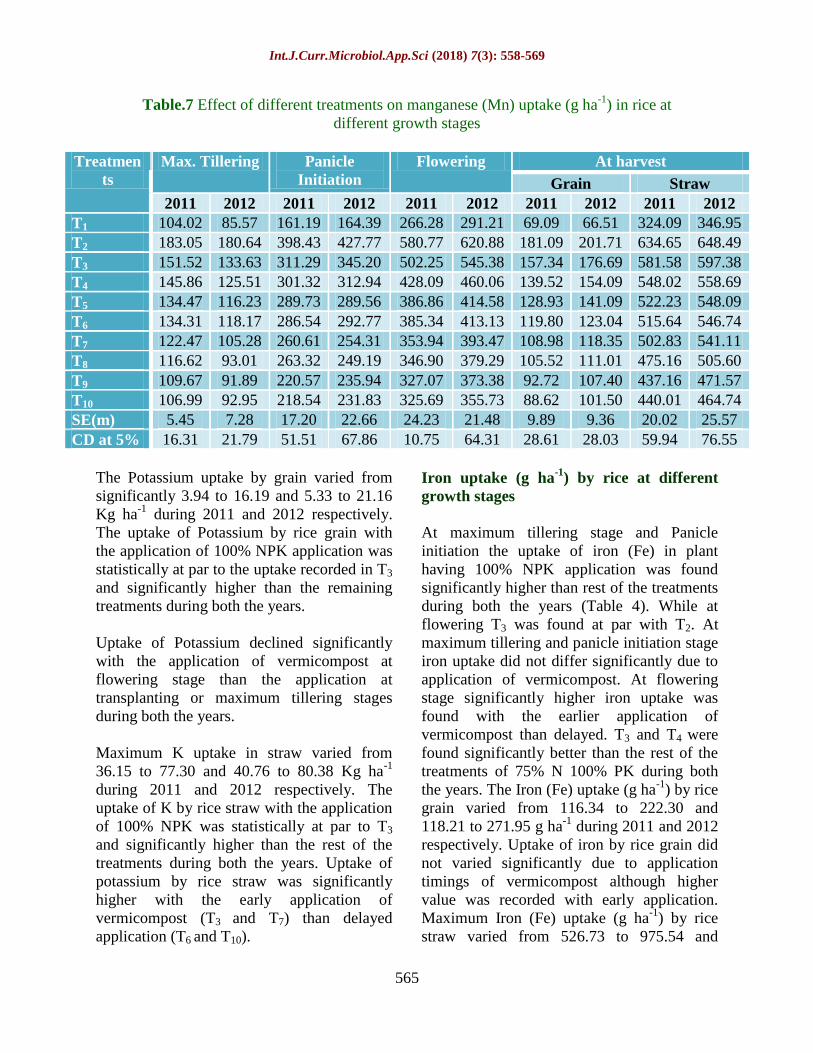
Table.7 Effect of different treatments on manganese (Mn) uptake (g ha-1
) in rice at
different growth stages
Treatmen
ts
Max. Tillering Panicle
Initiation
Flowering At harvest
Grain Straw
2011 2012 2011 2012 2011 2012 2011 2012 2011 2012
T1 104.02 85.57 161.19 164.39 266.28 291.21 69.09 66.51 324.09 346.95
T2 183.05 180.64 398.43 427.77 580.77 620.88 181.09 201.71 634.65 648.49
T3 151.52 133.63 311.29 345.20 502.25 545.38 157.34 176.69 581.58 597.38
T4 145.86 125.51 301.32 312.94 428.09 460.06 139.52 154.09 548.02 558.69
T5 134.47 116.23 289.73 289.56 386.86 414.58 128.93 141.09 522.23 548.09
T6 134.31 118.17 286.54 292.77 385.34 413.13 119.80 123.04 515.64 546.74
T7 122.47 105.28 260.61 254.31 353.94 393.47 108.98 118.35 502.83 541.11
T8 116.62 93.01 263.32 249.19 346.90 379.29 105.52 111.01 475.16 505.60
T9 109.67 91.89 220.57 235.94 327.07 373.38 92.72 107.40 437.16 471.57
T10 106.99 92.95 218.54 231.83 325.69 355.73 88.62 101.50 440.01 464.74
SE(m) 5.45 7.28 17.20 22.66 24.23 21.48 9.89 9.36 20.02 25.57
CD at 5% 16.31 21.79 51.51 67.86 10.75 64.31 28.61 28.03 59.94 76.55
The Potassium uptake by grain varied from
significantly 3.94 to 16.19 and 5.33 to 21.16
Kg ha-1
during 2011 and 2012 respectively.
The uptake of Potassium by rice grain with
the application of 100% NPK application was
statistically at par to the uptake recorded in T3
and significantly higher than the remaining
treatments during both the years.
Uptake of Potassium declined significantly
with the application of vermicompost at
flowering stage than the application at
transplanting or maximum tillering stages
during both the years.
Maximum K uptake in straw varied from
36.15 to 77.30 and 40.76 to 80.38 Kg ha-1
during 2011 and 2012 respectively. The
uptake of K by rice straw with the application
of 100% NPK was statistically at par to T3
and significantly higher than the rest of the
treatments during both the years. Uptake of
potassium by rice straw was significantly
higher with the early application of
vermicompost (T3 and T7) than delayed
application (T6 and T10).
Iron uptake (g ha-1
) by rice at different
growth stages
At maximum tillering stage and Panicle
initiation the uptake of iron (Fe) in plant
having 100% NPK application was found
significantly higher than rest of the treatments
during both the years (Table 4). While at
flowering T3 was found at par with T2. At
maximum tillering and panicle initiation stage
iron uptake did not differ significantly due to
application of vermicompost. At flowering
stage significantly higher iron uptake was
found with the earlier application of
vermicompost than delayed. T3 and T4 were
found significantly better than the rest of the
treatments of 75% N 100% PK during both
the years. The Iron (Fe) uptake (g ha-1
) by rice
grain varied from 116.34 to 222.30 and
118.21 to 271.95 g ha-1
during 2011 and 2012
respectively. Uptake of iron by rice grain did
not varied significantly due to application
timings of vermicompost although higher
value was recorded with early application.
Maximum Iron (Fe) uptake (g ha-1
) by rice
straw varied from 526.73 to 975.54 and
Int.J.Curr.Microbiol.App.Sci (2018) 7(3): 558-569
566
581.40 to 993.64 g ha-1
during 2011 and 2012
respectively. Uptake of iron by rice straw
with the application of 100% NPK was
significantly higher than the most of the
treatments during 2011, but during 2012 only
three treatments T1, T9 and T10 differ
significantly from T2.
Zinc uptake (gha-1
) by rice at different
growth stages
At maximum tillering and panicle initiation
stage the uptake of zinc in case of T2 was
significantly higher than the remaining
treatments during both the years however at
flowering T3 was found statistically at par to
T2 during 2012 (Table 5).
The application effect of vermicompost on
uptake of zinc at maximum tillering and
panicle initiation was not clear. Zn uptake by
rice plant at flowering stage varied from
71.93 to 201.31 and 79.51 to 214.59 gha-1
during 2011 and 2012 respectively.
Significantly higher zinc uptake at flowering
was recorded due to basal application of
vermicompost along 75% N, 100% PK than
the remaining treatments consisting
application of 75% N, 100% PK and
vermicompost.
With the exception of T6, rest of the
treatments consisting application of
vermicompost and 75% N, 100% PK were
found statistically at par in respect of Zn
uptake by rice grain. With delayed application
of vermicompost, Zn uptake by rice grain
declined.
Maximum zinc uptake by rice straw
statistically similar to T3 and significantly
higher than the remaining was found with the
application of 100% NPK during both the
years. Minimum zinc uptake by rice straw
significantly lower than the most of the
treatments during both the years was found in
case of T1 (Control).
Copper uptake (g ha-1
) by rice plant at
different stages
With exception of flowering stage during
2011, the uptake of copper with the
application of 100% NPK was significantly
higher than the remaining treatments at all the
growth stages during both the years (Table 6).
Copper uptake in T2 was found statistically at
par to T3 at flowering stage of 2011. No clear
cut effect of vermicompost application on
copper uptake at maximum tillering was
noticed. At panicle initiation stage copper
uptake varied from 16.30 to 66.68 and 21.54
to 83.25 g ha-1
during 2011 and 2012
respectively. Basal application of
vermicompost along with 75% N, 100% PK
resulted in significantly higher Cu uptake than
the treatments where no vermicompost was
applied. The uptake of copper (g ha-1
) by rice
plant at flowering stage varied from 26.81 to
91.94 and 31.81 to 117.59 g ha-1
during 2011
and 2012 respectively. The uptake copper
(Cu) by rice plant having 100% NPK
application (T2) was found statistically similar
toT3 and significantly higher than the rest of
the treatments during 2011 but such effect
was not noticed during 2012 and T2 differ
significantly from T3. The effect of
vermicompost application along with 75% N,
100% PK on the uptake of copper (g ha-1
) at
this stage was found significant only with
basal application of vermicompost during
both the years and it was significantly higher
than T5. The copper uptake (g ha-1
) by rice
grain varied from 22.37 to 71.05 and 38.72 to
103.99 g ha-1
during 2011 and 2012
respectively. The timing effect of
vermicompost application was inconsistent
while during 2011, most of the treatments
consisting vermicompost application with
75% N, 100% PK differ significantly but such
effect was not noticed during 2012. The
uptake of copper by rice straw varied from
8.93 to 59.70 and 6.84 to 47.27g ha-1
during
2011 and 2012 respectively. Basal application
Int.J.Curr.Microbiol.App.Sci (2018) 7(3): 558-569
567
of vermicompost along with 75%N, 100%PK
resulted in significantly higher copper uptake
than the treatments where vermicompost was
applied at panicle initiation or flowering stage
but with 50% N, 100% PK the application
effect of vermicompost was not found.
Manganese uptake (g ha-1
) by rice plant at
different stages
At maximum tillering stage, Panicle initiation
and flowering stages the uptake of Mn with
T2 was significantly higher than the remaining
treatments but uptake of Mn by rice grain and
straw in T3 was found statistically similar to
T2 during both the years (Table 7). At
maximum tillering stage uptake of Mn did not
differ significantly due to basal application of
vermicompost during both the years. At
panicle initiation stage manganese uptake (g
ha-1
) by rice plant varied from 161.19 to
398.43 and 164.39 to 427.77 g ha-1
during
2011 and 2012 respectively. No effect of
vermicompost application on Mn uptake was
found during both the years. The manganese
(Mn) uptake (g ha-1
) in plant at flowering
stage varied from 266.28 to 580.77 and
291.21 to 620.88 g ha-1
during 2011 and 2012
respectively. A significant effect of
vermicompost application with 75% N, 100%
PK on Mn uptake was found while in case
50% N, 100% PK no celerity was seen. The
manganese uptake (g ha-1
) in grain varied
from 69.09 to 181.09 and 66.51 to 201.71 g
ha-1
during 2011 and 2012 respectively. The
uptake of Mn by rice grain was significantly
higher with the basal application of
vermicompost during 2012, along with 75%
N, 100% PK than T5 and T6 during both the
years. The uptake of Mn by rice grain did not
differ significantly due application of
vermicompost along with 50% N, 100% PK.
Uptake of manganese (g ha-1
) by rice straw
varied from 324.09 to 634.65 and 346.95 to
648.49 g ha-1
during 2011 and 2012
respectively. Maximum uptake statistically at
par to T3 and significantly higher than the
remaining treatments both the years was
found in T2. The uptake of Manganese did not
differ significantly due to timing of
vermicompost application although slightly
higher values were recorded with early
application.
Effect on nutrients uptake by rice at
different stages
Comparatively higher uptake was also
recorded with the early than delayed
application of vermicompost. Initially higher
nutrient availability in soil in these treatments
responded well to plant growth and plant
nutrient contents and a significant variation in
dry matter accumulation and plant nutrient
contents was noticed. Uptake is the product of
dry matter yield and nutrient content. Since
dry matter yield and nutrient content were
maximum/significantly higher in these
treatments therefore significantly higher
nutrient uptake is obvious. In absence of
fertilizer application the dry matter yield and
nutrient content of plant sample was
lower/significantly lower therefore
significantly less nutrient uptake than the rest
in control treatment is well expected.
Application of sub optimal level of inorganic
N also reflected its impact on dry matter
production, plant nutrient content and there by
recorded lower quantities of plant nutrient
uptake by recorded lower quantities. The
similar result was observed by Manna et al.,
2001, Vyas et al., 2001, Sharma et al., 2013,
Singh et al., 2017 and Tamuly et al., 2014.
Duhan and Singh (2002) also reported that
uptake of nutrients increased significantly
with increasing N levels. Moreover,
application of N along with GM (green
manuring) showed additive effect on these
parameters. Under all GM treatments, the
uptake was always higher with 120 kg N ha−1
than with the lower levels of N. The highest
Int.J.Curr.Microbiol.App.Sci (2018) 7(3): 558-569
568
uptake of all micronutrients was obtained
where 120 kg N ha-1
was applied under GM.
Jat and Ahlawat, (2006) observed that the N
and P uptake in chickpea-maize cropping
system as influenced by the application of
vermicompost, indicated that vermicompost
application at 3t/ha significantly increased N
and P uptake by the cropping system in both
the seasons over the control. Linda et al.,
(2010) found that raising mineral nitrogen
fertilizer level from 25 to 50, 75 and 100 kg
N/fed resulted in significant increases in NPK
uptake of grain and straw. The wheat grain
and straw NPK contents were significantly
increased by application of compost and
humic acid treatments. Vanilarasu and
Balakrishnamurthy (2014) observed that
application of organic manure and
amendments increases uptake of leaf nutrient
contents like nitrogen, phosphorous and
potassium of banana.
References
Duhan, B.S. and Singh, M. 2002. Effect of
green manuring and nitrogen on yield
and uptake of Micronutrients by rice. J.
Indian Soc. Soil Sci., 50: 178-180.
Dussere, C. 1992. On the effect of earthworm
on the chemical condition of soil. Land
bow J. B. Schwiez. 16:75-78.
Gomez, A.K. and Gomez, A.A. 1984.
Statistical procedures for Agricultural
Research. Second Edition. John Wiley
and Sons, New York. U.S.A.
Hanway, J.J. and Heidal, H. 1952. Soil
analysis methods as used in Iowa State
College, Soil Testing Laboratory. Iowa
State College Bull., 57: 1-131.
Jackson, M.L. 1967. Soil chemical analysis
prentice hall of India private limited.
New Delhi.
Jackson, M.L. 1973. Soil Chemical Analysis.
Prentice Hall of India Pvt. Ltd., New
Delhi.
Jat, R. S. and Ahlawat, I.P.S. 2006.Direct and
residual effect of vermicompost,
biofertilizers and phosphorus on soil
nutrient dynamics and reductivity of
chickpea-fodder maize sequence. Indian
J. Soil. Sci. 12 (2): 41-54.
Kumar, A., Dhyani, B.P., Rai, A. and Kumar,
V. 2017.Effect of timing of
vermicompost application and different
level of NPK on growth, yield
attributing characters and yield of rice
in rice-wheat cropping system.
International Journal of Chemical
Studies, 5(5): 2034-2038.
Kumar, A., Dhyani, B.P., Rai, A. and Kumar,
V. 2017.Residual Effect of Applied
Vermicompost and NPK to Rice on
Growth and Yield of Succeeding Wheat
and Chemical Properties of Soil.
Int.J.Curr.Microbiol.App.Sci. 6(11):
1087-1098.
Kumar, R., Rawat, K. S., Singh, J., Singh, A.
and Rai, A. 2013.Soil aggregation
dynamics and carbon sequestration.
Journal of Applied and Natural Science
5(1): 250-267. Linda, W. A., Zakaria, M.S. and Rafla, H.H.
(2010) Influence of compost, n-mineral
and humic acid on yield and chemical
composition of wheat plants, J. Soil Sci.
and Agric. Engi., Mansoura Univ.,1
(11): 1131- 1143.
Lindsay, W.L. and Norvell, W.A. (1978)
Development of a DTPA test for zinc,
iron, manganese and copper. Soil
Science Society America Journal 42 (3):
421−428.
Majid, A. Ali., A. Rabie, M.M. and Sabrah,
R.E.A. 1995. Chicken manure as a bio-
fertilizer for wheat in the sandy soils of
Saudi Arabia. J. Arid. Environ 28(3):
413-420.
Manna, M.C., Ghozh, P.K. Ghosh, B.N. and
Singh, K.N. 2001. Comparative
effectiveness of phosphate enriched
compost and single superphosphate on
Int.J.Curr.Microbiol.App.Sci (2018) 7(3): 558-569
569
yield, uptake of nutrients and soil
quality under soybean -wheat rotation.
J. Agril. Sci. 137(1): 45-54.
Olsen, S.R., Cole, C.V., Watanable, F.S. and
Dean, L.A. 1954. Estimation of
available phosphorus in soils by
extraction with sodium bicarbonate,
Washington, USDA circular 939:1-18.
Rai, A., Mishra, S. and Sharma, D.P.
2012.Effect of fly ash and sewage
sludge on chemical properties of soil
and yield of radish (Raphanus sativus).
New Agriculturist, 23(1): 49–54.
Rai, A., Saleem, M., Mishra, S. and Devi, M.
2011.Phosphate availability in alluvial
soil as affected by sulphur application
with pea (Pisum sativum L.)As a test
crop. Bioved, 22(2): 239–241.
Rao, K.R., Rao, P.A. and Rao, K.T. 2000.
Influence of organic manure and
fertilizers on the incidence of groundnut
leaf miner. Approacrema, Modicella
Dev Annals of Plant Protection Sci.
9(1): 12-15.
Robinson. C. H. Inceson, P. Pierce, T.G. and
Rowland, A.P. 1992. Nitrogen
mobilization by earthworm in limed
peat soils under Piceasitchensis, J.
Applied Ecol. 29: 226-237.
Sharma, R., Kachroo, D., Thakur, N.P.,
Gupta, A.K., Bharat, R., Sharma, V. and
Arya, V.M. (2013).Effect of puddling,
irrigation and nutrient sources on yield,
nutrient uptake by rice and soil moisture
status under sub-tropical condition of
Jammu. Annals of Plant and Soil
Research. 15(2): 93-96.
Singh, L., Sharma, P.K., Kumar, V. and Rai,
A. 2017. Nutrient content, uptake and
quality of pearl millet influenced by
phosphorus and zinc fertilization
(Pennisetum galaucum L.) under
rainfed condition. International Journal
of Chemical Studies, 5(6): 1290-1294.
Subbiah, B. and Asija, G.L. 1956. A rapid
procedure for estimation of available
nitrogen in soil, Current Science, 25 (8):
259-260.
Tamuly, D., Choudhury, B. H. and Betty B.
2014.Effect of Nutrient Management on
Soil Availability, Plant Content and
Uptake of Nitrogen, Phosphorous and
Potassium under Rice cultivation in
Black Soils of Kerala. International,
Journal of Scientific and Engineering
Research, 5(1):1331-1342.
Vanilarasu, K. and Balakrishnamurthy, G.
2014. Influences of organic manures
and amendments in soil physiochemical
properties and their impact on growth,
yield and nutrient uptake of banana. The
Bioscan, 9(2): 525-529.
Vyas, M.D., Jain, A.K. and Tiwari, R.J.
2001.Long term effect of micronutrients
and FYM on yield of and nutrient
uptake by soybean on a
typicchromustert J. Indian Soc. Soil.
Sci. 51(1): 45-47.
Walkley, A. and Black, C.A. (1934)
“Estimation of organic carbon by
chromic acid and titration method”, Soil
Science 37(1): 28-29.
Zahid, H.M. 2001. Production of
vermicompost and its use in upland and
horticultural crops. Annual Report of
Bangladesh Agricultural Research
Council, Frame gate, Dhaka.
How to cite this article:
Amit Kumar, B.P. Dhyani, Vipin Kumar, Ashish Rai, Arvind Kumar and Karamveer. 2018.
Nutrient Uptake in Rice Crop as Influenced by Vermicompost and Nitrogen Application.
Int.J.Curr.Microbiol.App.Sci. 7(03): 558-569. doi: https://doi.org/10.20546/ijcmas.2018.703.067