Embed Size (px)
Citation preview
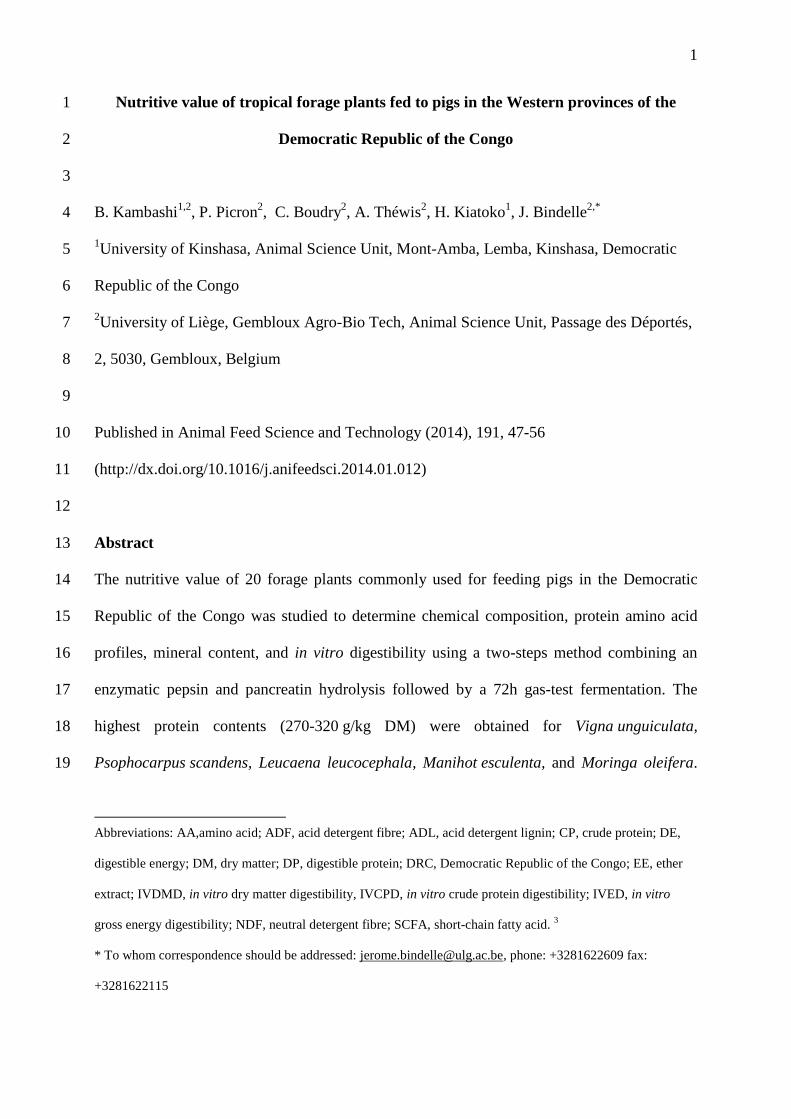
1
Nutritive value of tropical forage plants fed to pigs in the Western provinces of the 1
Democratic Republic of the Congo 2
3
B. Kambashi1,2
, P. Picron2, C. Boudry
2, A. Théwis
2, H. Kiatoko
1, J. Bindelle
2,* 4
1University of Kinshasa, Animal Science Unit, Mont-Amba, Lemba, Kinshasa, Democratic 5
Republic of the Congo 6
2University of Liège, Gembloux Agro-Bio Tech, Animal Science Unit, Passage des Déportés, 7
2, 5030, Gembloux, Belgium 8
9
Published in Animal Feed Science and Technology (2014), 191, 47-56 10
(http://dx.doi.org/10.1016/j.anifeedsci.2014.01.012) 11
12
Abstract 13
The nutritive value of 20 forage plants commonly used for feeding pigs in the Democratic 14
Republic of the Congo was studied to determine chemical composition, protein amino acid 15
profiles, mineral content, and in vitro digestibility using a two-steps method combining an 16
enzymatic pepsin and pancreatin hydrolysis followed by a 72h gas-test fermentation. The 17
highest protein contents (270-320 g/kg DM) were obtained for Vigna unguiculata, 18
Psophocarpus scandens, Leucaena leucocephala, Manihot esculenta, and Moringa oleifera. 19
Abbreviations: AA,amino acid; ADF, acid detergent fibre; ADL, acid detergent lignin; CP, crude protein; DE,
digestible energy; DM, dry matter; DP, digestible protein; DRC, Democratic Republic of the Congo; EE, ether
extract; IVDMD, in vitro dry matter digestibility, IVCPD, in vitro crude protein digestibility; IVED, in vitro
gross energy digestibility; NDF, neutral detergent fibre; SCFA, short-chain fatty acid. 3
* To whom correspondence should be addressed: [email protected], phone: +3281622609 fax:
+3281622115
2
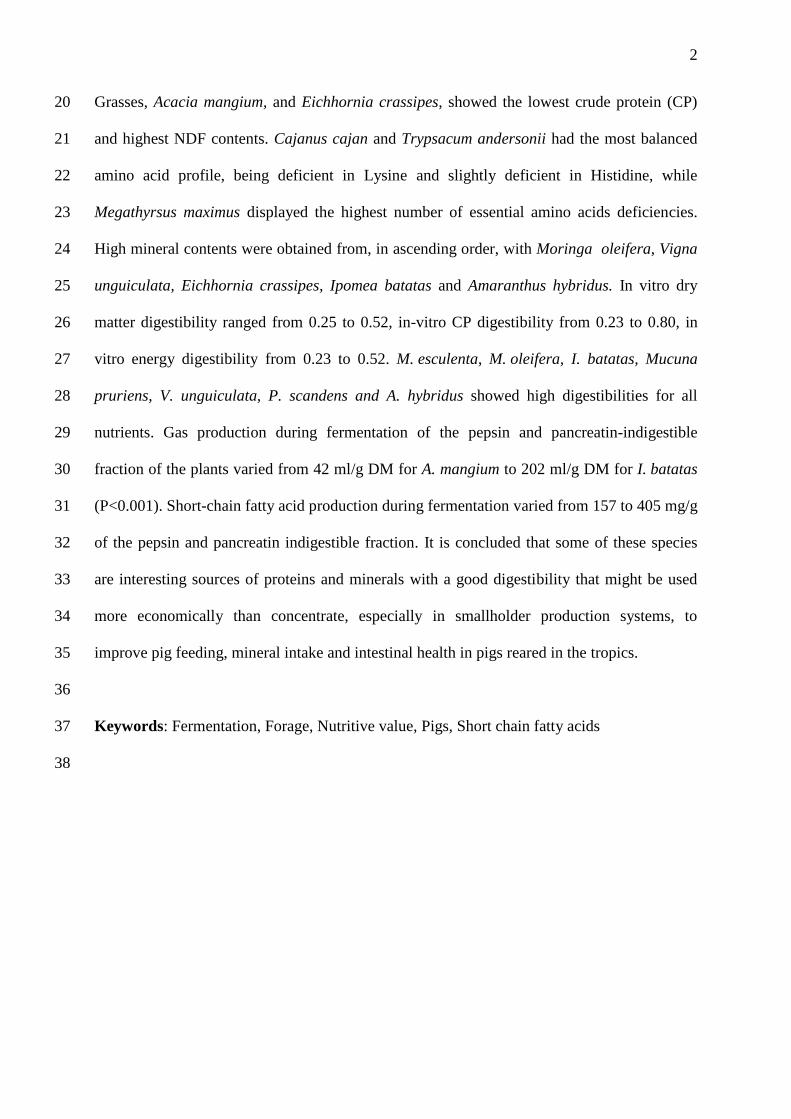
Grasses, Acacia mangium, and Eichhornia crassipes, showed the lowest crude protein (CP) 20
and highest NDF contents. Cajanus cajan and Trypsacum andersonii had the most balanced 21
amino acid profile, being deficient in Lysine and slightly deficient in Histidine, while 22
Megathyrsus maximus displayed the highest number of essential amino acids deficiencies. 23
High mineral contents were obtained from, in ascending order, with Moringa oleifera, Vigna 24
unguiculata, Eichhornia crassipes, Ipomea batatas and Amaranthus hybridus. In vitro dry 25
matter digestibility ranged from 0.25 to 0.52, in-vitro CP digestibility from 0.23 to 0.80, in 26
vitro energy digestibility from 0.23 to 0.52. M. esculenta, M. oleifera, I. batatas, Mucuna 27
pruriens, V. unguiculata, P. scandens and A. hybridus showed high digestibilities for all 28
nutrients. Gas production during fermentation of the pepsin and pancreatin-indigestible 29
fraction of the plants varied from 42 ml/g DM for A. mangium to 202 ml/g DM for I. batatas 30
(P<0.001). Short-chain fatty acid production during fermentation varied from 157 to 405 mg/g 31
of the pepsin and pancreatin indigestible fraction. It is concluded that some of these species 32
are interesting sources of proteins and minerals with a good digestibility that might be used 33
more economically than concentrate, especially in smallholder production systems, to 34
improve pig feeding, mineral intake and intestinal health in pigs reared in the tropics. 35
36
Keywords: Fermentation, Forage, Nutritive value, Pigs, Short chain fatty acids 37
38
3
1. Introduction 39
In the tropics, pig production is only tolerated if pigs do not compete with humans for 40
food (Leterme et al., 2006), especially in developing countries where monogastrics are in 41
direct competition with humans for the resources required to produce concentrate feed. 42
Because of the high and volatile prices of the latter (Braun, 2007; FAO, 2012), smallholders 43
often replace the cereals and oilseed by-products in pig feeds with large amounts of cheap and 44
unconventional fibre-rich ingredients such as crop residues, agro-industrial by-products, and 45
grass and legume forage collected in the forest or in fallow fields near pigsties (Kumaresan et 46
al., 2009; Phengsavanh et al., 2010). A recent survey realised in the Kinshasa and the Bas-47
Congo Provinces of the Democratic Republic of the Congo (DRC) (Kambashi et al., 48
submitted) confirmed that less than 2% of the farmers use commercial feeds and the most 49
abundant cereal resource, namely corn, is used as an ingredient in pig feed on less than 10% 50
of the farms. Although the growth performances of forage-fed pigs is often lower than that of 51
concentrate-fed and is negatively correlated with the inclusion rate of the forages 52
(Phengsavanh and Lindberg, 2013; Régnier et al., 2013), farmers in Western DRC do not feed 53
crop grains to their pigs because they consider it a waste of crops even in mixed farming 54
systems producing both pigs and crops. 55
The use of forage resources as pig feeds does have several drawbacks including low 56
digestibility of forage owing to their high content in fibre, the presence of anti-nutritive 57
compounds and the lack of suitable conservation methods. However, compared to cereals, 58
they have distinct advantages justifying their use by farmers: low cost, non-competitiveness 59
with human food, high levels of protein, minerals and vitamins (reviewed by Martens et al., 60
2012). As feed is the most critical expense in pig rearing activity, it can be profitable to 61
substitute a significant part of a concentrate-based diet with some forage ingredients 62
(Kaensombath et al., 2013b). Unfortunately, the lack of information on the nutritive value of 63
4
most of the forage resources used in tropical areas in general and in Western DRC specifically 64
can lead to unbalanced diets, low pigs growth and reproduction performances, low incomes 65
for the farmers and less locally produced animal protein available on the market. The aim of 66
this work is to assess using an in vitro model of the pigs gastro-intestinal tract, the nutritive 67
value of the forage species the most commonly used by smallholder farmers in Western DRC 68
in order to provide information that could guide them in the choice of forage resources for 69
improved pig performances. 70
2. Materials and methods 71
2.1. Plant material 72
Samples of 20 forage species used as pig feed by farmers in the Kinshasa and Bas-73
Congo Provinces of the DRC and identified as the most commonly used during a survey of 74
319 pig smallholders (Kambashi et al. submitted) were gathered from the smallholders’ farms 75
(Table 1). For each species, 4 independent samples were collected on different farms. All 76
forage samples were harvested during the vegetative growth phase before flowering and, 77
depending on the species, whole plants or only leaves were sampled according to the farmers’ 78
common practices. 79
2.2 In vitro digestion and fermentation 80
Forage samples were oven-dried at 60°C and ground to pass through a 1 mm mesh 81
screen in a Cyclotec 1093 Sample Mill (FOSS Electric A/S, Hilleroed, Denmark). The 82
digestibility of their nutrients was assessed using the in vitro model developed by Bindelle et 83
al. (2007a). Briefly, this method simulates the digestion in the pig gastro-intestinal tract in 84
two steps. The stomach and small intestinal digestion are mimicked by an enzymatic 85
hydrolysis with porcine pepsin (2h, 39°C, pH 2) and porcine pancreatin (4h, 39°C, pH 6.8), 86
respectively. The indigestible residue recovered by filtration through a nylon cloth (42 µm), 87
5
after washing with ethanol and acetone, is subsequently fermented with faecal bacteria of 88
sows in a carbonate-based buffer (72h, 39°C, pH 6.8) to simulate the fermentation processes 89
occurring in the large intestine. The volume of gas produced during fermentation was 90
modelled according to Groot et al. (1996). Four parameters describing the fermentation 91
kinetics were calculated: final gas volume (A, ml g/DM)), mid-fermentation time (B, h), 92
maximum rate of gas production (RM, ml g/DM) and time at which the maximum rate of gas 93
production is reached (tRM, h). Fermentation broth collected after 72 h was centrifuged at 13 94
000 g for 15 min and the supernatants were sampled and frozen at -18°C until further short-95
chain fatty acid (SCFA) analysis. 96
For each of the 4 samples of each forage species, hydrolysis was performed between 4 97
to 6 times on 2-g samples to yield sufficient amounts of indigestible residues for the 98
subsequent analyses and fermentation. In vitro fermentation was performed in quadruplicate 99
on the pooled residues of each initial forage sample. 100
2.3. Chemical analysis 101
Forage ingredients and hydrolysis residues pooled by forage sample (N=4 per species) 102
were analysed for their content in dry matter (DM) by drying at 105°C for 24 h (method 103
967.03; AOAC, 1990), ash by burning at 550°C for 8 h (method 923.03; AOAC, 1990), N 104
according to the Kjeldahl method and calculating the crude protein (CP) content (N × 6.25; 105
method 981.10; AOAC, 1990), and gross energy by means of an adiabatic oxygen bomb 106
calorimeter (1241 Adiabatic Calorimeter, PARR Instrument Co., Illinois, USA). Forage 107
ingredients were also analysed for their content in ether extract (EE) with the Soxhlet method 108
by using diethyl ether (method 920.29; AOAC, 1990), in neutral detergent fibre (aNDFom) 109
using thermostable amylase (Termamyl®, Novo Nordisk, Bagsværd, Denmark) and corrected 110
for ash, in acid detergent fibre (ADFom) corrected for ash, in acid detergent lignin (ADL(sa)) 111
according to Van Soest et al. (1991) using an ANKOM-Fiber Analyzer (ANKOM-112
6
Technology, Fairport, NY), and in total amino acids (excluding methionine, cysteine and 113
tryptophan) by HPLC after hydrolysis with a mixture of 6 mol HCl/l containing 1 g phenol/l 114
at 110°C for 24 h and derivatization with AccQ-Fluor reagent Kit. DL-2-aminobutyric acid 115
was used as internal standard. Ca, P, Mg, K, Cl, S, Se, Ni, Na, Fe, Mn, Cu and Zn contents of 116
one sample per plant (N=1 per species) were analysed by atomic absorption 117
spectrophotometry using a PerkinElmer AAS-800 (Wellesley, MA, USA). 118
The supernatants of the fermentation broth were analysed for SCFA contents after 72 119
h of fermentation with a Waters 2690 HPLC system (Waters, Milford, MA, USA) fitted with 120
an HPX 87H column (Bio-Rad, Hercules, CA, USA) combined with an UV detector (210 nm, 121
Waters, Milford, MA, USA). 122
2.4. Calculation and statistical analyses 123
The in vitro dry matter digestibility (IVDMD), crude protein digestibility (IVCPD) 124
and gross energy digestibility (IVED) during the pepsin and pancreatin hydrolysis were 125
calculated as follows: IVDMD = (X-Y)/X; where X is the weight of the sample before 126
hydrolysis and Y the weight of the residue ; andX
IVDMDYIVXD
)1(1
,where X is the 127
nutrient content (CP, energy) in the sample before hydrolysis and Y the nutrient content in the 128
residue after hydrolysis. 129
130
Potential contribution of fermentation in the large intestine to metabolic energy supply 131
through SCFA was calculated according to Gaedeken et al. (1989) by multiplying the energy 132
value of each SCFA (acetate 14.56 kJ/g, propionate 20.51 kJ/g, and butyrate 24.78 kJ/g) 133
(Livesey and Elia, 1995) by the SCFA production during the fermentation of the hydrolysed 134
forage ingredients. 135
Statistical analyses were performed by means of an analysis of variance and a 136
classification of means by the Least Significant Difference method using the MIXED 137
7
procedure of the SAS 8.02 software (SAS inc., Cary, NC, USA). Correlation was calculated 138
according to the PROC CORR procedure of the SAS 9.2 software (SAS inc., Cary, NC, 139
USA). For all the analyses, the individual forage sample was considered as the experimental 140
unit and the species was the effect that was tested (N = 4). 141
3. Results 142
3.1. Chemical composition 143
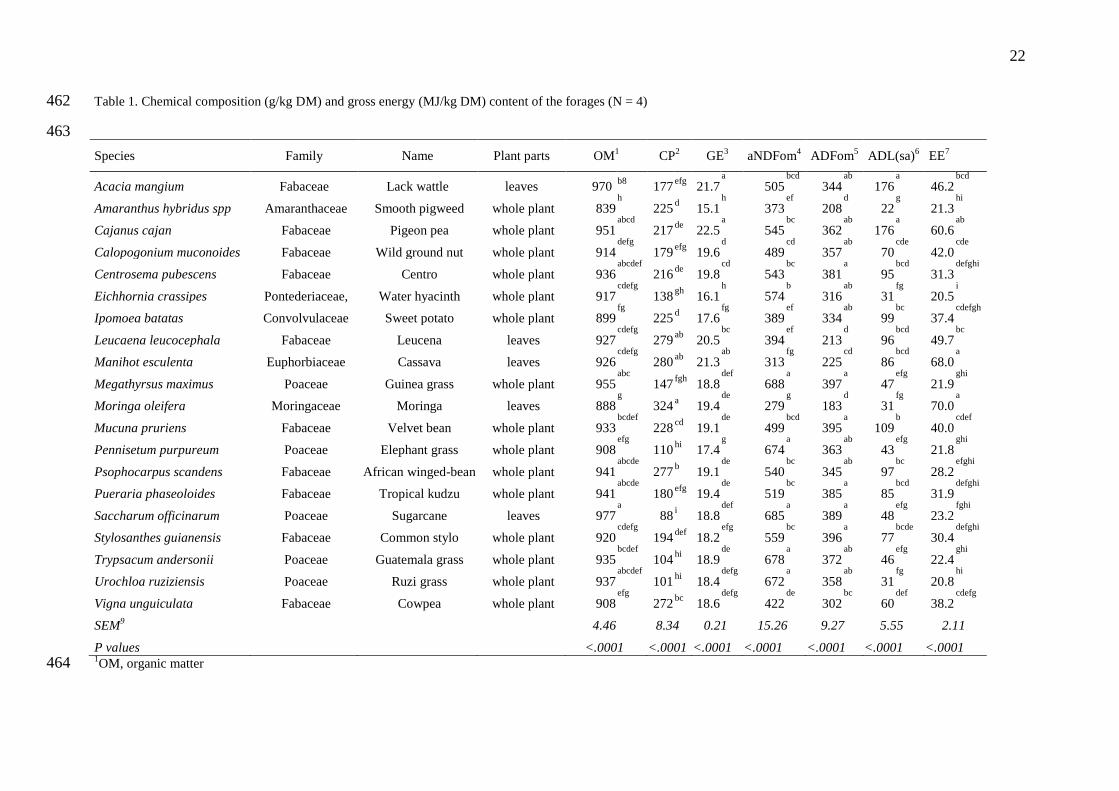
Crude protein contents of the forage species ranged from 88 to 324 g/kg DM and NDF 144
content ranged from 279 to 688 g/kg DM (Table 1). The lowest CP values (88 to 147 g kg
−1 145
DM) and the highest NDF contents (554 to 688 g/kg DM) were found in grasses (M. maximus, 146
P. purpureum, S. officinarum, U. ruziziensis, T. andersonii) and Eichhornia crassipes. In 147
contrast, the dicotyledons such as A. hybridus, I. batatas, M. pruriens, V. unguiculata, 148
P. scandens, L. Leucocephala, M. esculenta and M. oleifera showed CP contents ranged from 149
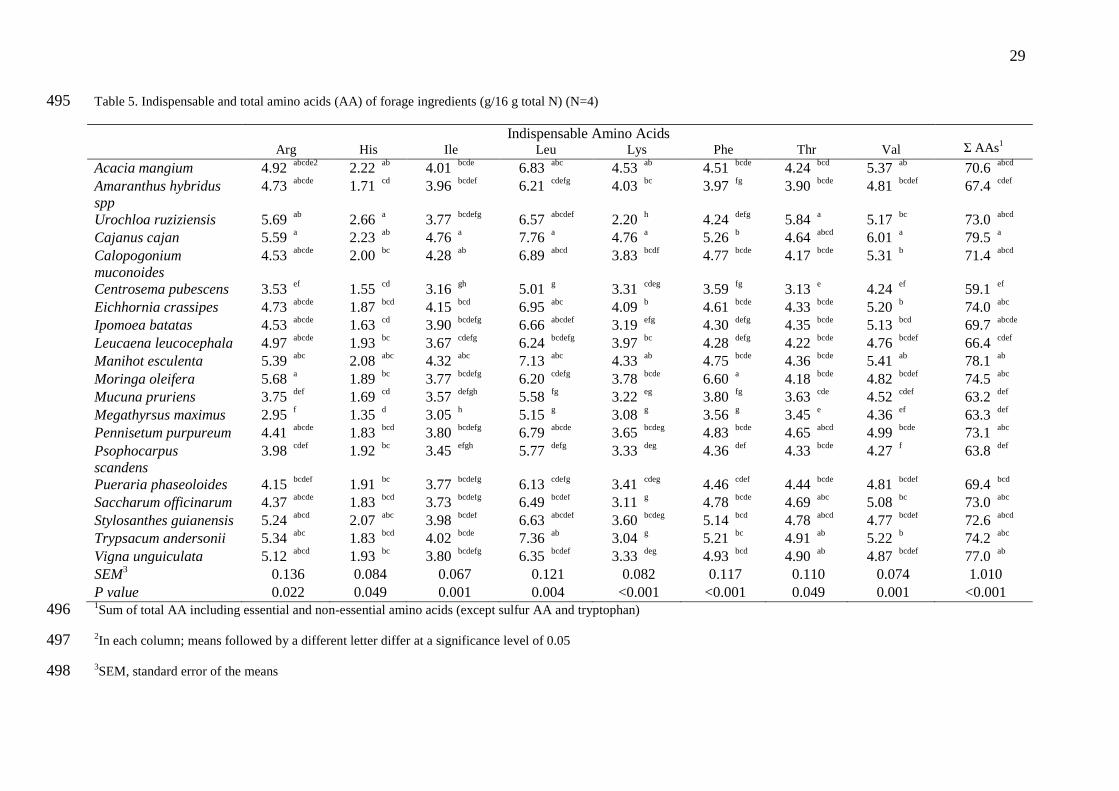
225 to 326 g/kg DM and NDF content ranged from 208 to 395 g/kg DM. The AA profile 150
differed between forages but all species were highly deficient in Lysine, with values ranging 151
between 3.08 and 4.76 g/16g N against recommendations of 7.14 g/16g N (NRC, 2012), with 152
grasses being the most deficient. The legume C. cajan and more surprisingly the grass T. 153
andersonii had the most balanced protein profile being deficient in Lysine (4,76 and 3.04 154
g/16g N, respectively) and slightly deficient in Histidine (2.23 and 1.83 g/16g N, 155
respectively). Conversely, M. maximus appeared to have the most unbalanced protein profile. 156
In terms of total amount of total AA per gram of protein, the lowest value were obtained with 157
C. pubescens , M. pruriens, M. maximus and P. scandens (59 to 63 g/16g N) while the highest 158
values were found in C. cajan, M. esculenta and, V. unguiculata (77 to 80 g/16g N). 159
160
8
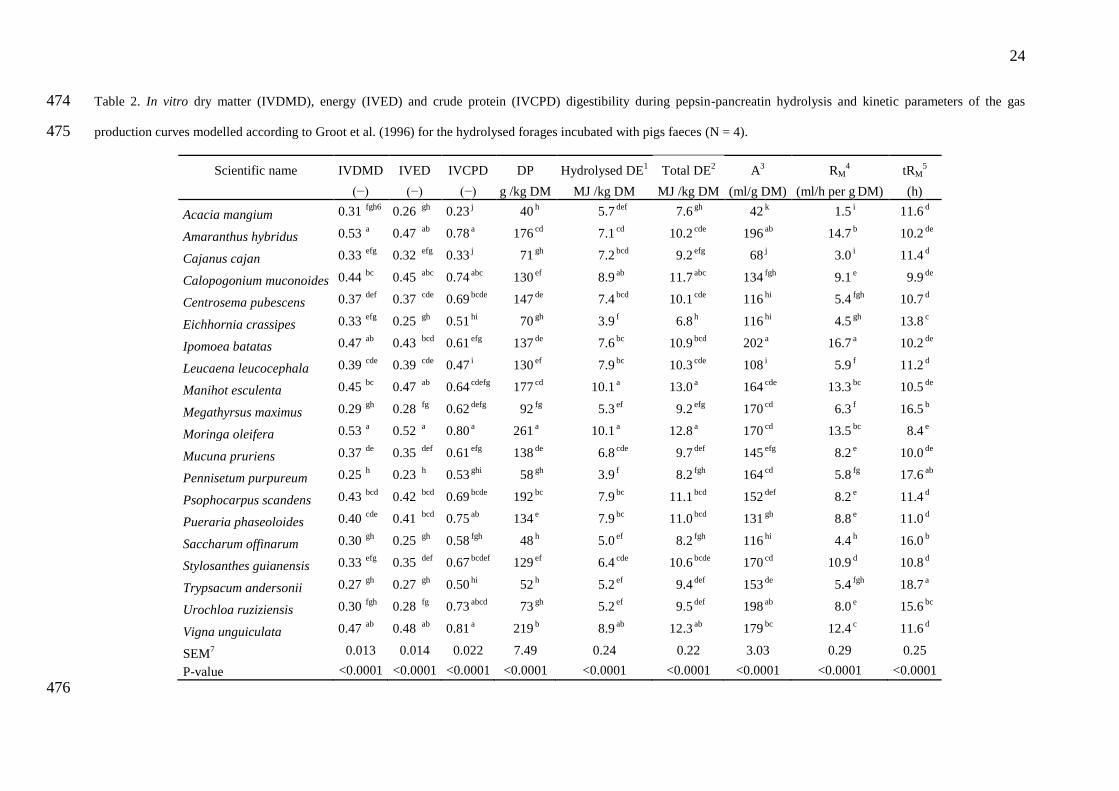
3.2. In vitro digestibility and fermentation 161
IVDMD ranged from 0.25 to 0.53, depending on the species (P<0.001), while IVCPD 162
ranged from 0.23 to 0.81(P<0.001) and that of energy (IVED) ranged from 0.23 to 0.52 163
(P<0.001) (Table 2). M. esculenta, M. oleifera, I. batatas, C. muconoides, V. unguiculata, P. 164
scandens and A. hybridus had the highest IVDMD, IVED and IVCPD values. Although it had 165
a low IVDMD of 0.40, P. phaseoloides scored among the highest for IVCPD with 0.75. Gas 166
production kinetics of the fibre-rich residues recovered after the pepsin and pancreatin 167
hydrolysis showed that different forage species have different fermentabilities. Final gas 168
production (A) varied from 42 ml/g DM for A. mangium to 202 ml/g DM for I. batatas 169
(P<0.001). These two species also gave the extreme values for the maximum rate of 170
fermentation (RM) which ranged from 1.5 to 16.7 ml/h per g DM (P<0.001). Mid-fermentation 171
times (B) and time at which RM is reached (tRM) ranged from 11.8 to 24.5 h and 8.4 to 18.7 h 172
(P<0.001), respectively. 173
As a consequence of their lower CP content as well as their lower IVCPD and 174
fermentability, all grasses (M. maximus, P. purpureum, S. officinarum, U. ruziziensis, and T. 175
andersonii) as well as A. mangium, C. cajan and E. crassipes, ranked amongst the species 176
with the lowest in vitro digestible protein (DP) values (40 to 92 g/kg DM). With DP ranging 177
from 129 to 147 g/kg DM, S. guianensis, C. muconoides, L. leucocephala, P. phaseoloides, I. 178
batatas, M. pruriens, and C. pubescens showed low DP values ranging from 129 to 147 g/kg 179
DM in contrast to A. hybridus, M. esculenta, P. scandens V. unguiculata and M. oleifera, 180
whose DP contents ranged from 176 to 261 g/kg DM. All grasses as well as A. mangium and 181
E. crassipes had the poorest digestible energy (DE) contents with values as low as 5.7 MJ/kg. 182
The species with the highest total energy, including the DE released from enzymatic 183
hydrolysis and the contribution of SCFA from fermentation, were: C. mucunoides 184
9
(11.7 MJ/kg), V. unguiculata (12.3 MJ/kg), M. Oleifera (12.8 MJ/kg) and M. esculenta (13.0 185
MJ/kg) 186
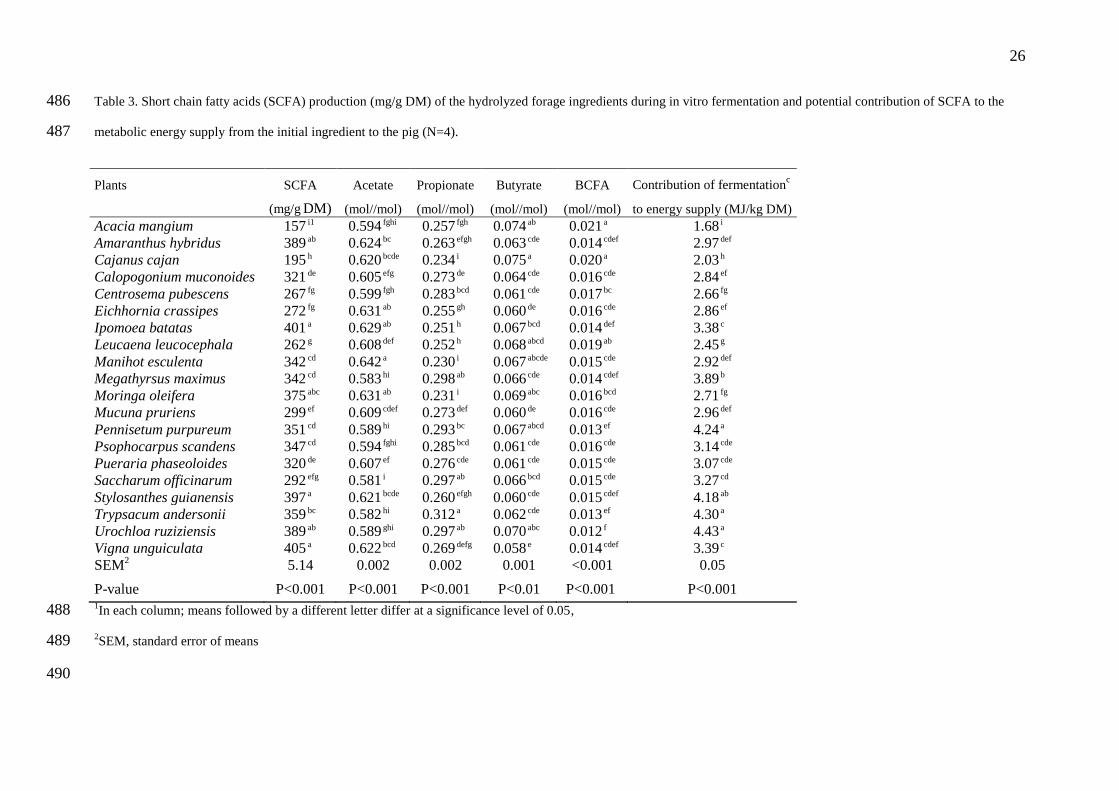
3.3. Short chain fatty acids 187
Total SCFA production during the in vitro fermentation (Table 3) differed between 188
forage species (P<0.001). These differences were consistent with those observed during 189
fermentation kinetics as total SCFA production was correlated to maximum rate of gas 190
production (r = 0.72, P<0.001) and final gas volume (r = 0.85, P<0.001). The fibre-rich 191
residue of V. unguiculata, I batatas, S. guianensis, A. hybridus, U. ruziziensis and, M. 192
oleifera, produced more SCFA (375 to 405 mg/g DM of enzymatically hydrolysed forage) 193
than the other species (157 to 359 mg/g DM). M. esculenta, E. crassipes, I. batatas showed 194
the highest acetate molar ratio (0.629 to 0.642) while grasses (M. maximus, P. purpureum, T. 195
andersonii, U. ruziziensis) had the lowest acetate (0.581 to 0.589) and the highest propionate 196
molar ratio (0.293 to 0.312). Although significant differences between forage species in 197
butyrate and BCFA molar ratios were quite little in absolute value. 198
The NDF content affected IVDMD (r = -0.82, P<0.001) and IVED (r = -0.80, 199
P<0.001). There was also a negative correlation (r = -0.71, P<0.001) between DP and NDF 200
content for all forages. 201
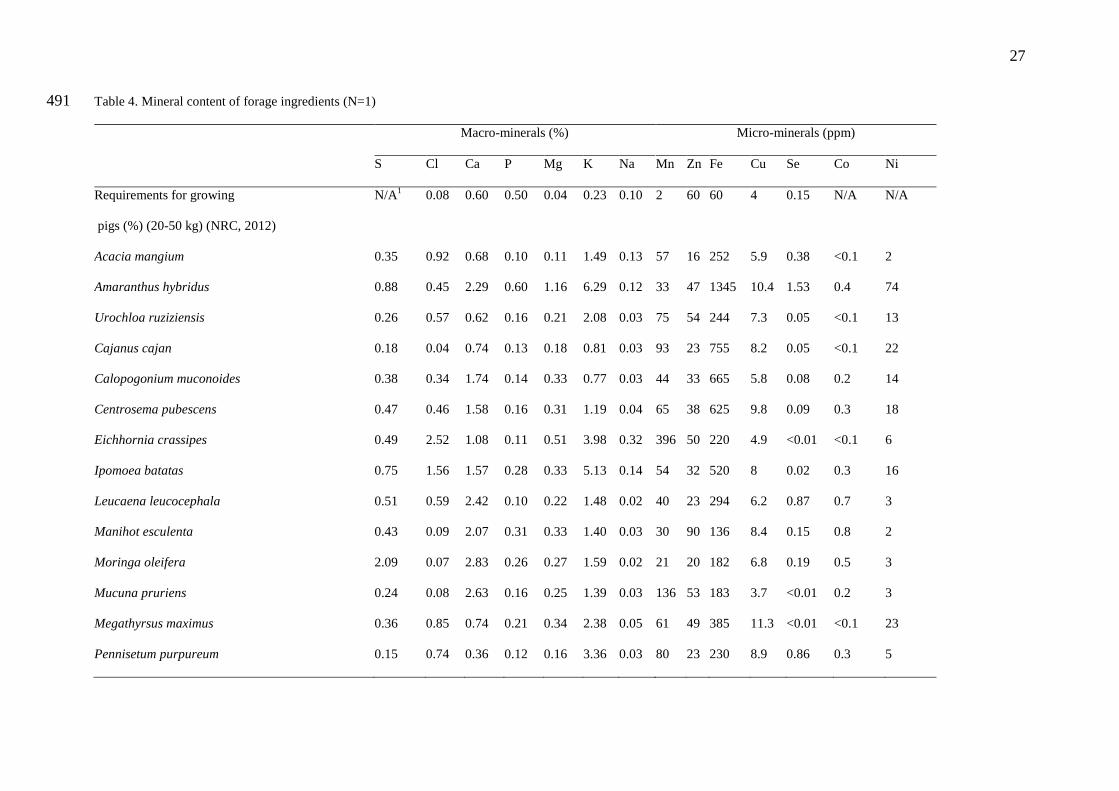
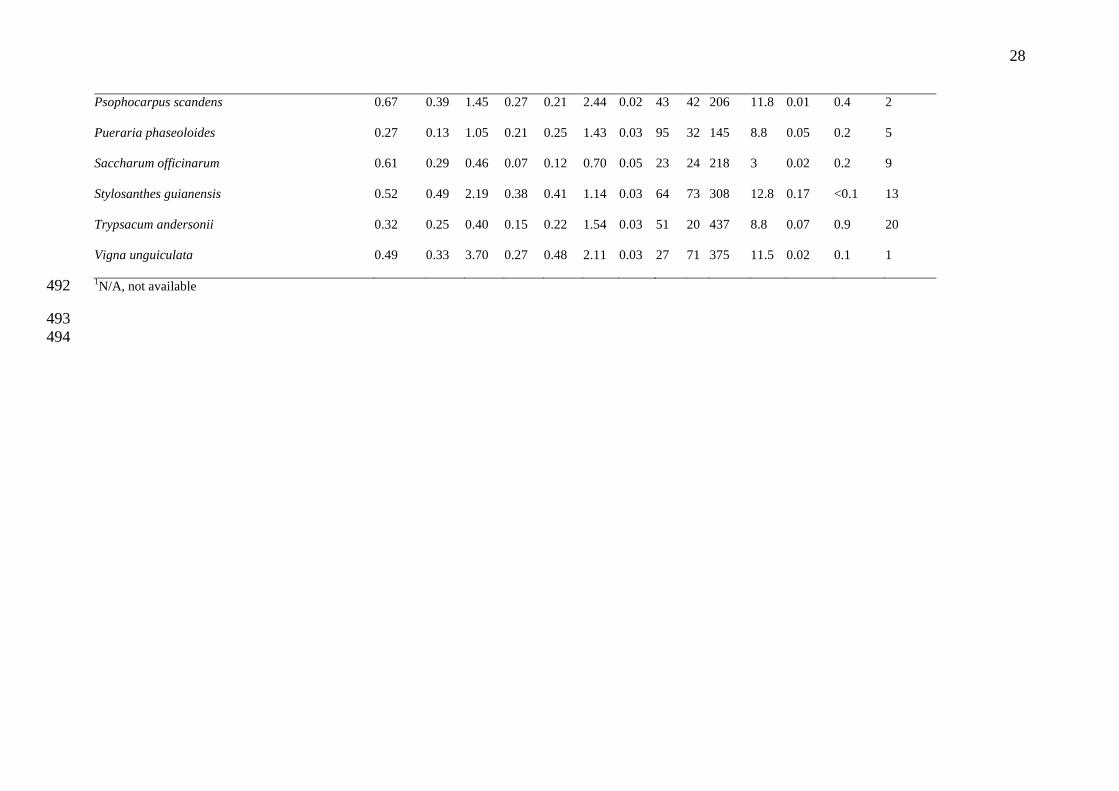
3.4. Mineral content of forages 202
The contents of macro- and micro-minerals in the sampled forage species varied 203
widely. Sulphur content ranged from 1.5 in P. purpureum to 20.9 g/kg DM in M. oleifera. 204
Calcium content ranged from 3.6 in P. purpureum to 37.0 g/kg DM in V. unguiculata while 205
phosphorus content ranged from 0.17 in S. officinarum to 6.0 g/kg DM in A. hybridus. 206
Magnesium content ranged from 1.1 to 11.6 g/kg DM sodium and potassium content ranged 207
from 0.2 to 3.8 g/kg DM and 7.0 to 62.9 g/kg DM, respectively. The highest macro mineral 208
10
contents were obtained from, in ascending order, M. oleifera, V. unguiculata, E. crassipes, I. 209
batatas and A. hybridus. 210
Levels of copper and nickel levels were low in all the forage plants compared to those 211
of other minerals. Cobalt and selenium levels were very low, and in some species below 212
detection levels. The iron levels were relatively high while phosphorus content was low in 213
almost all forage species compared to nutritional requirements (Table 4). Calcium-to-214
phosphorus ratio was high in all plants. Among the studied plants, A. hybridus had the highest 215
macro- and micro-nutrient levels. 216
Discussion 217
Feeding is the most important component in the efficiency of pig production systems, 218
yet a recent survey (Kambashi et al., submitted) showed that in the Kinshasa and Bas-Congo 219
provinces of the DRC, smallholders feed their pigs with by-products and locally available 220
forage plants. The efficiency of such a system depends on the nutrients that are provided by 221
forage and the capacity with which these nutrients are assimilated and converted into meat. 222
The in vitro approach used in this research allowed to evaluate the potential nutritive 223
value of a large number of forage species providing an insight, not only on their chemical 224
composition, but also on their enzymatic digestibility and the fermentability of their 225
indigestible fraction in the large intestine. However, this methodology is not perfect as the 226
capacity of a feed ingredient to supply nutrients to an animal depends on both the quantity 227
that an animal will voluntary ingest and how much nutrients present will be digested and 228
metabolised by the animal. Intake was not assessed here and not all the features regarding 229
digestion are assessed using the in vitro method. For example, the impact of toxic compounds 230
in the plant and their consequences on the intake and the digestive processes (Acamovic and 231
Brooker, 2005, Martens et al. 2012) are not modelled in the in vitro method. Another example 232
is the interaction between feed ingredients and with digestive processes. Some forage species 233
11
are rich in fibre with high water-holding capacity. The swelling of such fibre in the upper tract 234
of the pig will impact the digestibility of the whole diet by reducing transit time and contact 235
between the feed particles and the digestive enzymes (Partanen et al., 2007; Régnier et al., 236
2013). This effect cannot be evaluated in the chosen in vitro model either. 237
Considering chemical composition, except for A. mangium and C. cajan, all Fabaceae 238
have CP contents that meet the requirements for growing pigs (200 g/kg DM; NRC, 2012) and 239
yield high DP content. More specifically, the high protein content of M. oleifera, M. 240
esculenta, and the Fabaceae L. leucocephala, P. scandens and V. unguiculata, with 324, 280, 241
279, 277 and 272 g/kg DM, respectively, justifies their use in pig feeding since protein is the 242
most limiting factor in smallholder pig feeding systems in tropical areas (Leterme et al., 243
2005). These protein-rich plants also have an interesting amino acid profile (Table 5). 244
However, none of them covers the essential amino acids requirement of growing pigs, 245
especially in Lysine which was 45 to 68 % of the Lysine requirement per g/16g N for growing 246
pigs (NRC, 2012). Therefore using the above-mentioned forage species to supplement 247
Lysine-deficient basal diets, such as brewers grains and wheat bran (Kambashi et al., 248
submitted), requires to feed the animals above requirement levels for protein content or to 249
supplement forage-based diets with synthetic lysine. Moreover, the total AA contents 250
presented here do not consider digestibility of AA which can greatly vary between species 251
and could modify the ranking of the forages based on protein profile. As an example, the best 252
protein profile was found in C. cajan. However, the amino acid availability in this species is 253
expected to be limited by the low digestibility of the crude protein (0.33). 254
The high NDF and ADF contents of the grasses and E. crassipes explain their low in 255
vitro digestibility, as illustrated by the correlation linking NDF to IVDMD and IVED (r = -256
0.71 and -0.84 respectively, P<0.001) in this study and the more general observations by 257
Noblet and van Milgen (2004). The digestibility and fermentability of A. mangium and C. 258
12
cajan were low, probably because of the presence of plant secondary metabolites together 259
with their high lignin contents (176g/kg DM of ADL, respectively). Clavero and Razz (2011) 260
and Uwangbaoje (2012) found these plants to contain condensed tannins (4.8 and 38.7 mg/g 261
DM) and phenols (29.1 and 2.2 mg/g). , 262
In contrast to CP, the total digestible energy (DE) contents of the forages not meet the 263
requirements for growing pigs (15.8 MJ/kg
DM; NRC, 2012). V. unguiculata and C. 264
muconoides present DE contents of 11.7 and 12.3 MJ/kg DM, respectively whereas M. 265
oleifera and M. esculenta scored even better with 12.8 and 13.0 MJ/kg DM, respectively. In 266
addition, to hydrolysed DE, the SCFA released through fermentation in the large intestine of 267
the indigestible fibrous residue can supply up to 4 MJ/kg DM of additional metabolic energy 268
that significantly increases the energy value of some forage species. Interestingly, grasses 269
displayed high hemicellulose contents (calculated as the difference NDF-ADF) as opposed to 270
many legumes which show lower NDF values but ADF values similar to grasses. This leads 271
to distinct fermentation profile in grasses, yielding more propionate and less acetate than 272
legumes and other dicots, and induces a significant contribution of hindgut fermentation to 273
ME supply in the animal as a combination of (1) high indigestible feed particles reaching the 274
intestine, (2) high fermentability of the fibrous matrix, and (3) the higher energy content of 275
propionate as opposed to acetate (20.51 kJ/g vs. 14.56 kJ/g, respectively). Nevertheless, 276
SCFA production are measured in the in vitro model after 72 h fermentation. It represents a 277
long transit time in the large intestine that would be more consistent with sows than finishing 278
pigs and growing pigs (Le Goff et al., 2002) 279
The high fermentability related to greater SCFA results in a decrease in pH, which in 280
turn influences the composition of colonic microflora, decreases the solubility of bile acids 281
and increases absorption of some minerals (Hijova and Chmelarova, 2007). Low pH values 282
are also believed to prevent the overgrowth of pH-sensitive pathogenic bacteria. For example, 283
13
propionate or formate have been shown to kill E. coli or Salmonella under conditions of high 284
acidity (pH 5) (Cherrington et al., 1991). Some in vivo studies support these findings, with 285
greater SCFA production being related to lower numbers of potential pathogens (such as 286
Salmonella) in swine (Pieper et al., 2012). Some species combining high DP and DE contents 287
with high SCFA production can potentially contribute significantly to efficient nutrition 288
together with the development of health-promoting bacteria in pig intestines by providing 289
metabolizable energy (Bindelle et al., 2007b; Hijova and Chmelarova, 2007) and other 290
metabolic end products for pig use, as well as nutrients for the colonic epithelium, modulators 291
of colonic and intracellular pH, cell volume and other associated functions (Hijova and 292
Chmelarova, 2007). 293
Nonetheless, attention must be paid to the maximum levels of forage incorporation in 294
pig diets as some forage species may contain variable amounts of anti-nutritional or toxic 295
factors such as tannins, as discussed earlier: HCN in M. esculenta, mimosine in L. 296
leucocephala, and lectins in I. batatas and P. scandens. These compounds might reduce 297
voluntary intake and in vivo digestibility (Régnier et al., 2012). However, with moderate 298
inclusion rate of these forages, anti-nutritional effect is not significant. For example, the 299
incorporation of 350 g/kg DM of I. batatas leaves or 150 g/kg DM of M. esculenta leaves or 300
L. leucocephala in pig diets have shown ileal digestibility up to 74% (Phuc and Lindberg, 301
2000; An et al., 2004). However, the in vitro approach adopted in this research does not 302
allow considering these issues and the presented results should be taken as a first orientation 303
on the feeding value of one species. Obviously, one species scoring poorly on in vitro 304
digestibility trials as performed here will be of little value as pig feed ingredient. 305
Nevertheless, the opposite conclusion is not straightforward. A species scoring with high 306
nutritive characteristics as evaluated in vitro might not necessarily be well consumed or 307
digested in vivo possibly because of poor palatability, of the presence of plant secondary 308
14
metabolites displaying anti-nutritive or toxic attributes that are not always noticeable using an 309
in vitro approach. 310
The use of forage to supplement local feed resources can provide a better balanced diet 311
that improves growth performances keeping feeding costs under control (Lemke and Valle 312
Zárate, 2008) and in a sustainable way. For example, it has been reported that the inclusion of 313
ensiled S. guianensis in the diet of local pigs improved growth performance up to three times 314
compared to pigs fed ill-balanced diets based on locally available by-products (Kaensombath 315
et al., 2013b). However, the replacement of conventional sources of protein, such as soybean 316
meal, by protein-rich forage must be partial because Phengsavanh and Lindberg (2013) 317
reported that it reduces feed intake and growth performance. In another study, Kaensombath 318
and Lindberg (2013a) showed that when 50% of soybean protein was replaced with proteins 319
from ensiled Colocasia esculenta, growth performance and carcass traits of local and 320
improved pigs were not affected. Surprisingly, Men et al. (2006) report high cost 321
effectiveness of E. crassipes-based diets in Vietnam while this species scored really bad in 322
terms of nutritive value in the present investigation. This allows expecting even higher 323
efficiencies of feeding systems based on low cost forage with higher nutritive value than 324
water hyacinth. 325
Despite the expected high variability within species that was not assessed in this study 326
as only one sample per species was analysed, legumes seem to be a richer and better balanced 327
source of minerals than grasses. Yet variability among species, specifically with regard to the 328
bioavailability of minerals, must be considered as it ranges from 0.41 to 58% for P (Poulsen et 329
al., 2010), 3 to 27% for Fe (Kumari et al., 2004), 11 to 26% for Zn and 18 to 48% for Cu 330
(Agte et al., 2000). Due to the high calcium-to-phosphorus ratio, which decreases absorption 331
of phosphorus (Liu et al., 2000), as well as the low phosphorus content in most forages, these 332
species seem to perfectly supplement basal ingredients usually used by farmers, namely 333
15
brewers grains and wheat bran, which are deficient in Ca (2.1 and 1.4 g/kg, respectively) and 334
rich in P (5.8 and 9.9 g/kg, respectively). The outstanding mineral content of A. hybridus 335
deserves further attention, as according to NRC (2012), its Se level is quite high compared to 336
the requirements (0.3 ppm) but is still below the toxicity level (5 ppm). Co, Cu and Ni were 337
below toxicity levels in all forages, but with regard to this it must be noted that forage are 338
rarely fed to pigs alone; but rather, mixed with other ingredients. 339
It can be concluded that among the investigated plants in this study, A. hybridus, I. 340
batatas, M. esculenta, M. oleifera, P. scandens and V. unguiculata combine several 341
interesting nutritive traits including moderate to high IVDMD, IVED, DCP, RM, SCFA, Ca 342
and low NDF contents. They represent potentially useful sources of proteins and minerals 343
that might be used at low cost to improve pig feeding, mineral intake and intestinal health. 344
Grasses as well as A. mangium, E. crassipes and C. cajan should be discouraged in pig diet 345
because of their low nutritive value. Further studies are required to determine voluntary intake 346
and in vivo nutritive value for the potentially useful species and their ideal inclusion level in 347
pig diets for optimum performance in production environments with low quality basal diets. 348
349
Acknowledgements 350
The authors gratefully acknowledge Wallonie-Bruxelles International (Brussels, 351
Belgium) and the Walloon government (Namur, Belgium) for their support of the CAVTK 352
project. 353
354
16
References 355
Acamovic, T., Brooker, J.D., 2005. Biochemistry of plant secondary metabolites and their 356
effects in animals. The Proceedings of the Nutrition Society 64, 403-412. 357
Agte, V.V., Tarwadi, K.V., Mengale, S., Chiplonkar, S.A., 2000. Potential of traditionally 358
cooked green leafy vegetables as natural sources for supplementation of eight micronutrients 359
in vegetarian diets. J. Food Comp. Anal. 13, 885-891. 360
An, L.V., Hong, T.T.T., Lindberg, J.E., 2004. Ileal and total tract digestibility in growing pigs 361
fed cassava root meal diets with inclusion of fresh, dry and ensiled sweet potato (Ipomoea 362
batatas L. (Lam.)) leaves. Anim. Feed Sci. Technol. 114, 127-139. 363
AOAC. 1990. Official Methods of Analysis. In: A. O. A. Chemists (ed.) No. 15th ed. 364
(Association Official Analytical Chemists, Arlington). 365
Bindelle, J., Buldgen, A., Boudry, C., Leterme, P., 2007a. Effect of inoculum and pepsin–366
pancreatin hydrolysis on fibre fermentation measured by the gas production technique in pigs. 367
Anim. Feed Sci. Technol. 132, 111-122. 368
Bindelle, J., Buldgen, A., Wavreille, J., Agneessens, R., Destain, J.P., Wathelet, B., Leterme, 369
P., 2007b. The source of fermentable carbohydrates influences the in vitro protein synthesis 370
by colonic bacteria isolated from pigs. Animal 1, 1126-1133. 371
Braun, J.V., 2007. The World Food Situation: New Driving Forces and Required Actions, 372
International Food Policy Research Institute, Washington,D.C. 373
Cherrington, C.A., Hinton, M., Pearson, G.R., Chopra, I., 1991. Short-chain organic acids at 374
pH 5.0 kill Escherichia coli and Salmonella spp. without causing membrane perturbation. J. 375
Appl. Microb. 70, 161-165. 376
Clavero, T., Razz, R., 2011. Chemical compositions and anti-nutritive factors of Acacia 377
mangium. J. Anim. Sci. 89, E-Suppl. 1/J., 46. 378
FAO, 2012. Food Price Index, World Food Situation, FAO. 379
17
Gaedeken, D., Breves, G., Oslage, H.J., 1989. Efficiency of energy utilization of intracaecally 380
infused volatile fatty acids in pigs, In: Honing, Y.v.d., Close, W.H. (Eds.), 11. Symposium on 381
energy metabolism of farm animals, Pudoc, Wageningen (Netherlands), Lunteren 382
(Netherlands), pp. 115-118. 383
Groot, J.C.J., Cone, J.W., Williams, B.A., Debersaques, F.M.A., Lantinga, E.A., 1996. 384
Multiphasic analysis of gas production kinetics for in vitro fermentation of ruminant feeds. 385
Anim. Feed Sci. Technol. 64, 77-89. 386
Hijova, E., Chmelarova, A., 2007. Short chain fatty acids and colonic health. Bratislavske 387
lekarske listy 108, 354-358. 388
Kaensombath, L., Lindberg, J.E., 2013a. Effect of replacing soybean protein by taro leaf 389
(Colocasia esculenta (L.) Schott) protein on growth performance of exotic (Landrace x 390
Yorkshire) and native (Moo Lath) Lao pigs. Trop. Anim. Health Prod. 45, 45-51. 391
Kaensombath, L., Neil, M., Lindberg, J.E., 2013b. Effect of replacing soybean protein with 392
protein from ensiled stylo (Stylosanthes guianensis (Aubl.) Sw. var. guianensis) on growth 393
performance, carcass traits and organ weights of exotic (Landrace x Yorkshire) and native 394
(Moo Lath) Lao pigs. Trop. Anim. Health Prod. 45, 865-871. 395
Kumaresan, A., Bujarbaruah, K.M., Pathak, K.A., Anubrata Das, Bardoloi, R.K., 2009. 396
Integrated resource-driven pig production systems in a mountainous area of Northeast India: 397
production practices and pig performance. Trop. Anim. Health Prod. 41, 1187-1196. 398
Kumari, M., Gupta, S., Lakshmi, A.J., Prakash, J., 2004. Iron bioavailability in green leafy 399
vegetables cooked in different utensils. Food Chem. 86, 217-222. 400
Le Goff, G., Milgen, J., Noblet, J., 2002. Influence of dietary fibre on digestive utilization and 401
rate of passage in growing pigs, finishing pigs and adult sows. Animal Science (Penicuik, 402
Scotland) 74, 503-515. 403
18
Lemke, U., Valle Zárate, A., 2008. Dynamics and developmental trends of smallholder pig 404
production systems in North Vietnam. Agr. Syst. 96 207-223. 405
Leterme, P., Londoño, A.M., Estrada, F., Souffrant, W.B., Buldgen, A., 2005. Chemical 406
composition, nutritive value and voluntary intake of tropical tree foliage and cocoyam in pigs. 407
J. Sci. Food Agr. 85, 1725-1732. 408
Leterme, P., Boteroa, M., Londoñoa, A.M., Bindelle, J., Buldgen, A., 2006. Nutritive value of 409
tropical tree leaf meals in adult sows. Anim. Sci. 82, 175-182. 410
Liu, J., Bollinger, D.W., Ledoux, D.R., Venum, T.L., 2000. Effects of dietary 411
calcium:phosphorus ratios on apparent absorption of calcium and phosphorus in the small 412
intestine, cecum, and colon of pigs. J. Anim. Sci. 78, 106-109. 413
Livesey, G., Elia, M., 1995. Short-chain fatty acids as an energy source in the colon: 414
metabolism and clinical implications, In: Cummings, J.H., Rombeau, J.L., Sakata, T. (Eds.), 415
Physiological and clinical aspects of short-chain fatty acids, Cambridge University Press, UK, 416
pp. 427-481. 417
Martens, S.D., Tiemann, T.T., Bindelle, J., Peters, M., Lascano, C.E., 2012. Alternative plant 418
protein sources for pigs and chickens in the tropics – nutritional value and constraints: a 419
review. J. Agr. Rural Dev. Trop. 113, 101-123. 420
Men, L.T., Yamasaki, S., Caldwell, J.S., Yamada, R., Takada, R., Taniguchi, T., 2006. Effect 421
of farm household income levels and rice-based diet or water hyacinth (Eichhornia crassipes) 422
supplementation on growth/cost performances and meat indexes of growing and finishing 423
pigs in the Mekong Delta of Vietnam. Anim. Sci. J. 77, 320-329. 424
Noblet, J., van Milgen, J., 2004. Energy value of pig feeds: Effect of pig body weight and 425
energy evaluation system. J. Anim. Sci. 82, 229-238. 426
NRC, 2012. Nutrient Requirements of Swine. National Academy Press, Washington, DC. 427
19
Partanen, K., Jalava, T., Valaja, J., 2007. Effects of a dietary organic acid mixture and of 428
dietary fibre levels on ileal and faecal nutrient apparent digestibility, bacterial nitrogen flow, 429
microbial metabolite concentrations and rate of passage in the digestive tract of pigs. Animal 430
1, 389-401 431
Phengsavanh, P., Lindberg, J., 2013. Effect of replacing soybean protein with protein from 432
porcupine joint vetch (Aeschynomene histrix BRA 9690) and stylo (Stylosanthes guianensis 433
Composite) leaf meal on growth performance of native (Moo Lath) Lao pigs. Trop. Anim. 434
Health Prod. 1-8. 435
Phengsavanh, P., Ogle, B., Stur, W., Frankow-Lindberg, B.E., Lindberg, J.E., 2010. Feeding 436
and performance of pigs in smallholder production systems in Northern Lao PDR. Trop. 437
Anim. Health Prod. 42, 1627-1633. 438
Phuc, B.H.N., Lindberg, J.E., 2000. Ileal and total tract digestibility in growing pigs given 439
cassava root meal diets with inclusion of cassava leaves, leucaena leaves and groundnut 440
foliage. Anim. Sci. 71, 301-308. 441
Pieper, R., Bindelle, J., Malik, G., Marshall, J., Rossnagel, B.G., Leterme, P., Van Kessel, 442
A.G., 2012. Influence of different carbohydrate composition in barley varieties on Salmonella 443
Typhimurium var. Copenhagen colonisation in a "Trojan" challenge model in pigs. Arch. 444
Anim. Nutr. 66, 163-179. 445
Poulsen, H.D., Carlson, D., Nørgaard, J.V., Blaabjerg, K., 2010. Phosphorus digestibility is 446
highly influenced by phytase but slightly by calcium in growing pigs. Livest. Sci. 134, 100-447
102. 448
Régnier, C., Bocage, B., Archimède, H., Noblet, J., Renaudeau, D., 2013. Digestive 449
utilization of tropical foliages of cassava, sweet potatoes, wild cocoyam and erythrina in 450
Creole growing pigs. Anim. Feed Sci. Technol. 180, 44-54. 451
20
Régnier, C., Jaguelin, Y., Noblet, J., Renaudeau, D., 2012. Ileal digestibility of amino acids of 452
cassava, sweet potato, cocoyam and erythrina foliages fed to growing pigs. Animal 6, 586-453
593. 454
Uwangbaoje, L.O., 2012. The mineral and phytochemical analysis of the leaves of senna alata 455
and cajanus cajan and their medicinal value. Int. J. Bio. Pharm. Al. Sci. 1, 1-11. 456
Van Soest, P.J., Robertson, J.B., Lewis, B.A., 1991. Methods for Dietary Fiber, Neutral 457
Detergent Fiber, and Nonstarch Polysaccharides in Relation to Animal Nutrition. J. Dairy Sci. 458
74, 3583-3597. 459
460

21
461
22
Table 1. Chemical composition (g/kg DM) and gross energy (MJ/kg DM) content of the forages (N = 4) 462
463
Species Family Name Plant parts OM1 CP
2 GE
3 aNDFom
4 ADFom
5 ADL(sa)
6 EE
7
Acacia mangium Fabaceae Lack wattle leaves 970 b8
177 efg
21.7 a
505 bcd
344 ab
176 a
46.2 bcd
Amaranthus hybridus spp Amaranthaceae Smooth pigweed whole plant 839 h
225 d
15.1 h
373 ef
208 d
22 g
21.3 hi
Cajanus cajan Fabaceae Pigeon pea whole plant 951 abcd
217 de
22.5 a
545 bc
362 ab
176 a
60.6 ab
Calopogonium muconoides Fabaceae Wild ground nut whole plant 914 defg
179 efg
19.6 d
489 cd
357 ab
70 cde
42.0 cde
Centrosema pubescens Fabaceae Centro whole plant 936 abcdef
216 de
19.8 cd
543 bc
381 a
95 bcd
31.3 defghi
Eichhornia crassipes Pontederiaceae, Water hyacinth whole plant 917 cdefg
138 gh
16.1 h
574 b
316 ab
31 fg
20.5 i
Ipomoea batatas Convolvulaceae Sweet potato whole plant 899 fg
225 d
17.6 fg
389 ef
334 ab
99 bc
37.4 cdefgh
Leucaena leucocephala Fabaceae Leucena leaves 927 cdefg
279 ab
20.5 bc
394 ef
213 d
96 bcd
49.7 bc
Manihot esculenta Euphorbiaceae Cassava leaves 926 cdefg
280 ab
21.3 ab
313 fg
225 cd
86 bcd
68.0 a
Megathyrsus maximus Poaceae Guinea grass whole plant 955 abc
147 fgh
18.8 def
688 a
397 a
47 efg
21.9 ghi
Moringa oleifera Moringaceae Moringa leaves 888 g
324 a
19.4 de
279 g
183 d
31 fg
70.0 a
Mucuna pruriens Fabaceae Velvet bean whole plant 933 bcdef
228 cd
19.1 de
499 bcd
395 a
109 b
40.0 cdef
Pennisetum purpureum Poaceae Elephant grass whole plant 908 efg
110 hi
17.4 g
674 a
363 ab
43 efg
21.8 ghi
Psophocarpus scandens Fabaceae African winged-bean whole plant 941 abcde
277 b
19.1 de
540 bc
345 ab
97 bc
28.2 efghi
Pueraria phaseoloides Fabaceae Tropical kudzu whole plant 941 abcde
180 efg
19.4 de
519 bc
385 a
85 bcd
31.9 defghi
Saccharum officinarum Poaceae Sugarcane leaves 977 a
88 i
18.8 def
685 a
389 a
48 efg
23.2 fghi
Stylosanthes guianensis Fabaceae Common stylo whole plant 920 cdefg
194 def
18.2 efg
559 bc
396 a
77 bcde
30.4 defghi
Trypsacum andersonii Poaceae Guatemala grass whole plant 935 bcdef
104 hi
18.9 de
678 a
372 ab
46 efg
22.4 ghi
Urochloa ruziziensis Poaceae Ruzi grass whole plant 937 abcdef
101 hi
18.4 defg
672 a
358 ab
31 fg
20.8 hi
Vigna unguiculata Fabaceae Cowpea whole plant 908 efg
272 bc
18.6 defg
422 de
302 bc
60 def
38.2 cdefg
SEM9 4.46
8.34
0.21
15.26
9.27
5.55
2.11
P values <.0001
<.0001 <.0001
<.0001
<.0001
<.0001
<.0001
1OM, organic matter 464
23
2CP, crude protein (N × 6.25) 465
3GE, gross energy 466
4aNDFom, neutral detergent fibre using thermostable amylase and corrected for ash content 467
5ADFom, acid detergent fibre corrected for ash content 468
6ADL(sa), acid detergent lignin 469
7EE, ether extract 470
8For one column, means followed by different letters differ (P<0.05) 471
9SEM, standard error of the means
472
473
24
Table 2. In vitro dry matter (IVDMD), energy (IVED) and crude protein (IVCPD) digestibility during pepsin-pancreatin hydrolysis and kinetic parameters of the gas 474
production curves modelled according to Groot et al. (1996) for the hydrolysed forages incubated with pigs faeces (N = 4). 475
Scientific name IVDMD IVED IVCPD DP Hydrolysed DE1
Total DE2 A
3 RM
4 tRM
5
(−) (−) (−) g /kg DM MJ /kg DM MJ /kg DM (ml/g DM) (ml/h per g DM) (h)
Acacia mangium 0.31 fgh6
0.26 gh
0.23 j
40 h
5.7 def
7.6 gh
42 k
1.5 i
11.6 d
Amaranthus hybridus 0.53 a
0.47 ab
0.78 a
176 cd
7.1 cd
10.2 cde
196 ab
14.7 b
10.2 de
Cajanus cajan 0.33 efg
0.32 efg
0.33 j
71 gh
7.2 bcd
9.2 efg
68 j
3.0 i
11.4 d
Calopogonium muconoides 0.44 bc
0.45 abc
0.74 abc
130 ef
8.9 ab
11.7 abc
134 fgh
9.1 e
9.9 de
Centrosema pubescens 0.37 def
0.37 cde
0.69 bcde
147 de
7.4 bcd
10.1 cde
116 hi
5.4 fgh
10.7 d
Eichhornia crassipes 0.33 efg
0.25 gh
0.51 hi
70 gh
3.9 f
6.8 h
116 hi
4.5 gh
13.8 c
Ipomoea batatas 0.47 ab
0.43 bcd
0.61 efg
137 de
7.6 bc
10.9 bcd
202 a
16.7 a
10.2 de
Leucaena leucocephala 0.39 cde
0.39 cde
0.47 i
130 ef
7.9 bc
10.3 cde
108 i
5.9 f
11.2 d
Manihot esculenta 0.45 bc
0.47 ab
0.64 cdefg
177 cd
10.1 a
13.0 a
164 cde
13.3 bc
10.5 de
Megathyrsus maximus 0.29 gh
0.28 fg
0.62 defg
92 fg
5.3 ef
9.2 efg
170 cd
6.3 f
16.5 b
Moringa oleifera 0.53 a
0.52 a
0.80 a
261 a
10.1 a
12.8 a
170 cd
13.5 bc
8.4 e
Mucuna pruriens 0.37 de
0.35 def
0.61 efg
138 de
6.8 cde
9.7 def
145 efg
8.2 e
10.0 de
Pennisetum purpureum 0.25 h
0.23 h
0.53 ghi
58 gh
3.9 f
8.2 fgh
164 cd
5.8 fg
17.6 ab
Psophocarpus scandens 0.43 bcd
0.42 bcd
0.69 bcde
192 bc
7.9 bc
11.1 bcd
152 def
8.2 e
11.4 d
Pueraria phaseoloides 0.40 cde
0.41 bcd
0.75 ab
134 e
7.9 bc
11.0 bcd
131 gh
8.8 e
11.0 d
Saccharum offinarum 0.30 gh
0.25 gh
0.58 fgh
48 h
5.0 ef
8.2 fgh
116 hi
4.4 h
16.0 b
Stylosanthes guianensis 0.33 efg
0.35 def
0.67 bcdef
129 ef
6.4 cde
10.6 bcde
170 cd
10.9 d
10.8 d
Trypsacum andersonii 0.27 gh
0.27 gh
0.50 hi
52 h
5.2 ef
9.4 def
153 de
5.4 fgh
18.7 a
Urochloa ruziziensis 0.30 fgh
0.28 fg
0.73 abcd
73 gh
5.2 ef
9.5 def
198 ab
8.0 e
15.6 bc
Vigna unguiculata 0.47 ab
0.48 ab
0.81 a
219 b
8.9 ab
12.3 ab
179 bc
12.4 c
11.6 d
SEM7 0.013 0.014 0.022 7.49 0.24 0.22 3.03 0.29 0.25
P-value <0.0001 <0.0001 <0.0001 <0.0001 <0.0001 <0.0001 <0.0001 <0.0001 <0.0001
476
25
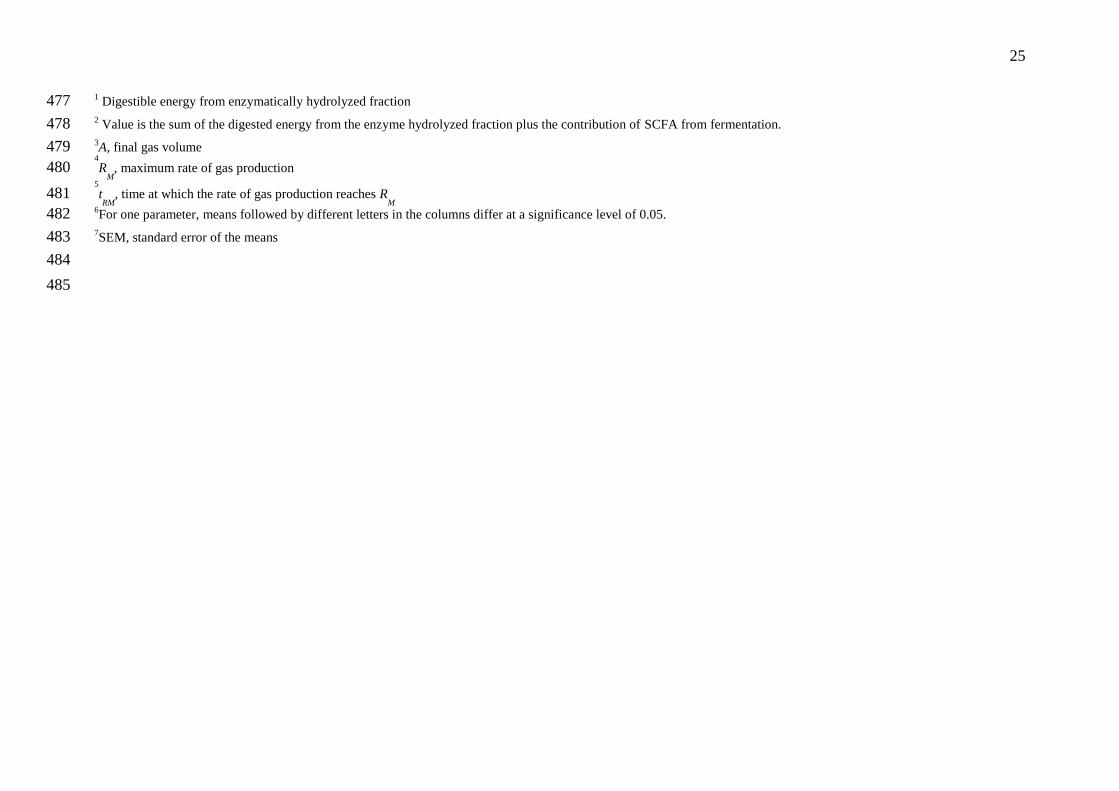
1 Digestible energy from enzymatically hydrolyzed fraction 477
2 Value is the sum of the digested energy from the enzyme hydrolyzed fraction plus the contribution of SCFA from fermentation. 478
3A, final gas volume 479
4
RM
, maximum rate of gas production 480 5
tRM
, time at which the rate of gas production reaches RM
481 6For one parameter, means followed by different letters in the columns differ at a significance level of 0.05. 482
7SEM, standard error of the means 483
484
485
26
Table 3. Short chain fatty acids (SCFA) production (mg/g DM) of the hydrolyzed forage ingredients during in vitro fermentation and potential contribution of SCFA to the 486
metabolic energy supply from the initial ingredient to the pig (N=4). 487
Plants SCFA Acetate Propionate Butyrate BCFA Contribution of fermentationc
(mg/g DM) (mol//mol) (mol//mol) (mol//mol) (mol//mol) to energy supply (MJ/kg DM)
Acacia mangium 157 i1 0.594 fghi 0.257 fgh 0.074 ab 0.021 a 1.68 i
Amaranthus hybridus 389 ab 0.624 bc 0.263 efgh 0.063 cde 0.014 cdef 2.97 def
Cajanus cajan 195 h 0.620 bcde 0.234 i 0.075 a 0.020 a 2.03 h
Calopogonium muconoides 321 de 0.605 efg 0.273 de 0.064 cde 0.016 cde 2.84 ef
Centrosema pubescens 267 fg 0.599 fgh 0.283 bcd 0.061 cde 0.017 bc 2.66 fg
Eichhornia crassipes 272 fg 0.631 ab 0.255 gh 0.060 de 0.016 cde 2.86 ef
Ipomoea batatas 401 a 0.629 ab 0.251 h 0.067 bcd 0.014 def 3.38 c
Leucaena leucocephala 262 g 0.608 def 0.252 h 0.068 abcd 0.019 ab 2.45 g
Manihot esculenta 342 cd 0.642 a 0.230 i 0.067 abcde 0.015 cde 2.92 def
Megathyrsus maximus 342 cd 0.583 hi 0.298 ab 0.066 cde 0.014 cdef 3.89 b
Moringa oleifera 375 abc 0.631 ab 0.231 i 0.069 abc 0.016 bcd 2.71 fg
Mucuna pruriens 299 ef 0.609 cdef 0.273 def 0.060 de 0.016 cde 2.96 def
Pennisetum purpureum 351 cd 0.589 hi 0.293 bc 0.067 abcd 0.013 ef 4.24 a
Psophocarpus scandens 347 cd 0.594 fghi 0.285 bcd 0.061 cde 0.016 cde 3.14 cde
Pueraria phaseoloides 320 de 0.607 ef 0.276 cde 0.061 cde 0.015 cde 3.07 cde
Saccharum officinarum 292 efg 0.581 i 0.297 ab 0.066 bcd 0.015 cde 3.27 cd
Stylosanthes guianensis 397 a 0.621 bcde 0.260 efgh 0.060 cde 0.015 cdef 4.18 ab
Trypsacum andersonii 359 bc 0.582 hi 0.312 a 0.062 cde 0.013 ef 4.30 a
Urochloa ruziziensis 389 ab 0.589 ghi 0.297 ab 0.070 abc 0.012 f 4.43 a
Vigna unguiculata 405 a 0.622 bcd 0.269 defg 0.058 e 0.014 cdef 3.39 c
SEM2
5.14 0.002 0.002 0.001 <0.001 0.05
P-value P<0.001 P<0.001 P<0.001 P<0.01 P<0.001 P<0.001 1In each column; means followed by a different letter differ at a significance level of 0.05, 488
2SEM, standard error of means 489
490
27
Table 4. Mineral content of forage ingredients (N=1) 491
Macro-minerals (%) Micro-minerals (ppm)
S Cl Ca P Mg K Na Mn Zn Fe Cu Se Co Ni
Requirements for growing
pigs (%) (20-50 kg) (NRC, 2012)
N/A1
0.08 0.60 0.50 0.04 0.23 0.10 2 60 60 4 0.15 N/A N/A
Acacia mangium 0.35 0.92 0.68 0.10 0.11 1.49 0.13 57 16 252 5.9 0.38 <0.1 2
Amaranthus hybridus 0.88 0.45 2.29 0.60 1.16 6.29 0.12 33 47 1345 10.4 1.53 0.4 74
Urochloa ruziziensis 0.26 0.57 0.62 0.16 0.21 2.08 0.03 75 54 244 7.3 0.05 <0.1 13
Cajanus cajan 0.18 0.04 0.74 0.13 0.18 0.81 0.03 93 23 755 8.2 0.05 <0.1 22
Calopogonium muconoides 0.38 0.34 1.74 0.14 0.33 0.77 0.03 44 33 665 5.8 0.08 0.2 14
Centrosema pubescens 0.47 0.46 1.58 0.16 0.31 1.19 0.04 65 38 625 9.8 0.09 0.3 18
Eichhornia crassipes 0.49 2.52 1.08 0.11 0.51 3.98 0.32 396 50 220 4.9 <0.01 <0.1 6
Ipomoea batatas 0.75 1.56 1.57 0.28 0.33 5.13 0.14 54 32 520 8 0.02 0.3 16
Leucaena leucocephala 0.51 0.59 2.42 0.10 0.22 1.48 0.02 40 23 294 6.2 0.87 0.7 3
Manihot esculenta 0.43 0.09 2.07 0.31 0.33 1.40 0.03 30 90 136 8.4 0.15 0.8 2
Moringa oleifera 2.09 0.07 2.83 0.26 0.27 1.59 0.02 21 20 182 6.8 0.19 0.5 3
Mucuna pruriens 0.24 0.08 2.63 0.16 0.25 1.39 0.03 136 53 183 3.7 <0.01 0.2 3
Megathyrsus maximus 0.36 0.85 0.74 0.21 0.34 2.38 0.05 61 49 385 11.3 <0.01 <0.1 23
Pennisetum purpureum 0.15 0.74 0.36 0.12 0.16 3.36 0.03 80 23 230 8.9 0.86 0.3 5
28
Psophocarpus scandens 0.67 0.39 1.45 0.27 0.21 2.44 0.02 43 42 206 11.8 0.01 0.4 2
Pueraria phaseoloides 0.27 0.13 1.05 0.21 0.25 1.43 0.03 95 32 145 8.8 0.05 0.2 5
Saccharum officinarum 0.61 0.29 0.46 0.07 0.12 0.70 0.05 23 24 218 3 0.02 0.2 9
Stylosanthes guianensis 0.52 0.49 2.19 0.38 0.41 1.14 0.03 64 73 308 12.8 0.17 <0.1 13
Trypsacum andersonii 0.32 0.25 0.40 0.15 0.22 1.54 0.03 51 20 437 8.8 0.07 0.9 20
Vigna unguiculata 0.49 0.33 3.70 0.27 0.48 2.11 0.03 27 71 375 11.5 0.02 0.1 1
1N/A, not available 492
493
494
29
Table 5. Indispensable and total amino acids (AA) of forage ingredients (g/16 g total N) (N=4) 495
Indispensable Amino Acids
Σ AAs1 Arg His Ile
Leu Lys Phe Thr Val
Acacia mangium 4.92 abcde2
2.22 ab
4.01 bcde
6.83 abc
4.53 ab
4.51 bcde
4.24 bcd
5.37 ab 70.6
abcd
Amaranthus hybridus
spp 4.73
abcde 1.71
cd 3.96
bcdef 6.21
cdefg 4.03
bc 3.97
fg 3.90
bcde 4.81
bcdef 67.4
cdef
Urochloa ruziziensis 5.69 ab
2.66 a
3.77 bcdefg
6.57 abcdef
2.20 h
4.24 defg
5.84 a
5.17 bc
73.0 abcd
Cajanus cajan 5.59 a
2.23 ab
4.76 a
7.76 a
4.76 a
5.26 b
4.64 abcd
6.01 a
79.5 a
Calopogonium
muconoides 4.53
abcde 2.00
bc 4.28
ab 6.89
abcd 3.83
bcdf 4.77
bcde 4.17
bcde 5.31
b 71.4
abcd
Centrosema pubescens 3.53 ef
1.55 cd
3.16 gh
5.01 g
3.31 cdeg
3.59 fg
3.13 e
4.24 ef
59.1 ef
Eichhornia crassipes 4.73 abcde
1.87 bcd
4.15 bcd
6.95 abc
4.09 b
4.61 bcde
4.33 bcde
5.20 b
74.0 abc
Ipomoea batatas 4.53 abcde
1.63 cd
3.90 bcdefg
6.66 abcdef
3.19 efg
4.30 defg
4.35 bcde
5.13 bcd
69.7 abcde
Leucaena leucocephala 4.97 abcde
1.93 bc
3.67 cdefg
6.24 bcdefg
3.97 bc
4.28 defg
4.22 bcde
4.76 bcdef
66.4 cdef
Manihot esculenta 5.39 abc
2.08 abc
4.32 abc
7.13 abc
4.33 ab
4.75 bcde
4.36 bcde
5.41 ab
78.1 ab
Moringa oleifera 5.68 a
1.89 bc
3.77 bcdefg
6.20 cdefg
3.78 bcde
6.60 a
4.18 bcde
4.82 bcdef
74.5 abc
Mucuna pruriens 3.75 def
1.69 cd
3.57 defgh
5.58 fg
3.22 eg
3.80 fg
3.63 cde
4.52 cdef
63.2 def
Megathyrsus maximus 2.95 f
1.35 d
3.05 h
5.15 g
3.08 g
3.56 g
3.45 e
4.36 ef
63.3 def
Pennisetum purpureum 4.41 abcde
1.83 bcd
3.80 bcdefg
6.79 abcde
3.65 bcdeg
4.83 bcde
4.65 abcd
4.99 bcde
73.1 abc
Psophocarpus
scandens 3.98
cdef 1.92
bc 3.45
efgh 5.77
defg 3.33
deg 4.36
def 4.33
bcde 4.27
f 63.8
def
Pueraria phaseoloides 4.15 bcdef
1.91 bc
3.77 bcdefg
6.13 cdefg
3.41 cdeg
4.46 cdef
4.44 bcde
4.81 bcdef
69.4 bcd
Saccharum officinarum 4.37 abcde
1.83 bcd
3.73 bcdefg
6.49 bcdef
3.11 g
4.78 bcde
4.69 abc
5.08 bc
73.0 abc
Stylosanthes guianensis 5.24 abcd
2.07 abc
3.98 bcdef
6.63 abcdef
3.60 bcdeg
5.14 bcd
4.78 abcd
4.77 bcdef
72.6 abcd
Trypsacum andersonii 5.34 abc
1.83 bcd
4.02 bcde
7.36 ab
3.04 g
5.21 bc
4.91 ab
5.22 b
74.2 abc
Vigna unguiculata 5.12 abcd
1.93 bc
3.80 bcdefg
6.35 bcdef
3.33 deg
4.93 bcd
4.90 ab
4.87 bcdef
77.0 ab
SEM3
0.136 0.084 0.067 0.121 0.082 0.117 0.110 0.074 1.010 P value 0.022 0.049 0.001 0.004 <0.001 <0.001 0.049 0.001 <0.001 1Sum of total AA including essential and non-essential amino acids (except sulfur AA and tryptophan) 496
2In each column; means followed by a different letter differ at a significance level of 0.05 497
3SEM, standard error of the means 498

30
499