Embed Size (px)
Citation preview
Obesity and Dental Caries in Obesity and Dental Caries in Children Aged 2Children Aged 2--6 Years in 6 Years in the United States: NHANES the United States: NHANES
19991999--20022002
Liang Hong D.D.S, MS, PhDLiang Hong D.D.S, MS, PhDDepartment of Dental Public HealthDepartment of Dental Public Health
School of DentistrySchool of DentistryUniv. of MissouriUniv. of Missouri--Kansas CityKansas City
Early Childhood CariesEarly Childhood CariesThe most common chronic childhood The most common chronic childhood disease (five times more prevalent than disease (five times more prevalent than asthma),asthma),28% of U.S 228% of U.S 2--5 year olds have caries (15% 5 year olds have caries (15% increase in last decade),increase in last decade),ThreeThree--quarters of those children are quarters of those children are untreated. untreated. CDC MMWR 2005 AugustCDC MMWR 2005 August
Childhood ObesityChildhood ObesityCurrently most prevalent nutritional disease Currently most prevalent nutritional disease of American children,of American children,25% are at risk for overweight and 11% 25% are at risk for overweight and 11% obese (obese (NicklasNicklas et al, 2003)et al, 2003)The proportion of overweight children aged The proportion of overweight children aged 66--11 has more than doubled and the rate for 11 has more than doubled and the rate for overweight adolescents has tripled (Surgeon overweight adolescents has tripled (Surgeon General Report 2004) General Report 2004)
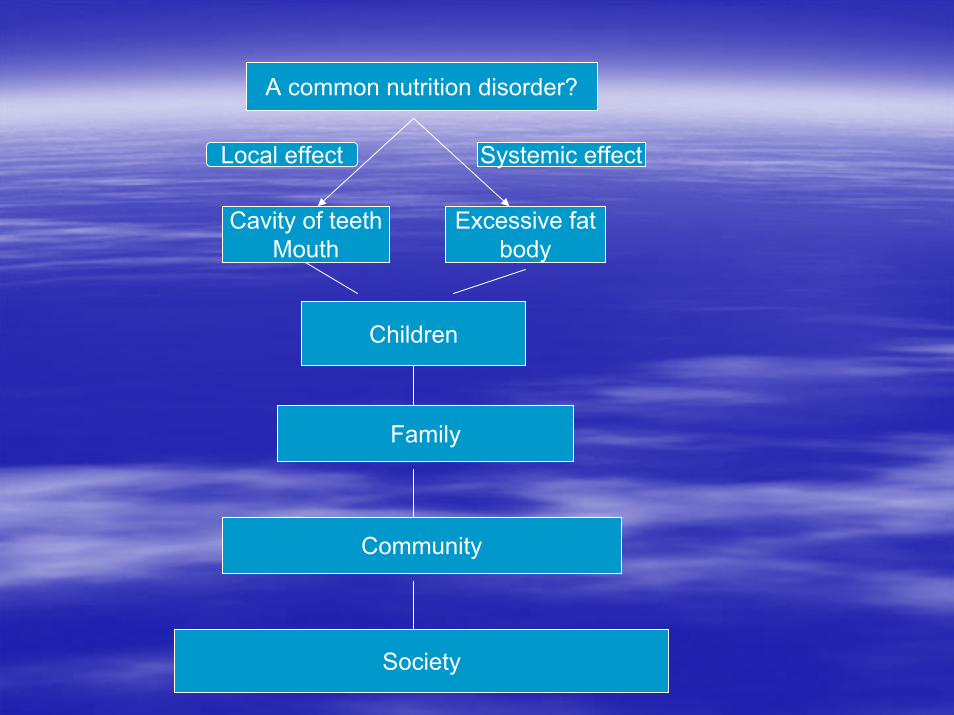
Cavity of teethMouth
Excessive fatbody
Children
Family
Community
Society
A common nutrition disorder?
Local effect Systemic effect
Childhood Obesity and Caries May Childhood Obesity and Caries May Share Some Common RiskShare Some Common Risk
Biological/genetic factorsBiological/genetic factorsSocial/cultural factorsSocial/cultural factorsDietary/feeding factorsDietary/feeding factorsEnvironmental/lifestyle factorsEnvironmental/lifestyle factors
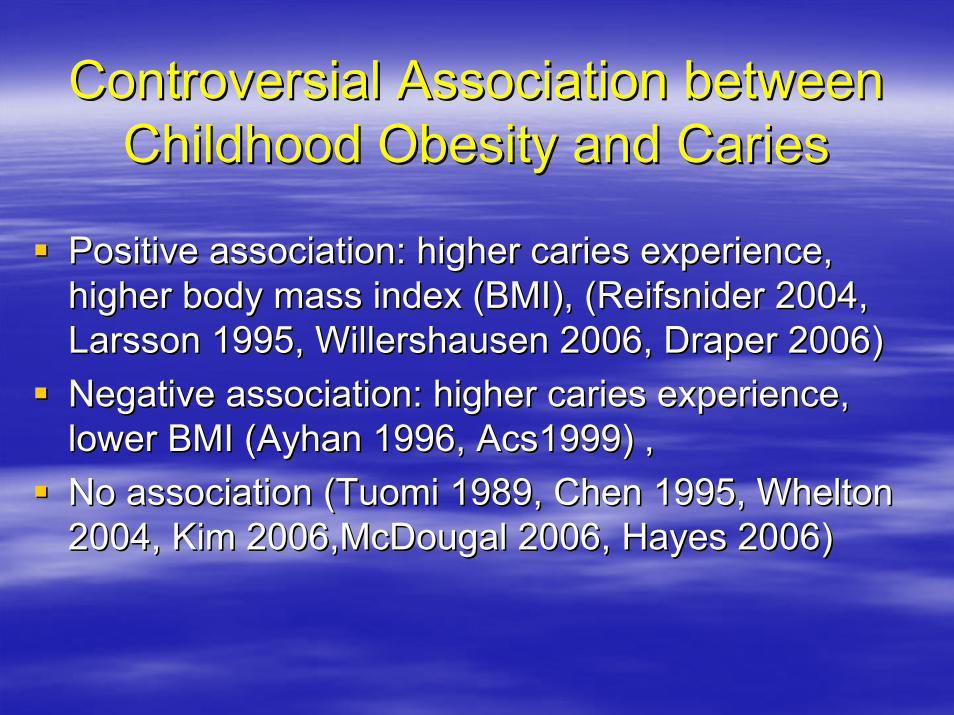
Controversial Association between Controversial Association between Childhood Obesity and CariesChildhood Obesity and Caries
Positive association: higher caries experience, Positive association: higher caries experience, higher body mass index (BMI), (higher body mass index (BMI), (ReifsniderReifsnider 2004, 2004, Larsson 1995, Larsson 1995, WillershausenWillershausen 2006, Draper 2006)2006, Draper 2006)Negative association: higher caries experience, Negative association: higher caries experience, lower BMI (lower BMI (AyhanAyhan 1996, Acs1999) ,1996, Acs1999) ,No association (No association (TuomiTuomi 1989, Chen 1995, 1989, Chen 1995, WheltonWhelton2004, Kim 2006,McDougal 2006, Hayes 2006)2004, Kim 2006,McDougal 2006, Hayes 2006)
Study AimStudy Aim
To assess the associations between To assess the associations between obesity and dental caries in children obesity and dental caries in children aged 2aged 2--6 years participating in NHANES 6 years participating in NHANES 19991999--20022002
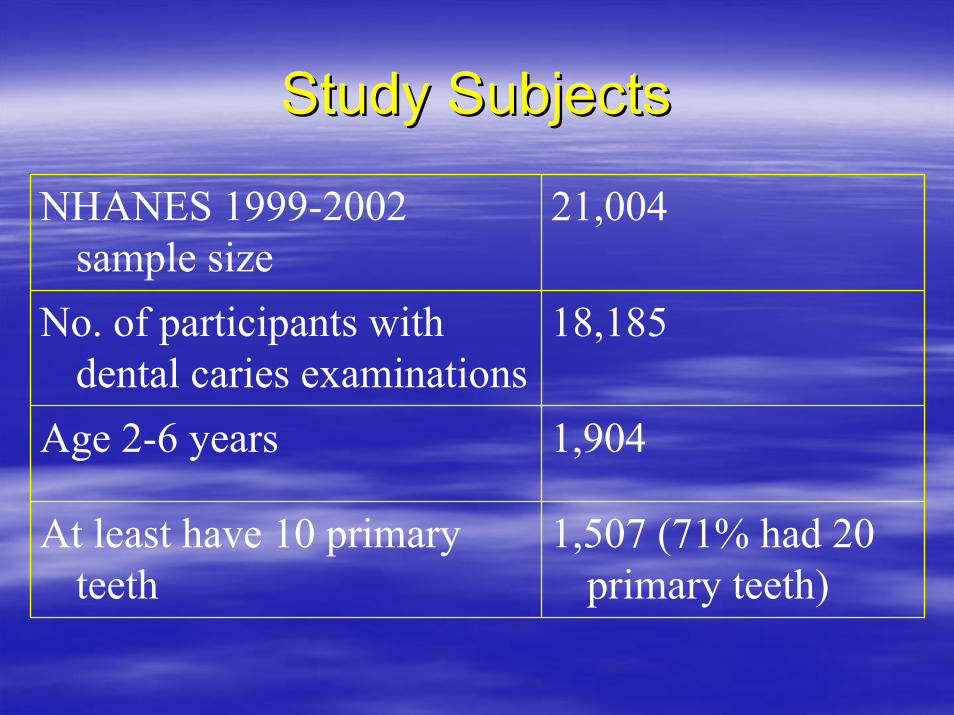
Study SubjectsStudy Subjects
NHANES 1999-2002 sample size
21,004
No. of participants with dental caries examinations
18,185
Age 2-6 years 1,904
At least have 10 primary teeth
1,507 (71% had 20 primary teeth)
Dental ExaminationsDental Examinations
Teeth were dried with air and examined with Teeth were dried with air and examined with a surface reflection mirror and a No.23 a surface reflection mirror and a No.23 explorer,explorer,Coronal caries was assessed using a visualCoronal caries was assessed using a visual--tactile method with standardized equipment tactile method with standardized equipment and supplies,and supplies,The number of decayed and filled teeth The number of decayed and filled teeth (DFT) was calculated and categorized into (DFT) was calculated and categorized into three groups: 0 DFT, 1three groups: 0 DFT, 1--10 DFT, and >10 10 DFT, and >10 DFT DFT
Body Mass Index (BMI) CalculationBody Mass Index (BMI) Calculation
Body mass index (BMI; kg/m2) was Body mass index (BMI; kg/m2) was calculated using weight and height calculated using weight and height measures,measures,Using age and gender specific criteria, Using age and gender specific criteria, subjects were categorized as underweight subjects were categorized as underweight (<5%), normal (5%(<5%), normal (5%--<85%), at risk for <85%), at risk for overweight (85overweight (85--<95 %), and overweight (<95 %), and overweight (≥≥95 95 %). %).
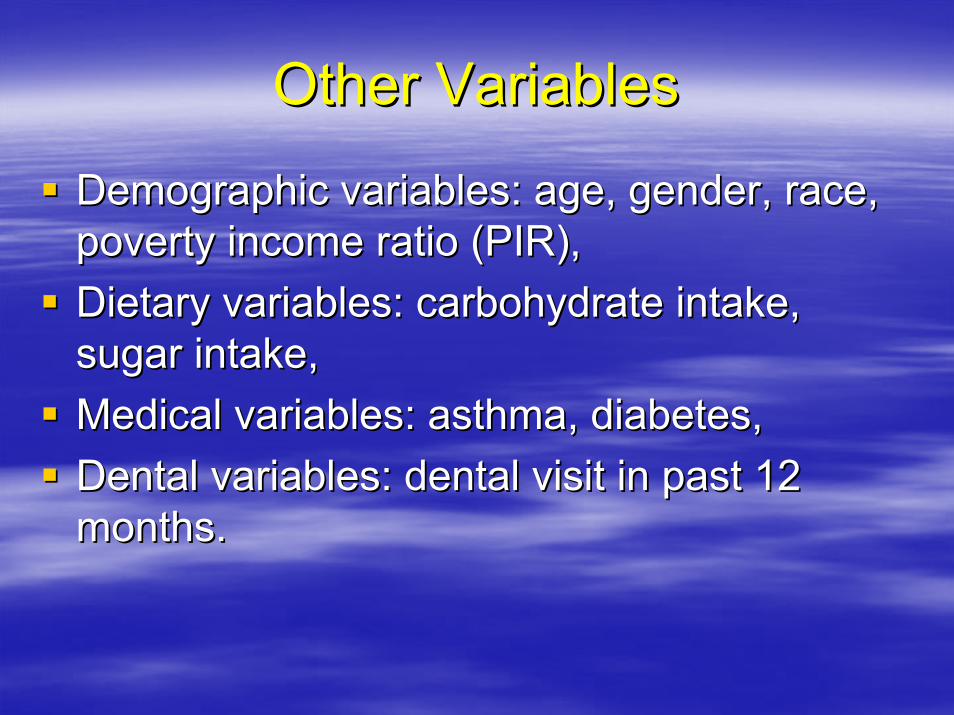
Other VariablesOther Variables
Demographic variables: age, gender, race, Demographic variables: age, gender, race, poverty income ratio (PIR),poverty income ratio (PIR),Dietary variables: carbohydrate intake, Dietary variables: carbohydrate intake, sugar intake,sugar intake,Medical variables: asthma, diabetes,Medical variables: asthma, diabetes,Dental variables: dental visit in past 12 Dental variables: dental visit in past 12 months.months.
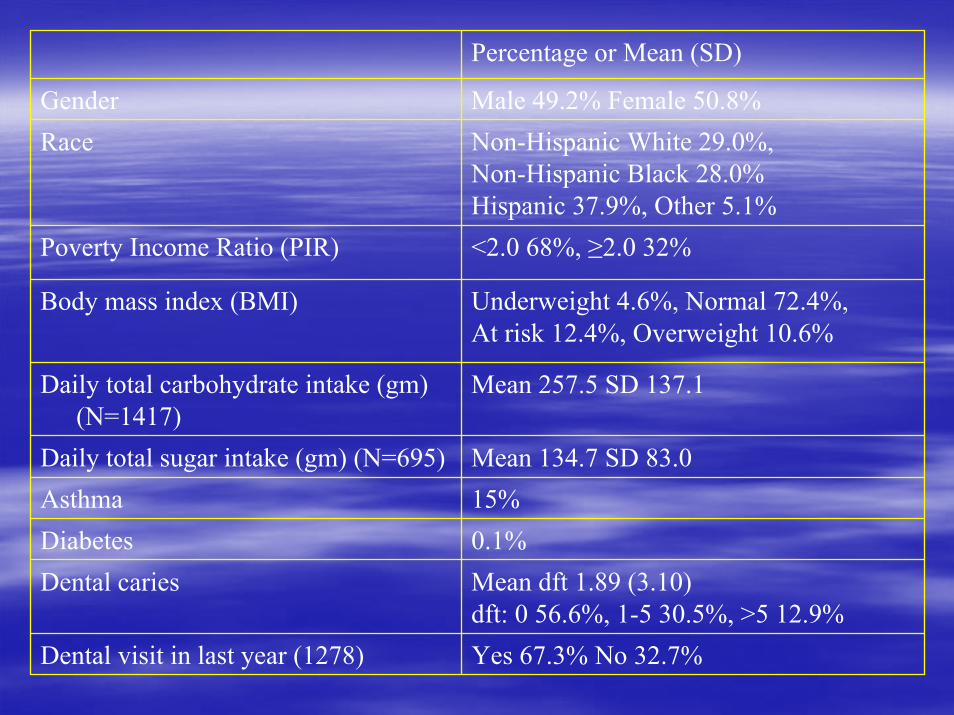
Percentage or Mean (SD)
Gender Male 49.2% Female 50.8%Race Non-Hispanic White 29.0%,
Non-Hispanic Black 28.0%Hispanic 37.9%, Other 5.1%
Poverty Income Ratio (PIR) <2.0 68%, ≥2.0 32%
Body mass index (BMI) Underweight 4.6%, Normal 72.4%,At risk 12.4%, Overweight 10.6%
Daily total carbohydrate intake (gm) (N=1417)
Mean 257.5 SD 137.1
Daily total sugar intake (gm) (N=695) Mean 134.7 SD 83.0Asthma 15%Diabetes 0.1%Dental caries Mean dft 1.89 (3.10)
dft: 0 56.6%, 1-5 30.5%, >5 12.9%Dental visit in last year (1278) Yes 67.3% No 32.7%
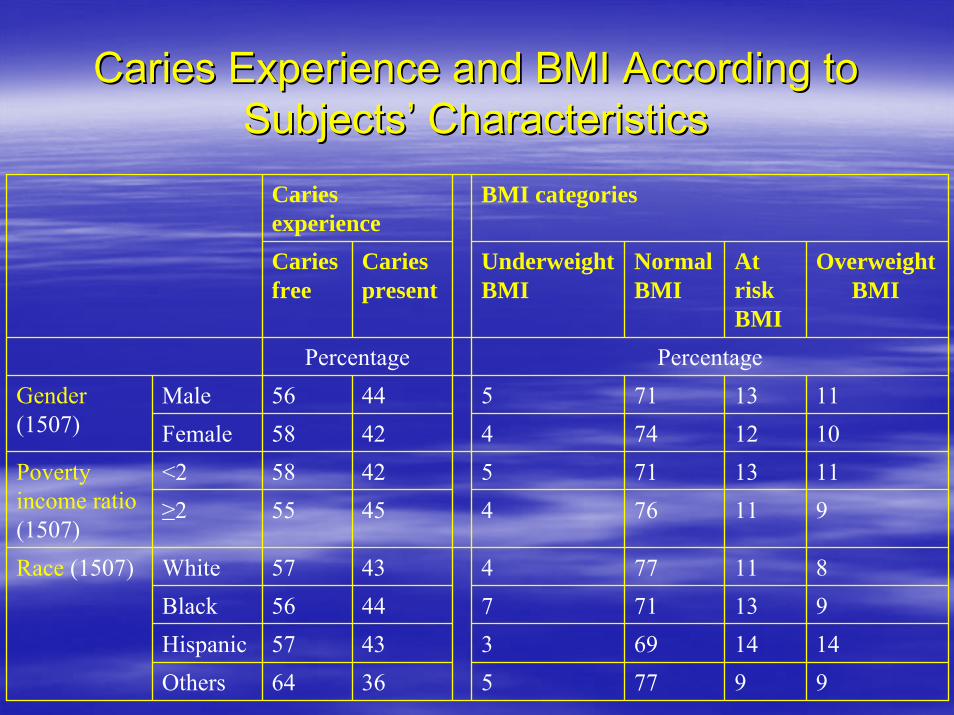
Caries Experience and BMI According to Caries Experience and BMI According to SubjectsSubjects’’ CharacteristicsCharacteristics
Cariesexperience
BMI categories
Cariesfree
Cariespresent
Underweight BMI
NormalBMI
AtriskBMI
Overweight BMI
Percentage PercentageMale 56 44 5 71 13 11Female 58 42 4 74 12 10<2 58 42 5 71 13 11≥2 55 45 4 76 11 9
White 57 43 4 77 11 8Black 56 44 7 71 13 9Hispanic 57 43 3 69 14 14Others 64 36 5 77 9 9
Race (1507)
Povertyincome ratio(1507)
Gender(1507)
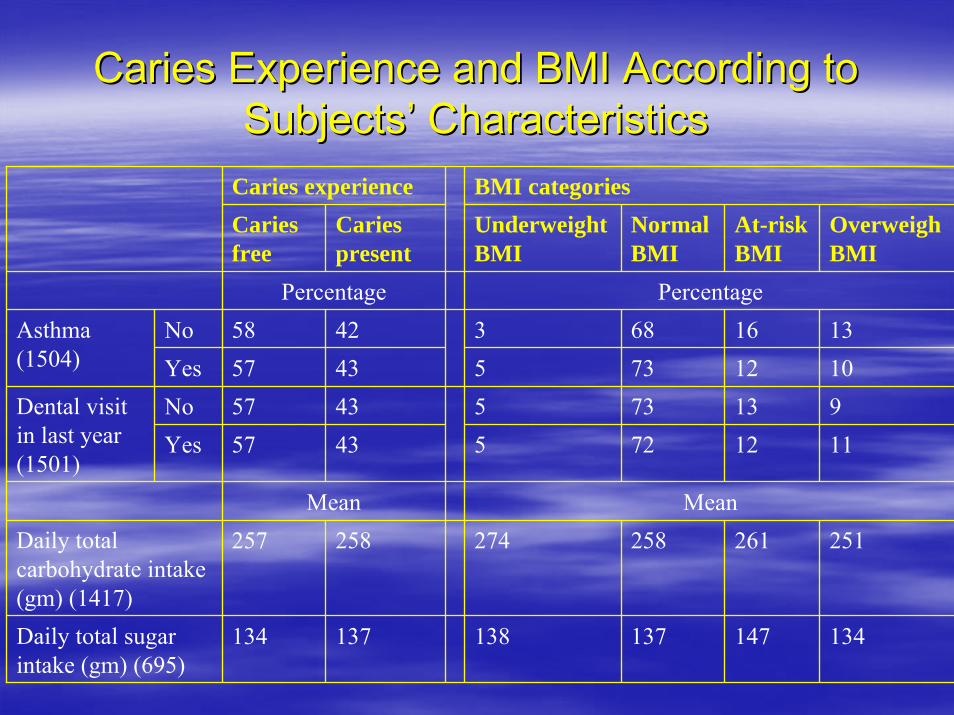
Caries Experience and BMI According to Caries Experience and BMI According to SubjectsSubjects’’ CharacteristicsCharacteristics
Caries experience BMI categoriesCaries free
Caries present
Underweight BMI
Normal BMI
At-risk BMI
Overweigh BMI
Percentage PercentageNo 58 42 3 68 16 13Yes 57 43 5 73 12 10No 57 43 5 73 13 9Yes 57 43 5 72 12 11
Mean MeanDaily total carbohydrate intake (gm) (1417)
257 258 274 258 261 251
Daily total sugar intake (gm) (695)
134 137 138 137 147 134
Dental visit in last year (1501)
Asthma (1504)
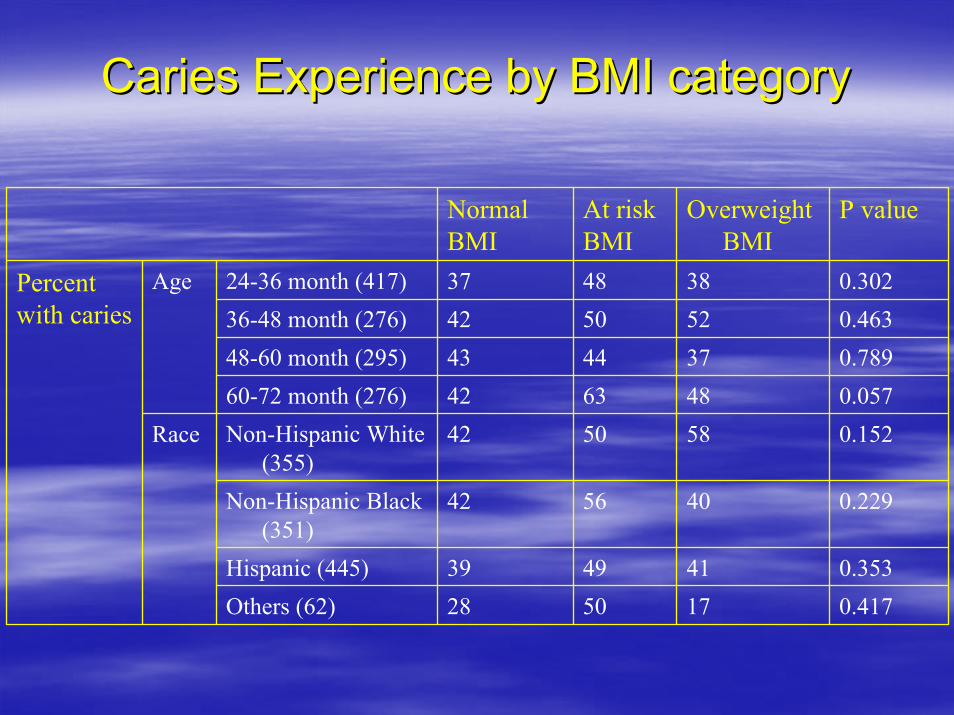
Caries Experience by BMI category Caries Experience by BMI category
NormalBMI
At riskBMI
Overweight BMI
P value
24-36 month (417) 37 48 38 0.30236-48 month (276) 42 50 52 0.46348-60 month (295) 43 44 37 0.78960-72 month (276) 42 63 48 0.057Non-Hispanic White
(355)42 50 58 0.152
Non-Hispanic Black (351)
42 56 40 0.229
Hispanic (445) 39 49 41 0.353Others (62) 28 50 17 0.417
Race
AgePercentwith caries
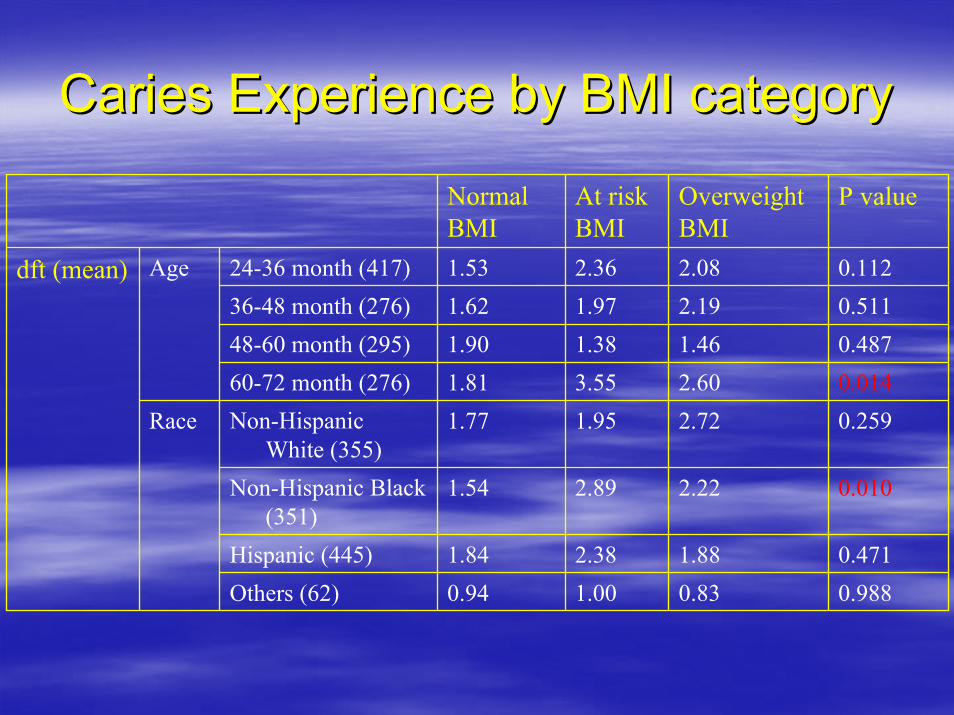
Caries Experience by BMI category Caries Experience by BMI category
NormalBMI
At riskBMI
OverweightBMI
P value
24-36 month (417) 1.53 2.36 2.08 0.11236-48 month (276) 1.62 1.97 2.19 0.51148-60 month (295) 1.90 1.38 1.46 0.48760-72 month (276) 1.81 3.55 2.60 0.014Non-Hispanic
White (355)1.77 1.95 2.72 0.259
Non-Hispanic Black (351)
1.54 2.89 2.22 0.010
Hispanic (445) 1.84 2.38 1.88 0.471Others (62) 0.94 1.00 0.83 0.988
Race
Agedft (mean)
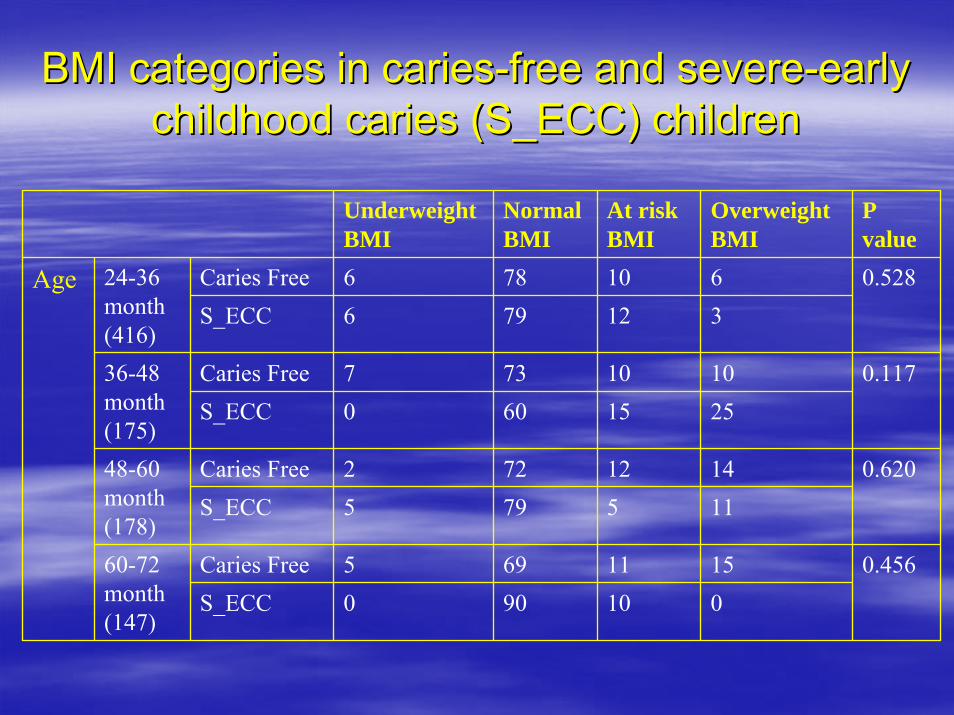
BMI categories in cariesBMI categories in caries--free and severefree and severe--early early childhood caries (S_ECC) childrenchildhood caries (S_ECC) children
UnderweightBMI
Normal BMI
At risk BMI
Overweight BMI
Pvalue
Caries Free 6 78 10 6S_ECC 6 79 12 3
Caries Free 7 73 10 10S_ECC 0 60 15 25
Caries Free 2 72 12 14S_ECC 5 79 5 11
Caries Free 5 69 11 15S_ECC 0 90 10 0
0.45660-72 month (147)
0.62048-60 month (178)
0.11736-48 month (175)
0.52824-36 month (416)
Age
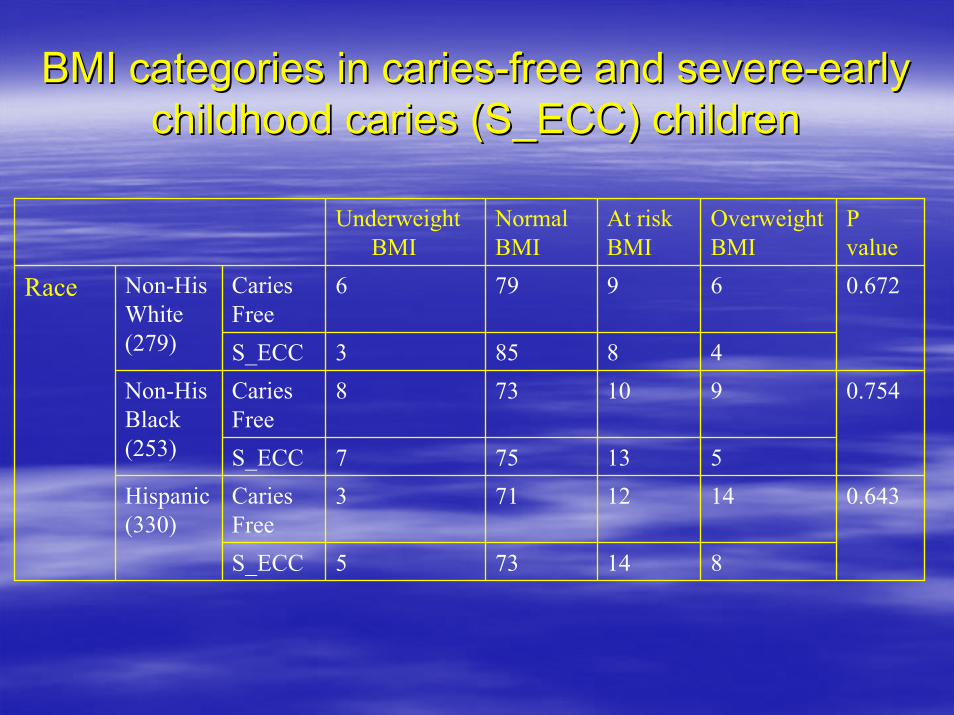
BMI categories in cariesBMI categories in caries--free and severefree and severe--early early childhood caries (S_ECC) childrenchildhood caries (S_ECC) children
Underweight BMI
NormalBMI
At risk BMI
Overweight BMI
P value
Caries Free
6 79 9 6
S_ECC 3 85 8 4Caries Free
8 73 10 9
S_ECC 7 75 13 5Caries Free
3 71 12 14
S_ECC 5 73 14 8
0.643Hispanic (330)
0.754Non-HisBlack(253)
0.672Non-HisWhite(279)
Race
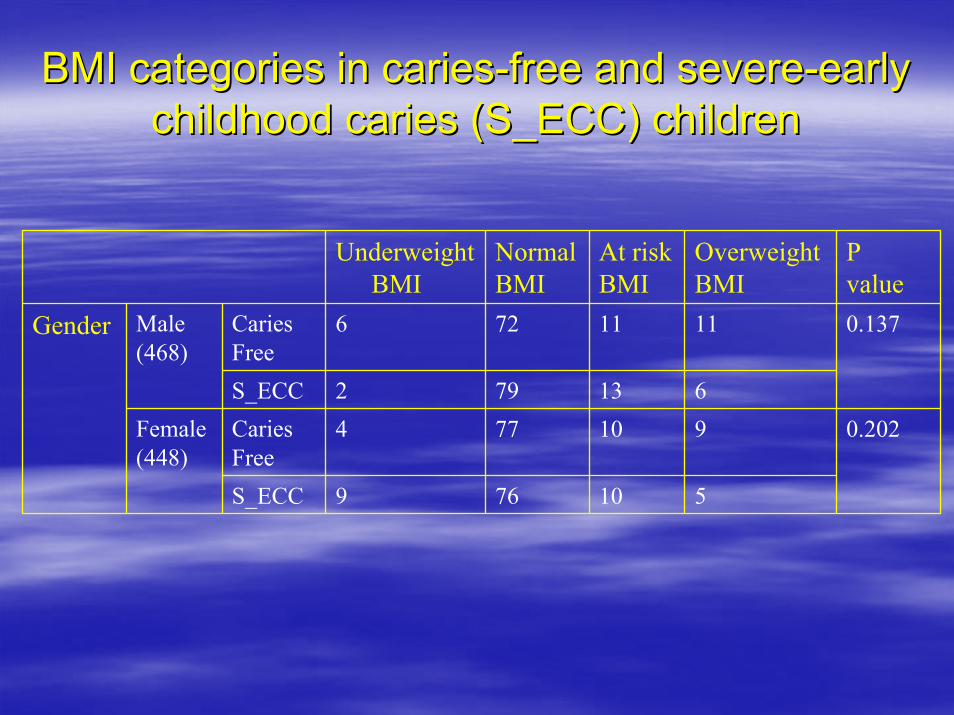
BMI categories in cariesBMI categories in caries--free and severefree and severe--early early childhood caries (S_ECC) childrenchildhood caries (S_ECC) children
Underweight BMI
Normal BMI
At risk BMI
Overweight BMI
P value
Caries Free
6 72 11 11
S_ECC 2 79 13 6Caries Free
4 77 10 9
S_ECC 9 76 10 5
0.202Female (448)
0.137Male (468)
Gender
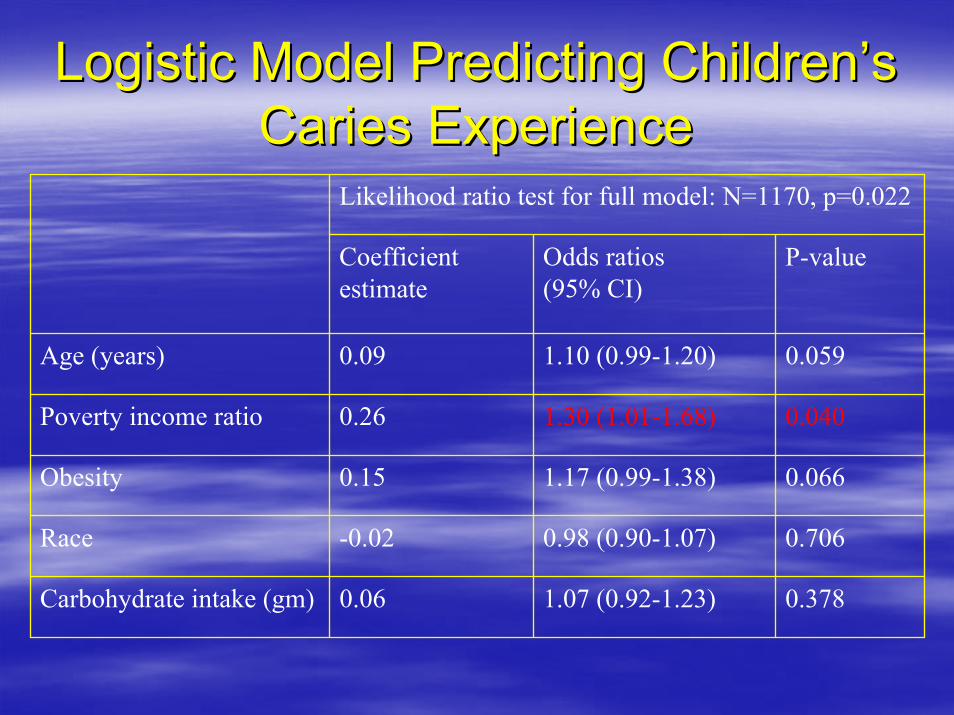
Logistic Model Predicting ChildrenLogistic Model Predicting Children’’s s Caries Experience Caries Experience
Likelihood ratio test for full model: N=1170, p=0.022
Coefficient estimate
Odds ratios (95% CI)
P-value
Age (years) 0.09 1.10 (0.99-1.20) 0.059
Poverty income ratio 0.26 1.30 (1.01-1.68) 0.040
Obesity 0.15 1.17 (0.99-1.38) 0.066
Race -0.02 0.98 (0.90-1.07) 0.706
Carbohydrate intake (gm) 0.06 1.07 (0.92-1.23) 0.378
DiscussionDiscussion
The relationship between childhood obesity The relationship between childhood obesity and dental caries is complex and varies and dental caries is complex and varies depending on many factors, such as age, depending on many factors, such as age, gender, race, and family income.gender, race, and family income.
DiscussionDiscussion
Generally those with atGenerally those with at--risk BMI had highest risk BMI had highest caries experience, consistent with a study caries experience, consistent with a study reported by Marshall et al 2005.reported by Marshall et al 2005.This relationship was statistically significant This relationship was statistically significant for those aged 60for those aged 60--72 months and African 72 months and African American.American.
DiscussionDiscussion
Regardless of age, gender, race, and family Regardless of age, gender, race, and family income, for both children with severe ECC income, for both children with severe ECC and children without caries, few were and children without caries, few were underweight (about 5%), most were normal underweight (about 5%), most were normal (70%), and many were at at(70%), and many were at at--riskrisk--ofof--overweight (15%) or overweight (10%).overweight (15%) or overweight (10%).
DiscussionDiscussion
In multiple logistic regression model, only In multiple logistic regression model, only family income is a statistically significant family income is a statistically significant predictor for dental caries, predictor for dental caries, However, a combination of family income However, a combination of family income and BMI provides a better prediction.and BMI provides a better prediction.
Future DirectionFuture Direction
Longitudinal studies are needed to further Longitudinal studies are needed to further assess the complex associations among assess the complex associations among nutritional intake, obesity, and dental caries nutritional intake, obesity, and dental caries development.development.


![Let's Move [Read-Only] - WV Early Childhood · Childhood Obesity Facts • 17% or 12.7 million children and adolescents aged 2-19 years are obese in the United States • Obesity](https://img.pdfslide.net/doc/110x75/601e3ade4f60ba26054b8417/lets-move-read-only-wv-early-childhood-obesity-facts-a-17-or-127-million.jpg)