Embed Size (px)
Citation preview
2015-16 School Accountability Report Card for Ocean View Elementary School Page 1 of 12
Ocean View Elementary School
School Accountability Report Card
Reported Using Data from the 2015-16 School Year
Published During 2016-17
By February 1 of each year, every school in California is required by state law to publish a School Accountability Report Card (SARC). The SARC contains information about the condition and performance of each California public school. Under the Local Control Funding Formula (LCFF) all local educational agencies (LEAs) are required to prepare a Local Control and Accountability Plan (LCAP), which describes how they intend to meet annual school-specific goals for all pupils, with specific activities to address state and local priorities. Additionally, data reported in an LCAP is to be consistent with data reported in the SARC. • For more information about SARC requirements, see the California Department of Education (CDE) SARC Web page at
http://www.cde.ca.gov/ta/ac/sa/. • For more information about the LCFF or LCAP, see the CDE LCFF Web page at http://www.cde.ca.gov/fg/aa/lc/. • For additional information about the school, parents/guardians and community members should contact the school principal or
the district office. DataQuest DataQuest is an online data tool located on the CDE DataQuest Web page at http://dq.cde.ca.gov/dataquest/ that contains additional information about this school and comparisons of the school to the district and the county. Specifically, DataQuest is a dynamic system that provides reports for accountability (e.g., test data, enrollment, high school graduates, dropouts, course enrollments, staffing, and data regarding English learners). Internet Access Internet access is available at public libraries and other locations that are publicly accessible (e.g., the California State Library). Access to the Internet at libraries and public locations is generally provided on a first-come, first-served basis. Other use restrictions may include the hours of operation, the length of time that a workstation may be used (depending on availability), the types of software programs available on a workstation, and the ability to print documents.
About This School Contact Information (School Year 2016-17) School Contact Information School Name------- Ocean View Elementary School Street------- 14359 E. Second Street City, State, Zip------- Whittier, CA 90605 Phone Number------- (562) 907-6400 Principal------- Tim Strand E-mail Address------- [email protected] Web Site------- oceanview.ewcsd.org CDS Code 19-64485-6013098
2015-16 School Accountability Report Card for Ocean View Elementary School Page 2 of 12
District Contact Information District Name------- East Whittier City School District Phone Number------- (562) 907-5900 Superintendent------- Mary Branca E-mail Address------- [email protected] Web Site------- www.ewcsd.org School Description and Mission Statement (School Year 2016-17)
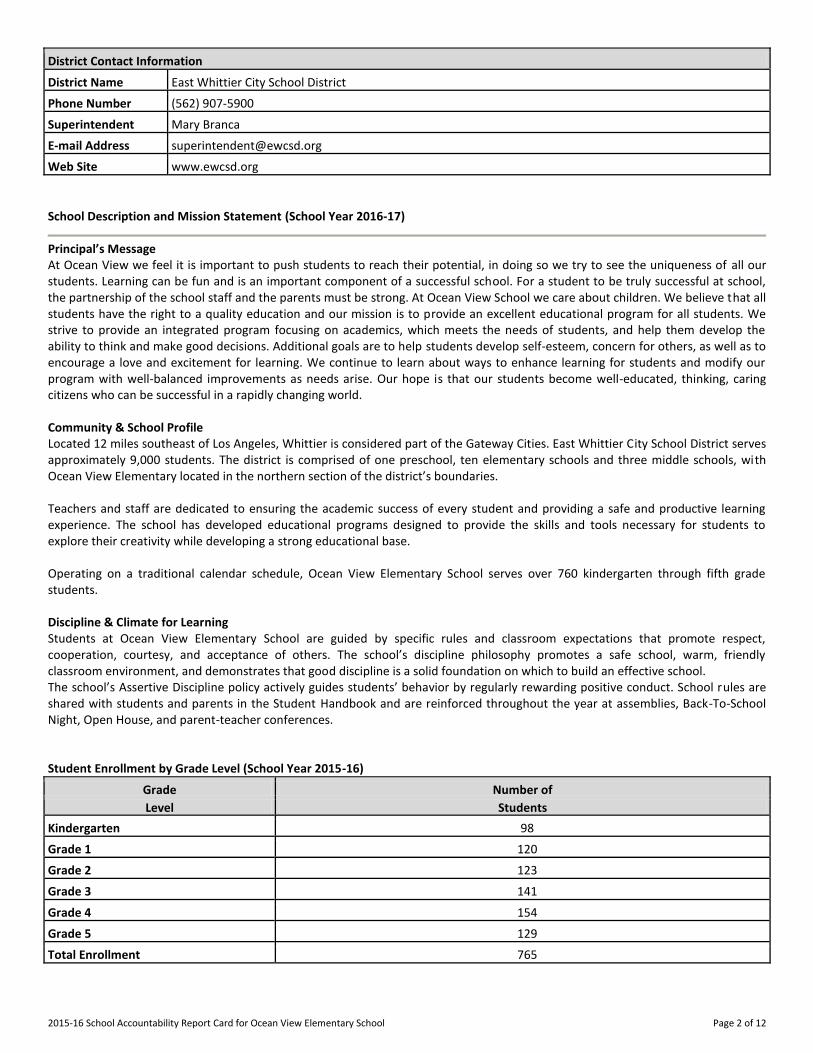
Principal’s Message At Ocean View we feel it is important to push students to reach their potential, in doing so we try to see the uniqueness of all our students. Learning can be fun and is an important component of a successful school. For a student to be truly successful at school, the partnership of the school staff and the parents must be strong. At Ocean View School we care about children. We believe that all students have the right to a quality education and our mission is to provide an excellent educational program for all students. We strive to provide an integrated program focusing on academics, which meets the needs of students, and help them develop the ability to think and make good decisions. Additional goals are to help students develop self-esteem, concern for others, as well as to encourage a love and excitement for learning. We continue to learn about ways to enhance learning for students and modify our program with well-balanced improvements as needs arise. Our hope is that our students become well-educated, thinking, caring citizens who can be successful in a rapidly changing world. Community & School Profile Located 12 miles southeast of Los Angeles, Whittier is considered part of the Gateway Cities. East Whittier City School District serves approximately 9,000 students. The district is comprised of one preschool, ten elementary schools and three middle schools, with Ocean View Elementary located in the northern section of the district’s boundaries. Teachers and staff are dedicated to ensuring the academic success of every student and providing a safe and productive learning experience. The school has developed educational programs designed to provide the skills and tools necessary for students to explore their creativity while developing a strong educational base. Operating on a traditional calendar schedule, Ocean View Elementary School serves over 760 kindergarten through fifth grade students. Discipline & Climate for Learning Students at Ocean View Elementary School are guided by specific rules and classroom expectations that promote respect, cooperation, courtesy, and acceptance of others. The school’s discipline philosophy promotes a safe school, warm, friendly classroom environment, and demonstrates that good discipline is a solid foundation on which to build an effective school. The school’s Assertive Discipline policy actively guides students’ behavior by regularly rewarding positive conduct. School rules are shared with students and parents in the Student Handbook and are reinforced throughout the year at assemblies, Back-To-School Night, Open House, and parent-teacher conferences. Student Enrollment by Grade Level (School Year 2015-16)
Grade Number of Level Students
Kindergarten 98 Grade 1 120 Grade 2 123 Grade 3 141 Grade 4 154 Grade 5 129 Total Enrollment 765
2015-16 School Accountability Report Card for Ocean View Elementary School Page 3 of 12
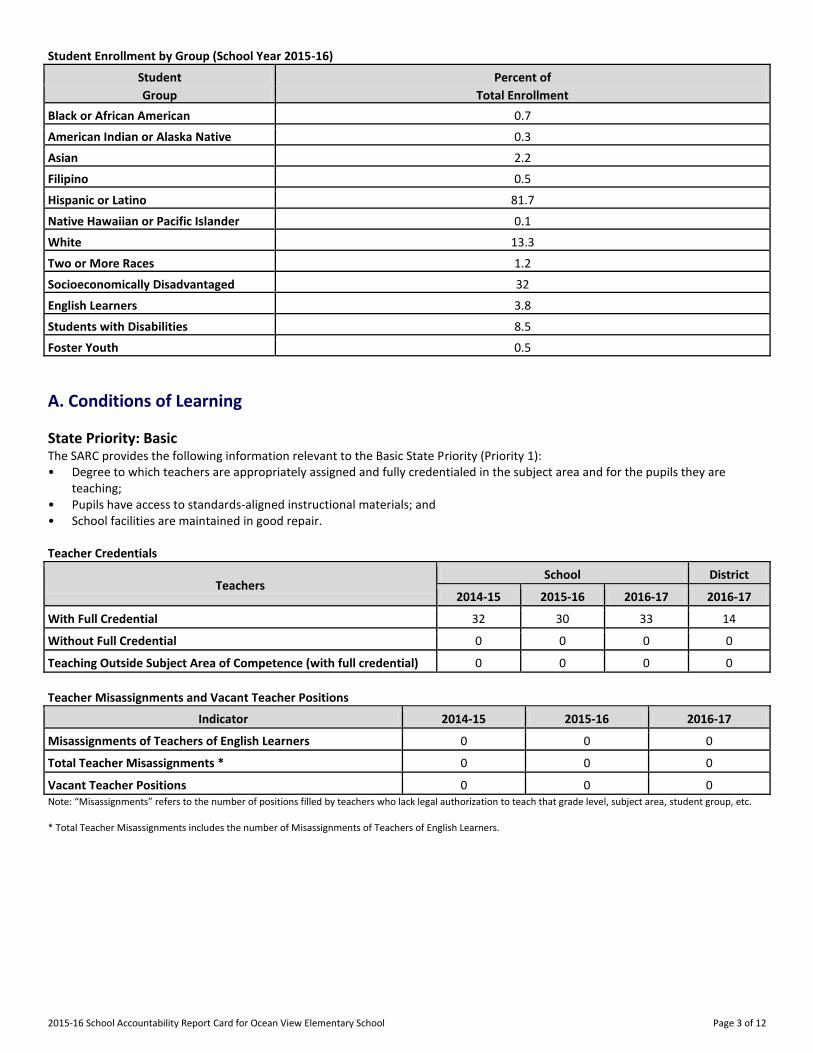
Student Enrollment by Group (School Year 2015-16) Student Percent of Group Total Enrollment
Black or African American 0.7 American Indian or Alaska Native 0.3 Asian 2.2 Filipino 0.5 Hispanic or Latino 81.7 Native Hawaiian or Pacific Islander 0.1 White 13.3 Two or More Races 1.2 Socioeconomically Disadvantaged 32 English Learners 3.8 Students with Disabilities 8.5 Foster Youth 0.5
A. Conditions of Learning State Priority: Basic The SARC provides the following information relevant to the Basic State Priority (Priority 1): • Degree to which teachers are appropriately assigned and fully credentialed in the subject area and for the pupils they are
teaching; • Pupils have access to standards-aligned instructional materials; and • School facilities are maintained in good repair. Teacher Credentials
Teachers School District
2014-15 2015-16 2016-17 2016-17
With Full Credential 32 30 33 14
Without Full Credential 0 0 0 0
Teaching Outside Subject Area of Competence (with full credential) 0 0 0 0 Teacher Misassignments and Vacant Teacher Positions
Indicator 2014-15 2015-16 2016-17
Misassignments of Teachers of English Learners 0 0 0
Total Teacher Misassignments * 0 0 0
Vacant Teacher Positions 0 0 0 Note: “Misassignments” refers to the number of positions filled by teachers who lack legal authorization to teach that grade level, subject area, student group, etc. * Total Teacher Misassignments includes the number of Misassignments of Teachers of English Learners.
2015-16 School Accountability Report Card for Ocean View Elementary School Page 4 of 12
Core Academic Classes Taught by Highly Qualified Teachers (School Year 2015-16)
Location of Classes Percent of Classes In Core Academic Subjects
Taught by Highly Qualified Teachers Not Taught by Highly Qualified Teachers
This School 100.0 0.0
All Schools in District 99.3 0.7
High-Poverty Schools in District 99.2 0.8
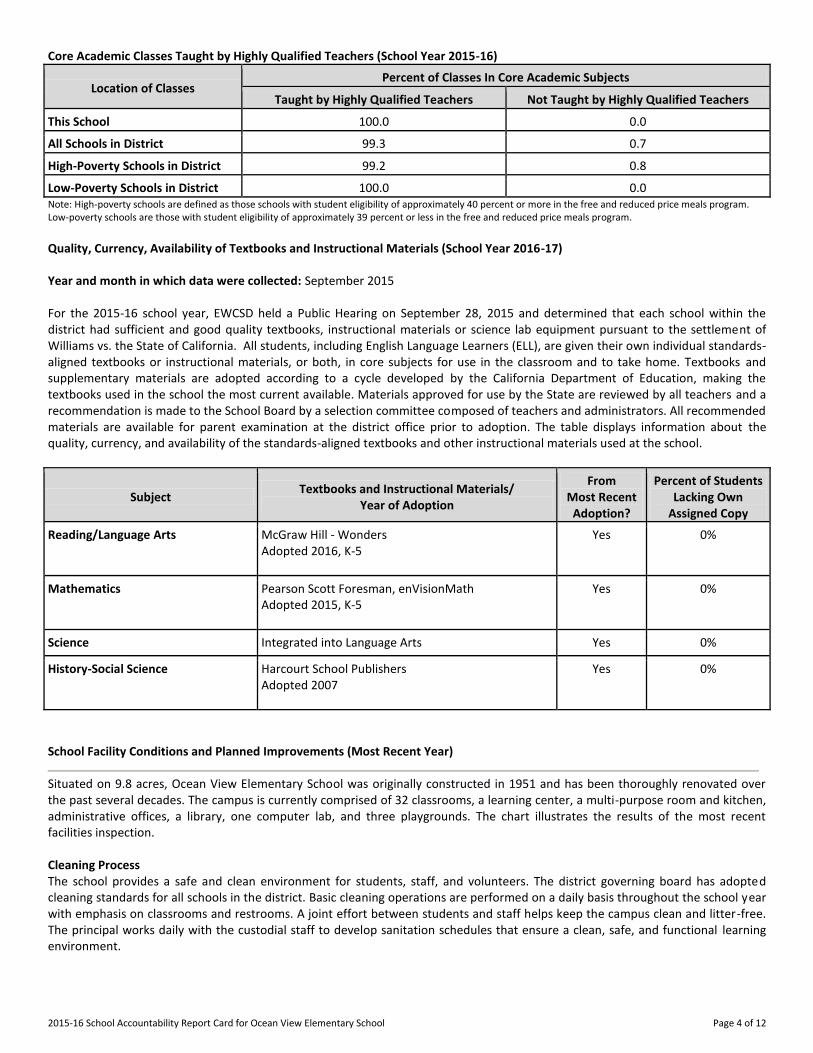
Low-Poverty Schools in District 100.0 0.0 Note: High-poverty schools are defined as those schools with student eligibility of approximately 40 percent or more in the free and reduced price meals program. Low-poverty schools are those with student eligibility of approximately 39 percent or less in the free and reduced price meals program. Quality, Currency, Availability of Textbooks and Instructional Materials (School Year 2016-17) Year and month in which data were collected: September 2015 For the 2015-16 school year, EWCSD held a Public Hearing on September 28, 2015 and determined that each school within the district had sufficient and good quality textbooks, instructional materials or science lab equipment pursuant to the settlement of Williams vs. the State of California. All students, including English Language Learners (ELL), are given their own individual standards-aligned textbooks or instructional materials, or both, in core subjects for use in the classroom and to take home. Textbooks and supplementary materials are adopted according to a cycle developed by the California Department of Education, making the textbooks used in the school the most current available. Materials approved for use by the State are reviewed by all teachers and a recommendation is made to the School Board by a selection committee composed of teachers and administrators. All recommended materials are available for parent examination at the district office prior to adoption. The table displays information about the quality, currency, and availability of the standards-aligned textbooks and other instructional materials used at the school.
Subject Textbooks and Instructional Materials/ Year of Adoption
From Most Recent
Adoption?
Percent of Students Lacking Own
Assigned Copy
Reading/Language Arts McGraw Hill - Wonders Adopted 2016, K-5
Yes 0%
Mathematics Pearson Scott Foresman, enVisionMath Adopted 2015, K-5
Yes 0%
Science Integrated into Language Arts Yes 0%
History-Social Science Harcourt School Publishers Adopted 2007
Yes 0%
School Facility Conditions and Planned Improvements (Most Recent Year)
Situated on 9.8 acres, Ocean View Elementary School was originally constructed in 1951 and has been thoroughly renovated over the past several decades. The campus is currently comprised of 32 classrooms, a learning center, a multi-purpose room and kitchen, administrative offices, a library, one computer lab, and three playgrounds. The chart illustrates the results of the most recent facilities inspection. Cleaning Process The school provides a safe and clean environment for students, staff, and volunteers. The district governing board has adopted cleaning standards for all schools in the district. Basic cleaning operations are performed on a daily basis throughout the school year with emphasis on classrooms and restrooms. A joint effort between students and staff helps keep the campus clean and litter-free. The principal works daily with the custodial staff to develop sanitation schedules that ensure a clean, safe, and functional learning environment.
2015-16 School Accountability Report Card for Ocean View Elementary School Page 5 of 12
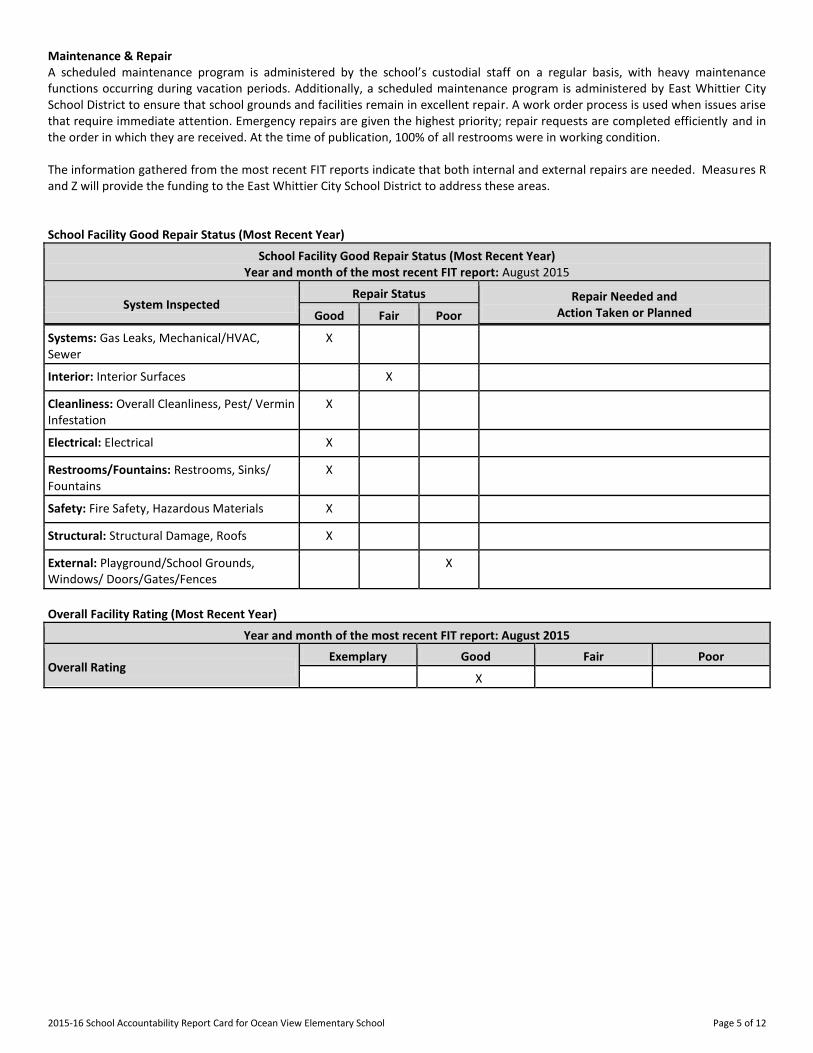
Maintenance & Repair A scheduled maintenance program is administered by the school’s custodial staff on a regular basis, with heavy maintenance functions occurring during vacation periods. Additionally, a scheduled maintenance program is administered by East Whittier City School District to ensure that school grounds and facilities remain in excellent repair. A work order process is used when issues arise that require immediate attention. Emergency repairs are given the highest priority; repair requests are completed efficiently and in the order in which they are received. At the time of publication, 100% of all restrooms were in working condition. The information gathered from the most recent FIT reports indicate that both internal and external repairs are needed. Measures R and Z will provide the funding to the East Whittier City School District to address these areas. School Facility Good Repair Status (Most Recent Year)
School Facility Good Repair Status (Most Recent Year) Year and month of the most recent FIT report: August 2015
System Inspected Repair Status Repair Needed and
Action Taken or Planned Good Fair Poor
Systems: Gas Leaks, Mechanical/HVAC, Sewer
X
Interior: Interior Surfaces X
Cleanliness: Overall Cleanliness, Pest/ Vermin Infestation
X
Electrical: Electrical X
Restrooms/Fountains: Restrooms, Sinks/ Fountains
X
Safety: Fire Safety, Hazardous Materials X
Structural: Structural Damage, Roofs X
External: Playground/School Grounds, Windows/ Doors/Gates/Fences
X
Overall Facility Rating (Most Recent Year)
Year and month of the most recent FIT report: August 2015
Overall Rating Exemplary Good Fair Poor
X
2015-16 School Accountability Report Card for Ocean View Elementary School Page 6 of 12
B. Pupil Outcomes State Priority: Pupil Achievement The SARC provides the following information relevant to the State priority: Pupil Achievement (Priority 4): • Statewide assessments (i.e., California Assessment of Student Performance and Progress [CAASPP] System, which includes the
Smarter Balanced Summative Assessments for students in the general education population and the California Alternate Assessments [CAAs] for English language arts/literacy [ELA] and mathematics given in grades three through eight and grade eleven. The CAAs have replaced the California Alternate Performance Assessment [CAPA] for ELA and mathematics, which were eliminated in 2015. Only eligible students may participate in the administration of the CAAs. CAA items are aligned with alternate achievement standards, which are linked with the Common Core State Standards [CCSS] for students with significant cognitive disabilities); and
• The percentage of students who have successfully completed courses that satisfy the requirements for entrance to the University of California and the California State University, or career technical education sequences or programs of study
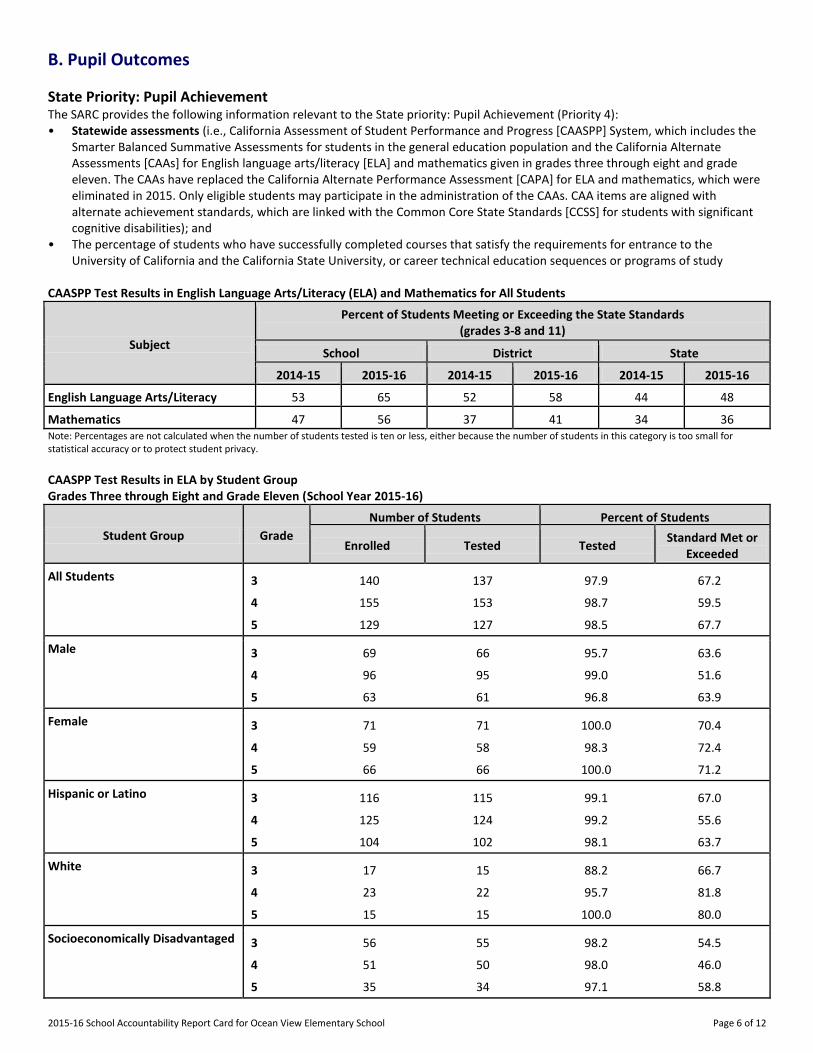
CAASPP Test Results in English Language Arts/Literacy (ELA) and Mathematics for All Students
Subject
Percent of Students Meeting or Exceeding the State Standards (grades 3-8 and 11)
School District State
2014-15 2015-16 2014-15 2015-16 2014-15 2015-16
English Language Arts/Literacy 53 65 52 58 44 48
Mathematics 47 56 37 41 34 36 Note: Percentages are not calculated when the number of students tested is ten or less, either because the number of students in this category is too small for statistical accuracy or to protect student privacy. CAASPP Test Results in ELA by Student Group Grades Three through Eight and Grade Eleven (School Year 2015-16)
Student Group Grade Number of Students Percent of Students
Enrolled Tested Tested Standard Met or Exceeded
All Students 3 140 137 97.9 67.2
4 155 153 98.7 59.5
5 129 127 98.5 67.7
Male 3 69 66 95.7 63.6
4 96 95 99.0 51.6
5 63 61 96.8 63.9
Female 3 71 71 100.0 70.4
4 59 58 98.3 72.4
5 66 66 100.0 71.2
Hispanic or Latino 3 116 115 99.1 67.0
4 125 124 99.2 55.6
5 104 102 98.1 63.7
White 3 17 15 88.2 66.7
4 23 22 95.7 81.8
5 15 15 100.0 80.0
Socioeconomically Disadvantaged 3 56 55 98.2 54.5
4 51 50 98.0 46.0
5 35 34 97.1 58.8
2015-16 School Accountability Report Card for Ocean View Elementary School Page 7 of 12
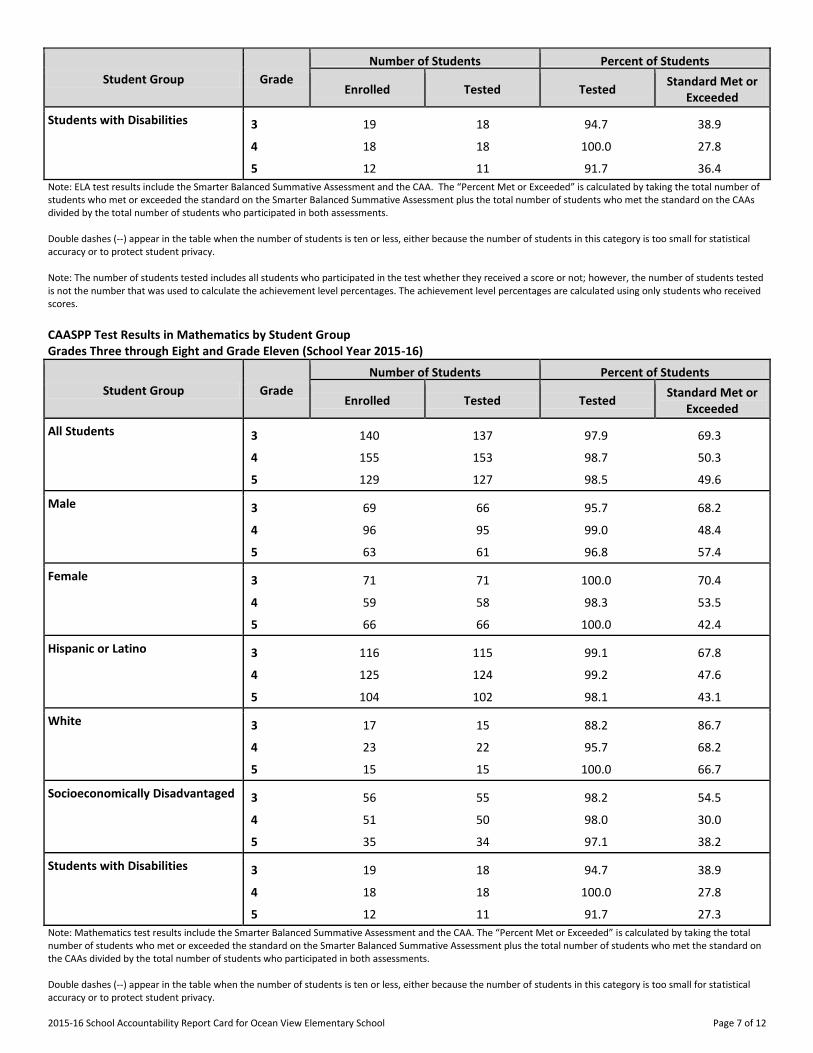
Student Group Grade Number of Students Percent of Students
Enrolled Tested Tested Standard Met or Exceeded
Students with Disabilities 3 19 18 94.7 38.9
4 18 18 100.0 27.8
5 12 11 91.7 36.4
Note: ELA test results include the Smarter Balanced Summative Assessment and the CAA. The “Percent Met or Exceeded” is calculated by taking the total number of students who met or exceeded the standard on the Smarter Balanced Summative Assessment plus the total number of students who met the standard on the CAAs divided by the total number of students who participated in both assessments. Double dashes (--) appear in the table when the number of students is ten or less, either because the number of students in this category is too small for statistical accuracy or to protect student privacy. Note: The number of students tested includes all students who participated in the test whether they received a score or not; however, the number of students tested is not the number that was used to calculate the achievement level percentages. The achievement level percentages are calculated using only students who received scores. CAASPP Test Results in Mathematics by Student Group Grades Three through Eight and Grade Eleven (School Year 2015-16)
Student Group Grade Number of Students Percent of Students
Enrolled Tested Tested Standard Met or Exceeded
All Students 3 140 137 97.9 69.3
4 155 153 98.7 50.3
5 129 127 98.5 49.6
Male 3 69 66 95.7 68.2
4 96 95 99.0 48.4
5 63 61 96.8 57.4
Female 3 71 71 100.0 70.4
4 59 58 98.3 53.5
5 66 66 100.0 42.4
Hispanic or Latino 3 116 115 99.1 67.8
4 125 124 99.2 47.6
5 104 102 98.1 43.1
White 3 17 15 88.2 86.7
4 23 22 95.7 68.2
5 15 15 100.0 66.7
Socioeconomically Disadvantaged 3 56 55 98.2 54.5
4 51 50 98.0 30.0
5 35 34 97.1 38.2
Students with Disabilities 3 19 18 94.7 38.9
4 18 18 100.0 27.8
5 12 11 91.7 27.3
Note: Mathematics test results include the Smarter Balanced Summative Assessment and the CAA. The “Percent Met or Exceeded” is calculated by taking the total number of students who met or exceeded the standard on the Smarter Balanced Summative Assessment plus the total number of students who met the standard on the CAAs divided by the total number of students who participated in both assessments. Double dashes (--) appear in the table when the number of students is ten or less, either because the number of students in this category is too small for statistical accuracy or to protect student privacy.
2015-16 School Accountability Report Card for Ocean View Elementary School Page 8 of 12
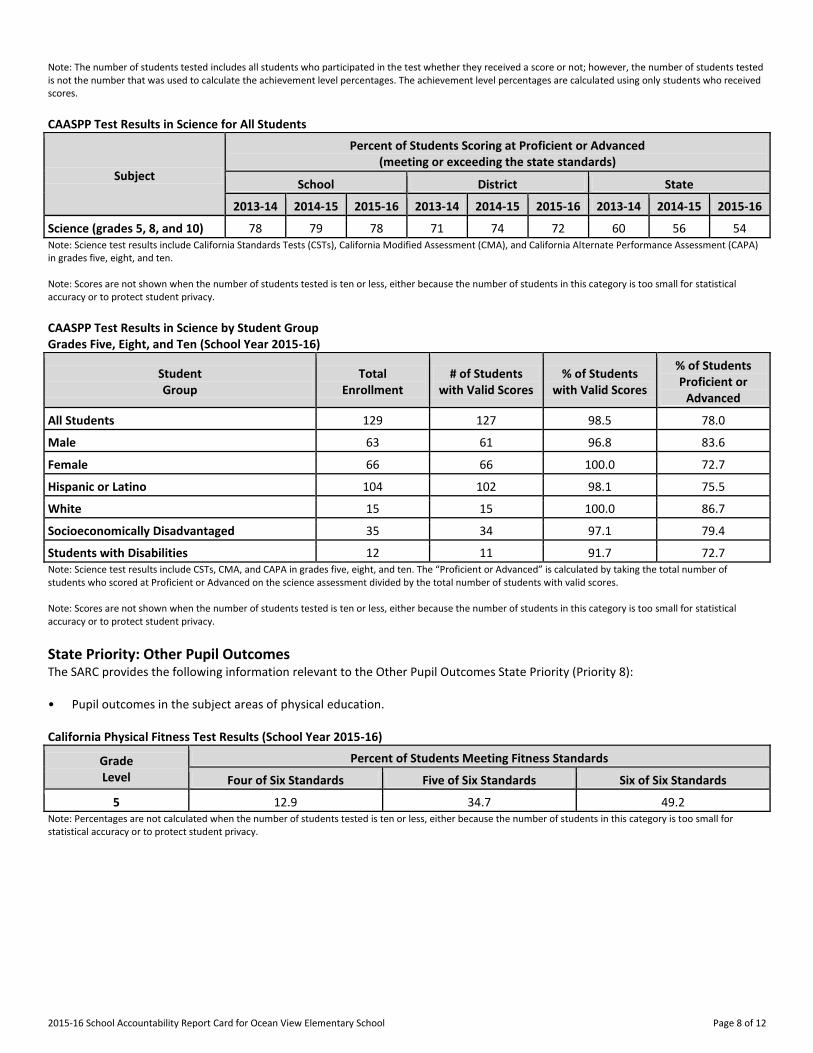
Note: The number of students tested includes all students who participated in the test whether they received a score or not; however, the number of students tested is not the number that was used to calculate the achievement level percentages. The achievement level percentages are calculated using only students who received scores. CAASPP Test Results in Science for All Students
Subject
Percent of Students Scoring at Proficient or Advanced (meeting or exceeding the state standards)
School District State
2013-14 2014-15 2015-16 2013-14 2014-15 2015-16 2013-14 2014-15 2015-16
Science (grades 5, 8, and 10) 78 79 78 71 74 72 60 56 54 Note: Science test results include California Standards Tests (CSTs), California Modified Assessment (CMA), and California Alternate Performance Assessment (CAPA) in grades five, eight, and ten. Note: Scores are not shown when the number of students tested is ten or less, either because the number of students in this category is too small for statistical accuracy or to protect student privacy. CAASPP Test Results in Science by Student Group Grades Five, Eight, and Ten (School Year 2015-16)
Student Group
Total Enrollment
# of Students with Valid Scores
% of Students with Valid Scores
% of Students Proficient or
Advanced
All Students 129 127 98.5 78.0
Male 63 61 96.8 83.6
Female 66 66 100.0 72.7
Hispanic or Latino 104 102 98.1 75.5
White 15 15 100.0 86.7
Socioeconomically Disadvantaged 35 34 97.1 79.4
Students with Disabilities 12 11 91.7 72.7 Note: Science test results include CSTs, CMA, and CAPA in grades five, eight, and ten. The “Proficient or Advanced” is calculated by taking the total number of students who scored at Proficient or Advanced on the science assessment divided by the total number of students with valid scores. Note: Scores are not shown when the number of students tested is ten or less, either because the number of students in this category is too small for statistical accuracy or to protect student privacy. State Priority: Other Pupil Outcomes The SARC provides the following information relevant to the Other Pupil Outcomes State Priority (Priority 8): • Pupil outcomes in the subject areas of physical education. California Physical Fitness Test Results (School Year 2015-16)
Grade Level
Percent of Students Meeting Fitness Standards
Four of Six Standards Five of Six Standards Six of Six Standards
---5--- 12.9 34.7 49.2 Note: Percentages are not calculated when the number of students tested is ten or less, either because the number of students in this category is too small for statistical accuracy or to protect student privacy.
2015-16 School Accountability Report Card for Ocean View Elementary School Page 9 of 12
C. Engagement State Priority: Parental Involvement The SARC provides the following information relevant to the Parental Involvement State Priority (Priority 3): • Efforts the school district makes to seek parent input in making decisions for the school district and each schoolsite. Opportunities for Parental Involvement (School Year 2016-17)
Parents and the community are very supportive of the educational programs at Ocean View Elementary School. Ocean View Elementary School offers a variety of events, programs, and activities throughout the school year for parents to become actively involved in their child’s school and education. Parents are encouraged to participate in the following activities and events held at Ocean View Elementary School:
• Back-to-School Night • Open House • Chorus Program • Dive into Reading Picnic • Family Fun Night • Fitness Fun Day • Holiday Program • PTA • Jog-a-Thon • Red Ribbon Week
Our district takes advantage of all available resources in the community to assist students in their emotional and academic development. Some of the community resources available include, but are not limited to, the following:
• Intercommunity Child Guidance Center • Boys & Girls Club • California State University, Fullerton • YMCA • Whittier Public Library • SKILLS Foundation • Help-line Youth Counseling • Options Family Center • Whittier Assistance League • Presbyterian Hospital • Whittier Community Center • Lion’s Club • Whittier Police Department • University of California • Los Angeles Probation Department • Kiwanis Club • Los Angeles Center for Alcohol & Drug Abuse • Los Angeles County District Attorney’s Office • Whittier Area Cooperative Special Education Program • East Los Angeles Regional Center
2015-16 School Accountability Report Card for Ocean View Elementary School Page 10 of 12
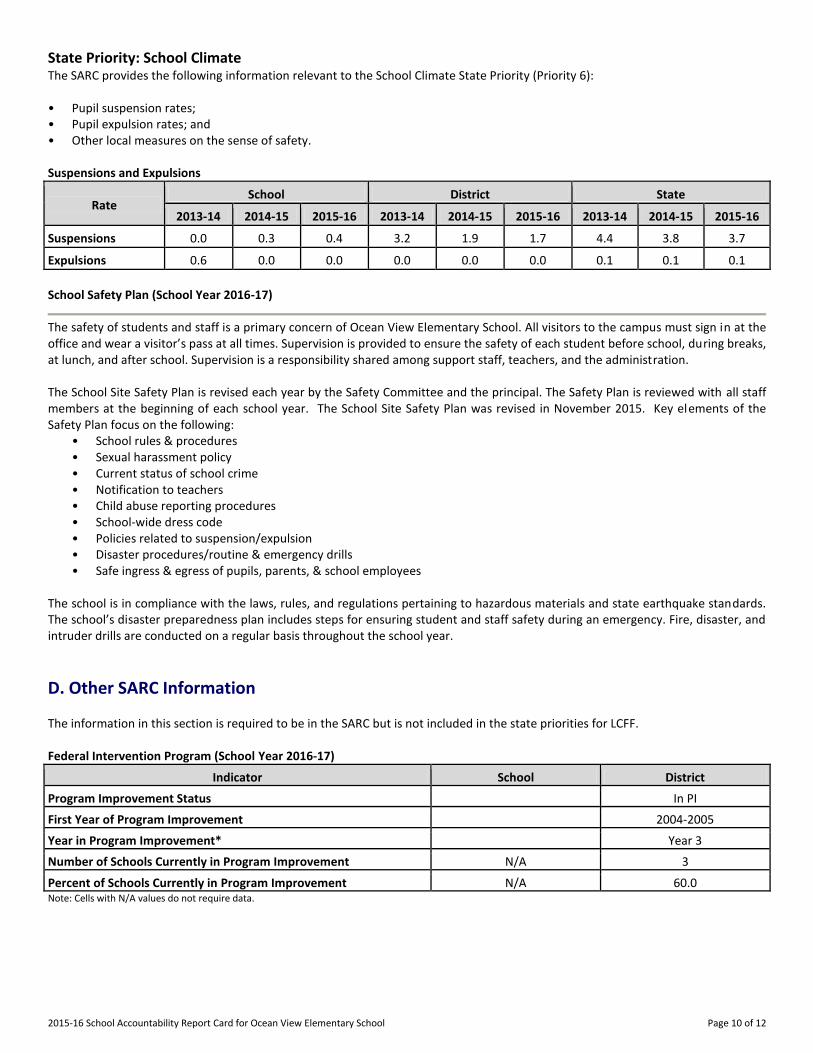
State Priority: School Climate The SARC provides the following information relevant to the School Climate State Priority (Priority 6): • Pupil suspension rates; • Pupil expulsion rates; and • Other local measures on the sense of safety. Suspensions and Expulsions
Rate School District State
2013-14 2014-15 2015-16 2013-14 2014-15 2015-16 2013-14 2014-15 2015-16
Suspensions------- 0.0 0.3 0.4 3.2 1.9 1.7 4.4 3.8 3.7
Expulsions------- 0.6 0.0 0.0 0.0 0.0 0.0 0.1 0.1 0.1 School Safety Plan (School Year 2016-17)
The safety of students and staff is a primary concern of Ocean View Elementary School. All visitors to the campus must sign in at the office and wear a visitor’s pass at all times. Supervision is provided to ensure the safety of each student before school, during breaks, at lunch, and after school. Supervision is a responsibility shared among support staff, teachers, and the administration. The School Site Safety Plan is revised each year by the Safety Committee and the principal. The Safety Plan is reviewed with all staff members at the beginning of each school year. The School Site Safety Plan was revised in November 2015. Key elements of the Safety Plan focus on the following:
• School rules & procedures • Sexual harassment policy • Current status of school crime • Notification to teachers • Child abuse reporting procedures • School-wide dress code • Policies related to suspension/expulsion • Disaster procedures/routine & emergency drills • Safe ingress & egress of pupils, parents, & school employees
The school is in compliance with the laws, rules, and regulations pertaining to hazardous materials and state earthquake standards. The school’s disaster preparedness plan includes steps for ensuring student and staff safety during an emergency. Fire, disaster, and intruder drills are conducted on a regular basis throughout the school year. D. Other SARC Information The information in this section is required to be in the SARC but is not included in the state priorities for LCFF. Federal Intervention Program (School Year 2016-17)
Indicator School District Program Improvement Status In PI First Year of Program Improvement 2004-2005 Year in Program Improvement* Year 3 Number of Schools Currently in Program Improvement N/A 3 Percent of Schools Currently in Program Improvement N/A 60.0 Note: Cells with N/A values do not require data.
2015-16 School Accountability Report Card for Ocean View Elementary School Page 11 of 12
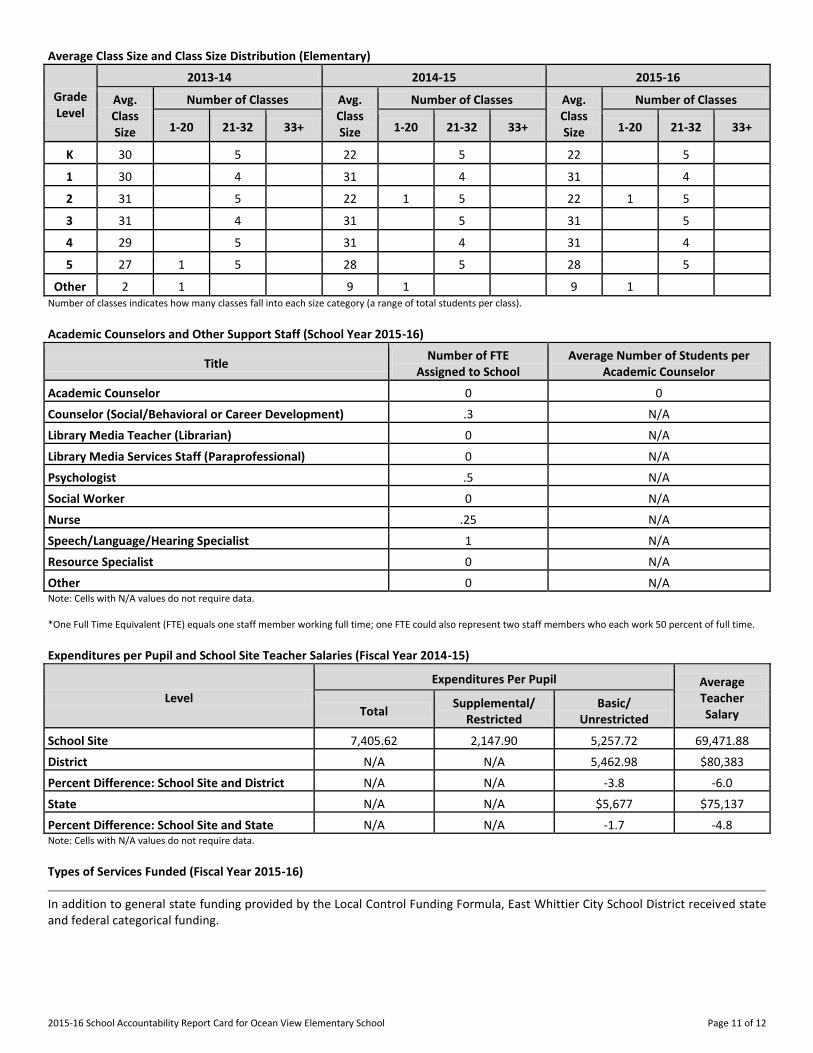
Average Class Size and Class Size Distribution (Elementary)
Grade Level
2013-14 2014-15 2015-16
Avg. Class Size
Number of Classes Avg. Class Size
Number of Classes Avg. Class Size
Number of Classes
1-20 21-32 33+ 1-20 21-32 33+ 1-20 21-32 33+
K
30 5 22 5 22 5
1
30 4 31 4 31 4
2
31 5 22 1 5 22 1 5
3
31 4 31 5 31 5
4
29 5 31 4 31 4
5
27 1 5 28 5 28 5
Other
2 1 9 1 9 1 Number of classes indicates how many classes fall into each size category (a range of total students per class). Academic Counselors and Other Support Staff (School Year 2015-16)
Title Number of FTE Assigned to School
Average Number of Students per Academic Counselor
Academic Counselor------- 0 0 Counselor (Social/Behavioral or Career Development) .3 N/A Library Media Teacher (Librarian) 0 N/A Library Media Services Staff (Paraprofessional) 0 N/A Psychologist------- .5 N/A Social Worker------- 0 N/A Nurse------- .25 N/A Speech/Language/Hearing Specialist 1 N/A Resource Specialist------- 0 N/A Other------- 0 N/A Note: Cells with N/A values do not require data. *One Full Time Equivalent (FTE) equals one staff member working full time; one FTE could also represent two staff members who each work 50 percent of full time. Expenditures per Pupil and School Site Teacher Salaries (Fiscal Year 2014-15)
Level Expenditures Per Pupil Average
Teacher Salary Total Supplemental/
Restricted Basic/
Unrestricted
School Site------- 7,405.62 2,147.90 5,257.72 69,471.88 District------- N/A N/A 5,462.98 $80,383 Percent Difference: School Site and District N/A N/A -3.8 -6.0 State------- N/A N/A $5,677 $75,137 Percent Difference: School Site and State N/A N/A -1.7 -4.8 Note: Cells with N/A values do not require data. Types of Services Funded (Fiscal Year 2015-16)
In addition to general state funding provided by the Local Control Funding Formula, East Whittier City School District received state and federal categorical funding.
2015-16 School Accountability Report Card for Ocean View Elementary School Page 12 of 12
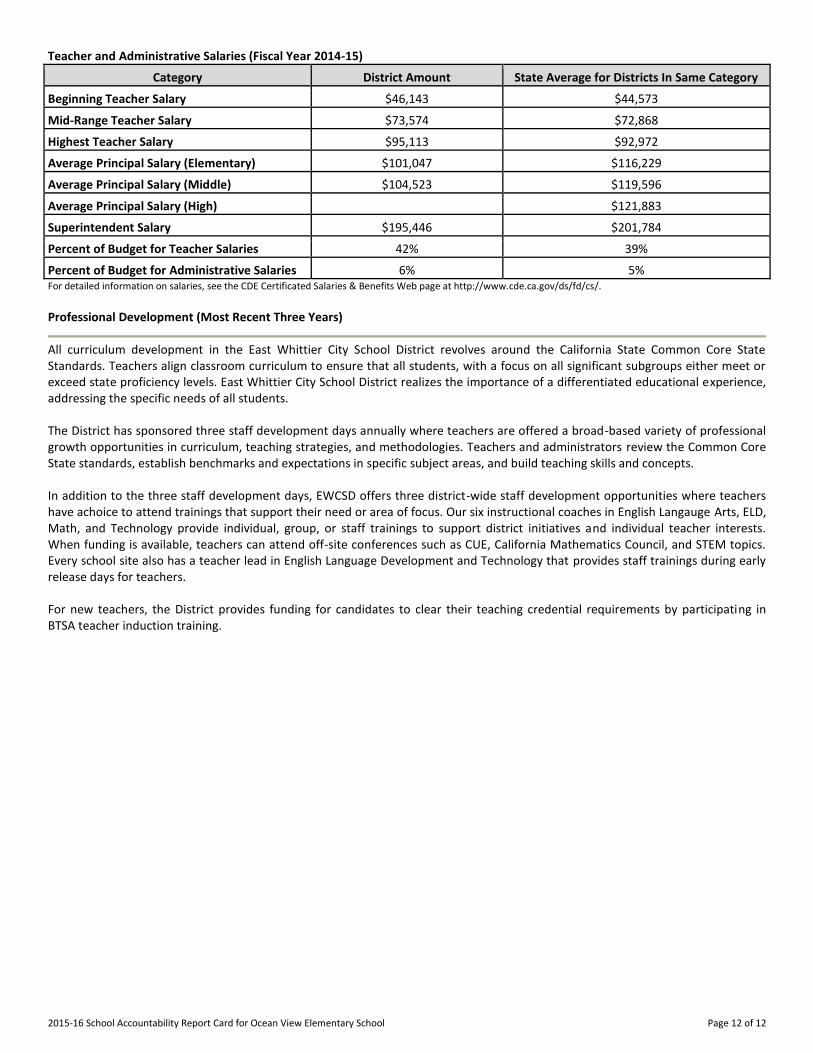
Teacher and Administrative Salaries (Fiscal Year 2014-15) Category District Amount State Average for Districts In Same Category
Beginning Teacher Salary $46,143 $44,573
Mid-Range Teacher Salary $73,574 $72,868
Highest Teacher Salary $95,113 $92,972
Average Principal Salary (Elementary) $101,047 $116,229
Average Principal Salary (Middle) $104,523 $119,596
Average Principal Salary (High) $121,883
Superintendent Salary $195,446 $201,784
Percent of Budget for Teacher Salaries 42% 39%
Percent of Budget for Administrative Salaries 6% 5% For detailed information on salaries, see the CDE Certificated Salaries & Benefits Web page at http://www.cde.ca.gov/ds/fd/cs/. Professional Development (Most Recent Three Years)
All curriculum development in the East Whittier City School District revolves around the California State Common Core State Standards. Teachers align classroom curriculum to ensure that all students, with a focus on all significant subgroups either meet or exceed state proficiency levels. East Whittier City School District realizes the importance of a differentiated educational experience, addressing the specific needs of all students. The District has sponsored three staff development days annually where teachers are offered a broad-based variety of professional growth opportunities in curriculum, teaching strategies, and methodologies. Teachers and administrators review the Common Core State standards, establish benchmarks and expectations in specific subject areas, and build teaching skills and concepts. In addition to the three staff development days, EWCSD offers three district-wide staff development opportunities where teachers have achoice to attend trainings that support their need or area of focus. Our six instructional coaches in English Langauge Arts, ELD, Math, and Technology provide individual, group, or staff trainings to support district initiatives and individual teacher interests. When funding is available, teachers can attend off-site conferences such as CUE, California Mathematics Council, and STEM topics. Every school site also has a teacher lead in English Language Development and Technology that provides staff trainings during early release days for teachers. For new teachers, the District provides funding for candidates to clear their teaching credential requirements by participating in BTSA teacher induction training.
Informe de Responsabilidad Escolar del 2015-16 para Escuela Primaria Ocean View Página 1 de 12
Escuela Primaria Ocean View
Informe de Responsabilidad Escolar
Reportado Usando Datos del Ciclo Escolar 2015-16
Publicado Durante el 2016-17
La ley estatal requiere que cada escuela en el estado de California publique un informe de responsabilidad escolar (SARC, por sus siglas en inglés), para el 1 de febrero de cada año. El SARC contiene información sobre la condición y desempeño de cada escuela pública en California. Bajo la fórmula de financiamiento bajo control local (LCFF, por sus siglas en inglés) todas las agencias educativas locales (LEA, por sus siglas en inglés) son requeridas preparar un plan de responsabilidad bajo control local (LCAP, por sus siglas en inglés), que describe como intentan cumplir las metas anuales específicas a la escuela para todos los alumnos, con actividades específicas para abordar prioridades estatales y locales. Además, datos reportados en un LCAP debe ser consistente con los datos reportados en el SARC. • Para mayores informes sobre los requisitos del SARC, favor de consultar la página web del SARC del Departamento de Educación
de California (CDE, por sus siglas en inglés), en http://www.cde.ca.gov/ta/ac/sa/. • Para más información sobre el LCFF o LCAP, vea el sitio web CDE LCFF http://www.cde.ca.gov/fg/aa/lc/. • Si los padres y el público general desean recibir información adicional sobre la escuela, pueden comunicarse con el director o la
oficina del distrito. DataQuest DataQuest es una herramienta en línea ubicada en el sitio web DataQuest de CDE en http://dq.cde.ca.gov/dataquest/ que cuenta con información adicional sobre esta escuela y comparaciones de la escuela con el distrito, el condado, y el estado. Específicamente, DataQuest es un sistema dinámico que proporciona informes para contabilidad (p. ej., datos de pruebas, matriculación, egresados de escuela preparatoria, abandono escolar, matriculación en cursos, dotación, y datos relacionados a Estudiantes del Inglés. Acceso al Internet Acceso al internet está disponible en bibliotecas públicas y otras ubicaciones que son accesibles al público (p. ej., la Biblioteca Estatal de California). Acceso al internet en las bibliotecas y ubicaciones públicas es generalmente proporcionado en orden de llegada. Otras restricciones pueden incluir horario de servicio, el periodo de tiempo que un terminal puede ser utilizado (dependiendo en disponibilidad), los tipos de programas informáticos disponibles en una terminal, y la habilidad de imprimir documentos.
Sobre esta escuela Información de Contacto (ciclo escolar 2016-17) Información de Contacto Escolar Nombre de la escuela------- Escuela Primaria Ocean View Dirección------- 14359 E. Second Street Ciudad, estado, código postal Whittier, CA 90605 Teléfono------- (562) 907-6400 Director------- Tim Strand Correo electrónico------- [email protected] Niveles de año------- K-5 Código CDS------- 19-64485-6013098
Informe de Responsabilidad Escolar del 2015-16 para Escuela Primaria Ocean View Página 2 de 12
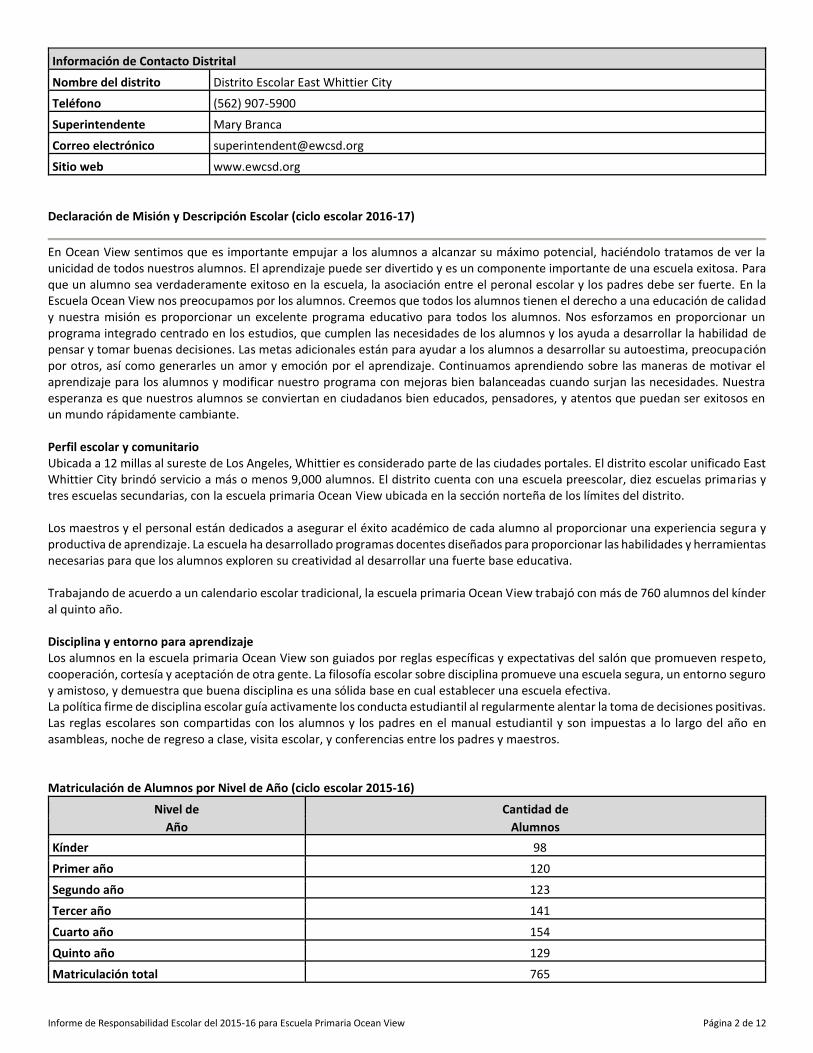
Información de Contacto Distrital Nombre del distrito------- Distrito Escolar East Whittier City Teléfono------- (562) 907-5900 Superintendente------- Mary Branca Correo electrónico------- [email protected] Sitio web------- www.ewcsd.org
Declaración de Misión y Descripción Escolar (ciclo escolar 2016-17)
En Ocean View sentimos que es importante empujar a los alumnos a alcanzar su máximo potencial, haciéndolo tratamos de ver la unicidad de todos nuestros alumnos. El aprendizaje puede ser divertido y es un componente importante de una escuela exitosa. Para que un alumno sea verdaderamente exitoso en la escuela, la asociación entre el peronal escolar y los padres debe ser fuerte. En la Escuela Ocean View nos preocupamos por los alumnos. Creemos que todos los alumnos tienen el derecho a una educación de calidad y nuestra misión es proporcionar un excelente programa educativo para todos los alumnos. Nos esforzamos en proporcionar un programa integrado centrado en los estudios, que cumplen las necesidades de los alumnos y los ayuda a desarrollar la habilidad de pensar y tomar buenas decisiones. Las metas adicionales están para ayudar a los alumnos a desarrollar su autoestima, preocupación por otros, así como generarles un amor y emoción por el aprendizaje. Continuamos aprendiendo sobre las maneras de motivar el aprendizaje para los alumnos y modificar nuestro programa con mejoras bien balanceadas cuando surjan las necesidades. Nuestra esperanza es que nuestros alumnos se conviertan en ciudadanos bien educados, pensadores, y atentos que puedan ser exitosos en un mundo rápidamente cambiante. Perfil escolar y comunitario Ubicada a 12 millas al sureste de Los Angeles, Whittier es considerado parte de las ciudades portales. El distrito escolar unificado East Whittier City brindó servicio a más o menos 9,000 alumnos. El distrito cuenta con una escuela preescolar, diez escuelas primarias y tres escuelas secundarias, con la escuela primaria Ocean View ubicada en la sección norteña de los límites del distrito. Los maestros y el personal están dedicados a asegurar el éxito académico de cada alumno al proporcionar una experiencia segura y productiva de aprendizaje. La escuela ha desarrollado programas docentes diseñados para proporcionar las habilidades y herramientas necesarias para que los alumnos exploren su creatividad al desarrollar una fuerte base educativa. Trabajando de acuerdo a un calendario escolar tradicional, la escuela primaria Ocean View trabajó con más de 760 alumnos del kínder al quinto año. Disciplina y entorno para aprendizaje Los alumnos en la escuela primaria Ocean View son guiados por reglas específicas y expectativas del salón que promueven respeto, cooperación, cortesía y aceptación de otra gente. La filosofía escolar sobre disciplina promueve una escuela segura, un entorno seguro y amistoso, y demuestra que buena disciplina es una sólida base en cual establecer una escuela efectiva. La política firme de disciplina escolar guía activamente los conducta estudiantil al regularmente alentar la toma de decisiones positivas. Las reglas escolares son compartidas con los alumnos y los padres en el manual estudiantil y son impuestas a lo largo del año en asambleas, noche de regreso a clase, visita escolar, y conferencias entre los padres y maestros. Matriculación de Alumnos por Nivel de Año (ciclo escolar 2015-16)
Nivel de Cantidad de Año Alumnos
Kínder 98 Primer año 120 Segundo año 123 Tercer año 141 Cuarto año 154 Quinto año 129 Matriculación total 765
Informe de Responsabilidad Escolar del 2015-16 para Escuela Primaria Ocean View Página 3 de 12
Matriculación Estudiantil por Grupo (ciclo escolar 2015-16) Grupo Porcentaje de
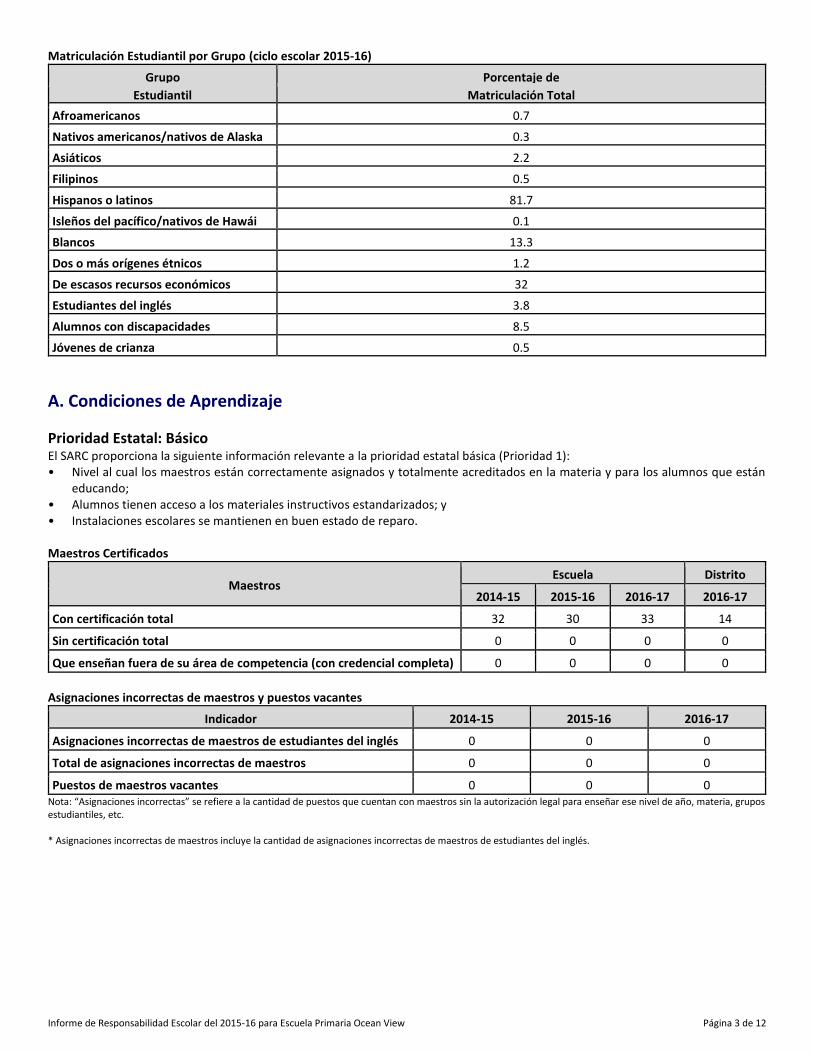
Estudiantil Matriculación Total Afroamericanos 0.7 Nativos americanos/nativos de Alaska 0.3 Asiáticos 2.2 Filipinos 0.5 Hispanos o latinos 81.7 Isleños del pacífico/nativos de Hawái 0.1 Blancos 13.3 Dos o más orígenes étnicos 1.2 De escasos recursos económicos 32 Estudiantes del inglés 3.8 Alumnos con discapacidades 8.5 Jóvenes de crianza 0.5
A. Condiciones de Aprendizaje Prioridad Estatal: Básico El SARC proporciona la siguiente información relevante a la prioridad estatal básica (Prioridad 1): • Nivel al cual los maestros están correctamente asignados y totalmente acreditados en la materia y para los alumnos que están
educando; • Alumnos tienen acceso a los materiales instructivos estandarizados; y • Instalaciones escolares se mantienen en buen estado de reparo. Maestros Certificados
Maestros Escuela Distrito
2014-15 2015-16 2016-17 2016-17
Con certificación total 32 30 33 14
Sin certificación total 0 0 0 0
Que enseñan fuera de su área de competencia (con credencial completa) 0 0 0 0 Asignaciones incorrectas de maestros y puestos vacantes
Indicador 2014-15 2015-16 2016-17
Asignaciones incorrectas de maestros de estudiantes del inglés 0 0 0
Total de asignaciones incorrectas de maestros 0 0 0
Puestos de maestros vacantes 0 0 0 Nota: “Asignaciones incorrectas” se refiere a la cantidad de puestos que cuentan con maestros sin la autorización legal para enseñar ese nivel de año, materia, grupos estudiantiles, etc. * Asignaciones incorrectas de maestros incluye la cantidad de asignaciones incorrectas de maestros de estudiantes del inglés.
Informe de Responsabilidad Escolar del 2015-16 para Escuela Primaria Ocean View Página 4 de 12
Materias Académicas Básicas Impartidas por Maestros Altamente Calificados (ciclo escolar 2015-16)
Ubicación de las clases
Porcentaje de Clases de Materias Básicas
Impartido por maestros altamente calificados
No impartido por maestros altamente calificados
Esta escuela 100.0 0.0
Todas las escuelas del distrito 99.3 0.7
Escuelas del distrito de muy bajos recursos 99.2 0.8
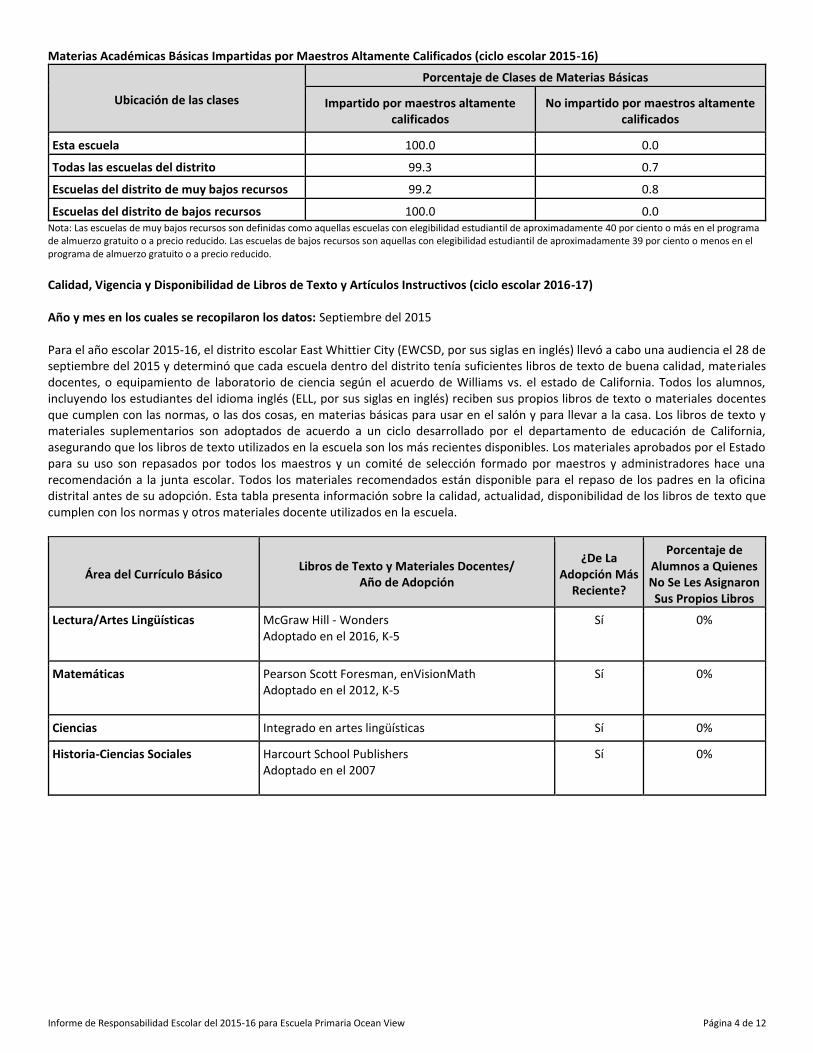
Escuelas del distrito de bajos recursos 100.0 0.0 Nota: Las escuelas de muy bajos recursos son definidas como aquellas escuelas con elegibilidad estudiantil de aproximadamente 40 por ciento o más en el programa de almuerzo gratuito o a precio reducido. Las escuelas de bajos recursos son aquellas con elegibilidad estudiantil de aproximadamente 39 por ciento o menos en el programa de almuerzo gratuito o a precio reducido. Calidad, Vigencia y Disponibilidad de Libros de Texto y Artículos Instructivos (ciclo escolar 2016-17) Año y mes en los cuales se recopilaron los datos: Septiembre del 2015 Para el año escolar 2015-16, el distrito escolar East Whittier City (EWCSD, por sus siglas en inglés) llevó a cabo una audiencia el 28 de septiembre del 2015 y determinó que cada escuela dentro del distrito tenía suficientes libros de texto de buena calidad, materiales docentes, o equipamiento de laboratorio de ciencia según el acuerdo de Williams vs. el estado de California. Todos los alumnos, incluyendo los estudiantes del idioma inglés (ELL, por sus siglas en inglés) reciben sus propios libros de texto o materiales docentes que cumplen con las normas, o las dos cosas, en materias básicas para usar en el salón y para llevar a la casa. Los libros de texto y materiales suplementarios son adoptados de acuerdo a un ciclo desarrollado por el departamento de educación de California, asegurando que los libros de texto utilizados en la escuela son los más recientes disponibles. Los materiales aprobados por el Estado para su uso son repasados por todos los maestros y un comité de selección formado por maestros y administradores hace una recomendación a la junta escolar. Todos los materiales recomendados están disponible para el repaso de los padres en la oficina distrital antes de su adopción. Esta tabla presenta información sobre la calidad, actualidad, disponibilidad de los libros de texto que cumplen con los normas y otros materiales docente utilizados en la escuela.
Área del Currículo Básico Libros de Texto y Materiales Docentes/ Año de Adopción
¿De La Adopción Más
Reciente?
Porcentaje de Alumnos a Quienes No Se Les Asignaron Sus Propios Libros
Lectura/Artes Lingüísticas McGraw Hill - Wonders Adoptado en el 2016, K-5
Sí 0%
Matemáticas Pearson Scott Foresman, enVisionMath Adoptado en el 2012, K-5
Sí 0%
Ciencias Integrado en artes lingüísticas Sí 0%
Historia-Ciencias Sociales Harcourt School Publishers Adoptado en el 2007
Sí 0%
Informe de Responsabilidad Escolar del 2015-16 para Escuela Primaria Ocean View Página 5 de 12
Condición de las Instalaciones Escolares y Mejoras Planificadas (año más reciente)
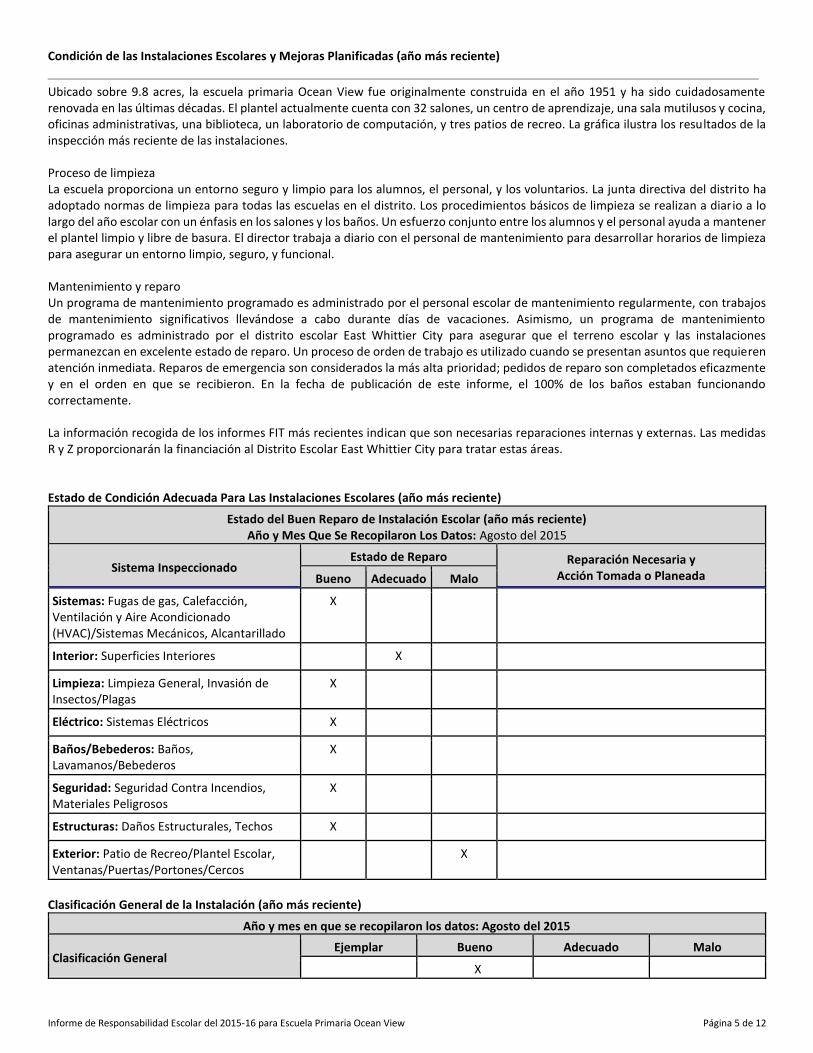
Ubicado sobre 9.8 acres, la escuela primaria Ocean View fue originalmente construida en el año 1951 y ha sido cuidadosamente renovada en las últimas décadas. El plantel actualmente cuenta con 32 salones, un centro de aprendizaje, una sala mutilusos y cocina, oficinas administrativas, una biblioteca, un laboratorio de computación, y tres patios de recreo. La gráfica ilustra los resultados de la inspección más reciente de las instalaciones. Proceso de limpieza La escuela proporciona un entorno seguro y limpio para los alumnos, el personal, y los voluntarios. La junta directiva del distrito ha adoptado normas de limpieza para todas las escuelas en el distrito. Los procedimientos básicos de limpieza se realizan a diario a lo largo del año escolar con un énfasis en los salones y los baños. Un esfuerzo conjunto entre los alumnos y el personal ayuda a mantener el plantel limpio y libre de basura. El director trabaja a diario con el personal de mantenimiento para desarrollar horarios de limpieza para asegurar un entorno limpio, seguro, y funcional. Mantenimiento y reparo Un programa de mantenimiento programado es administrado por el personal escolar de mantenimiento regularmente, con trabajos de mantenimiento significativos llevándose a cabo durante días de vacaciones. Asimismo, un programa de mantenimiento programado es administrado por el distrito escolar East Whittier City para asegurar que el terreno escolar y las instalaciones permanezcan en excelente estado de reparo. Un proceso de orden de trabajo es utilizado cuando se presentan asuntos que requieren atención inmediata. Reparos de emergencia son considerados la más alta prioridad; pedidos de reparo son completados eficazmente y en el orden en que se recibieron. En la fecha de publicación de este informe, el 100% de los baños estaban funcionando correctamente. La información recogida de los informes FIT más recientes indican que son necesarias reparaciones internas y externas. Las medidas R y Z proporcionarán la financiación al Distrito Escolar East Whittier City para tratar estas áreas. Estado de Condición Adecuada Para Las Instalaciones Escolares (año más reciente)
Estado del Buen Reparo de Instalación Escolar (año más reciente) Año y Mes Que Se Recopilaron Los Datos: Agosto del 2015
Sistema Inspeccionado Estado de Reparo Reparación Necesaria y
Acción Tomada o Planeada Bueno Adecuado Malo
Sistemas: Fugas de gas, Calefacción, Ventilación y Aire Acondicionado (HVAC)/Sistemas Mecánicos, Alcantarillado
X
Interior: Superficies Interiores X
Limpieza: Limpieza General, Invasión de Insectos/Plagas
X
Eléctrico: Sistemas Eléctricos X
Baños/Bebederos: Baños, Lavamanos/Bebederos
X
Seguridad: Seguridad Contra Incendios, Materiales Peligrosos
X
Estructuras: Daños Estructurales, Techos X
Exterior: Patio de Recreo/Plantel Escolar, Ventanas/Puertas/Portones/Cercos
X
Clasificación General de la Instalación (año más reciente)
Año y mes en que se recopilaron los datos: Agosto del 2015
Clasificación General Ejemplar Bueno Adecuado Malo
X
Informe de Responsabilidad Escolar del 2015-16 para Escuela Primaria Ocean View Página 6 de 12
B. Resultados Estudiantiles Prioridad Estatal: Rendimiento Estudiantil El SARC proporciona la siguiente información relevante a la prioridad estatal de rendimiento estudiantil (prioridad 4): • Evaluaciones a nivel estatal (p. ej., Evaluación de Rendimiento Estudiantil y Progreso de California [CAASPP, por sus siglas en
inglés], que incluye las Evaluaciones Sumativas Smarter Balanced para alumnos en población de educación general y las Evaluaciones Alternativas de California [CAA, por sus siglas en inglés] para artes lingüísticas del inglés [ELA, por sus siglas en inglés]/alfabetismo y matemáticas administradas en tercero a octavo y onceavo año. El CAA ha reemplazado la Evaluación de Rendimiento Alternativo de California [CAPA, por sus siglas en inglés] para ELA y matemáticas, que fue eliminado en el 2015. Solo alumnos elegibles pueden participar en la administración de las CAA. Material CAA cumple con las normas de rendimiento alternativo, las cuales están vinculadas con las Normas Básicas Comunes Estatales [CCSS, por sus siglas en inglés] para alumnos con discapacidades cognitivas significativas); y
• El porcentaje de alumnos que han exitosamente completado cursos que satisfacen los requisitos para admisión a la Universidad de California y la Universidad Estatal de California, o secuencias de educación de carrera técnica o programas de estudio.
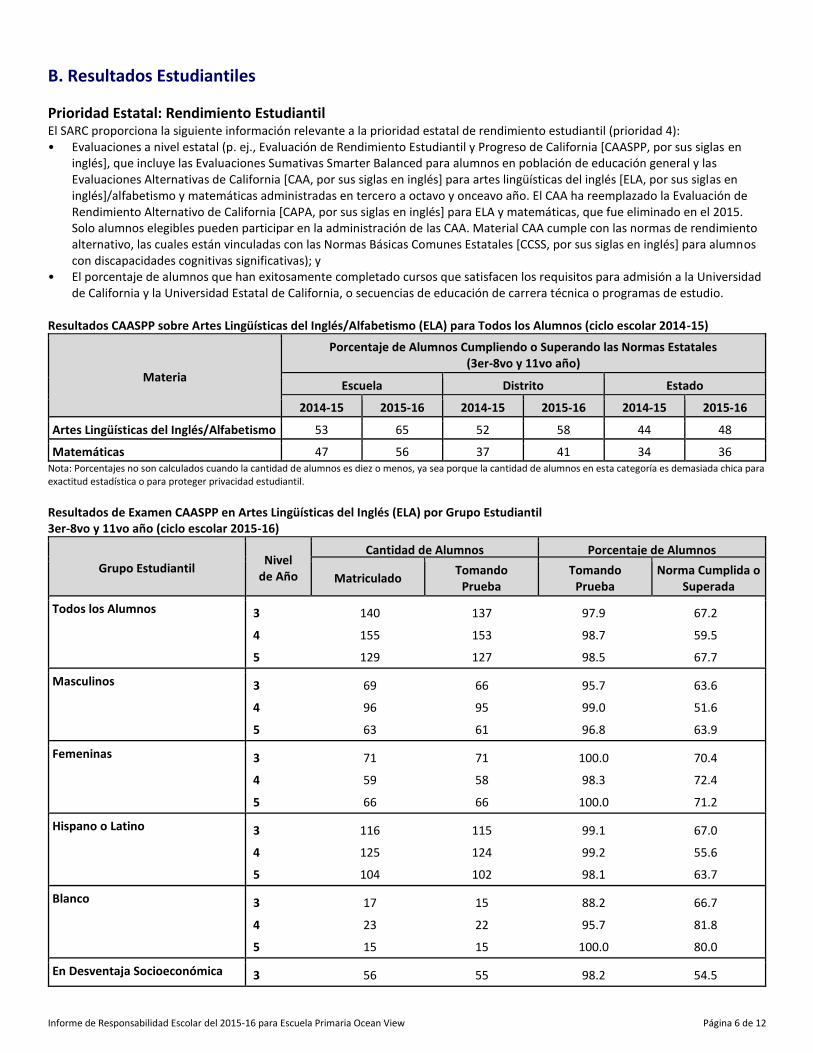
Resultados CAASPP sobre Artes Lingüísticas del Inglés/Alfabetismo (ELA) para Todos los Alumnos (ciclo escolar 2014-15)
Materia
Porcentaje de Alumnos Cumpliendo o Superando las Normas Estatales (3er-8vo y 11vo año)
Escuela Distrito Estado
2014-15 2015-16 2014-15 2015-16 2014-15 2015-16
Artes Lingüísticas del Inglés/Alfabetismo 53 65 52 58 44 48
Matemáticas 47 56 37 41 34 36 Nota: Porcentajes no son calculados cuando la cantidad de alumnos es diez o menos, ya sea porque la cantidad de alumnos en esta categoría es demasiada chica para exactitud estadística o para proteger privacidad estudiantil. Resultados de Examen CAASPP en Artes Lingüísticas del Inglés (ELA) por Grupo Estudiantil 3er-8vo y 11vo año (ciclo escolar 2015-16)
Grupo Estudiantil Nivel de Año
Cantidad de Alumnos Porcentaje de Alumnos
Matriculado Tomando Prueba
Tomando Prueba
Norma Cumplida o Superada
Todos los Alumnos 3 140 137 97.9 67.2
4 155 153 98.7 59.5
5 129 127 98.5 67.7
Masculinos 3 69 66 95.7 63.6
4 96 95 99.0 51.6
5 63 61 96.8 63.9
Femeninas 3 71 71 100.0 70.4
4 59 58 98.3 72.4
5 66 66 100.0 71.2
Hispano o Latino 3 116 115 99.1 67.0
4 125 124 99.2 55.6
5 104 102 98.1 63.7
Blanco 3 17 15 88.2 66.7
4 23 22 95.7 81.8
5 15 15 100.0 80.0
En Desventaja Socioeconómica 3 56 55 98.2 54.5
Informe de Responsabilidad Escolar del 2015-16 para Escuela Primaria Ocean View Página 7 de 12
Grupo Estudiantil Nivel de Año
Cantidad de Alumnos Porcentaje de Alumnos
Matriculado Tomando Prueba
Tomando Prueba
Norma Cumplida o Superada
4 51 50 98.0 46.0
5 35 34 97.1 58.8
Alumnos con Discapacidades 3 19 18 94.7 38.9
4 18 18 100.0 27.8
5 12 11 91.7 36.4
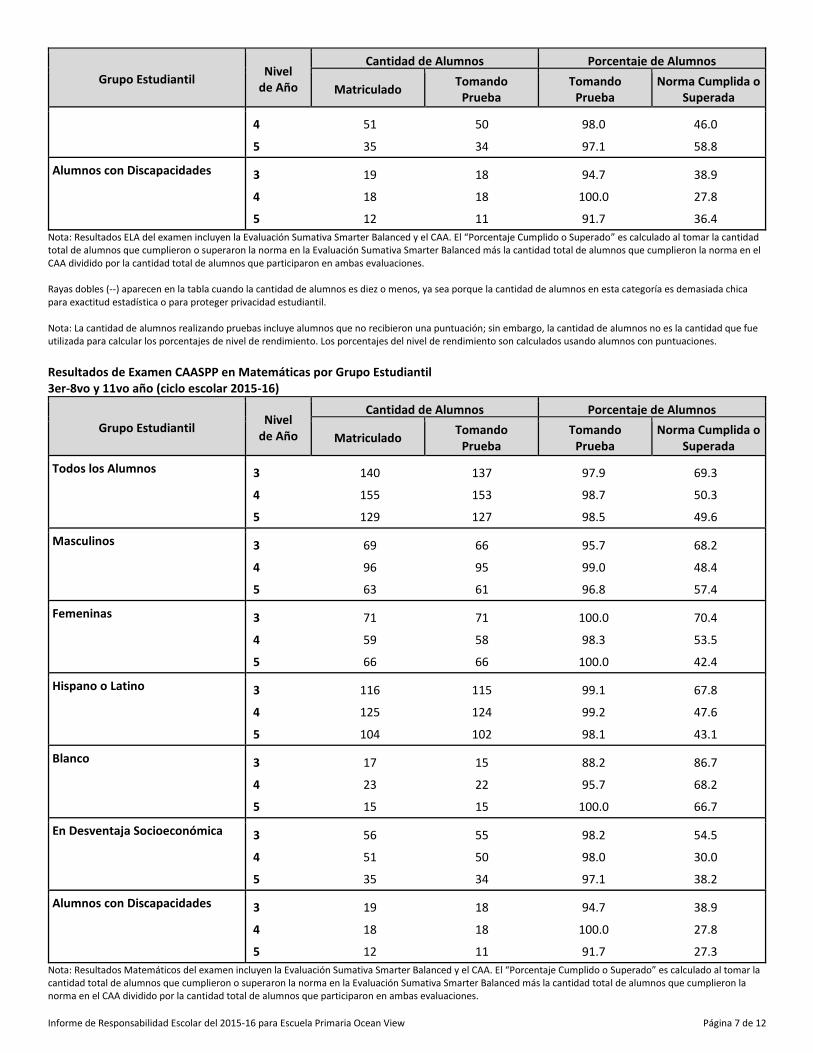
Nota: Resultados ELA del examen incluyen la Evaluación Sumativa Smarter Balanced y el CAA. El “Porcentaje Cumplido o Superado” es calculado al tomar la cantidad total de alumnos que cumplieron o superaron la norma en la Evaluación Sumativa Smarter Balanced más la cantidad total de alumnos que cumplieron la norma en el CAA dividido por la cantidad total de alumnos que participaron en ambas evaluaciones. Rayas dobles (--) aparecen en la tabla cuando la cantidad de alumnos es diez o menos, ya sea porque la cantidad de alumnos en esta categoría es demasiada chica para exactitud estadística o para proteger privacidad estudiantil. Nota: La cantidad de alumnos realizando pruebas incluye alumnos que no recibieron una puntuación; sin embargo, la cantidad de alumnos no es la cantidad que fue utilizada para calcular los porcentajes de nivel de rendimiento. Los porcentajes del nivel de rendimiento son calculados usando alumnos con puntuaciones. Resultados de Examen CAASPP en Matemáticas por Grupo Estudiantil 3er-8vo y 11vo año (ciclo escolar 2015-16)
Grupo Estudiantil Nivel de Año
Cantidad de Alumnos Porcentaje de Alumnos
Matriculado Tomando Prueba
Tomando Prueba
Norma Cumplida o Superada
Todos los Alumnos 3 140 137 97.9 69.3
4 155 153 98.7 50.3
5 129 127 98.5 49.6
Masculinos 3 69 66 95.7 68.2
4 96 95 99.0 48.4
5 63 61 96.8 57.4
Femeninas 3 71 71 100.0 70.4
4 59 58 98.3 53.5
5 66 66 100.0 42.4
Hispano o Latino 3 116 115 99.1 67.8
4 125 124 99.2 47.6
5 104 102 98.1 43.1
Blanco 3 17 15 88.2 86.7
4 23 22 95.7 68.2
5 15 15 100.0 66.7
En Desventaja Socioeconómica 3 56 55 98.2 54.5
4 51 50 98.0 30.0
5 35 34 97.1 38.2
Alumnos con Discapacidades 3 19 18 94.7 38.9
4 18 18 100.0 27.8
5 12 11 91.7 27.3
Nota: Resultados Matemáticos del examen incluyen la Evaluación Sumativa Smarter Balanced y el CAA. El “Porcentaje Cumplido o Superado” es calculado al tomar la cantidad total de alumnos que cumplieron o superaron la norma en la Evaluación Sumativa Smarter Balanced más la cantidad total de alumnos que cumplieron la norma en el CAA dividido por la cantidad total de alumnos que participaron en ambas evaluaciones.
Informe de Responsabilidad Escolar del 2015-16 para Escuela Primaria Ocean View Página 8 de 12
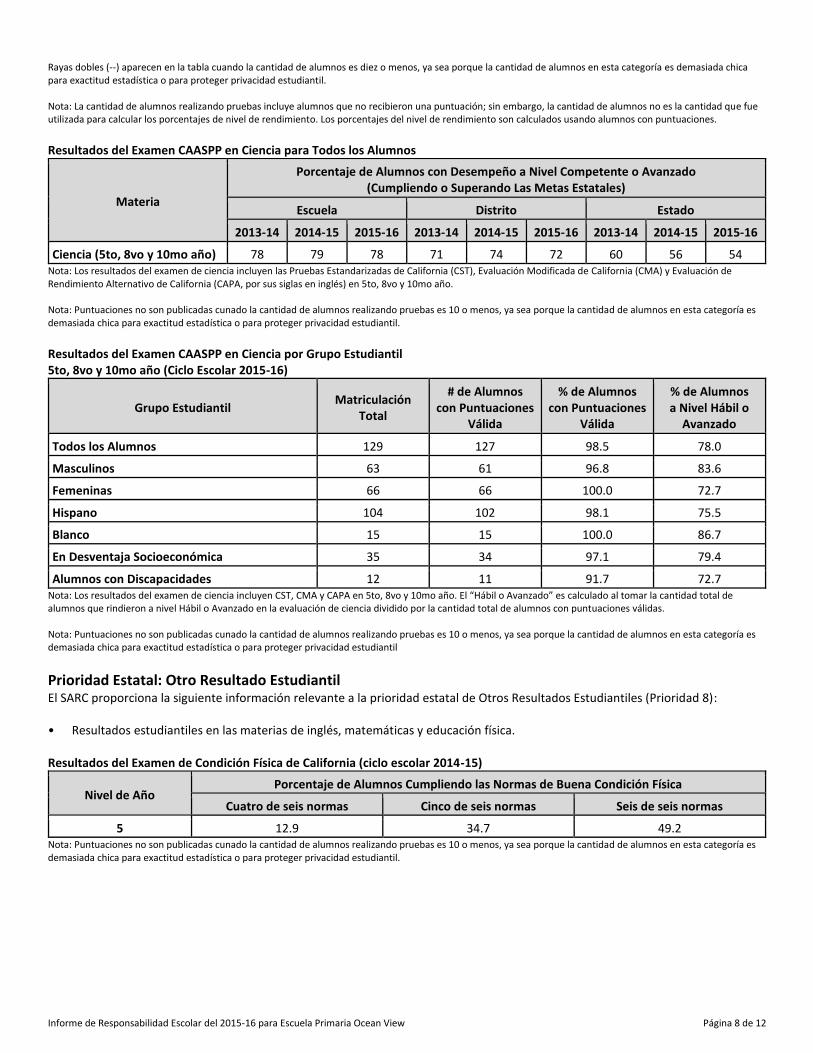
Rayas dobles (--) aparecen en la tabla cuando la cantidad de alumnos es diez o menos, ya sea porque la cantidad de alumnos en esta categoría es demasiada chica para exactitud estadística o para proteger privacidad estudiantil. Nota: La cantidad de alumnos realizando pruebas incluye alumnos que no recibieron una puntuación; sin embargo, la cantidad de alumnos no es la cantidad que fue utilizada para calcular los porcentajes de nivel de rendimiento. Los porcentajes del nivel de rendimiento son calculados usando alumnos con puntuaciones. Resultados del Examen CAASPP en Ciencia para Todos los Alumnos
Materia
Porcentaje de Alumnos con Desempeño a Nivel Competente o Avanzado (Cumpliendo o Superando Las Metas Estatales)
Escuela Distrito Estado
2013-14 2014-15 2015-16 2013-14 2014-15 2015-16 2013-14 2014-15 2015-16
Ciencia (5to, 8vo y 10mo año) 78 79 78 71 74 72 60 56 54 Nota: Los resultados del examen de ciencia incluyen las Pruebas Estandarizadas de California (CST), Evaluación Modificada de California (CMA) y Evaluación de Rendimiento Alternativo de California (CAPA, por sus siglas en inglés) en 5to, 8vo y 10mo año. Nota: Puntuaciones no son publicadas cunado la cantidad de alumnos realizando pruebas es 10 o menos, ya sea porque la cantidad de alumnos en esta categoría es demasiada chica para exactitud estadística o para proteger privacidad estudiantil. Resultados del Examen CAASPP en Ciencia por Grupo Estudiantil 5to, 8vo y 10mo año (Ciclo Escolar 2015-16)
Grupo Estudiantil Matriculación Total
# de Alumnos con Puntuaciones
Válida
% de Alumnos con Puntuaciones
Válida
% de Alumnos a Nivel Hábil o
Avanzado
Todos los Alumnos 129 127 98.5 78.0
Masculinos 63 61 96.8 83.6
Femeninas 66 66 100.0 72.7
Hispano 104 102 98.1 75.5
Blanco 15 15 100.0 86.7
En Desventaja Socioeconómica 35 34 97.1 79.4
Alumnos con Discapacidades 12 11 91.7 72.7 Nota: Los resultados del examen de ciencia incluyen CST, CMA y CAPA en 5to, 8vo y 10mo año. El “Hábil o Avanzado” es calculado al tomar la cantidad total de alumnos que rindieron a nivel Hábil o Avanzado en la evaluación de ciencia dividido por la cantidad total de alumnos con puntuaciones válidas. Nota: Puntuaciones no son publicadas cunado la cantidad de alumnos realizando pruebas es 10 o menos, ya sea porque la cantidad de alumnos en esta categoría es demasiada chica para exactitud estadística o para proteger privacidad estudiantil Prioridad Estatal: Otro Resultado Estudiantil El SARC proporciona la siguiente información relevante a la prioridad estatal de Otros Resultados Estudiantiles (Prioridad 8): • Resultados estudiantiles en las materias de inglés, matemáticas y educación física. Resultados del Examen de Condición Física de California (ciclo escolar 2014-15)
Nivel de Año Porcentaje de Alumnos Cumpliendo las Normas de Buena Condición Física
Cuatro de seis normas Cinco de seis normas Seis de seis normas
---5--- 12.9 34.7 49.2 Nota: Puntuaciones no son publicadas cunado la cantidad de alumnos realizando pruebas es 10 o menos, ya sea porque la cantidad de alumnos en esta categoría es demasiada chica para exactitud estadística o para proteger privacidad estudiantil.
Informe de Responsabilidad Escolar del 2015-16 para Escuela Primaria Ocean View Página 9 de 12
C. Inclusión Prioridad Estatal: Participación de los Padres El SARC proporciona la siguiente información relevante a la prioridad estatal de Participación de los Padres (prioridad 3): • Esfuerzos que el distrito escolar realiza para buscar la aportación de los padres en toma de decisiones para el distrito escolar y
cada sitio escolar. Oportunidades para Participación de los Padres (ciclo escolar 2016-17)
Los padres y la comunidad apoyan de sobremanera los programas docentes en la escuela primaria Ocean View. La escuela primaria Ocean View ofrece una variedad de eventos, programas, y actividades a lo largo del año escolar para que los padres participen activamente en la escuela y educación de sus hijos. Los padres son alentados a participar en las siguientes actividades y eventos llevados a cabo en la escuela secundaria Granada: • Noche de regreso a clases. • Visita escolar. • Programa de coro. • Almuerzo Dive into Reading. • Noche de diversión con la familia. • Día de diversión de bienestar físico. • Programas navideños. • Asociación de Padres y Maestros (PTA, por sus siglas en inglés) • Jog-A-Thon. • Semana de listón rojo. El distrito aprovecha todos los recursos disponibles en la comunidad para ayudar los alumnos en su desarrollo emocional y académico. Algunos de los recursos comunitarios disponibles incluyen, pero no están limitados a, lo siguiente: • Centro intercomunitario de orientación juvenil. • Boys & Girls Club. • California State University, Fullerton. • YMCA. • Biblioteca pública de Whittier. • Fundación SKILLS. • Consejería juvenil de asistencia telefónica. • Centro Options para la familia. • Whittier Assistance League. • Presbyterian Hospital. • Centro comunitario de Whittier • Club de leones. • Departamento de policías de Whittier. • Universidad de California. • Departamento de libertad condicional de Los Ángeles. • Club Kiwanis. • Centro de abuso de alcohol y drogas de Los Ángeles. • Oficina del fiscal del condado de Los Ángeles. • Programa Operativo de Educación Especial del área de Whittier. • Centro Regional de East Los Ángeles.
Informe de Responsabilidad Escolar del 2015-16 para Escuela Primaria Ocean View Página 10 de 12
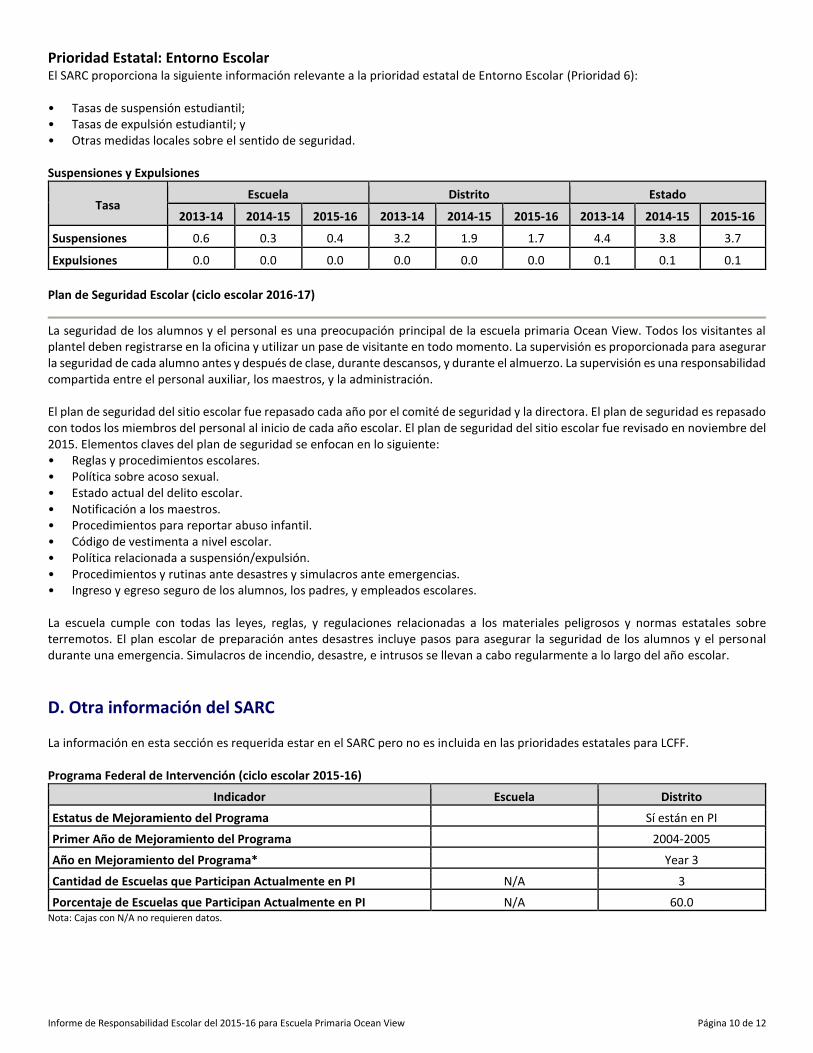
Prioridad Estatal: Entorno Escolar El SARC proporciona la siguiente información relevante a la prioridad estatal de Entorno Escolar (Prioridad 6): • Tasas de suspensión estudiantil; • Tasas de expulsión estudiantil; y • Otras medidas locales sobre el sentido de seguridad. Suspensiones y Expulsiones
Tasa Escuela Distrito Estado
2013-14 2014-15 2015-16 2013-14 2014-15 2015-16 2013-14 2014-15 2015-16
Suspensiones------- 0.6 0.3 0.4 3.2 1.9 1.7 4.4 3.8 3.7
Expulsiones------- 0.0 0.0 0.0 0.0 0.0 0.0 0.1 0.1 0.1 Plan de Seguridad Escolar (ciclo escolar 2016-17)
La seguridad de los alumnos y el personal es una preocupación principal de la escuela primaria Ocean View. Todos los visitantes al plantel deben registrarse en la oficina y utilizar un pase de visitante en todo momento. La supervisión es proporcionada para asegurar la seguridad de cada alumno antes y después de clase, durante descansos, y durante el almuerzo. La supervisión es una responsabilidad compartida entre el personal auxiliar, los maestros, y la administración. El plan de seguridad del sitio escolar fue repasado cada año por el comité de seguridad y la directora. El plan de seguridad es repasado con todos los miembros del personal al inicio de cada año escolar. El plan de seguridad del sitio escolar fue revisado en noviembre del 2015. Elementos claves del plan de seguridad se enfocan en lo siguiente: • Reglas y procedimientos escolares. • Política sobre acoso sexual. • Estado actual del delito escolar. • Notificación a los maestros. • Procedimientos para reportar abuso infantil. • Código de vestimenta a nivel escolar. • Política relacionada a suspensión/expulsión. • Procedimientos y rutinas ante desastres y simulacros ante emergencias. • Ingreso y egreso seguro de los alumnos, los padres, y empleados escolares. La escuela cumple con todas las leyes, reglas, y regulaciones relacionadas a los materiales peligrosos y normas estatales sobre terremotos. El plan escolar de preparación antes desastres incluye pasos para asegurar la seguridad de los alumnos y el personal durante una emergencia. Simulacros de incendio, desastre, e intrusos se llevan a cabo regularmente a lo largo del año escolar. D. Otra información del SARC La información en esta sección es requerida estar en el SARC pero no es incluida en las prioridades estatales para LCFF. Programa Federal de Intervención (ciclo escolar 2015-16)
Indicador Escuela Distrito Estatus de Mejoramiento del Programa Sí están en PI Primer Año de Mejoramiento del Programa 2004-2005 Año en Mejoramiento del Programa* Year 3 Cantidad de Escuelas que Participan Actualmente en PI N/A 3 Porcentaje de Escuelas que Participan Actualmente en PI N/A 60.0
Nota: Cajas con N/A no requieren datos.
Informe de Responsabilidad Escolar del 2015-16 para Escuela Primaria Ocean View Página 11 de 12
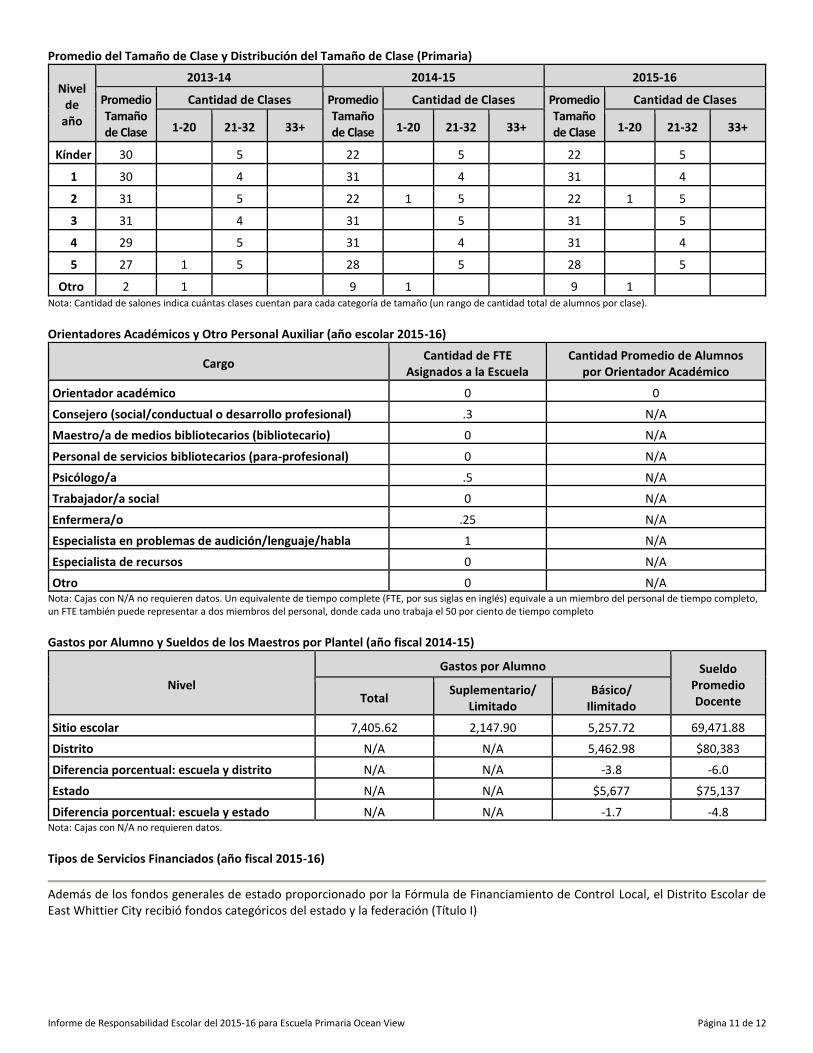
Promedio del Tamaño de Clase y Distribución del Tamaño de Clase (Primaria)
Nivel de
año
2013-14 2014-15 2015-16
Promedio Tamaño de Clase
Cantidad de Clases Promedio Tamaño de Clase
Cantidad de Clases Promedio Tamaño de Clase
Cantidad de Clases
1-20 21-32 33+ 1-20 21-32 33+ 1-20 21-32 33+
Kínder
30 5 22 5 22 5
1
30 4 31 4 31 4
2
31 5 22 1 5 22 1 5
3
31 4 31 5 31 5
4
29 5 31 4 31 4
5
27 1 5 28 5 28 5
Otro
2 1 9 1 9 1 Nota: Cantidad de salones indica cuántas clases cuentan para cada categoría de tamaño (un rango de cantidad total de alumnos por clase). Orientadores Académicos y Otro Personal Auxiliar (año escolar 2015-16)
Cargo Cantidad de FTE Asignados a la Escuela
Cantidad Promedio de Alumnos por Orientador Académico
Orientador académico 0 0 Consejero (social/conductual o desarrollo profesional) .3 N/A Maestro/a de medios bibliotecarios (bibliotecario) 0 N/A Personal de servicios bibliotecarios (para-profesional) 0 N/A Psicólogo/a-------- .5 N/A Trabajador/a social 0 N/A Enfermera/o-------- .25 N/A Especialista en problemas de audición/lenguaje/habla 1 N/A Especialista de recursos 0 N/A Otro-------- 0 N/A
Nota: Cajas con N/A no requieren datos. Un equivalente de tiempo complete (FTE, por sus siglas en inglés) equivale a un miembro del personal de tiempo completo, un FTE también puede representar a dos miembros del personal, donde cada uno trabaja el 50 por ciento de tiempo completo Gastos por Alumno y Sueldos de los Maestros por Plantel (año fiscal 2014-15)
Nivel Gastos por Alumno Sueldo
Promedio Docente Total Suplementario/
Limitado Básico/
Ilimitado Sitio escolar 7,405.62 2,147.90 5,257.72 69,471.88 Distrito---- N/A N/A 5,462.98 $80,383 Diferencia porcentual: escuela y distrito N/A N/A -3.8 -6.0 Estado---- N/A N/A $5,677 $75,137 Diferencia porcentual: escuela y estado N/A N/A -1.7 -4.8
Nota: Cajas con N/A no requieren datos. Tipos de Servicios Financiados (año fiscal 2015-16)
Además de los fondos generales de estado proporcionado por la Fórmula de Financiamiento de Control Local, el Distrito Escolar de East Whittier City recibió fondos categóricos del estado y la federación (Título I)
Informe de Responsabilidad Escolar del 2015-16 para Escuela Primaria Ocean View Página 12 de 12
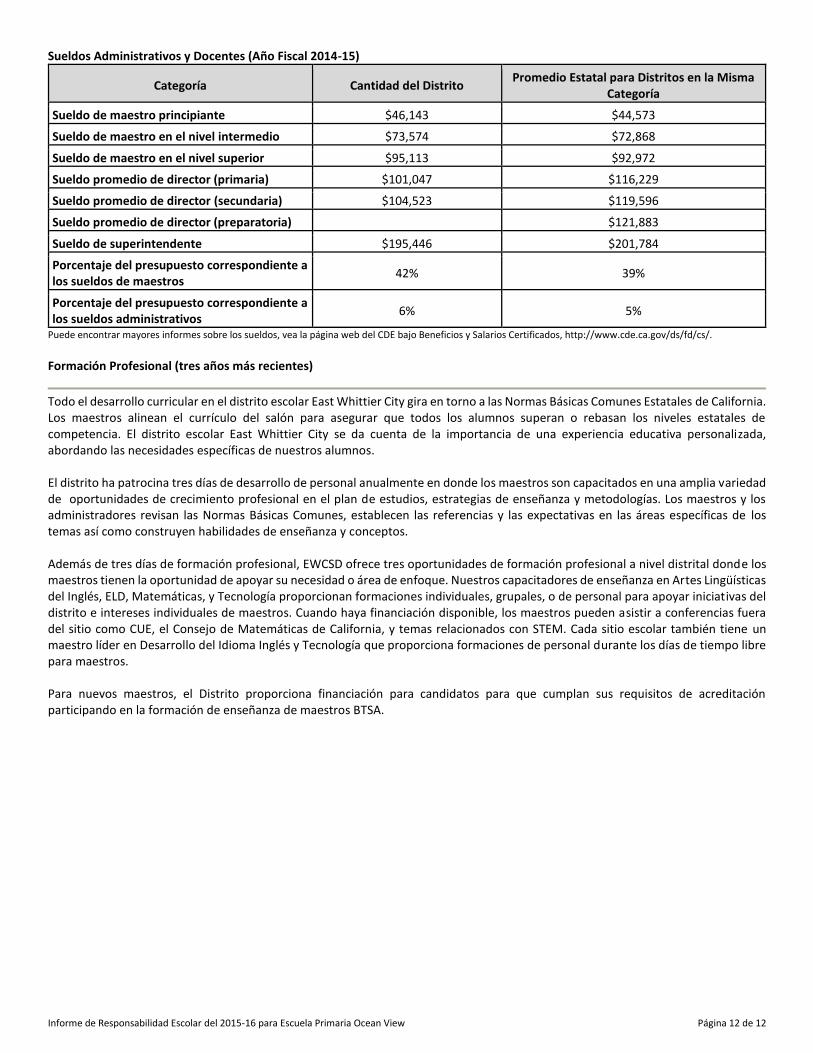
Sueldos Administrativos y Docentes (Año Fiscal 2014-15)
Categoría Cantidad del Distrito Promedio Estatal para Distritos en la Misma Categoría
Sueldo de maestro principiante $46,143 $44,573
Sueldo de maestro en el nivel intermedio $73,574 $72,868
Sueldo de maestro en el nivel superior $95,113 $92,972
Sueldo promedio de director (primaria) $101,047 $116,229
Sueldo promedio de director (secundaria) $104,523 $119,596
Sueldo promedio de director (preparatoria) $121,883
Sueldo de superintendente $195,446 $201,784
Porcentaje del presupuesto correspondiente a los sueldos de maestros
42% 39%
Porcentaje del presupuesto correspondiente a los sueldos administrativos
6% 5%
Puede encontrar mayores informes sobre los sueldos, vea la página web del CDE bajo Beneficios y Salarios Certificados, http://www.cde.ca.gov/ds/fd/cs/. Formación Profesional (tres años más recientes)
Todo el desarrollo curricular en el distrito escolar East Whittier City gira en torno a las Normas Básicas Comunes Estatales de California. Los maestros alinean el currículo del salón para asegurar que todos los alumnos superan o rebasan los niveles estatales de competencia. El distrito escolar East Whittier City se da cuenta de la importancia de una experiencia educativa personalizada, abordando las necesidades específicas de nuestros alumnos. El distrito ha patrocina tres días de desarrollo de personal anualmente en donde los maestros son capacitados en una amplia variedad de oportunidades de crecimiento profesional en el plan de estudios, estrategias de enseñanza y metodologías. Los maestros y los administradores revisan las Normas Básicas Comunes, establecen las referencias y las expectativas en las áreas específicas de los temas así como construyen habilidades de enseñanza y conceptos. Además de tres días de formación profesional, EWCSD ofrece tres oportunidades de formación profesional a nivel distrital donde los maestros tienen la oportunidad de apoyar su necesidad o área de enfoque. Nuestros capacitadores de enseñanza en Artes Lingüísticas del Inglés, ELD, Matemáticas, y Tecnología proporcionan formaciones individuales, grupales, o de personal para apoyar iniciativas del distrito e intereses individuales de maestros. Cuando haya financiación disponible, los maestros pueden asistir a conferencias fuera del sitio como CUE, el Consejo de Matemáticas de California, y temas relacionados con STEM. Cada sitio escolar también tiene un maestro líder en Desarrollo del Idioma Inglés y Tecnología que proporciona formaciones de personal durante los días de tiempo libre para maestros. Para nuevos maestros, el Distrito proporciona financiación para candidatos para que cumplan sus requisitos de acreditación participando en la formación de enseñanza de maestros BTSA.