Embed Size (px)
Citation preview
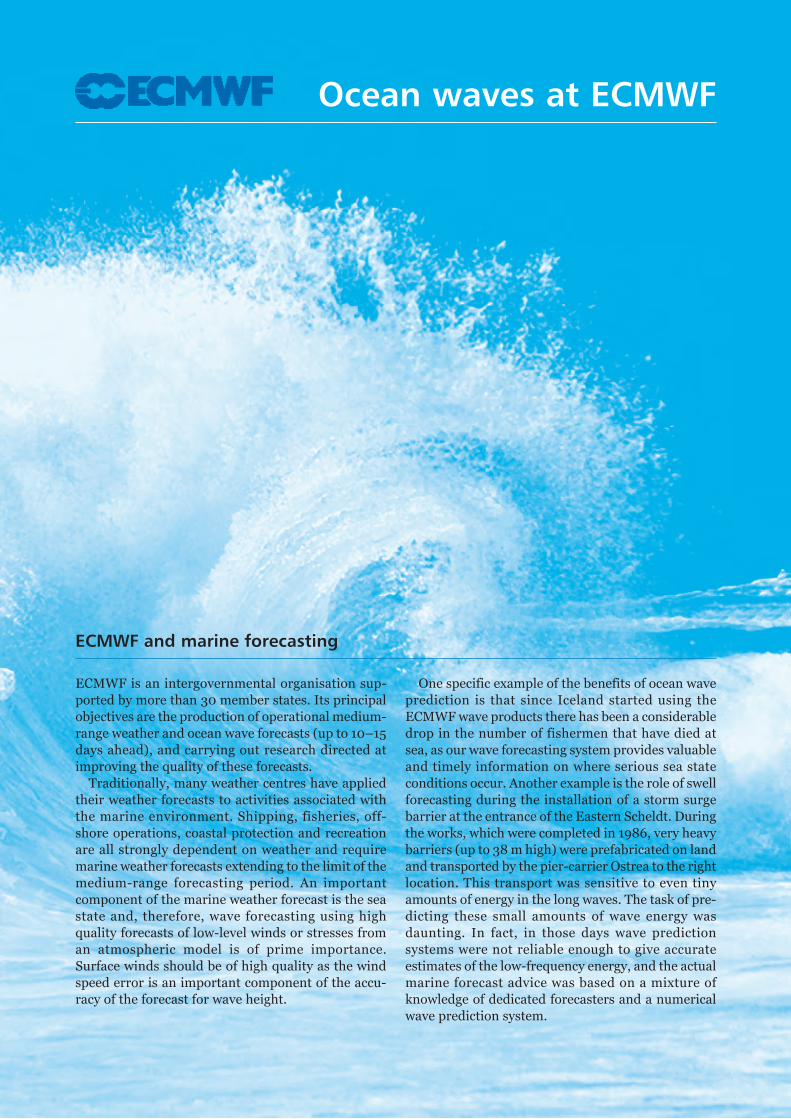
Ocean waves at ECMWF
ECMWF and marine forecasting
One specific example of the benefits of ocean wave
prediction is that since Iceland started using the
ECMWF wave products there has been a considerable
drop in the number of fishermen that have died at
sea, as our wave forecasting system provides valuable
and timely information on where serious sea state
conditions occur. Another example is the role of swell
forecasting during the installation of a storm surge
barrier at the entrance of the Eastern Scheldt. During
the works, which were completed in 1986, very heavy
barriers (up to 38 m high) were prefabricated on land
and transported by the pier-carrier Ostrea to the right
location. This transport was sensitive to even tiny
amounts of energy in the long waves. The task of pre-
dicting these small amounts of wave energy was
daunting. In fact, in those days wave prediction
systems were not reliable enough to give accurate
estimates of the low-frequency energy, and the actual
marine forecast advice was based on a mixture of
knowledge of dedicated forecasters and a numerical
wave prediction system.
ECMWF is an intergovernmental organisation sup-
ported by more than 30 member states. Its principal
objectives are the production of operational medium-
range weather and ocean wave forecasts (up to 10–15
days ahead), and carrying out research directed at
improving the quality of these forecasts.
Traditionally, many weather centres have applied
their weather forecasts to activities associated with
the marine environment. Ship ping, fisheries, off-
shore operations, coastal protection and recreation
are all strongly dependent on weather and require
marine weather forecasts extending to the limit of the
medium-range forecasting period. An important
component of the marine weather forecast is the sea
state and, therefore, wave forecasting using high
quality forecasts of low-level winds or stresses from
an atmospheric model is of prime importance.
Surface winds should be of high quality as the wind
speed error is an important component of the accu-
racy of the forecast for wave height.
Brief history
ECMWF METOFFNMOC NCEP METFRDWD AUSBM JMA
0 1 2 3 4 5 0 1 2 3 4 5Forecast range (days) – forecasts from 00 and 12 UTC
0
0.1
0.2
0.3
0.4
0.5
0.6
0.7
0.8
0.9
1
RMSE
(m)
Significant wave height root mean square error at all buoys
Forecast range (days) – forecasts from 00 and 12 UTC
0
0.4
0.8
1.2
1.6
2
2.4
2.8
3.2
3.6
4
RMSE
(m/s
)
10m wind speed root mean square error at all buoys
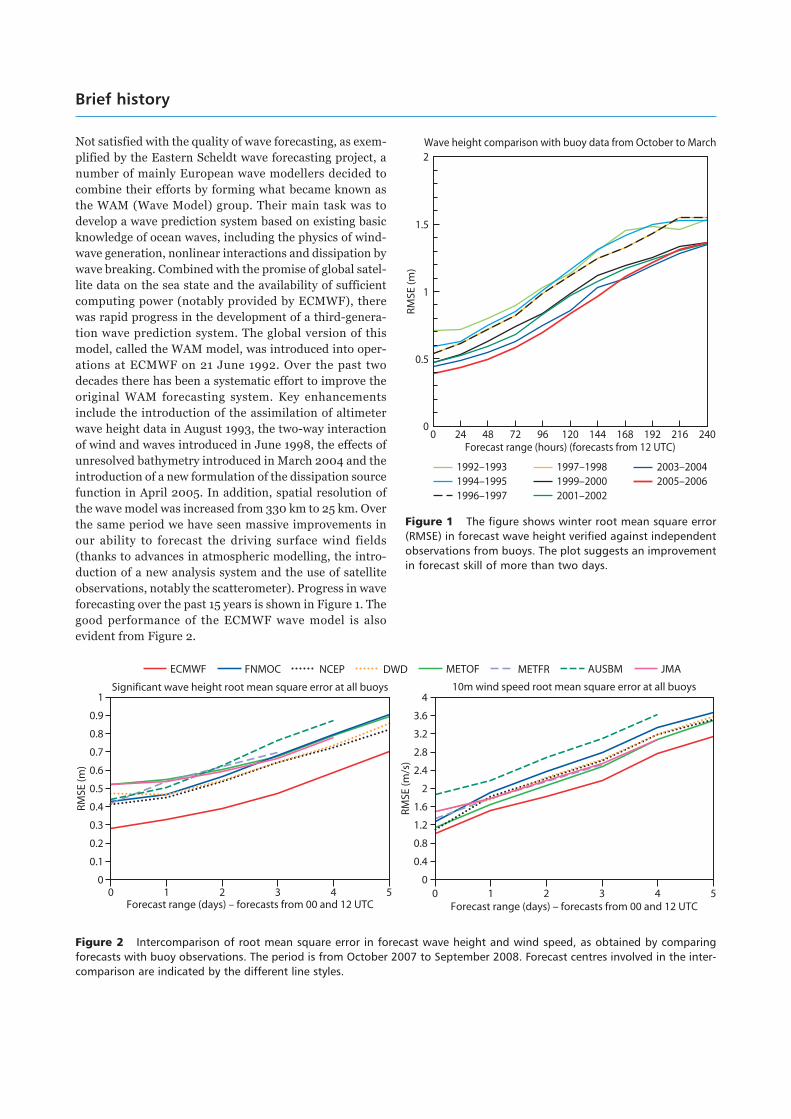
Figure 2 Intercomparison of root mean square error in forecast wave height and wind speed, as obtained by comparingforecasts with buoy observations. The period is from October 2007 to September 2008. Forecast centres involved in the inter-comparison are indicated by the different line styles.
Not satisfied with the quality of wave forecasting, as exem-
plified by the Eastern Scheldt wave forecasting project, a
number of mainly European wave modellers decided to
combine their efforts by forming what became known as
the WAM (Wave Model) group. Their main task was to
develop a wave prediction system based on existing basic
knowledge of ocean waves, including the physics of wind-
wave generation, nonlinear interactions and dissipation by
wave breaking. Combined with the promise of global satel-
lite data on the sea state and the availability of sufficient
computing power (notably provided by ECMWF), there
was rapid progress in the development of a third-genera-
tion wave prediction system. The global version of this
model, called the WAM model, was introduced into oper-
ations at ECMWF on 21 June 1992. Over the past two
decades there has been a systematic effort to improve the
original WAM forecasting system. Key enhancements
include the introduction of the assimilation of altimeter
wave height data in August 1993, the two-way interaction
of wind and waves introduced in June 1998, the effects of
unresolved bathymetry introduced in March 2004 and the
introduction of a new formulation of the dissipation source
function in April 2005. In addition, spatial resolution of
the wave model was increased from 330 km to 25 km. Over
the same period we have seen massive improvements in
our ability to forecast the driving surface wind fields
(thanks to advances in atmospheric modelling, the intro-
duction of a new analysis system and the use of satellite
observations, notably the scatterometer). Progress in wave
forecasting over the past 15 years is shown in Figure 1. The
good performance of the ECMWF wave model is also
evident from Figure 2.
0 48 120967224 144 168 192 216 240Forecast range (hours) (forecasts from 12 UTC)
0.5
0
2
1
1.5
RMSE
(m)
1992–19931994–19951996–1997
1997–19981999–20002001–2002
2003–20042005–2006
Wave height comparison with buoy data from October to March
Figure 1 The figure shows winter root mean square error(RMSE) in forecast wave height verified against independentobservations from buoys. The plot suggests an improvementin forecast skill of more than two days.
50°N
0° 0
4
8
12
16
20
24
20
16
12 8 4
Extreme wave forecasting
One of the remits of ECMWF is to provide forecast guid-
ance for extreme events. In the context of marine weather
this means that we have to be able to give an accurate pre-
diction of wind speed and wave height when there is a big
storm over the oceans. A considerable amount of effort in
the past 15 years has been devoted to achieving high accu-
racy for such events.
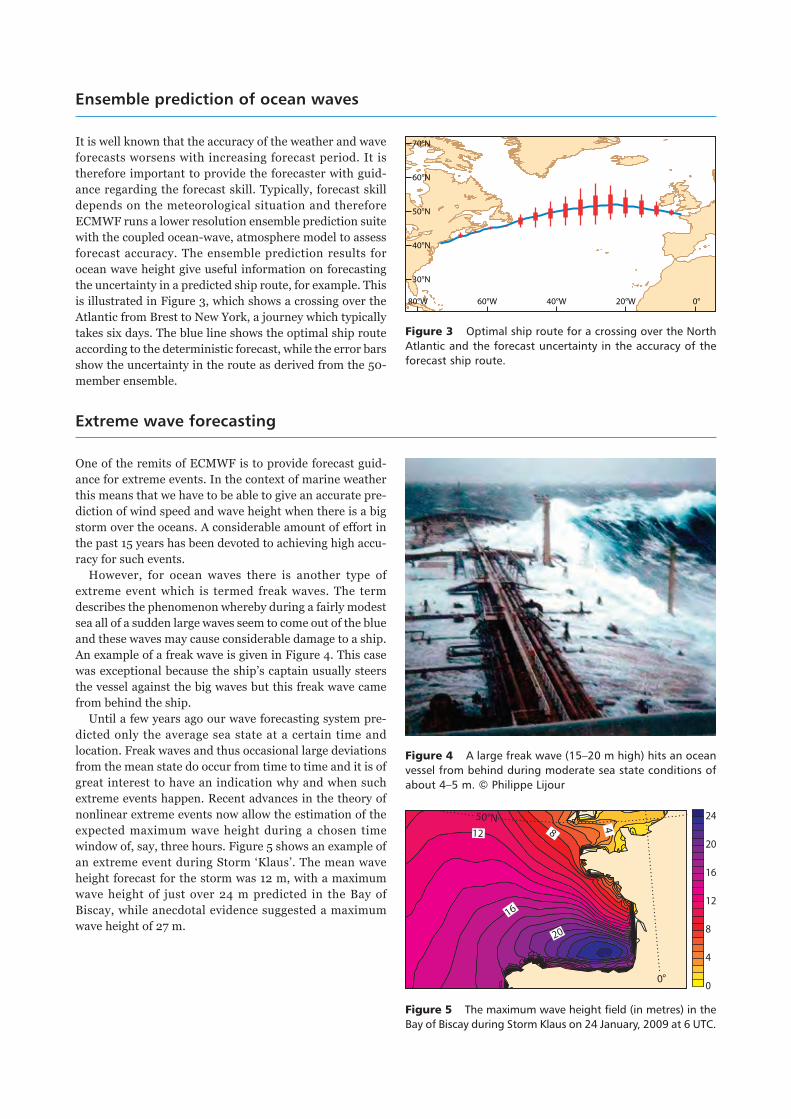
However, for ocean waves there is another type of
extreme event which is termed freak waves. The term
describes the phenomenon whereby during a fairly modest
sea all of a sudden large waves seem to come out of the blue
and these waves may cause considerable damage to a ship.
An example of a freak wave is given in Figure 4. This case
was exceptional because the ship’s captain usually steers
the vessel against the big waves but this freak wave came
from behind the ship.
Until a few years ago our wave forecasting system pre-
dicted only the average sea state at a certain time and
location. Freak waves and thus occasional large deviations
from the mean state do occur from time to time and it is of
great interest to have an indication why and when such
extreme events happen. Recent advances in the theory of
nonlinear extreme events now allow the estimation of the
expected maximum wave height during a chosen time
window of, say, three hours. Figure 5 shows an example of
an extreme event during Storm ‘Klaus’. The mean wave
height forecast for the storm was 12 m, with a maximum
wave height of just over 24 m predicted in the Bay of
Biscay, while anecdotal evidence suggested a maximum
wave height of 27 m.
Figure 4 A large freak wave (15–20 m high) hits an oceanvessel from behind during moderate sea state conditions ofabout 4–5 m. © Philippe Lijour
Figure 5 The maximum wave height field (in metres) in theBay of Biscay during Storm Klaus on 24 January, 2009 at 6 UTC.
Ensemble prediction of ocean waves
30°N
40°N
50°N
60°N
70°N
80°W 60°W 40°W 20°W 0°
It is well known that the accuracy of the weather and wave
forecasts worsens with increasing forecast period. It is
therefore important to provide the forecaster with guid-
ance regarding the forecast skill. Typically, forecast skill
depends on the meteorological situation and therefore
ECMWF runs a lower resolution ensemble prediction suite
with the coupled ocean-wave, atmosphere model to assess
forecast accuracy. The ensemble prediction results for
ocean wave height give useful information on forecasting
the uncertainty in a predicted ship route, for example. This
is illustrated in Figure 3, which shows a crossing over the
Atlantic from Brest to New York, a journey which typically
takes six days. The blue line shows the optimal ship route
according to the deterministic forecast, while the error bars
show the uncertainty in the route as derived from the 50-
member ensemble.
Figure 3 Optimal ship route for a crossing over the NorthAtlantic and the forecast uncertainty in the accuracy of theforecast ship route.
Outlook
A considerable amount of progress in wave modelling has
been achieved in the past 20 years or so and there are
definite reasons for further development. They derive, as
they should, from a number of applications in which the
wave spectrum plays an important role. Just recently we
have seen rapid progress in the understanding of the
mechanisms behind the generation of extreme sea states
such as freak waves. Prediction of the maximum wave
height of extreme events is of tremendous benefit to the
marine world, but clearly an accurate prediction of the
detailed low frequency part of the wave spectrum is of
utmost importance. Although there is already evidence of
this capability of wind-wave forecasting systems it is
nevertheless expected that further improvements may be
required.
On the other hand, knowledge of the high-frequency part
of the wave spectrum is important in all remote sensing
applications that depend to some extent on properties of
the sea surface. These include instruments such as the
altimeter, the scatterometer, SSM/I, and ATOVS, in short,
any instrument that involves aspects of specular reflection.
In fact, the ocean surface albedo depends in a straightfor-
ward manner on properties of the slope spectrum. Also,
knowledge of the high-frequency spectrum is important in
order to determine the air-sea momentum exchange, and
as a consequence it is also important for the exchange of
passive scalars such as carbon dioxide. Progress in this
area, and the prospects of modelling the impact of ocean
waves on ocean circulation promise very exciting times
ahead in the field of ocean waves.
Wave forecasting and satellite observations
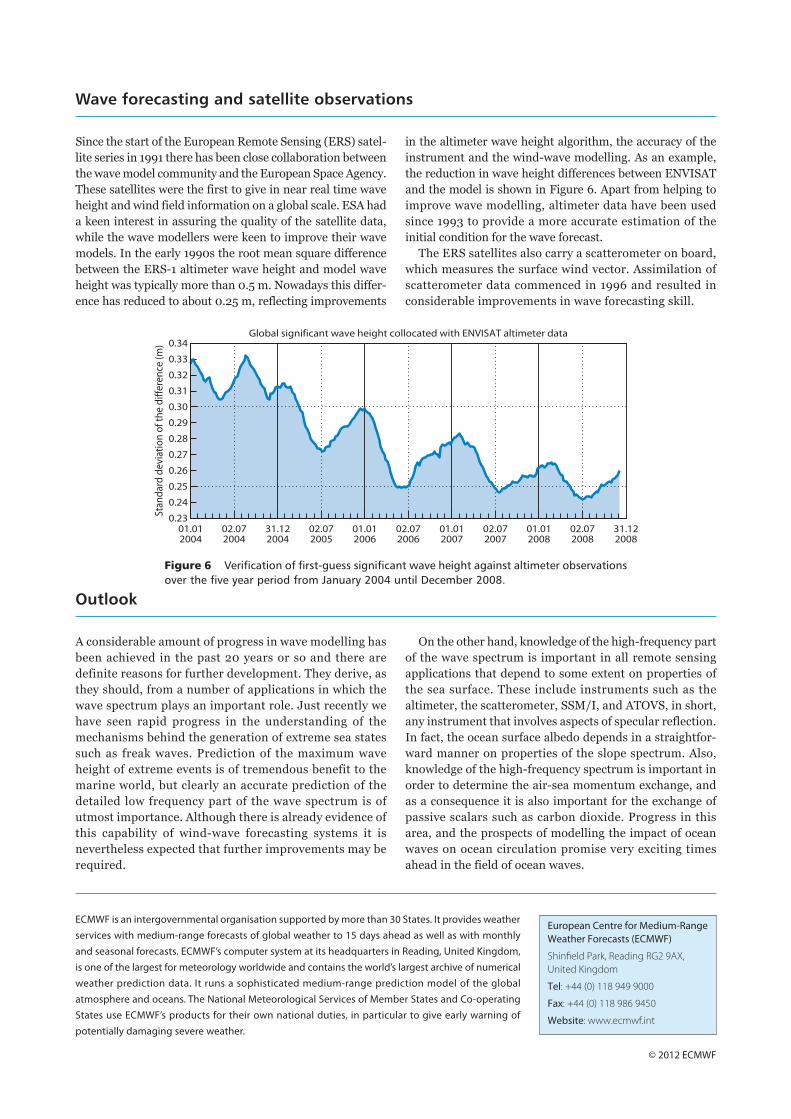
Since the start of the European Remote Sensing (ERS) satel-
lite series in 1991 there has been close collaboration between
the wave model community and the European Space Agency.
These satellites were the first to give in near real time wave
height and wind field information on a global scale. ESA had
a keen interest in assuring the quality of the satellite data,
while the wave modellers were keen to improve their wave
models. In the early 1990s the root mean square difference
between the ERS-1 altimeter wave height and model wave
height was typically more than 0.5 m. Nowadays this differ-
ence has reduced to about 0.25 m, reflecting improvements
in the altimeter wave height algorithm, the accuracy of the
instrument and the wind-wave modelling. As an example,
the reduction in wave height differences between ENVISAT
and the model is shown in Figure 6. Apart from helping to
improve wave modelling, altimeter data have been used
since 1993 to provide a more accurate estimation of the
initial condition for the wave forecast.
The ERS satellites also carry a scatterometer on board,
which measures the surface wind vector. Assimilation of
scatterometer data commenced in 1996 and resulted in
considerable improvements in wave forecasting skill.
01.012004
02.072004
31.122004
02.072005
01.012006
02.072006
01.012007
02.072007
01.012008
02.072008
31.122008
0.25
0.27
0.29
0.24
0.26
0.28
0.31
0.33
0.32
0.23
0.30
0.34
Stan
dard
dev
iatio
n of
the
diff
eren
ce (m
)
Global significant wave height collocated with ENVISAT altimeter data
Figure 6 Verification of first-guess significant wave height against altimeter observationsover the five year period from January 2004 until December 2008.
ECMWF is an intergovernmental organisation supported by more than 30 States. It provides weatherservices with medium-range forecasts of global weather to 15 days ahead as well as with monthlyand seasonal forecasts. ECMWF’s computer system at its headquarters in Reading, United Kingdom,is one of the largest for meteorology worldwide and contains the world’s largest archive of numericalweather prediction data. It runs a sophisticated medium-range prediction model of the globalatmosphere and oceans. The National Meteorological Services of Member States and Co-operatingStates use ECMWF’s products for their own national duties, in particular to give early warning ofpotentially damaging severe weather.
European Centre for Medium-RangeWeather Forecasts (ECMWF)
Shinfield Park, Reading RG2 9AX,United Kingdom
Tel: +44 (0) 118 949 9000
Fax: +44 (0) 118 986 9450
Website: www.ecmwf.int
© 2012 ECMWF