Embed Size (px)
Citation preview
Oceanic Applications of Laser Induced BreakdownSpectroscopy: Laboratory Validation
Anna PM Michel∗, Marion J. Lawrence-Snyder†, S. Michael Angel†, and Alan D. Chave‡∗Massachusetts Institute of Technology / Woods Hole Oceanographic Institution Joint Program
Department of Applied Ocean Physics and EngineeringWoods Hole, Massachusetts 02543
Email: [email protected], Telephone: (508) 289–2429, Fax: (508) 457–2006†Department of Chemistry and Biochemistry
University of South CarolinaColumbia, South Carolina 29208
‡Department of Applied Ocean Physics and EngineeringWoods Hole Oceanographic Institution
Woods Hole, Massachusetts 02543
Abstract— New chemical sensors are needed for both presentday expeditionary oceanography and an emerging new phaseinvolving long term in situ ocean observations. Over the pastfour decades, a new spectrochemical technique, Laser InducedBreakdown Spectroscopy (LIBS), has been under developmentfor the identification of the elemental constituents of materials.This technique uses a laser to create a spark or plasma on asample. The plasma emission is then analyzed with a spectrom-eter to determine its elemental composition. Recently, LIBS hasbeen identified as a viable tool for in situ field measurementsbecause it is able to analyze all forms of matter (solids, liquids,and gases), can operate in a stand-off mode, and is non-invasiveand non-destructive. A marine LIBS sensor would be a usefultool for studying many environments in the ocean, especially mid-ocean ridge hydrothermal vents where in situ measurements aredifficult due to the presence of high-temperature, corrosive fluids.A feasibility assessment of oceanic LIBS in the laboratory hasbeen initiated. A high pressure chamber was designed and builtfor investigating the effect of realistic ocean environments on theLIBS signal. Preliminary work shows that LIBS can successfullydetect Li, Na, K, Ca, Mn, and Zn in bulk aqueous solutions atpressures up to 272 atm, making LIBS a viable technique fordeep ocean chemical sensing.
I. INTRODUCTION
In recent ocean science workshops, the development of insitu chemical sensors was identified as a major priority forunderstanding the ocean [1]. This is especially important sincea new paradigm for study is beginning with the implementationof ocean observatories. As these facilities become the mode offuture ocean study, sensors capable of long deployments willbe essential. The goal of the present work is the developmentof a new chemical sensor capable of obtaining real-timeanalytical data in the ocean.
Since it was reported in the literature in 1962, laser-inducedbreakdown spectroscopy (LIBS) has been under developmentas a laboratory technique and has recently been identified as aviable tool for real-time in situ geochemical and environmentalfield work and for work in extreme and hostile environments[2]–[11]. LIBS has been used in a variety of areas including theanalysis of rocks, archaeological artifacts, and paint. Several
field portable systems have been developed, for example, fordetecting heavy metals in soils [5], [12], and other effortsare focused on designing systems for geochemical analysison Mars and Venus [13]–[17].
The LIBS technique yields simultaneous sensitivity to vir-tually all elements in the parts-per-million (ppm) or betterrange in solids, liquids, gases, and aerosols. LIBS is effectivelynon-invasive and non-destructive (typically only pg to ng ofmaterial are ablated) and requires no sample preparation. LIBScan be used in a stand-off mode without perturbing the targetand it requires only optical access to a sample. LIBS isessentially a real-time measurement, requiring <1s per cycle.Unlike many techniques that require collection of a samplefollowed by its transport to a laboratory, LIBS measurementscan be made directly in the field. These characteristics arethose required for in situ chemical sensing in the ocean [1],[18]–[21].
LIBS is a promising in situ technique for oceanographyand will have extensive applications in chemical, geological,and biological oceanography ranging from laboratory experi-mentation to fieldwork. LIBS could be used to determine thecomposition of sediments, rocks, or seawater and for studyingenvironmental issues. To determine the feasibility of oceanicLIBS, we have focused on the detection of elements foundin one extreme and hostile ocean environment, hydrothermalvent systems. Taking measurements directly in vent fluid isespecially challenging due to extremes of temperature and itscorrosive nature. The use of an indirect method like LIBSmay enable an understanding of the chemistry of vents, andespecially its temporal variability, that has thus far beendifficult to achieve.
II. LASER INDUCED BREAKDOWN SPECTROSCOPY
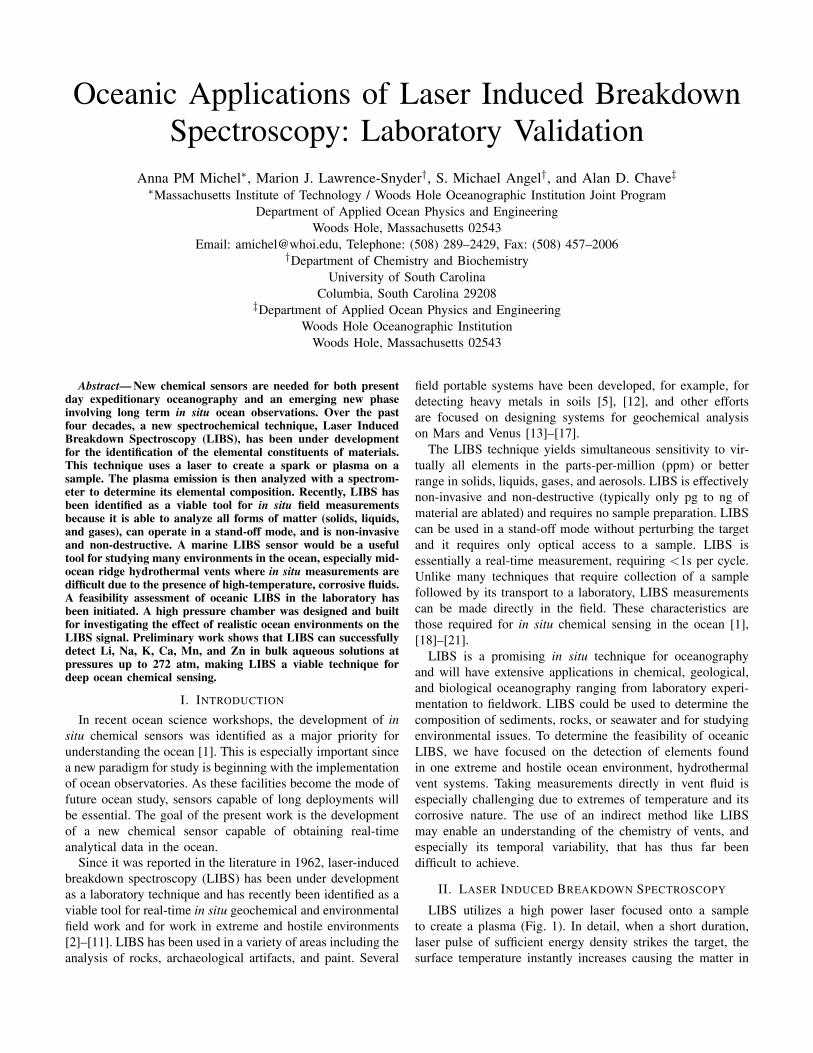
LIBS utilizes a high power laser focused onto a sampleto create a plasma (Fig. 1). In detail, when a short duration,laser pulse of sufficient energy density strikes the target, thesurface temperature instantly increases causing the matter in
High PressurePump
Nd:YAG Laser 11064 nm or 532 nm
Nd:YAG Laser 21064 nm or 532 nm
Timing Generator
Spectrograph
ICCD
Fiber Optic
Valve
Sample Chamber
1) Solution is pressurized in the sample chamber.2) High power laser(s) is focused using optics into sample chamber. If 2 lasers are used, the timing between their pulses is controlled by a timing generator.
*3) A spark or plasma is formed in the solution
4) The light emitted by the plasma is focused onto a fiber optic which transmits the collected light
5) A spectrograph separates the emitted light into wavelengths. All elements emit at different wavelengths.
6) An intensified charge-coupled device detects the spectrally resolved signal.
7) A computer is used for data collection.
Computer
Fig. 1. Experimental set-up for laser induced breakdown spectroscopy studiesof liquids in a pressurized chamber.
the spark to be vaporized, reduced to its atomic species,and then electronically excited [22]. Emission lines at dis-crete wavelengths that characterize the elements present arethen resolved spectrally and temporally with a spectrometercovering part or all of the ultraviolet through near infraredrange (200-1000 nm wavelength). A CCD (charge coupleddevice) or ICCD (intensified charge coupled device) servesas the detection device within the spectrometer. Each elementemits at different wavelengths and therefore by examining aspectrum, the elements contained within a material can beidentified from the spectral peaks present. The peak intensitiesprovide a quantitative description of the material [10], [23].
Some researchers have successfully created plasma abla-tions on materials submerged in water and on liquid surfaces;yet, few researchers have attempted plasma ablation withinbulk aqueous solutions [24]–[41]. LIBS is capable of iden-tifying Li, Na, K, Rb, Cs, Be, Ca, B, and Al in aqueoussolutions with varying detection limits, but typically at theppm level [24]. This work also showed that by using two laserpulses, separated by a short time delay, the detection limitfor dissolved species could be improved. The first laser pulsecreates a cavitation bubble and a second pulse is fired intothe bubble, forming a plasma within the gaseous environment.LIBS studies have shown that plasma emission is quenchedin a liquid environment, resulting in a reduction in bothplasma light intensity and the length of time during whichplasma emission can be observed. Liquid LIBS also displaysa broadening of spectral peaks [24], [32], [35], [42].
In the development of a LIBS sensor for use at hydrothermalvents, the effect of both pressure and temperature on theLIBS signal must be quantified. A few papers have reportedusing LIBS in higher than atmospheric pressure environments;yet, the pressures used were less than 100 atm, well belowthe ambient pressures in the deep ocean [16], [43]. Moltenmaterials have been analyzed with LIBS, demonstrating thefeasibility of using the technique under high temperatureconditions [44]–[47].
III. SCIENTIFIC APPLICATION: HYDROTHERMAL VENT
CHEMISTRY
Hydrothermal venting occurs on mid-ocean ridges whereseawater circulates through the fractured and permeable crust.Exit temperatures at high temperature vents range from 200- 405oC at ambient pressures of 147 - 361 atm. Substantialchanges in fluid composition occur due to interaction with thehost rock, phase separation, and possibly magma degassing.For example, many alkalis (e.g., Li, Na, and Ca) and transitionmetals (e.g., Fe, Mn, Cu, and Zn) are leached from the hostrock and concentrated to varying degrees in the fluid, while Mgand SO4 are largely removed from the fluid. Cooling due tomixing with seawater occurs above the seafloor causing addi-tional changes to the fluid chemistry [48]. Von Damm [49] andButterfield et al. [50] review the chemistry of hydrothermalvent fluids.
The elements that have been selected to be a focus ofour work are important for understanding vent chemistry (Li,Na, K, Mg, Ca, Mn, Fe, Cu, Zn, Si, Cl and Br). Using asubset of these elements, we investigated the effect of theenvironmental conditions found at vent systems on the LIBSsignal; more specifically, we examined the effect of highpressure, temperature, and NaCl concentration. In addition,the effect of laser pulse energy on analyte detection at highpressures was evaluated.
IV. EXPERIMENTAL SET-UP
The laboratory LIBS system was set up to run both single(SP) and dual (DP) laser pulse experiments (Fig. 1). For singlepulse experiments, a Continuum Surelite III laser (7-ns pulse)was used for excitation. For dual pulse experiments, a QuantelNd 580 (9-ns pulse) was used for the first laser pulse followedby a second pulse from the Surelite laser. Both lasers were Q-switched Nd:YAG lasers operated at the 1064 nm fundamentalwavelength with a repetition rate of 5 Hz. For dual pulseexperiments, a variable clock (Stanford Instruments ModelSR250) with a delay generator (Stanford Instruments ModelDG535) controlled the triggering and timing of the lasers.
A high pressure cell, designed to reach pressures of >340atm, was designed and constructed of stainless steel Swagelokfittings with six 1”-ID view ports. Stainless steel tubing (1
8”)connected one port to a pump (Isco Syringe Pump Model260D, Teledyne Technologies Incorporated) which allowedaqueous solutions to be flowed into the cell and for the cell tobe pressurized. A second port was equipped with the sametubing and a regulating valve for cell drainage. Two portswere affixed with sapphire windows (MSW100/125, MellerOptics Incorporated). The remaining two ports were sealedwith Swagelok steel plugs.
Fused silica lenses and dielectric mirrors were used forfocusing the laser pulses into the cell and for focusing theplasma emission onto a collection fiber optic. When dualpulses were used, the laser pulses followed the same opticalpath, making the pulses collinear to each other. All opticswere mounted on micrometer stages allowing precise control

of beam overlap and collection field of view within the highpressure cell.
The plasma emission was measured using one of two differ-ent spectrometer set-ups. The first is a 1960-µ-core-diameter,0.51-N.A. (numerical aperture), light guide (Edmund ScientificCo. Model 02551) connected to a 0.25-m focal length, f/4spectrograph (Chromex, Model 250IS/RF) with a 1200-groovegrating blazed at 500 nm. The data collection system wasan intensified CCD detector (Princeton Instruments, I-Max1024E) with spectra taken using a computer running Win-Spec/32 software. In the alternate configuration, the plasmaemission was focused onto an 800 µ diameter fiber whichwas connected to an Echelle spectra analyzer ESA 3000 (LLAinstruments GmbH), with a 100 µm slitwidth. This spectrom-eter was used for obtaining spectra over a broad wavelengthrange (200 - 780 nm). The spectral resolution ranges from 1.4- 5.4 nm over the 200 - 780 nm spectral range. This systemconsists of an Echelle spectrograph, an ICCD camera, anda control unit containing a computer, the electronics, and awater-cooling system. The detector consists of a CCD-arraycoupled with an MCP-image intensifier (Model 3000 CP). Theinternal shutter is controlled by a Fast-Pulse-Generator board(Model 3000 FP) and a driver board (Model 3000 IS).
The key LIBS timing parameters that must be optimized foranalyte detection are shown in Figure 2 [35], [36]. The firstand second laser pulse energies are referred to as E1 and E2.For dual pulse experiments the timing between the two pulseenergies, the interpulse delay, is referred to as ∆T. The gatedelay, td, is the delay after the laser pulse, or for dual pulseexperiments, after the second laser pulse, before the detectoris turned on. The emission is recorded by the detector for thelength of time set by the gate width, tb.
Sample solutions were made using NaCl, CaCl2, LiCl,MnSO4·H2O, NaBr, ZnBr, and KI dissolved in deionized
Fig. 2. Key timing parameters used in LIBS experiments: E1 = energy oflaser pulse 1 and E2 = energy of laser pulse 2; ∆T = interpulse delay, lengthof time between laser pulses, when dual pulses are used; td = gate delay, thedelay after the laser pulse, or for dual pulse experiments, after the secondlaser pulse, before the detector is turned on; tb = gate width, the length oftime the detector mesasures emission.
water. Where noted, NaCl was added to the solutions tosimulate seawater. All concentrations are listed in parts permillion (ppm) by mass.
V. RESULTS AND DISCUSSION
A. Effect of Pressure on LIBS Signal
In this work, LIBS was successfully used for the detectionof Li, Na, K, Ca, Mn, and Zn at pressures up to 272 atm.LIBS yields reproducible, high quality spectra at these highpressures, and probably beyond, with no major problems fromline broadening or quenching. Figure 3 shows spectra takenat 3 atm and 272 atm obtained with the broadband Echellespectrometer, and shows the simultaneous detection of 1000ppm Ca, Mn, Na, Li, and K. It is important to note thatincreased pressure does not significantly affect the signalintensity and peak width of these analytes.
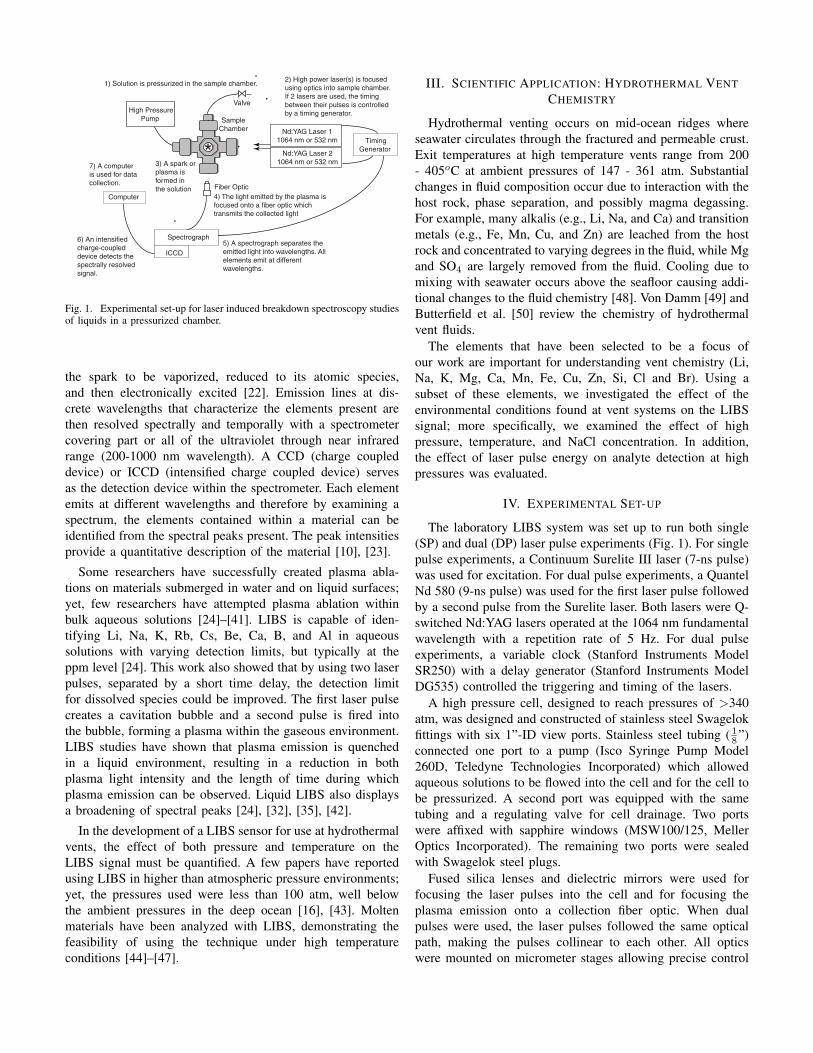
In another study, using a low energy single pulse, thepressure effects on signal intensity for Mn, Ca, and Nawere investigated (Fig. 4). Using the same conditions for allpressures, no effect was seen on the detection of Ca and Na.Increased pressure enhanced the signal intensity of Mn. Thismay have been a result of using the same timing parametersfor all pressures.
The full peak width at half of the maximum intensity(FWHM) was calculated for each analyte and did not change
(a)
(b)
Fig. 3. Spectra of 1,000 ppm Ca, Mn, Na, Li, and K taken with the Echellespectrometer taken at 3 atm and 272 atm. The full broadband spectra is shownin (a) and a smaller wavelength region (390 - 430 nm) is blown-up and shownin (b). The minimal effect of pressure on LIBS spectra is evident.
160
140
120
100
80
60
40
Int
ensi
ty (
a.u.
) x1
03
250200150100500Pressure (atm)
Fig. 4. Effect of pressure on the LIBS signal using low laser pulse energies.Each data point is an average of 10 spectra each with 250 accumulations anderror bars represent ±1σ. 100 ppm Na (©), E1 = 22 mJ; 5,000 ppm Mn in2,540 ppm NaCl (�), E1 = 14 mJ; 500 ppm Ca in 2,540 ppm NaCl (�), E1
= 20 mJ); td = 350 ns; tb = 1 µs, slit width = 75 µm.
1.0
0.8
0.6
0.4
FW
HM
(nm
)
250200150100500Pressure (atm)
Fig. 5. Effect of pressure on the FWHM of the peaks using low laserpulse energies. Each data point is an average of 10 spectra each with 250accumulations and error bars represent ±1σ. (100 ppm Na (©), E1 = 22 mJ;5,000 ppm Mn in 2,540 ppm NaCl (�), E1 = 14 mJ; 500 ppm Ca in 2,540ppm NaCl (�), E1 = 20 mJ); td = 350 ns; tb = 1 µs, slit width = 75 µm.
with increased pressure (Fig. 5). Pressure did not have a dele-terious effect on signal intensity or on peak width; therefore,the significant pressures in the ocean environment should notinhibit the measurement of these analytes.
B. Detection of Analytes Using Single and Dual Pulses andVarious Laser Pulse Energies
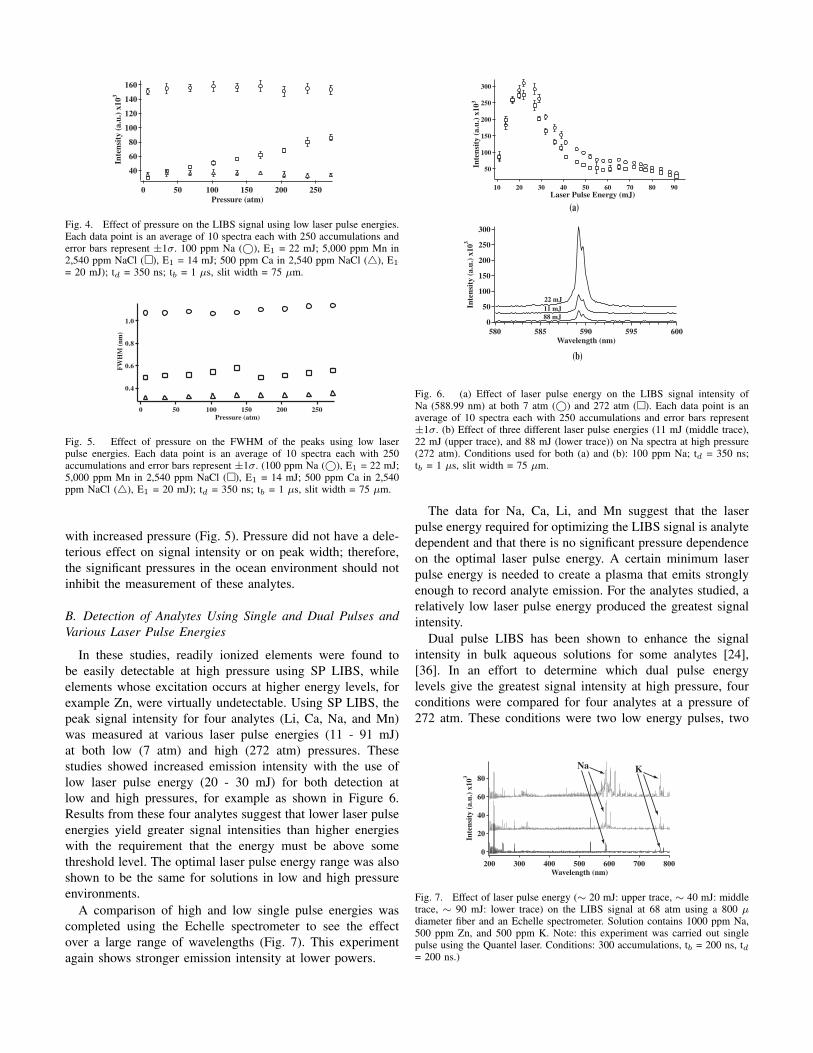
In these studies, readily ionized elements were found tobe easily detectable at high pressure using SP LIBS, whileelements whose excitation occurs at higher energy levels, forexample Zn, were virtually undetectable. Using SP LIBS, thepeak signal intensity for four analytes (Li, Ca, Na, and Mn)was measured at various laser pulse energies (11 - 91 mJ)at both low (7 atm) and high (272 atm) pressures. Thesestudies showed increased emission intensity with the use oflow laser pulse energy (20 - 30 mJ) for both detection atlow and high pressures, for example as shown in Figure 6.Results from these four analytes suggest that lower laser pulseenergies yield greater signal intensities than higher energieswith the requirement that the energy must be above somethreshold level. The optimal laser pulse energy range was alsoshown to be the same for solutions in low and high pressureenvironments.
A comparison of high and low single pulse energies wascompleted using the Echelle spectrometer to see the effectover a large range of wavelengths (Fig. 7). This experimentagain shows stronger emission intensity at lower powers.
300
250
200
150
100
50 Int
ensi
ty (
a.u.
) x1
03
908070605040302010 Laser Pulse Energy (mJ)
300
250
200
150
100
50
0
Inte
nsit
y (a
.u.)
x10
3
600595590585580 Wavelength (nm)
11 mJ22 mJ
88 mJ
(a)
(b)
Fig. 6. (a) Effect of laser pulse energy on the LIBS signal intensity ofNa (588.99 nm) at both 7 atm (©) and 272 atm (�). Each data point is anaverage of 10 spectra each with 250 accumulations and error bars represent±1σ. (b) Effect of three different laser pulse energies (11 mJ (middle trace),22 mJ (upper trace), and 88 mJ (lower trace)) on Na spectra at high pressure(272 atm). Conditions used for both (a) and (b): 100 ppm Na; td = 350 ns;tb = 1 µs, slit width = 75 µm.
The data for Na, Ca, Li, and Mn suggest that the laserpulse energy required for optimizing the LIBS signal is analytedependent and that there is no significant pressure dependenceon the optimal laser pulse energy. A certain minimum laserpulse energy is needed to create a plasma that emits stronglyenough to record analyte emission. For the analytes studied, arelatively low laser pulse energy produced the greatest signalintensity.
Dual pulse LIBS has been shown to enhance the signalintensity in bulk aqueous solutions for some analytes [24],[36]. In an effort to determine which dual pulse energylevels give the greatest signal intensity at high pressure, fourconditions were compared for four analytes at a pressure of272 atm. These conditions were two low energy pulses, two
80
60
40
20
0
Int
ensi
ty (
a.u.
) x1
03
800700600500400300200 Wavelength (nm)
Na K
Fig. 7. Effect of laser pulse energy (∼ 20 mJ: upper trace, ∼ 40 mJ: middletrace, ∼ 90 mJ: lower trace) on the LIBS signal at 68 atm using a 800 µdiameter fiber and an Echelle spectrometer. Solution contains 1000 ppm Na,500 ppm Zn, and 500 ppm K. Note: this experiment was carried out singlepulse using the Quantel laser. Conditions: 300 accumulations, tb = 200 ns, td= 200 ns.)
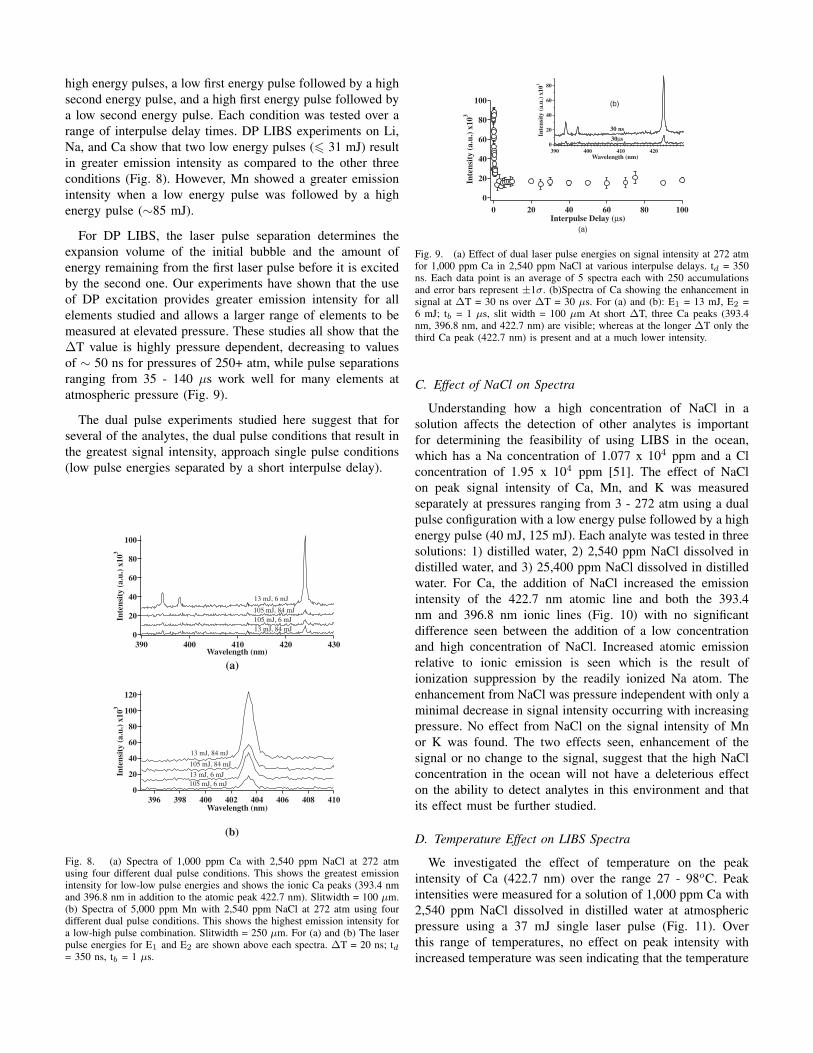
high energy pulses, a low first energy pulse followed by a highsecond energy pulse, and a high first energy pulse followed bya low second energy pulse. Each condition was tested over arange of interpulse delay times. DP LIBS experiments on Li,Na, and Ca show that two low energy pulses (� 31 mJ) resultin greater emission intensity as compared to the other threeconditions (Fig. 8). However, Mn showed a greater emissionintensity when a low energy pulse was followed by a highenergy pulse (∼85 mJ).
For DP LIBS, the laser pulse separation determines theexpansion volume of the initial bubble and the amount ofenergy remaining from the first laser pulse before it is excitedby the second one. Our experiments have shown that the useof DP excitation provides greater emission intensity for allelements studied and allows a larger range of elements to bemeasured at elevated pressure. These studies all show that the∆T value is highly pressure dependent, decreasing to valuesof ∼ 50 ns for pressures of 250+ atm, while pulse separationsranging from 35 - 140 µs work well for many elements atatmospheric pressure (Fig. 9).
The dual pulse experiments studied here suggest that forseveral of the analytes, the dual pulse conditions that result inthe greatest signal intensity, approach single pulse conditions(low pulse energies separated by a short interpulse delay).
100
80
60
40
20
0
Inte
nsit
y (a
.u.)
x10
3
430420410400390Wavelength (nm)
13 mJ, 6 mJ
105 mJ, 84 mJ105 mJ, 6 mJ13 mJ, 84 mJ
120
100
80
60
40
20
0
Inte
nsit
y (a
.u.)
x10
3
410408406404402400398396Wavelength (nm)
13 mJ, 84 mJ
105 mJ, 84 mJ
13 mJ, 6 mJ105 mJ, 6 mJ
(a)
(b)
Fig. 8. (a) Spectra of 1,000 ppm Ca with 2,540 ppm NaCl at 272 atmusing four different dual pulse conditions. This shows the greatest emissionintensity for low-low pulse energies and shows the ionic Ca peaks (393.4 nmand 396.8 nm in addition to the atomic peak 422.7 nm). Slitwidth = 100 µm.(b) Spectra of 5,000 ppm Mn with 2,540 ppm NaCl at 272 atm using fourdifferent dual pulse conditions. This shows the highest emission intensity fora low-high pulse combination. Slitwidth = 250 µm. For (a) and (b) The laserpulse energies for E1 and E2 are shown above each spectra. ∆T = 20 ns; td= 350 ns, tb = 1 µs.
100
80
60
40
20
0
Int
ensi
ty (
a.u.
) x1
03
100806040200Interpulse Delay (µs)
80
60
40
20
0
Int
ensi
ty (
a.u.
) x1
03
420410400390 Wavelength (nm)
30 ns
30 µs
(a)
(b)
Fig. 9. (a) Effect of dual laser pulse energies on signal intensity at 272 atmfor 1,000 ppm Ca in 2,540 ppm NaCl at various interpulse delays. td = 350ns. Each data point is an average of 5 spectra each with 250 accumulationsand error bars represent ±1σ. (b)Spectra of Ca showing the enhancement insignal at ∆T = 30 ns over ∆T = 30 µs. For (a) and (b): E1 = 13 mJ, E2 =6 mJ; tb = 1 µs, slit width = 100 µm At short ∆T, three Ca peaks (393.4nm, 396.8 nm, and 422.7 nm) are visible; whereas at the longer ∆T only thethird Ca peak (422.7 nm) is present and at a much lower intensity.
C. Effect of NaCl on Spectra
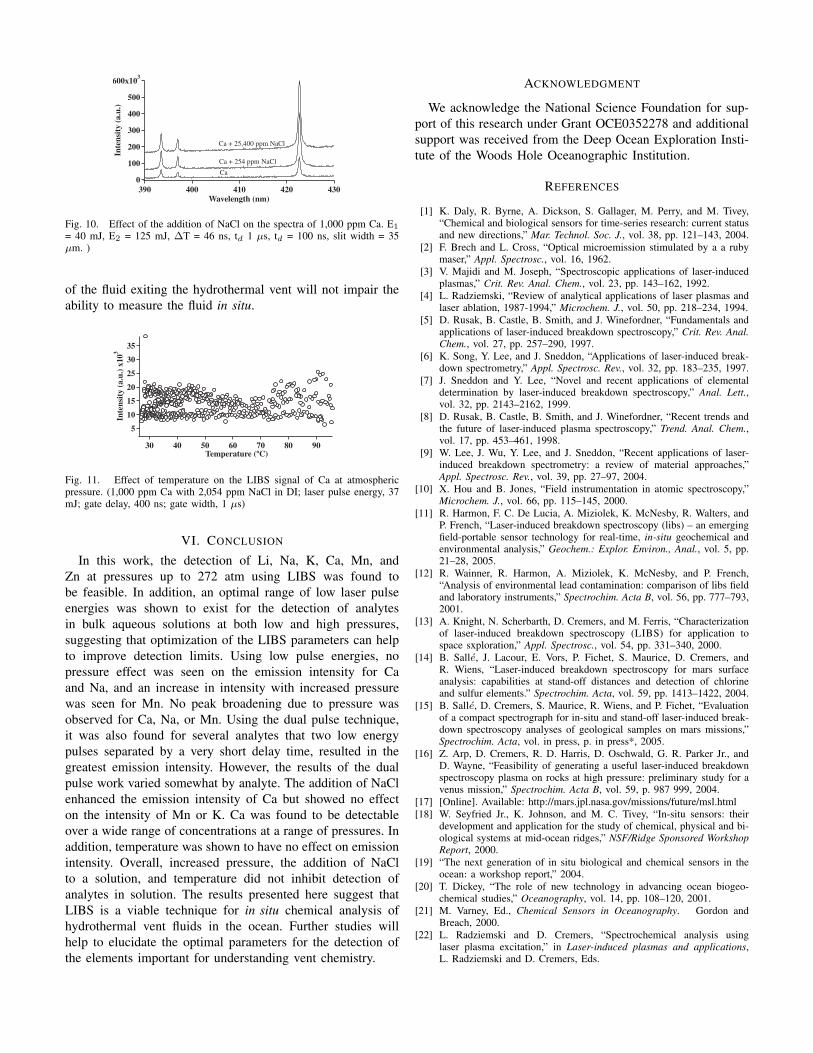
Understanding how a high concentration of NaCl in asolution affects the detection of other analytes is importantfor determining the feasibility of using LIBS in the ocean,which has a Na concentration of 1.077 x 10⁴ ppm and a Clconcentration of 1.95 x 10⁴ ppm [51]. The effect of NaClon peak signal intensity of Ca, Mn, and K was measuredseparately at pressures ranging from 3 - 272 atm using a dualpulse configuration with a low energy pulse followed by a highenergy pulse (40 mJ, 125 mJ). Each analyte was tested in threesolutions: 1) distilled water, 2) 2,540 ppm NaCl dissolved indistilled water, and 3) 25,400 ppm NaCl dissolved in distilledwater. For Ca, the addition of NaCl increased the emissionintensity of the 422.7 nm atomic line and both the 393.4nm and 396.8 nm ionic lines (Fig. 10) with no significantdifference seen between the addition of a low concentrationand high concentration of NaCl. Increased atomic emissionrelative to ionic emission is seen which is the result ofionization suppression by the readily ionized Na atom. Theenhancement from NaCl was pressure independent with only aminimal decrease in signal intensity occurring with increasingpressure. No effect from NaCl on the signal intensity of Mnor K was found. The two effects seen, enhancement of thesignal or no change to the signal, suggest that the high NaClconcentration in the ocean will not have a deleterious effecton the ability to detect analytes in this environment and thatits effect must be further studied.
D. Temperature Effect on LIBS Spectra
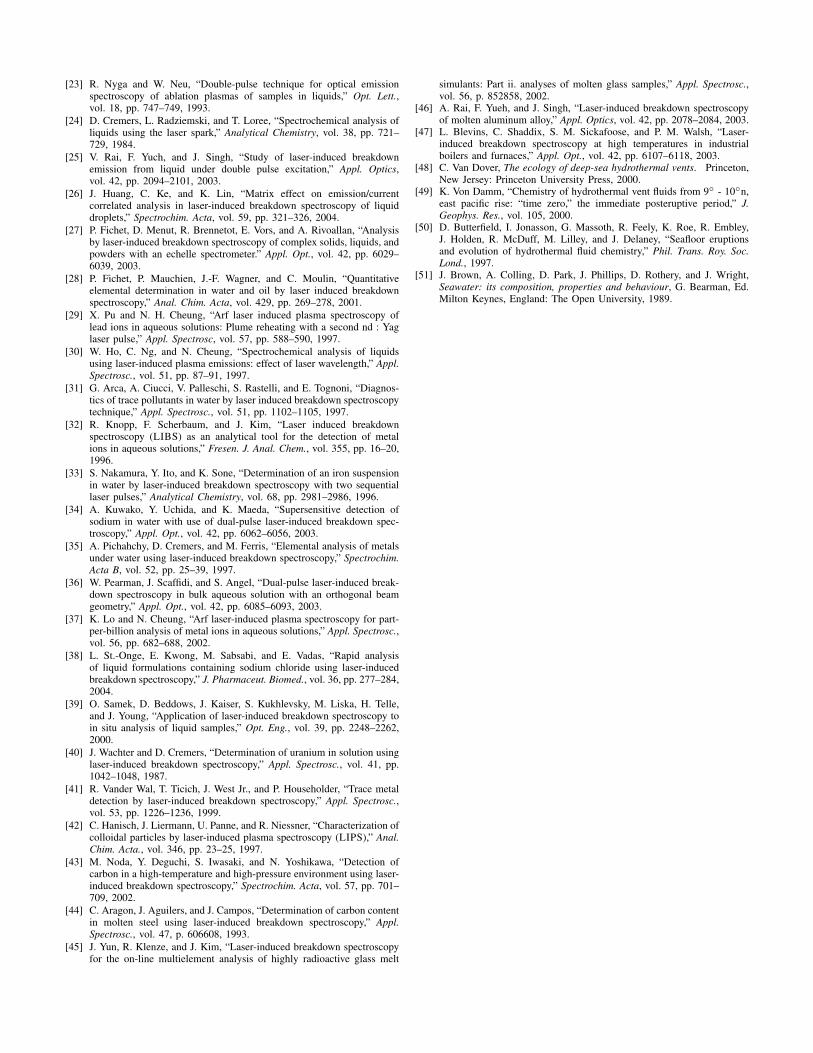
We investigated the effect of temperature on the peakintensity of Ca (422.7 nm) over the range 27 - 98oC. Peakintensities were measured for a solution of 1,000 ppm Ca with2,540 ppm NaCl dissolved in distilled water at atmosphericpressure using a 37 mJ single laser pulse (Fig. 11). Overthis range of temperatures, no effect on peak intensity withincreased temperature was seen indicating that the temperature
600x103
500
400
300
200
100
0
Inte
nsit
y (a
.u.)
430420410400390Wavelength (nm)
Ca
Ca + 254 ppm NaCl
Ca + 25,400 ppm NaCl
Fig. 10. Effect of the addition of NaCl on the spectra of 1,000 ppm Ca. E1
= 40 mJ, E2 = 125 mJ, ∆T = 46 ns, td 1 µs, td = 100 ns, slit width = 35µm. )
of the fluid exiting the hydrothermal vent will not impair theability to measure the fluid in situ.
35
30
25
20
15
10
5
Inte
nsit
y (a
.u.)
x10
3
90807060504030Temperature (ºC)
Fig. 11. Effect of temperature on the LIBS signal of Ca at atmosphericpressure. (1,000 ppm Ca with 2,054 ppm NaCl in DI; laser pulse energy, 37mJ; gate delay, 400 ns; gate width, 1 µs)
VI. CONCLUSION
In this work, the detection of Li, Na, K, Ca, Mn, andZn at pressures up to 272 atm using LIBS was found tobe feasible. In addition, an optimal range of low laser pulseenergies was shown to exist for the detection of analytesin bulk aqueous solutions at both low and high pressures,suggesting that optimization of the LIBS parameters can helpto improve detection limits. Using low pulse energies, nopressure effect was seen on the emission intensity for Caand Na, and an increase in intensity with increased pressurewas seen for Mn. No peak broadening due to pressure wasobserved for Ca, Na, or Mn. Using the dual pulse technique,it was also found for several analytes that two low energypulses separated by a very short delay time, resulted in thegreatest emission intensity. However, the results of the dualpulse work varied somewhat by analyte. The addition of NaClenhanced the emission intensity of Ca but showed no effecton the intensity of Mn or K. Ca was found to be detectableover a wide range of concentrations at a range of pressures. Inaddition, temperature was shown to have no effect on emissionintensity. Overall, increased pressure, the addition of NaClto a solution, and temperature did not inhibit detection ofanalytes in solution. The results presented here suggest thatLIBS is a viable technique for in situ chemical analysis ofhydrothermal vent fluids in the ocean. Further studies willhelp to elucidate the optimal parameters for the detection ofthe elements important for understanding vent chemistry.
ACKNOWLEDGMENT
We acknowledge the National Science Foundation for sup-port of this research under Grant OCE0352278 and additionalsupport was received from the Deep Ocean Exploration Insti-tute of the Woods Hole Oceanographic Institution.
REFERENCES
[1] K. Daly, R. Byrne, A. Dickson, S. Gallager, M. Perry, and M. Tivey,“Chemical and biological sensors for time-series research: current statusand new directions,” Mar. Technol. Soc. J., vol. 38, pp. 121–143, 2004.
[2] F. Brech and L. Cross, “Optical microemission stimulated by a a rubymaser,” Appl. Spectrosc., vol. 16, 1962.
[3] V. Majidi and M. Joseph, “Spectroscopic applications of laser-inducedplasmas,” Crit. Rev. Anal. Chem., vol. 23, pp. 143–162, 1992.
[4] L. Radziemski, “Review of analytical applications of laser plasmas andlaser ablation, 1987-1994,” Microchem. J., vol. 50, pp. 218–234, 1994.
[5] D. Rusak, B. Castle, B. Smith, and J. Winefordner, “Fundamentals andapplications of laser-induced breakdown spectroscopy,” Crit. Rev. Anal.Chem., vol. 27, pp. 257–290, 1997.
[6] K. Song, Y. Lee, and J. Sneddon, “Applications of laser-induced break-down spectrometry,” Appl. Spectrosc. Rev., vol. 32, pp. 183–235, 1997.
[7] J. Sneddon and Y. Lee, “Novel and recent applications of elementaldetermination by laser-induced breakdown spectroscopy,” Anal. Lett.,vol. 32, pp. 2143–2162, 1999.
[8] D. Rusak, B. Castle, B. Smith, and J. Winefordner, “Recent trends andthe future of laser-induced plasma spectroscopy,” Trend. Anal. Chem.,vol. 17, pp. 453–461, 1998.
[9] W. Lee, J. Wu, Y. Lee, and J. Sneddon, “Recent applications of laser-induced breakdown spectrometry: a review of material approaches,”Appl. Spectrosc. Rev., vol. 39, pp. 27–97, 2004.
[10] X. Hou and B. Jones, “Field instrumentation in atomic spectroscopy,”Microchem. J., vol. 66, pp. 115–145, 2000.
[11] R. Harmon, F. C. De Lucia, A. Miziolek, K. McNesby, R. Walters, andP. French, “Laser-induced breakdown spectroscopy (libs) – an emergingfield-portable sensor technology for real-time, in-situ geochemical andenvironmental analysis,” Geochem.: Explor. Environ., Anal., vol. 5, pp.21–28, 2005.
[12] R. Wainner, R. Harmon, A. Miziolek, K. McNesby, and P. French,“Analysis of environmental lead contamination: comparison of libs fieldand laboratory instruments,” Spectrochim. Acta B, vol. 56, pp. 777–793,2001.
[13] A. Knight, N. Scherbarth, D. Cremers, and M. Ferris, “Characterizationof laser-induced breakdown spectroscopy (LIBS) for application tospace sxploration,” Appl. Spectrosc., vol. 54, pp. 331–340, 2000.
[14] B. Salle, J. Lacour, E. Vors, P. Fichet, S. Maurice, D. Cremers, andR. Wiens, “Laser-induced breakdown spectroscopy for mars surfaceanalysis: capabilities at stand-off distances and detection of chlorineand sulfur elements.” Spectrochim. Acta, vol. 59, pp. 1413–1422, 2004.
[15] B. Salle, D. Cremers, S. Maurice, R. Wiens, and P. Fichet, “Evaluationof a compact spectrograph for in-situ and stand-off laser-induced break-down spectroscopy analyses of geological samples on mars missions,”Spectrochim. Acta, vol. in press, p. in press*, 2005.
[16] Z. Arp, D. Cremers, R. D. Harris, D. Oschwald, G. R. Parker Jr., andD. Wayne, “Feasibility of generating a useful laser-induced breakdownspectroscopy plasma on rocks at high pressure: preliminary study for avenus mission,” Spectrochim. Acta B, vol. 59, p. 987 999, 2004.
[17] [Online]. Available: http://mars.jpl.nasa.gov/missions/future/msl.html[18] W. Seyfried Jr., K. Johnson, and M. C. Tivey, “In-situ sensors: their
development and application for the study of chemical, physical and bi-ological systems at mid-ocean ridges,” NSF/Ridge Sponsored WorkshopReport, 2000.
[19] “The next generation of in situ biological and chemical sensors in theocean: a workshop report,” 2004.
[20] T. Dickey, “The role of new technology in advancing ocean biogeo-chemical studies,” Oceanography, vol. 14, pp. 108–120, 2001.
[21] M. Varney, Ed., Chemical Sensors in Oceanography. Gordon andBreach, 2000.
[22] L. Radziemski and D. Cremers, “Spectrochemical analysis usinglaser plasma excitation,” in Laser-induced plasmas and applications,L. Radziemski and D. Cremers, Eds.
[23] R. Nyga and W. Neu, “Double-pulse technique for optical emissionspectroscopy of ablation plasmas of samples in liquids,” Opt. Lett.,vol. 18, pp. 747–749, 1993.
[24] D. Cremers, L. Radziemski, and T. Loree, “Spectrochemical analysis ofliquids using the laser spark,” Analytical Chemistry, vol. 38, pp. 721–729, 1984.
[25] V. Rai, F. Yuch, and J. Singh, “Study of laser-induced breakdownemission from liquid under double pulse excitation,” Appl. Optics,vol. 42, pp. 2094–2101, 2003.
[26] J. Huang, C. Ke, and K. Lin, “Matrix effect on emission/currentcorrelated analysis in laser-induced breakdown spectroscopy of liquiddroplets,” Spectrochim. Acta, vol. 59, pp. 321–326, 2004.
[27] P. Fichet, D. Menut, R. Brennetot, E. Vors, and A. Rivoallan, “Analysisby laser-induced breakdown spectroscopy of complex solids, liquids, andpowders with an echelle spectrometer.” Appl. Opt., vol. 42, pp. 6029–6039, 2003.
[28] P. Fichet, P. Mauchien, J.-F. Wagner, and C. Moulin, “Quantitativeelemental determination in water and oil by laser induced breakdownspectroscopy,” Anal. Chim. Acta, vol. 429, pp. 269–278, 2001.
[29] X. Pu and N. H. Cheung, “Arf laser induced plasma spectroscopy oflead ions in aqueous solutions: Plume reheating with a second nd : Yaglaser pulse,” Appl. Spectrosc, vol. 57, pp. 588–590, 1997.
[30] W. Ho, C. Ng, and N. Cheung, “Spectrochemical analysis of liquidsusing laser-induced plasma emissions: effect of laser wavelength,” Appl.Spectrosc., vol. 51, pp. 87–91, 1997.
[31] G. Arca, A. Ciucci, V. Palleschi, S. Rastelli, and E. Tognoni, “Diagnos-tics of trace pollutants in water by laser induced breakdown spectroscopytechnique,” Appl. Spectrosc., vol. 51, pp. 1102–1105, 1997.
[32] R. Knopp, F. Scherbaum, and J. Kim, “Laser induced breakdownspectroscopy (LIBS) as an analytical tool for the detection of metalions in aqueous solutions,” Fresen. J. Anal. Chem., vol. 355, pp. 16–20,1996.
[33] S. Nakamura, Y. Ito, and K. Sone, “Determination of an iron suspensionin water by laser-induced breakdown spectroscopy with two sequentiallaser pulses,” Analytical Chemistry, vol. 68, pp. 2981–2986, 1996.
[34] A. Kuwako, Y. Uchida, and K. Maeda, “Supersensitive detection ofsodium in water with use of dual-pulse laser-induced breakdown spec-troscopy,” Appl. Opt., vol. 42, pp. 6062–6056, 2003.
[35] A. Pichahchy, D. Cremers, and M. Ferris, “Elemental analysis of metalsunder water using laser-induced breakdown spectroscopy,” Spectrochim.Acta B, vol. 52, pp. 25–39, 1997.
[36] W. Pearman, J. Scaffidi, and S. Angel, “Dual-pulse laser-induced break-down spectroscopy in bulk aqueous solution with an orthogonal beamgeometry,” Appl. Opt., vol. 42, pp. 6085–6093, 2003.
[37] K. Lo and N. Cheung, “Arf laser-induced plasma spectroscopy for part-per-billion analysis of metal ions in aqueous solutions,” Appl. Spectrosc.,vol. 56, pp. 682–688, 2002.
[38] L. St.-Onge, E. Kwong, M. Sabsabi, and E. Vadas, “Rapid analysisof liquid formulations containing sodium chloride using laser-inducedbreakdown spectroscopy,” J. Pharmaceut. Biomed., vol. 36, pp. 277–284,2004.
[39] O. Samek, D. Beddows, J. Kaiser, S. Kukhlevsky, M. Liska, H. Telle,and J. Young, “Application of laser-induced breakdown spectroscopy toin situ analysis of liquid samples,” Opt. Eng., vol. 39, pp. 2248–2262,2000.
[40] J. Wachter and D. Cremers, “Determination of uranium in solution usinglaser-induced breakdown spectroscopy,” Appl. Spectrosc., vol. 41, pp.1042–1048, 1987.
[41] R. Vander Wal, T. Ticich, J. West Jr., and P. Householder, “Trace metaldetection by laser-induced breakdown spectroscopy,” Appl. Spectrosc.,vol. 53, pp. 1226–1236, 1999.
[42] C. Hanisch, J. Liermann, U. Panne, and R. Niessner, “Characterization ofcolloidal particles by laser-induced plasma spectroscopy (LIPS),” Anal.Chim. Acta., vol. 346, pp. 23–25, 1997.
[43] M. Noda, Y. Deguchi, S. Iwasaki, and N. Yoshikawa, “Detection ofcarbon in a high-temperature and high-pressure environment using laser-induced breakdown spectroscopy,” Spectrochim. Acta, vol. 57, pp. 701–709, 2002.
[44] C. Aragon, J. Aguilers, and J. Campos, “Determination of carbon contentin molten steel using laser-induced breakdown spectroscopy,” Appl.Spectrosc., vol. 47, p. 606608, 1993.
[45] J. Yun, R. Klenze, and J. Kim, “Laser-induced breakdown spectroscopyfor the on-line multielement analysis of highly radioactive glass melt
simulants: Part ii. analyses of molten glass samples,” Appl. Spectrosc.,vol. 56, p. 852858, 2002.
[46] A. Rai, F. Yueh, and J. Singh, “Laser-induced breakdown spectroscopyof molten aluminum alloy,” Appl. Optics, vol. 42, pp. 2078–2084, 2003.
[47] L. Blevins, C. Shaddix, S. M. Sickafoose, and P. M. Walsh, “Laser-induced breakdown spectroscopy at high temperatures in industrialboilers and furnaces,” Appl. Opt., vol. 42, pp. 6107–6118, 2003.
[48] C. Van Dover, The ecology of deep-sea hydrothermal vents. Princeton,New Jersey: Princeton University Press, 2000.
[49] K. Von Damm, “Chemistry of hydrothermal vent fluids from 9◦ - 10◦n,east pacific rise: “time zero,” the immediate posteruptive period,” J.Geophys. Res., vol. 105, 2000.
[50] D. Butterfield, I. Jonasson, G. Massoth, R. Feely, K. Roe, R. Embley,J. Holden, R. McDuff, M. Lilley, and J. Delaney, “Seafloor eruptionsand evolution of hydrothermal fluid chemistry,” Phil. Trans. Roy. Soc.Lond., 1997.
[51] J. Brown, A. Colling, D. Park, J. Phillips, D. Rothery, and J. Wright,Seawater: its composition, properties and behaviour, G. Bearman, Ed.Milton Keynes, England: The Open University, 1989.