Embed Size (px)
DESCRIPTION
OCWD
Citation preview
Orange County Water District
Initial Expansion
of the Groundwater Replenishment System
Engineer’s Report
Mehul Patel, P.E. August 2010
1
INITIAL EXPANSION OF THE GWR SYSTEM
i
Table of Contents
INTRODUCTION........................................................................................................1 WATER SUPPLY SUMMARY.......................................................................................2 ALTERNATIVE SOURCES...........................................................................................4
LONG-TERM FACILITIES PLAN ...............................................................................4 CONSERVATION ...................................................................................................4 WATER TRANSFERS .............................................................................................5 DESALINATION .....................................................................................................5
PROJECT DESCRIPTION ...........................................................................................6 LABORATORY DEMOLITION....................................................................................7 MICROFILTRATION................................................................................................7 REVERSE OSMOSIS..............................................................................................8 ULTRAVIOLET LIGHT WITH HYDROGEN PEROXIDE....................................................8 POST-TREATMENT................................................................................................8
OCSD SECONDARY TREATED FLOW AVAILABILITY.....................................................9 GROUNDWATER RECHARGE AND INJECTION ............................................................10 ORGANIZATIONAL IMPACT ......................................................................................12 COST ...................................................................................................................12 SCHEDULE............................................................................................................15 CEQA..................................................................................................................15 RECOMMENDATION................................................................................................16
List of Figures FIGURE 1 – GWR SYSTEM MAP ...............................................................................1 FIGURE 2 – CURRENT AND FUTURE DEMANDS WITHIN THE OCWD SERVICE AREA .......3 FIGURE 3 – SITE LAYOUT FOR INITIAL EXPANSION OF THE GWR SYSTEM ....................6 FIGURE 4 – EXPECTED AVAILABLE FLOW FROM OCSD PLANT 1 AFTER 2012 ............10 FIGURE 5 – ESTIMATED 2012 GWR SYSTEM PHASE 2 UNIT COSTS AND
MWD UNIT COSTS ($/AF).................................................................15
List of Tables TABLE 1 - EXPANDED GWR SYSTEM FLOW DELIVERIES ...........................................11 TABLE 2 - PRELIMINARY COST ESTIMATE FOR PHASE 2 TREATMENT FACILITIES .........13 TABLE 3 - ESTIMATED UNIT COST OF PHASE 2 WATER .............................................13 TABLE 4 - SCHEDULE OF THE INITIAL EXPANSION OF THE GWR SYSTEM....................15 Appendix: Costs for the GWR System Initial Expansion
2
INITIAL EXPANSION OF THE GWR SYSTEM
ENGINEER’S REPORT 1 ORANGE COUNTY WATER DISTRICT
Introduction
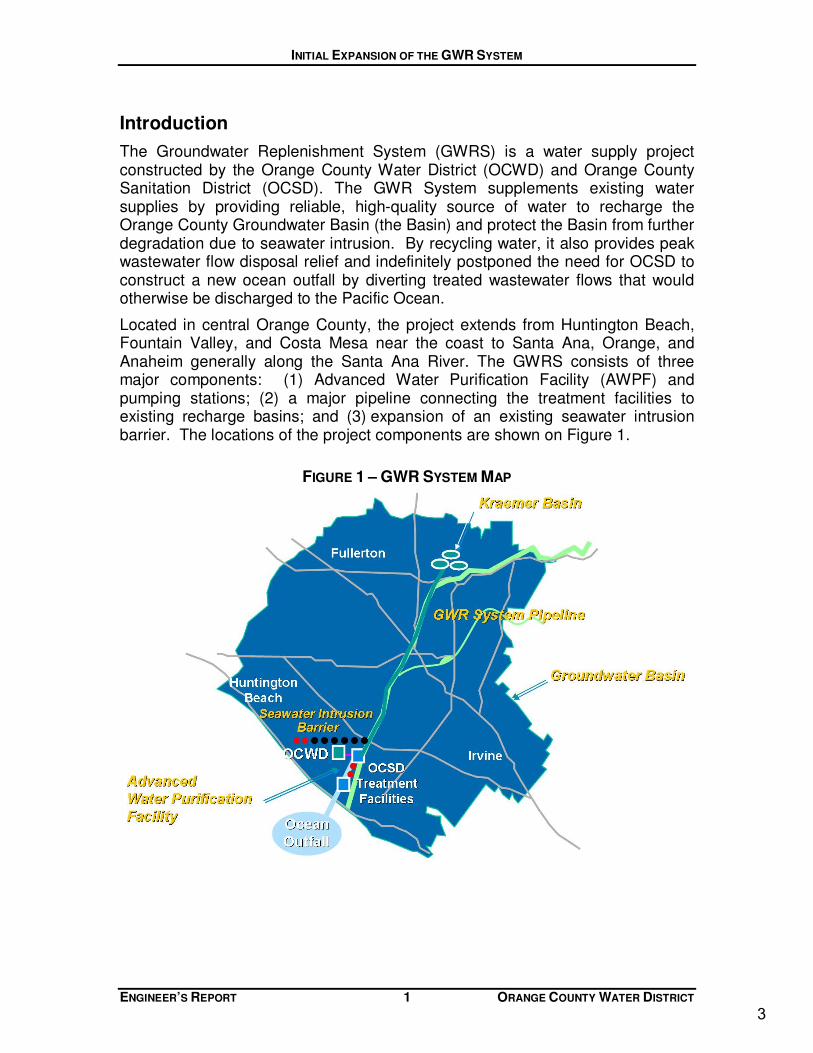
The Groundwater Replenishment System (GWRS) is a water supply project constructed by the Orange County Water District (OCWD) and Orange County Sanitation District (OCSD). The GWR System supplements existing water supplies by providing reliable, high-quality source of water to recharge the Orange County Groundwater Basin (the Basin) and protect the Basin from further degradation due to seawater intrusion. By recycling water, it also provides peak wastewater flow disposal relief and indefinitely postponed the need for OCSD to construct a new ocean outfall by diverting treated wastewater flows that would otherwise be discharged to the Pacific Ocean.
Located in central Orange County, the project extends from Huntington Beach, Fountain Valley, and Costa Mesa near the coast to Santa Ana, Orange, and Anaheim generally along the Santa Ana River. The GWRS consists of three major components: (1) Advanced Water Purification Facility (AWPF) and pumping stations; (2) a major pipeline connecting the treatment facilities to existing recharge basins; and (3) expansion of an existing seawater intrusion barrier. The locations of the project components are shown on Figure 1.
FIGURE 1 – GWR SYSTEM MAP
3
INITIAL EXPANSION OF THE GWR SYSTEM
ENGINEER’S REPORT 2 ORANGE COUNTY WATER DISTRICT
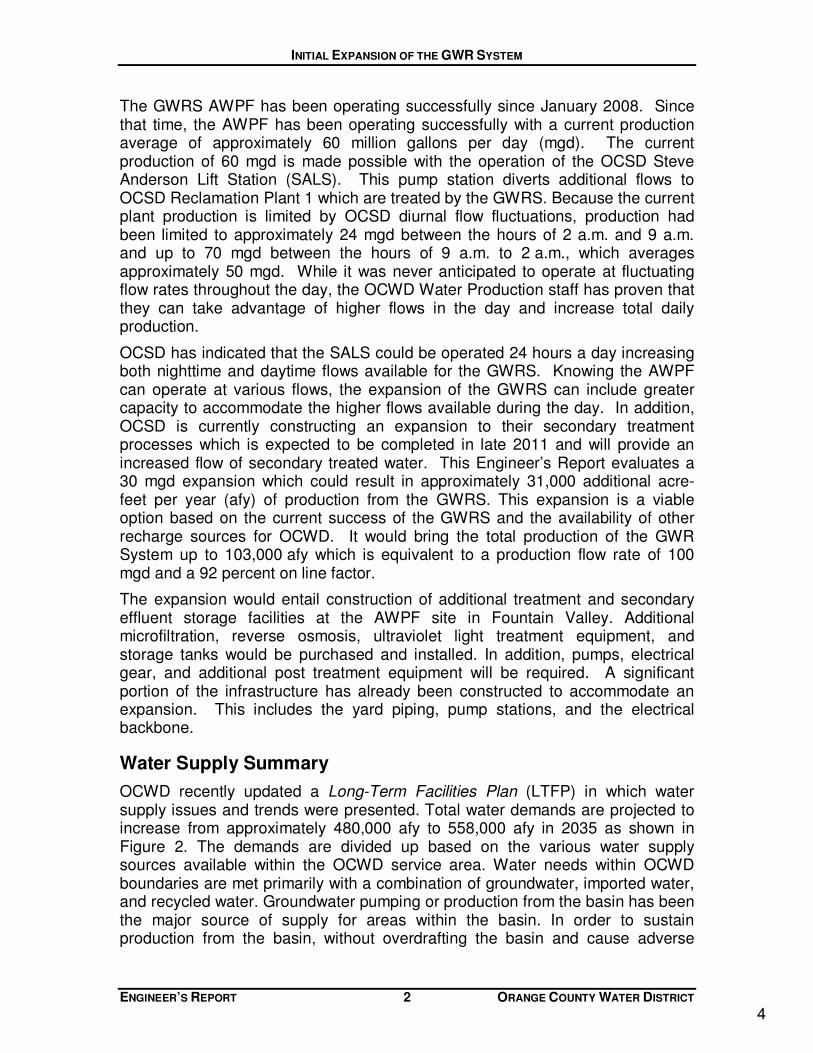
The GWRS AWPF has been operating successfully since January 2008. Since that time, the AWPF has been operating successfully with a current production average of approximately 60 million gallons per day (mgd). The current production of 60 mgd is made possible with the operation of the OCSD Steve Anderson Lift Station (SALS). This pump station diverts additional flows to OCSD Reclamation Plant 1 which are treated by the GWRS. Because the current plant production is limited by OCSD diurnal flow fluctuations, production had been limited to approximately 24 mgd between the hours of 2 a.m. and 9 a.m. and up to 70 mgd between the hours of 9 a.m. to 2 a.m., which averages approximately 50 mgd. While it was never anticipated to operate at fluctuating flow rates throughout the day, the OCWD Water Production staff has proven that they can take advantage of higher flows in the day and increase total daily production.
OCSD has indicated that the SALS could be operated 24 hours a day increasing both nighttime and daytime flows available for the GWRS. Knowing the AWPF can operate at various flows, the expansion of the GWRS can include greater capacity to accommodate the higher flows available during the day. In addition, OCSD is currently constructing an expansion to their secondary treatment processes which is expected to be completed in late 2011 and will provide an increased flow of secondary treated water. This Engineer’s Report evaluates a 30 mgd expansion which could result in approximately 31,000 additional acre-feet per year (afy) of production from the GWRS. This expansion is a viable option based on the current success of the GWRS and the availability of other recharge sources for OCWD. It would bring the total production of the GWR System up to 103,000 afy which is equivalent to a production flow rate of 100 mgd and a 92 percent on line factor.
The expansion would entail construction of additional treatment and secondary effluent storage facilities at the AWPF site in Fountain Valley. Additional microfiltration, reverse osmosis, ultraviolet light treatment equipment, and storage tanks would be purchased and installed. In addition, pumps, electrical gear, and additional post treatment equipment will be required. A significant portion of the infrastructure has already been constructed to accommodate an expansion. This includes the yard piping, pump stations, and the electrical backbone.
Water Supply Summary
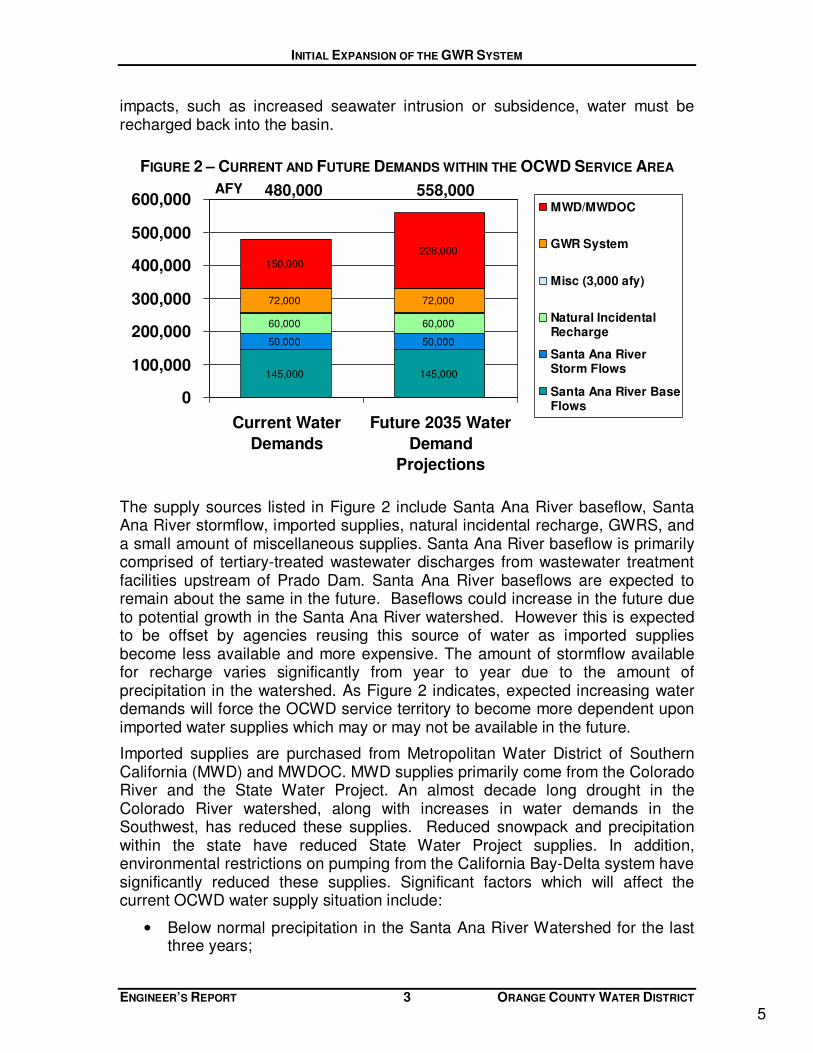
OCWD recently updated a Long-Term Facilities Plan (LTFP) in which water supply issues and trends were presented. Total water demands are projected to increase from approximately 480,000 afy to 558,000 afy in 2035 as shown in Figure 2. The demands are divided up based on the various water supply sources available within the OCWD service area. Water needs within OCWD boundaries are met primarily with a combination of groundwater, imported water, and recycled water. Groundwater pumping or production from the basin has been the major source of supply for areas within the basin. In order to sustain production from the basin, without overdrafting the basin and cause adverse
4
INITIAL EXPANSION OF THE GWR SYSTEM
ENGINEER’S REPORT 3 ORANGE COUNTY WATER DISTRICT
impacts, such as increased seawater intrusion or subsidence, water must be recharged back into the basin.
FIGURE 2 – CURRENT AND FUTURE DEMANDS WITHIN THE OCWD SERVICE AREA
The supply sources listed in Figure 2 include Santa Ana River baseflow, Santa Ana River stormflow, imported supplies, natural incidental recharge, GWRS, and a small amount of miscellaneous supplies. Santa Ana River baseflow is primarily comprised of tertiary-treated wastewater discharges from wastewater treatment facilities upstream of Prado Dam. Santa Ana River baseflows are expected to remain about the same in the future. Baseflows could increase in the future due to potential growth in the Santa Ana River watershed. However this is expected to be offset by agencies reusing this source of water as imported supplies become less available and more expensive. The amount of stormflow available for recharge varies significantly from year to year due to the amount of precipitation in the watershed. As Figure 2 indicates, expected increasing water demands will force the OCWD service territory to become more dependent upon imported water supplies which may or may not be available in the future.
Imported supplies are purchased from Metropolitan Water District of Southern California (MWD) and MWDOC. MWD supplies primarily come from the Colorado River and the State Water Project. An almost decade long drought in the Colorado River watershed, along with increases in water demands in the Southwest, has reduced these supplies. Reduced snowpack and precipitation within the state have reduced State Water Project supplies. In addition, environmental restrictions on pumping from the California Bay-Delta system have significantly reduced these supplies. Significant factors which will affect the current OCWD water supply situation include:
• Below normal precipitation in the Santa Ana River Watershed for the last three years;
145,000 145,000
50,000 50,000
60,000 60,000
72,000 72,000
150,000
228,000
0
100,000
200,000
300,000
400,000
500,000
600,000
Current Water
Demands
Future 2035 Water
Demand
Projections
MWD/MWDOC
GWR System
Misc (3,000 afy)
Natural IncidentalRecharge
Santa Ana RiverStorm Flows
Santa Ana River BaseFlows
480,000 558,000 AFY
5
INITIAL EXPANSION OF THE GWR SYSTEM
ENGINEER’S REPORT 4 ORANGE COUNTY WATER DISTRICT
• The lack of MWD supplemental replenishment water since April 2007;
• MWD may allocate imported water supplies in the next one to two years, which could further increase demands on the basin;
• The anticipated lack of supplemental replenishment water through at least 2011; and
• A potential lag of three to five years before MWD can provide reliable information regarding when supplemental replenishment water is available.
Because of these factors, annual groundwater production and the level of storage in the basin have declined since 2006. Additionally, the potential to refill the basin with supplemental imported replenishment water, as has occurred in the past, is not a reliable option. It is likely that the amount of production from the basin will need to be further reduced in response to the below normal precipitation in the Santa Ana River Watershed and the lack of supplemental replenishment water.
Alternative Sources
OCWD has been developing programs and projects that will maximize the sustainable basin yield of the groundwater basin in a cost effective manner. Sustainable basin yield refers to the annual amount of production that can be maintained on a long term basis (e.g. five to ten years, or more) without overdrafting the basin. This requires matching the production of the basin with the amount recharged on a long-term basis. These projects are summarized in the LTFP. Additional opportunities to develop new water supplies and their feasibility are described below.
Long-Term Facilities Plan
The LTFP is a strategic planning tool for the District which identifies potential projects that could increase the basin’s yield and protect groundwater quality. The LTFP presents a preliminary assessment of potential projects’ costs and benefits, and prioritizes potential projects for more detailed analysis based upon cost, benefit and feasibility. A wide range of potential projects were identified. The preparation of the LTFP is a planning effort to screen potential projects and identify which ones to carry forward for more detailed analysis and consideration. Many of the projects presented in the LTFP address projects that have been developed to increase storm flow capture. These projects would maximize recharge of water that is normally lost to the ocean during a storm event.
Conservation
OCWD is committed to conservation with their support for MWDOC’s conservation program. MWDOC, with financial support from OCWD and its 28 other member agencies, has developed and implemented a water conservation program involving various Best Management Practices (BMP), including:
6
INITIAL EXPANSION OF THE GWR SYSTEM
ENGINEER’S REPORT 5 ORANGE COUNTY WATER DISTRICT
• Large landscape education
• Multi-family ultra low-flush toilets (ULFT)
• Low-flow showerheads
• Single-Family ULFT
• Residential Evapotranspiration (ET) Smart Controllers
• Residential front-loading clothes washers
• Commercial ULFT
• Home and commercial water surveys
• Distribution system leak repair
MWDOC, Anaheim, Fullerton, and Santa Ana (as the MWD Member Agency within the OCWD service area) tend to be the lead agencies for implementing the conservation programs. Significant demands have been reduced and conservation efforts must remain a high priority. Even with conservation, the OCWD service area will require a substantial amount of imported water supply each year.
Water Transfers
Another option for new water sources are water transfers which will help recharge the groundwater basin. OCWD plans to explore options to acquire available water and how to convey to the Orange County groundwater basin. As Southern California’s imported water provider who manages the Colorado River Aqueduct and as the major contractor along the State Water Project, MWD is generally responsible and has experience in making larger water transfers.
There are significant institutional issues to overcome to develop successful transfer programs. OCWD cannot directly compete with MWD in the water market. OCWD will explore opportunities as well as support MWD on any water transfers that are beneficial to the OCWD service area.
Desalination
Poseidon is currently developing plans for a 50 mgd ocean water desalination plant in Huntington Beach. A desalination facility in Huntington Beach could generate a significant amount of water within Orange County. This water is a new supply with an almost unlimited source. While it is a reliable source water, there are numerous permitting and institutional challenges associated with ocean water desalination.
Estimated costs for ocean desalinated water exceed $1,200/af. These high costs are linked to the large amounts of energy required for the reverse osmosis process.
As a groundwater management agency, OCWD may not have a need for this water as desalinated ocean water is generally permitted for the potable system.
7
INITIAL EXPANSION OF THE GWR SYSTEM
ENGINEER’S REPORT 6 ORANGE COUNTY WATER DISTRICT
Project Description
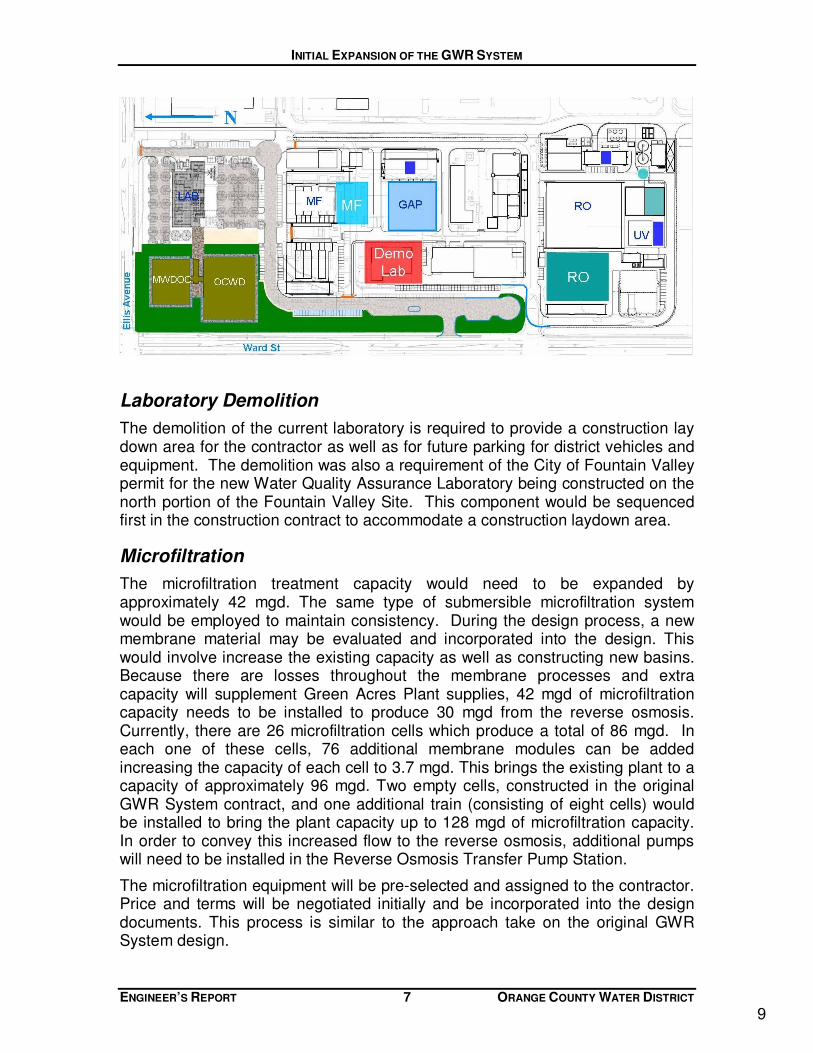
The Initial Expansion of the GWR System would include adding treatment capacity to the AWPF in Fountain Valley. Additional microfiltration, reverse osmosis, and ultraviolet light treatment equipment would be purchased and installed. In addition flow equalization of secondary effluent would be provided by the construction of two 7.5 million gallon storage tanks. The storage tanks would allow for the excess secondary effluent available in daytime hours to be stored and then fed to the GWRS during low night time flow periods. A significant portion of the infrastructure has already been constructed to accommodate an expansion. This includes the yard piping, pump stations, and the electrical backbone. When the GWRS was designed and constructed, all piping, facilities, electrical systems, and the site were designed for an ultimate capacity of 130 mgd. Because the major processes (microfiltration, reverse osmosis, and ultraviolet light) are modular systems, expansion would be relatively simple. The shaded areas in Figure 3 below identify the areas on the GWRS that would accommodate the 30 mgd expansion.
Major work of the expansion would entail:
• Demolition of the current lab facility
• Microfiltration facility construction (up to a capacity of 42 mgd)
• Reverse osmosis facility (up to a capacity of 30 mgd)
• Ultraviolet light equipment installation (up to a capacity of 30 mgd)
• Additional post-treatment facilities
• Additional reverse osmosis transfer pumps
• Additional product water and barrier pumps
• Construction of two 7.5 million gallon capacity secondary effluent storage tanks
FIGURE 3 – SITE LAYOUT FOR INITIAL EXPANSION OF THE GWRS
8
INITIAL EXPANSION OF THE GWR SYSTEM
ENGINEER’S REPORT 7 ORANGE COUNTY WATER DISTRICT
Laboratory Demolition
The demolition of the current laboratory is required to provide a construction lay down area for the contractor as well as for future parking for district vehicles and equipment. The demolition was also a requirement of the City of Fountain Valley permit for the new Water Quality Assurance Laboratory being constructed on the north portion of the Fountain Valley Site. This component would be sequenced first in the construction contract to accommodate a construction laydown area.
Microfiltration
The microfiltration treatment capacity would need to be expanded by approximately 42 mgd. The same type of submersible microfiltration system would be employed to maintain consistency. During the design process, a new membrane material may be evaluated and incorporated into the design. This would involve increase the existing capacity as well as constructing new basins. Because there are losses throughout the membrane processes and extra capacity will supplement Green Acres Plant supplies, 42 mgd of microfiltration capacity needs to be installed to produce 30 mgd from the reverse osmosis. Currently, there are 26 microfiltration cells which produce a total of 86 mgd. In each one of these cells, 76 additional membrane modules can be added increasing the capacity of each cell to 3.7 mgd. This brings the existing plant to a capacity of approximately 96 mgd. Two empty cells, constructed in the original GWR System contract, and one additional train (consisting of eight cells) would be installed to bring the plant capacity up to 128 mgd of microfiltration capacity. In order to convey this increased flow to the reverse osmosis, additional pumps will need to be installed in the Reverse Osmosis Transfer Pump Station.
The microfiltration equipment will be pre-selected and assigned to the contractor. Price and terms will be negotiated initially and be incorporated into the design documents. This process is similar to the approach take on the original GWR System design.
9
INITIAL EXPANSION OF THE GWR SYSTEM
ENGINEER’S REPORT 8 ORANGE COUNTY WATER DISTRICT
Reverse Osmosis
The expansion of the reverse osmosis entails an additional 30 mgd of treatment capacity as well as construction of a new building. The current 70 mgd of reverse osmosis treatment is within an enclosed building. Space is available to the west for an additional 60 mgd expansion. It is proposed that the entire building be constructed but only 30 mgd of reverse osmosis capacity be installed. Maintaining the same 5 mgd unit design would be desirable to reduce impacts on the operations staff. Additional cartridge filters and chemical feed systems upstream of the reverse osmosis would also be required.
Currently, the area serves as a parking lot for OCWD vehicles and equipment. Following construction of the reverse osmosis expansion, this parking area would be moved to the site of the old lab.
Ultraviolet light with Hydrogen Peroxide
The expansion of the advanced oxidation system involves installation of additional ultraviolet equipment. Each train is capable of treating 8.75 mgd of reverse osmosis product. Currently, there are three partial trains that can be built out to add 17.5 mgd of treatment capacity. Two additional trains would need to be installed to treat the 30 mgd of additional flow. The peroxide system would not need to be modified significantly.
Post-treatment
Post-treatment facilities include decarbonators and lime stabilization. Five decarbonators currently degasify the product water to reduce carbon dioxide and help restore pH. An analysis will need to be performed to determine how many additional decarbonators will be required to handle the increased flow. The same will need to be performed to evaluate whether an additional lime saturator will be required. The lime addition is required to stabilize the water before being recharged into the groundwater basin. Finally, additional barrier and product water pumps will be required to convey the water to the injection barrier or to the recharge basins in Anaheim.
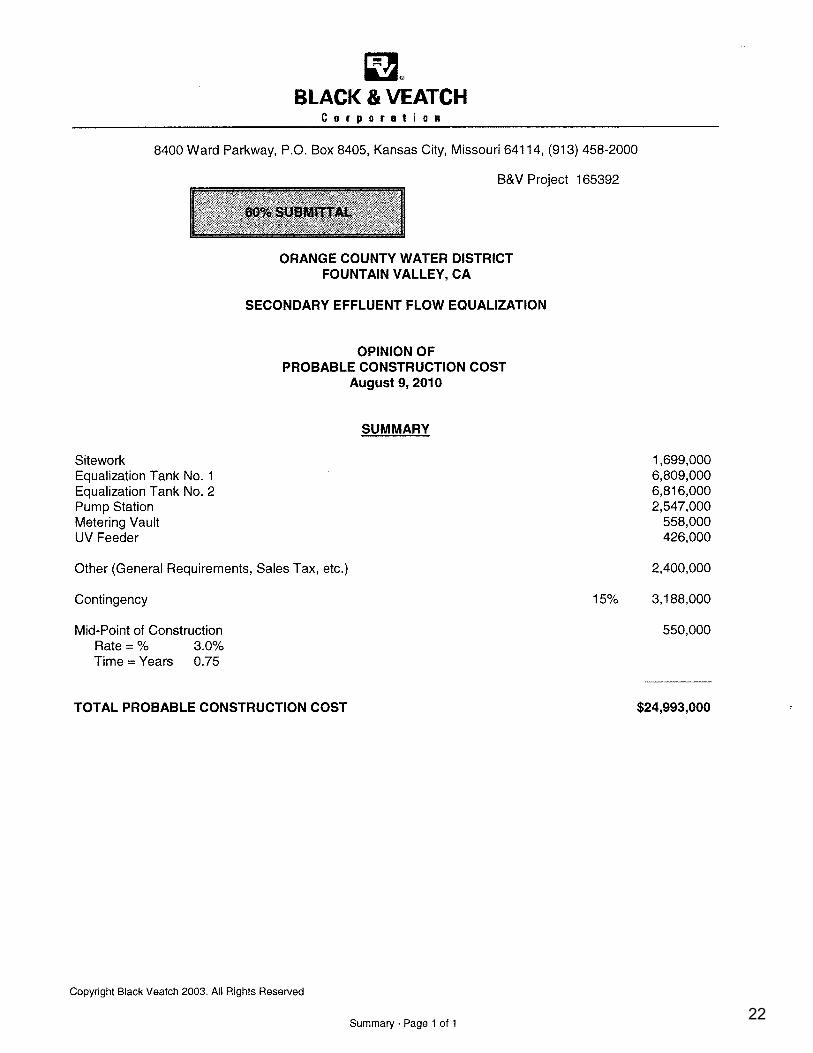
Flow Equalization Storage Tanks
Flow equalization will be included in the GWRS Expansion Project. Flow equalization will involve the construction of two 7.5 million gallon capacity above ground steel storage tanks. The tanks would contain enough storage volume to ensure that the expansion would provide an additional 31,000 afy of production from the GWRS. The tanks will be 216 feet in diameter and 35 feet tall. The tanks will include solar powered mixers. A pump station consisting of five 75 horsepower vertical turbine pumps is included as part of the flow equalization portion of the expansion project. The pumps are used to fill the equalization tanks with excess secondary effluent. The contents are then discharged from the
10
INITIAL EXPANSION OF THE GWR SYSTEM
ENGINEER’S REPORT 9 ORANGE COUNTY WATER DISTRICT
tanks by gravity to the GWRS screening facility. A common pipeline will be used for both filling and draining of the equalizaition tanks.
OCSD Secondary Treated Flow Availability
OCSD has provided expected flow availability information for Plant 1 when the SALS is operational. Based on these expected figures, it can be anticipated to have enough flow to produce an additional 31,000 afy from the GWRS. In order to do this, additional capacity would need to be constructed so that the GWRS AWPF could be ramped up during the day. OCSD has indicated that with the new secondary treatment available in 2012 and the 24 hour operation of the SALS, flow would be available. OCWD and OCSD have revised the existing Operations Agreement to ensure that this would be a mode of operation amenable to OCSD.
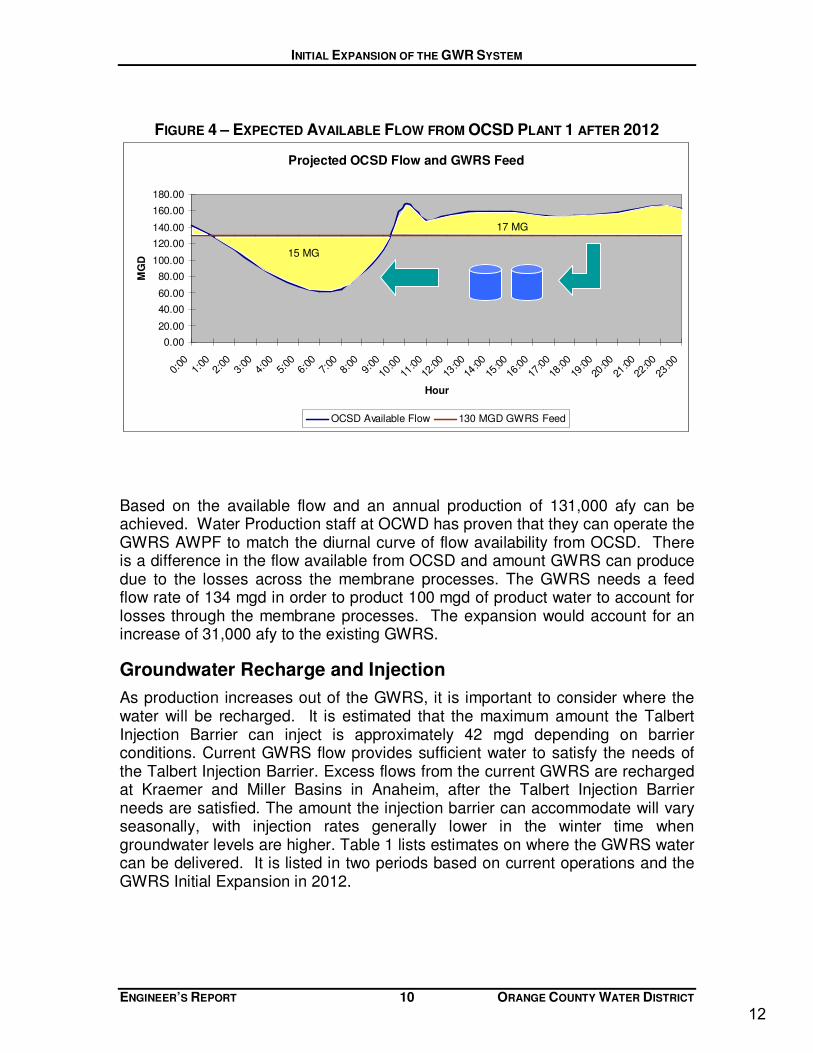
The following graph (Figure 4) identifies the current estimate of OCSD water that will be available with the SALS in operation and secondary treatment expanded in 2012. It also shows that the 15 million gallons of equalization storage make up for the short fall in available night time flows to ensure a continuous 100 mgd flow rate from the GWRS.
11
INITIAL EXPANSION OF THE GWR SYSTEM
ENGINEER’S REPORT 10 ORANGE COUNTY WATER DISTRICT
FIGURE 4 – EXPECTED AVAILABLE FLOW FROM OCSD PLANT 1 AFTER 2012
Based on the available flow and an annual production of 131,000 afy can be achieved. Water Production staff at OCWD has proven that they can operate the GWRS AWPF to match the diurnal curve of flow availability from OCSD. There is a difference in the flow available from OCSD and amount GWRS can produce due to the losses across the membrane processes. The GWRS needs a feed flow rate of 134 mgd in order to product 100 mgd of product water to account for losses through the membrane processes. The expansion would account for an increase of 31,000 afy to the existing GWRS.
Groundwater Recharge and Injection
As production increases out of the GWRS, it is important to consider where the water will be recharged. It is estimated that the maximum amount the Talbert Injection Barrier can inject is approximately 42 mgd depending on barrier conditions. Current GWRS flow provides sufficient water to satisfy the needs of the Talbert Injection Barrier. Excess flows from the current GWRS are recharged at Kraemer and Miller Basins in Anaheim, after the Talbert Injection Barrier needs are satisfied. The amount the injection barrier can accommodate will vary seasonally, with injection rates generally lower in the winter time when groundwater levels are higher. Table 1 lists estimates on where the GWRS water can be delivered. It is listed in two periods based on current operations and the GWRS Initial Expansion in 2012.
Projected OCSD Flow and GWRS Feed
0.00
20.00
40.00
60.00
80.00
100.00
120.00
140.00
160.00
180.00
0:00
1:00
2:00
3:00
4:00
5:00
6:00
7:00
8:00
9:00
10:00
11:00
12:00
13:00
14:00
15:00
16:00
17:00
18:00
19:00
20:00
21:00
22:00
23:00
Hour
MG
D
OCSD Available Flow 130 MGD GWRS Feed
17 MG Surplus
15 MG Deficit
12
INITIAL EXPANSION OF THE GWR SYSTEM
ENGINEER’S REPORT 11 ORANGE COUNTY WATER DISTRICT
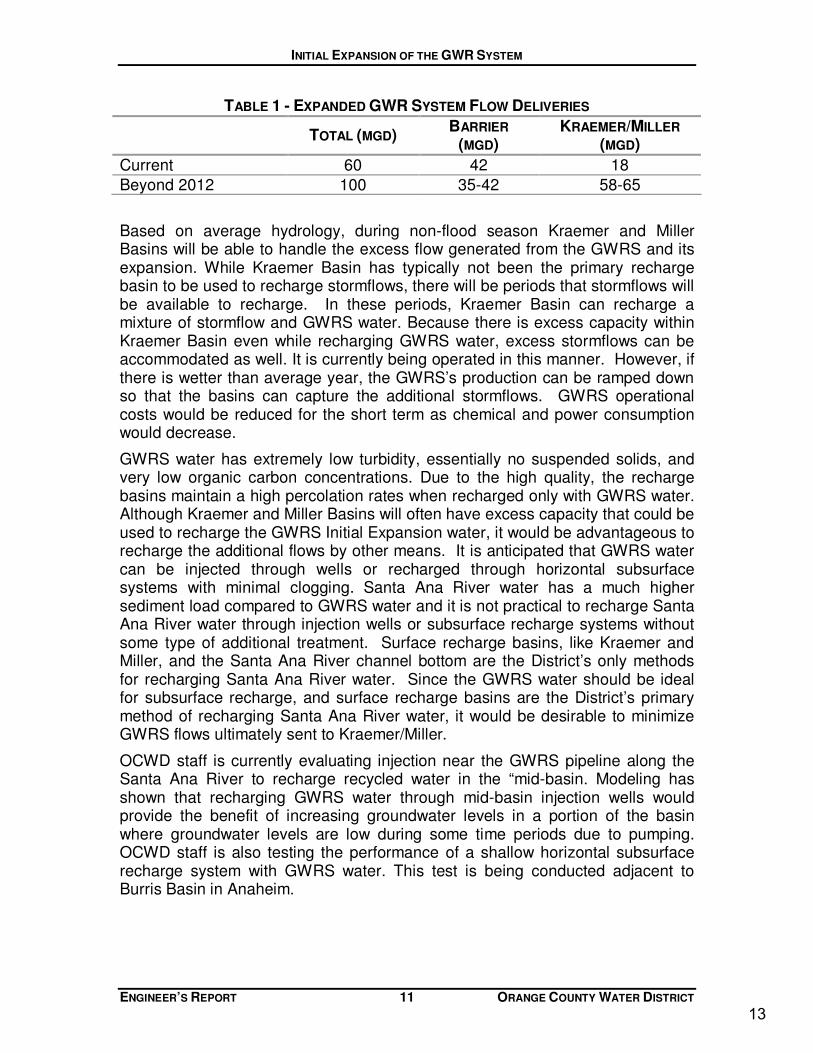
TABLE 1 - EXPANDED GWR SYSTEM FLOW DELIVERIES
TOTAL (MGD) BARRIER
(MGD) KRAEMER/MILLER
(MGD)
Current 60 42 18
Beyond 2012 100 35-42 58-65
Based on average hydrology, during non-flood season Kraemer and Miller Basins will be able to handle the excess flow generated from the GWRS and its expansion. While Kraemer Basin has typically not been the primary recharge basin to be used to recharge stormflows, there will be periods that stormflows will be available to recharge. In these periods, Kraemer Basin can recharge a mixture of stormflow and GWRS water. Because there is excess capacity within Kraemer Basin even while recharging GWRS water, excess stormflows can be accommodated as well. It is currently being operated in this manner. However, if there is wetter than average year, the GWRS’s production can be ramped down so that the basins can capture the additional stormflows. GWRS operational costs would be reduced for the short term as chemical and power consumption would decrease.
GWRS water has extremely low turbidity, essentially no suspended solids, and very low organic carbon concentrations. Due to the high quality, the recharge basins maintain a high percolation rates when recharged only with GWRS water. Although Kraemer and Miller Basins will often have excess capacity that could be used to recharge the GWRS Initial Expansion water, it would be advantageous to recharge the additional flows by other means. It is anticipated that GWRS water can be injected through wells or recharged through horizontal subsurface systems with minimal clogging. Santa Ana River water has a much higher sediment load compared to GWRS water and it is not practical to recharge Santa Ana River water through injection wells or subsurface recharge systems without some type of additional treatment. Surface recharge basins, like Kraemer and Miller, and the Santa Ana River channel bottom are the District’s only methods for recharging Santa Ana River water. Since the GWRS water should be ideal for subsurface recharge, and surface recharge basins are the District’s primary method of recharging Santa Ana River water, it would be desirable to minimize GWRS flows ultimately sent to Kraemer/Miller.
OCWD staff is currently evaluating injection near the GWRS pipeline along the Santa Ana River to recharge recycled water in the “mid-basin. Modeling has shown that recharging GWRS water through mid-basin injection wells would provide the benefit of increasing groundwater levels in a portion of the basin where groundwater levels are low during some time periods due to pumping. OCWD staff is also testing the performance of a shallow horizontal subsurface recharge system with GWRS water. This test is being conducted adjacent to Burris Basin in Anaheim.
13
INITIAL EXPANSION OF THE GWR SYSTEM
ENGINEER’S REPORT 12 ORANGE COUNTY WATER DISTRICT
Organizational Impact
It is anticipated that additional staff would be required to support the increased treatment capacity of the GWRS. It is currently estimated that six additional staff would be required to support the increased production. This increase includes three new operators, two maintenance technicians, and one instrumentation and electrical technician. As part of the design, a more detailed staffing plan would be generated to determine the actual need. It is not anticipated that this would increase the amount of samples analyzed by the Water Quality Assurance Laboratory so there is no increase in staffing required there.
Cost
A preliminary unit cost of $543/af has been estimated. This is based on numerous assumptions including:
• All costs escalated to the midpoint of construction in 2011
• Entire reverse osmosis building is constructed to accommodate additional expansions up to 130 mgd
• A contingency on capital improvement included
• Capital cost component financed at five percent over 30 years
• No grants or subsidies
• 92 percent online efficiency
• Annual four percent increase in all operating costs
• Six additional staff
14
INITIAL EXPANSION OF THE GWR SYSTEM
ENGINEER’S REPORT 13 ORANGE COUNTY WATER DISTRICT
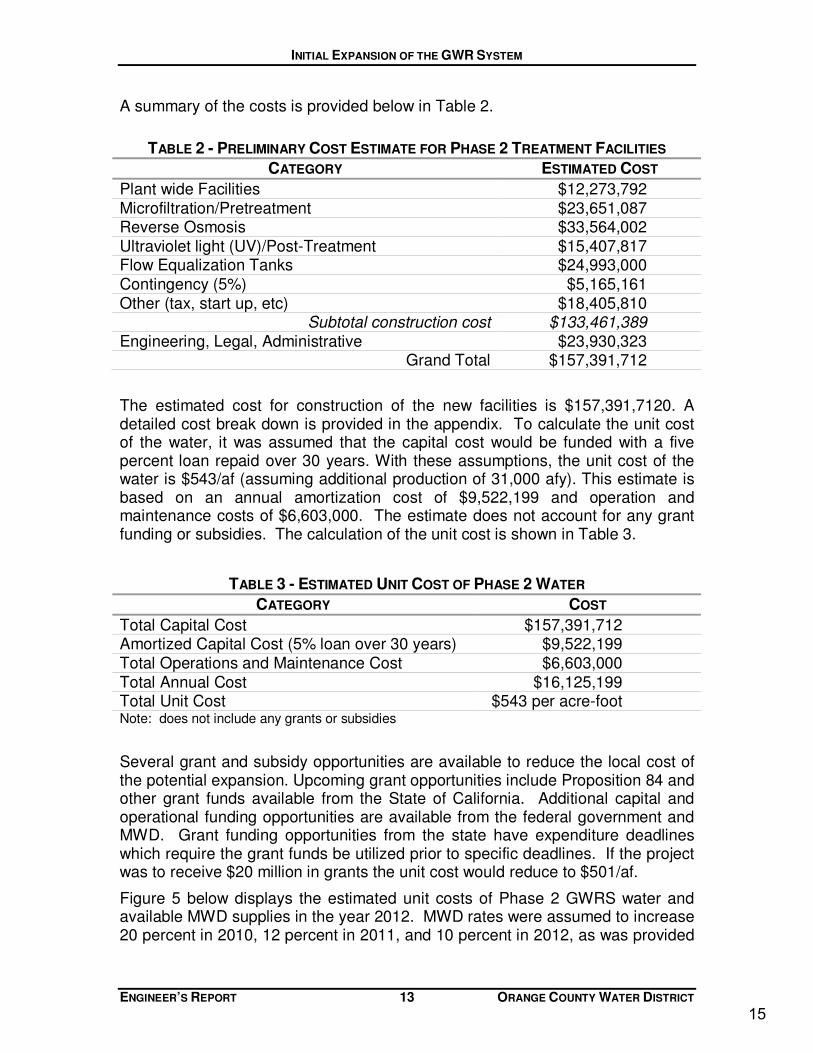
A summary of the costs is provided below in Table 2.
TABLE 2 - PRELIMINARY COST ESTIMATE FOR PHASE 2 TREATMENT FACILITIES
CATEGORY ESTIMATED COST
Plant wide Facilities $12,273,792 Microfiltration/Pretreatment $23,651,087 Reverse Osmosis $33,564,002 Ultraviolet light (UV)/Post-Treatment $15,407,817 Flow Equalization Tanks $24,993,000 Contingency (5%) $5,165,161 Other (tax, start up, etc) $18,405,810
Subtotal construction cost $133,461,389 Engineering, Legal, Administrative $23,930,323
Grand Total $157,391,712
The estimated cost for construction of the new facilities is $157,391,7120. A detailed cost break down is provided in the appendix. To calculate the unit cost of the water, it was assumed that the capital cost would be funded with a five percent loan repaid over 30 years. With these assumptions, the unit cost of the water is $543/af (assuming additional production of 31,000 afy). This estimate is based on an annual amortization cost of $9,522,199 and operation and maintenance costs of $6,603,000. The estimate does not account for any grant funding or subsidies. The calculation of the unit cost is shown in Table 3.
TABLE 3 - ESTIMATED UNIT COST OF PHASE 2 WATER
CATEGORY COST
Total Capital Cost $157,391,712 Amortized Capital Cost (5% loan over 30 years) $9,522,199 Total Operations and Maintenance Cost $6,603,000 Total Annual Cost $16,125,199 Total Unit Cost $543 per acre-foot Note: does not include any grants or subsidies
Several grant and subsidy opportunities are available to reduce the local cost of the potential expansion. Upcoming grant opportunities include Proposition 84 and other grant funds available from the State of California. Additional capital and operational funding opportunities are available from the federal government and MWD. Grant funding opportunities from the state have expenditure deadlines which require the grant funds be utilized prior to specific deadlines. If the project was to receive $20 million in grants the unit cost would reduce to $501/af.
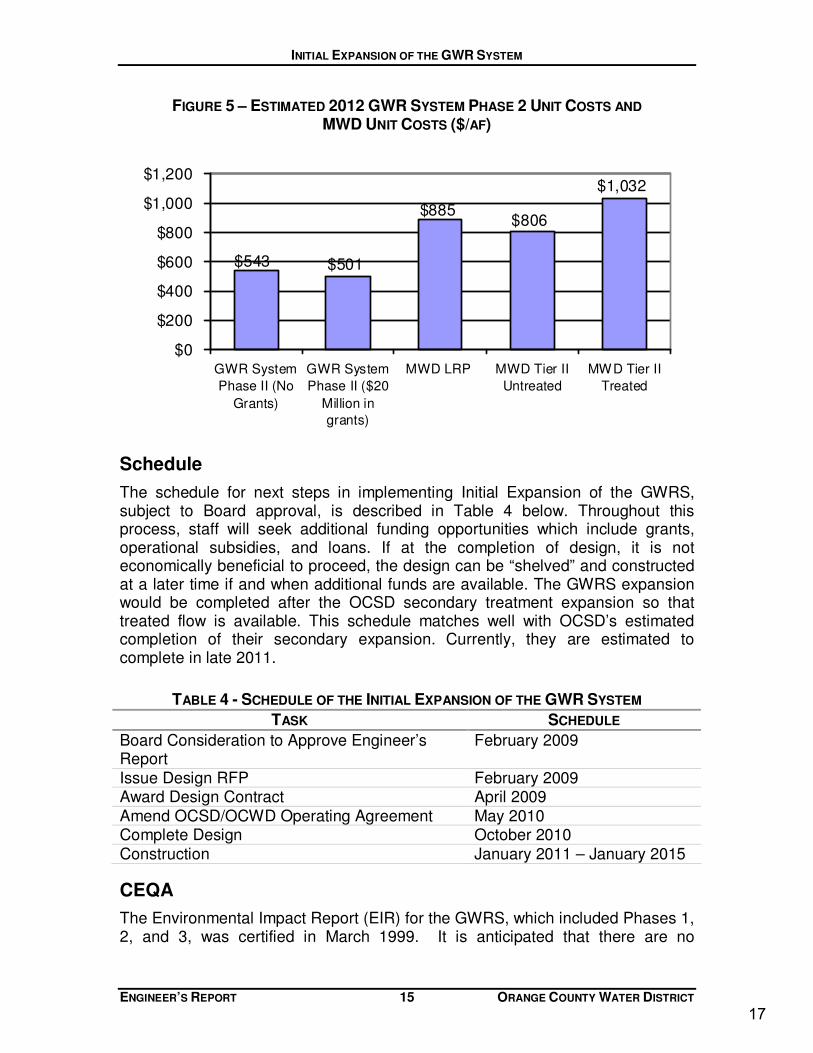
Figure 5 below displays the estimated unit costs of Phase 2 GWRS water and available MWD supplies in the year 2012. MWD rates were assumed to increase 20 percent in 2010, 12 percent in 2011, and 10 percent in 2012, as was provided
15
INITIAL EXPANSION OF THE GWR SYSTEM
ENGINEER’S REPORT 14 ORANGE COUNTY WATER DISTRICT
in a January 13, 2009 budget and rates report to the MWD Board. The projected Tier II MWD rates include estimated equivalent $/af amounts for the MWD readiness-to-serve and capacity charges.
The MWD Local Resources Program (LRP) unit cost shown in Figure 5 is used to calculate LRP subsidy eligibility. MWD uses the difference between the two unit costs of water to calculate what the MWD LRP subsidy should be. In this case, the GWRS Initial Expansion unit cost is lower than the MWD LRP rate so no subsidy would be received. Opportunities still may exist to qualify if the unit cost of the GWRS Expansion would be higher than anticipated due to reduced production due to a wet scenario or other unknown increase. The District could enter into a MWD LRP agreement to ensure the Unit 2 water cost never exceeded the MWD LRP rate which is estimated at $885/af in 2012.
As the GWRS is creating new water supplies, it is reducing the amount of MWD Tier II treated water that must be purchased by the Producers. Currently, 10,000 to 30,000 afy of MWD Tier II water is being purchased. This amount will increase with projected increasing water demands and/or with a lower future Basin Production Percentage. Untreated Tier II MWD supplies are estimated to cost $806/af in 2012. Purchasing this water is a viable future option to assist the District in raising the Basin Production Percentage and allowing the Producers to avoid the treatment surcharge portion of the MWD rate structure. The cost of this water is estimated to be very similar to the cost of the GWRS Expansion cost assuming $20 million in grants are received for the project. Both options could be implemented in the future. The GWRS Expansion would be a higher ranked option for the following reasons:
• You are creating more reliable local water supplies;
• The water supply has a lower total dissolved solids concentration to benefit the groundwater basin;
• GWRS supplies are drought proof;
• If imported water supplies are allocated by MWD; OCWD could then be limited to only purchasing up to about 7,000 afy of this water without paying possibly much higher penalty rates.
16
INITIAL EXPANSION OF THE GWR SYSTEM
ENGINEER’S REPORT 15 ORANGE COUNTY WATER DISTRICT
FIGURE 5 – ESTIMATED 2012 GWR SYSTEM PHASE 2 UNIT COSTS AND
MWD UNIT COSTS ($/AF)
Schedule
The schedule for next steps in implementing Initial Expansion of the GWRS, subject to Board approval, is described in Table 4 below. Throughout this process, staff will seek additional funding opportunities which include grants, operational subsidies, and loans. If at the completion of design, it is not economically beneficial to proceed, the design can be “shelved” and constructed at a later time if and when additional funds are available. The GWRS expansion would be completed after the OCSD secondary treatment expansion so that treated flow is available. This schedule matches well with OCSD’s estimated completion of their secondary expansion. Currently, they are estimated to complete in late 2011.
TABLE 4 - SCHEDULE OF THE INITIAL EXPANSION OF THE GWR SYSTEM
TASK SCHEDULE
Board Consideration to Approve Engineer’s Report
February 2009
Issue Design RFP February 2009 Award Design Contract April 2009 Amend OCSD/OCWD Operating Agreement May 2010 Complete Design October 2010 Construction January 2011 – January 2015
CEQA
The Environmental Impact Report (EIR) for the GWRS, which included Phases 1, 2, and 3, was certified in March 1999. It is anticipated that there are no
$1,032
$806
$501$543
$885
$0
$200
$400
$600
$800
$1,000
$1,200
GWR System
Phase II (No
Grants)
GWR System
Phase II ($20
Million in
grants)
MWD LRP MWD Tier II
Untreated
MWD Tier II
Treated
17
INITIAL EXPANSION OF THE GWR SYSTEM
ENGINEER’S REPORT 16 ORANGE COUNTY WATER DISTRICT
additional environmental analysis required. The District would need to receive an amended permit or a new permit from the Regional Water Quality Control Board (RWQCB). The California Department of Health (DPH) is involved in this process and the conditions required by DPH are included in the permit issued by the Regional Board.
Recommendation
The Initial Expansion of the GWRS is a viable project and is feasible and necessary and of general benefit to the lands in the Orange County Water District. With droughts and environmental challenges affecting imported supplies, the new water produced through the Initial Expansion of GWRS is a cost effective water supply that exceed the water quality of any other source of water.
18

INITIAL EXPANSION OF THE GWR SYSTEM
Appendix
19
INITIAL EXPANSION OF THE GWR SYSTEM
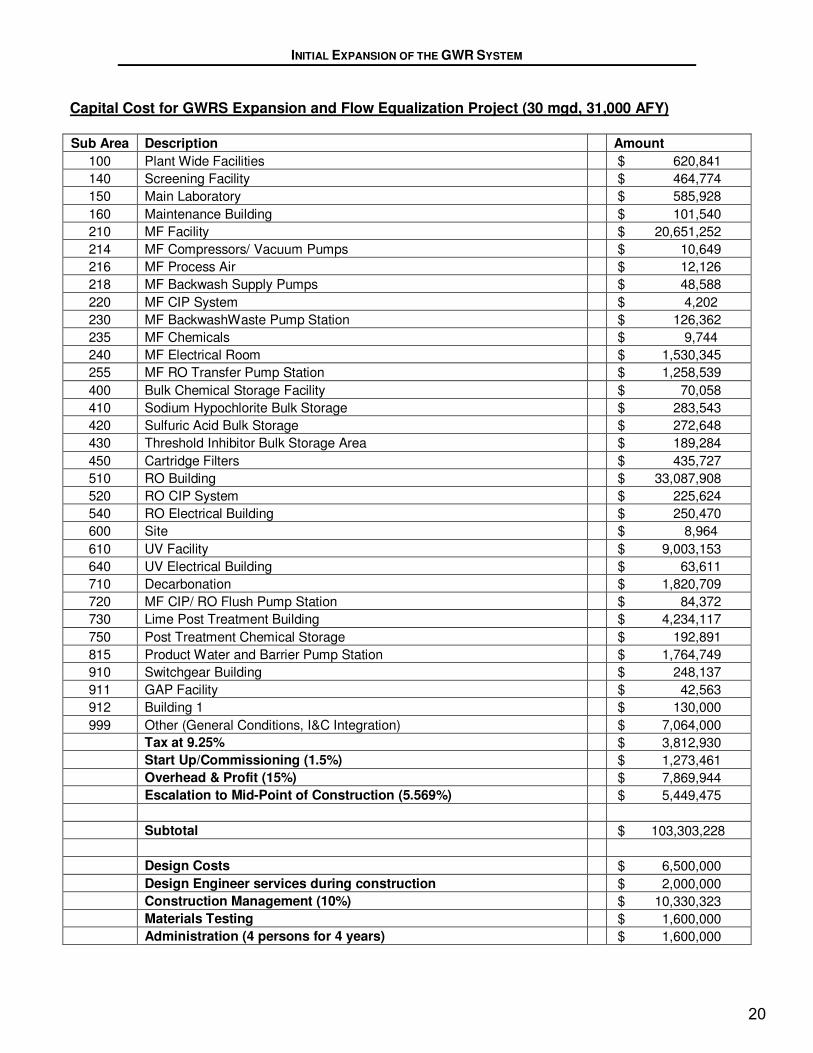
Capital Cost for GWRS Expansion and Flow Equalization Project (30 mgd, 31,000 AFY)
Sub Area Description Amount
100 Plant Wide Facilities $ 620,841
140 Screening Facility $ 464,774
150 Main Laboratory $ 585,928
160 Maintenance Building $ 101,540
210 MF Facility $ 20,651,252
214 MF Compressors/ Vacuum Pumps $ 10,649
216 MF Process Air $ 12,126
218 MF Backwash Supply Pumps $ 48,588
220 MF CIP System $ 4,202
230 MF BackwashWaste Pump Station $ 126,362
235 MF Chemicals $ 9,744
240 MF Electrical Room $ 1,530,345
255 MF RO Transfer Pump Station $ 1,258,539
400 Bulk Chemical Storage Facility $ 70,058
410 Sodium Hypochlorite Bulk Storage $ 283,543
420 Sulfuric Acid Bulk Storage $ 272,648
430 Threshold Inhibitor Bulk Storage Area $ 189,284
450 Cartridge Filters $ 435,727
510 RO Building $ 33,087,908
520 RO CIP System $ 225,624
540 RO Electrical Building $ 250,470
600 Site $ 8,964
610 UV Facility $ 9,003,153
640 UV Electrical Building $ 63,611
710 Decarbonation $ 1,820,709
720 MF CIP/ RO Flush Pump Station $ 84,372
730 Lime Post Treatment Building $ 4,234,117
750 Post Treatment Chemical Storage $ 192,891
815 Product Water and Barrier Pump Station $ 1,764,749
910 Switchgear Building $ 248,137
911 GAP Facility $ 42,563
912 Building 1 $ 130,000
999 Other (General Conditions, I&C Integration) $ 7,064,000
Tax at 9.25% $ 3,812,930
Start Up/Commissioning (1.5%) $ 1,273,461
Overhead & Profit (15%) $ 7,869,944
Escalation to Mid-Point of Construction (5.569%) $ 5,449,475
Subtotal $ 103,303,228
Design Costs $ 6,500,000
Design Engineer services during construction $ 2,000,000
Construction Management (10%) $ 10,330,323
Materials Testing $ 1,600,000
Administration (4 persons for 4 years) $ 1,600,000
20
INITIAL EXPANSION OF THE GWR SYSTEM
Outreach $ 1,200,000
Legal Services $ 200,000
Outside Consultants $ 400,000
Surveying Services $ 100,000
Contingency (5%) $ 5,165,161
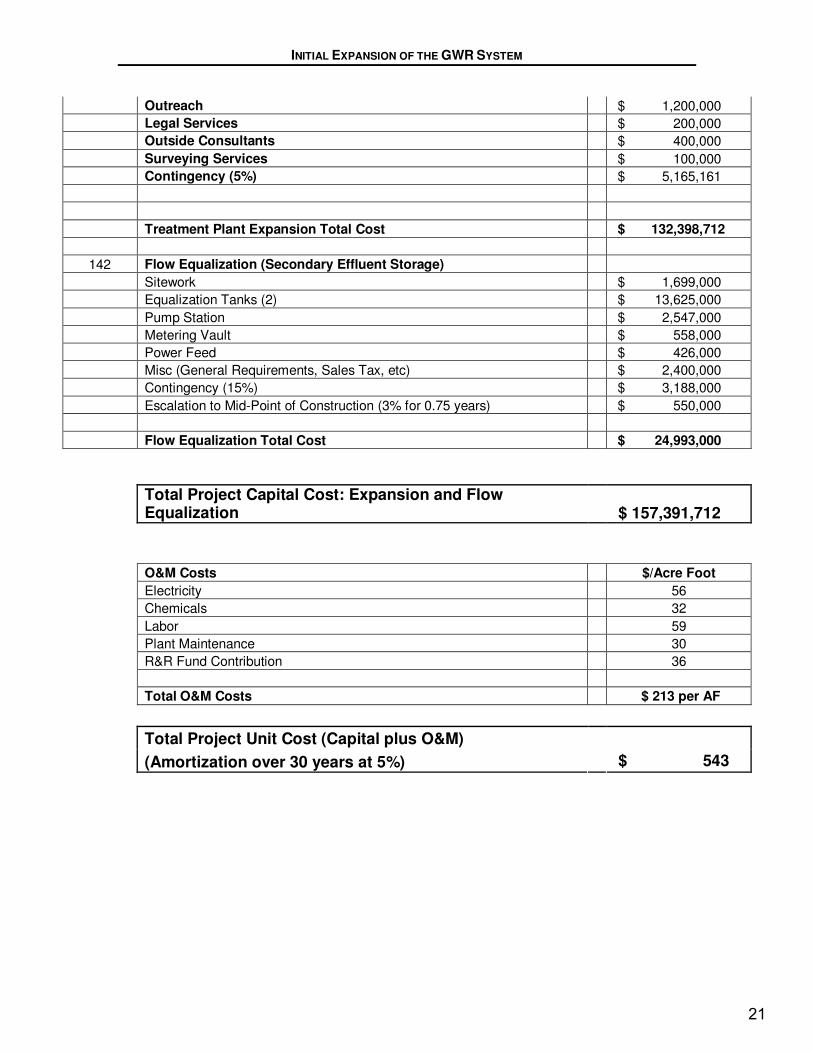
Treatment Plant Expansion Total Cost $ 132,398,712
142 Flow Equalization (Secondary Effluent Storage)
Sitework $ 1,699,000
Equalization Tanks (2) $ 13,625,000
Pump Station $ 2,547,000
Metering Vault $ 558,000
Power Feed $ 426,000
Misc (General Requirements, Sales Tax, etc) $ 2,400,000
Contingency (15%) $ 3,188,000
Escalation to Mid-Point of Construction (3% for 0.75 years) $ 550,000
Flow Equalization Total Cost $ 24,993,000
Total Project Capital Cost: Expansion and Flow Equalization $ 157,391,712
O&M Costs $/Acre Foot
Electricity 56
Chemicals 32
Labor 59
Plant Maintenance 30
R&R Fund Contribution 36
Total O&M Costs $ 213 per AF
Total Project Unit Cost (Capital plus O&M)
(Amortization over 30 years at 5%) $ 543
21
22

23