Embed Size (px)
Citation preview
OECD Economic Surveys
Hungary
May 2016
OVERVIEW
www.oecd.org/eco/surveys/economic-survey-hungary.htm
This Overview is extracted from the 2016 Economic Survey of Hungary. The Survey is published on the responsibility of the Economic and Development Review Committee (EDRC) of the OECD, which is charged with the examination of the economic situation of member countries.
This document and any map included herein are without prejudice to the status of or sovereignty over any territory, to the delimitation of international frontiers and boundaries and to the name of any territory, city or area
OECD Economic Surveys: Hungary© OECD 2016
You can copy, download or print OECD content for your own use, and you can include excerpts from OECD publications, databases and multimedia products in your own documents, presentations, blogs, websites and teaching materials, provided that suitable acknowledgment of OECD as source and copyright owner is given. All requests for public or commercial use and translation rights should be submitted to [email protected]. Requests for permission to photocopy portions of this material for public or commercial use shall be addressed directly to the Copyright Clearance Center (CCC) at [email protected] or the Centre français d’exploitation du droit de copie (CFC) at [email protected].
OECD Economic Surveys: Hungary 2016
© OECD 2016
9
Executive summary
● Strong economic growth has returned
● Investment has started to pick up
● Low-skilled have weak labour market outcomes
EXECUTIVE SUMMARY
OECD ECONOMIC SURVEYS: HUNGARY 2016 © OECD 201610
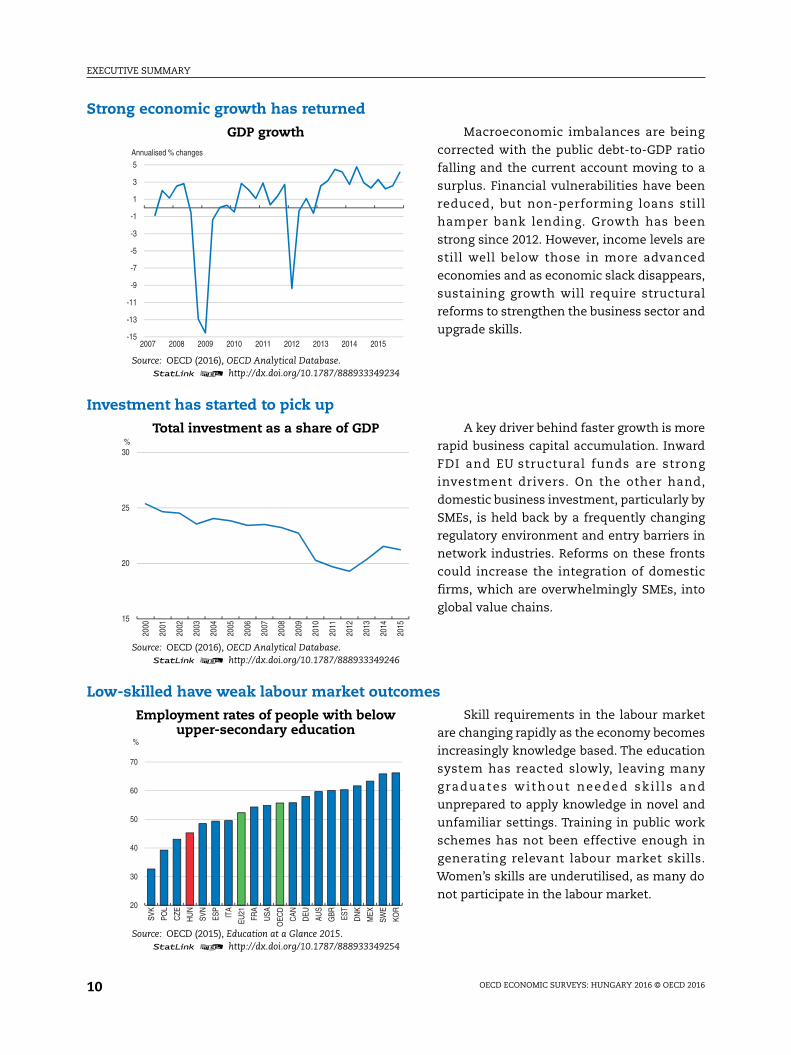
Strong economic growth has returned
GDP growth
Source: OECD (2016), OECD Analytical Database.1 2 http://dx.doi.org/10.1787/888933349234
Macroeconomic imbalances are being
corrected with the public debt-to-GDP ratio
falling and the current account moving to a
surplus. Financial vulnerabilities have been
reduced, but non-performing loans still
hamper bank lending. Growth has been
strong since 2012. However, income levels are
still well below those in more advanced
economies and as economic slack disappears,
sustaining growth will require structural
reforms to strengthen the business sector and
upgrade skills.
Investment has started to pick up
Total investment as a share of GDP
Source: OECD (2016), OECD Analytical Database.1 2 http://dx.doi.org/10.1787/888933349246
A key driver behind faster growth is more
rapid business capital accumulation. Inward
FDI and EU structural funds are strong
investment drivers. On the other hand,
domestic business investment, particularly by
SMEs, is held back by a frequently changing
regulatory environment and entry barriers in
network industries. Reforms on these fronts
could increase the integration of domestic
firms, which are overwhelmingly SMEs, into
global value chains.
Low-skilled have weak labour market outcomes
Employment rates of people with belowupper-secondary education
Source: OECD (2015), Education at a Glance 2015.1 2 http://dx.doi.org/10.1787/888933349254
Skill requirements in the labour market
are changing rapidly as the economy becomes
increasingly knowledge based. The education
system has reacted slowly, leaving many
graduates without needed ski l ls and
unprepared to apply knowledge in novel and
unfamiliar settings. Training in public work
schemes has not been effective enough in
generating relevant labour market skills.
Women’s skills are underutilised, as many do
not participate in the labour market.
-15
-13
-11
-9
-7
-5
-3
-1
1
3
5
2007 2008 2009 2010 2011 2012 2013 2014 2015
Annualised % changes
15
20
25
30
2000
2001
2002
2003
2004
2005
2006
2007
2008
2009
2010
2011
2012
2013
2014
2015
%
20
30
40
50
60
70
SVK
POL
CZE
HU
N
SVN
ESP
ITA
EU21
FRA
USA
OEC
D
CAN
DEU AU
S
GBR ES
T
DN
K
MEX
SWE
KOR
%
EXECUTIVE SUMMARY
OECD ECONOMIC SURVEYS: HUNGARY 2016 © OECD 2016 11
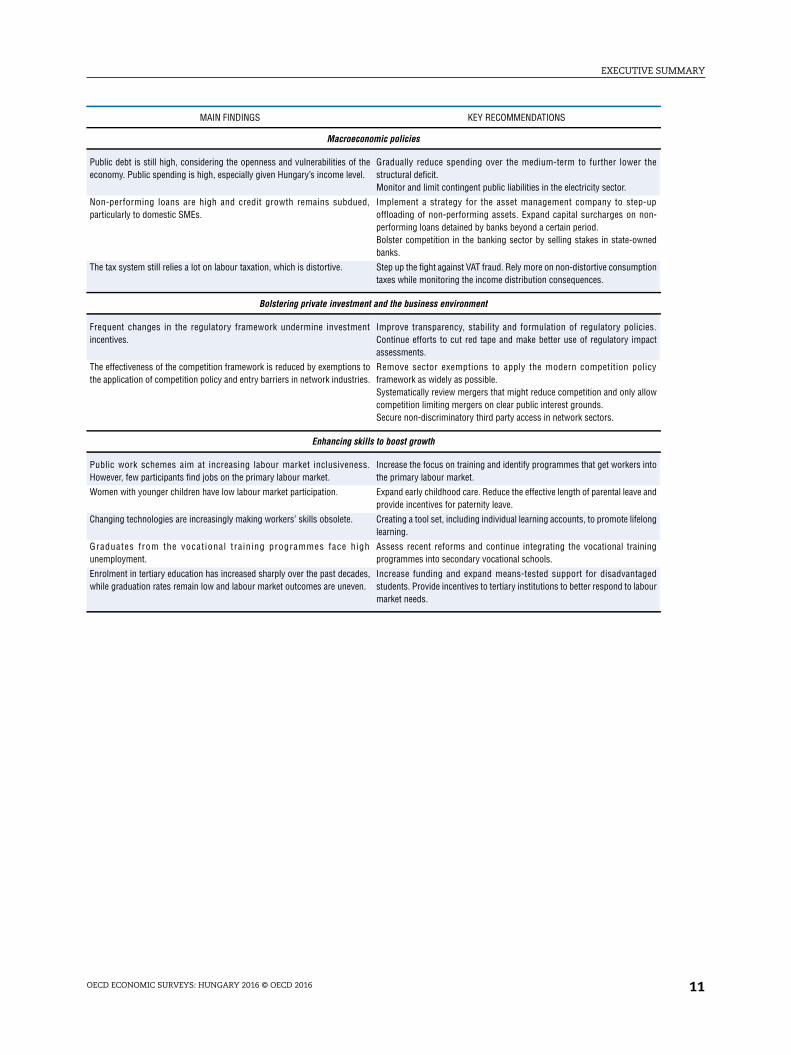
MAIN FINDINGS KEY RECOMMENDATIONS
Macroeconomic policies
Public debt is still high, considering the openness and vulnerabilities of theeconomy. Public spending is high, especially given Hungary’s income level.
Gradually reduce spending over the medium-term to further lower thestructural deficit.Monitor and limit contingent public liabilities in the electricity sector.
Non-performing loans are high and credit growth remains subdued,particularly to domestic SMEs.
Implement a strategy for the asset management company to step-upoffloading of non-performing assets. Expand capital surcharges on non-performing loans detained by banks beyond a certain period.Bolster competition in the banking sector by selling stakes in state-ownedbanks.
The tax system still relies a lot on labour taxation, which is distortive. Step up the fight against VAT fraud. Rely more on non-distortive consumptiontaxes while monitoring the income distribution consequences.
Bolstering private investment and the business environment
Frequent changes in the regulatory framework undermine investmentincentives.
Improve transparency, stability and formulation of regulatory policies.Continue efforts to cut red tape and make better use of regulatory impactassessments.
The effectiveness of the competition framework is reduced by exemptions tothe application of competition policy and entry barriers in network industries.
Remove sector exemptions to apply the modern competition policyframework as widely as possible.Systematically review mergers that might reduce competition and only allowcompetition limiting mergers on clear public interest grounds.Secure non-discriminatory third party access in network sectors.
Enhancing skills to boost growth
Public work schemes aim at increasing labour market inclusiveness.However, few participants find jobs on the primary labour market.
Increase the focus on training and identify programmes that get workers intothe primary labour market.
Women with younger children have low labour market participation. Expand early childhood care. Reduce the effective length of parental leave andprovide incentives for paternity leave.
Changing technologies are increasingly making workers’ skills obsolete. Creating a tool set, including individual learning accounts, to promote lifelonglearning.
Graduates from the vocat ional training programmes face highunemployment.
Assess recent reforms and continue integrating the vocational trainingprogrammes into secondary vocational schools.
Enrolment in tertiary education has increased sharply over the past decades,while graduation rates remain low and labour market outcomes are uneven.
Increase funding and expand means-tested support for disadvantagedstudents. Provide incentives to tertiary institutions to better respond to labourmarket needs.

OECD Economic Surveys: Hungary 2016
© OECD 2016
13
Assessment and recommendations
● Resuming inclusive growth
● The recovery is broadening
● Bolstering business investment
● Enhancing skills to boost growth
ASSESSMENT AND RECOMMENDATIONS
OECD ECONOMIC SURVEYS: HUNGARY 2016 © OECD 201614
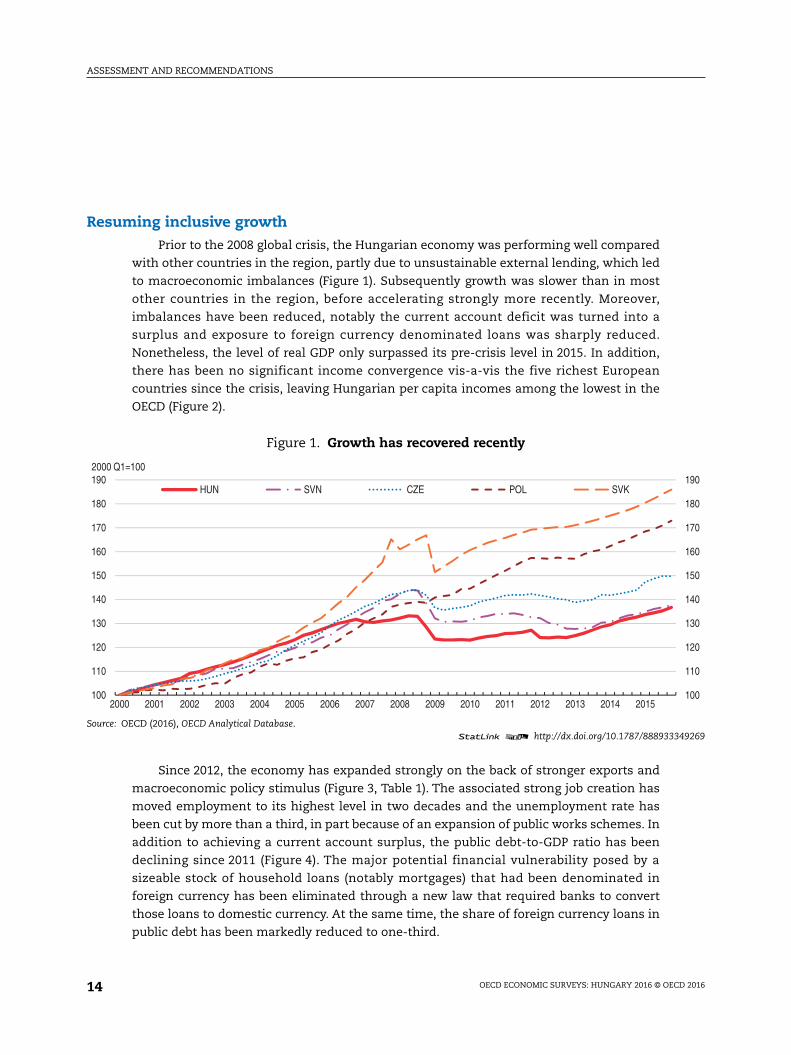
Resuming inclusive growthPrior to the 2008 global crisis, the Hungarian economy was performing well compared
with other countries in the region, partly due to unsustainable external lending, which led
to macroeconomic imbalances (Figure 1). Subsequently growth was slower than in most
other countries in the region, before accelerating strongly more recently. Moreover,
imbalances have been reduced, notably the current account deficit was turned into a
surplus and exposure to foreign currency denominated loans was sharply reduced.
Nonetheless, the level of real GDP only surpassed its pre-crisis level in 2015. In addition,
there has been no significant income convergence vis-a-vis the five richest European
countries since the crisis, leaving Hungarian per capita incomes among the lowest in the
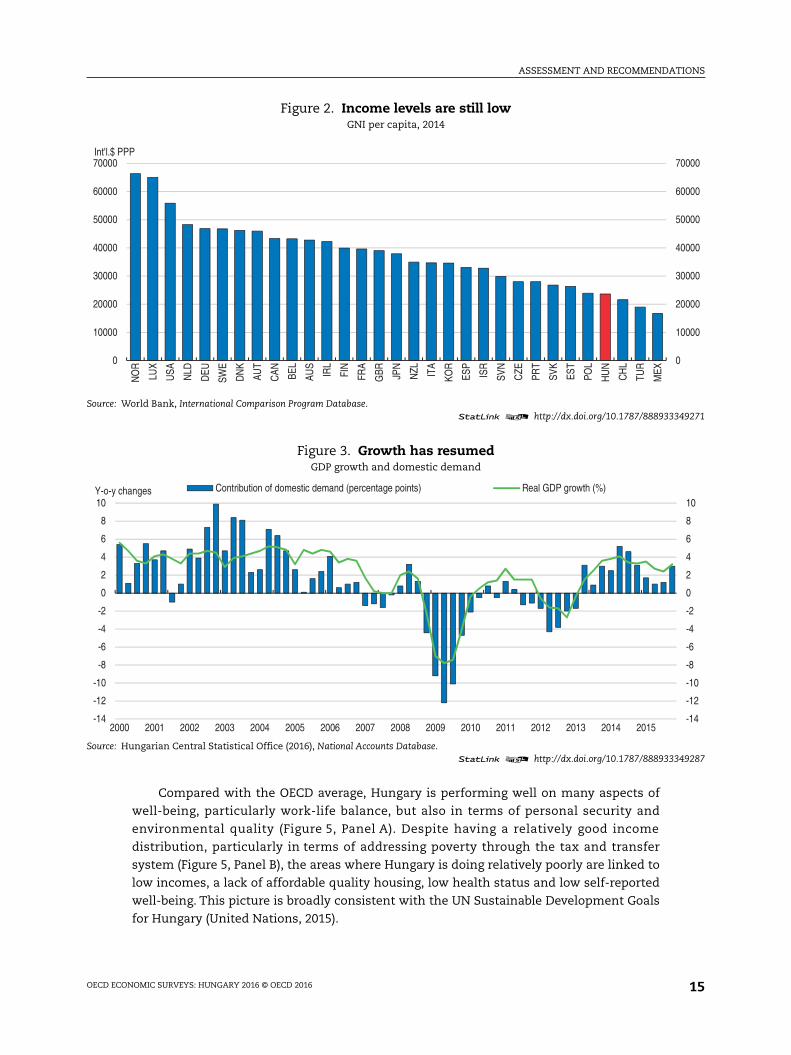
OECD (Figure 2).
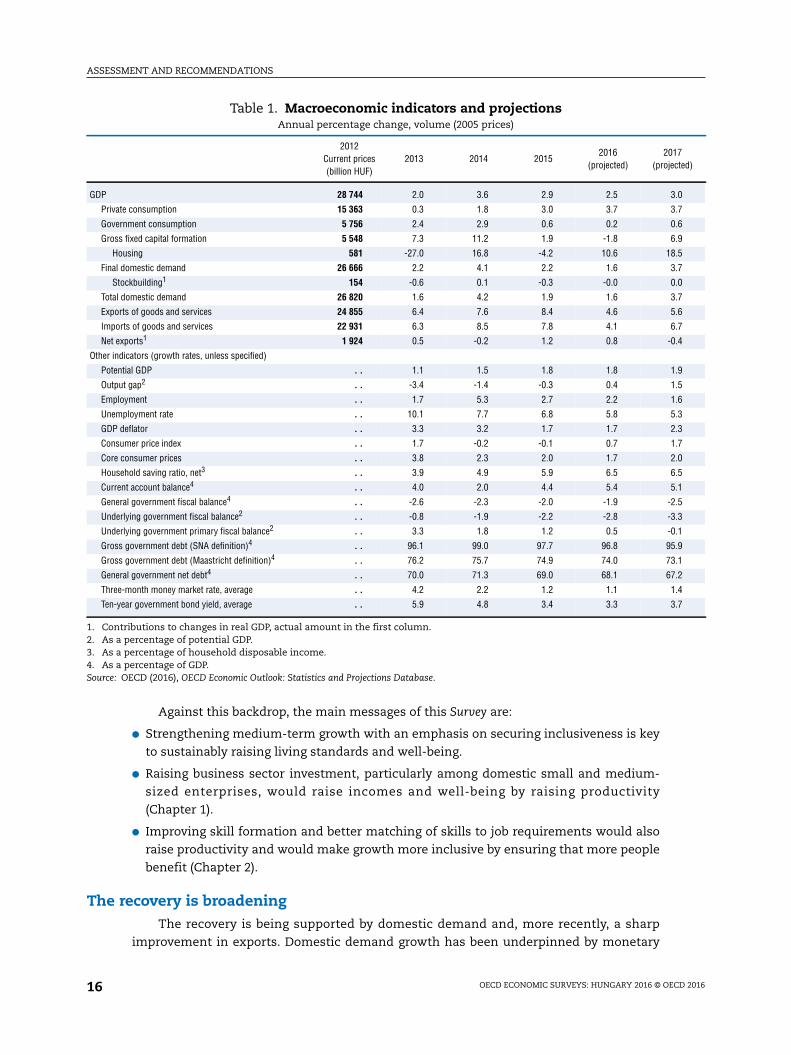
Since 2012, the economy has expanded strongly on the back of stronger exports and
macroeconomic policy stimulus (Figure 3, Table 1). The associated strong job creation has
moved employment to its highest level in two decades and the unemployment rate has
been cut by more than a third, in part because of an expansion of public works schemes. In
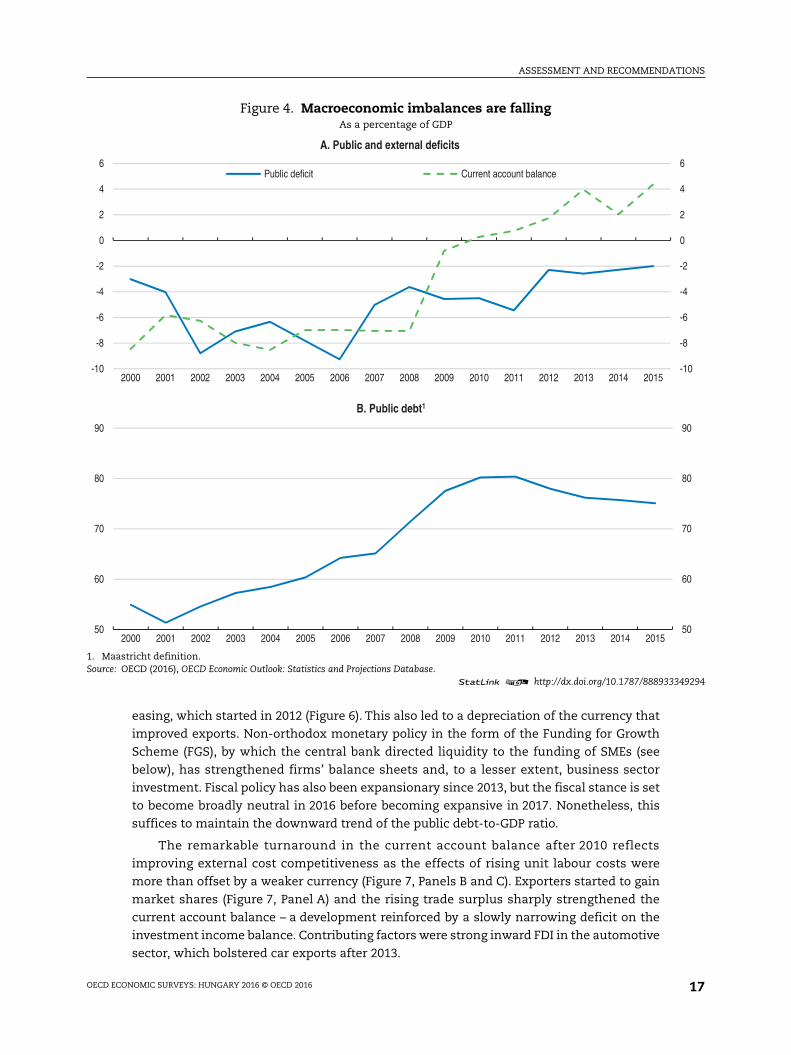
addition to achieving a current account surplus, the public debt-to-GDP ratio has been
declining since 2011 (Figure 4). The major potential financial vulnerability posed by a
sizeable stock of household loans (notably mortgages) that had been denominated in
foreign currency has been eliminated through a new law that required banks to convert
those loans to domestic currency. At the same time, the share of foreign currency loans in
public debt has been markedly reduced to one-third.
Figure 1. Growth has recovered recently
Source: OECD (2016), OECD Analytical Database.1 2 http://dx.doi.org/10.1787/888933349269
100
110
120
130
140
150
160
170
180
190
100
110
120
130
140
150
160
170
180
190
2000 2001 2002 2003 2004 2005 2006 2007 2008 2009 2010 2011 2012 2013 2014 2015
2000 Q1=100
HUN SVN CZE POL SVK
ASSESSMENT AND RECOMMENDATIONS
OECD ECONOMIC SURVEYS: HUNGARY 2016 © OECD 2016 15
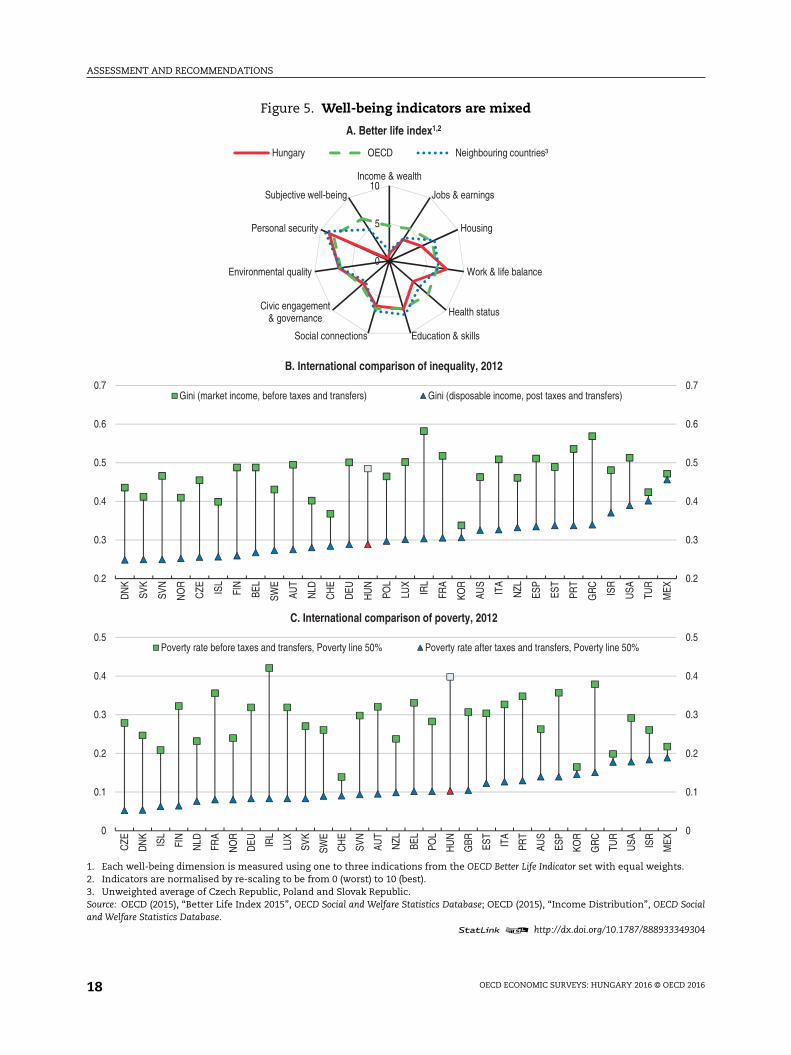
Compared with the OECD average, Hungary is performing well on many aspects of
well-being, particularly work-life balance, but also in terms of personal security and
environmental quality (Figure 5, Panel A). Despite having a relatively good income
distribution, particularly in terms of addressing poverty through the tax and transfer
system (Figure 5, Panel B), the areas where Hungary is doing relatively poorly are linked to
low incomes, a lack of affordable quality housing, low health status and low self-reported
well-being. This picture is broadly consistent with the UN Sustainable Development Goals
for Hungary (United Nations, 2015).
Figure 2. Income levels are still lowGNI per capita, 2014
Source: World Bank, International Comparison Program Database.1 2 http://dx.doi.org/10.1787/888933349271
Figure 3. Growth has resumedGDP growth and domestic demand
Source: Hungarian Central Statistical Office (2016), National Accounts Database.1 2 http://dx.doi.org/10.1787/888933349287
0
10000
20000
30000
40000
50000
60000
70000
0
10000
20000
30000
40000
50000
60000
70000
NO
R
LUX
USA NLD
DEU
SWE
DN
K
AUT
CAN BE
L
AUS
IRL
FIN
FRA
GBR JP
N
NZL ITA
KOR
ESP
ISR
SVN
CZE
PRT
SVK
EST
POL
HU
N
CH
L
TUR
MEX
Int'l.$ PPP
-14
-12
-10
-8
-6
-4
-2
0
2
4
6
8
10
-14
-12
-10
-8
-6
-4
-2
0
2
4
6
8
10
2000 2001 2002 2003 2004 2005 2006 2007 2008 2009 2010 2011 2012 2013 2014 2015
Y-o-y changes Contribution of domestic demand (percentage points) Real GDP growth (%)
ASSESSMENT AND RECOMMENDATIONS
OECD ECONOMIC SURVEYS: HUNGARY 2016 © OECD 201616
Against this backdrop, the main messages of this Survey are:
● Strengthening medium-term growth with an emphasis on securing inclusiveness is key
to sustainably raising living standards and well-being.
● Raising business sector investment, particularly among domestic small and medium-
sized enterprises, would raise incomes and well-being by raising productivity
(Chapter 1).
● Improving skill formation and better matching of skills to job requirements would also
raise productivity and would make growth more inclusive by ensuring that more people
benefit (Chapter 2).
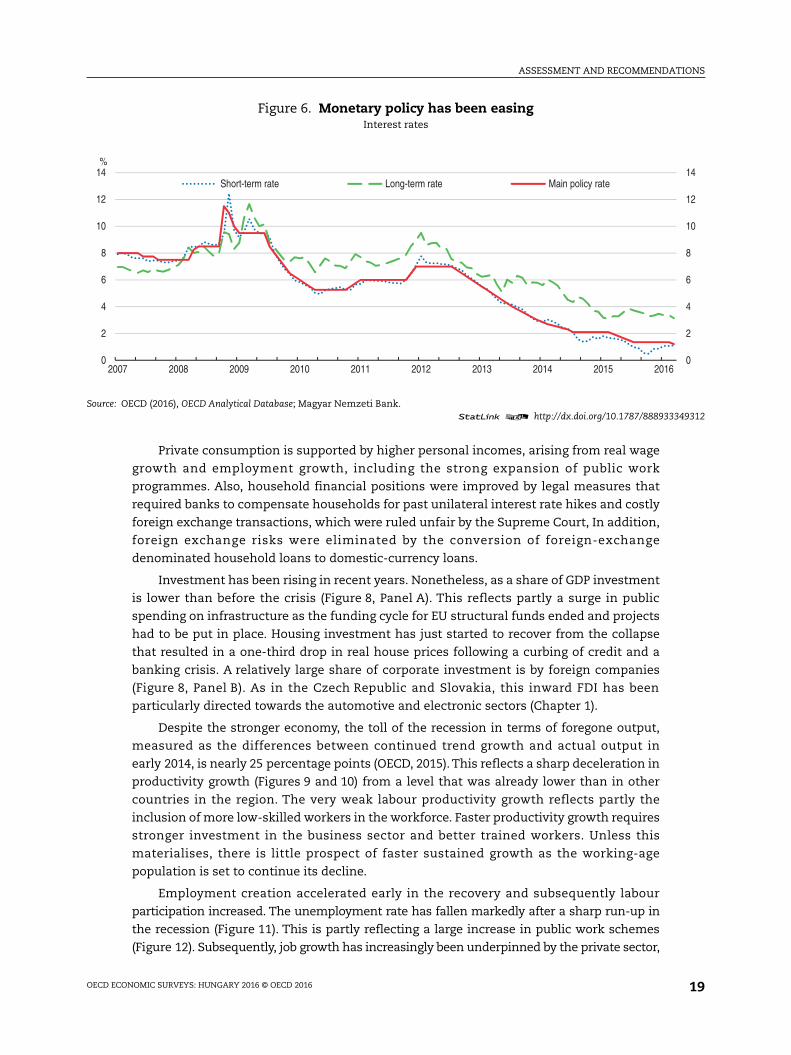
The recovery is broadeningThe recovery is being supported by domestic demand and, more recently, a sharp
improvement in exports. Domestic demand growth has been underpinned by monetary
Table 1. Macroeconomic indicators and projectionsAnnual percentage change, volume (2005 prices)
2012Current prices(billion HUF)
2013 2014 20152016
(projected)2017
(projected)
GDP 28 744 2.0 3.6 2.9 2.5 3.0
Private consumption 15 363 0.3 1.8 3.0 3.7 3.7
Government consumption 5 756 2.4 2.9 0.6 0.2 0.6
Gross fixed capital formation 5 548 7.3 11.2 1.9 -1.8 6.9
Housing 581 -27.0 16.8 -4.2 10.6 18.5
Final domestic demand 26 666 2.2 4.1 2.2 1.6 3.7
Stockbuilding1 154 -0.6 0.1 -0.3 -0.0 0.0
Total domestic demand 26 820 1.6 4.2 1.9 1.6 3.7
Exports of goods and services 24 855 6.4 7.6 8.4 4.6 5.6
Imports of goods and services 22 931 6.3 8.5 7.8 4.1 6.7
Net exports1 1 924 0.5 -0.2 1.2 0.8 -0.4
Other indicators (growth rates, unless specified)
Potential GDP . . 1.1 1.5 1.8 1.8 1.9
Output gap2 . . -3.4 -1.4 -0.3 0.4 1.5
Employment . . 1.7 5.3 2.7 2.2 1.6
Unemployment rate . . 10.1 7.7 6.8 5.8 5.3
GDP deflator . . 3.3 3.2 1.7 1.7 2.3
Consumer price index . . 1.7 -0.2 -0.1 0.7 1.7
Core consumer prices . . 3.8 2.3 2.0 1.7 2.0
Household saving ratio, net3 . . 3.9 4.9 5.9 6.5 6.5
Current account balance4 . . 4.0 2.0 4.4 5.4 5.1
General government fiscal balance4 . . -2.6 -2.3 -2.0 -1.9 -2.5
Underlying government fiscal balance2 . . -0.8 -1.9 -2.2 -2.8 -3.3
Underlying government primary fiscal balance2 . . 3.3 1.8 1.2 0.5 -0.1
Gross government debt (SNA definition)4 . . 96.1 99.0 97.7 96.8 95.9
Gross government debt (Maastricht definition)4 . . 76.2 75.7 74.9 74.0 73.1
General government net debt4 . . 70.0 71.3 69.0 68.1 67.2
Three-month money market rate, average . . 4.2 2.2 1.2 1.1 1.4
Ten-year government bond yield, average . . 5.9 4.8 3.4 3.3 3.7
1. Contributions to changes in real GDP, actual amount in the first column.2. As a percentage of potential GDP.3. As a percentage of household disposable income.4. As a percentage of GDP.Source: OECD (2016), OECD Economic Outlook: Statistics and Projections Database.
ASSESSMENT AND RECOMMENDATIONS
OECD ECONOMIC SURVEYS: HUNGARY 2016 © OECD 2016 17
easing, which started in 2012 (Figure 6). This also led to a depreciation of the currency that
improved exports. Non-orthodox monetary policy in the form of the Funding for Growth
Scheme (FGS), by which the central bank directed liquidity to the funding of SMEs (see
below), has strengthened firms’ balance sheets and, to a lesser extent, business sector
investment. Fiscal policy has also been expansionary since 2013, but the fiscal stance is set
to become broadly neutral in 2016 before becoming expansive in 2017. Nonetheless, this
suffices to maintain the downward trend of the public debt-to-GDP ratio.
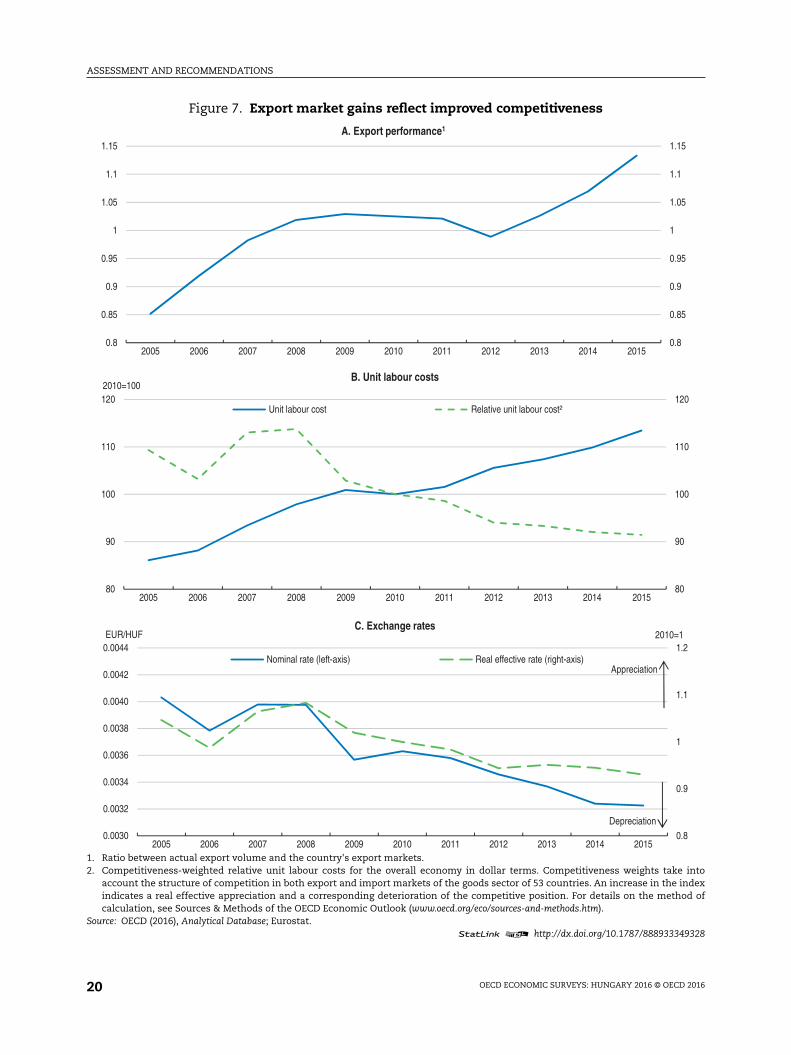
The remarkable turnaround in the current account balance after 2010 reflects
improving external cost competitiveness as the effects of rising unit labour costs were
more than offset by a weaker currency (Figure 7, Panels B and C). Exporters started to gain
market shares (Figure 7, Panel A) and the rising trade surplus sharply strengthened the
current account balance – a development reinforced by a slowly narrowing deficit on the
investment income balance. Contributing factors were strong inward FDI in the automotive
sector, which bolstered car exports after 2013.
Figure 4. Macroeconomic imbalances are fallingAs a percentage of GDP
1. Maastricht definition.Source: OECD (2016), OECD Economic Outlook: Statistics and Projections Database.
1 2 http://dx.doi.org/10.1787/888933349294
50
60
70
80
90
50
60
70
80
90
2000 2001 2002 2003 2004 2005 2006 2007 2008 2009 2010 2011 2012 2013 2014 2015
B. Public debt1
-10
-8
-6
-4
-2
0
2
4
6
-10
-8
-6
-4
-2
0
2
4
6
2000 2001 2002 2003 2004 2005 2006 2007 2008 2009 2010 2011 2012 2013 2014 2015
A. Public and external deficits
Public deficit Current account balance
ASSESSMENT AND RECOMMENDATIONS
OECD ECONOMIC SURVEYS: HUNGARY 2016 © OECD 201618
Figure 5. Well-being indicators are mixed
1. Each well-being dimension is measured using one to three indications from the OECD Better Life Indicator set with equal weights.2. Indicators are normalised by re-scaling to be from 0 (worst) to 10 (best).3. Unweighted average of Czech Republic, Poland and Slovak Republic.Source: OECD (2015), “Better Life Index 2015”, OECD Social and Welfare Statistics Database; OECD (2015), “Income Distribution”, OECD Socialand Welfare Statistics Database.
1 2 http://dx.doi.org/10.1787/888933349304
0
5
10Income & wealth
Jobs & earnings
Housing
Work & life balance
Health status
Education & skillsSocial connections
Civic engagement& governance
Environmental quality
Personal security
Subjective well-being
A. Better life index1,2
Hungary OECD Neighbouring countries³
0.2
0.3
0.4
0.5
0.6
0.7
0.2
0.3
0.4
0.5
0.6
0.7
DN
K
SVK
SVN
NO
R
CZE IS
L
FIN
BEL
SWE
AUT
NLD
CH
E
DEU
HU
N
POL
LUX
IRL
FRA
KOR
AUS
ITA
NZL
ESP
EST
PRT
GR
C
ISR
USA
TUR
MEX
B. International comparison of inequality, 2012
Gini (market income, before taxes and transfers) Gini (disposable income, post taxes and transfers)
0
0.1
0.2
0.3
0.4
0.5
0
0.1
0.2
0.3
0.4
0.5
CZE
DN
K
ISL
FIN
NLD
FRA
NO
R
DEU IR
L
LUX
SVK
SWE
CH
E
SVN
AUT
NZL
BEL
POL
HU
N
GBR ES
T
ITA
PRT
AUS
ESP
KOR
GR
C
TUR
USA IS
R
MEX
C. International comparison of poverty, 2012
Poverty rate before taxes and transfers, Poverty line 50% Poverty rate after taxes and transfers, Poverty line 50%
ASSESSMENT AND RECOMMENDATIONS
OECD ECONOMIC SURVEYS: HUNGARY 2016 © OECD 2016 19
Private consumption is supported by higher personal incomes, arising from real wage
growth and employment growth, including the strong expansion of public work
programmes. Also, household financial positions were improved by legal measures that
required banks to compensate households for past unilateral interest rate hikes and costly
foreign exchange transactions, which were ruled unfair by the Supreme Court, In addition,
foreign exchange risks were eliminated by the conversion of foreign-exchange
denominated household loans to domestic-currency loans.
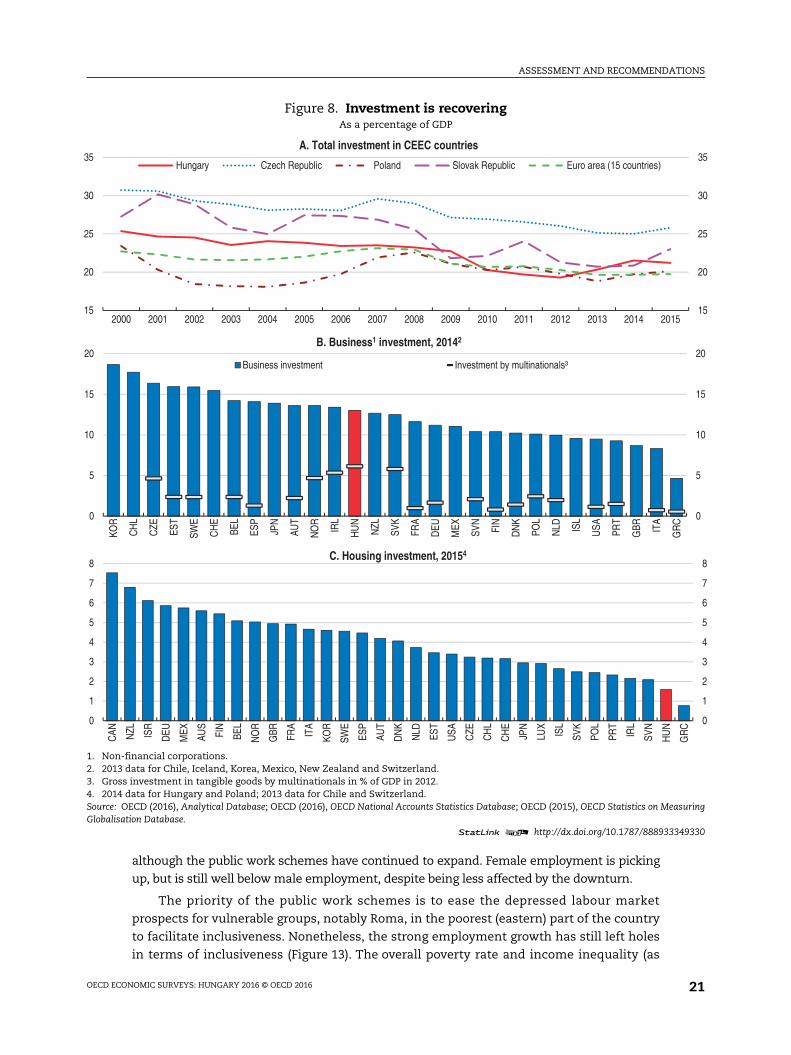
Investment has been rising in recent years. Nonetheless, as a share of GDP investment
is lower than before the crisis (Figure 8, Panel A). This reflects partly a surge in public
spending on infrastructure as the funding cycle for EU structural funds ended and projects
had to be put in place. Housing investment has just started to recover from the collapse
that resulted in a one-third drop in real house prices following a curbing of credit and a
banking crisis. A relatively large share of corporate investment is by foreign companies
(Figure 8, Panel B). As in the Czech Republic and Slovakia, this inward FDI has been
particularly directed towards the automotive and electronic sectors (Chapter 1).
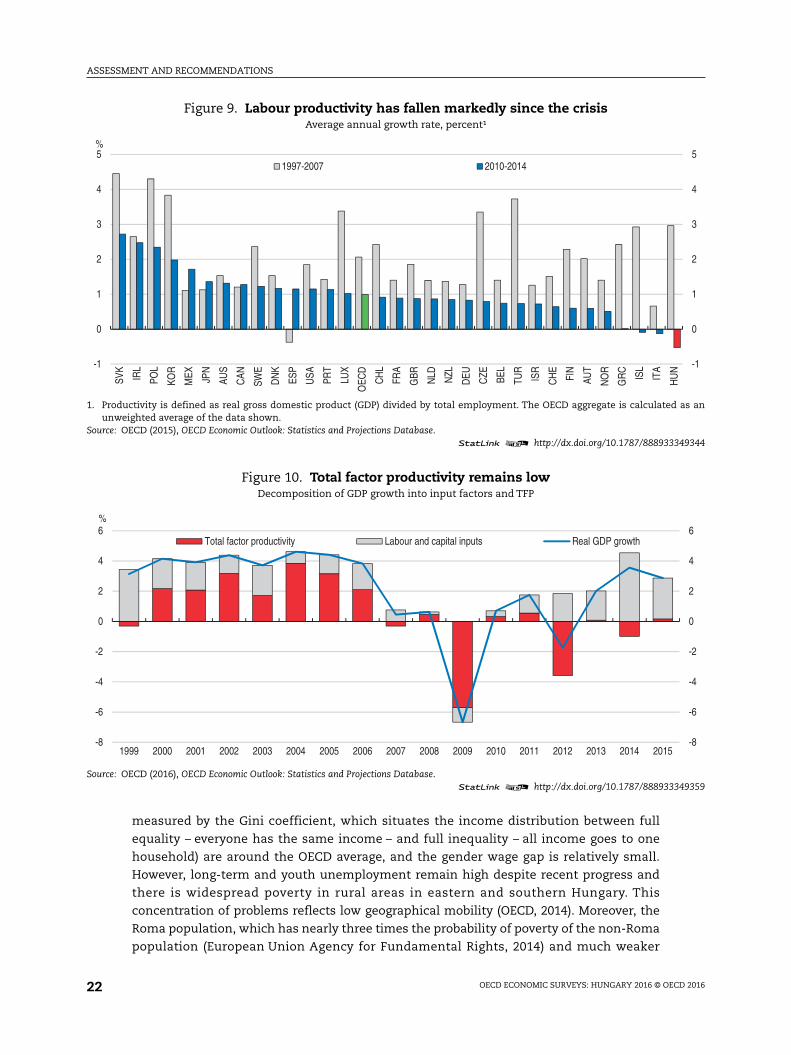
Despite the stronger economy, the toll of the recession in terms of foregone output,
measured as the differences between continued trend growth and actual output in
early 2014, is nearly 25 percentage points (OECD, 2015). This reflects a sharp deceleration in
productivity growth (Figures 9 and 10) from a level that was already lower than in other
countries in the region. The very weak labour productivity growth reflects partly the
inclusion of more low-skilled workers in the workforce. Faster productivity growth requires
stronger investment in the business sector and better trained workers. Unless this
materialises, there is little prospect of faster sustained growth as the working-age
population is set to continue its decline.
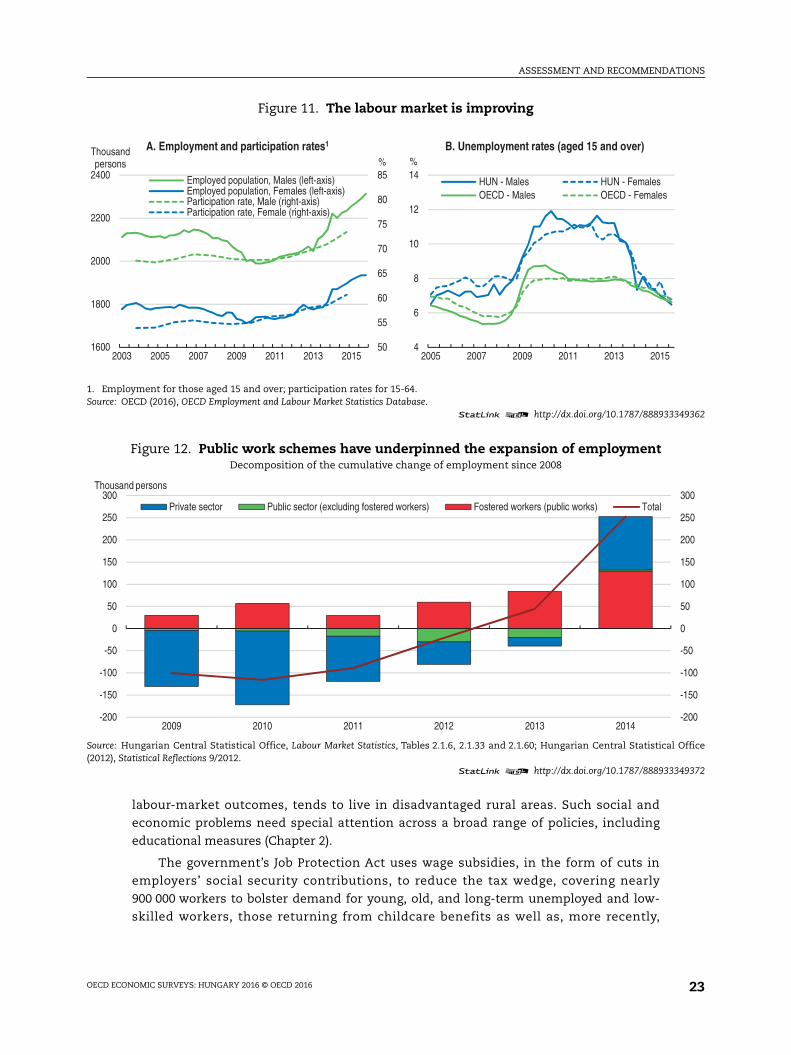
Employment creation accelerated early in the recovery and subsequently labour
participation increased. The unemployment rate has fallen markedly after a sharp run-up in
the recession (Figure 11). This is partly reflecting a large increase in public work schemes
(Figure 12). Subsequently, job growth has increasingly been underpinned by the private sector,
Figure 6. Monetary policy has been easingInterest rates
Source: OECD (2016), OECD Analytical Database; Magyar Nemzeti Bank.1 2 http://dx.doi.org/10.1787/888933349312
0
2
4
6
8
10
12
14
0
2
4
6
8
10
12
14
2007 2008 2009 2010 2011 2012 2013 2014 2015 2016
%
Short-term rate Long-term rate Main policy rate
ASSESSMENT AND RECOMMENDATIONS
OECD ECONOMIC SURVEYS: HUNGARY 2016 © OECD 201620
Figure 7. Export market gains reflect improved competitiveness
1. Ratio between actual export volume and the country's export markets.2. Competitiveness-weighted relative unit labour costs for the overall economy in dollar terms. Competitiveness weights take into
account the structure of competition in both export and import markets of the goods sector of 53 countries. An increase in the indexindicates a real effective appreciation and a corresponding deterioration of the competitive position. For details on the method ofcalculation, see Sources & Methods of the OECD Economic Outlook (www.oecd.org/eco/sources-and-methods.htm).
Source: OECD (2016), Analytical Database; Eurostat.1 2 http://dx.doi.org/10.1787/888933349328
0.8
0.9
1
1.1
1.2
0.0030
0.0032
0.0034
0.0036
0.0038
0.0040
0.0042
0.0044
2005 2006 2007 2008 2009 2010 2011 2012 2013 2014 2015
2010=1EUR/HUFC. Exchange rates
Nominal rate (left-axis) Real effective rate (right-axis)Appreciation
Depreciation
0.8
0.85
0.9
0.95
1
1.05
1.1
1.15
0.8
0.85
0.9
0.95
1
1.05
1.1
1.15
2005 2006 2007 2008 2009 2010 2011 2012 2013 2014 2015
A. Export performance1
80
90
100
110
120
80
90
100
110
120
2005 2006 2007 2008 2009 2010 2011 2012 2013 2014 2015
2010=100B. Unit labour costs
Unit labour cost Relative unit labour cost²
ASSESSMENT AND RECOMMENDATIONS
OECD ECONOMIC SURVEYS: HUNGARY 2016 © OECD 2016 21
although the public work schemes have continued to expand. Female employment is picking
up, but is still well below male employment, despite being less affected by the downturn.
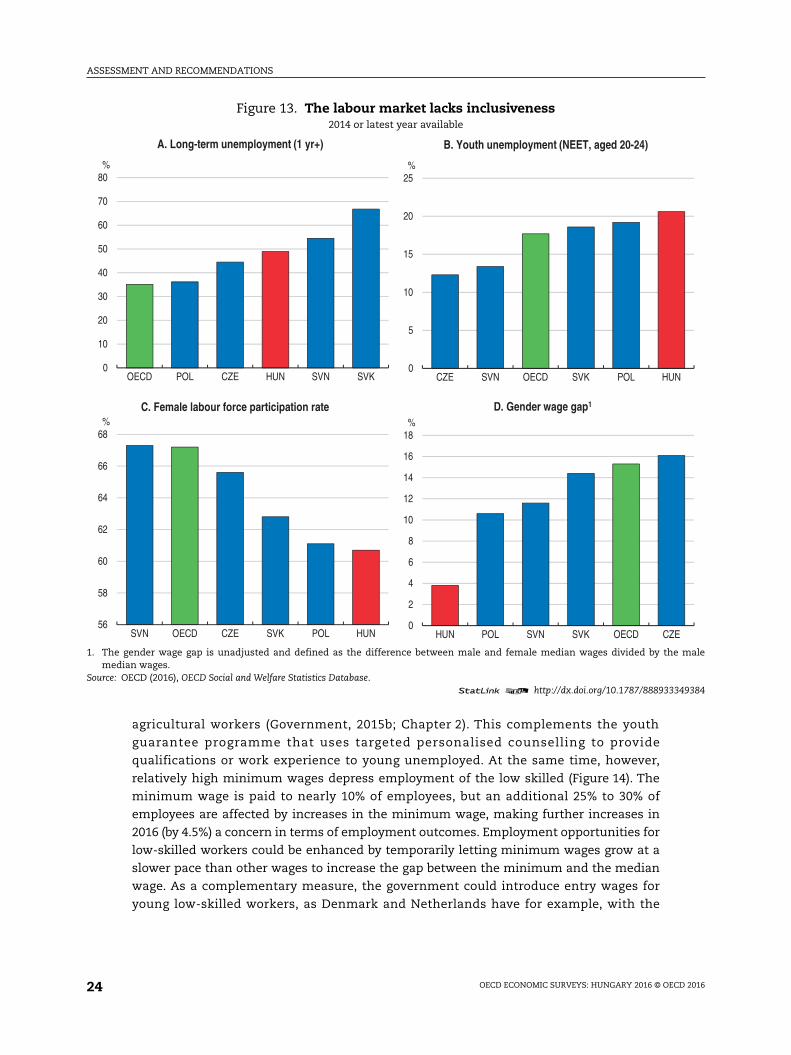
The priority of the public work schemes is to ease the depressed labour market
prospects for vulnerable groups, notably Roma, in the poorest (eastern) part of the country
to facilitate inclusiveness. Nonetheless, the strong employment growth has still left holes
in terms of inclusiveness (Figure 13). The overall poverty rate and income inequality (as
Figure 8. Investment is recoveringAs a percentage of GDP
1. Non-financial corporations.2. 2013 data for Chile, Iceland, Korea, Mexico, New Zealand and Switzerland.3. Gross investment in tangible goods by multinationals in % of GDP in 2012.4. 2014 data for Hungary and Poland; 2013 data for Chile and Switzerland.Source: OECD (2016), Analytical Database; OECD (2016), OECD National Accounts Statistics Database; OECD (2015), OECD Statistics on MeasuringGlobalisation Database.
1 2 http://dx.doi.org/10.1787/888933349330
0
1
2
3
4
5
6
7
8
0
1
2
3
4
5
6
7
8
CAN NZL ISR
DEU
MEX
AUS
FIN
BEL
NO
R
GBR FR
A
ITA
KOR
SWE
ESP
AUT
DN
K
NLD ES
T
USA CZE
CH
L
CH
E
JPN
LUX
ISL
SVK
POL
PRT
IRL
SVN
HU
N
GR
C
C. Housing investment, 20154
15
20
25
30
35
15
20
25
30
35
2000 2001 2002 2003 2004 2005 2006 2007 2008 2009 2010 2011 2012 2013 2014 2015
A. Total investment in CEEC countries
Hungary Czech Republic Poland Slovak Republic Euro area (15 countries)
0
5
10
15
20
0
5
10
15
20
KOR
CH
L
CZE ES
T
SWE
CH
E
BEL
ESP
JPN
AUT
NO
R
IRL
HU
N
NZL
SVK
FRA
DEU
MEX
SVN
FIN
DN
K
POL
NLD IS
L
USA PR
T
GBR IT
A
GR
C
B. Business1 investment, 20142
Business investment Investment by multinationals³
ASSESSMENT AND RECOMMENDATIONS
OECD ECONOMIC SURVEYS: HUNGARY 2016 © OECD 201622
measured by the Gini coefficient, which situates the income distribution between full
equality – everyone has the same income – and full inequality – all income goes to one
household) are around the OECD average, and the gender wage gap is relatively small.
However, long-term and youth unemployment remain high despite recent progress and
there is widespread poverty in rural areas in eastern and southern Hungary. This
concentration of problems reflects low geographical mobility (OECD, 2014). Moreover, the
Roma population, which has nearly three times the probability of poverty of the non-Roma
population (European Union Agency for Fundamental Rights, 2014) and much weaker
Figure 9. Labour productivity has fallen markedly since the crisisAverage annual growth rate, percent¹
1. Productivity is defined as real gross domestic product (GDP) divided by total employment. The OECD aggregate is calculated as anunweighted average of the data shown.
Source: OECD (2015), OECD Economic Outlook: Statistics and Projections Database.1 2 http://dx.doi.org/10.1787/888933349344
Figure 10. Total factor productivity remains lowDecomposition of GDP growth into input factors and TFP
Source: OECD (2016), OECD Economic Outlook: Statistics and Projections Database.1 2 http://dx.doi.org/10.1787/888933349359
-1
0
1
2
3
4
5
-1
0
1
2
3
4
5
SVK
IRL
POL
KOR
MEX JP
N
AUS
CAN
SWE
DN
K
ESP
USA PR
T
LUX
OEC
D
CH
L
FRA
GBR NLD NZL
DEU CZE BE
L
TUR
ISR
CH
E
FIN
AUT
NO
R
GR
C
ISL
ITA
HU
N
%
1997-2007 2010-2014
-8
-6
-4
-2
0
2
4
6
-8
-6
-4
-2
0
2
4
6
1999 2000 2001 2002 2003 2004 2005 2006 2007 2008 2009 2010 2011 2012 2013 2014 2015
%
Total factor productivity Labour and capital inputs Real GDP growth
ASSESSMENT AND RECOMMENDATIONS
OECD ECONOMIC SURVEYS: HUNGARY 2016 © OECD 2016 23
labour-market outcomes, tends to live in disadvantaged rural areas. Such social and
economic problems need special attention across a broad range of policies, including
educational measures (Chapter 2).
The government’s Job Protection Act uses wage subsidies, in the form of cuts in
employers’ social security contributions, to reduce the tax wedge, covering nearly
900 000 workers to bolster demand for young, old, and long-term unemployed and low-
skilled workers, those returning from childcare benefits as well as, more recently,
Figure 11. The labour market is improving
1. Employment for those aged 15 and over; participation rates for 15-64.Source: OECD (2016), OECD Employment and Labour Market Statistics Database.
1 2 http://dx.doi.org/10.1787/888933349362
Figure 12. Public work schemes have underpinned the expansion of employmentDecomposition of the cumulative change of employment since 2008
Source: Hungarian Central Statistical Office, Labour Market Statistics, Tables 2.1.6, 2.1.33 and 2.1.60; Hungarian Central Statistical Office(2012), Statistical Reflections 9/2012.
1 2 http://dx.doi.org/10.1787/888933349372
4
6
8
10
12
14
2005 2007 2009 2011 2013 2015
%B. Unemployment rates (aged 15 and over)
HUN - Males HUN - FemalesOECD - Males OECD - Females
50
55
60
65
70
75
80
85
1600
1800
2000
2200
2400
2003 2005 2007 2009 2011 2013 2015
%Thousand persons
A. Employment and participation rates1
Employed population, Males (left-axis)Employed population, Females (left-axis)Participation rate, Male (right-axis)Participation rate, Female (right-axis)
-200
-150
-100
-50
0
50
100
150
200
250
300
-200
-150
-100
-50
0
50
100
150
200
250
300
2009 2010 2011 2012 2013 2014
Thousand persons
Private sector Public sector (excluding fostered workers) Fostered workers (public works) Total
ASSESSMENT AND RECOMMENDATIONS
OECD ECONOMIC SURVEYS: HUNGARY 2016 © OECD 201624
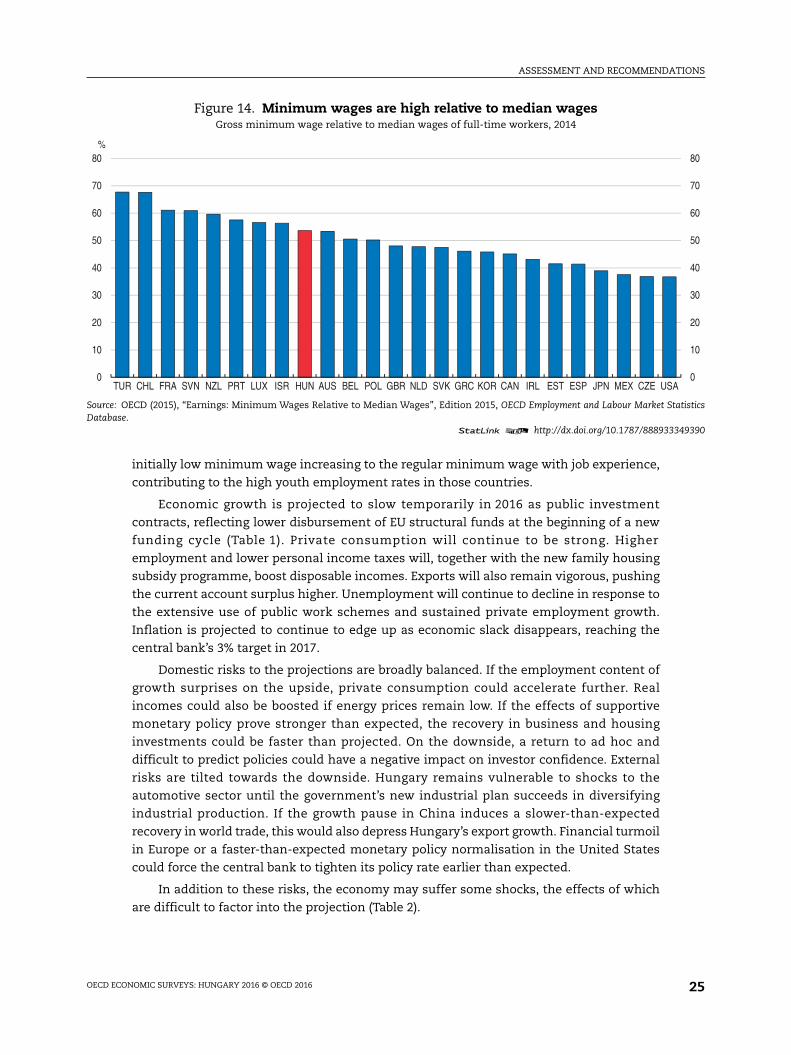
agricultural workers (Government, 2015b; Chapter 2). This complements the youth
guarantee programme that uses targeted personalised counselling to provide
qualifications or work experience to young unemployed. At the same time, however,
relatively high minimum wages depress employment of the low skilled (Figure 14). The
minimum wage is paid to nearly 10% of employees, but an additional 25% to 30% of
employees are affected by increases in the minimum wage, making further increases in
2016 (by 4.5%) a concern in terms of employment outcomes. Employment opportunities for
low-skilled workers could be enhanced by temporarily letting minimum wages grow at a
slower pace than other wages to increase the gap between the minimum and the median
wage. As a complementary measure, the government could introduce entry wages for
young low-skilled workers, as Denmark and Netherlands have for example, with the
Figure 13. The labour market lacks inclusiveness2014 or latest year available
1. The gender wage gap is unadjusted and defined as the difference between male and female median wages divided by the malemedian wages.
Source: OECD (2016), OECD Social and Welfare Statistics Database.1 2 http://dx.doi.org/10.1787/888933349384
0
10
20
30
40
50
60
70
80
OECD POL CZE HUN SVN SVK
%
A. Long-term unemployment (1 yr+)
0
5
10
15
20
25
CZE SVN OECD SVK POL HUN
%
B. Youth unemployment (NEET, aged 20-24)
56
58
60
62
64
66
68
SVN OECD CZE SVK POL HUN
%C. Female labour force participation rate
0
2
4
6
8
10
12
14
16
18
HUN POL SVN SVK OECD CZE
%
D. Gender wage gap1
ASSESSMENT AND RECOMMENDATIONS
OECD ECONOMIC SURVEYS: HUNGARY 2016 © OECD 2016 25
initially low minimum wage increasing to the regular minimum wage with job experience,
contributing to the high youth employment rates in those countries.
Economic growth is projected to slow temporarily in 2016 as public investment
contracts, reflecting lower disbursement of EU structural funds at the beginning of a new
funding cycle (Table 1). Private consumption will continue to be strong. Higher
employment and lower personal income taxes will, together with the new family housing
subsidy programme, boost disposable incomes. Exports will also remain vigorous, pushing
the current account surplus higher. Unemployment will continue to decline in response to
the extensive use of public work schemes and sustained private employment growth.
Inflation is projected to continue to edge up as economic slack disappears, reaching the
central bank’s 3% target in 2017.
Domestic risks to the projections are broadly balanced. If the employment content of
growth surprises on the upside, private consumption could accelerate further. Real
incomes could also be boosted if energy prices remain low. If the effects of supportive
monetary policy prove stronger than expected, the recovery in business and housing
investments could be faster than projected. On the downside, a return to ad hoc and
difficult to predict policies could have a negative impact on investor confidence. External
risks are tilted towards the downside. Hungary remains vulnerable to shocks to the
automotive sector until the government’s new industrial plan succeeds in diversifying
industrial production. If the growth pause in China induces a slower-than-expected
recovery in world trade, this would also depress Hungary’s export growth. Financial turmoil
in Europe or a faster-than-expected monetary policy normalisation in the United States
could force the central bank to tighten its policy rate earlier than expected.
In addition to these risks, the economy may suffer some shocks, the effects of which
are difficult to factor into the projection (Table 2).
Figure 14. Minimum wages are high relative to median wagesGross minimum wage relative to median wages of full-time workers, 2014
Source: OECD (2015), “Earnings: Minimum Wages Relative to Median Wages”, Edition 2015, OECD Employment and Labour Market StatisticsDatabase.
1 2 http://dx.doi.org/10.1787/888933349390
0
10
20
30
40
50
60
70
80
0
10
20
30
40
50
60
70
80
TUR CHL FRA SVN NZL PRT LUX ISR HUN AUS BEL POL GBR NLD SVK GRC KOR CAN IRL EST ESP JPN MEX CZE USA
%
ASSESSMENT AND RECOMMENDATIONS
OECD ECONOMIC SURVEYS: HUNGARY 2016 © OECD 201626
Monetary policy is still supporting the recovery
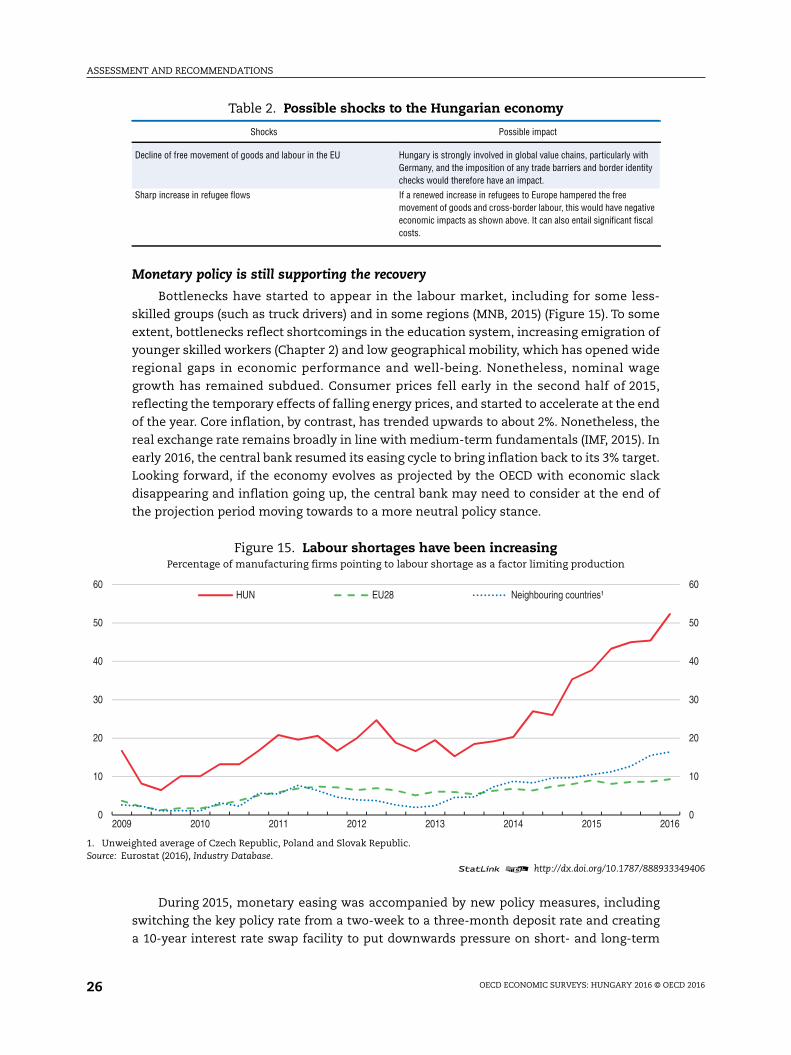
Bottlenecks have started to appear in the labour market, including for some less-
skilled groups (such as truck drivers) and in some regions (MNB, 2015) (Figure 15). To some
extent, bottlenecks reflect shortcomings in the education system, increasing emigration of
younger skilled workers (Chapter 2) and low geographical mobility, which has opened wide
regional gaps in economic performance and well-being. Nonetheless, nominal wage
growth has remained subdued. Consumer prices fell early in the second half of 2015,
reflecting the temporary effects of falling energy prices, and started to accelerate at the end
of the year. Core inflation, by contrast, has trended upwards to about 2%. Nonetheless, the
real exchange rate remains broadly in line with medium-term fundamentals (IMF, 2015). In
early 2016, the central bank resumed its easing cycle to bring inflation back to its 3% target.
Looking forward, if the economy evolves as projected by the OECD with economic slack
disappearing and inflation going up, the central bank may need to consider at the end of
the projection period moving towards to a more neutral policy stance.
During 2015, monetary easing was accompanied by new policy measures, including
switching the key policy rate from a two-week to a three-month deposit rate and creating
a 10-year interest rate swap facility to put downwards pressure on short- and long-term
Table 2. Possible shocks to the Hungarian economy
Shocks Possible impact
Decline of free movement of goods and labour in the EU Hungary is strongly involved in global value chains, particularly withGermany, and the imposition of any trade barriers and border identitychecks would therefore have an impact.
Sharp increase in refugee flows If a renewed increase in refugees to Europe hampered the freemovement of goods and cross-border labour, this would have negativeeconomic impacts as shown above. It can also entail significant fiscalcosts.
Figure 15. Labour shortages have been increasingPercentage of manufacturing firms pointing to labour shortage as a factor limiting production
1. Unweighted average of Czech Republic, Poland and Slovak Republic.Source: Eurostat (2016), Industry Database.
1 2 http://dx.doi.org/10.1787/888933349406
0
10
20
30
40
50
60
0
10
20
30
40
50
60
2009 2010 2011 2012 2013 2014 2015 2016
HUN EU28 Neighbouring countries¹
ASSESSMENT AND RECOMMENDATIONS
OECD ECONOMIC SURVEYS: HUNGARY 2016 © OECD 2016 27
market rates (MNB, 2015a). In addition, the unorthodox monetary policy instrument the
Funding for Growth Scheme that provides liquidity at zero cost to banks for lending to
SMEs at a maximum rate of 2½% was complemented by “Funding for Growth Scheme Plus”
to ensure financing for riskier borrowers that had not benefited from the first scheme. The
first and second phases of the schemes provided more than 30 000 SMEs with financing,
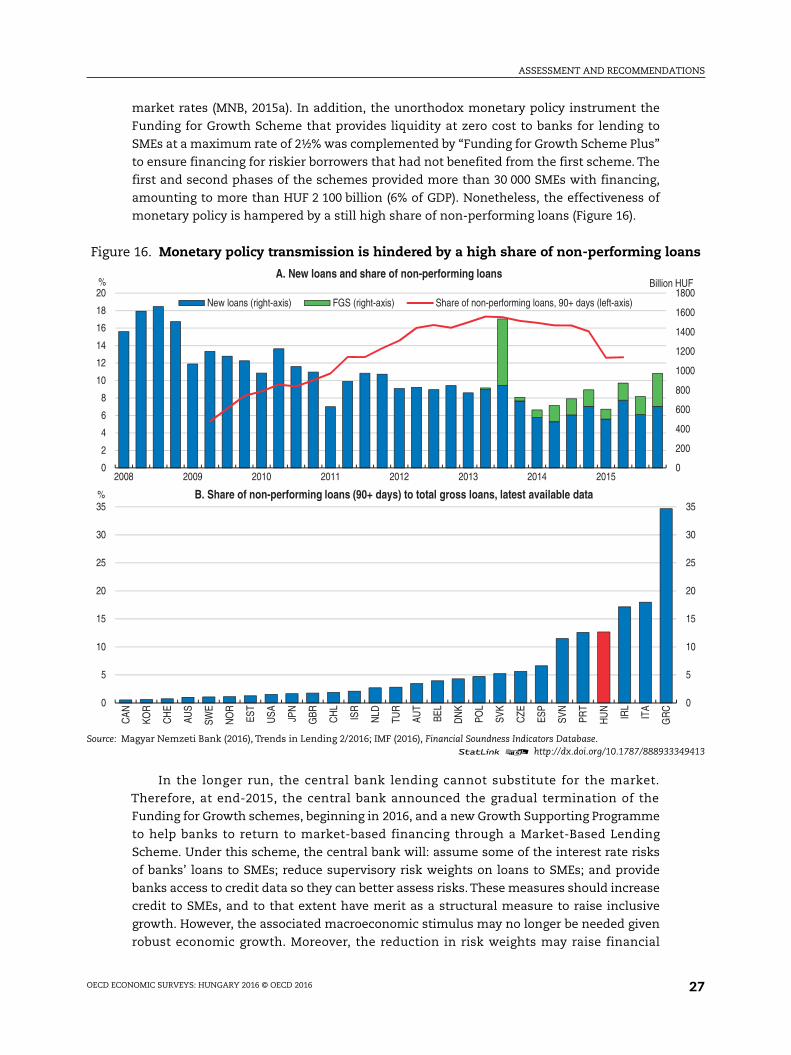
amounting to more than HUF 2 100 billion (6% of GDP). Nonetheless, the effectiveness of
monetary policy is hampered by a still high share of non-performing loans (Figure 16).
In the longer run, the central bank lending cannot substitute for the market.
Therefore, at end-2015, the central bank announced the gradual termination of the
Funding for Growth schemes, beginning in 2016, and a new Growth Supporting Programme
to help banks to return to market-based financing through a Market-Based Lending
Scheme. Under this scheme, the central bank will: assume some of the interest rate risks
of banks’ loans to SMEs; reduce supervisory risk weights on loans to SMEs; and provide
banks access to credit data so they can better assess risks. These measures should increase
credit to SMEs, and to that extent have merit as a structural measure to raise inclusive
growth. However, the associated macroeconomic stimulus may no longer be needed given
robust economic growth. Moreover, the reduction in risk weights may raise financial
Figure 16. Monetary policy transmission is hindered by a high share of non-performing loans
Source: Magyar Nemzeti Bank (2016), Trends in Lending 2/2016; IMF (2016), Financial Soundness Indicators Database.1 2 http://dx.doi.org/10.1787/888933349413
0
200
400
600
800
1000
1200
1400
1600
1800
0
2
4
6
8
10
12
14
16
18
20
2008 2009 2010 2011 2012 2013 2014 2015
Billion HUF%A. New loans and share of non-performing loans
New loans (right-axis) FGS (right-axis) Share of non-performing loans, 90+ days (left-axis)
0
5
10
15
20
25
30
35
0
5
10
15
20
25
30
35
CAN
KOR
CH
E
AUS
SWE
NO
R
EST
USA JP
N
GBR CH
L
ISR
NLD
TUR
AUT
BEL
DN
K
POL
SVK
CZE
ESP
SVN
PRT
HU
N
IRL
ITA
GR
C
% B. Share of non-performing loans (90+ days) to total gross loans, latest available data
ASSESSMENT AND RECOMMENDATIONS
OECD ECONOMIC SURVEYS: HUNGARY 2016 © OECD 201628
stability concerns to the extent the reduction leads to systematic underestimation of
actual risks. As a monetary policy institution and as a supervisor, the central bank will
have to monitor both issues closely.
The Hungarian capital market is under-developed and does not provide financing to
complement bank lending. In addition, the falling number of new issuances and turnover has
endangered the viability of the exchange. In late 2015, the central bank bought the Budapest
Stock Exchange from the Vienna Stock Exchange and the Austrian Kontrollbank AG to
revitalise capital markets. As the central bank is also the financial market regulator, the
purchase may raise a perception of a conflict-of-interest between its ownership and regulatory
functions. Thus, the ownership of the stock exchange should be temporary and the stock
exchange should return to private ownership over the medium-term.
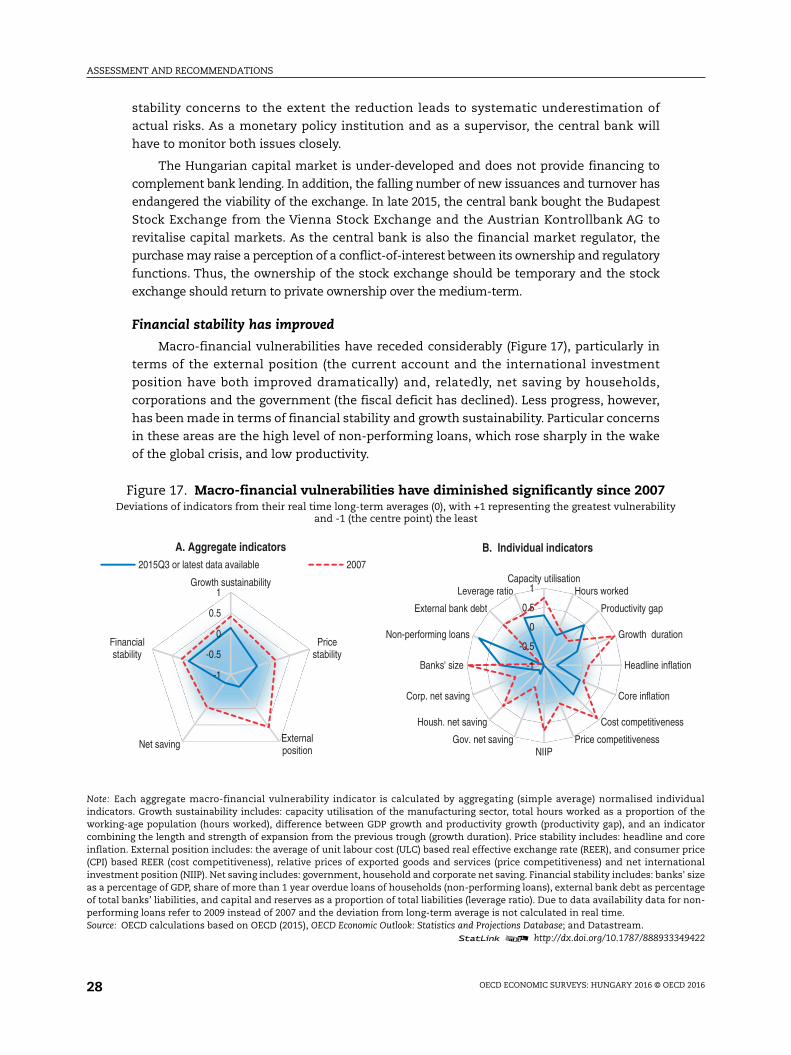
Financial stability has improved
Macro-financial vulnerabilities have receded considerably (Figure 17), particularly in
terms of the external position (the current account and the international investment
position have both improved dramatically) and, relatedly, net saving by households,
corporations and the government (the fiscal deficit has declined). Less progress, however,
has been made in terms of financial stability and growth sustainability. Particular concerns
in these areas are the high level of non-performing loans, which rose sharply in the wake
of the global crisis, and low productivity.
Figure 17. Macro-financial vulnerabilities have diminished significantly since 2007Deviations of indicators from their real time long-term averages (0), with +1 representing the greatest vulnerability
and -1 (the centre point) the least
Note: Each aggregate macro-financial vulnerability indicator is calculated by aggregating (simple average) normalised individualindicators. Growth sustainability includes: capacity utilisation of the manufacturing sector, total hours worked as a proportion of theworking-age population (hours worked), difference between GDP growth and productivity growth (productivity gap), and an indicatorcombining the length and strength of expansion from the previous trough (growth duration). Price stability includes: headline and coreinflation. External position includes: the average of unit labour cost (ULC) based real effective exchange rate (REER), and consumer price(CPI) based REER (cost competitiveness), relative prices of exported goods and services (price competitiveness) and net internationalinvestment position (NIIP). Net saving includes: government, household and corporate net saving. Financial stability includes: banks' sizeas a percentage of GDP, share of more than 1 year overdue loans of households (non-performing loans), external bank debt as percentageof total banks’ liabilities, and capital and reserves as a proportion of total liabilities (leverage ratio). Due to data availability data for non-performing loans refer to 2009 instead of 2007 and the deviation from long-term average is not calculated in real time.Source: OECD calculations based on OECD (2015), OECD Economic Outlook: Statistics and Projections Database; and Datastream.
1 2 http://dx.doi.org/10.1787/888933349422
-1
-0.5
0
0.5
1Growth sustainability
Pricestability
Externalposition
Net saving
Financialstability
A. Aggregate indicators2015Q3 or latest data available 2007
-1
-0.5
0
0.5
1Capacity utilisation
Hours worked
Productivity gap
Growth duration
Headline inflation
Core inflation
Cost competitiveness
Price competitivenessNIIP
Gov. net saving
Housh. net saving
Corp. net saving
Banks' size
Non-performing loans
External bank debt
Leverage ratio
B. Individual indicators
ASSESSMENT AND RECOMMENDATIONS
OECD ECONOMIC SURVEYS: HUNGARY 2016 © OECD 2016 29
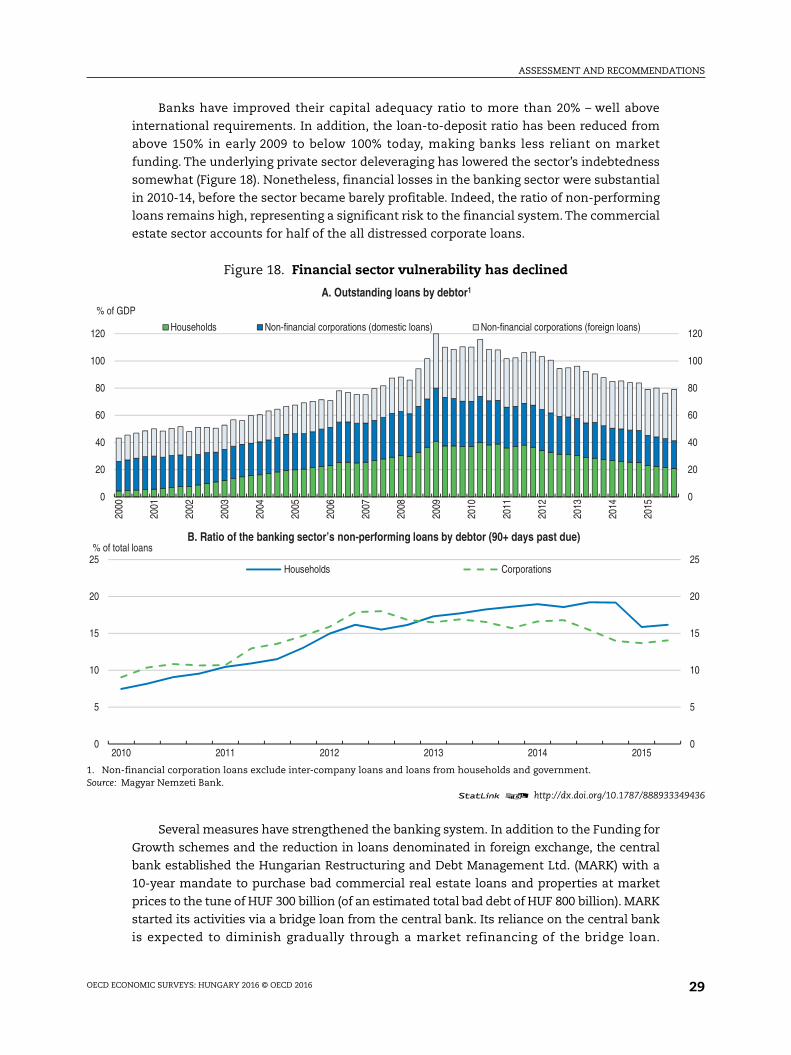
Banks have improved their capital adequacy ratio to more than 20% – well above
international requirements. In addition, the loan-to-deposit ratio has been reduced from
above 150% in early 2009 to below 100% today, making banks less reliant on market
funding. The underlying private sector deleveraging has lowered the sector’s indebtedness
somewhat (Figure 18). Nonetheless, financial losses in the banking sector were substantial
in 2010-14, before the sector became barely profitable. Indeed, the ratio of non-performing
loans remains high, representing a significant risk to the financial system. The commercial
estate sector accounts for half of the all distressed corporate loans.
Several measures have strengthened the banking system. In addition to the Funding for
Growth schemes and the reduction in loans denominated in foreign exchange, the central
bank established the Hungarian Restructuring and Debt Management Ltd. (MARK) with a
10-year mandate to purchase bad commercial real estate loans and properties at market
prices to the tune of HUF 300 billion (of an estimated total bad debt of HUF 800 billion). MARK
started its activities via a bridge loan from the central bank. Its reliance on the central bank
is expected to diminish gradually through a market refinancing of the bridge loan.
Figure 18. Financial sector vulnerability has declined
1. Non-financial corporation loans exclude inter-company loans and loans from households and government.Source: Magyar Nemzeti Bank.
1 2 http://dx.doi.org/10.1787/888933349436
0
5
10
15
20
25
0
5
10
15
20
25
2010 2011 2012 2013 2014 2015
% of total loansB. Ratio of the banking sector’s non-performing loans by debtor (90+ days past due)
Households Corporations
0
20
40
60
80
100
120
0
20
40
60
80
100
120
2000
2001
2002
2003
2004
2005
2006
2007
2008
2009
2010
2011
2012
2013
2014
2015
% of GDP
A. Outstanding loans by debtor1
Households Non-financial corporations (domestic loans) Non-financial corporations (foreign loans)
ASSESSMENT AND RECOMMENDATIONS
OECD ECONOMIC SURVEYS: HUNGARY 2016 © OECD 201630
This works similar to other asset management companies dealing with impaired loans,
although there is no explicit strategy for offloading of non-performing assets, and will reduce
the large stock of non-performing loans. Developing a strategy for selling assets would
increase transparency and reduce public sector contingent liabilities.
Sales of impaired assets could be encouraged by imposing capital surcharges on banks
that keep their impaired loans beyond a certain duration and threshold – effectively
increasing capital requirements for holding on to non-performing loans. The effect of this
measure would be to give banks incentives for selling impaired loans to the asset
management company at market prices, facilitating the restructuring of the banks’ balance
sheet. Such charges are already in place in the Euro area for global systemically important
institutions. The central bank already imposed such a systemic risk buffer to commercial
real estate loans as of 1 January 2017. For mortgages, the government has introduced
personal bankruptcy (Chapter 1) and the central bank introduced regulation on payment-to-
income and caps on loan-to-value ratios. The central bank also published guidelines for
financial institutions on sustainable restructuring of non-performing households loans. In
addition, the government lowered the levy on larger banks, from 0.53% to 0.24% of assets,
although the tax on small banks, of 0.15% of assets, remains unchanged.
The government has reached a Memorandum of Understanding with the EBRD in
early 2015 to sell public stakes in large banks within three years, which will improve the
functioning of the banking sector. The government should implement the sell off as rapidly
as possible as state-owned banks can hamper the financial sector’s ability to contribute to
growth. Particularly in cases where state-owned banks are required to finance loss-making
(state-owned) enterprises, provide financing on non-commercial terms to regions or
sectors, or extend credit based on other factors than risk assessments (Andrews, 2005).
Such problems can be further compounded if state-owned banks have a cost advantage in
terms of funding, arising from an implicit or explicit government guarantee.
Putting the debt-to-GDP ratio firmly on a downward path will require furtherconsolidation efforts
Since Hungary left the European Union’s excessive deficit procedure in 2013, the public
debt-to-GDP ratio has continued to decline (OECD, 2015). For 2016, the stance of policy is set
to be broadly neutral, before becoming expansive in 2017 (Table 3). Given the projected
strength of the economy and diminishing slack the 2016 stance is appropriate. In 2017, the
stance is set to be expansionary despite the rapid disappearance of economic slack.
Hungary’s debt-to-GDP ratio has been falling since 2011 and is lower than the
European Union average. Moreover, general government contingent liabilities amount to a
quarter of GDP – a relatively low level by European standards (Eurostat, 2015). However, it is
high compared to similar countries, and it is prudent for small open economies like that of
Hungary to have relatively low levels of public debt to ensure resilience (Fall and Fournier,
2015). Indeed, Hungary was out of international bond markets for almost two years until
early 2013, when a large US dollar denominated bond issuance took place. The
government’s commitment to gradually reduce the debt-GDP ratio is therefore welcome,
but ensuring it will, in the medium term, require a lower deficit than today.
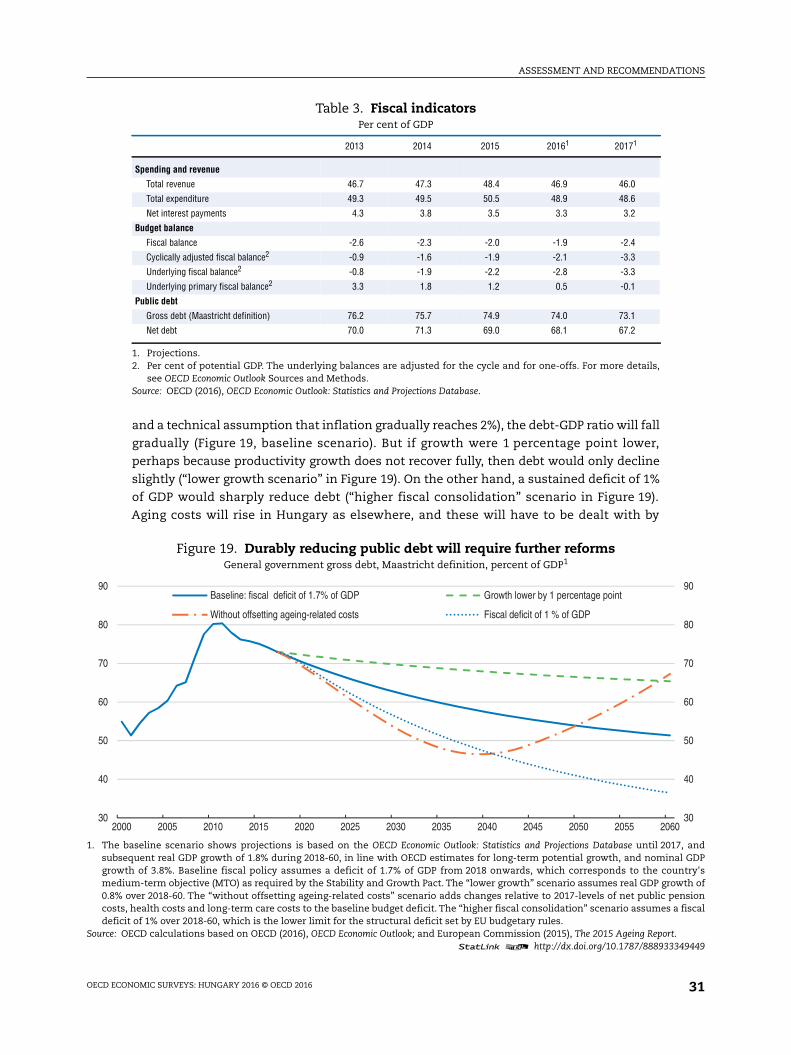
Assuming a medium-term fiscal deficit of 1.7% of GDP (which corresponds to
Hungary’s medium-term objective under the Stability and Growth Pact) and that nominal
GDP over the long-term grows at 3.8% (consistent with OECD estimate of potential growth
ASSESSMENT AND RECOMMENDATIONS
OECD ECONOMIC SURVEYS: HUNGARY 2016 © OECD 2016 31
and a technical assumption that inflation gradually reaches 2%), the debt-GDP ratio will fall
gradually (Figure 19, baseline scenario). But if growth were 1 percentage point lower,
perhaps because productivity growth does not recover fully, then debt would only decline
slightly (“lower growth scenario” in Figure 19). On the other hand, a sustained deficit of 1%
of GDP would sharply reduce debt (“higher fiscal consolidation” scenario in Figure 19).
Aging costs will rise in Hungary as elsewhere, and these will have to be dealt with by
Table 3. Fiscal indicatorsPer cent of GDP
2013 2014 2015 20161 20171
Spending and revenue
Total revenue 46.7 47.3 48.4 46.9 46.0
Total expenditure 49.3 49.5 50.5 48.9 48.6
Net interest payments 4.3 3.8 3.5 3.3 3.2
Budget balance
Fiscal balance -2.6 -2.3 -2.0 -1.9 -2.4
Cyclically adjusted fiscal balance2 -0.9 -1.6 -1.9 -2.1 -3.3
Underlying fiscal balance2 -0.8 -1.9 -2.2 -2.8 -3.3
Underlying primary fiscal balance2 3.3 1.8 1.2 0.5 -0.1
Public debt
Gross debt (Maastricht definition) 76.2 75.7 74.9 74.0 73.1
Net debt 70.0 71.3 69.0 68.1 67.2
1. Projections.2. Per cent of potential GDP. The underlying balances are adjusted for the cycle and for one-offs. For more details,
see OECD Economic Outlook Sources and Methods.Source: OECD (2016), OECD Economic Outlook: Statistics and Projections Database.
Figure 19. Durably reducing public debt will require further reformsGeneral government gross debt, Maastricht definition, percent of GDP1
1. The baseline scenario shows projections is based on the OECD Economic Outlook: Statistics and Projections Database until 2017, andsubsequent real GDP growth of 1.8% during 2018-60, in line with OECD estimates for long-term potential growth, and nominal GDPgrowth of 3.8%. Baseline fiscal policy assumes a deficit of 1.7% of GDP from 2018 onwards, which corresponds to the country'smedium-term objective (MTO) as required by the Stability and Growth Pact. The “lower growth” scenario assumes real GDP growth of0.8% over 2018-60. The “without offsetting ageing-related costs” scenario adds changes relative to 2017-levels of net public pensioncosts, health costs and long-term care costs to the baseline budget deficit. The “higher fiscal consolidation” scenario assumes a fiscaldeficit of 1% over 2018-60, which is the lower limit for the structural deficit set by EU budgetary rules.
Source: OECD calculations based on OECD (2016), OECD Economic Outlook; and European Commission (2015), The 2015 Ageing Report.1 2 http://dx.doi.org/10.1787/888933349449
30
40
50
60
70
80
90
30
40
50
60
70
80
90
2000 2005 2010 2015 2020 2025 2030 2035 2040 2045 2050 2055 2060
Baseline: fiscal deficit of 1.7% of GDP Growth lower by 1 percentage point
Without offsetting ageing-related costs Fiscal deficit of 1 % of GDP
ASSESSMENT AND RECOMMENDATIONS
OECD ECONOMIC SURVEYS: HUNGARY 2016 © OECD 201632
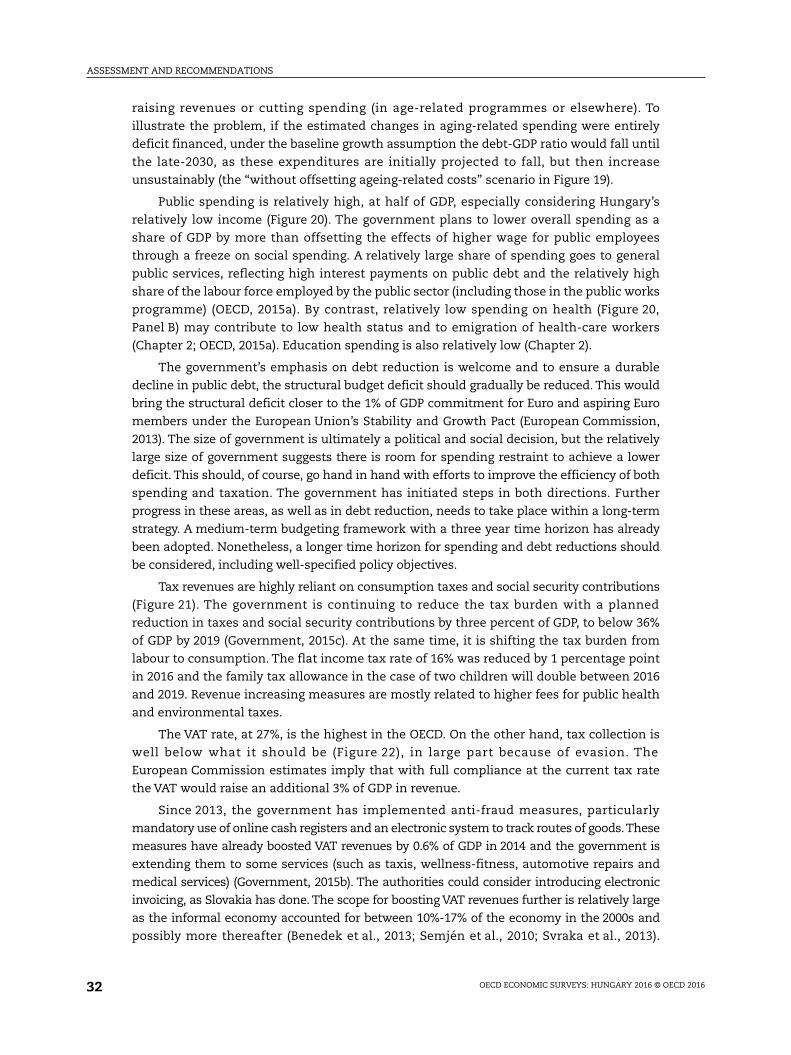
raising revenues or cutting spending (in age-related programmes or elsewhere). To
illustrate the problem, if the estimated changes in aging-related spending were entirely
deficit financed, under the baseline growth assumption the debt-GDP ratio would fall until
the late-2030, as these expenditures are initially projected to fall, but then increase
unsustainably (the “without offsetting ageing-related costs” scenario in Figure 19).
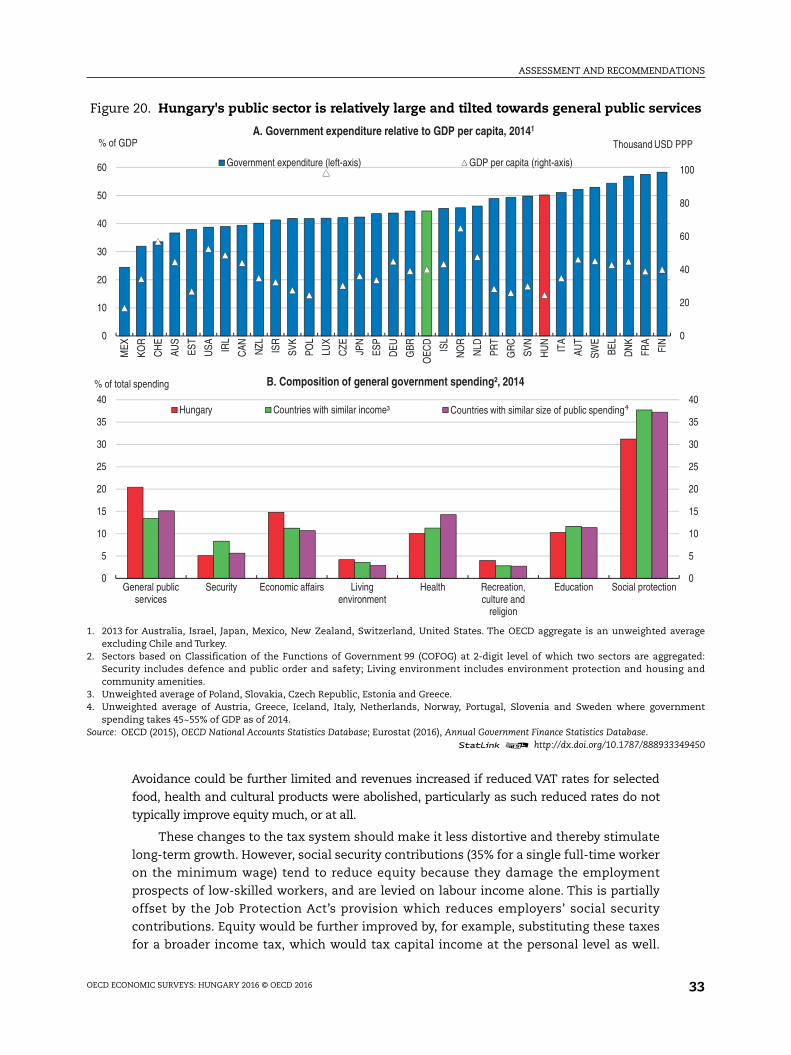
Public spending is relatively high, at half of GDP, especially considering Hungary’s
relatively low income (Figure 20). The government plans to lower overall spending as a
share of GDP by more than offsetting the effects of higher wage for public employees
through a freeze on social spending. A relatively large share of spending goes to general
public services, reflecting high interest payments on public debt and the relatively high
share of the labour force employed by the public sector (including those in the public works
programme) (OECD, 2015a). By contrast, relatively low spending on health (Figure 20,
Panel B) may contribute to low health status and to emigration of health-care workers
(Chapter 2; OECD, 2015a). Education spending is also relatively low (Chapter 2).
The government’s emphasis on debt reduction is welcome and to ensure a durable
decline in public debt, the structural budget deficit should gradually be reduced. This would
bring the structural deficit closer to the 1% of GDP commitment for Euro and aspiring Euro
members under the European Union’s Stability and Growth Pact (European Commission,
2013). The size of government is ultimately a political and social decision, but the relatively
large size of government suggests there is room for spending restraint to achieve a lower
deficit. This should, of course, go hand in hand with efforts to improve the efficiency of both
spending and taxation. The government has initiated steps in both directions. Further
progress in these areas, as well as in debt reduction, needs to take place within a long-term
strategy. A medium-term budgeting framework with a three year time horizon has already
been adopted. Nonetheless, a longer time horizon for spending and debt reductions should
be considered, including well-specified policy objectives.
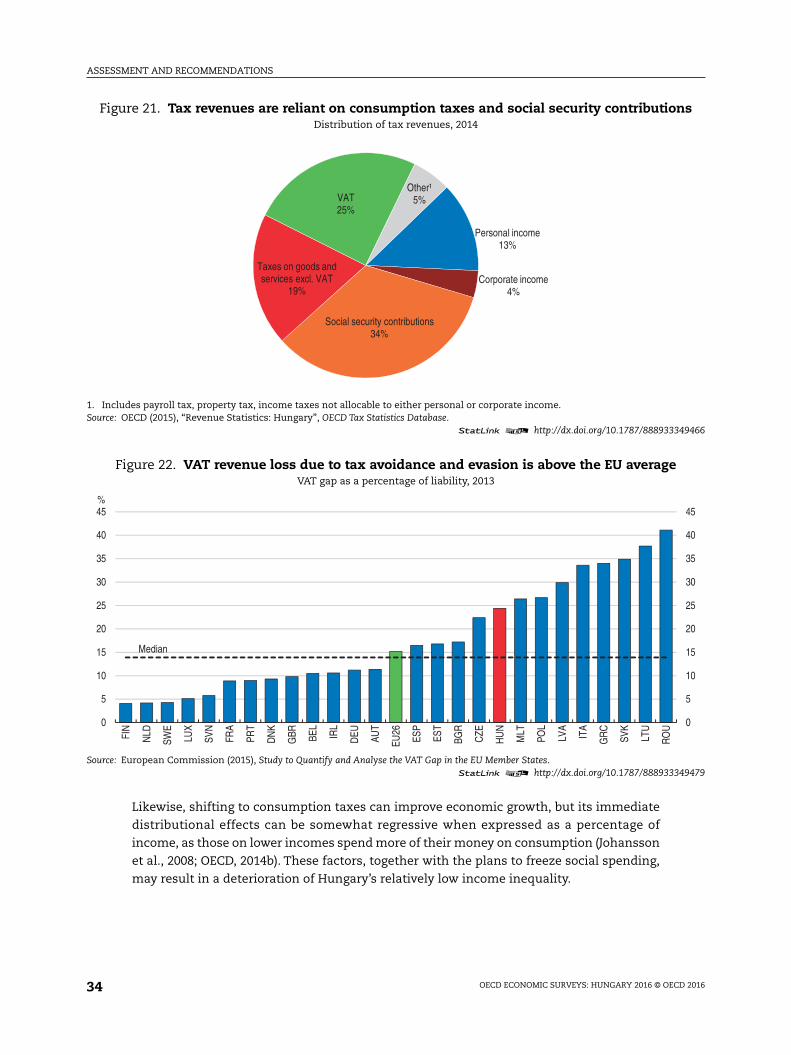
Tax revenues are highly reliant on consumption taxes and social security contributions
(Figure 21). The government is continuing to reduce the tax burden with a planned
reduction in taxes and social security contributions by three percent of GDP, to below 36%
of GDP by 2019 (Government, 2015c). At the same time, it is shifting the tax burden from
labour to consumption. The flat income tax rate of 16% was reduced by 1 percentage point
in 2016 and the family tax allowance in the case of two children will double between 2016
and 2019. Revenue increasing measures are mostly related to higher fees for public health
and environmental taxes.
The VAT rate, at 27%, is the highest in the OECD. On the other hand, tax collection is
well below what it should be (Figure 22), in large part because of evasion. The
European Commission estimates imply that with full compliance at the current tax rate
the VAT would raise an additional 3% of GDP in revenue.
Since 2013, the government has implemented anti-fraud measures, particularly
mandatory use of online cash registers and an electronic system to track routes of goods.These
measures have already boosted VAT revenues by 0.6% of GDP in 2014 and the government is
extending them to some services (such as taxis, wellness-fitness, automotive repairs and
medical services) (Government, 2015b). The authorities could consider introducing electronic
invoicing, as Slovakia has done. The scope for boosting VAT revenues further is relatively large
as the informal economy accounted for between 10%-17% of the economy in the 2000s and
possibly more thereafter (Benedek et al., 2013; Semjén et al., 2010; Svraka et al., 2013).
ASSESSMENT AND RECOMMENDATIONS
OECD ECONOMIC SURVEYS: HUNGARY 2016 © OECD 2016 33
Avoidance could be further limited and revenues increased if reduced VAT rates for selected
food, health and cultural products were abolished, particularly as such reduced rates do not
typically improve equity much, or at all.
These changes to the tax system should make it less distortive and thereby stimulate
long-term growth. However, social security contributions (35% for a single full-time worker
on the minimum wage) tend to reduce equity because they damage the employment
prospects of low-skilled workers, and are levied on labour income alone. This is partially
offset by the Job Protection Act’s provision which reduces employers’ social security
contributions. Equity would be further improved by, for example, substituting these taxes
for a broader income tax, which would tax capital income at the personal level as well.
Figure 20. Hungary's public sector is relatively large and tilted towards general public services
1. 2013 for Australia, Israel, Japan, Mexico, New Zealand, Switzerland, United States. The OECD aggregate is an unweighted averageexcluding Chile and Turkey.
2. Sectors based on Classification of the Functions of Government 99 (COFOG) at 2-digit level of which two sectors are aggregated:Security includes defence and public order and safety; Living environment includes environment protection and housing andcommunity amenities.
3. Unweighted average of Poland, Slovakia, Czech Republic, Estonia and Greece.4. Unweighted average of Austria, Greece, Iceland, Italy, Netherlands, Norway, Portugal, Slovenia and Sweden where government
spending takes 45~55% of GDP as of 2014.Source: OECD (2015), OECD National Accounts Statistics Database; Eurostat (2016), Annual Government Finance Statistics Database.
1 2 http://dx.doi.org/10.1787/888933349450
0
5
10
15
20
25
30
35
40
0
5
10
15
20
25
30
35
40
General publicservices
Security Economic affairs Livingenvironment
Health Recreation,culture and
religion
Education Social protection
% of total spending B. Composition of general government spending², 2014
Hungary Countries with similar income³ Countries with similar size of public spending
0
20
40
60
80
100
0
10
20
30
40
50
60
MEX
KOR
CH
E
AUS
EST
USA IR
L
CAN NZL ISR
SVK
POL
LUX
CZE JP
N
ESP
DEU
GBR
OEC
D
ISL
NO
R
NLD
PRT
GR
C
SVN
HU
N
ITA
AUT
SWE
BEL
DN
K
FRA
FIN
Thousand USD PPP% of GDPA. Government expenditure relative to GDP per capita, 20141
Government expenditure (left-axis) GDP per capita (right-axis)
ASSESSMENT AND RECOMMENDATIONS
OECD ECONOMIC SURVEYS: HUNGARY 2016 © OECD 201634
Likewise, shifting to consumption taxes can improve economic growth, but its immediate
distributional effects can be somewhat regressive when expressed as a percentage of
income, as those on lower incomes spend more of their money on consumption (Johansson
et al., 2008; OECD, 2014b). These factors, together with the plans to freeze social spending,
may result in a deterioration of Hungary’s relatively low income inequality.
Figure 21. Tax revenues are reliant on consumption taxes and social security contributionsDistribution of tax revenues, 2014
1. Includes payroll tax, property tax, income taxes not allocable to either personal or corporate income.Source: OECD (2015), “Revenue Statistics: Hungary”, OECD Tax Statistics Database.
1 2 http://dx.doi.org/10.1787/888933349466
Figure 22. VAT revenue loss due to tax avoidance and evasion is above the EU averageVAT gap as a percentage of liability, 2013
Source: European Commission (2015), Study to Quantify and Analyse the VAT Gap in the EU Member States.1 2 http://dx.doi.org/10.1787/888933349479
Personal income13%
Corporate income4%
Social security contributions34%
Taxes on goods and services excl. VAT
19%
VAT25%
Other¹5%
0
5
10
15
20
25
30
35
40
45
0
5
10
15
20
25
30
35
40
45
FIN
NLD
SWE
LUX
SVN
FRA
PRT
DN
K
GBR BE
L
IRL
DEU AU
T
EU26
ESP
EST
BGR
CZE
HU
N
MLT
POL
LVA
ITA
GR
C
SVK
LTU
RO
U
%
Median
ASSESSMENT AND RECOMMENDATIONS
OECD ECONOMIC SURVEYS: HUNGARY 2016 © OECD 2016 35
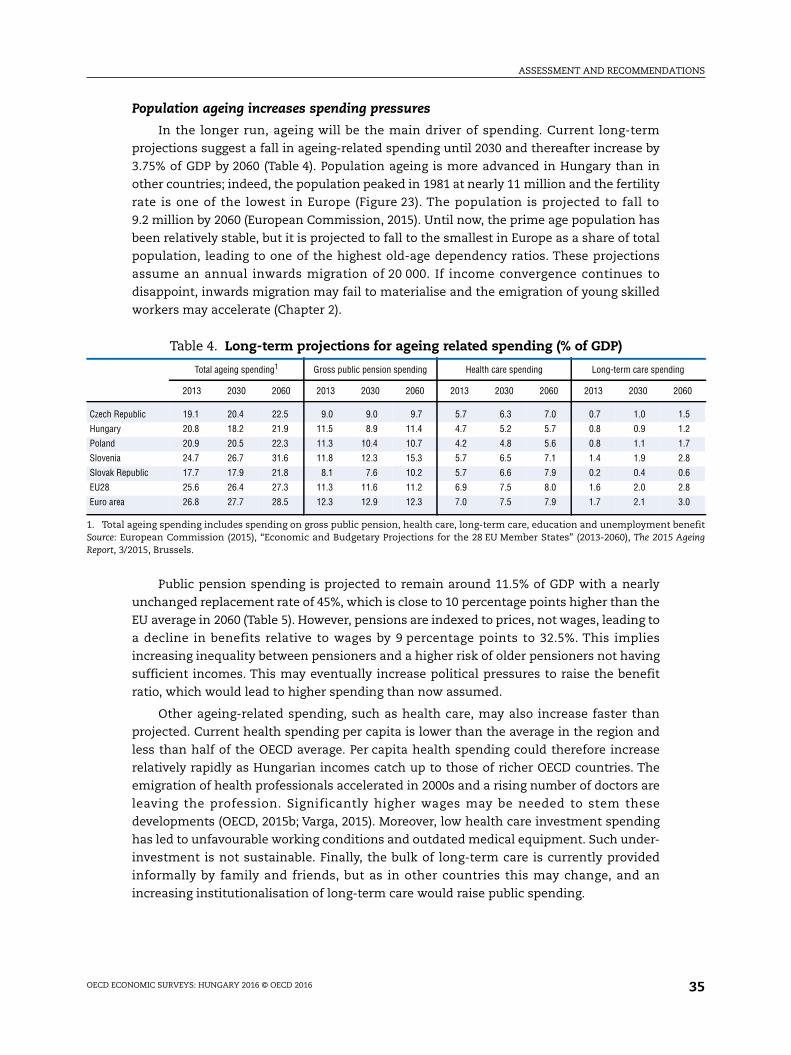
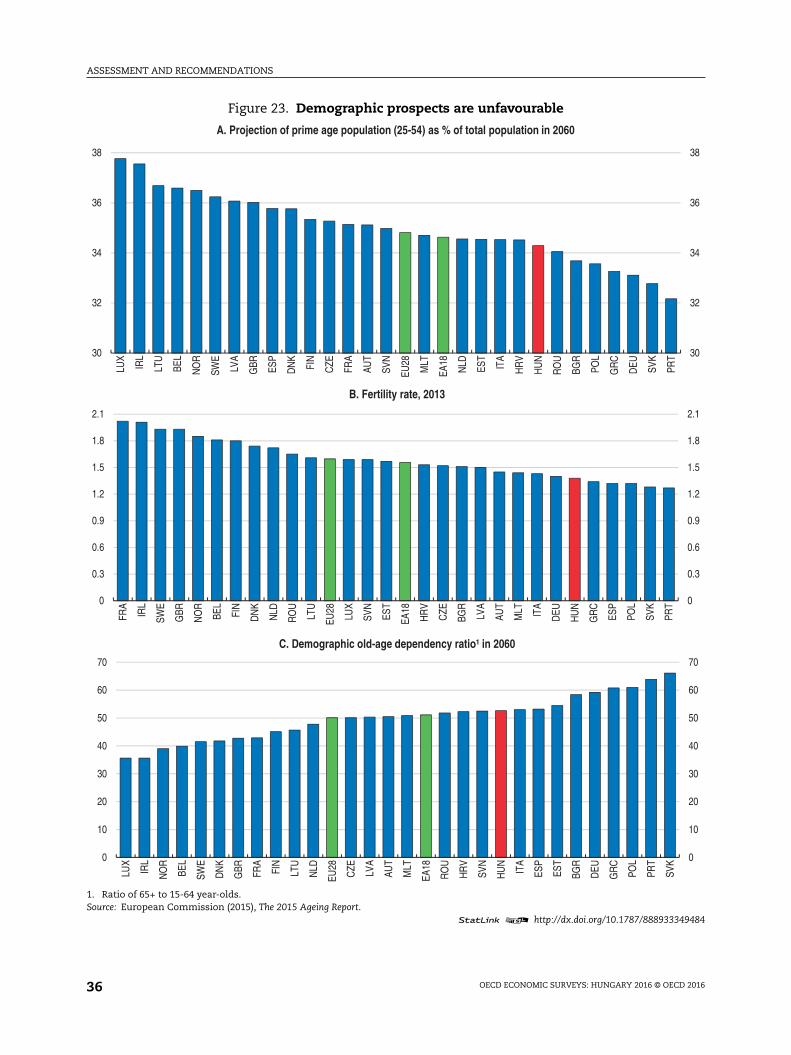
Population ageing increases spending pressures
In the longer run, ageing will be the main driver of spending. Current long-term
projections suggest a fall in ageing-related spending until 2030 and thereafter increase by
3.75% of GDP by 2060 (Table 4). Population ageing is more advanced in Hungary than in
other countries; indeed, the population peaked in 1981 at nearly 11 million and the fertility
rate is one of the lowest in Europe (Figure 23). The population is projected to fall to
9.2 million by 2060 (European Commission, 2015). Until now, the prime age population has
been relatively stable, but it is projected to fall to the smallest in Europe as a share of total
population, leading to one of the highest old-age dependency ratios. These projections
assume an annual inwards migration of 20 000. If income convergence continues to
disappoint, inwards migration may fail to materialise and the emigration of young skilled
workers may accelerate (Chapter 2).
Public pension spending is projected to remain around 11.5% of GDP with a nearly
unchanged replacement rate of 45%, which is close to 10 percentage points higher than the
EU average in 2060 (Table 5). However, pensions are indexed to prices, not wages, leading to
a decline in benefits relative to wages by 9 percentage points to 32.5%. This implies
increasing inequality between pensioners and a higher risk of older pensioners not having
sufficient incomes. This may eventually increase political pressures to raise the benefit
ratio, which would lead to higher spending than now assumed.
Other ageing-related spending, such as health care, may also increase faster than
projected. Current health spending per capita is lower than the average in the region and
less than half of the OECD average. Per capita health spending could therefore increase
relatively rapidly as Hungarian incomes catch up to those of richer OECD countries. The
emigration of health professionals accelerated in 2000s and a rising number of doctors are
leaving the profession. Significantly higher wages may be needed to stem these
developments (OECD, 2015b; Varga, 2015). Moreover, low health care investment spending
has led to unfavourable working conditions and outdated medical equipment. Such under-
investment is not sustainable. Finally, the bulk of long-term care is currently provided
informally by family and friends, but as in other countries this may change, and an
increasing institutionalisation of long-term care would raise public spending.
Table 4. Long-term projections for ageing related spending (% of GDP)
Total ageing spending1 Gross public pension spending Health care spending Long-term care spending
2013 2030 2060 2013 2030 2060 2013 2030 2060 2013 2030 2060
Czech Republic 19.1 20.4 22.5 9.0 9.0 9.7 5.7 6.3 7.0 0.7 1.0 1.5
Hungary 20.8 18.2 21.9 11.5 8.9 11.4 4.7 5.2 5.7 0.8 0.9 1.2
Poland 20.9 20.5 22.3 11.3 10.4 10.7 4.2 4.8 5.6 0.8 1.1 1.7
Slovenia 24.7 26.7 31.6 11.8 12.3 15.3 5.7 6.5 7.1 1.4 1.9 2.8
Slovak Republic 17.7 17.9 21.8 8.1 7.6 10.2 5.7 6.6 7.9 0.2 0.4 0.6
EU28 25.6 26.4 27.3 11.3 11.6 11.2 6.9 7.5 8.0 1.6 2.0 2.8
Euro area 26.8 27.7 28.5 12.3 12.9 12.3 7.0 7.5 7.9 1.7 2.1 3.0
1. Total ageing spending includes spending on gross public pension, health care, long-term care, education and unemployment benefitSource: European Commission (2015), “Economic and Budgetary Projections for the 28 EU Member States” (2013-2060), The 2015 AgeingReport, 3/2015, Brussels.
ASSESSMENT AND RECOMMENDATIONS
OECD ECONOMIC SURVEYS: HUNGARY 2016 © OECD 201636
Figure 23. Demographic prospects are unfavourable
1. Ratio of 65+ to 15-64 year-olds.Source: European Commission (2015), The 2015 Ageing Report.
1 2 http://dx.doi.org/10.1787/888933349484
0
0.3
0.6
0.9
1.2
1.5
1.8
2.1
0
0.3
0.6
0.9
1.2
1.5
1.8
2.1
FRA
IRL
SWE
GBR
NO
R
BEL
FIN
DN
K
NLD
RO
U
LTU
EU28
LUX
SVN
EST
EA18
HR
V
CZE
BGR
LVA
AUT
MLT ITA
DEU
HU
N
GR
C
ESP
POL
SVK
PRT
B. Fertility rate, 2013
30
32
34
36
38
30
32
34
36
38
LUX
IRL
LTU
BEL
NO
R
SWE
LVA
GBR ES
P
DN
K
FIN
CZE
FRA
AUT
SVN
EU28
MLT
EA18
NLD ES
T
ITA
HR
V
HU
N
RO
U
BGR
POL
GR
C
DEU SV
K
PRT
A. Projection of prime age population (25-54) as % of total population in 2060
0
10
20
30
40
50
60
70
0
10
20
30
40
50
60
70
LUX
IRL
NO
R
BEL
SWE
DN
K
GBR FR
A
FIN
LTU
NLD
EU28
CZE LV
A
AUT
MLT
EA18
RO
U
HR
V
SVN
HU
N
ITA
ESP
EST
BGR
DEU
GR
C
POL
PRT
SVK
C. Demographic old-age dependency ratio¹ in 2060
ASSESSMENT AND RECOMMENDATIONS
OECD ECONOMIC SURVEYS: HUNGARY 2016 © OECD 2016 37
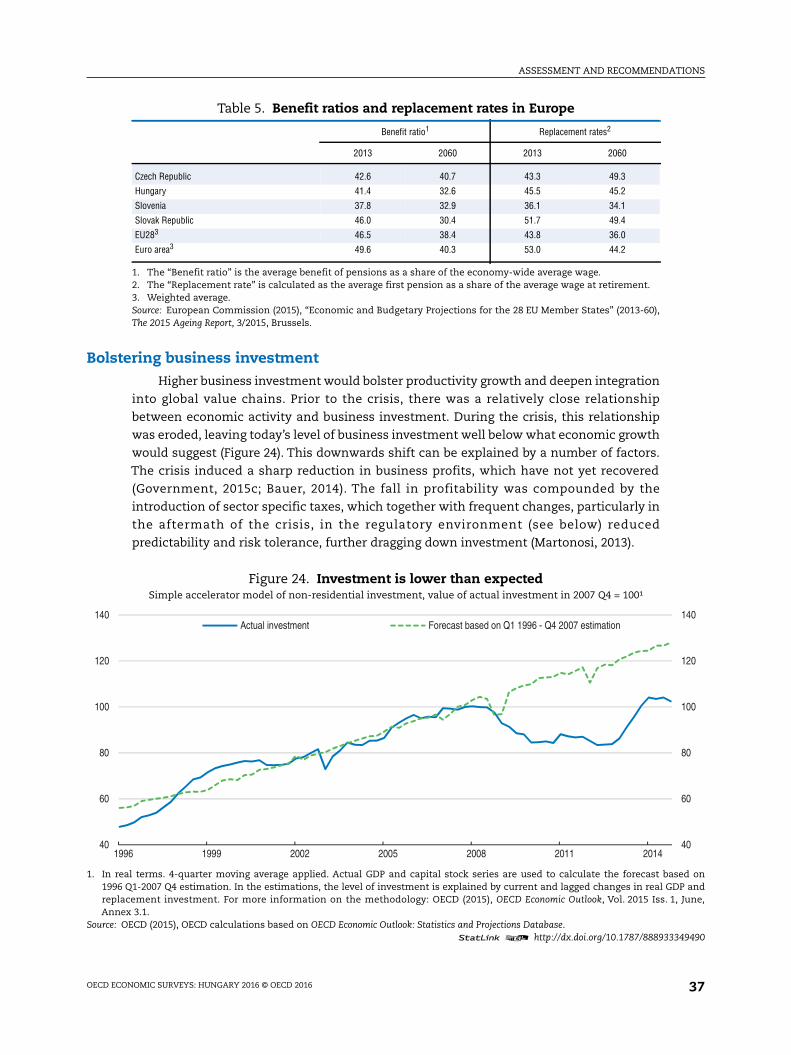
Bolstering business investmentHigher business investment would bolster productivity growth and deepen integration
into global value chains. Prior to the crisis, there was a relatively close relationship
between economic activity and business investment. During the crisis, this relationship
was eroded, leaving today’s level of business investment well below what economic growth
would suggest (Figure 24). This downwards shift can be explained by a number of factors.
The crisis induced a sharp reduction in business profits, which have not yet recovered
(Government, 2015c; Bauer, 2014). The fall in profitability was compounded by the
introduction of sector specific taxes, which together with frequent changes, particularly in
the aftermath of the crisis, in the regulatory environment (see below) reduced
predictability and risk tolerance, further dragging down investment (Martonosi, 2013).
Table 5. Benefit ratios and replacement rates in Europe
Benefit ratio1 Replacement rates2
2013 2060 2013 2060
Czech Republic 42.6 40.7 43.3 49.3
Hungary 41.4 32.6 45.5 45.2
Slovenia 37.8 32.9 36.1 34.1
Slovak Republic 46.0 30.4 51.7 49.4
EU283 46.5 38.4 43.8 36.0
Euro area3 49.6 40.3 53.0 44.2
1. The “Benefit ratio” is the average benefit of pensions as a share of the economy-wide average wage.2. The “Replacement rate” is calculated as the average first pension as a share of the average wage at retirement.3. Weighted average.Source: European Commission (2015), “Economic and Budgetary Projections for the 28 EU Member States” (2013-60),The 2015 Ageing Report, 3/2015, Brussels.
Figure 24. Investment is lower than expectedSimple accelerator model of non-residential investment, value of actual investment in 2007 Q4 = 100¹
1. In real terms. 4-quarter moving average applied. Actual GDP and capital stock series are used to calculate the forecast based on1996 Q1-2007 Q4 estimation. In the estimations, the level of investment is explained by current and lagged changes in real GDP andreplacement investment. For more information on the methodology: OECD (2015), OECD Economic Outlook, Vol. 2015 Iss. 1, June,Annex 3.1.
Source: OECD (2015), OECD calculations based on OECD Economic Outlook: Statistics and Projections Database.1 2 http://dx.doi.org/10.1787/888933349490
40
60
80
100
120
140
40
60
80
100
120
140
1996 1999 2002 2005 2008 2011 2014
Actual investment Forecast based on Q1 1996 - Q4 2007 estimation
ASSESSMENT AND RECOMMENDATIONS
OECD ECONOMIC SURVEYS: HUNGARY 2016 © OECD 201638
In addition, financing sources dried up as the banking crisis sharply reduced bank
lending. This particularly affected domestic SMEs as multinational companies relied on
international financial markets for their funding. The Funding for Growth schemes have
resulted in some new investment, particularly by smaller firms, and have also been used to
refinance older and more expensive loans (Endresz et al., 2015). Other funding sources,
such as equity or corporate bonds, play only a minor role in Hungary, as in other eastern
European countries.
Developing capital markets would provide new sources of funding, but it is a slow
process that requires improving transparency, reliability and comparability of information
(Jäger-Gyovai, 2014). In particular, a critical mass of floated firms will be needed to secure a
well-functioning stock market (Adarov and Tchaidze, 2011). In this respect, developing
common rules and standards for accounting, corporate credit, insolvency and other capital
market regulations could foster capital markets in the region, which could possibly clear the
way for making the Budapest stock exchange part of a larger regional stock exchange, as in
the Baltic area (Véron and Wolff, 2015). Such a larger stock exchange would be more viable
than the Budapest exchange alone. New financing sources should be promoted by adjusting
existing or adopting new regulation to new financial technologies. At the same time, investor
confidence needs to be strengthened, pointing to the need for creating a more stable
regulatory framework that promotes the competitiveness of the business sector.
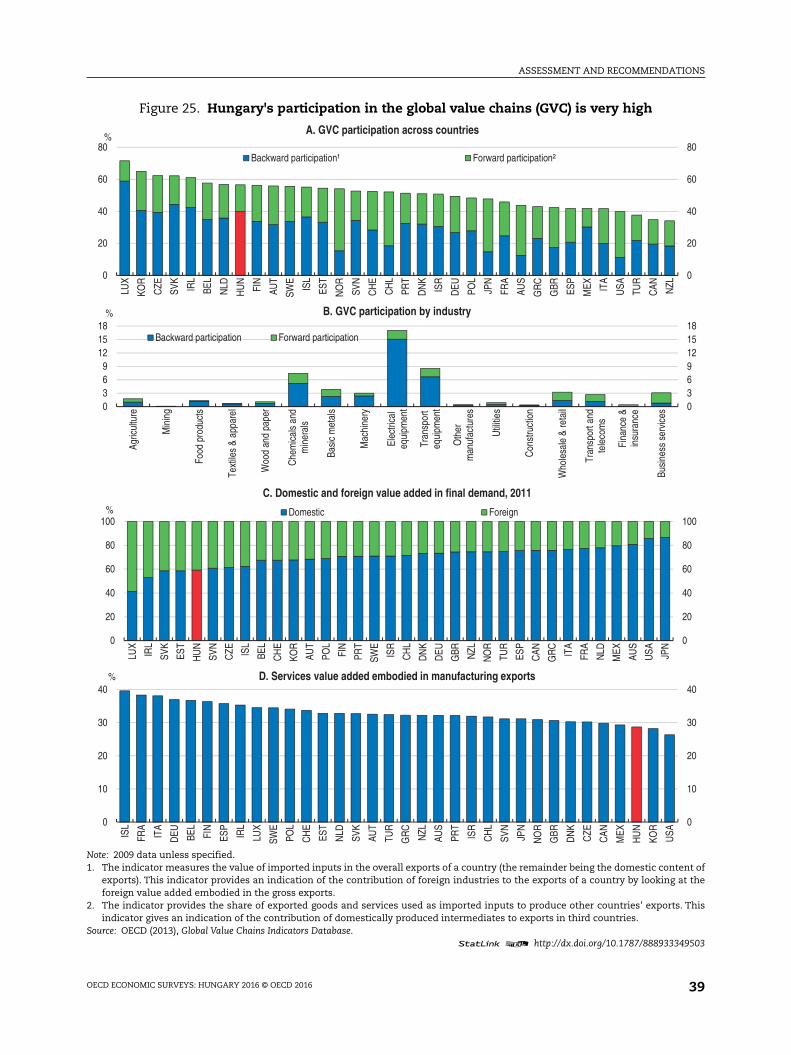
Global value chains benefit relatively few
Hungary’s participation in the global value chains is among the highest in the OECD
(Figure 25, Panel A). This success is linked to the large presence of foreign firms in the
(intertwined) electrical and transport equipment producing sectors, which are characterised
by high inflows of inward FDI and intensive links with manufacturing in other countries,
especially Germany (Figure 25, Panel B; Chapter 1). The multinational companies behind this
inward FDI typically use a high share of foreign produced intermediates in their production
or rely on inputs from foreign-owned producers in Hungary.
In contrast, domestically-owned producers of intermediate inputs have been less
successful than in other countries in integrating themselves into the production chain of
the large foreign-owned exporters, which means that the value added in exports is
relatively low. In addition, producers of intermediate inputs have a relatively low
contribution to the production of other countries’ exports (known as low “forward
participation” in GVCs). Moreover, services contribute less to manufacturing exports than
in any other European country (Figure 25, Panel D). As a consequence, Hungary has missed
out on direct services provision, such as communication, but also indirect services that
help to differentiate and upgrade products (such as design, development, and marketing).
Better use of such services would help firms to capture more value in the global value
chains (OECD, 2013a).
Inward FDI accounts for a substantial part of business investment and over time the
inflows have been concentrated in a few sectors. The high concentration in the vehicle
production (22% of industrial production and 13% of total exports) and the dominant
position of a few German firms involve some exposure to firm, sector and country specific
risk. Moreover, there is little investment in intangibles, such as R&D, digital economy and
other elements of knowledge-based capital that are needed to foster potential growth and
move up the value added chain (OECD, 2015c). Finally, the firm structure is dominated by
ASSESSMENT AND RECOMMENDATIONS
OECD ECONOMIC SURVEYS: HUNGARY 2016 © OECD 2016 39
Figure 25. Hungary's participation in the global value chains (GVC) is very high
Note: 2009 data unless specified.1. The indicator measures the value of imported inputs in the overall exports of a country (the remainder being the domestic content of
exports). This indicator provides an indication of the contribution of foreign industries to the exports of a country by looking at theforeign value added embodied in the gross exports.
2. The indicator provides the share of exported goods and services used as imported inputs to produce other countries' exports. Thisindicator gives an indication of the contribution of domestically produced intermediates to exports in third countries.
Source: OECD (2013), Global Value Chains Indicators Database.1 2 http://dx.doi.org/10.1787/888933349503
0
20
40
60
80
0
20
40
60
80
LUX
KOR
CZE
SVK
IRL
BEL
NLD
HU
N
FIN
AUT
SWE
ISL
EST
NO
R
SVN
CH
E
CH
L
PRT
DN
K
ISR
DEU PO
L
JPN
FRA
AUS
GR
C
GBR ES
P
MEX IT
A
USA
TUR
CAN NZL
%A. GVC participation across countries
Backward participation¹ Forward participation²
0369121518
0369
121518
Agric
ultu
re
Min
ing
Food
pro
duct
s
Text
iles
& ap
pare
l
Woo
d an
d pa
per
Che
mic
als
and
min
eral
s
Basi
c m
etal
s
Mac
hine
ry
Elec
trica
leq
uipm
ent
Tran
spor
teq
uipm
ent
Oth
erm
anuf
actu
res
Util
ities
Con
stru
ctio
n
Who
lesa
le &
reta
il
Tran
spor
t and
tele
com
s
Fina
nce
&in
sura
nce
Busi
ness
ser
vice
s
% B. GVC participation by industry
Backward participation Forward participation
0
20
40
60
80
100
0
20
40
60
80
100
LUX
IRL
SVK
EST
HU
N
SVN
CZE IS
L
BEL
CH
E
KOR
AUT
POL
FIN
PRT
SWE
ISR
CH
L
DN
K
DEU
GBR NZL
NO
R
TUR
ESP
CAN
GR
C
ITA
FRA
NLD
MEX
AUS
USA JP
N
%
C. Domestic and foreign value added in final demand, 2011
Domestic Foreign
0
10
20
30
40
0
10
20
30
40
ISL
FRA
ITA
DEU BE
L
FIN
ESP
IRL
LUX
SWE
POL
CH
E
EST
NLD
SVK
AUT
TUR
GR
C
NZL
AUS
PRT
ISR
CH
L
SVN
JPN
NO
R
GBR
DN
K
CZE
CAN
MEX
HU
N
KOR
USA
% D. Services value added embodied in manufacturing exports
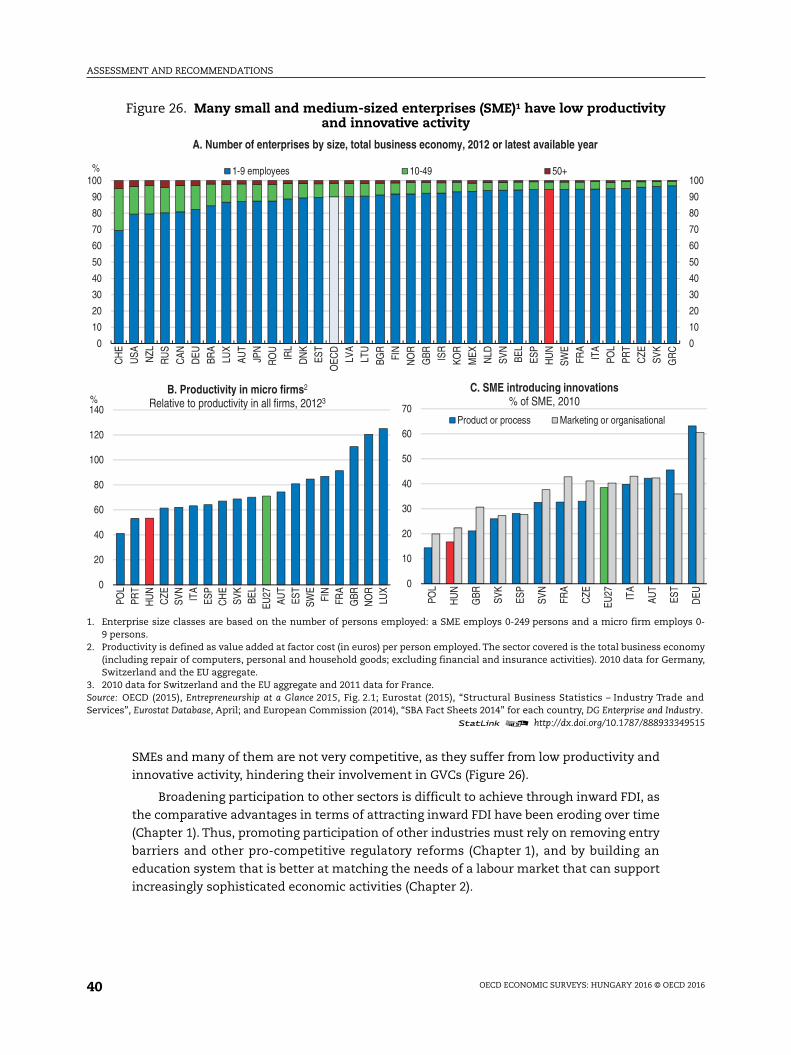
ASSESSMENT AND RECOMMENDATIONS
OECD ECONOMIC SURVEYS: HUNGARY 2016 © OECD 201640
SMEs and many of them are not very competitive, as they suffer from low productivity and
innovative activity, hindering their involvement in GVCs (Figure 26).
Broadening participation to other sectors is difficult to achieve through inward FDI, as
the comparative advantages in terms of attracting inward FDI have been eroding over time
(Chapter 1). Thus, promoting participation of other industries must rely on removing entry
barriers and other pro-competitive regulatory reforms (Chapter 1), and by building an
education system that is better at matching the needs of a labour market that can support
increasingly sophisticated economic activities (Chapter 2).
Figure 26. Many small and medium-sized enterprises (SME)¹ have low productivityand innovative activity
1. Enterprise size classes are based on the number of persons employed: a SME employs 0-249 persons and a micro firm employs 0-9 persons.
2. Productivity is defined as value added at factor cost (in euros) per person employed. The sector covered is the total business economy(including repair of computers, personal and household goods; excluding financial and insurance activities). 2010 data for Germany,Switzerland and the EU aggregate.
3. 2010 data for Switzerland and the EU aggregate and 2011 data for France.Source: OECD (2015), Entrepreneurship at a Glance 2015, Fig. 2.1; Eurostat (2015), “Structural Business Statistics – Industry Trade andServices”, Eurostat Database, April; and European Commission (2014), “SBA Fact Sheets 2014” for each country, DG Enterprise and Industry.
1 2 http://dx.doi.org/10.1787/888933349515
0
20
40
60
80
100
120
140
POL
PRT
HU
NC
ZESV
NIT
AES
PC
HE
SVK
BEL
EU27
AUT
EST
SWE
FIN
FRA
GBR
NO
RLU
X
%B. Productivity in micro firms2
Relative to productivity in all firms, 20123
0
10
20
30
40
50
60
70
POL
HU
N
GBR SV
K
ESP
SVN
FRA
CZE
EU27 ITA
AUT
EST
DEU
C. SME introducing innovations % of SME, 2010
Product or process Marketing or organisational
0
10
20
30
40
50
60
70
80
90
100
0
10
20
30
40
50
60
70
80
90
100
CH
E
USA NZL
RU
S
CAN
DEU BR
ALU
X
AUT
JPN
RO
U
IRL
DN
KES
T
OEC
DLV
ALT
U
BGR
FIN
NO
R
GBR IS
RKO
R
MEX NLD
SVN
BEL
ESP
HU
NSW
E
FRA
ITA
POL
PRT
CZE
SVK
GR
C
%
A. Number of enterprises by size, total business economy, 2012 or latest available year
1-9 employees 10-49 50+
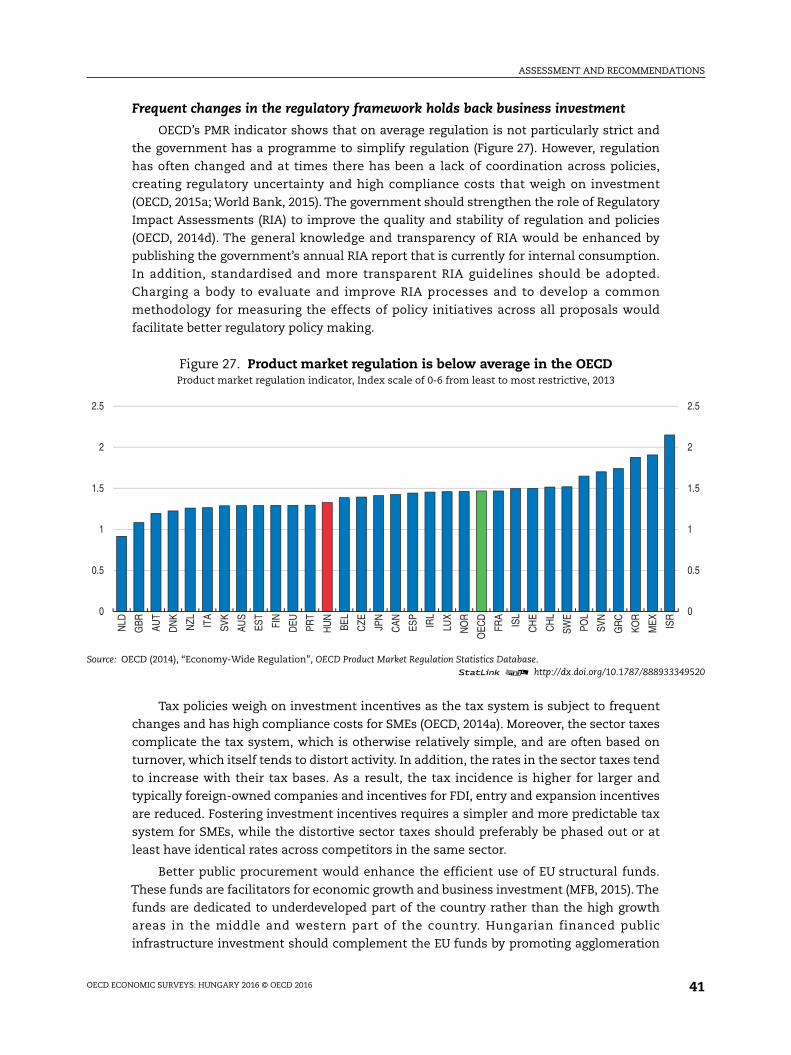
ASSESSMENT AND RECOMMENDATIONS
OECD ECONOMIC SURVEYS: HUNGARY 2016 © OECD 2016 41
Frequent changes in the regulatory framework holds back business investment
OECD’s PMR indicator shows that on average regulation is not particularly strict and
the government has a programme to simplify regulation (Figure 27). However, regulation
has often changed and at times there has been a lack of coordination across policies,
creating regulatory uncertainty and high compliance costs that weigh on investment
(OECD, 2015a; World Bank, 2015). The government should strengthen the role of Regulatory
Impact Assessments (RIA) to improve the quality and stability of regulation and policies
(OECD, 2014d). The general knowledge and transparency of RIA would be enhanced by
publishing the government’s annual RIA report that is currently for internal consumption.
In addition, standardised and more transparent RIA guidelines should be adopted.
Charging a body to evaluate and improve RIA processes and to develop a common
methodology for measuring the effects of policy initiatives across all proposals would
facilitate better regulatory policy making.
Tax policies weigh on investment incentives as the tax system is subject to frequent
changes and has high compliance costs for SMEs (OECD, 2014a). Moreover, the sector taxes
complicate the tax system, which is otherwise relatively simple, and are often based on
turnover, which itself tends to distort activity. In addition, the rates in the sector taxes tend
to increase with their tax bases. As a result, the tax incidence is higher for larger and
typically foreign-owned companies and incentives for FDI, entry and expansion incentives
are reduced. Fostering investment incentives requires a simpler and more predictable tax
system for SMEs, while the distortive sector taxes should preferably be phased out or at
least have identical rates across competitors in the same sector.
Better public procurement would enhance the efficient use of EU structural funds.
These funds are facilitators for economic growth and business investment (MFB, 2015). The
funds are dedicated to underdeveloped part of the country rather than the high growth
areas in the middle and western part of the country. Hungarian financed public
infrastructure investment should complement the EU funds by promoting agglomeration
Figure 27. Product market regulation is below average in the OECDProduct market regulation indicator, Index scale of 0-6 from least to most restrictive, 2013
Source: OECD (2014), “Economy-Wide Regulation”, OECD Product Market Regulation Statistics Database.1 2 http://dx.doi.org/10.1787/888933349520
0
0.5
1
1.5
2
2.5
0
0.5
1
1.5
2
2.5
NLD
GBR AU
T
DN
K
NZL ITA
SVK
AUS
EST
FIN
DEU PR
T
HU
N
BEL
CZE JP
N
CAN ES
P
IRL
LUX
NO
R
OEC
D
FRA
ISL
CH
E
CH
L
SWE
POL
SVN
GR
C
KOR
MEX IS
R
ASSESSMENT AND RECOMMENDATIONS
OECD ECONOMIC SURVEYS: HUNGARY 2016 © OECD 201642
effects in the high growth areas. This should include upgrading secondary and tertiary
networks as well as other measures to promote communication.
However, not all public procurement has been open to tendering. The government has
introduced a new public procurement framework, which should ensure that all public
procurement follows EU rules in this area. Also, corruption has been a recurrent issue. The
National Anti-Corruption Programme could be bolstered with the establishment of a
dedicated anti-corruption agency as done in other countries in the region, Australia and
Spain. A noticeable example in this area is the success of Hong Kong’s anti-corruption
agency in reducing corruption (OECD, 2013b).
The role of the competition framework could be strengthened. Not all bills from the
government and parliamentarians are submitted to the competition authority for
commenting on the competition aspects of the bills. The quality of regulation could be
strengthened if the competition authority systematically commented on all relevant
proposals. Moreover, a number of sectors are exempted from various elements in the
competition law. The agriculture sector is exempt from the competition act’s ban on
restrictive practices – the exemption is only applicable to local markets where EU-trade is
not affected (European Commission, 2014). Nonetheless, the exemption increases
regulatory uncertainty with detrimental effects on investment incentives and should be
removed. Another area that reduces investment incentives is the government’s wide scope
for using decree to exempt whole sectors from merger regulation on public interest
grounds. This means that market participants in that sector do not know what forces are
shaping future market structures. In contrast, the European standard is that governments
only after a full merger review can permit the competition decreasing mergers on clear and
limited public interest grounds, preserving competition as the main shaper of market
structures. Hungary should follow the European merger standard.
Entry into network sectors has become more difficult. State-owned energy companies
have taken over energy retailing and the energy regulator imposes universal service
obligations and price regulation. The energy market is characterised by low gas and
electricity prices for households, but high prices for firms, which reduce competitiveness
and investment incentives (Figure 28). Moreover, the state-owned retailers may bear a cost
of up to nearly ½% of GDP for providing low retail prices, and if energy prices rise again this
cost will rise too. This situation is likely to result in higher government contingent
liabilities, as the retailers may eventually have to be bailed out. The government should
introduce market-based energy prices by giving the responsibility for regulating prices to
the sector regulator, using clear competition-friendly pricing principles. Public service
obligations should be met through explicit and transparent compensation to providers.
This would reduce distortions and, by increasing transparency, perhaps lead to better
decisions regarding public service provision.
Regulation of the retail sector has increased, reducing entry, ICT investment and
inward FDI incentives. Permissions are required for opening outlets larger than 400 m2.
However, the permission granting powers have been moved from a ministerial committee
to one single local government official with ample room for discretion in giving
derogations from the rule (LawNow, 2015). Media reports that for food outlets, derogation
has seldom been granted to foreign-owned outlets, but larger Hungarian owned chains
and, less frequently, smaller independent shops have benefited from derogations (Tldr.444;
2015). Transparency could be improved by clarifying the rules for derogations, increasing
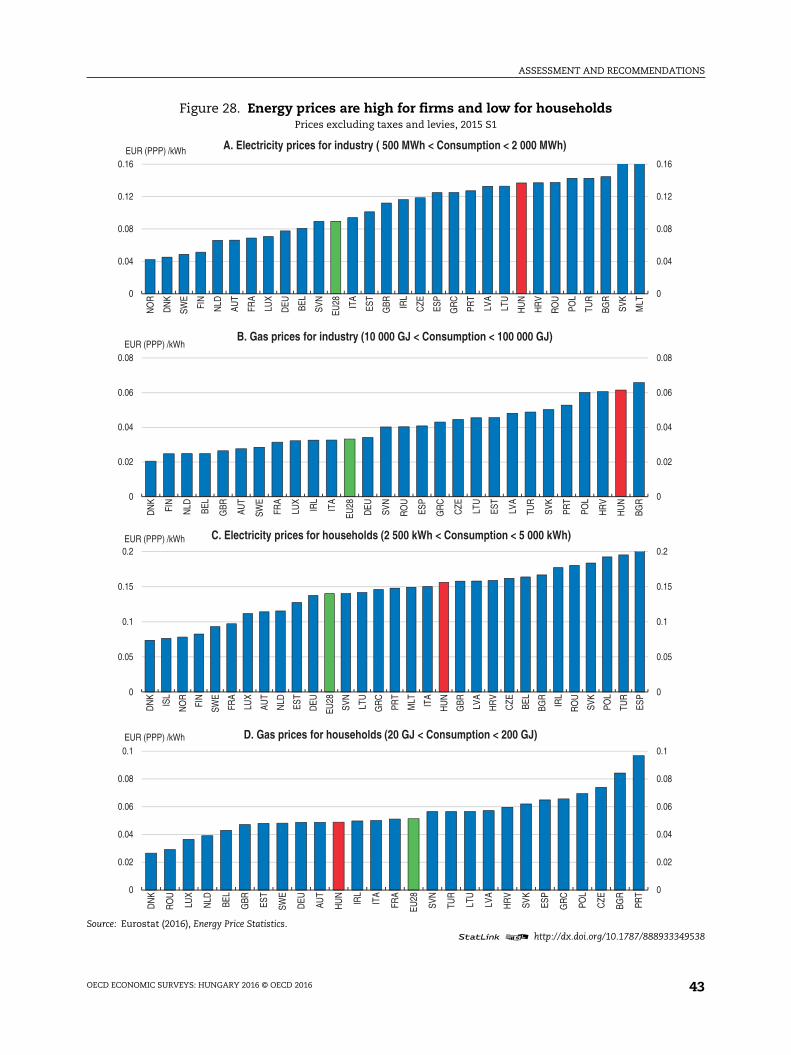
ASSESSMENT AND RECOMMENDATIONS
OECD ECONOMIC SURVEYS: HUNGARY 2016 © OECD 2016 43
Figure 28. Energy prices are high for firms and low for householdsPrices excluding taxes and levies, 2015 S1
Source: Eurostat (2016), Energy Price Statistics.1 2 http://dx.doi.org/10.1787/888933349538
0
0.05
0.1
0.15
0.2
0
0.05
0.1
0.15
0.2
DN
K
ISL
NO
R
FIN
SWE
FRA
LUX
AUT
NLD ES
T
DEU
EU28
SVN
LTU
GR
C
PRT
MLT ITA
HU
N
GBR LV
A
HR
V
CZE BE
L
BGR
IRL
RO
U
SVK
POL
TUR
ESP
EUR (PPP) /kWh C. Electricity prices for households (2 500 kWh < Consumption < 5 000 kWh)
0
0.04
0.08
0.12
0.16
0
0.04
0.08
0.12
0.16
NO
R
DN
K
SWE
FIN
NLD
AUT
FRA
LUX
DEU BE
L
SVN
EU28 ITA
EST
GBR IR
L
CZE
ESP
GR
C
PRT
LVA
LTU
HU
N
HR
V
RO
U
POL
TUR
BGR
SVK
MLT
EUR (PPP) /kWh A. Electricity prices for industry ( 500 MWh < Consumption < 2 000 MWh)
0
0.02
0.04
0.06
0.08
0.1
0
0.02
0.04
0.06
0.08
0.1
DN
K
RO
U
LUX
NLD BE
L
GBR ES
T
SWE
DEU AU
T
HU
N
IRL
ITA
FRA
EU28
SVN
TUR
LTU
LVA
HR
V
SVK
ESP
GR
C
POL
CZE
BGR
PRT
EUR (PPP) /kWh D. Gas prices for households (20 GJ < Consumption < 200 GJ)
0
0.02
0.04
0.06
0.08
0
0.02
0.04
0.06
0.08
DN
K
FIN
NLD BE
L
GBR AU
T
SWE
FRA
LUX
IRL
ITA
EU28
DEU SV
N
RO
U
ESP
GR
C
CZE LT
U
EST
LVA
TUR
SVK
PRT
POL
HR
V
HU
N
BGR
EUR (PPP) /kWhB. Gas prices for industry (10 000 GJ < Consumption < 100 000 GJ)
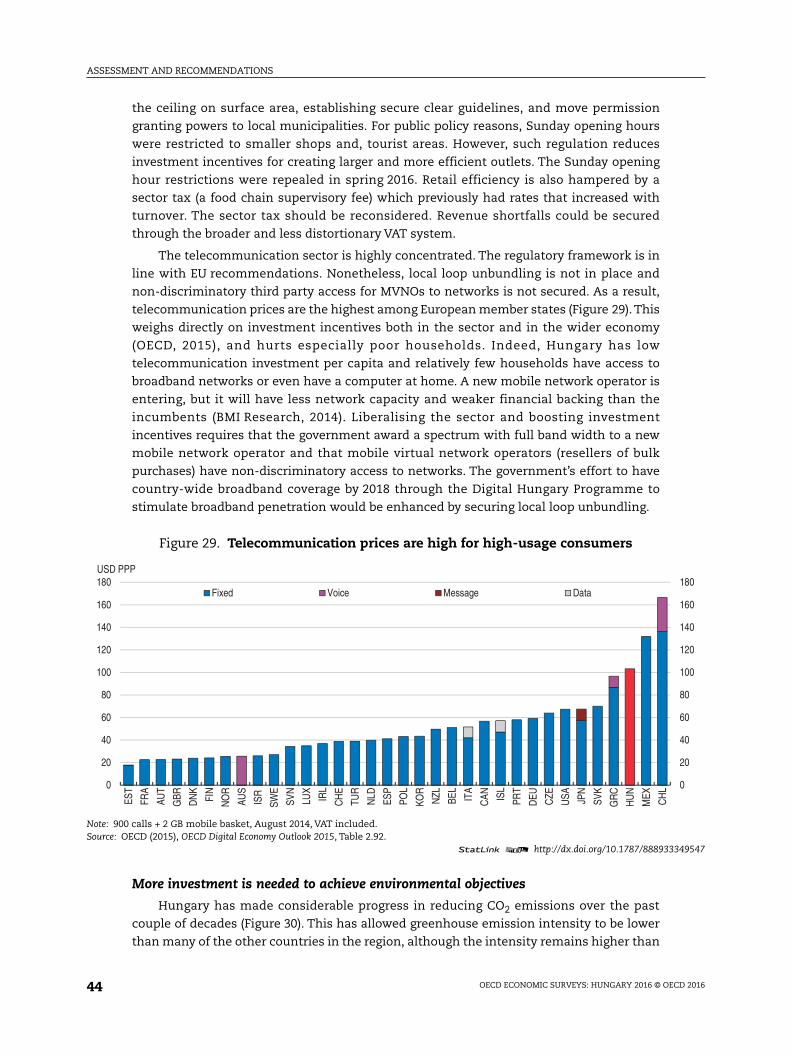
ASSESSMENT AND RECOMMENDATIONS
OECD ECONOMIC SURVEYS: HUNGARY 2016 © OECD 201644
the ceiling on surface area, establishing secure clear guidelines, and move permission
granting powers to local municipalities. For public policy reasons, Sunday opening hours
were restricted to smaller shops and, tourist areas. However, such regulation reduces
investment incentives for creating larger and more efficient outlets. The Sunday opening
hour restrictions were repealed in spring 2016. Retail efficiency is also hampered by a
sector tax (a food chain supervisory fee) which previously had rates that increased with
turnover. The sector tax should be reconsidered. Revenue shortfalls could be secured
through the broader and less distortionary VAT system.
The telecommunication sector is highly concentrated. The regulatory framework is in
line with EU recommendations. Nonetheless, local loop unbundling is not in place and
non-discriminatory third party access for MVNOs to networks is not secured. As a result,
telecommunication prices are the highest among European member states (Figure 29). This
weighs directly on investment incentives both in the sector and in the wider economy
(OECD, 2015), and hurts especially poor households. Indeed, Hungary has low
telecommunication investment per capita and relatively few households have access to
broadband networks or even have a computer at home. A new mobile network operator is
entering, but it will have less network capacity and weaker financial backing than the
incumbents (BMI Research, 2014). Liberalising the sector and boosting investment
incentives requires that the government award a spectrum with full band width to a new
mobile network operator and that mobile virtual network operators (resellers of bulk
purchases) have non-discriminatory access to networks. The government’s effort to have
country-wide broadband coverage by 2018 through the Digital Hungary Programme to
stimulate broadband penetration would be enhanced by securing local loop unbundling.
More investment is needed to achieve environmental objectives
Hungary has made considerable progress in reducing CO2 emissions over the past
couple of decades (Figure 30). This has allowed greenhouse emission intensity to be lower
than many of the other countries in the region, although the intensity remains higher than
Figure 29. Telecommunication prices are high for high-usage consumers
Note: 900 calls + 2 GB mobile basket, August 2014, VAT included.Source: OECD (2015), OECD Digital Economy Outlook 2015, Table 2.92.
1 2 http://dx.doi.org/10.1787/888933349547
0
20
40
60
80
100
120
140
160
180
0
20
40
60
80
100
120
140
160
180
EST
FRA
AUT
GBR
DN
K
FIN
NO
R
AUS
ISR
SWE
SVN
LUX
IRL
CH
E
TUR
NLD
ESP
POL
KOR
NZL
BEL
ITA
CAN IS
L
PRT
DEU CZE
USA JP
N
SVK
GR
C
HU
N
MEX CH
L
USD PPP
Fixed Voice Message Data
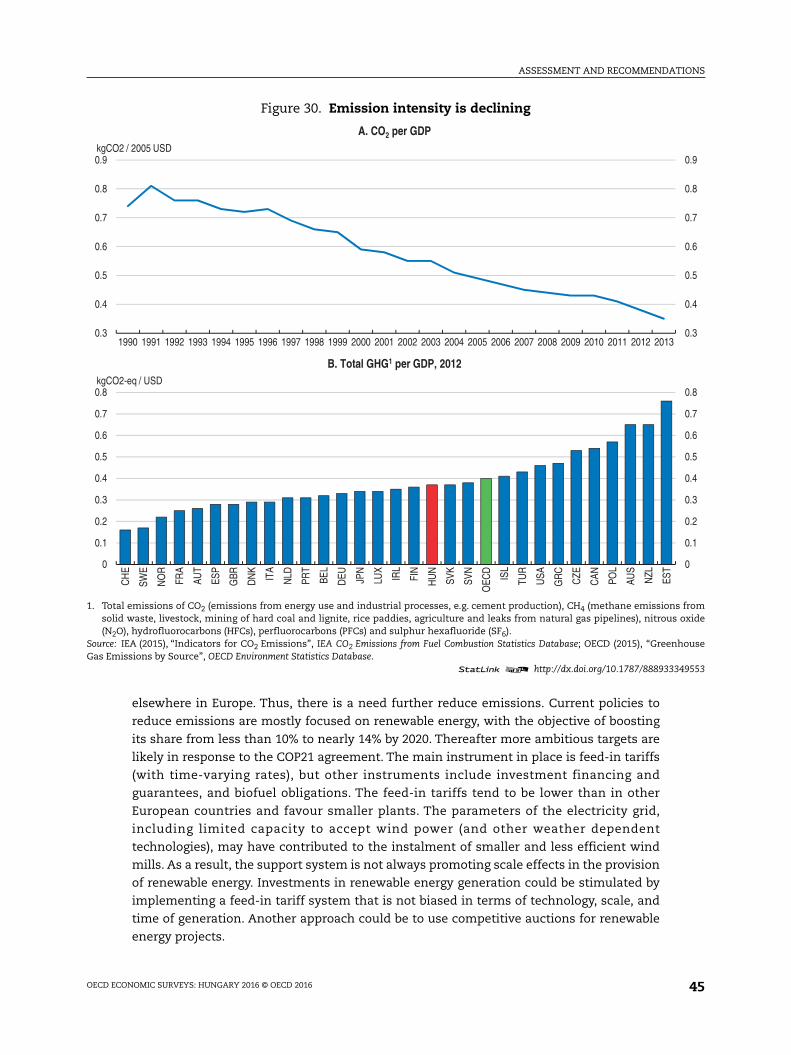
ASSESSMENT AND RECOMMENDATIONS
OECD ECONOMIC SURVEYS: HUNGARY 2016 © OECD 2016 45
elsewhere in Europe. Thus, there is a need further reduce emissions. Current policies to
reduce emissions are mostly focused on renewable energy, with the objective of boosting
its share from less than 10% to nearly 14% by 2020. Thereafter more ambitious targets are
likely in response to the COP21 agreement. The main instrument in place is feed-in tariffs
(with time-varying rates), but other instruments include investment financing and
guarantees, and biofuel obligations. The feed-in tariffs tend to be lower than in other
European countries and favour smaller plants. The parameters of the electricity grid,
including limited capacity to accept wind power (and other weather dependent
technologies), may have contributed to the instalment of smaller and less efficient wind
mills. As a result, the support system is not always promoting scale effects in the provision
of renewable energy. Investments in renewable energy generation could be stimulated by
implementing a feed-in tariff system that is not biased in terms of technology, scale, and
time of generation. Another approach could be to use competitive auctions for renewable
energy projects.
Figure 30. Emission intensity is declining
1. Total emissions of CO2 (emissions from energy use and industrial processes, e.g. cement production), CH4 (methane emissions fromsolid waste, livestock, mining of hard coal and lignite, rice paddies, agriculture and leaks from natural gas pipelines), nitrous oxide(N2O), hydrofluorocarbons (HFCs), perfluorocarbons (PFCs) and sulphur hexafluoride (SF6).
Source: IEA (2015), “Indicators for CO2 Emissions”, IEA CO2 Emissions from Fuel Combustion Statistics Database; OECD (2015), “GreenhouseGas Emissions by Source”, OECD Environment Statistics Database.
1 2 http://dx.doi.org/10.1787/888933349553
0.3
0.4
0.5
0.6
0.7
0.8
0.9
0.3
0.4
0.5
0.6
0.7
0.8
0.9
1990 1991 1992 1993 1994 1995 1996 1997 1998 1999 2000 2001 2002 2003 2004 2005 2006 2007 2008 2009 2010 2011 2012 2013
kgCO2 / 2005 USD
A. CO2 per GDP
0
0.1
0.2
0.3
0.4
0.5
0.6
0.7
0.8
0
0.1
0.2
0.3
0.4
0.5
0.6
0.7
0.8
CH
E
SWE
NO
R
FRA
AUT
ESP
GBR
DN
K
ITA
NLD
PRT
BEL
DEU JP
N
LUX
IRL
FIN
HU
N
SVK
SVN
OEC
D
ISL
TUR
USA
GR
C
CZE
CAN PO
L
AUS
NZL
EST
kgCO2-eq / USD
B. Total GHG1 per GDP, 2012
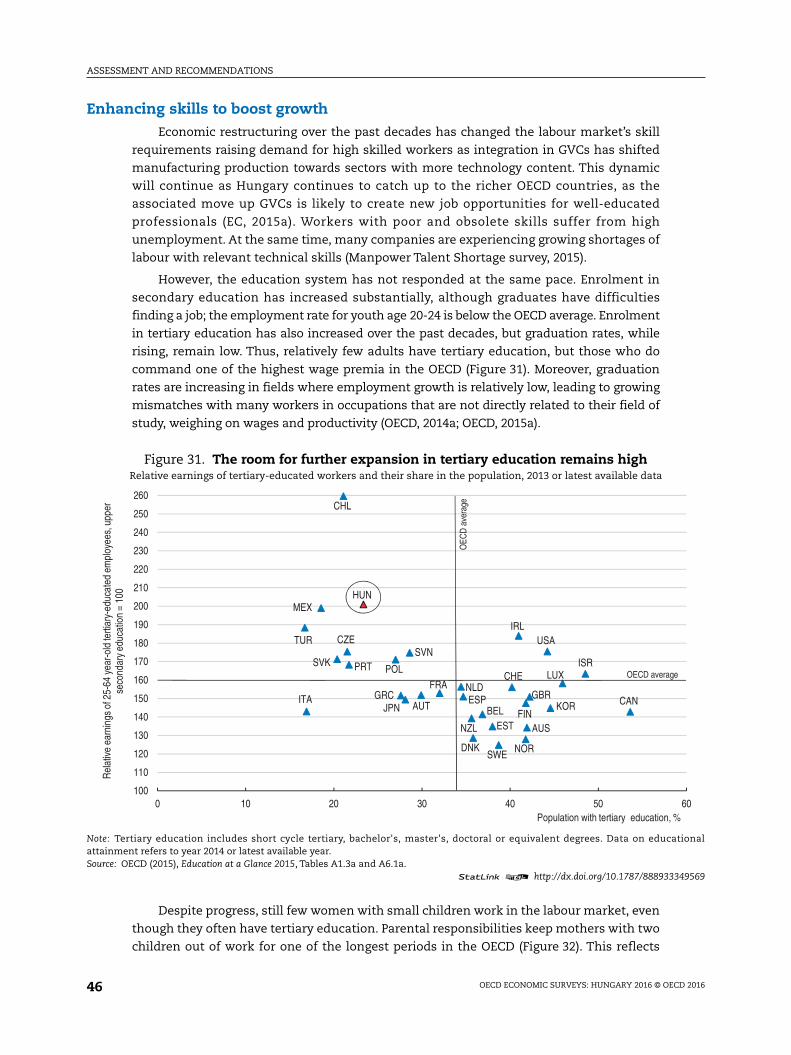
ASSESSMENT AND RECOMMENDATIONS
OECD ECONOMIC SURVEYS: HUNGARY 2016 © OECD 201646
Enhancing skills to boost growthEconomic restructuring over the past decades has changed the labour market’s skill
requirements raising demand for high skilled workers as integration in GVCs has shifted
manufacturing production towards sectors with more technology content. This dynamic
will continue as Hungary continues to catch up to the richer OECD countries, as the
associated move up GVCs is likely to create new job opportunities for well-educated
professionals (EC, 2015a). Workers with poor and obsolete skills suffer from high
unemployment. At the same time, many companies are experiencing growing shortages of
labour with relevant technical skills (Manpower Talent Shortage survey, 2015).
However, the education system has not responded at the same pace. Enrolment in
secondary education has increased substantially, although graduates have difficulties
finding a job; the employment rate for youth age 20-24 is below the OECD average. Enrolment
in tertiary education has also increased over the past decades, but graduation rates, while
rising, remain low. Thus, relatively few adults have tertiary education, but those who do
command one of the highest wage premia in the OECD (Figure 31). Moreover, graduation
rates are increasing in fields where employment growth is relatively low, leading to growing
mismatches with many workers in occupations that are not directly related to their field of
study, weighing on wages and productivity (OECD, 2014a; OECD, 2015a).
Despite progress, still few women with small children work in the labour market, even
though they often have tertiary education. Parental responsibilities keep mothers with two
children out of work for one of the longest periods in the OECD (Figure 32). This reflects
Figure 31. The room for further expansion in tertiary education remains highRelative earnings of tertiary-educated workers and their share in the population, 2013 or latest available data
Note: Tertiary education includes short cycle tertiary, bachelor's, master's, doctoral or equivalent degrees. Data on educationalattainment refers to year 2014 or latest available year.Source: OECD (2015), Education at a Glance 2015, Tables A1.3a and A6.1a.
1 2 http://dx.doi.org/10.1787/888933349569
AUS
AUT BELCAN
CHL
CZE
DNK
ESTFIN
FRAGRC
HUN
IRL
ISR
ITAJPN KOR
LUX
MEX
NLD
NZL
NOR
POLPRTSVKSVN
ESP
SWE
CHE
TUR
GBR
USA
100
110
120
130
140
150
160
170
180
190
200
210
220
230
240
250
260
0 10 20 30 40 50 60
Rel
ativ
e ea
rnin
gs o
f 25-
64 y
ear-o
ld te
rtiar
y-ed
ucat
ed e
mpl
oyee
s, u
pper
se
cond
ary
educ
atio
n =
100
Population with tertiary education, %
OECD average
OEC
D a
vera
ge
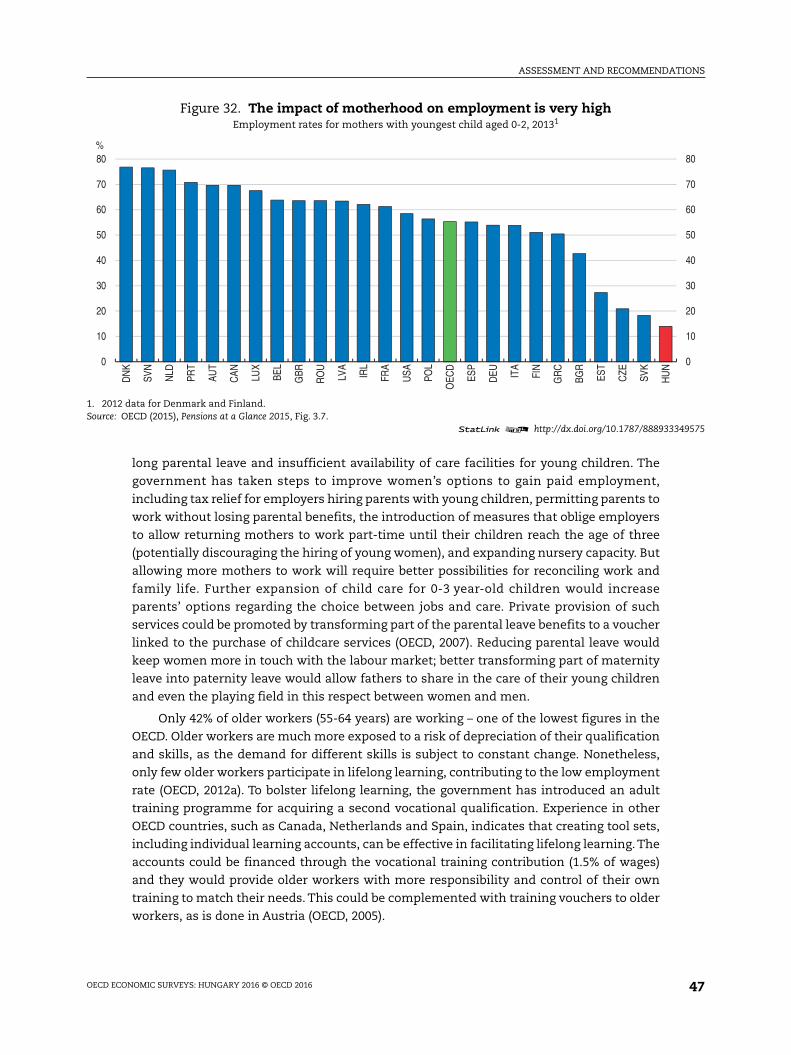
ASSESSMENT AND RECOMMENDATIONS
OECD ECONOMIC SURVEYS: HUNGARY 2016 © OECD 2016 47
long parental leave and insufficient availability of care facilities for young children. The
government has taken steps to improve women’s options to gain paid employment,
including tax relief for employers hiring parents with young children, permitting parents to
work without losing parental benefits, the introduction of measures that oblige employers
to allow returning mothers to work part-time until their children reach the age of three
(potentially discouraging the hiring of young women), and expanding nursery capacity. But
allowing more mothers to work will require better possibilities for reconciling work and
family life. Further expansion of child care for 0-3 year-old children would increase
parents’ options regarding the choice between jobs and care. Private provision of such
services could be promoted by transforming part of the parental leave benefits to a voucher
linked to the purchase of childcare services (OECD, 2007). Reducing parental leave would
keep women more in touch with the labour market; better transforming part of maternity
leave into paternity leave would allow fathers to share in the care of their young children
and even the playing field in this respect between women and men.
Only 42% of older workers (55-64 years) are working – one of the lowest figures in the
OECD. Older workers are much more exposed to a risk of depreciation of their qualification
and skills, as the demand for different skills is subject to constant change. Nonetheless,
only few older workers participate in lifelong learning, contributing to the low employment
rate (OECD, 2012a). To bolster lifelong learning, the government has introduced an adult
training programme for acquiring a second vocational qualification. Experience in other
OECD countries, such as Canada, Netherlands and Spain, indicates that creating tool sets,
including individual learning accounts, can be effective in facilitating lifelong learning. The
accounts could be financed through the vocational training contribution (1.5% of wages)
and they would provide older workers with more responsibility and control of their own
training to match their needs. This could be complemented with training vouchers to older
workers, as is done in Austria (OECD, 2005).
Figure 32. The impact of motherhood on employment is very highEmployment rates for mothers with youngest child aged 0-2, 20131
1. 2012 data for Denmark and Finland.Source: OECD (2015), Pensions at a Glance 2015, Fig. 3.7.
1 2 http://dx.doi.org/10.1787/888933349575
0
10
20
30
40
50
60
70
80
0
10
20
30
40
50
60
70
80
DN
K
SVN
NLD
PRT
AUT
CAN LU
X
BEL
GBR
RO
U
LVA
IRL
FRA
USA PO
L
OEC
D
ESP
DEU IT
A
FIN
GR
C
BGR
EST
CZE
SVK
HU
N
%
ASSESSMENT AND RECOMMENDATIONS
OECD ECONOMIC SURVEYS: HUNGARY 2016 © OECD 201648
Emigration of young and skilled workers contributes to labour shortages in some
professions, such as in the health care sector. Since 2008, the stock of emigrants has tripled
to 3% of the labour force. The government is trying to attract skilled young expatriates
through the recently launched “Come Home, Youth!” programme, which covers part of
resettlement costs and provides a monthly wage subsidy for one year (of EUR 320). Uptake
has been limited. Other countries, for example, Denmark, Finland, Ireland, and the
Netherlands, have also granted tax concession for returning high-skilled workers (OECD,
2011). Further easing of visa and work permit requirements can help attract skilled labour
from outside EU. Special attention in this respect should be given to (the relatively few)
international students, who have studied in Hungary and are thus familiar with the
language, institutions and culture. These students should be allowed to look for a job after
graduation and automatically provided with work permit if they find a job.
Regarding low-skilled workers, the scaling up of public work schemes has provided
temporary relief from unemployment of people who have long been excluded from the
labour market through mostly menial jobs, notably benefitting low-skilled workers in poor
regions with weak labour market prospects. Ideally, public works jobs would lead to jobs in
the primary labour market. However, less than 14% of participants have found employment
in the primary labour market after terminating work in the scheme, and most participants
return to the scheme after another spell of unemployment. This is in line with experiences
in other countries, indicating that skills gained in public work schemes are seldom relevant
for private sector employment. Indeed, participation in public work schemes can even
lower subsequent employment probability as enrolees are prevented from job search or
training activities (Card et al., 2015).
To address this issue, the authorities are bolstering the schemes’ training component to
include one-fifth of participants – an approach that holds the promise of making growth more
inclusive by bringing those who have been excluded from the labour market into regular work.
A problem is that training has not markedly increase employment probabilities, reflecting
large uncertainties concerning the effectiveness of different types of training.Thus, the scaling
up of training should be combined with careful evaluation to identify training programmes
that favour subsequent employment. Increased transit from the schemes to the private labour
market should be the success criterion for the schemes. The effectiveness of the schemes
might be bolstered if they were closely coordinated with other job programmes, such as job
search assistance and mentoring. Indeed, the new profiling system could be a step in this
direction. If such measures were successful, the public works schemes could be scaled back as
over time fewer people would need this sort of support.
PISA scores have been deteriorating, including in mathematics, and are now below the
OECD average in all assessed subject (Figure 33, Panel A). More worryingly, the education
system falls short in preparing students to perform tasks required in today’s labour market,
such as solving non-routine problems in unfamiliar situation. Indeed, the PISA tests show
that problem solving skills are among the weakest in the OECD. Particularly, students
perform significantly worse in problem solving than students in other countries with
similar performance in core subjects, suggesting that Hungarian teaching remains too
content-centred with little space for knowledge application (Figure 33, Panel B). In
contrast, the rapid changes in the economy and technology require the ability to adapt to
new circumstances and learning in unfamiliar contexts. Empirical research confirms that
those with the highest level of proficiency in problem solving also find employment in the
occupations with the strongest employment creation (OECD, 2014c).
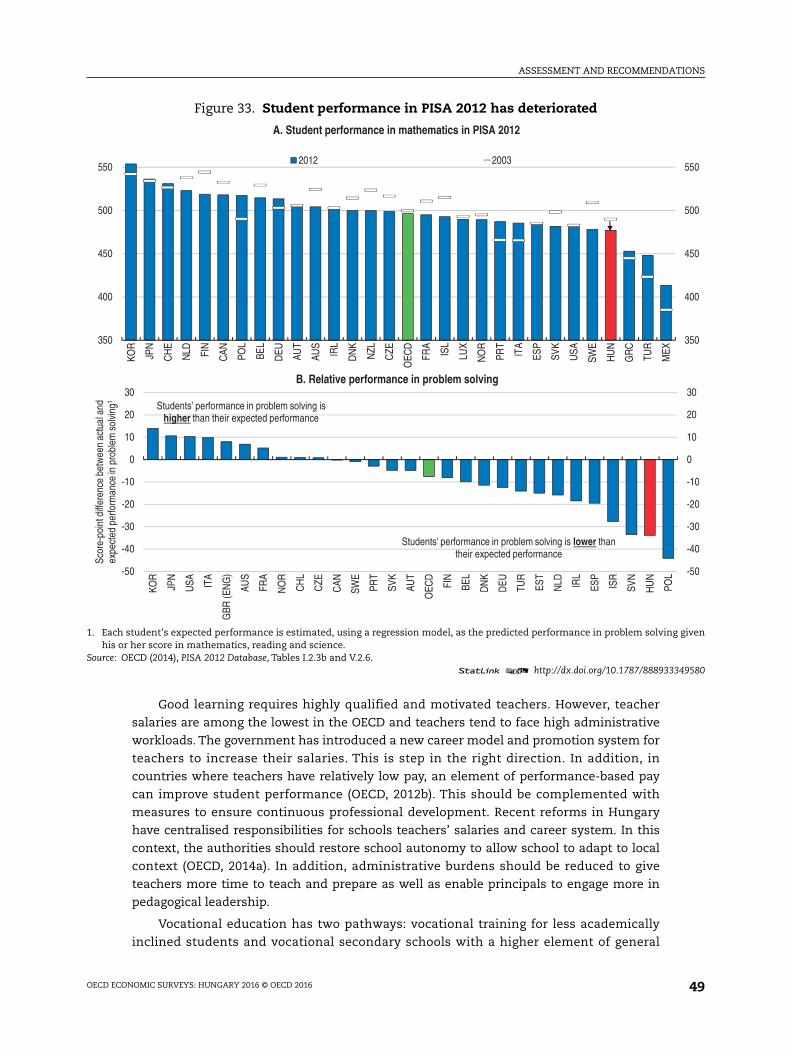
ASSESSMENT AND RECOMMENDATIONS
OECD ECONOMIC SURVEYS: HUNGARY 2016 © OECD 2016 49
Good learning requires highly qualified and motivated teachers. However, teacher
salaries are among the lowest in the OECD and teachers tend to face high administrative
workloads. The government has introduced a new career model and promotion system for
teachers to increase their salaries. This is step in the right direction. In addition, in
countries where teachers have relatively low pay, an element of performance-based pay
can improve student performance (OECD, 2012b). This should be complemented with
measures to ensure continuous professional development. Recent reforms in Hungary
have centralised responsibilities for schools teachers’ salaries and career system. In this
context, the authorities should restore school autonomy to allow school to adapt to local
context (OECD, 2014a). In addition, administrative burdens should be reduced to give
teachers more time to teach and prepare as well as enable principals to engage more in
pedagogical leadership.
Vocational education has two pathways: vocational training for less academically
inclined students and vocational secondary schools with a higher element of general
Figure 33. Student performance in PISA 2012 has deteriorated
1. Each student's expected performance is estimated, using a regression model, as the predicted performance in problem solving givenhis or her score in mathematics, reading and science.
Source: OECD (2014), PISA 2012 Database, Tables I.2.3b and V.2.6.1 2 http://dx.doi.org/10.1787/888933349580
-50
-40
-30
-20
-10
0
10
20
30
-50
-40
-30
-20
-10
0
10
20
30
KOR
JPN
USA IT
A
GBR
(EN
G)
AUS
FRA
NO
R
CH
L
CZE
CAN
SWE
PRT
SVK
AUT
OEC
D
FIN
BEL
DN
K
DEU TU
R
EST
NLD IR
L
ESP
ISR
SVN
HU
N
POL
Scor
e-po
int d
iffer
ence
bet
wee
n ac
tual
and
ex
pect
ed p
erfo
rman
ce in
pro
blem
sol
ving
1
B. Relative performance in problem solving
Students' performance in problem solving is lower than their expected performance
Students' performance in problem solving is higher than their expected performance
350
400
450
500
550
350
400
450
500
550
KOR
JPN
CH
E
NLD FI
N
CAN PO
L
BEL
DEU AU
T
AUS
IRL
DN
K
NZL
CZE
OEC
D
FRA
ISL
LUX
NO
R
PRT
ITA
ESP
SVK
USA
SWE
HU
N
GR
C
TUR
MEX
A. Student performance in mathematics in PISA 2012
2012 2003
ASSESSMENT AND RECOMMENDATIONS
OECD ECONOMIC SURVEYS: HUNGARY 2016 © OECD 201650
education with the possibility for accessing tertiary education. Vocational training
provides practical workplace training, with limited general education content, to prepare
students for direct access to the labour market. However, quality is low and vocational
training has become the education path for children with weak socio-economic
background (Keller and Mártonfi, 2009). Graduates are faced with high unemployment
rates, difficulties in finding a first job, and wages that are 25% lower than other secondary
school graduates (Hajdu et al., 2015). In addition, the limited general education content
reduces graduates’ adaptability to changing labour market needs, leading to increasing
wage dispersion over time vis-à-vis general education graduates (Hajdu et al., 2015).
The government is reforming VET training by introducing a two-year study extension
that leads to the upper secondary degree that gives access to tertiary education. This study
programme starts with three years to acquire practical skills followed by two years of
general skill studies, rather than an integrated study programme. Integrated study could be
achieved by merging the vocational training and vocational school systems. This would
increase the emphasis on general skills and improve the reputation of vocational training,
helping to close the gap in labour market outcomes between training schools and
vocational secondary schools.
Such a reform should be complemented with systematic assessments of students to
ensure a basic minimum level of skills and identify those in need of targeted support.
A factor behind the poor outcome of workplace training is that often students are allocated
to unskilled tasks or only trained in firm-specific skills. To improve the quality of
workplace training, subsidies should be introduce to reward companies which have high
training quality standards. Also, contractual arrangements should define obligations of
trainee and employer to achieve learning objectives, which should be developed by
employers and schools.
Tertiary graduates enjoy a favourable labour market situation, but the supply of
tertiary graduates remains stubbornly low as less than half of the students are able to
finish studies within the required time as completion rate is one of the lowest in the OECD.
In addition, labour market outcomes of different tertiary graduates differ greatly. For
example, graduates with degrees in informatics and engineering earn more than twice the
earnings of graduates in social science or agriculture. Moreover, one in four graduates in
tertiary education works in a job that do not need their tertiary degree – a problem also
observed in other countries (Nyusti and Veroszta, 2013). This mismatch is the strongest in
the fields of social science, agriculture and humanities.
Relatively few financial resources are devoted to higher education. However, both
public and private returns to tertiary education are among the highest in the OECD,
providing strong incentives for investing in tertiary education. Thus, the government
should increasing funding in this area. Moreover, there is a need to enhance incentives for
institutions to better respond to labour market needs. This could include better career
counselling and strengthen partnership between tertiary education institutions and
private companies to facilitate the labour market transition of students (OECD 2014a).
Moreover, for equity reasons, means tested support for disadvantaged students, including
academic mentoring and financial aid, should be expanded.
ASSESSMENT AND RECOMMENDATIONS
OECD ECONOMIC SURVEYS: HUNGARY 2016 © OECD 2016 51
Bibliography
Adarov, A. and R. Tchaidze (2011), “Development of Financial Markets in Central Europe: The Case ofthe CE4 Countries”, IMF Working Paper, WP/11/101.
Andrews, A.M. (2005), “State-Owned Banks, Stability, Privatization, and Growth – Practical PolicyDecisions in a World Without Empirical Proof”, IMF Working Paper, WP/05/10.
Bauer, P. (2014), “Corporate Profitability and Labour Market Adjustments – Findings of a Micro DataStudy”, MNB Bulletin, March.
Benedek, D., P. Elek and J. Köll (2013), “Tax Avoidance, Tax Evasion, Black and Grey Employment”, inK. Fazekas, P. Benczúr and Á Telegdy (eds.), The Hungarian Labour Market, Review and Analysis.
BMI Research (2014), “Digi to Barely Impact Mobile Market Share in Hungary”, www.bmiresearch.com/news-and-views/digi-to-barely-impact-mobile-market-share-in-hungary.
Card, D., J. Kluve and J. Weber (2015), “What Works? A Meta Analysis of Recent Active Labor MarketProgram Evaluations”, NBER Working Paper,, No. 21431, www.nber.org/papers/w21431.
Endresz, M., P. Harasztosi, and R.P. Lieli (2015), “The Impact of the Magyar Nemzeti Bank’s Funding forGrowth Scheme on Firm Level Investment”, MNB Working Papers 2.
European Commission (2013), “Building a Strengthened Fiscal Framework in the European Union– A Guide to the Stability and Growth Pact”, European Economy Occasional Papers 150, May.
European Commission (2014), “April Infringements Package: Main Decisions”, Press Release, Brussels, 16 April.
European Commission (2015), “Study to Quantify and Analyse the VAT Gap in the EU Member States”,2015 Report, Warsaw.
European Commission (2015b), “The 2015 Ageing Report, Economy and Budgetary Projections for the28 EU Member States” (2013-2060), 3/2015, Brussels.
European commission, (2015c), “Skill Supply and Demand up to 2025”, Hungary Country Forecast,European Centre for the Development of Vocational Training.
Eurostat (2015), “First Time Release of Data on Contingent Liabilities and Non-Performing Loans inEU Member States”, Eurostat Newsrelease, 26/2015, 10 February.
European Union Agency for Fundamental Rights (2014), “Poverty and Employment: The Situation ofRoma in 11 EU Member States”.
Fall, F. and J. Fournier (2015), “Macroeconomic Uncertainties, Prudent Debt Targets and Fiscal Rules”,OECD Economics Department Working Papers, No. 1230, OECD Publishing, Paris, http://dx.doi.org/10.1787/5jrxv0bf2vmx-en.
Government (2015a), www.kormany.hu/en/ministry-for-national-economy/news/eu-should-adopt-a-common-stance-in-combating-vat-fraud.
Government (2015b), The National Reform Programme.
Government (2015c), Convergence Programme of Hungary, 2015-2018.
Hajdu, T., Z. Hermann, D. Horn, G. Kertesi, G. Kezdi, J. Kollo and J. Varga (2015), “Az Érettségi Védelmében”,Budapest i Munkagazdaságtani füz ETEK BWP.
IMF (2015), “Hungary – 2015 Article IV Consultation”, IMF Country Report, No. 15/92, Washington, DC.
Jäger-Gyovai. K. (2014), “Capital Market Development in CESEE and the Need for Further Reform”,Oesterreichische Nationalbank, Financial Stability Report 27, June.
Johansson, Å., C. Heady, J. Arnold, B. Brys and L. Vartia (2008), “Taxation and Economic Growth”, OECDEconomics Department Working Papers, No. 620, OECD Publishing, http://dx.doi.org/10.1787/241216205486.
Keller, J. and G. Mártonfi (2009), “Inequalities and Special Needs in Education in Hungary 2006”,Hungarian Institute for Educational Research and Development, Budapest.
Kroll, C. (2015), “Sustainable Development Goals: Are the Rich Countries Ready?”, SustainableDevelopment Solutions Network – A Global Initiative for the United Nations, Bertelsmann Stiftung.
LawNow (2015), “Hungary: Changes Affecting the Retail Industry”, www.cms-lawnow.com/ealerts/2015/03/hungary-changes-affecting-the-retail-industry.
Martonosi, A. (2013), “Factors Underlying Low Investment in Hungary”, MNB Bulletin, January.
McGowan, A. and D. Andrews (2015), “Labour Market Mismatch and Labour Productivity: Evidencefrom PIAAC Data”, OECD Economics Department Working Papers, No. 1209, OECD Publishing.
ASSESSMENT AND RECOMMENDATIONS
OECD ECONOMIC SURVEYS: HUNGARY 2016 © OECD 201652
MFB (Magyar Fejlesztési Bank – Hungarian Development Bank) (2015), Periszkóp, August.
MNB (2015), Financial Stability Report, November.
MNB (2015a), “MNB Introduces a New Ten-Year Interest Rate Swap Facility to Encourage Banks’Purchases of Government Securities”, Press Release, 7 July.
MNB (2015b), “MNB Introduces New Regulations to Reduce External Vulnerability”, Press Release, 7 July.
MNB (2015c), “Restoring Market-Based Financing and Achieving a Lasting Turnaround in Lending ArePriorities”, Press Release, 3 November.
Nyuisti S. and Z. Veroszta (2013), “Hungarian Graduate Career Tracking 2013”, Education Public SectorNon-Profit LLC.
OECD (2005), Promoting Adult Learning, 2005, OECD Publishing.
OECD (2007) “Babies and Bosses – Reconciling Work and Family Life”, A Synthesis of Findings for OECD.
OECD (2011), “Taxation and Employment”, OECD Tax Policy Studies, No. 21, OECD, Paris.
OECD (2012a), OECD Economic Surveys: Hungary 2012, OECD Publishing, http://dx.doi.org/10.1787/9789264127272-en.
OECD (2012b), “Does Performance-Based Pay Improve Teaching?”, PISA in Focus, No. 16.
OECD (2013a), Global Value Chains (GVCs), Hungary.
OECD (2013b), “Specialised Anti-Corruption Institutions: Review of Models”, Second Edition, OECDPublishing, http://dx.doi.org/10.1787/9789264187207-en.
OECD (2014a), OECD Economic Surveys: Hungary 2014, OECD Publishing, http://dx.doi.org/10.1787/eco_surveys-hun-2014-en.
OECD (2014b), “The Distributional Effects of Consumption Taxes in OECD Countries”, OECD/KoreaInstitute of Public Finance, OECD Tax Policy Studies, No. 22, OECD Publishing, http://dx.doi.org/10.1787/9789264224520-en.
OECD (2014c), “PISA 2012 Results: Creative Problem Solving: Students’ Skills in Tackling Real-LifeProblems” (Volume V), PISA, OECD Publishing, http://dx.doi.org/10.1787/9789264208070-en.
OECD (2014d), Public Governance Review of Hungary.
OECD (2015), Digital Outlook.
OECD (2015a), Government at a Glance – How Hungary Compares, Paris.
OECD (2015b), International Migration Outlook 2015, Paris.
OECD (2015c), OECD Economic Outlook, No. 97, May.
OECD (2016), Green Investment Banks: Scaling Up Private Investments in Low-Carbon Infrastructure, OECDPublishing.
Semjén A. and I.J. Tóth (2010), “A válság lehetséges hatásai a be nem jelentett foglalkoztatásra”, inK. Fazekas and G. Molnár (eds.), Munkaerőpiaci Tükör 2010: Közelkép: A Válság Munkapiaci Hatásai,MTA Közgazdaságtudományi Intézet Országos Foglalkoztatási Közalapítvány, pp. 149-168.
Svraka-Szabó-Hudecz (2013), “Foglalkoztatásösztönző adókedvezmények a magyar munkaerőpiacon”,Pénzügyi Szemle, 58/4, pp. 386, December.
Talent Shortage Survey (2015), Manpower group, www.manpowergroup.com/wps/wcm/connect/db23c560-08b6-485f-9bf6- f5f38a43c76a/2015_Talent_Shortage_Survey_US-lo_res.pdf?MOD=AJPERES.
Tldr.444 (2015), “Az élelmiszerpiacot akarták átrendezni a plázastoppal”, http://tldr.444.hu/2015/11/30/az-elelmiszerpiacot-akartak-atrendezni-a-plazastoppal#, 30 November.
United Nations (2015), Sustainable Development Goals, www.un.org/sustainabledevelopment/sustainable-development-goals/.
Varga (2015), “Hova lettek az orvosok? Az orvosok külföldre vándorlása és pályaelhagyása Magyarországon2003-2011”, Budapesti Munkagazdaságtani Füzetek, BWP – 2015/6, Budapest.
Véron, N. and G.B. Wolff (2015), “Capital Market Union: A Vision for the Long Term”, Bruegel PolicyContribution, Issue 2015/05, April.
World Bank (2015), “Doing Business 2015 – Going Beyond Efficiency”, Economic Profile 2015 Hungary,Washington.