Embed Size (px)
Citation preview
OECD Economic Surveys RUSSIAN FEDERATION January 2014
OVERVIEW

©
©
©
©
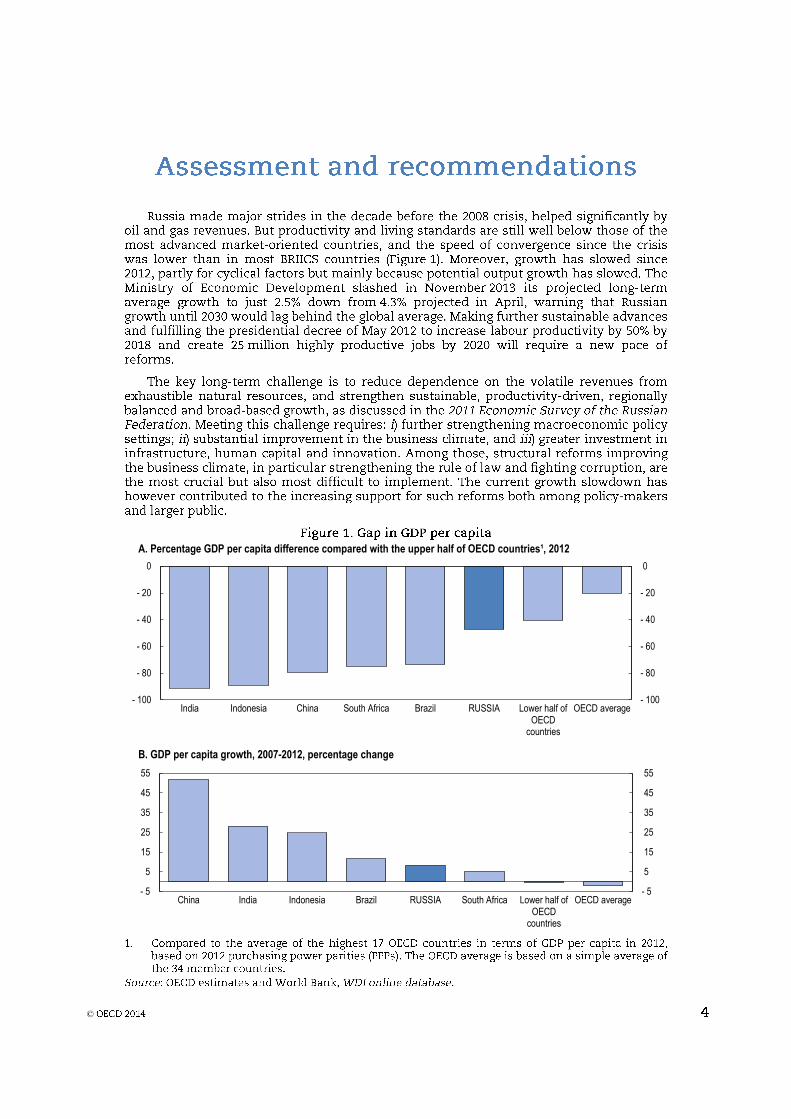
A. Percentage GDP per capita difference compared with the upper half of OECD countries¹, 2012
B. GDP per capita growth, 2007-2012, percentage change
- 100
- 80
- 60
- 40
- 20
0
- 100
- 80
- 60
- 40
- 20
0
India Indonesia China South Africa Brazil RUSSIA Lower half ofOECD
countries
OECD average
- 5
5
15
25
35
45
55
- 5
5
15
25
35
45
55
China India Indonesia Brazil RUSSIA South Africa Lower half ofOECD
countries
OECD average
©
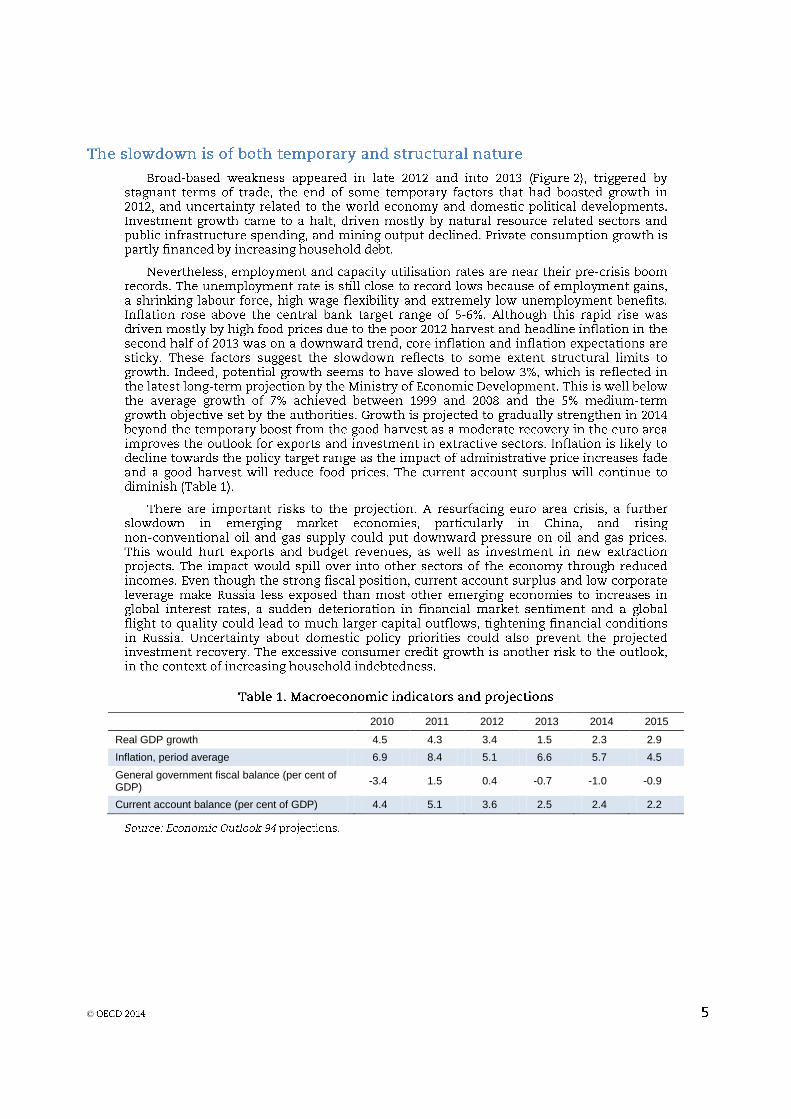
2010 2011 2012 2013 2014 2015
Real GDP growth 4.5 4.3 3.4 1.5 2.3 2.9
Inflation, period average 6.9 8.4 5.1 6.6 5.7 4.5
General government fiscal balance (per cent of GDP)
-3.4 1.5 0.4 -0.7 -1.0 -0.9
Current account balance (per cent of GDP) 4.4 5.1 3.6 2.5 2.4 2.2
©
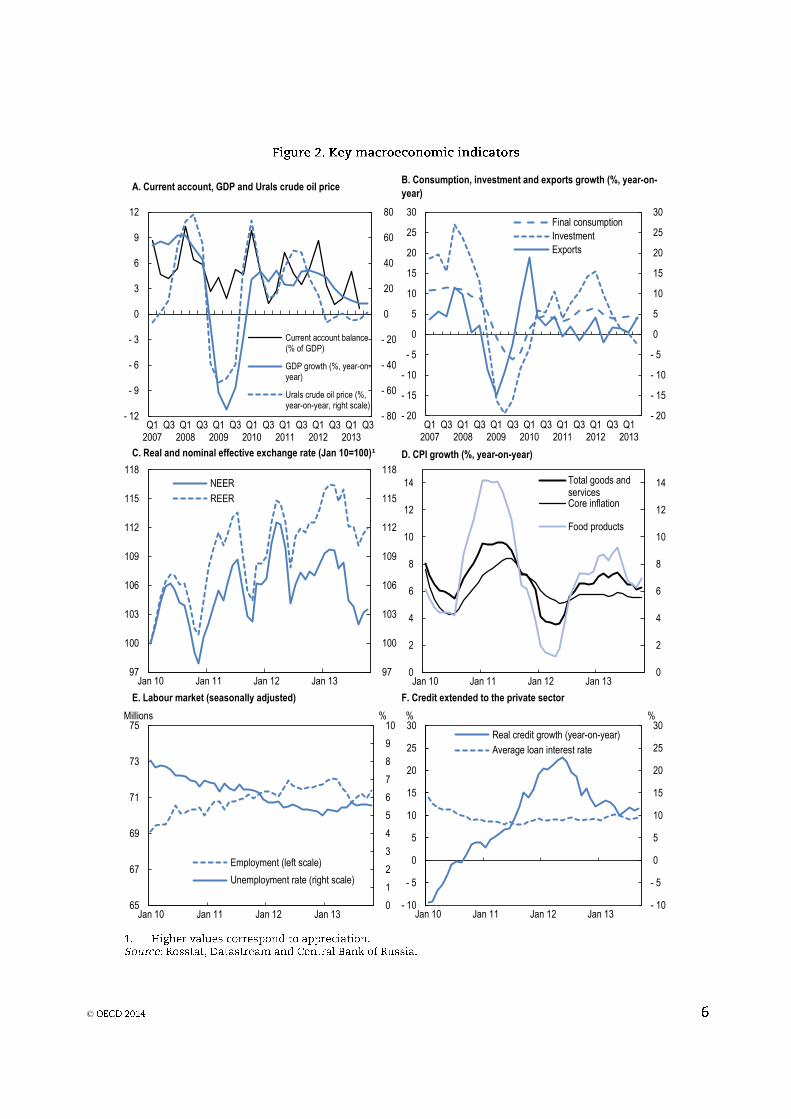
C. Real and nominal effective exchange rate (Jan 10=100)¹
E. Labour market (seasonally adjusted)
A. Current account, GDP and Urals crude oil priceB. Consumption, investment and exports growth (%, year-on-
year)
D. CPI growth (%, year-on-year)
F. Credit extended to the private sector
- 20
- 15
- 10
- 5
0
5
10
15
20
25
30
Q12007
Q3 Q12008
Q3 Q12009
Q3 Q12010
Q3 Q12011
Q3 Q12012
Q3 Q12013
- 20
- 15
- 10
- 5
0
5
10
15
20
25
30Final consumption
Investment
Exports
- 80
- 60
- 40
- 20
0
20
40
60
80
- 12
- 9
- 6
- 3
0
3
6
9
12
Q12007
Q3 Q12008
Q3 Q12009
Q3 Q12010
Q3 Q12011
Q3 Q12012
Q3 Q12013
Q3
Current account balance(% of GDP)
GDP growth (%, year-on-year)
Urals crude oil price (%,year-on-year, right scale)
0
2
4
6
8
10
12
14
Jan 10 Jan 11 Jan 12 Jan 13 0
2
4
6
8
10
12
14Total goods andservicesCore inflation
Food products
0
1
2
3
4
5
6
7
8
9
10
65
67
69
71
73
75
Jan 10 Jan 11 Jan 12 Jan 13
%Millions
Employment (left scale)
Unemployment rate (right scale)
- 10
- 5
0
5
10
15
20
25
30
- 10
- 5
0
5
10
15
20
25
30
Jan 10 Jan 11 Jan 12 Jan 13
%%
Real credit growth (year-on-year)
Average loan interest rate
97
100
103
106
109
112
115
118
97
100
103
106
109
112
115
118
Jan 10 Jan 11 Jan 12 Jan 13
NEER
REER
©
©
- 16
- 12
- 8
- 4
0
4
8
12
- 16
- 12
- 8
- 4
0
4
8
12
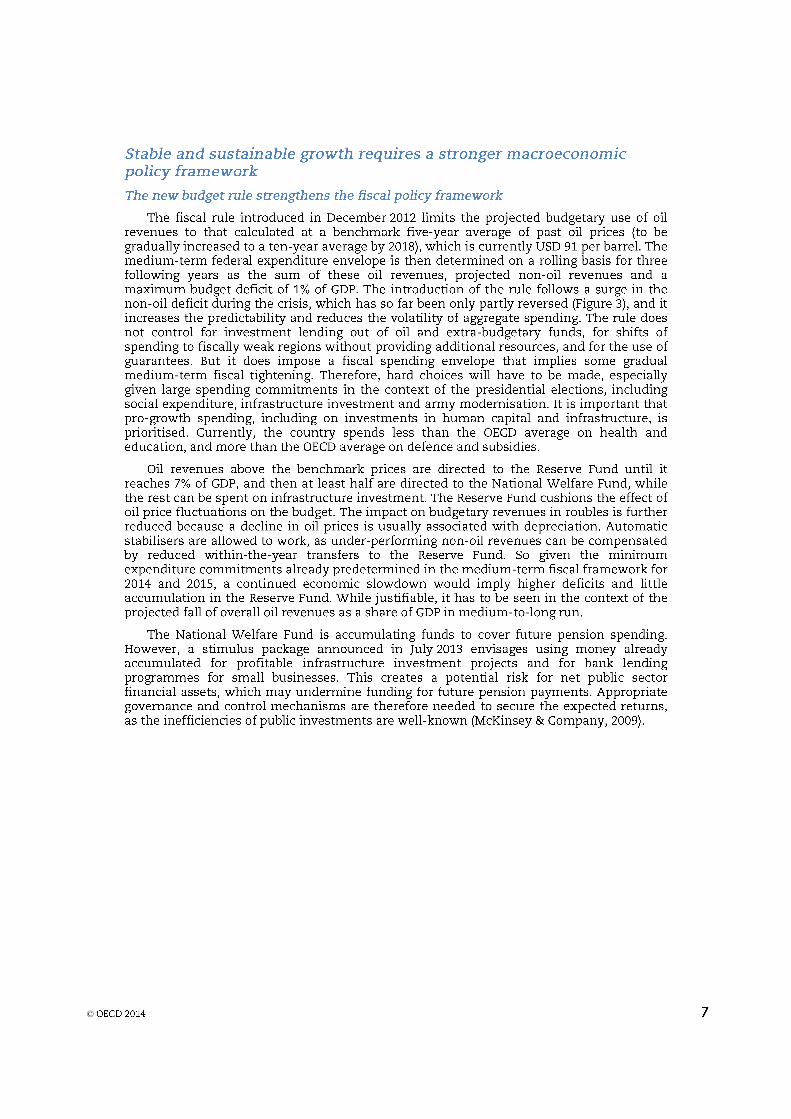
1998 1999 2000 2001 2002 2003 2004 2005 2006 2007 2008 2009 2010 2011 2012
General government budget balance
Non-oil balance
©
©
0
2
4
6
8
10
12
14
0
2
4
6
8
10
12
14
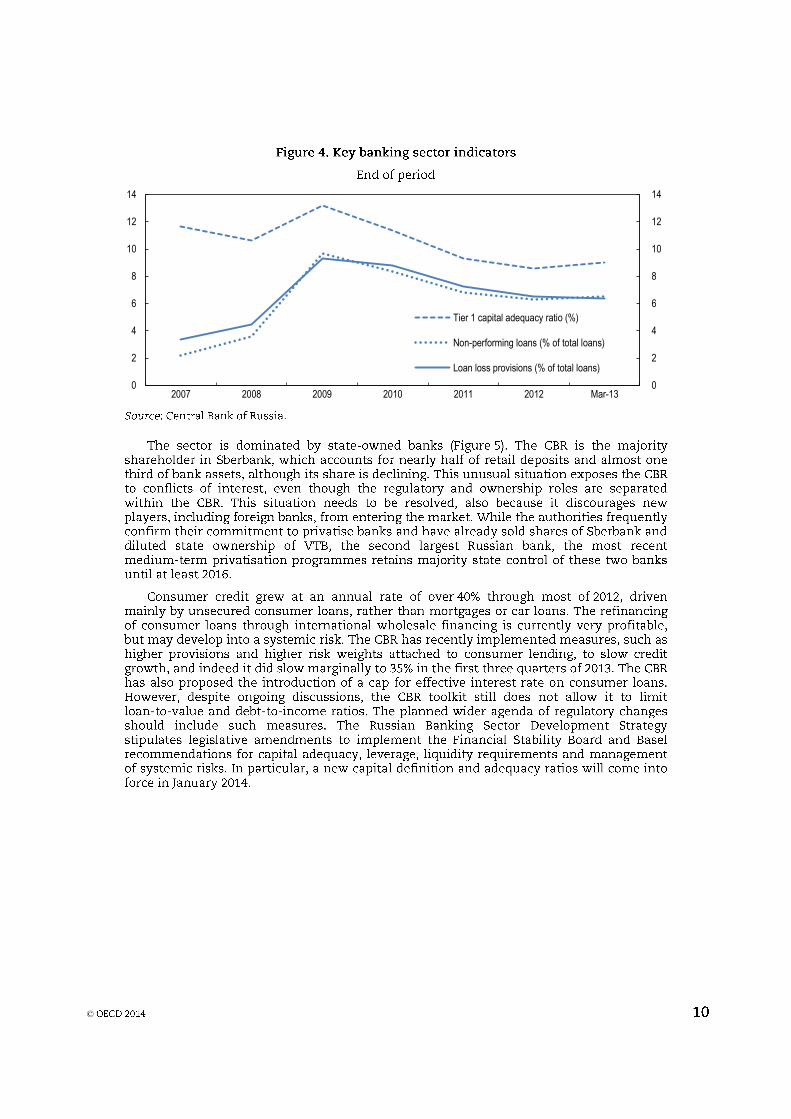
2007 2008 2009 2010 2011 2012 Mar-13
Tier 1 capital adequacy ratio (%)
Non-performing loans (% of total loans)
Loan loss provisions (% of total loans)
©
Box 1. Recommendations for strengthening the macroeconomic policy framework
Further strengthen the medium-term fiscal framework by stricter control of guarantees, regional spending and the use of oil funds. To reduce ageing-related spending increases, raise women’s retirement age to men’s and increase both in line with rising life expectancy, while implementing other measures to increase the effective retirement age.
Continue transition to inflation targeting, while improving transparency of monetary policy decisions. Develop macro-prudential instruments to rein in excessive growth of consumer loans as part of regulatory and supervisory reforms. Improve monitoring of non-performing loans. Resolve the potential conflict of interest at the central bank, which is both the majority owner and the supervisor of the largest Russian bank.
0
5 000
10 000
15 000
20 000
25 000
30 000
35 000
40 000
45 000
50 000
55 000
0
5 000
10 000
15 000
20 000
25 000
30 000
35 000
40 000
45 000
50 000
55 000
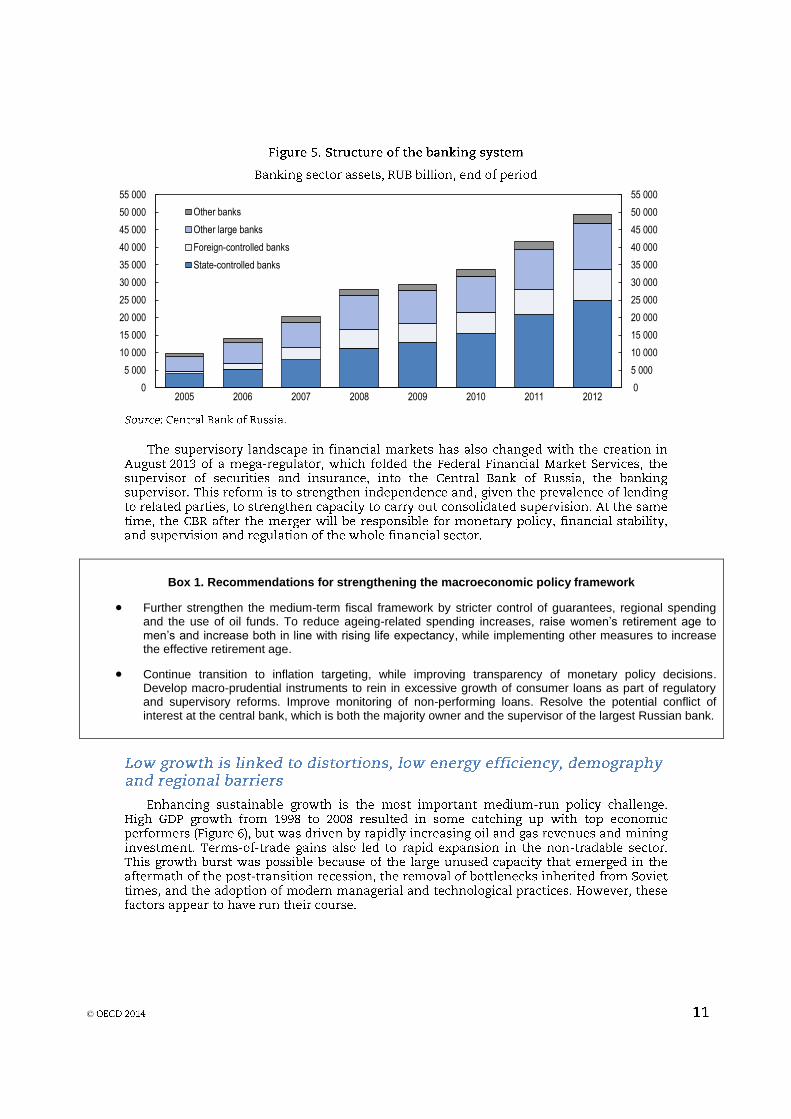
2005 2006 2007 2008 2009 2010 2011 2012
Other banks
Other large banks
Foreign-controlled banks
State-controlled banks
©
Value added share (current prices)
Annual real growth rates (%)
1995 2008 Value added Labour input Capital input MFP
Total Economy 100.0 100.0 4.61 1.30 3.22 2.27
Market economy 86.1 84.0 4.82 1.27 2.89 2.56
Goods 25.6 18.3 2.92 -1.01 0.51 3.23
High Skill-Intensive 3.6 3.6 3.92 -2.54 -0.18 5.57
Low Skill-Intensive 22.0 14.8 2.72 -0.71 0.64 2.78
Services 40.4 41.0 5.82 1.72 3.92 3.14
High Skill-Intensive 5.1 11.2 10.70 1.20 2.78 8.97
Low Skill-Intensive 35.3 29.8 4.60 1.85 4.20 1.69
Extended mining 20.1 24.7 4.87 2.67 3.35 0.84
Non-market economy 13.9 16.0 3.41 1.52 5.12 0.60
0
5
10
15
20
25
30
35
40
45
0
5
10
15
20
25
30
35
40
45
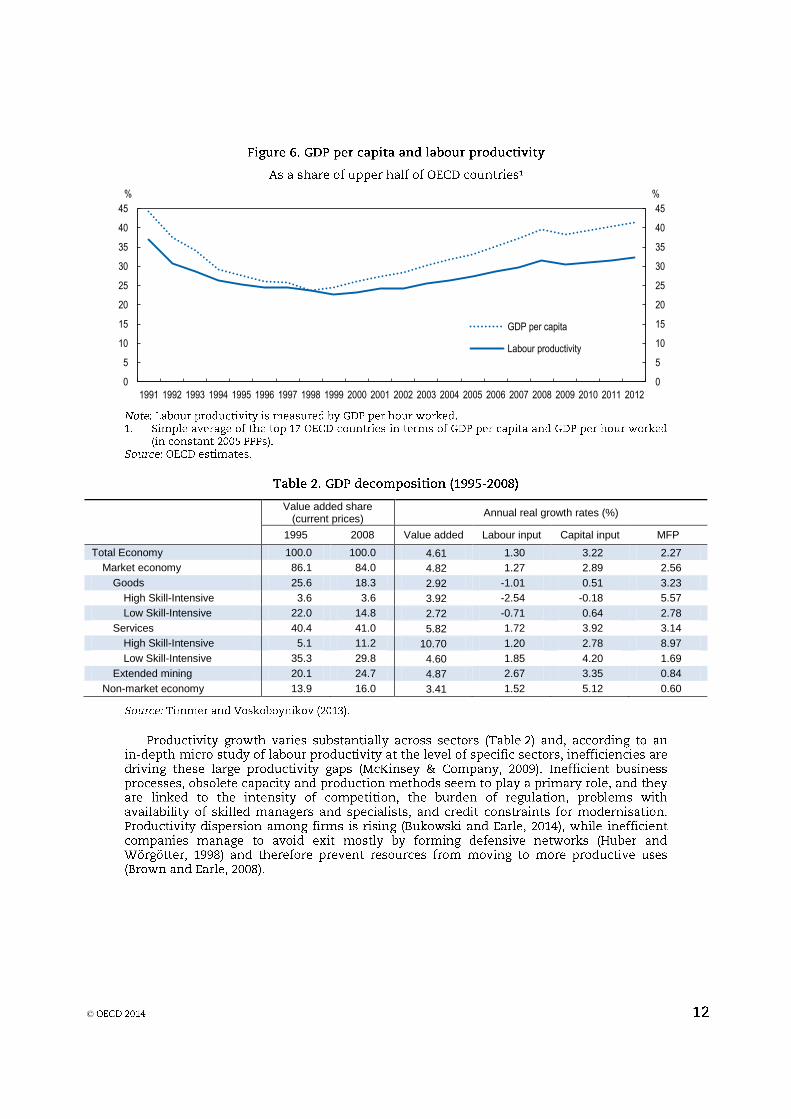
1991 1992 1993 1994 1995 1996 1997 1998 1999 2000 2001 2002 2003 2004 2005 2006 2007 2008 2009 2010 2011 2012
%%
GDP per capita
Labour productivity
©
©
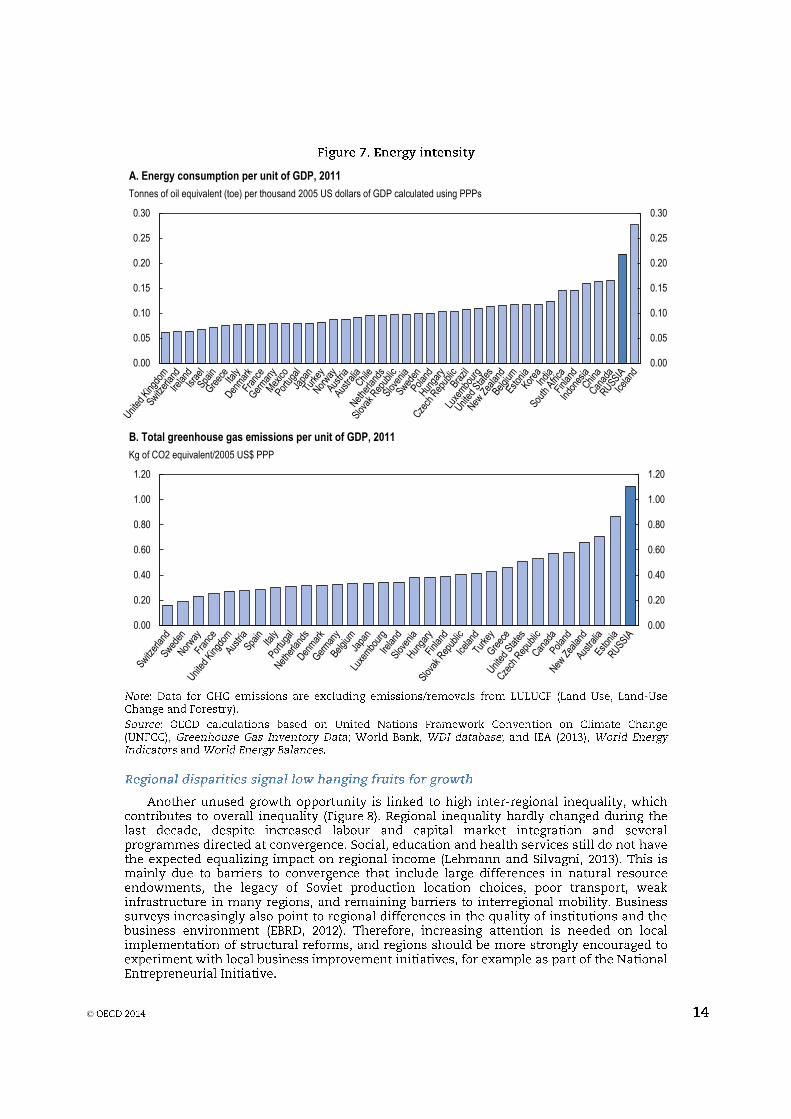
A. Energy consumption per unit of GDP, 2011
Tonnes of oil equivalent (toe) per thousand 2005 US dollars of GDP calculated using PPPs
Kg of CO2 equivalent/2005 US$ PPP
B. Total greenhouse gas emissions per unit of GDP, 2011
0.00
0.20
0.40
0.60
0.80
1.00
1.20
0.00
0.20
0.40
0.60
0.80
1.00
1.20
0.00
0.05
0.10
0.15
0.20
0.25
0.30
0.00
0.05
0.10
0.15
0.20
0.25
0.30
©
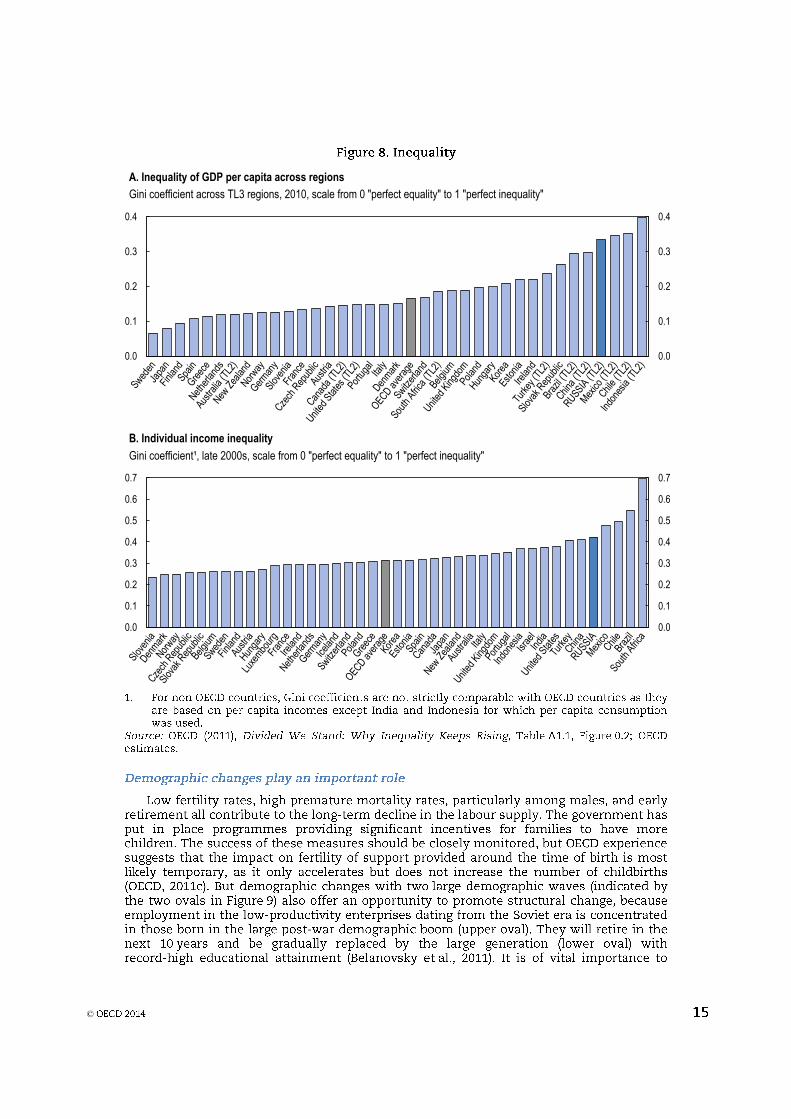
B. Individual income inequality
Gini coefficient¹, late 2000s, scale from 0 "perfect equality" to 1 "perfect inequality"
A. Inequality of GDP per capita across regions
Gini coefficient across TL3 regions, 2010, scale from 0 "perfect equality" to 1 "perfect inequality"
0.0
0.1
0.2
0.3
0.4
0.5
0.6
0.7
0.0
0.1
0.2
0.3
0.4
0.5
0.6
0.7
0.0
0.1
0.2
0.3
0.4
0.0
0.1
0.2
0.3
0.4
©
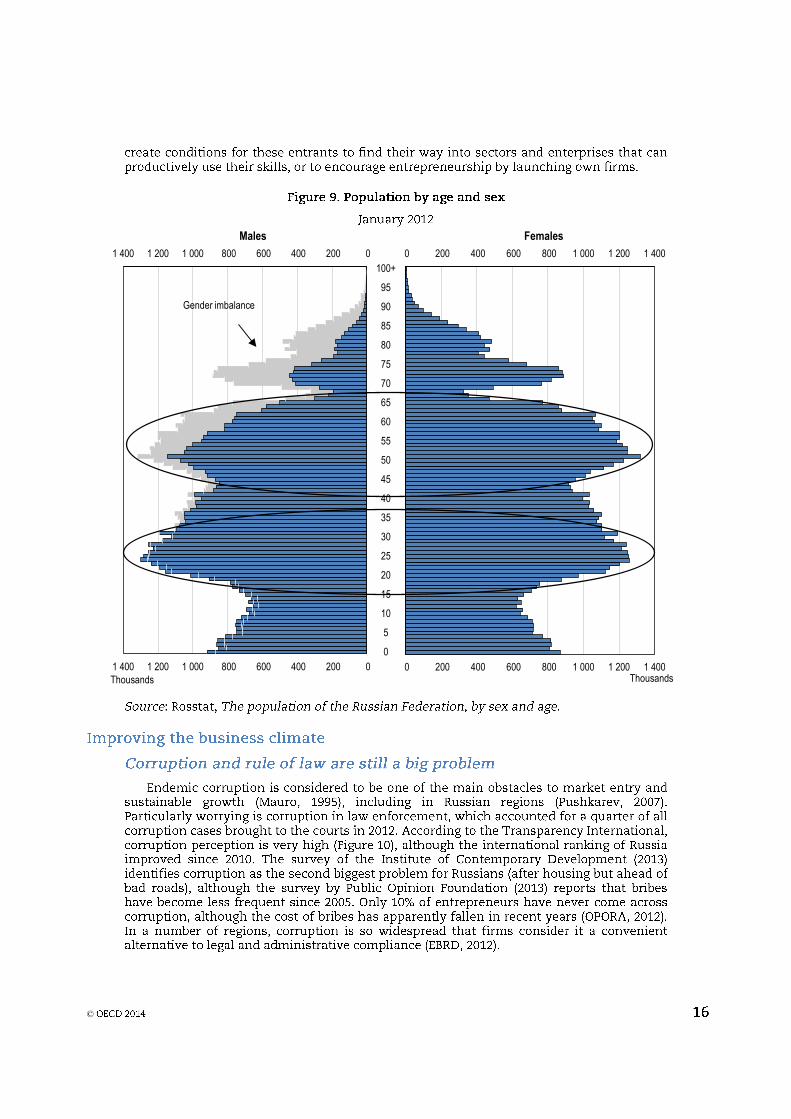
Males Females
0 200 400 600 8001 0001 2001 400
0 200 400 600 8001 0001 2001 400
0
5
10
15
20
25
30
35
40
45
50
55
60
65
70
75
80
85
90
95
100+
Thousands
Gender imbalance
0 200 400 600 800 1 000 1 200 1 400
0 200 400 600 800 1 000 1 200 1 400Thousands
©
0
10
20
30
40
50
60
70
80
90
100
0
10
20
30
40
50
60
70
80
90
100
©
©
0
1
2
3
4
5
6
0
1
2
3
4
5
6
2013
©
©
0
1
2
3
4
5
6
0
1
2
3
4
5
6
2013
©
0
1
2
3
0
1
2
32013
©
©
Australia AustriaBelgium
Canada
Chile
Czech Republic
Denmark
Estonia
Finland
France
Germany
Greece
Hungary
Iceland Ireland
Israel
Italy
Japan
KoreaLuxembourg
Mexico
Netherlands
New Zealand
Norway
Poland
Portugal
Slovak Republic
Slovenia
Spain
Sweden
Switzerland
Turkey
United Kingdom
United States
RUSSIA
Brazil
China
India
Indonesia
South Africa
3.8
4.2
4.6
5.0
5.4
5.8
3.8
4.2
4.6
5.0
5.4
5.8
2.5 3.0 3.5 4.0 4.5 5.0 5.5 6.0 6.5Quality of transport infrastructure index score¹
WEF Global competitiveness index score (overall index)
0
10
20
30
40
50
60
70
80
90
0
10
20
30
40
50
60
70
80
90
©
0 5 10 15 20 25 30 35
0 5 10 15 20 25 30 35
Helsinki
Athens
Madrid
Vienna
Warsaw
London
Moscow
km/h
km/h
©
Box 2. Recommendations for establishing a transparent, coherent and predictable business climate
Continue the current anti-corruption campaign with stronger focus on transparency and accountability mechanisms in the public sector. Improve legal protection of whistleblowers and do not restrict the scope for media or civil society organisations to publicise violations of the law.
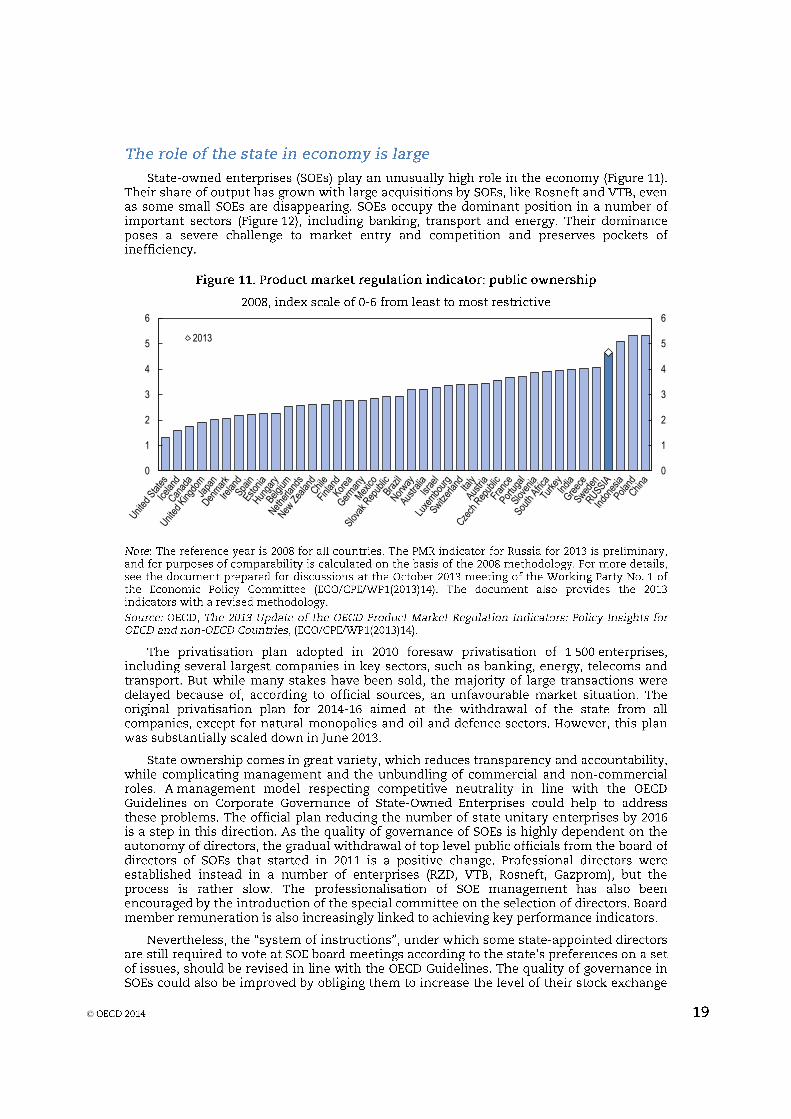
Strengthen judicial independence through greater transparency in appointment and promotion processes, better pay and rotation of judges, while avoiding even the appearance of political interference in court cases. Make law-enforcement agencies more transparent and accountable.
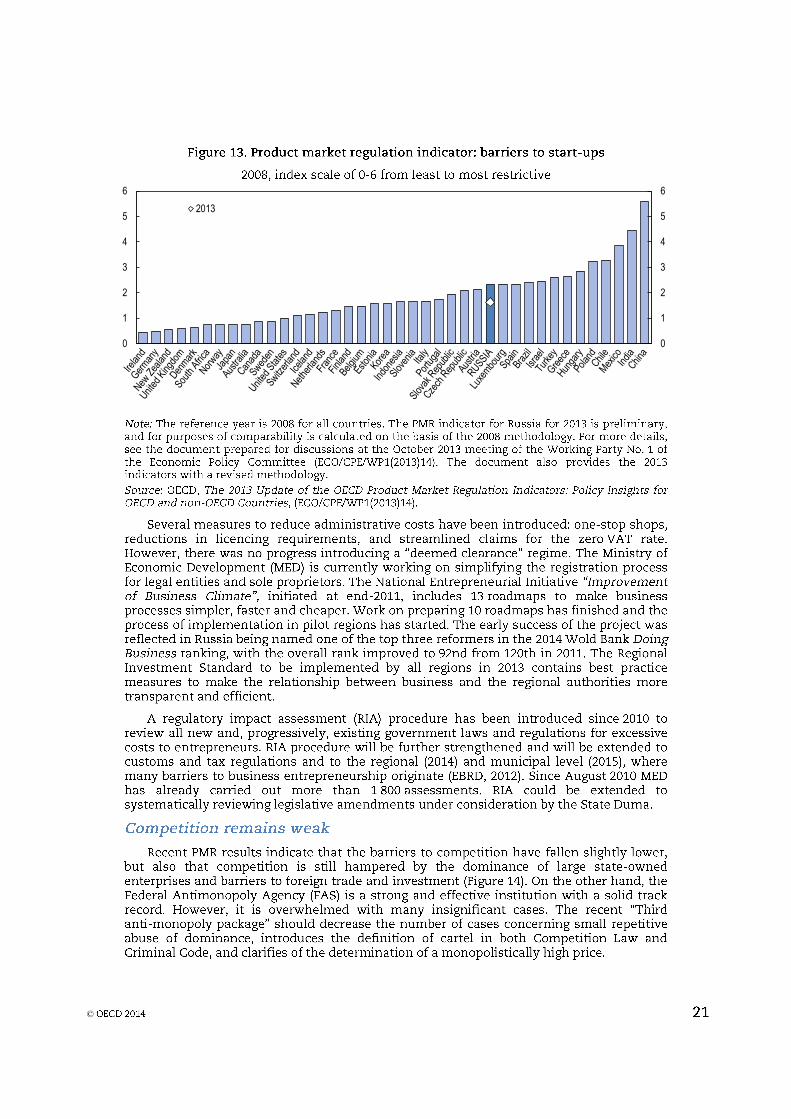
Continue reducing administrative barriers, and widen federal initiatives to regional and local levels. Extend regulatory impact assessments to legislative draft considered by the State Duma.
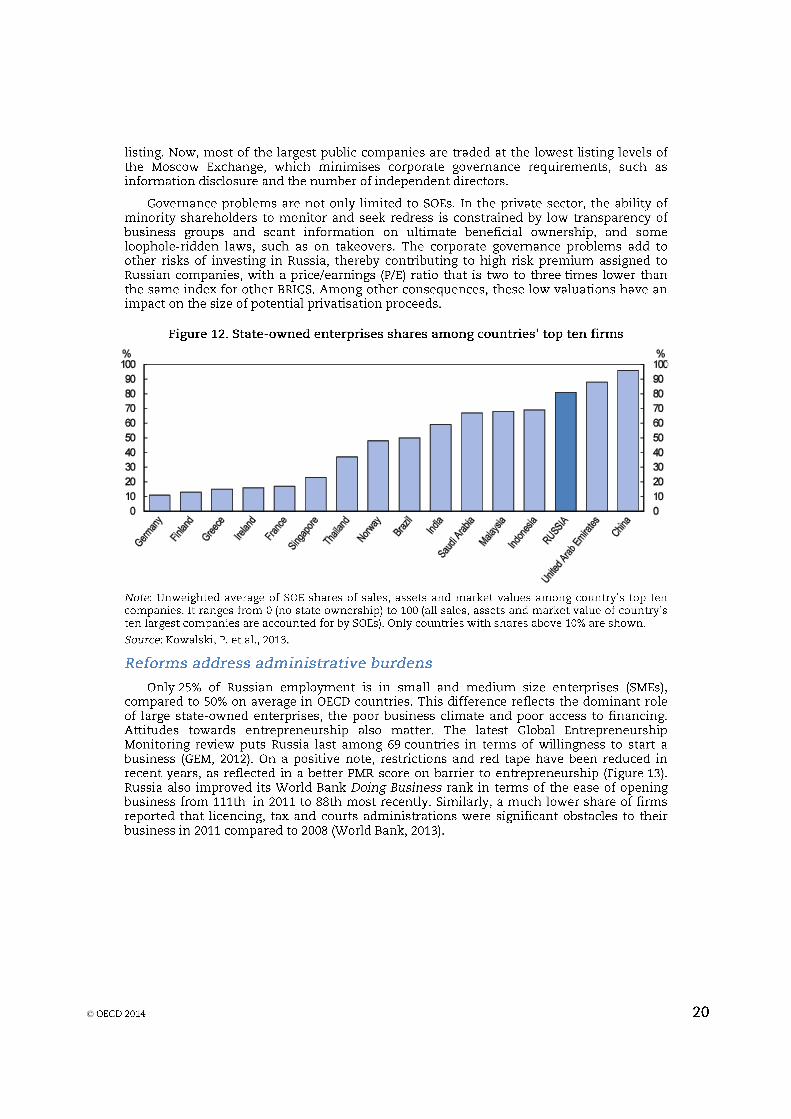
Push ahead with privatisation of state-owned banks and other state-owned enterprises (SOEs). Further improve governance of SOEs and foster a level playing field between public and private companies.
To strengthen the positive impact of WTO accession, refrain from introducing entry barriers. Shorten the list of strategic sectors with prior approval required for foreign investment and streamline the approval process.
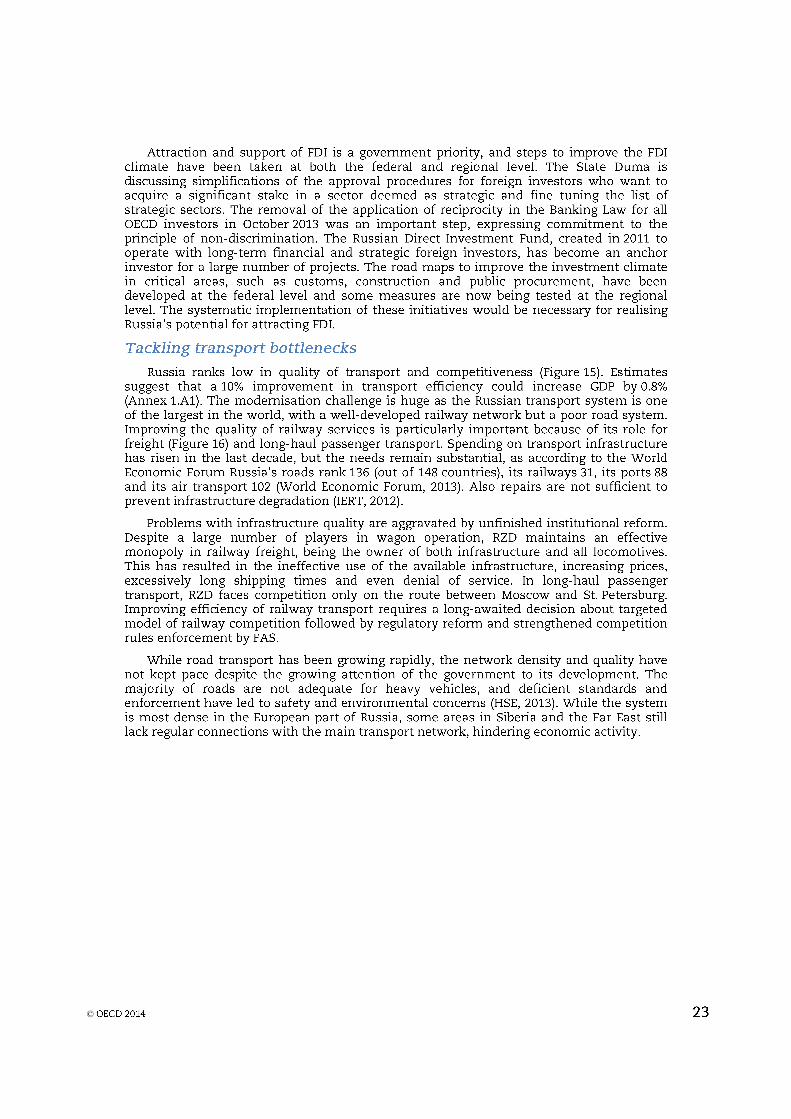
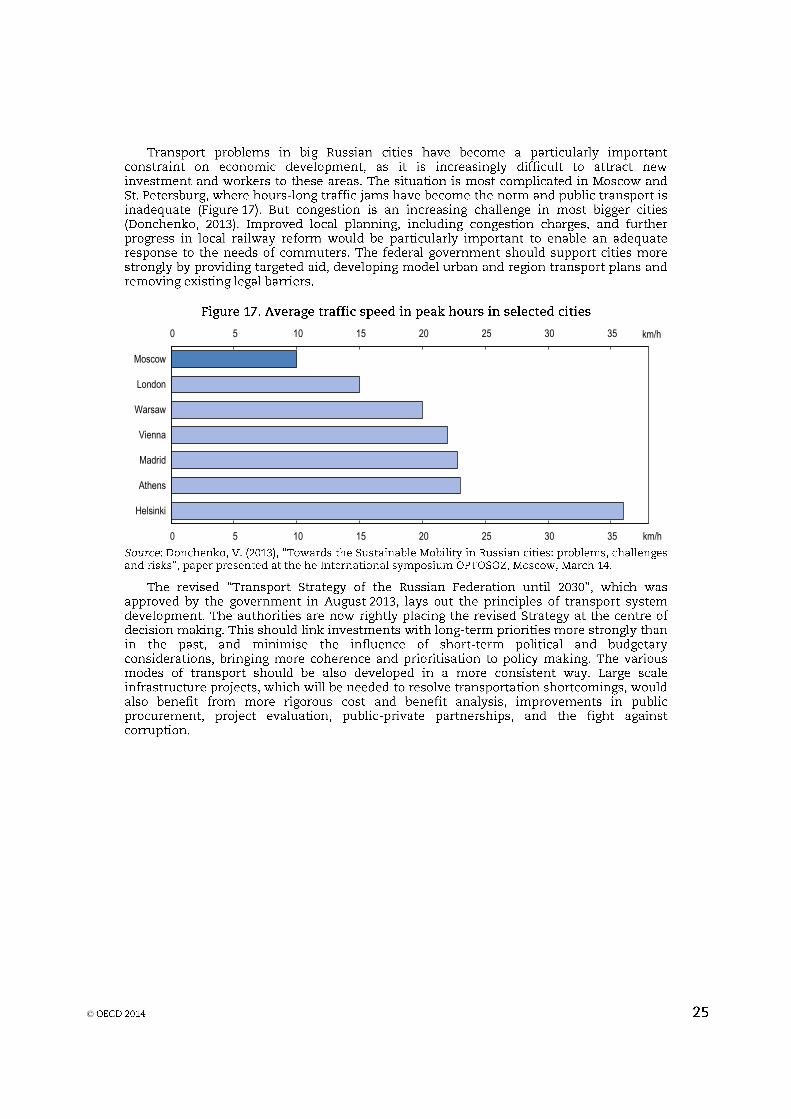
Tackle transport bottlenecks by improving the efficiency of infrastructure spending, promoting competition in the transport sector and ensuring better policy coordination to address urban transport challenges.
©
40
60
80
100
120
140
160
180
200
40
60
80
100
120
140
160
180
200
1992 1994 1996 1998 2000 2002 2004 2006 2008 2010 2012
Index 1992 = 100Index 1992 = 100
Real wage
Real GDP
Employment
©
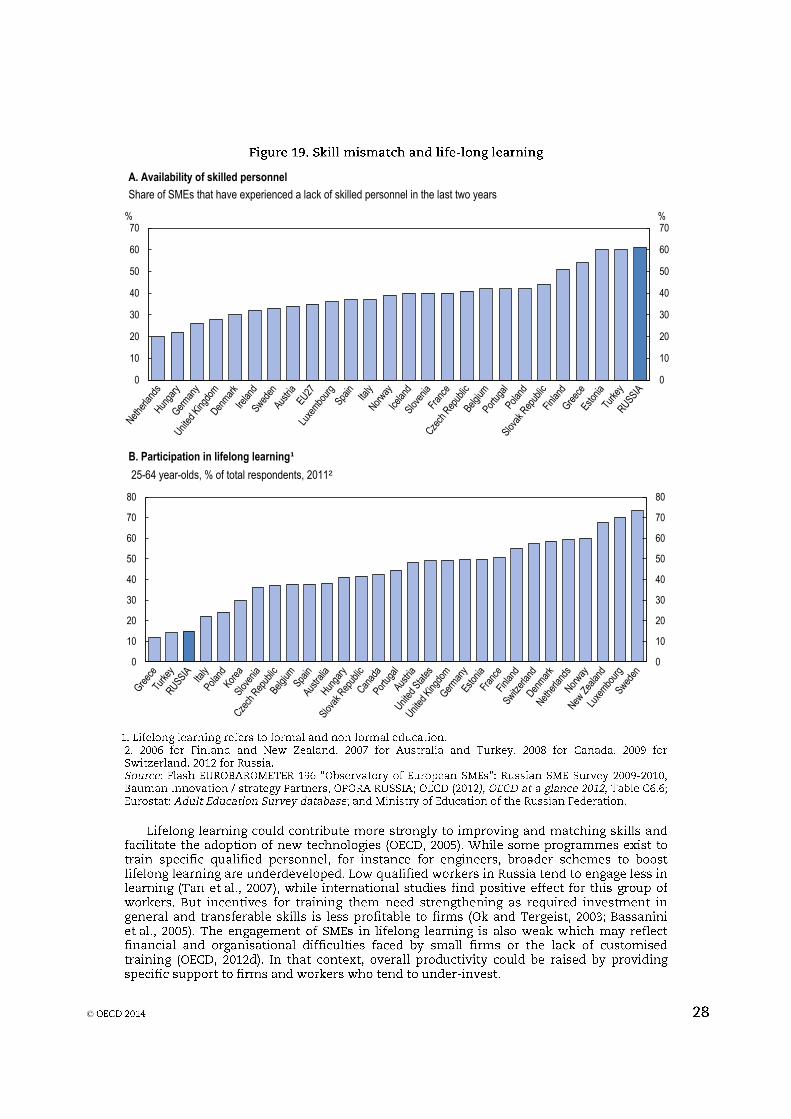
A. Availability of skilled personnel
B. Participation in lifelong learning¹
Share of SMEs that have experienced a lack of skilled personnel in the last two years
25-64 year-olds, % of total respondents, 2011²
0
10
20
30
40
50
60
70
0
10
20
30
40
50
60
70%%
0
10
20
30
40
50
60
70
80
0
10
20
30
40
50
60
70
80
©
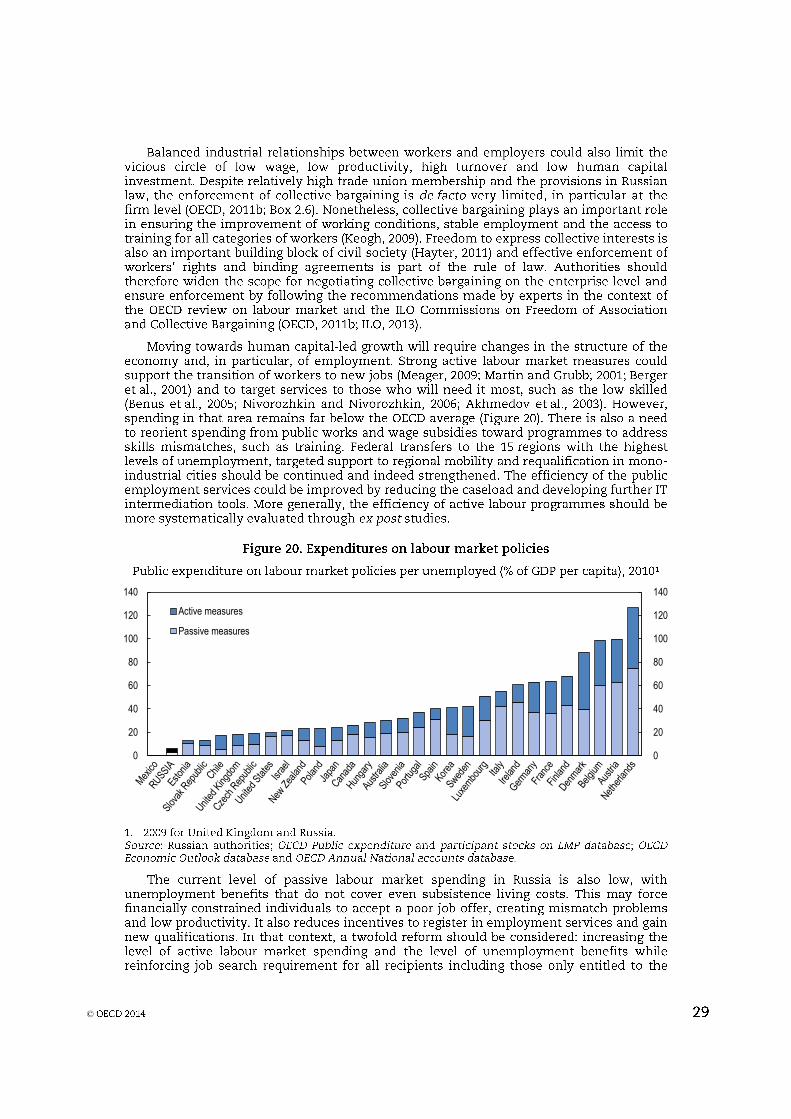
0
20
40
60
80
100
120
140
0
20
40
60
80
100
120
140
Active measures
Passive measures
©
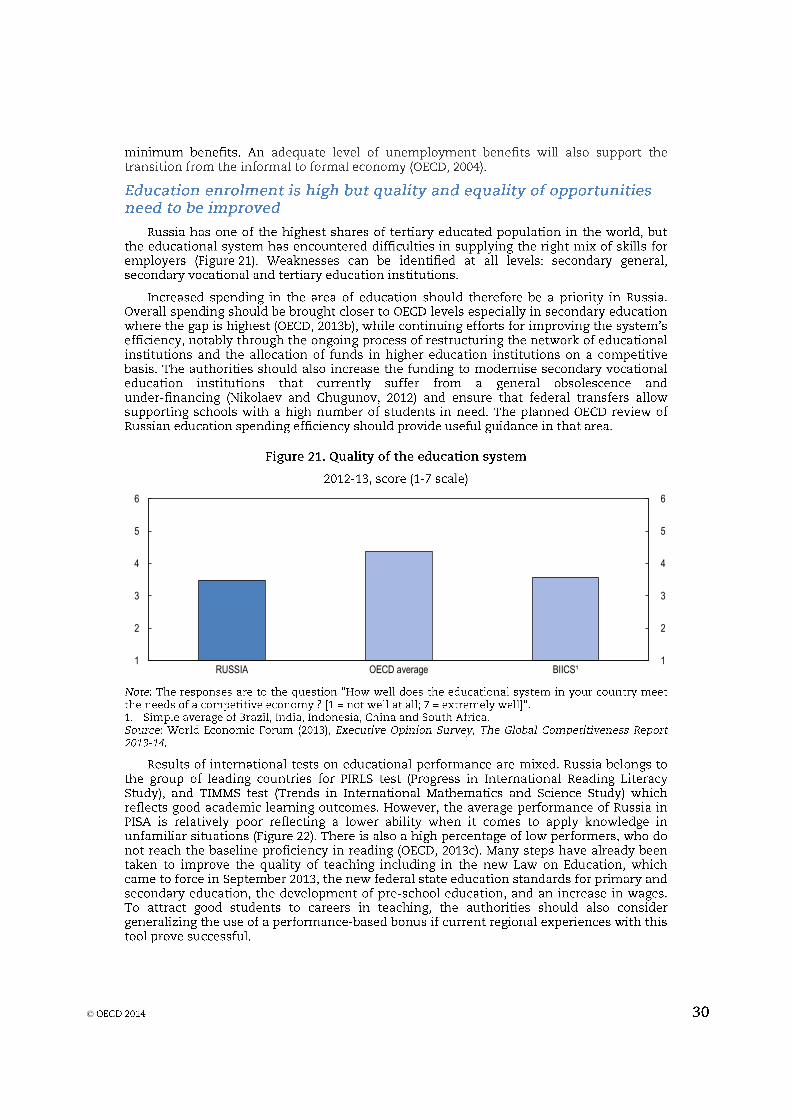
1
2
3
4
5
6
1
2
3
4
5
6
RUSSIA OECD average BIICS¹
©
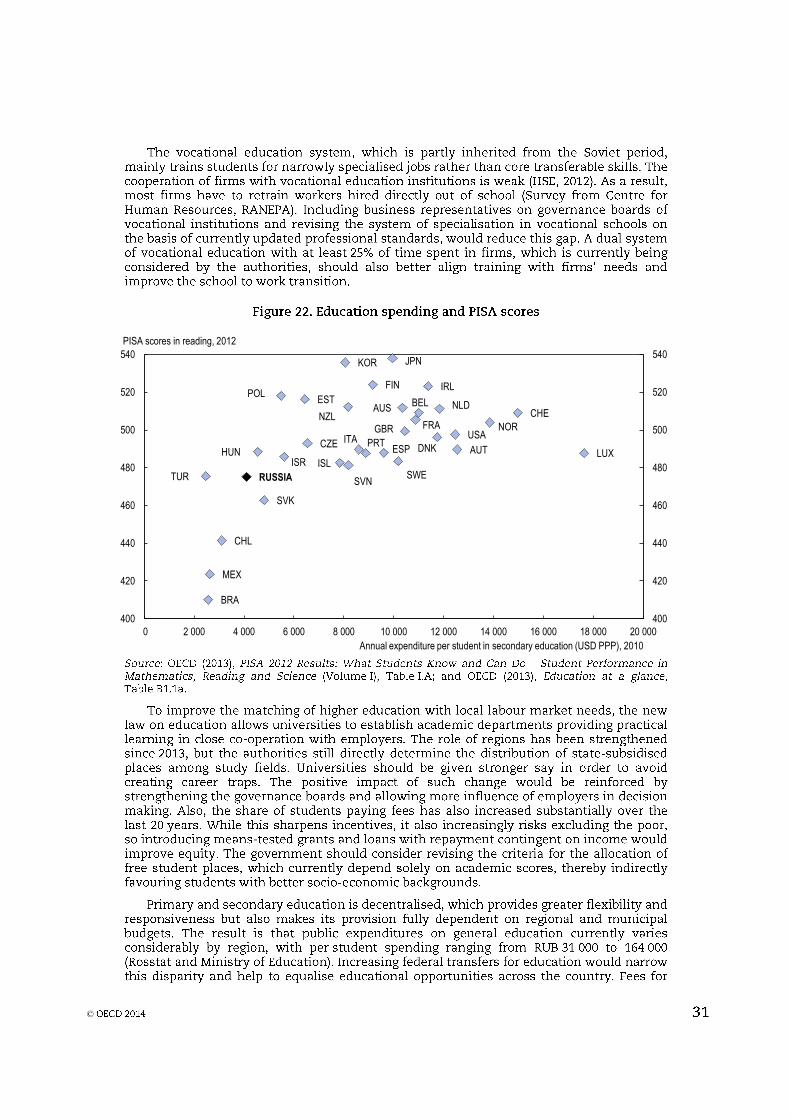
AUS
AUT
BEL
CHL
CZE DNK
EST
FIN
FRA
HUNISL
IRL
ISR
ITA
JPNKOR
LUX
MEX
NLDNZL
NOR
POL
PRT
SVK
SVN
ESP
SWE
CHE
TUR
GBRUSA
RUSSIA
BRA
400
420
440
460
480
500
520
540
400
420
440
460
480
500
520
540
0 2 000 4 000 6 000 8 000 10 000 12 000 14 000 16 000 18 000 20 000
Annual expenditure per student in secondary education (USD PPP), 2010
PISA scores in reading, 2012
©
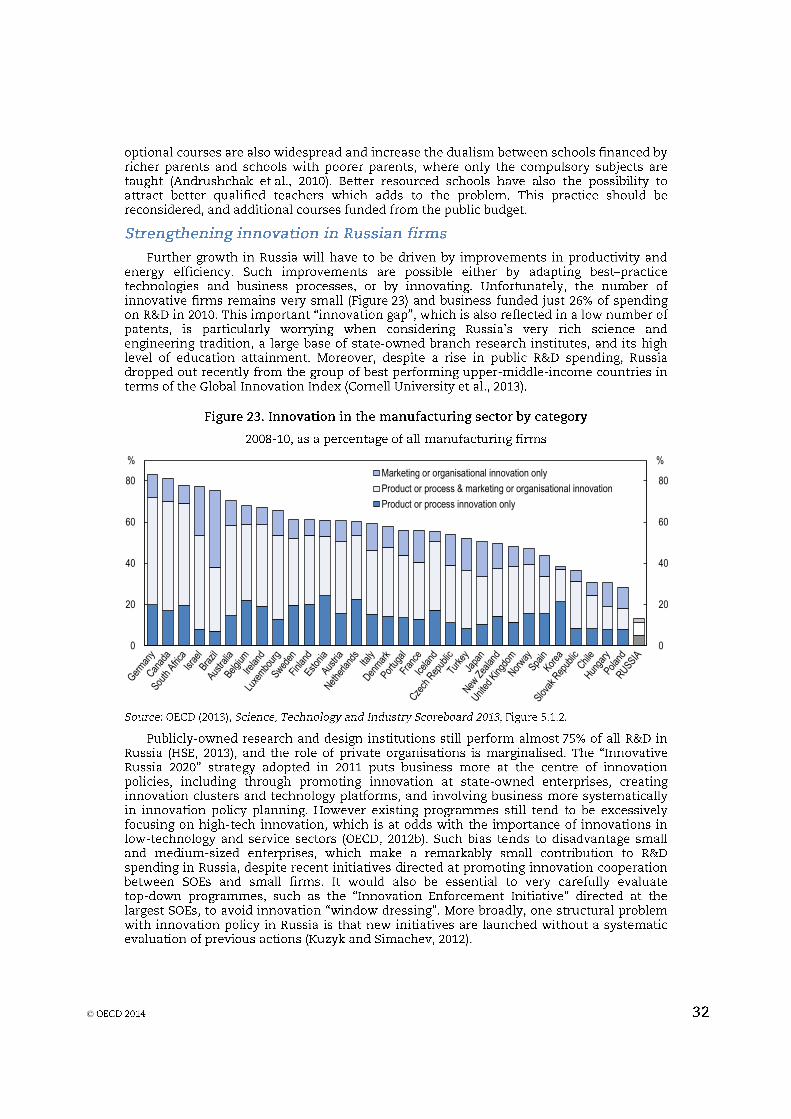
0
20
40
60
80
0
20
40
60
80
%%
Marketing or organisational innovation only
Product or process & marketing or organisational innovation
Product or process innovation only
©
Box 3. Recommendations for strengthening skills and innovation
Strengthen life-long learning through incentive for firms and workers, such as training vouchers. Increase spending on active labour market programmes and temporary income support to unemployed. Widen the scope for negotiating collective agreements on the enterprise level.
Increase overall education funding, in particular in poor regions, while continuing to restructure education institutions. Link remuneration of teachers with their performance. Strengthen the co-operation between education institutions, business and trade unions and continue efforts to develop updated professional standards for vocational education. Reconsider school fees for optional courses in primary and secondary education to reduce access inequalities.
Continue broad-based support for innovation, and for the adoption of new technologies, in particular to improve energy efficiency. Finalise the reform of the public R&D sector; in particular by shifting more research from the reformed Academy of Science to universities, increasing the share of competitive grant funding and streamlining state-owned branch research institutes. Evaluate innovation policies more systematically.
©
Bibliography
Akhmedov, A., I. Denisova and M. Kartseva (2003), “Active labor market Policies in Russia: regional
interpretation determines effectiveness?”, CEFIR Working Papers 37.
Andrushchak, G.V. et al. (2010), “New pay system in schools. Experience of the Novgorod Region”,
Higher School of Economics Working Papers Series no 05.
Bassanini, A. et al. (2005), “Workplace Training in Europe”, IZA Discussion Papers 1640.
Belanovsky, S. et al. (2011), Socio-economic change and political transformation in Russia, The Center
for Strategic Research, Moscow.
Berger, M.C, J.S. Earle and K.Z. Sabirianova (2001), “Worker training in a restructuring economy:
Evidence from the Russian transition”, IZA Discussion Papers No. 361, IZA, Bonn, Germany.
Benus, J. et al. (2005), “Re-training Programs in Russia and Romania: Impact Evaluation Study”, CEFIR
Policy Papers.
Brown, J.D. and J.S. Earle (2008), “Understanding the Contributions of Reallocation to Productivity
Growth: Lessons from a Comparative Firm-Level Analysis”, IZA DP No. 3683, September.
Bukowski, P. and J. Earle (2014), “Measuring Productivity Dispersion across Russian Manufacturing
Firms, 2003-2010”, Economics Department Working Papers, OECD Publishing, forthcoming.
CNBC (2013), Is Russia Too Corrupt for International Business?, 11 June,
www.cnbc.com/id/100805382.
Commander, S. and I. Denisova (2012), “Are skills a constraint on firms? New evidence from Russia”,
IZA Discussion Paper Series No. 7041.
Cornell University, INSEAD, and WIPO (2013), The Global Innovation Index 2013: The Local
Dynamics of Innovation, Geneva, Fontainebleau and Ithaca.
Denisova, I. (2012), “Income Distribution and Poverty in Russia”, Social, Employment and Migration
Working Papers No. 132, OECD Publishing.
Donchenko, V. (2013), “Towards the Sustainable Mobility in Russian Cities: Problems, Challenges and
Risks”, paper presented at the International symposium OPTOSOZ, Moscow, 14 March.
EBRD (2012), Diversifying Russia. Harnessing regional diversity, European Bank for Reconstruction
and Development, London.
Floerkemeier, H. (2013), “The Exchange Rate vs. Interest Volatility Trade-Off: The Role of Inflation
Targeting, Russian Federation”, IMF 2013 Article IV Consultation: Selected Issues, IMF Country
Reports No. 13/311.
FT (2013), Alexei Navalny verdict sends ripples through Moscow business world, Financial Times,
18 July, www.ft.com/intl/cms/s/0/d2da85de-efb5-11e2-8229-00144feabdc0.html.
©
Garbuzova, M. and R. Madlener (2012), “Russia’s Emerging ESCO Market: Prospects and Barriers for
Energy Efficiency Investments”, FCN Working Papers No. 6.
Gimpelson, V. and D. Lippoldt (2001), The Russian Labour Market: Between Transition and Turmoil,
Rowman & Littlefield Publishers.
Granville, C. (2013), “Russia’s commercial courts: A bright spot”, in Barysch, K. (ed.), Three views on
modernisation and the rule of law in Russia, Centre for European Reform, London.
GRECO (2012), Joint First and Second Evaluation Round, Addendum to the Compliance Report on the
Russian Federation, Group of States against Corruption, Council of Europe, adopted by GRECO
at its 58th Plenary Meeting, Strasbourg, 3-7 December 2012.
GEM (2012), GEM 2012 Global Report, Global Entrepreneurship Monitor.
Hayter, S. (2011), The Role Of Collective Bargaining In The Global Economy, International Labour
Office, Switzerland.
HSE (2012), Monitoring of Education Markets and Organizations, Higher School of Economics, ISSEK,
Moscow.
HSE (2013), “Bezopasnost dorozhnogo dvizhenia v Rossii:Sovremennoe Sostoyanie I Neotlozhnie Meri
po Ulucheniu Situacii” (Road Safety in Russia: Current Situation and Emergent Measures for its
Improvement), HSE, Moscow.
Huber, P. and A Wörgötter (1998), “Political Survival or Entrepreneurial Development? Observations
on Russian Business Networks”, Post-Soviet Affairs, Vol. 14, Issue 1, 81-91.
IEA (2011), World Energy Outlook, OECD Publishing.
IEA (2012a), World Energy Outlook, OECD Publishing.
IERT (The institute of the transport economics and development), (2012), The Reference and Analytical
Paper on the Railway Infrastructure Development in the Regions of the Russian Sea Ports Until
2015, IERT, Moscow.
ILO (2011), Employment and Labour Market strategies in Russia in the Context of innovations economy,
proceedings of the Conference, Moscow, September 2011.
ILO (2013), Report of the Committee of experts on the application of conventions and recommendations,
Report III (Part 1A), ILO, Geneva.
Institute of Contemporary Development (2013), Survey of public opinion.
Keogh, H. (2009), The State and development of adult learning and education in Europe, North America
and Israel, Regional synthesis report, Hamburg, Germany, UNESCO Institute for Lifelong
Learning.
Kochetkov, A. (2011), Professional Education and Labor Market: Problems of Interaction, Institute of
Sociology, Russian Academy of Sciences.
©
Kuzyk, M. and Y. Simachev (2013), “Russia's Innovation Promotion Policies: Their Evolution,
Achievements, Problems and Lessons”, Russian Economy in 2012 Trends and Outlooks, Issue 23,
Moscow.
Ledyaeva (2013), “If Foreign Investment Is not Foreign: Round-Trip Versus Genuine Foreign
Investment in Russia”, CEPII Working Papers, February 2013.
Lehmann, H. and A Zaiceva (2013), Informal employment in Russia: Definitions, incidence,
determinants and labour market segmentation, Economics Department Working Papers 1098,
OECD Publishing.
Lehmann, H. and M. Silvagni (2013), “Is There Convergence of Russia’s Regions? Exploring the
Empirical Evidence: 1995-2010”, Technical Background Papers, OECD Publishing..
Lokshin, M., V. Gimpelson and A. Oshchepkov (2012), “Explaining the dynamics in perceptions of job
insecurity in Russia”, IZA Discussion Papers 6422.
Martin, J. and D. Grubb, (2001), “What work and for whom: a review of OECD countries‘ experiences
with active labour market policies”, Institute for Labour Market Policy Evaluation, Working
Papers No. 14, IFAU.
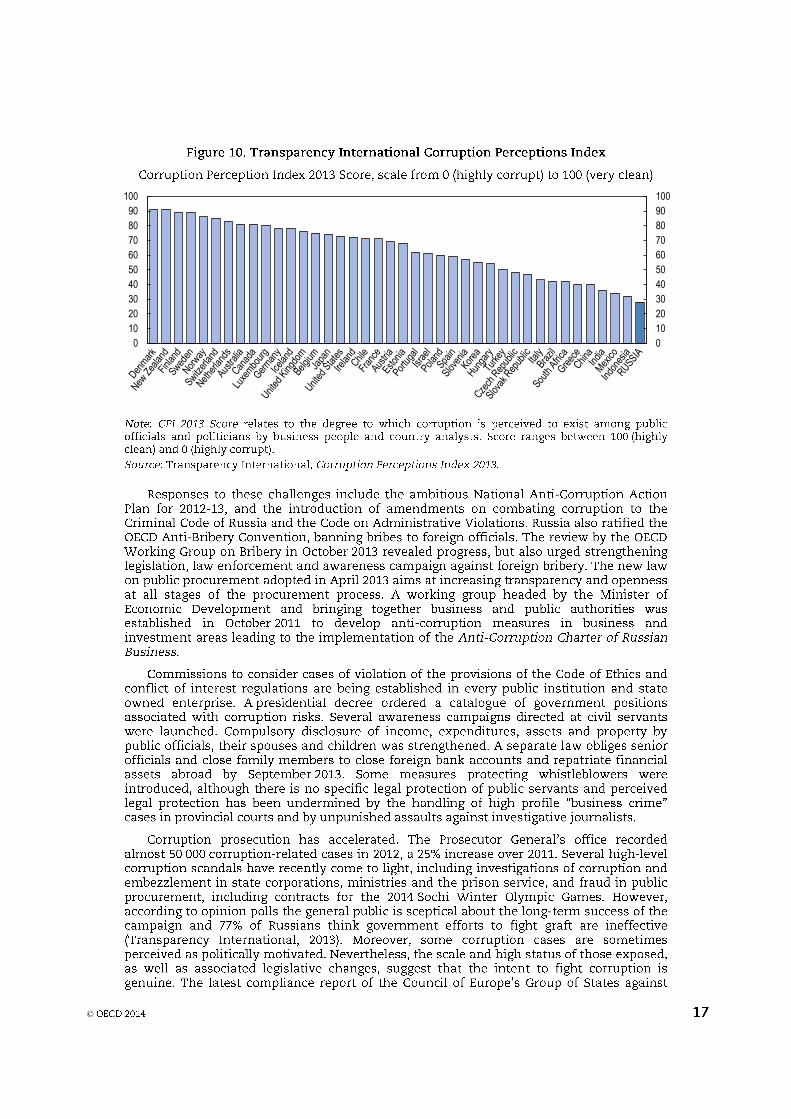
Mauro, P. (1995), “Corruption and growth”, Quarterly Journal of Economics, Vol. 110(3), 681-712.
Meager, N. (2009), “The role of training and skills development in active labour market policies”,
International Journal of Training and Development, 13(1).
McKinsey & Company (2009), Lean Russia. Sustaining economic growth through improved
productivity, McKinsey Global Institute, Moscow.
Nikolaev, D. and D. Chugunov (2012), “The Education System in the Russia Federation”, World Bank
Education Brief 2012.
Nivorozhkin A. and E. Nivorozhkin, (2006), “Do government sponsored vocational training programmes
help the unemployed find jobs? Evidence from Russia”, Applied Economics Letters, Vol. 14(1),
5-10.
OECD (2004), “Informal employment and promoting the transition to a salaried economy”, OECD
Employment outlook, OECD Publishing.
OECD (2005), Promoting Adult Learning, OECD Publishing.
OECD (2011b), Reviews of Labour Market and Social Policies, Russia Federation. OECD Publishing.
OECD (2011c), Doing Better for Families, OECD Publishing.
OECD (2012a), Reviews Innovation Policy, Russian Federation, OECD Publishing.
OECD (2012b), Science, Technology and Industry Outlook, OECD Publishing.
OECD (2012c), Reviews of Health Systems: Russian Federation, OECD Publishing.
©
OECD (2012d), Better Skills, Better Jobs, Better Lives: A Strategic Approach to Skills Policies, OECD
Publishing.
OECD (2013a), Inventory of estimated budgetary support and tax expenditures for fossil fuel, OECD
Publishing.
OECD (2013b), Education at a Glance, OECD Publishing.
OECD (2013c), PISA 2012 Results: What Students Know and Can Do – Student Performance in
Mathematics, Reading and Science, Vol. I, OECD Publishing.
OECD (2013d), Skills Outlook 2013: First Results from the Survey of Adult Skills, OECD Publishing.
Ok and Tergeist (2003), “Improving Workers’skills: analytical evidence and the role of social partners”,
Social, Employment and Migration Working Papers No. 10, OECD Publishing.
OPORA (2012), The entrepreneurship climate in Russia: Index of OPORA-2012, Moscow.
OSJI (2011), Pretrial Detention and Torture: Why Pretrial Detainees Face the Greatest Risk, Open
Society Justice Initiative, Open Society Foundations, New York, NJ.
Public Opinion Foundation (2013), Survey of public opinion.
Pushkarev, O. (2007), “Corruption and Economic Development of Russia: A Regional Aspect”, Applied
Econometrics, 2007, Vol. 6, Issue 2.
RAC (2013), Report on intermediate results of the analytical review of “Measures taken by state
authorities with regard to fulfilment of responsibilities and realization of rights of the Russian
Federation related to the WTO accession, on evaluation of the impact of norms and rules of the
WTO on the budget system and economy”, Russian Accounts Chamber 29 March 2013.
Tan, H. et al. (2007), Skills Shortage and training in Russian enterprises, Higher School of Economics
Working Paper 04.
Timmer, M. and I. Voskoboynikov (2013), Is Mining Fuelling Long-run Growth in Russia? Industry
Productivity Growth Trends since 1995, GGDC Research Memorandum.
Transparency International (2013), Global Corruption Barometer.
WHO (2013), Global Health Observatory Data Repository.
World Economic Forum (2013), The Global Competitiveness Report 2013-14, Geneva.
World Bank (2013), Policy Note Russian Federation: National and Regional Trends in Regulatory
Burden and Corruption, February.
Zaytsev, V. and L. Saykina (2013), Realization of energy efficiency policy in industry. Energosvet, 28.
©
Economic growth is below what would be needed to resume rapid convergence to average OECD living
standards. On-going efforts to improve the business climate are laudable, but need to be widened and
strengthened. Much progress has been achieved in reducing red tape, but it is only recently that the
authorities have visibly become more energetic in fighting corruption. Adverse interactions between
politics, business and law enforcement generate obstacles for the rule of law and remain a major risk for
potential investors. High entry barriers lead to weak competition. Reducing the role of the state in the
economy and WTO membership should be viewed as opportunities to strengthen competition, and hence
provide incentives for productivity improvements, which are urgently required to ensure stronger growth
in Russia because of a shrinking labour force.
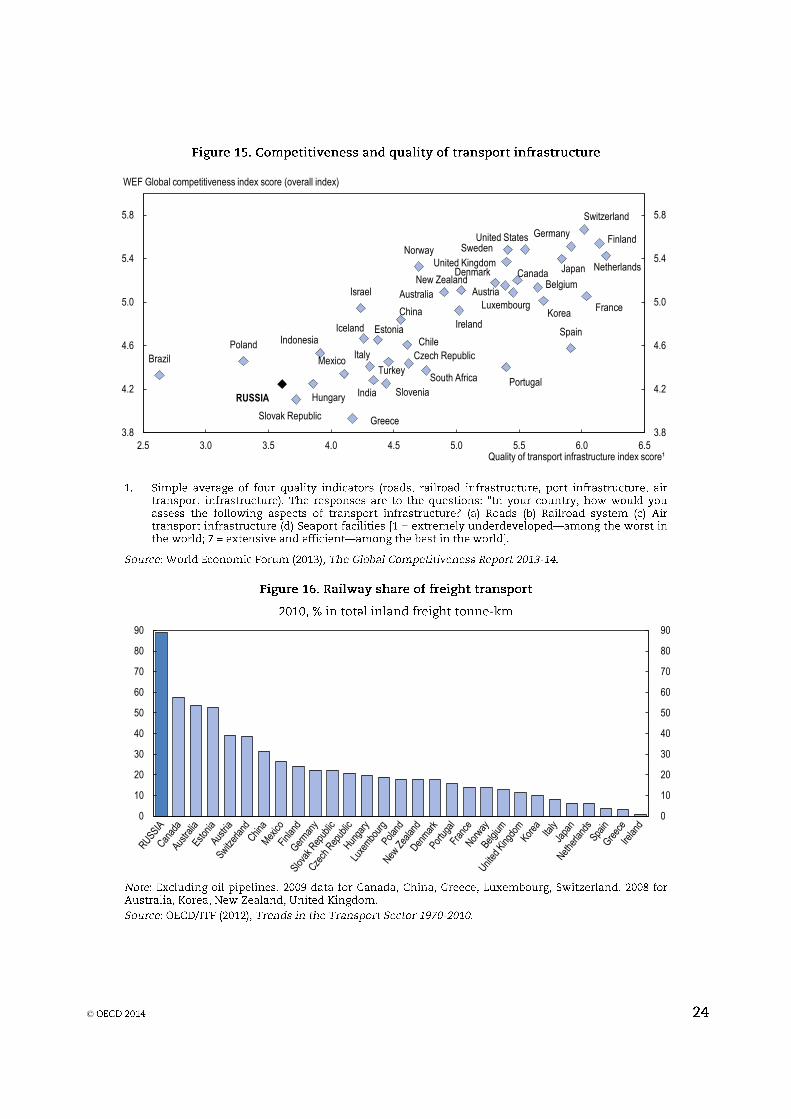
Transport can play an important role in promoting growth, diversification and regional convergence.
However, with insufficient investment and incomplete structural reforms, Russia faces very large
challenges in modernising its large transport system. Urban transport problems are intensifying, because
of weak policy coordination and inadequate traffic management. Promoting competition in the transport
sector is essential, in particular by effectively opening the railway freight market to independent
operators.
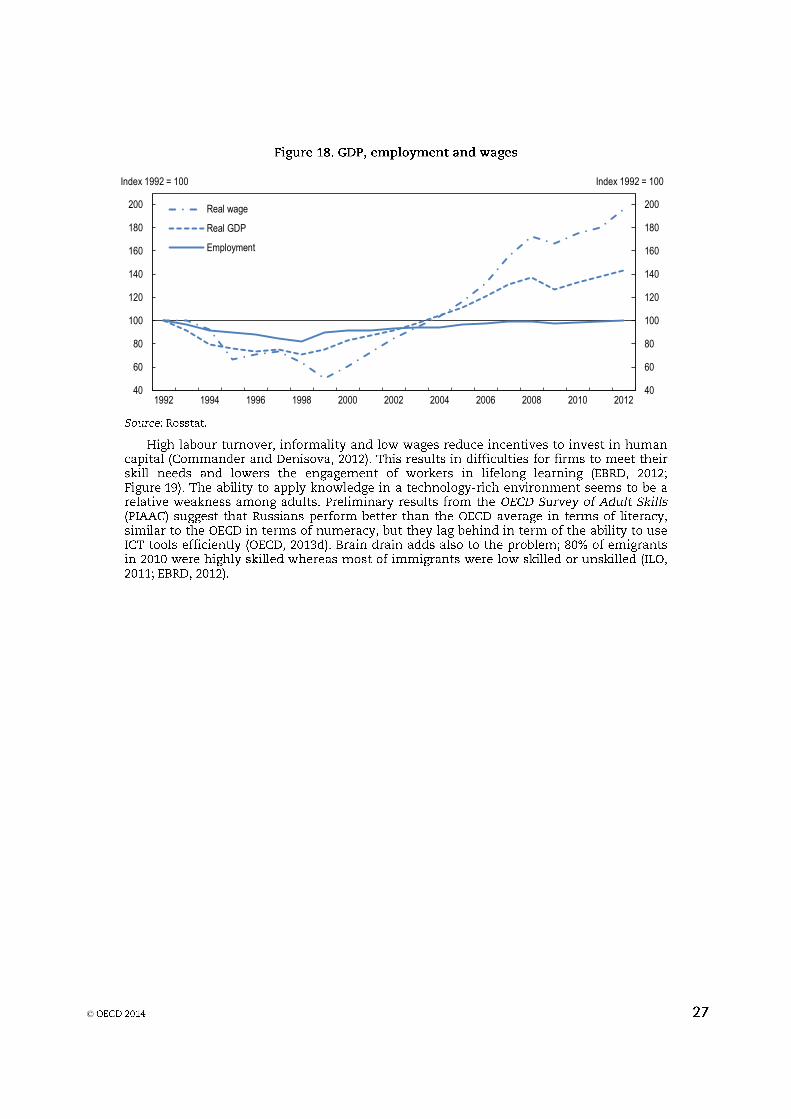
The labour market in Russia is very flexible. Firms adjust to economic shocks through wage cuts,
working hour reductions and minimisation of non-wage labour costs. Workers react by changing jobs.
This results in a high and stable overall employment rate, but also high wage inequality, informality and
labour turnover, which limits incentives for firms to invest in human capital and productivity
improvements.
While educational attainment is very high, the education system needs to be strengthened to respond to
the needs of a skill-based economy. School-employer cooperation is low and opportunities for higher
education are unequally distributed. Adequate funding for education institutions is not assured
everywhere while at the same time inefficiencies persist.
Private spending on innovation is very low and Russia underperforms in terms of scientific outputs and
patents. Support for low-tech innovation and technology adoption, especially among SMEs is narrow
because of a bias towards large and high-tech projects, which however are only loosely related to Russian
manufacturing capacity. Reform of the public R&D sector is incomplete, notably with respect to
strengthening funding on a competitive basis.


![Example 11.21 Analyzing Classical Form third movement, 9–23 · Adagio molto G [Main Theme] 55 5 5555 55555 5 = f 5k$ 55 5!5 55 5!55M 3: p 55 $ 5555 = f. Title: example11-21 Author:](https://img.pdfslide.net/doc/110x75/6014233909245c4fac76d57b/example-1121-analyzing-classical-form-third-movement-9a23-adagio-molto-g-main.jpg)