Embed Size (px)
Citation preview
OECD Economic Surveys: South Africa
2015
2
This document and any map included herein are without prejudice to the status of or sovereignty over any territory, to the delimitation of international frontiers and boundaries and to the name of any territory, city or area. The statistical data for Israel are supplied by and under the responsibility of the relevant Israeli authorities. The use of such data by the OECD is without prejudice to the status of the Golan Heights, East Jerusalem and Israeli settlements in the West Bank under the terms of international law.
3
TABLE OF CONTENTS
Basic statistics of South Africa, 2014 .…………………………………….….……………………….………7
Executive summary ....................................................................................................................................... 9
Main findings ............................................................................................................................................. 10 Key recommendations ............................................................................................................................... 11
Assessment and recommendations ............................................................................................................. 13
Social progress over the past 20 years has been impressive ...................................................................... 14 A stronger recovery was held back by strikes and power cuts .................................................................. 17 Macroeconomic policies are stabilising inflation and public debt ............................................................. 23 Promoting inclusive growth by improving the labour market ................................................................... 26 More effective infrastructure and business regulation to lay the foundations for higher growth .............. 36 How can the tax system help to meet revenue-raising challenges? ........................................................... 43
Bibliography .................................................................................................................................................. 48
ANNEX Progress in main structural reforms .......................................................................................... 52
Thematic chapters Chapter 1. More effective infrastructure and business regulation ......................................................... 60
Investments in infrastructure are being ramped up .................................................................................... 61 The lack of infrastructure investment is most noticeable in the electricity sector ..................................... 62 Transport infrastructure investments have not kept pace with economic developments ........................... 65 Telecommunications could better support growth ..................................................................................... 73 Better business regulation to boost growth ................................................................................................ 74 Housing and spatial planning have to cope with ongoing urbanisation ..................................................... 85
Notes……………………………………………………………………………………………………….. 88 Bibliography……………………………………………………………………………………………….. 90
Chapter 2. How can the tax system meet revenue raising challenges? .................................................. 96
The existing tax system performs relatively well ...................................................................................... 97 The income tax system relies on narrow tax bases .................................................................................. 100 Indirect taxation has a broad base ............................................................................................................ 112 Developing property taxation into a sustainable revenue source ............................................................. 121 Getting taxation of natural resources “right” is a challenge .................................................................... 123
Notes……………………………………………………………………………………………………… 127 Bibliography ……………………………………………………………………………………………… 128 Tables
1. Macroeconomic indicators and projections ........................................................................................... 18 2. Examples of industrial relations policies in OECD countries ................................................................ 27 1.1. The freight railway system .................................................................................................................. 65 1.2. Modal composition of commuter transport since 1996....................................................................... 67 1.3. Road infrastructure backlog – 2010 .................................................................................................... 70 1.4. Distribution of freight type (million tons, fiscal year 2011/12) .......................................................... 72 1.5. Codes for scoring of Broad-Based Black Economic Empowerment .................................................. 75 1.6. Enforcement action by the Competition Commission ........................................................................ 79 1.7. Distribution of the number of firms and employment ........................................................................ 82
4
2.1. Summary of trade-offs between instruments for raising revenue in OECD economies ..................... 99 2.2. Average and marginal tax wedges are relatively low ....................................................................... 101 2.3. Tax incentives for business investment ............................................................................................ 109 2.4. Excise on luxury goods is better targeted for some items than others .............................................. 115 2.5. The tax rate on CO2 emissions varies considerably across sources and uses ................................... 118 2.6. Emissions and effective carbon prices differ by sector ..................................................................... 120 2.7. Government revenues from resources............................................................................................... 125
Figures
1. Selected indicators ................................................................................................................................. 14 2. Social benefits reach many people ......................................................................................................... 15 3. The economy is slowly recovering, although external imbalances remain high ................................... 19 4. Labour market performance is poor ....................................................................................................... 20 5. Labour market unrest has increased ....................................................................................................... 20 6. Inflation pressures have eased ............................................................................................................... 22 7. The policy rate has increased from historically low levels .................................................................... 23 8. A persistent gap seems to have opened between public spending and revenues ................................... 24 9. Public finances have deteriorated .......................................................................................................... 25 10. Environmental indicators ..................................................................................................................... 31 11. Economic growth has been strongest in the richest regions ................................................................ 32 12. Competitiveness indicators .................................................................................................................. 34 13. Global Value Chain participation indices, 2009 .................................................................................. 35 14. Services value added embodied in manufacturing exports, 2009 ........................................................ 35 15. Infrastructure investment has been increased ...................................................................................... 36 16. Electricity production is falling behind growth ................................................................................... 37 17. Modal composition of commuter transport .......................................................................................... 39 18. The regulatory burden is high across the economy .............................................................................. 41 19. The tax system is relatively well structured and administered efficiently ........................................... 44 20. Tariff barriers are still relatively high for consumer goods ................................................................. 46 1.1. Infrastructure investment has been increased ..................................................................................... 61 1.2. Electricity production is falling behind growth .................................................................................. 62 1.3. Road transport has increased .............................................................................................................. 69 1.4. Deterioration in road conditions: 2009-13 .......................................................................................... 70 1.5. Transport fuel prices ........................................................................................................................... 71 1.6. Cost and efficiency of selected international ports ............................................................................. 72 1.7. Economy-wide Product Market Regulation (PMR), overall indicator ............................................... 77 1.8. The regulatory burden is high across the economy ............................................................................. 78 2.1. Comparison of the level and structure of government revenue .......................................................... 98 2.2. Administration costs are relatively low and coverage is improving ................................................. 100 2.3. The schedule of personal income tax rates is progressive ................................................................ 102 2.4. Individuals begin paying income tax at a relatively high level of income ........................................ 103 2.5. Tax thresholds have been raised in real terms .................................................................................. 103 2.6. Effective marginal tax rates across savings vehicles ........................................................................ 105 2.7. Corporate tax revenues have been volatile but the burden remains relatively high .......................... 107 2.8. The statutory corporate income tax rate is relatively high ................................................................ 107 2.9. Tax incentives reduce the marginal effective tax rate on investment ............................................... 108 2.10. VAT revenues are similar to OECD countries ................................................................................ 113 2.11. The VAT performs relatively well .................................................................................................. 114 2.12. Preferential VAT treatment for goods benefits poor households but also well-off households ..... 114 2.13. Tariff barriers are still relatively high for consumer goods ............................................................ 117
5
2.14. Environmentally related taxes have increased but there is scope for further use ........................... 118 2.15. Taxes on immovable property ........................................................................................................ 121 2.16. Many municipalities are not well run financially ........................................................................... 122 2.17. The performance of the royalty regime........................................................................................... 124
Boxes
1. The National Development Plan (NDP) ................................................................................................ 16 Recommendations on macroeconomic policy ........................................................................................... 25 Recommendations to promote inclusive growth by improving the labour market .................................... 29 Recommendations to promote green growth, regional convergence and deeper trade integration ........... 35 Recommendations to tackle infrastructure bottlenecks and improve business regulation ......................... 42 Recommendations to meet revenue-raising challenges ............................................................................. 47 1.1. Supply-demand planning - the Integrated Resource Plan ................................................................... 63 1.2. The Gauteng Freeways ....................................................................................................................... 68 1.3. Black economic empowerment policies ............................................................................................. 74 1.4. Socio-Economic Impact Assessment System (SEIAS) in South Africa ............................................. 76 1.5. Beneficiation in South Africa ............................................................................................................. 76 1.6. Public interest considerations in South Africa’s review of the Wal-Mart / Massmart merger ........... 80 1.7. The VET system is poorly linked to labour market needs .................................................................. 83 1.8. Employment in the informal sector ..................................................................................................... 84 1.9. Different types of subsidised housing ................................................................................................. 85 1.10. Migrant workers in modern South Africa – findings from a probit model ....................................... 87 Recommendations for more efficient business regulation and infrastructure ............................................ 88 2.1. International experience with in-work benefits ................................................................................ 106 2.2. Schemes to encourage formalisation of small businesses in other countries .................................... 111 2.3. Davis Tax Committee recommendations for tackling base erosion and profit shifting
(“BEPS”) ........................................................................................................................................ 111 2.4. South Africa’s plans for a carbon tax ................................................................................................ 119 Recommendations on meeting revenue-raising challenges ..................................................................... 126
6
This Survey was prepared in the Economics Department by Jens-Christian Høj and Christine Lewis under the supervision of Andreas Wörgötter. The draft has benefited from valuable background research by Theresa Alton and Boipuso Modise, seconded from the South African National Treasury. Research assistance was provided by Corinne Chanteloup and secretarial assistance by Heloise Wickramanayake and Mercedes Burgos. The draft also benefited from valuable background research by Reinhard Schiel and Murray Leibbrandt from SALDRU at the University of Cape Town, Lawrence Edwards from the University of Cape Town, Neil Rankin from Stellenbosch University, Chris Darroll from SBP and Zavareh Rustomjee. Falilou Fall contributed to the finalisation of the draft for publication.
The Economic Survey of South Africa was discussed by the Economic Development and Review Committee on 27 May 2015, with participation of representatives of the South African government and representatives of Brazil and the Czech Republic as lead speakers.
This Survey is published under the responsibility of the Secretary-General of the OECD.
The previous Economic Survey of South Africa was issued in March 2013.
Information about the latest as well as previous Surveys and more information about how Surveys are prepared is available at www.oecd.org/eco/surveys.
7
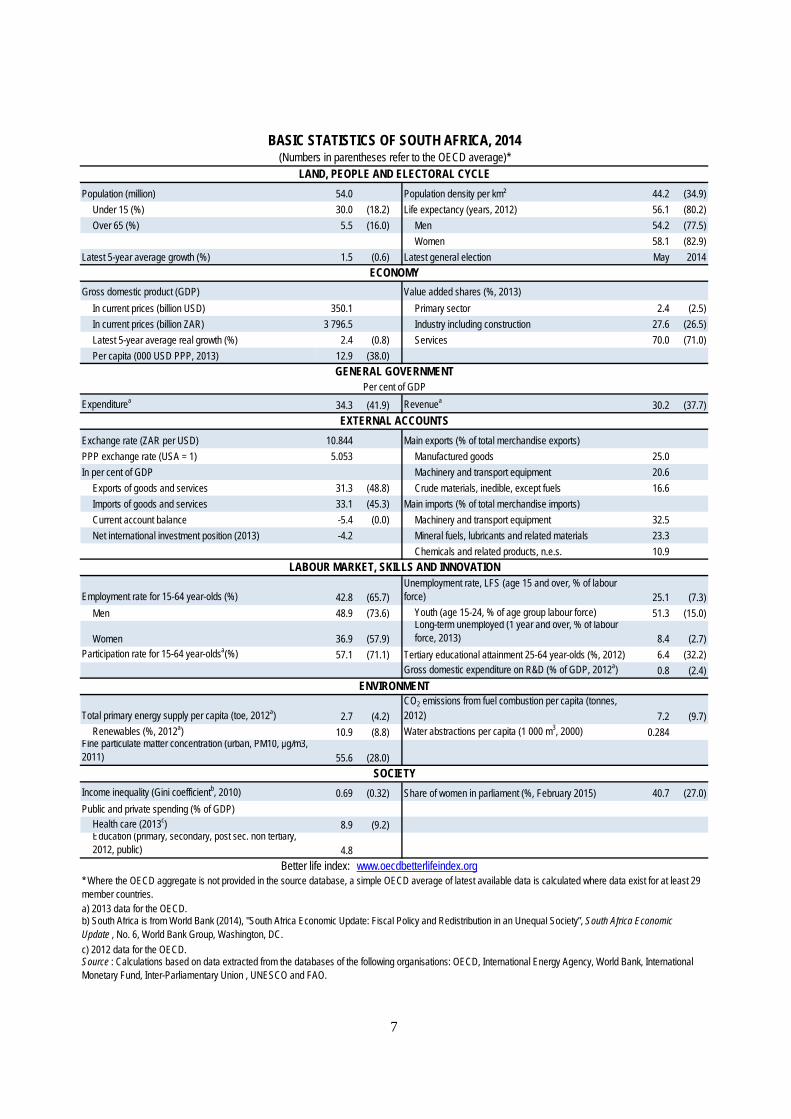
Population (million) 54.0 Population density per km² 44.2 (34.9)Under 15 (%) 30.0 (18.2) Life expectancy (years, 2012) 56.1 (80.2)Over 65 (%) 5.5 (16.0) Men 54.2 (77.5)
Women 58.1 (82.9)Latest 5-year average growth (%) 1.5 (0.6) Latest general election May 2014
Gross domestic product (GDP) Value added shares (%, 2013)In current prices (billion USD) 350.1 Primary sector 2.4 (2.5)In current prices (billion ZAR) 3 796.5 Industry including construction 27.6 (26.5)Latest 5-year average real growth (%) 2.4 (0.8) Services 70.0 (71.0)Per capita (000 USD PPP, 2013) 12.9 (38.0)
Expenditurea 34.3 (41.9) Revenuea 30.2 (37.7)
Exchange rate (ZAR per USD) 10.844 Main exports (% of total merchandise exports)PPP exchange rate (USA = 1) 5.053 Manufactured goods 25.0In per cent of GDP Machinery and transport equipment 20.6
Exports of goods and services 31.3 (48.8) Crude materials, inedible, except fuels 16.6Imports of goods and services 33.1 (45.3) Main imports (% of total merchandise imports)Current account balance -5.4 (0.0) Machinery and transport equipment 32.5Net international investment position (2013) -4.2 Mineral fuels, lubricants and related materials 23.3
Chemicals and related products, n.e.s. 10.9
Employment rate for 15-64 year-olds (%) 42.8 (65.7)Unemployment rate, LFS (age 15 and over, % of labour force) 25.1 (7.3)
Men 48.9 (73.6) Youth (age 15-24, % of age group labour force) 51.3 (15.0)
Women 36.9 (57.9)Long-term unemployed (1 year and over, % of labour force, 2013) 8.4 (2.7)
Participation rate for 15-64 year-oldsa(%) 57.1 (71.1) Tertiary educational attainment 25-64 year-olds (%, 2012) 6.4 (32.2)Gross domestic expenditure on R&D (% of GDP, 2012a) 0.8 (2.4)
Total primary energy supply per capita (toe, 2012a) 2.7 (4.2)CO2 emissions from fuel combustion per capita (tonnes, 2012) 7.2 (9.7)
Renewables (%, 2012a) 10.9 (8.8) Water abstractions per capita (1 000 m3, 2000) 0.284Fine particulate matter concentration (urban, PM10, μg/m3, 2011) 55.6 (28.0)
Income inequality (Gini coefficientb, 2010) 0.69 (0.32) Share of women in parliament (%, February 2015) 40.7 (27.0)Public and private spending (% of GDP)
Health care (2013c) 8.9 (9.2)Education (primary, secondary, post sec. non tertiary, 2012, public) 4.8
Better life index: www.oecdbetterlifeindex.org
a) 2013 data for the OECD.
c) 2012 data for the OECD.Source : Calculations based on data extracted from the databases of the following organisations: OECD, International Energy Agency, World Bank, International Monetary Fund, Inter-Parliamentary Union , UNESCO and FAO.
BASIC STATISTICS OF SOUTH AFRICA, 2014(Numbers in parentheses refer to the OECD average)*
LAND, PEOPLE AND ELECTORAL CYCLE
ECONOMY
GENERAL GOVERNMENTPer cent of GDP
EXTERNAL ACCOUNTS
LABOUR MARKET, SKILLS AND INNOVATION
ENVIRONMENT
SOCIETY
* Where the OECD aggregate is not provided in the source database, a simple OECD average of latest available data is calculated where data exist for at least 29 member countries.
b) South Africa is from World Bank (2014), "South Africa Economic Update: Fiscal Policy and Redistribution in an Unequal Society”, South Africa Economic Update , No. 6, World Bank Group, Washington, DC.

8

9
Executive summary
• Main findings
• Key recommendations
10
Main findings
Since 1994 South Africa has made great progress in reducing absolute poverty by rolling out social grants for pensioners, the disabled and children. Access to education, housing, water, electricity and other services has been greatly broadened. As a result, well-being has increased substantially. A sound macroeconomic framework with a stable fiscal position, inflation targeting, a floating exchange rate and largely unimpeded international capital flows underpinned this progress and has earned South Africa the confidence of financial markets.
Notwithstanding the successful transition to a democratic system with strong institutions, the legacy of apartheid is still felt by many South Africans. Inactivity is widespread, settlement structures are too remote from economic centres and severe infrastructure bottlenecks prevent economic activity from delivering the benefits of globalisation to all. Moreover, domestic barriers to firms entering markets are still high, in particular for black entrepreneurs despite policies to foster black economic empowerment. The National Development Plan provides an ambitious framework for stronger, more inclusive growth.
Growth has not been inclusive due to insufficient employment growth
A key factor behind the high income inequality is the low employment rate, especially of black South Africans. The National Development Plan also identifies the need to increase economic growth and expand employment. Job creation is held back by regulatory entry barriers for new suppliers, who could offer better and cheaper services, and by the legal extension of collectively agreed wages, contributing to an insider/outsider divide. Wage formation is complicated by confrontational industrial action. Large numbers of low-skilled job seekers reside where employment opportunities are limited. The lack of a centralised infrastructure for providing active labour market policies means that delivery of existing programmes is fragmented. There is also no national minimum wage, although collective bargaining agreements and sectoral regulations establish widely varying wage floors across much of the economy.
Reforms are under way to tackle infrastructure bottlenecks and support SMEs
The government has identified SMEs as key to bolstering growth and employment but SMEs face high regulatory burdens, and the pattern of social housing hinders business opportunities. Publicly owned network industries, especially electricity but also some transport sectors, have ongoing capacity problems and are characterised by cross-subsidies, insufficient oversight by regulators and limited access of independent service providers to the infrastructure. The government is making large investments to rectify capacity problems; electricity shortages have been particularly damaging for the economy. New public management techniques promise to improve spending efficiency. Public ownership of companies is still significant, even in markets that could be opened for competition. This occupies scarce administrative capacity on all levels of government and is a potential source of inefficiency.
The tax base is narrow and revenues are too small to meet future spending needs
A well balanced and administered tax system underpins a sound fiscal position and finances a high degree of redistribution. However, the public sector will face considerable resource needs in the years ahead to expand social and economic infrastructure. Meeting these needs will require increased revenues, but this must be equitable and not penalise growth. Taxes on personal and corporate income represent half of all tax revenues, but are levied on narrow tax bases. While goods and services taxes are an important source of revenue and are relatively efficient, largely due to the VAT regime, the zero-rates and exemptions are not well-targeted as the associated tax savings disproportionately accrue to better-off households. Carbon emissions are barely taxed but a broad carbon tax is to be introduced in 2016.
11
Key recommendations
The overarching priorities for strong, sustainable and inclusive growth in South Africa are:
Focus policy implementation on the objectives in the National Development Plan.
Remove obstacles for job creation.
Invest in social and economic infrastructure.
Tackle infrastructure bottlenecks and improve business regulation to support job creation
• Choose infrastructure investments with the highest social returns to facilitate prioritisation and cost control.
• Improve employment opportunities by expanding affordable public transport, including integrating minibuses into the public transport system, and building new, denser settlements closer to economic centres.
• In network industries, complete the introduction of independent regulators and charge them with ensuring non-discriminatory third-party access. Secure additional electricity generation capacity by accelerating the independent power producer programme and facilitating private co-generation.
• Support SMEs by increasing the use of regulatory impact analysis in order to reduce the regulatory burden, eliminating entry barriers and promoting competition.
• Systematically identify and eliminate competition-hampering regulation. Privatise state-owned companies, such as telecoms, that are in markets with a sufficient degree of competition.
Enhance the responsiveness of the labour market for more inclusive growth
• Establish a public employment service as a one-stop shop for job seekers to lower the cost of job search and hiring costs for employers, which would improve the matching of workers to jobs.
• Increase the role of mediation and arbitration to make wage negotiations less confrontational.
Broaden tax bases to help finance requirements for stronger and sustainable growth
• Broaden personal and corporate income tax bases by reducing deductions, credits and allowances. Increase tax rates on higher incomes.
• Broaden the VAT base and strengthen VAT compliance. Proceed with the introduction of a carbon tax.

12

13
ASSESSMENT AND RECOMMENDATIONS
• Social progress over the past 20 years has been impressive
• A stronger recovery was held back by strikes and power cuts
• Macroeconomic policies are stabilising inflation and public debt
• Promoting inclusive growth by improving the labour market
• More effective infrastructure and business regulation to lay the foundations for higher growth
• How can the tax system help to meet revenue-raising challenges?
14
Social progress over the past 20 years has been impressive
Since the early 1990s, South Africa has gone through a democratic transition with the development of broad-based consultation in the policy formation process, a sound macroeconomic policy framework, and strong institutions to protect the rule of the law. Social progress has been achieved with redistributive grants and wide access to key public services, notably education, health, housing, water, sanitation and electricity. These services account for 60% of government spending (Statistics South Africa, 2014).
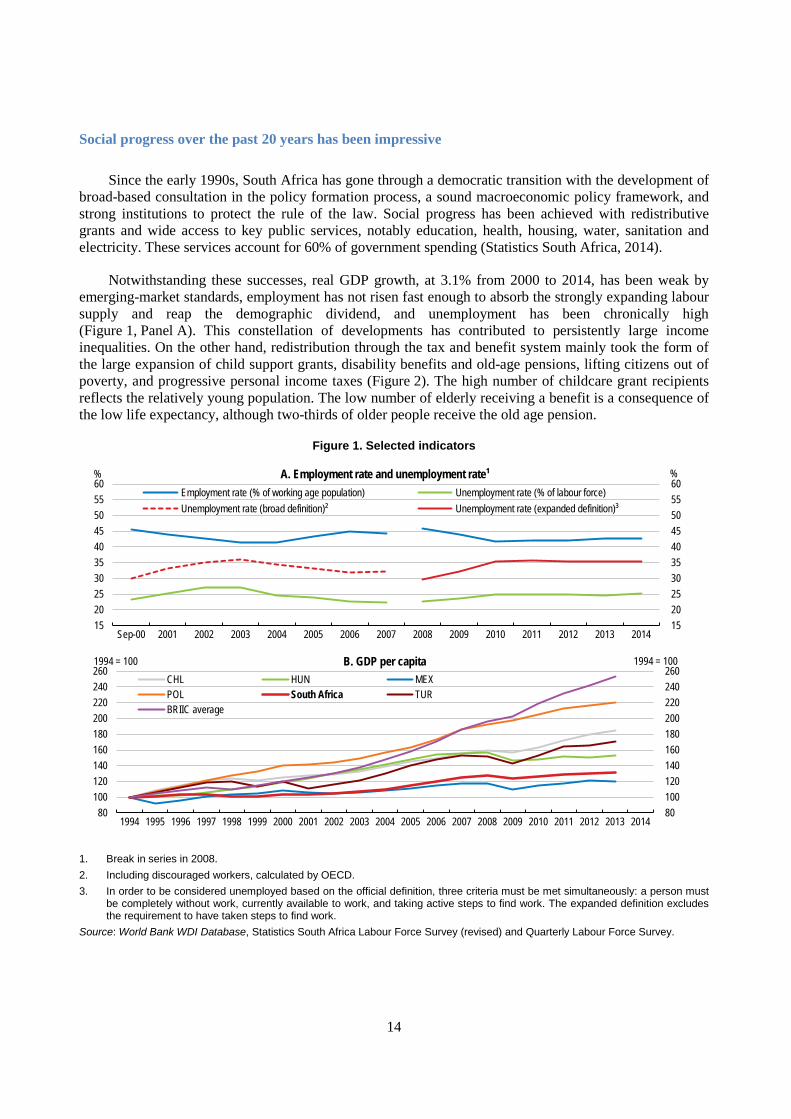
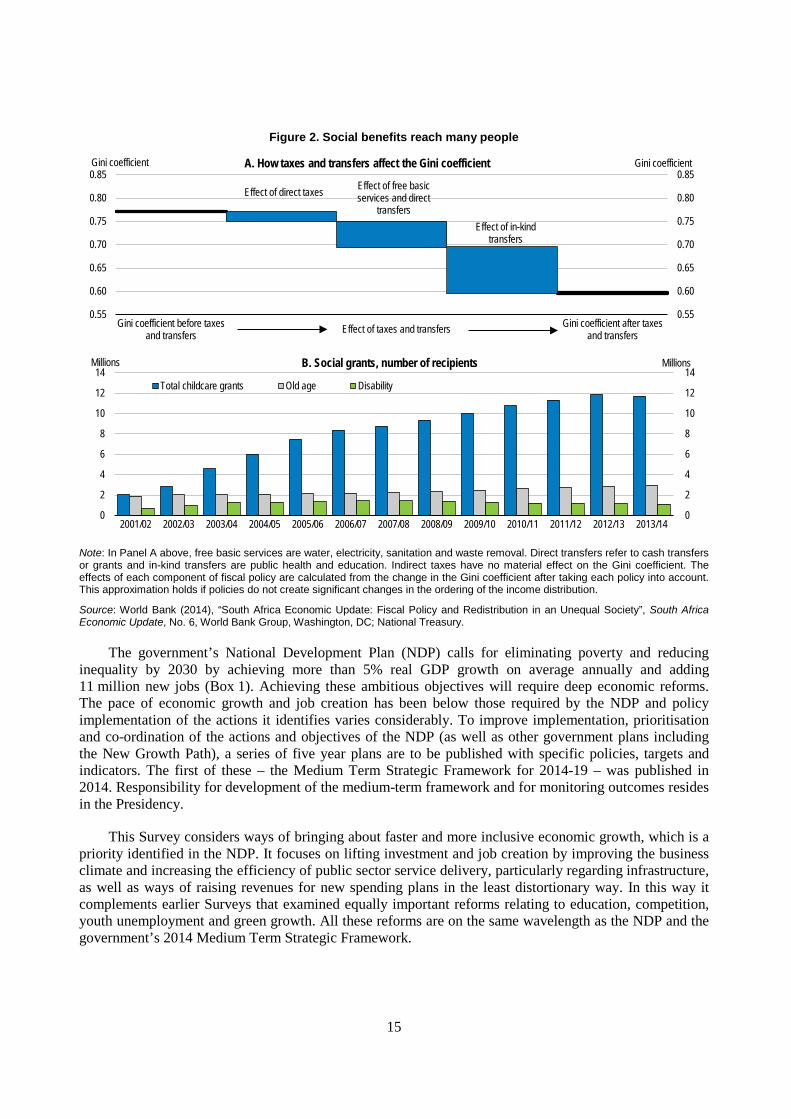
Notwithstanding these successes, real GDP growth, at 3.1% from 2000 to 2014, has been weak by emerging-market standards, employment has not risen fast enough to absorb the strongly expanding labour supply and reap the demographic dividend, and unemployment has been chronically high (Figure 1, Panel A). This constellation of developments has contributed to persistently large income inequalities. On the other hand, redistribution through the tax and benefit system mainly took the form of the large expansion of child support grants, disability benefits and old-age pensions, lifting citizens out of poverty, and progressive personal income taxes (Figure 2). The high number of childcare grant recipients reflects the relatively young population. The low number of elderly receiving a benefit is a consequence of the low life expectancy, although two-thirds of older people receive the old age pension.
Figure 1. Selected indicators
1. Break in series in 2008. 2. Including discouraged workers, calculated by OECD. 3. In order to be considered unemployed based on the official definition, three criteria must be met simultaneously: a person must
be completely without work, currently available to work, and taking active steps to find work. The expanded definition excludes the requirement to have taken steps to find work.
Source: World Bank WDI Database, Statistics South Africa Labour Force Survey (revised) and Quarterly Labour Force Survey.
80 100 120 140 160 180 200 220 240 260
1994 1995 1996 1997 1998 1999 2000 2001 2002 2003 2004 2005 2006 2007 2008 2009 2010 2011 2012 2013 2014 80
100 120 140 160 180 200 220 240 260
1994 = 1001994 = 100 B. GDP per capitaCHL HUN MEXPOL South Africa TURBRIIC average
15 20 25 30 35 40 45 50 55 60
Sep-00 2001 2002 2003 2004 2005 2006 2007 2008 2009 2010 2011 2012 2013 2014 15 20 25 30 35 40 45 50 55 60
%% A. Employment rate and unemployment rate¹ Employment rate (% of working age population) Unemployment rate (% of labour force)Unemployment rate (broad definition)² Unemployment rate (expanded definition)³
15
Figure 2. Social benefits reach many people
Note: In Panel A above, free basic services are water, electricity, sanitation and waste removal. Direct transfers refer to cash transfers or grants and in-kind transfers are public health and education. Indirect taxes have no material effect on the Gini coefficient. The effects of each component of fiscal policy are calculated from the change in the Gini coefficient after taking each policy into account. This approximation holds if policies do not create significant changes in the ordering of the income distribution.
Source: World Bank (2014), “South Africa Economic Update: Fiscal Policy and Redistribution in an Unequal Society”, South Africa Economic Update, No. 6, World Bank Group, Washington, DC; National Treasury.
The government’s National Development Plan (NDP) calls for eliminating poverty and reducing inequality by 2030 by achieving more than 5% real GDP growth on average annually and adding 11 million new jobs (Box 1). Achieving these ambitious objectives will require deep economic reforms. The pace of economic growth and job creation has been below those required by the NDP and policy implementation of the actions it identifies varies considerably. To improve implementation, prioritisation and co-ordination of the actions and objectives of the NDP (as well as other government plans including the New Growth Path), a series of five year plans are to be published with specific policies, targets and indicators. The first of these – the Medium Term Strategic Framework for 2014-19 – was published in 2014. Responsibility for development of the medium-term framework and for monitoring outcomes resides in the Presidency.
This Survey considers ways of bringing about faster and more inclusive economic growth, which is a priority identified in the NDP. It focuses on lifting investment and job creation by improving the business climate and increasing the efficiency of public sector service delivery, particularly regarding infrastructure, as well as ways of raising revenues for new spending plans in the least distortionary way. In this way it complements earlier Surveys that examined equally important reforms relating to education, competition, youth unemployment and green growth. All these reforms are on the same wavelength as the NDP and the government’s 2014 Medium Term Strategic Framework.
0
2
4
6
8
10
12
14
2001/02 2002/03 2003/04 2004/05 2005/06 2006/07 2007/08 2008/09 2009/10 2010/11 2011/12 2012/13 2013/14 0
2
4
6
8
10
12
14MillionsMillions B. Social grants, number of recipients
Total childcare grants Old age Disability
0.55
0.60
0.65
0.70
0.75
0.80
0.85
Gini coefficient before taxesand transfers
Gini coefficient after taxesand transfers
0.55
0.60
0.65
0.70
0.75
0.80
0.85Gini coefficientGini coefficient A. How taxes and transfers affect the Gini coefficient
Effect of taxes and transfers
Effect of direct taxes Effect of free basic services and direct
transfersEffect of in-kind
transfers
16
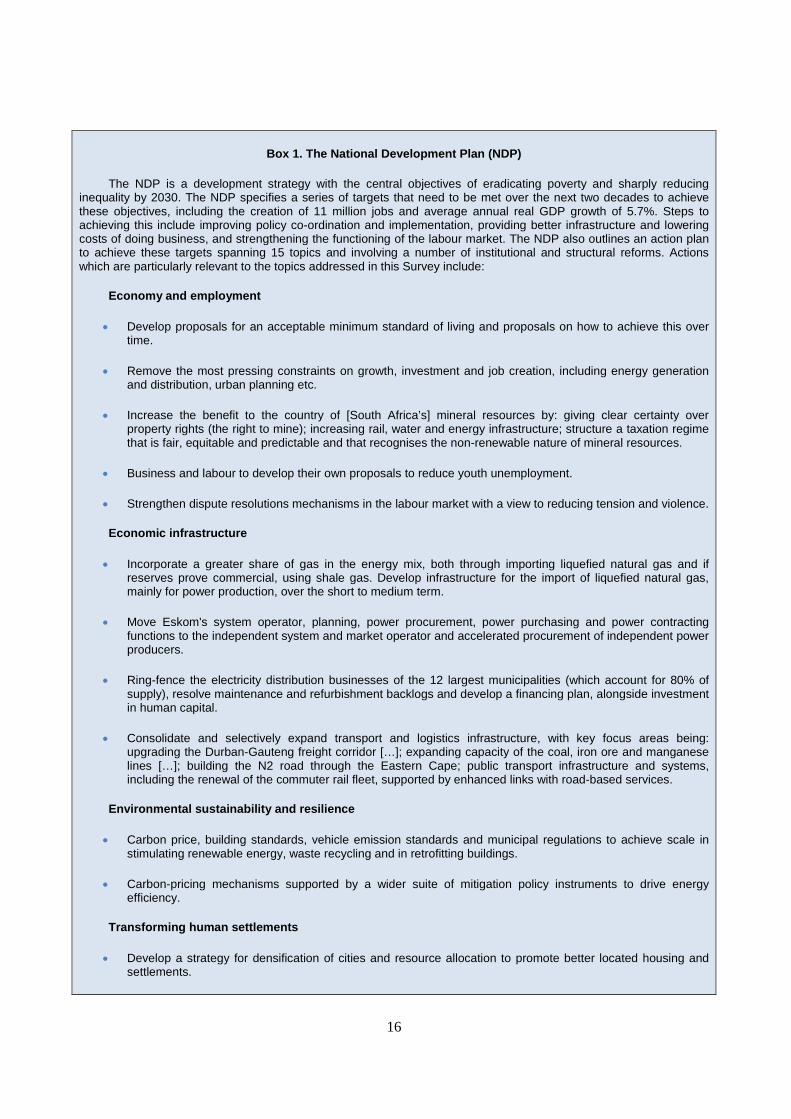
Box 1. The National Development Plan (NDP)
The NDP is a development strategy with the central objectives of eradicating poverty and sharply reducing inequality by 2030. The NDP specifies a series of targets that need to be met over the next two decades to achieve these objectives, including the creation of 11 million jobs and average annual real GDP growth of 5.7%. Steps to achieving this include improving policy co-ordination and implementation, providing better infrastructure and lowering costs of doing business, and strengthening the functioning of the labour market. The NDP also outlines an action plan to achieve these targets spanning 15 topics and involving a number of institutional and structural reforms. Actions which are particularly relevant to the topics addressed in this Survey include:
Economy and employment
• Develop proposals for an acceptable minimum standard of living and proposals on how to achieve this over time.
• Remove the most pressing constraints on growth, investment and job creation, including energy generation and distribution, urban planning etc.
• Increase the benefit to the country of [South Africa’s] mineral resources by: giving clear certainty over property rights (the right to mine); increasing rail, water and energy infrastructure; structure a taxation regime that is fair, equitable and predictable and that recognises the non-renewable nature of mineral resources.
• Business and labour to develop their own proposals to reduce youth unemployment.
• Strengthen dispute resolutions mechanisms in the labour market with a view to reducing tension and violence.
Economic infrastructure
• Incorporate a greater share of gas in the energy mix, both through importing liquefied natural gas and if reserves prove commercial, using shale gas. Develop infrastructure for the import of liquefied natural gas, mainly for power production, over the short to medium term.
• Move Eskom's system operator, planning, power procurement, power purchasing and power contracting functions to the independent system and market operator and accelerated procurement of independent power producers.
• Ring-fence the electricity distribution businesses of the 12 largest municipalities (which account for 80% of supply), resolve maintenance and refurbishment backlogs and develop a financing plan, alongside investment in human capital.
• Consolidate and selectively expand transport and logistics infrastructure, with key focus areas being: upgrading the Durban-Gauteng freight corridor […]; expanding capacity of the coal, iron ore and manganese lines […]; building the N2 road through the Eastern Cape; public transport infrastructure and systems, including the renewal of the commuter rail fleet, supported by enhanced links with road-based services.
Environmental sustainability and resilience
• Carbon price, building standards, vehicle emission standards and municipal regulations to achieve scale in stimulating renewable energy, waste recycling and in retrofitting buildings.
• Carbon-pricing mechanisms supported by a wider suite of mitigation policy instruments to drive energy efficiency.
Transforming human settlements
• Develop a strategy for densification of cities and resource allocation to promote better located housing and settlements.
17
• Substantial investment to ensure safe, reliable and affordable public transport.
• Introduce spatial development framework and norms, including improving the balance between location of jobs and people.
Social protection
• Together with social partners, determine a social floor that can be progressively realised through rising employment, higher earnings and social grants and other aspects of the social wage.
• Pilot mechanisms and incentives to assist the unemployed to access the labour market.
• Expand existing public employment initiatives to create opportunities for the unemployed.
• Develop a consolidated institutional framework that supports coherent policy implementation, integrated social security administration, and effective regulation and oversight of the system.
Source: Action plan items are selected extracts from National Planning Commission (2011), National Development Plan.
A stronger recovery was held back by strikes and power cuts
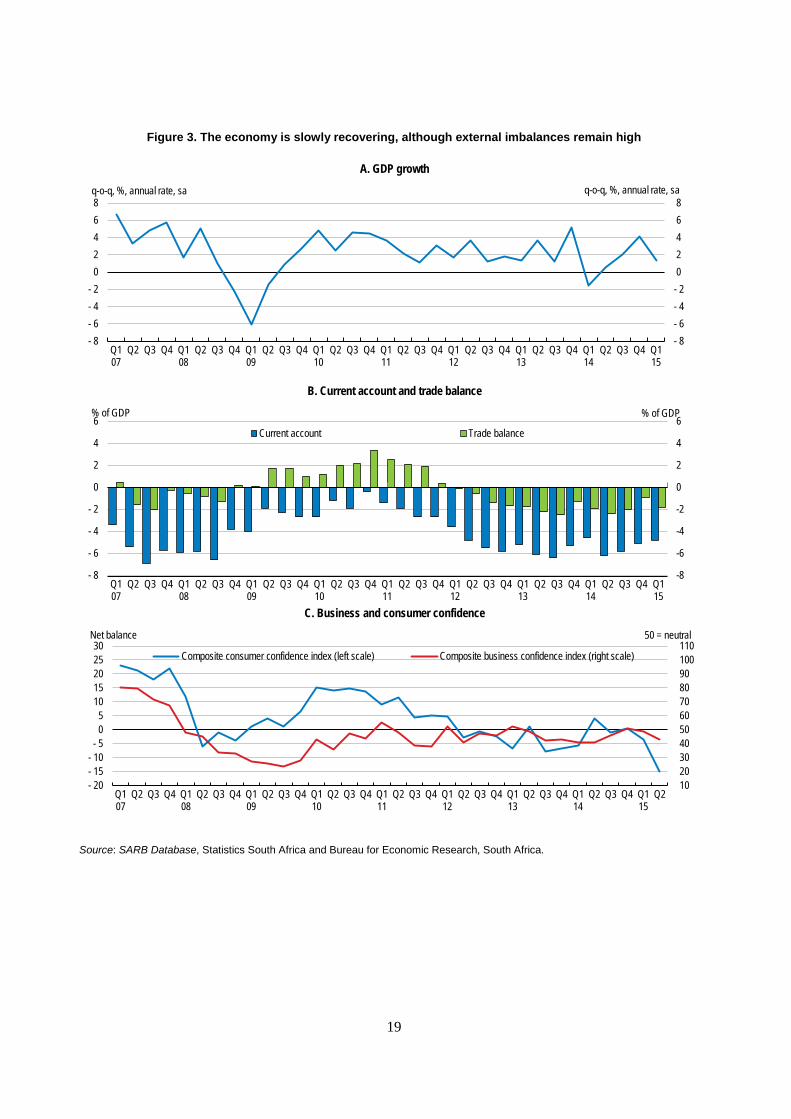
In 2014, the economy faced slower international growth, insufficient infrastructure capacity (particularly of electricity generation, which was hit by a large-scale plant failure in the latter part of the year) and long, violent and costly industrial action in two important sectors. Real GDP fell in the first part of the year as a consequence of the strikes but then bounced back (Figure 3, Panel A). The strikes are estimated to have subtracted about 2 percentage points from growth in the first quarter and a bit less in the third quarter (SARB, 2014a). Subsequently, the recovery has been constrained by a delay in the roll-out of new electricity generation capacity and unplanned maintenance, leading to power outages that continued well into 2015.
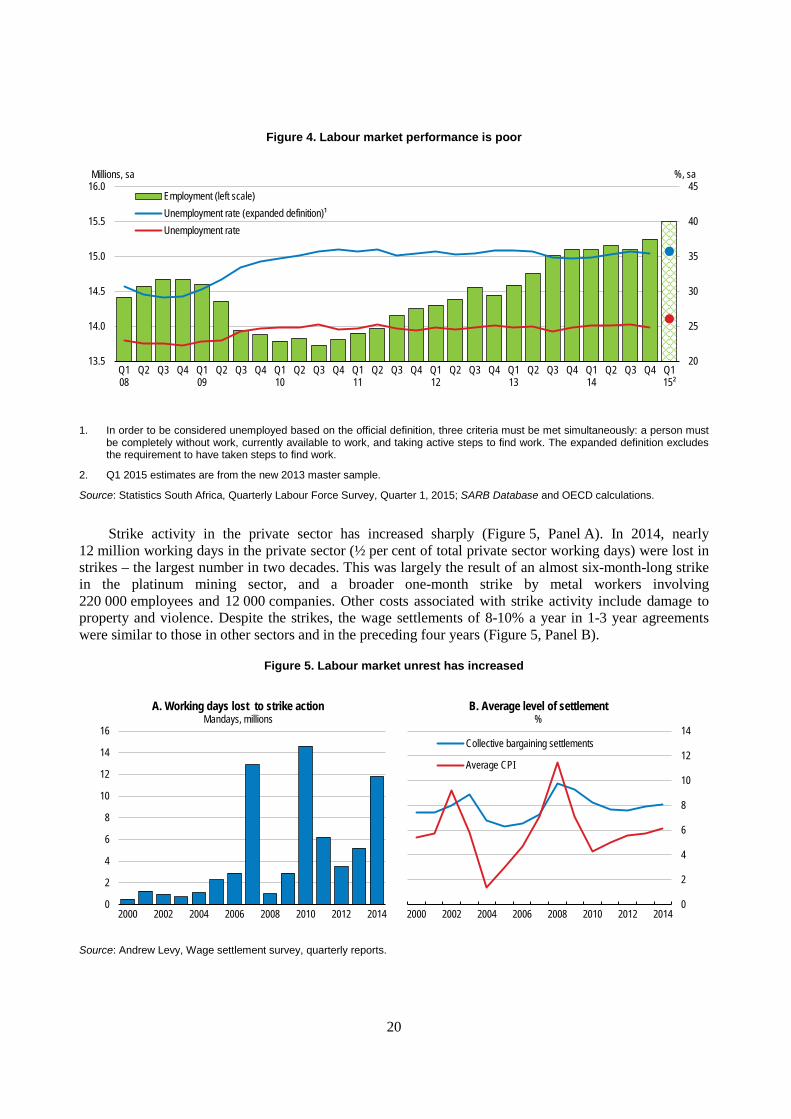
Private consumption growth dipped in early 2014, then firmed over the year in line with higher disposable income and confidence (Figure 3, Panel C). Private investment contracted in the first half of the year, and the subsequent recovery has been slowed by headwinds from electricity supply problems (Table 1). Uncertainty around electricity supply and government policy (particularly relating to the resources and agricultural sectors), labour market unrest (discussed below) and further falls in commodity prices also weighed on investment. Exports slowed, export markets weakened, and export performance (exports in relation to market growth) disappointed despite a strong depreciation of the effective exchange rate since the beginning of 2011. This poor performance partly reflects a high reliance on resource exports, which weakened as the commodity boom petered out. Import growth slowed in response to lower domestic demand and rand depreciation, but the worsening terms of trade meant that the current account deficit remained high (Figure 3, Panel B). Although employment creation restarted towards the end of 2014, in early 2015 the unemployment rate was higher than a year earlier, at 26% (Figure 4).
18
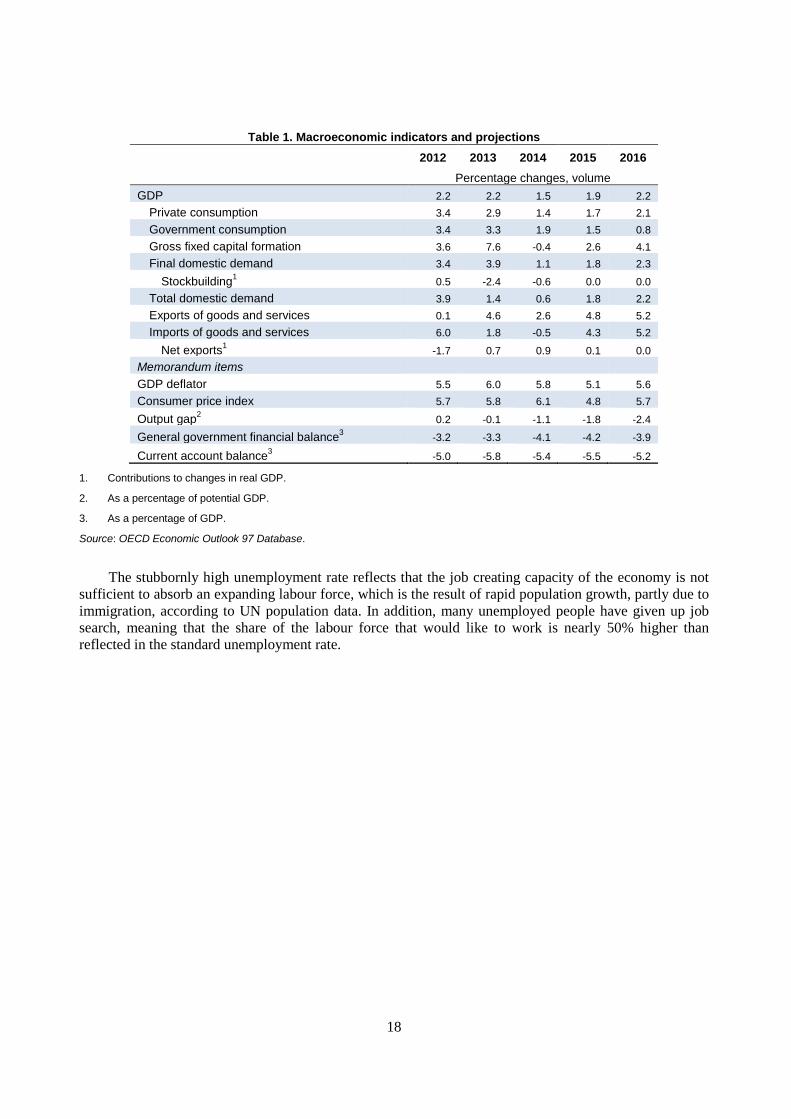
Table 1. Macroeconomic indicators and projections 2012 2013 2014 2015 2016 Percentage changes, volume GDP 2.2 2.2 1.5 1.9 2.2
Private consumption 3.4 2.9 1.4 1.7 2.1 Government consumption 3.4 3.3 1.9 1.5 0.8 Gross fixed capital formation 3.6 7.6 -0.4 2.6 4.1 Final domestic demand 3.4 3.9 1.1 1.8 2.3
Stockbuilding1 0.5 -2.4 -0.6 0.0 0.0 Total domestic demand 3.9 1.4 0.6 1.8 2.2 Exports of goods and services 0.1 4.6 2.6 4.8 5.2 Imports of goods and services 6.0 1.8 -0.5 4.3 5.2
Net exports1 -1.7 0.7 0.9 0.1 0.0 Memorandum items
GDP deflator 5.5 6.0 5.8 5.1 5.6 Consumer price index 5.7 5.8 6.1 4.8 5.7
Output gap2 0.2 -0.1 -1.1 -1.8 -2.4
General government financial balance3 -3.2 -3.3 -4.1 -4.2 -3.9
Current account balance3 -5.0 -5.8 -5.4 -5.5 -5.2
1. Contributions to changes in real GDP.
2. As a percentage of potential GDP.
3. As a percentage of GDP. Source: OECD Economic Outlook 97 Database.
The stubbornly high unemployment rate reflects that the job creating capacity of the economy is not sufficient to absorb an expanding labour force, which is the result of rapid population growth, partly due to immigration, according to UN population data. In addition, many unemployed people have given up job search, meaning that the share of the labour force that would like to work is nearly 50% higher than reflected in the standard unemployment rate.
19
Figure 3. The economy is slowly recovering, although external imbalances remain high
Source: SARB Database, Statistics South Africa and Bureau for Economic Research, South Africa.
A. GDP growth
B. Current account and trade balance
C. Business and consumer confidence
-8
-6
-4
-2
0
2
4
6
Q107
Q2 Q3 Q4 Q108
Q2 Q3 Q4 Q109
Q2 Q3 Q4 Q110
Q2 Q3 Q4 Q111
Q2 Q3 Q4 Q112
Q2 Q3 Q4 Q113
Q2 Q3 Q4 Q114
Q2 Q3 Q4 Q115
- 8
- 6
- 4
- 2
0
2
4
6% of GDP% of GDP
Current account Trade balance
10 20 30 40 50 60 70 80 90 100 110
Q107
Q2 Q3 Q4 Q108
Q2 Q3 Q4 Q109
Q2 Q3 Q4 Q110
Q2 Q3 Q4 Q111
Q2 Q3 Q4 Q112
Q2 Q3 Q4 Q113
Q2 Q3 Q4 Q114
Q2 Q3 Q4 Q115
Q2- 20- 15- 10- 5 0 5
10 15 20 25 30
50 = neutralNet balance
Composite consumer confidence index (left scale) Composite business confidence index (right scale)
- 8- 6- 4- 2 0 2 4 6 8
Q107
Q2 Q3 Q4 Q108
Q2 Q3 Q4 Q109
Q2 Q3 Q4 Q110
Q2 Q3 Q4 Q111
Q2 Q3 Q4 Q112
Q2 Q3 Q4 Q113
Q2 Q3 Q4 Q114
Q2 Q3 Q4 Q115
- 8- 6- 4- 2 0 2 4 6 8
q-o-q, %, annual rate, saq-o-q, %, annual rate, sa
20
Figure 4. Labour market performance is poor
1. In order to be considered unemployed based on the official definition, three criteria must be met simultaneously: a person must be completely without work, currently available to work, and taking active steps to find work. The expanded definition excludes the requirement to have taken steps to find work.
2. Q1 2015 estimates are from the new 2013 master sample.
Source: Statistics South Africa, Quarterly Labour Force Survey, Quarter 1, 2015; SARB Database and OECD calculations.
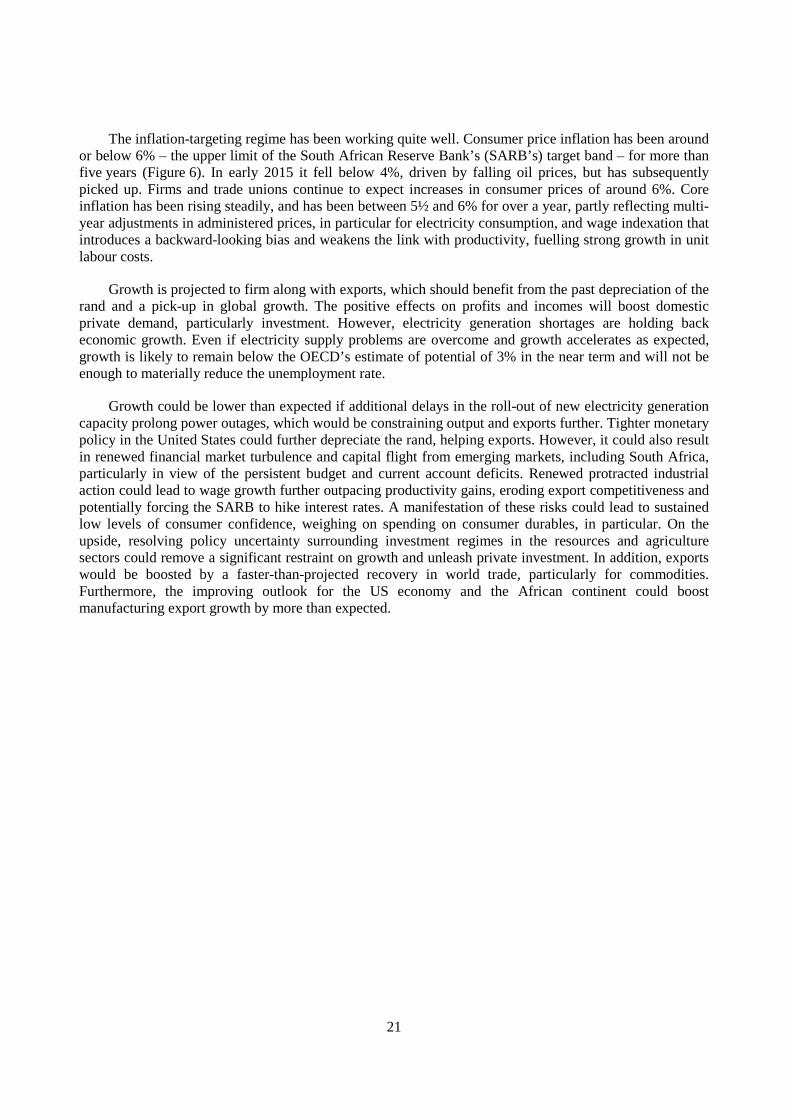
Strike activity in the private sector has increased sharply (Figure 5, Panel A). In 2014, nearly 12 million working days in the private sector (½ per cent of total private sector working days) were lost in strikes – the largest number in two decades. This was largely the result of an almost six-month-long strike in the platinum mining sector, and a broader one-month strike by metal workers involving 220 000 employees and 12 000 companies. Other costs associated with strike activity include damage to property and violence. Despite the strikes, the wage settlements of 8-10% a year in 1-3 year agreements were similar to those in other sectors and in the preceding four years (Figure 5, Panel B).
Figure 5. Labour market unrest has increased
Source: Andrew Levy, Wage settlement survey, quarterly reports.
20
25
30
35
40
45
Q108
Q2 Q3 Q4 Q109
Q2 Q3 Q4 Q110
Q2 Q3 Q4 Q111
Q2 Q3 Q4 Q112
Q2 Q3 Q4 Q113
Q2 Q3 Q4 Q114
Q2 Q3 Q4 Q115²
13.5
14.0
14.5
15.0
15.5
16.0%, saMillions, sa
Employment (left scale)Unemployment rate (expanded definition)¹Unemployment rate
0
2
4
6
8
10
12
14
16
2000 2002 2004 2006 2008 2010 2012 2014
A. Working days lost to strike actionMandays, millions
0
2
4
6
8
10
12
14
2000 2002 2004 2006 2008 2010 2012 2014
B. Average level of settlement%
Collective bargaining settlements
Average CPI
21
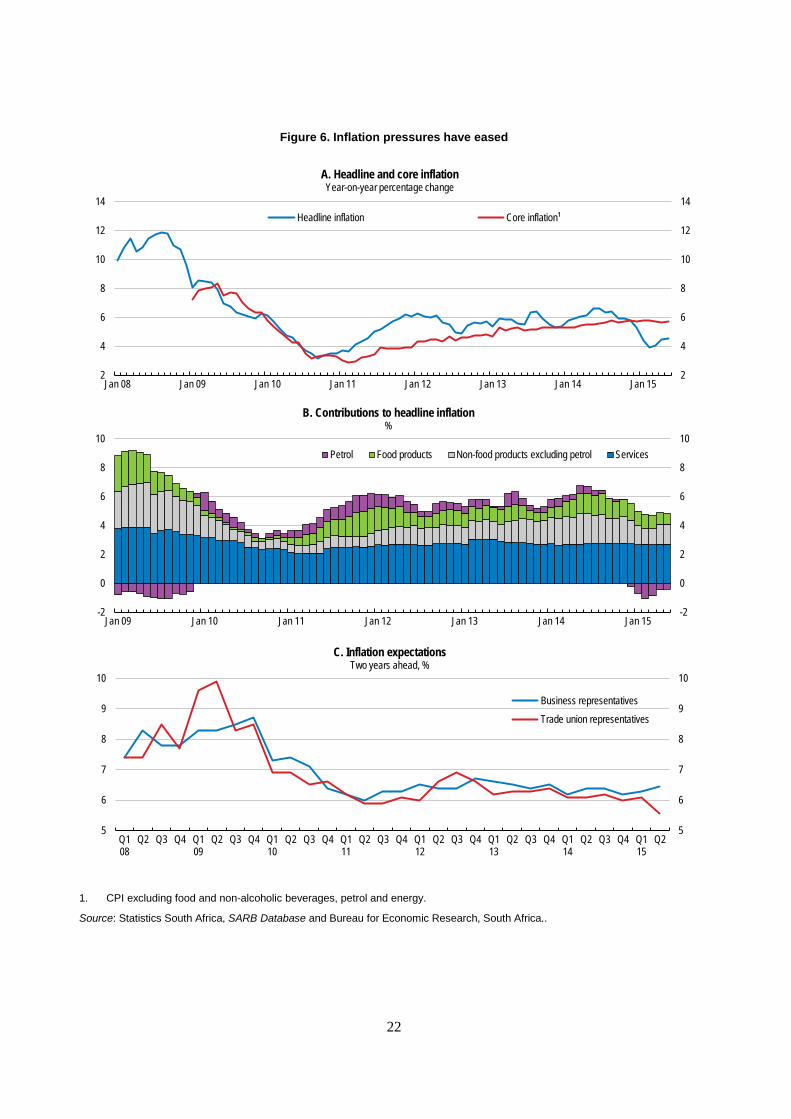
The inflation-targeting regime has been working quite well. Consumer price inflation has been around or below 6% – the upper limit of the South African Reserve Bank’s (SARB’s) target band – for more than five years (Figure 6). In early 2015 it fell below 4%, driven by falling oil prices, but has subsequently picked up. Firms and trade unions continue to expect increases in consumer prices of around 6%. Core inflation has been rising steadily, and has been between 5½ and 6% for over a year, partly reflecting multi-year adjustments in administered prices, in particular for electricity consumption, and wage indexation that introduces a backward-looking bias and weakens the link with productivity, fuelling strong growth in unit labour costs.
Growth is projected to firm along with exports, which should benefit from the past depreciation of the rand and a pick-up in global growth. The positive effects on profits and incomes will boost domestic private demand, particularly investment. However, electricity generation shortages are holding back economic growth. Even if electricity supply problems are overcome and growth accelerates as expected, growth is likely to remain below the OECD’s estimate of potential of 3% in the near term and will not be enough to materially reduce the unemployment rate.
Growth could be lower than expected if additional delays in the roll-out of new electricity generation capacity prolong power outages, which would be constraining output and exports further. Tighter monetary policy in the United States could further depreciate the rand, helping exports. However, it could also result in renewed financial market turbulence and capital flight from emerging markets, including South Africa, particularly in view of the persistent budget and current account deficits. Renewed protracted industrial action could lead to wage growth further outpacing productivity gains, eroding export competitiveness and potentially forcing the SARB to hike interest rates. A manifestation of these risks could lead to sustained low levels of consumer confidence, weighing on spending on consumer durables, in particular. On the upside, resolving policy uncertainty surrounding investment regimes in the resources and agriculture sectors could remove a significant restraint on growth and unleash private investment. In addition, exports would be boosted by a faster-than-projected recovery in world trade, particularly for commodities. Furthermore, the improving outlook for the US economy and the African continent could boost manufacturing export growth by more than expected.
22
Figure 6. Inflation pressures have eased
1. CPI excluding food and non-alcoholic beverages, petrol and energy.
Source: Statistics South Africa, SARB Database and Bureau for Economic Research, South Africa..
2
4
6
8
10
12
14
2
4
6
8
10
12
14
Jan 08 Jan 09 Jan 10 Jan 11 Jan 12 Jan 13 Jan 14 Jan 15
A. Headline and core inflationYear-on-year percentage change
Headline inflation Core inflation¹
-2
0
2
4
6
8
10
-2
0
2
4
6
8
10
Jan 09 Jan 10 Jan 11 Jan 12 Jan 13 Jan 14 Jan 15
B. Contributions to headline inflation%
Petrol Food products Non-food products excluding petrol Services
5
6
7
8
9
10
5
6
7
8
9
10
Q108
Q2 Q3 Q4 Q109
Q2 Q3 Q4 Q110
Q2 Q3 Q4 Q111
Q2 Q3 Q4 Q112
Q2 Q3 Q4 Q113
Q2 Q3 Q4 Q114
Q2 Q3 Q4 Q115
Q2
C. Inflation expectationsTwo years ahead, %
Business representativesTrade union representatives
23
Macroeconomic policies are stabilising inflation and public debt
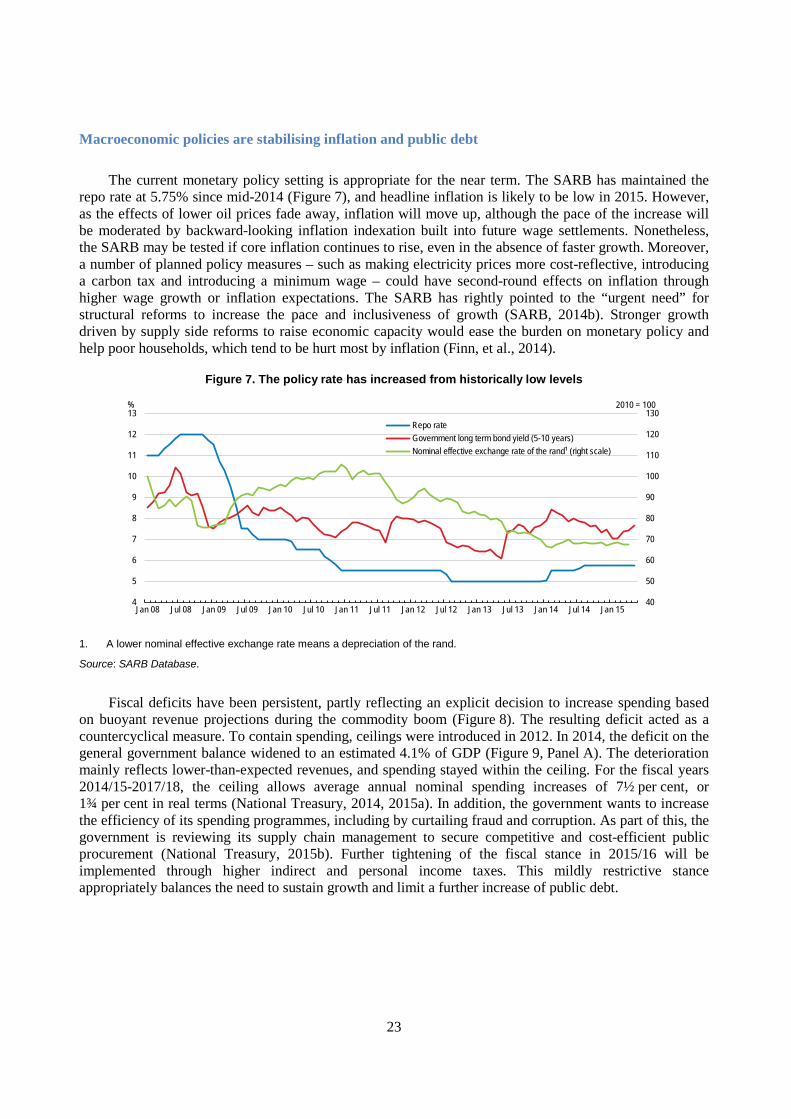
The current monetary policy setting is appropriate for the near term. The SARB has maintained the repo rate at 5.75% since mid-2014 (Figure 7), and headline inflation is likely to be low in 2015. However, as the effects of lower oil prices fade away, inflation will move up, although the pace of the increase will be moderated by backward-looking inflation indexation built into future wage settlements. Nonetheless, the SARB may be tested if core inflation continues to rise, even in the absence of faster growth. Moreover, a number of planned policy measures – such as making electricity prices more cost-reflective, introducing a carbon tax and introducing a minimum wage – could have second-round effects on inflation through higher wage growth or inflation expectations. The SARB has rightly pointed to the “urgent need” for structural reforms to increase the pace and inclusiveness of growth (SARB, 2014b). Stronger growth driven by supply side reforms to raise economic capacity would ease the burden on monetary policy and help poor households, which tend to be hurt most by inflation (Finn, et al., 2014).
Figure 7. The policy rate has increased from historically low levels
1. A lower nominal effective exchange rate means a depreciation of the rand.
Source: SARB Database.
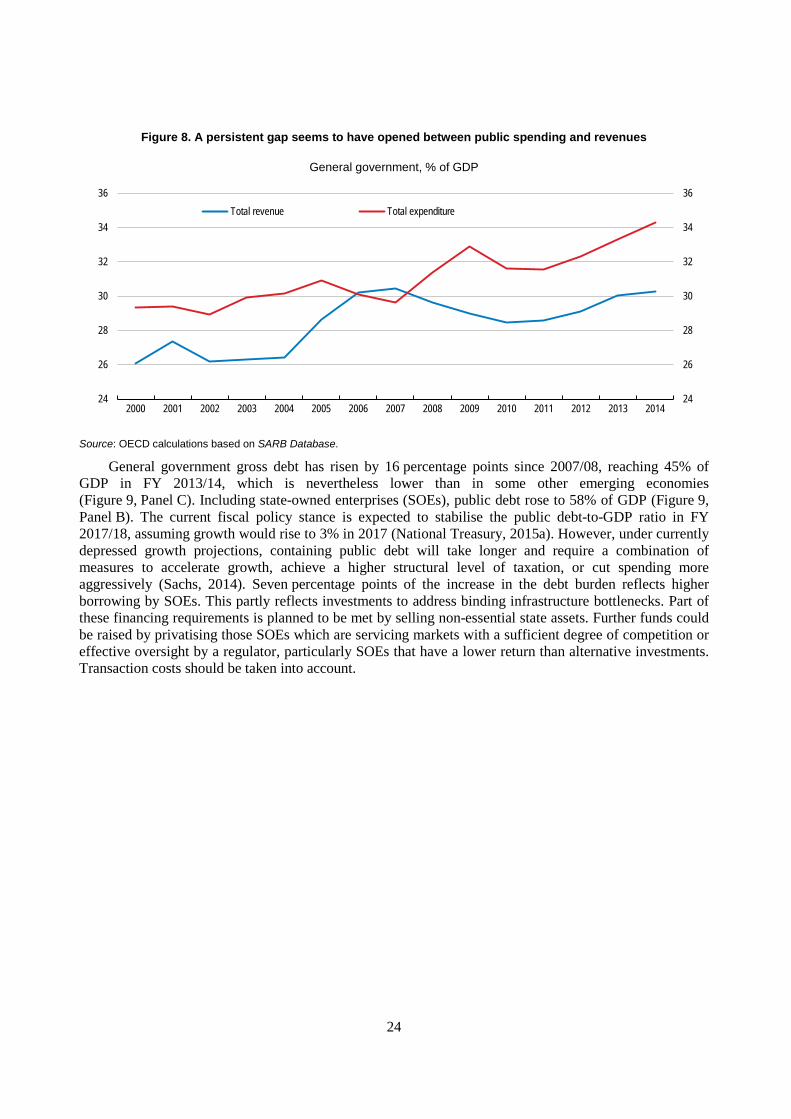
Fiscal deficits have been persistent, partly reflecting an explicit decision to increase spending based on buoyant revenue projections during the commodity boom (Figure 8). The resulting deficit acted as a countercyclical measure. To contain spending, ceilings were introduced in 2012. In 2014, the deficit on the general government balance widened to an estimated 4.1% of GDP (Figure 9, Panel A). The deterioration mainly reflects lower-than-expected revenues, and spending stayed within the ceiling. For the fiscal years 2014/15-2017/18, the ceiling allows average annual nominal spending increases of 7½ per cent, or 1¾ per cent in real terms (National Treasury, 2014, 2015a). In addition, the government wants to increase the efficiency of its spending programmes, including by curtailing fraud and corruption. As part of this, the government is reviewing its supply chain management to secure competitive and cost-efficient public procurement (National Treasury, 2015b). Further tightening of the fiscal stance in 2015/16 will be implemented through higher indirect and personal income taxes. This mildly restrictive stance appropriately balances the need to sustain growth and limit a further increase of public debt.
40
50
60
70
80
90
100
110
120
130
4
5
6
7
8
9
10
11
12
13
Jan 08 Jul 08 Jan 09 Jul 09 Jan 10 Jul 10 Jan 11 Jul 11 Jan 12 Jul 12 Jan 13 Jul 13 Jan 14 Jul 14 Jan 15
2010 = 100%
Repo rateGovernment long term bond yield (5-10 years)Nominal effective exchange rate of the rand¹ (right scale)
24
Figure 8. A persistent gap seems to have opened between public spending and revenues
General government, % of GDP
Source: OECD calculations based on SARB Database.
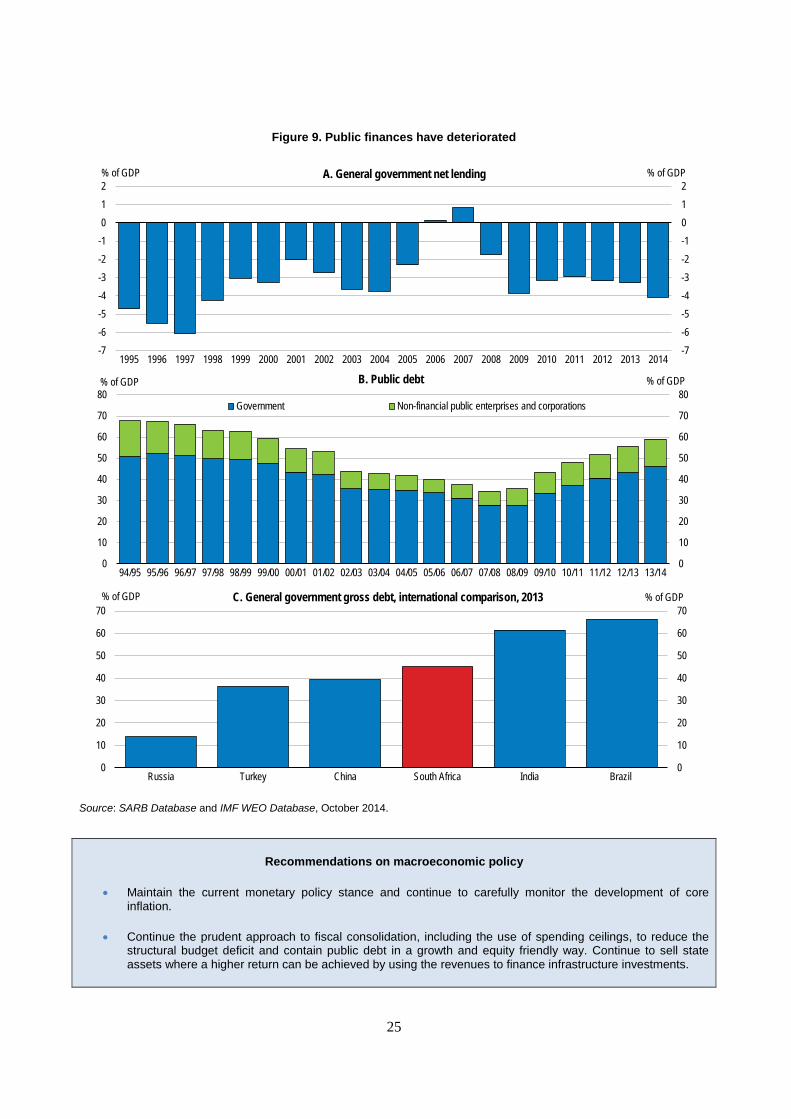
General government gross debt has risen by 16 percentage points since 2007/08, reaching 45% of GDP in FY 2013/14, which is nevertheless lower than in some other emerging economies (Figure 9, Panel C). Including state-owned enterprises (SOEs), public debt rose to 58% of GDP (Figure 9, Panel B). The current fiscal policy stance is expected to stabilise the public debt-to-GDP ratio in FY 2017/18, assuming growth would rise to 3% in 2017 (National Treasury, 2015a). However, under currently depressed growth projections, containing public debt will take longer and require a combination of measures to accelerate growth, achieve a higher structural level of taxation, or cut spending more aggressively (Sachs, 2014). Seven percentage points of the increase in the debt burden reflects higher borrowing by SOEs. This partly reflects investments to address binding infrastructure bottlenecks. Part of these financing requirements is planned to be met by selling non-essential state assets. Further funds could be raised by privatising those SOEs which are servicing markets with a sufficient degree of competition or effective oversight by a regulator, particularly SOEs that have a lower return than alternative investments. Transaction costs should be taken into account.
24
26
28
30
32
34
36
2000 2001 2002 2003 2004 2005 2006 2007 2008 2009 2010 2011 2012 2013 2014 24
26
28
30
32
34
36Total revenue Total expenditure
25
Figure 9. Public finances have deteriorated
Source: SARB Database and IMF WEO Database, October 2014.
Recommendations on macroeconomic policy
• Maintain the current monetary policy stance and continue to carefully monitor the development of core inflation.
• Continue the prudent approach to fiscal consolidation, including the use of spending ceilings, to reduce the structural budget deficit and contain public debt in a growth and equity friendly way. Continue to sell state assets where a higher return can be achieved by using the revenues to finance infrastructure investments.
0
10
20
30
40
50
60
70
80
0
10
20
30
40
50
60
70
80
94/95 95/96 96/97 97/98 98/99 99/00 00/01 01/02 02/03 03/04 04/05 05/06 06/07 07/08 08/09 09/10 10/11 11/12 12/13 13/14
% of GDP% of GDP B. Public debt
Government Non-financial public enterprises and corporations
-7-6-5-4-3-2-1012
-7-6-5-4-3-2-1012
1995 1996 1997 1998 1999 2000 2001 2002 2003 2004 2005 2006 2007 2008 2009 2010 2011 2012 2013 2014
% of GDP% of GDP A. General government net lending
0
10
20
30
40
50
60
70
0
10
20
30
40
50
60
70
Russia Turkey China South Africa India Brazil
% of GDP% of GDP C. General government gross debt, international comparison, 2013
26
Promoting inclusive growth by improving the labour market
A key impediment to inclusive growth in South Africa is high and persistent unemployment, especially among blacks. Given the scale of inactivity, a multi-pronged strategy is necessary to raise the pace of growth and promote job creation, as identified by the National Development Plan. This requires measures to foster entrepreneurship, improve the environment for job creation and enhance the functioning of the labour market. Policies are also needed to increase the quality of basic education to increase skills, which is crucial for medium-term growth, and also improve transitions from school to work and better link vocational training to the economy’s needs; the OECD has previously made recommendations in these important areas (OECD, 2010, 2013a; Field, et al., 2014; Annex). The government has sought to increase the inclusiveness of growth by implementing: a series of black economic empowerment programmes; a wage subsidy in the form of an employer tax incentive mainly targeting young workers (covering 216 000 employees in December 2014); measures to expand public works programmes; and steps to increase enrolment in post-school education, in order to address persistent skills mismatches.
One of the main planks in the government’s strategy to enhance the inclusiveness of economic growth and reduce existing inequalities is to overcome the heritage of restrictions on black entrepreneurship. Black economic empowerment (BEE) policies are key to enhancing the inclusiveness of economic growth and reducing existing inequalities, and are based in part on using public procurement policy, via a points system, to induce firms to include larger numbers of historically disadvantaged population groups (Blacks, Coloured, Indians, Chinese, handicapped, and women) in their production and supply chains as workers, managers and owners. Revisions to the rules introduced in 2015 have extended the reach of the system as more points can be gained from sub-contractors, including SMEs, which may not directly be engaged in public procurement contracts themselves. In addition, oversight and sanctions are being boosted (Darroll, 2015). The points system is complex and it is important to evaluate the cost-effectiveness of all existing and new policies. Furthermore there seems to be scope to redirect BEE more towards fostering black entrepreneurship in order to better achieve the transformational objectives of the programme. This could involve a greater focus on expanding direct support for black entrepreneurs, including through subsidised access to finance, professional help with business plans, and subsidised access to management training programmes. Such measures should foster a more direct role for blacks to manage and control enterprises.
The labour market is currently hindered by high job search costs and skills mismatches, in addition to the lack of demand due to slow growth. Delivery of labour market programs is fragmented and the administrative burden of some programs is excessive (OECD, 2010). This partly reflects the absence of a fully rolled out public employment service. Spatial mismatches between economic activity and housing (discussed below) also add to the costs of job search, because some job seekers must make long trips to search for work and also because access to information on job openings is more limited (OECD, 2010). Developing a central public employment service as a “one stop shop” for job seekers that provides access to training and other support programmes as well as a centralised database of job openings, would lower the cost of job search, improve skills and help improve the matching of workers to jobs.
27
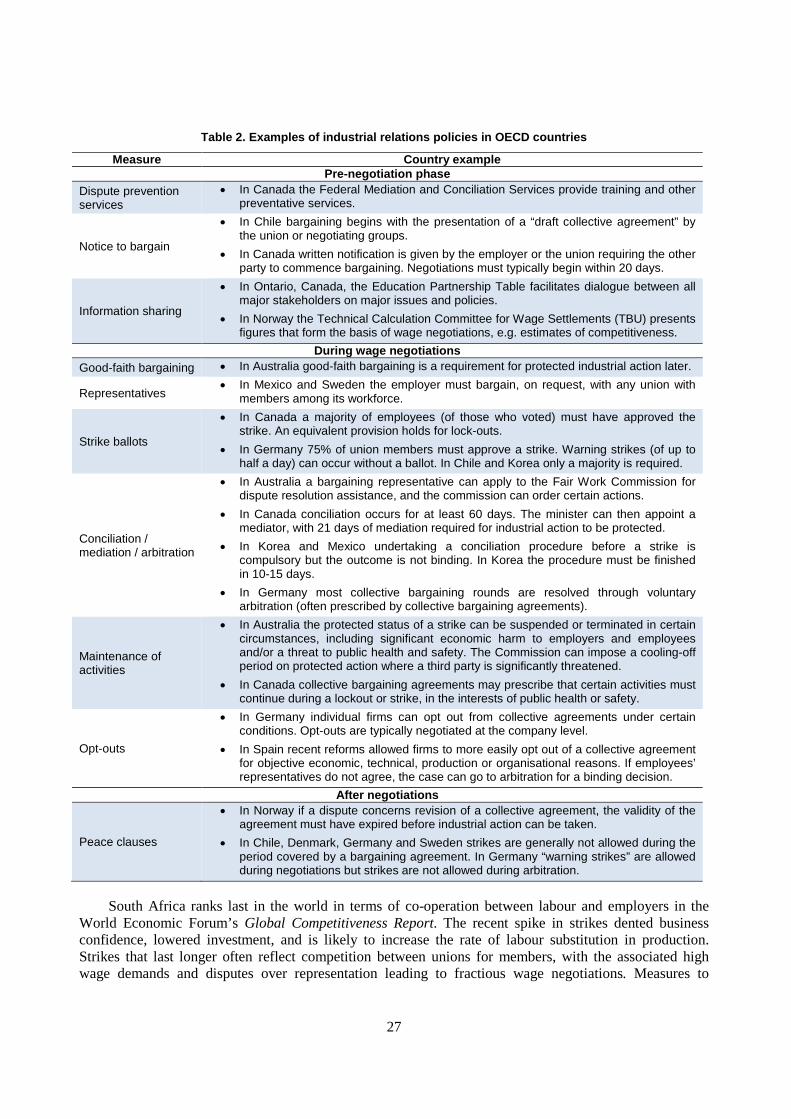
Table 2. Examples of industrial relations policies in OECD countries
Measure Country example Pre-negotiation phase
Dispute prevention services
• In Canada the Federal Mediation and Conciliation Services provide training and other preventative services.
Notice to bargain
• In Chile bargaining begins with the presentation of a “draft collective agreement” by the union or negotiating groups.
• In Canada written notification is given by the employer or the union requiring the other party to commence bargaining. Negotiations must typically begin within 20 days.
Information sharing
• In Ontario, Canada, the Education Partnership Table facilitates dialogue between all major stakeholders on major issues and policies.
• In Norway the Technical Calculation Committee for Wage Settlements (TBU) presents figures that form the basis of wage negotiations, e.g. estimates of competitiveness.
During wage negotiations Good-faith bargaining • In Australia good-faith bargaining is a requirement for protected industrial action later.
Representatives • In Mexico and Sweden the employer must bargain, on request, with any union with
members among its workforce.
Strike ballots
• In Canada a majority of employees (of those who voted) must have approved the strike. An equivalent provision holds for lock-outs.
• In Germany 75% of union members must approve a strike. Warning strikes (of up to half a day) can occur without a ballot. In Chile and Korea only a majority is required.
Conciliation / mediation / arbitration
• In Australia a bargaining representative can apply to the Fair Work Commission for dispute resolution assistance, and the commission can order certain actions.
• In Canada conciliation occurs for at least 60 days. The minister can then appoint a mediator, with 21 days of mediation required for industrial action to be protected.
• In Korea and Mexico undertaking a conciliation procedure before a strike is compulsory but the outcome is not binding. In Korea the procedure must be finished in 10-15 days.
• In Germany most collective bargaining rounds are resolved through voluntary arbitration (often prescribed by collective bargaining agreements).
Maintenance of activities
• In Australia the protected status of a strike can be suspended or terminated in certain circumstances, including significant economic harm to employers and employees and/or a threat to public health and safety. The Commission can impose a cooling-off period on protected action where a third party is significantly threatened.
• In Canada collective bargaining agreements may prescribe that certain activities must continue during a lockout or strike, in the interests of public health or safety.
Opt-outs
• In Germany individual firms can opt out from collective agreements under certain conditions. Opt-outs are typically negotiated at the company level.
• In Spain recent reforms allowed firms to more easily opt out of a collective agreement for objective economic, technical, production or organisational reasons. If employees’ representatives do not agree, the case can go to arbitration for a binding decision.
After negotiations
Peace clauses
• In Norway if a dispute concerns revision of a collective agreement, the validity of the agreement must have expired before industrial action can be taken.
• In Chile, Denmark, Germany and Sweden strikes are generally not allowed during the period covered by a bargaining agreement. In Germany “warning strikes” are allowed during negotiations but strikes are not allowed during arbitration.
South Africa ranks last in the world in terms of co-operation between labour and employers in the World Economic Forum’s Global Competitiveness Report. The recent spike in strikes dented business confidence, lowered investment, and is likely to increase the rate of labour substitution in production. Strikes that last longer often reflect competition between unions for members, with the associated high wage demands and disputes over representation leading to fractious wage negotiations. Measures to
28
increase the role of mediation and arbitration could secure a faster and more peaceful bargaining process. Recent amendments to the Labour Relations Act include allowing any union to request recognition, which should increase the representativeness of unions involved in negotiations, and giving powers to the Commission for Conciliation, Mediation and Arbitration to impose conciliation in certain circumstances. Building trust among negotiating partners is important for the acceptance of productivity-oriented medium-term wage agreements, which would make the introduction of new technologies needed to climb the value chain more acceptable. More procedural measures, like introducing secret ballots, as the government proposed in the 2012 Labour Relations Act Amendment Bill, would improve the representation of workers’ rights. Other possibilities would be to require social partners to enter the bargaining process with realistic demands (as in Australia) before protected industrial action can be permitted, or to provide training to bargaining partners, as in Canada (Table 2). Incentives to negotiate could be strengthened by specifying the circumstances in which an action’s protected status is retracted.
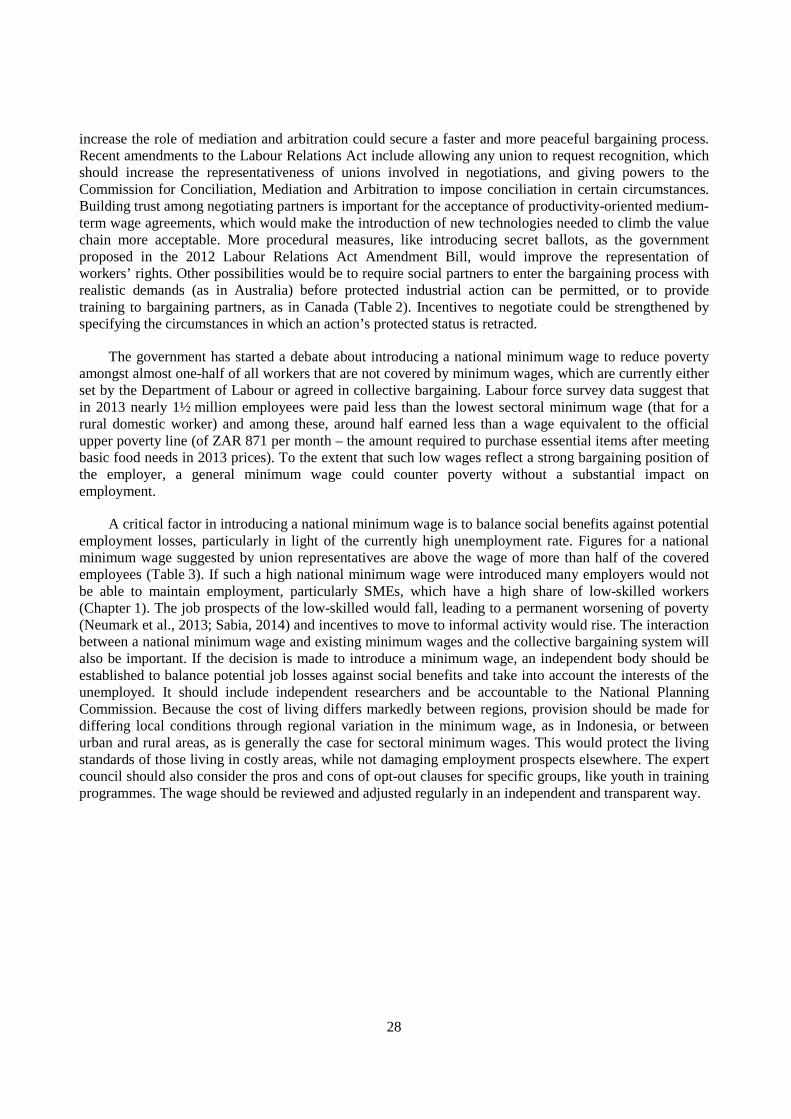
The government has started a debate about introducing a national minimum wage to reduce poverty amongst almost one-half of all workers that are not covered by minimum wages, which are currently either set by the Department of Labour or agreed in collective bargaining. Labour force survey data suggest that in 2013 nearly 1½ million employees were paid less than the lowest sectoral minimum wage (that for a rural domestic worker) and among these, around half earned less than a wage equivalent to the official upper poverty line (of ZAR 871 per month – the amount required to purchase essential items after meeting basic food needs in 2013 prices). To the extent that such low wages reflect a strong bargaining position of the employer, a general minimum wage could counter poverty without a substantial impact on employment.
A critical factor in introducing a national minimum wage is to balance social benefits against potential employment losses, particularly in light of the currently high unemployment rate. Figures for a national minimum wage suggested by union representatives are above the wage of more than half of the covered employees (Table 3). If such a high national minimum wage were introduced many employers would not be able to maintain employment, particularly SMEs, which have a high share of low-skilled workers (Chapter 1). The job prospects of the low-skilled would fall, leading to a permanent worsening of poverty (Neumark et al., 2013; Sabia, 2014) and incentives to move to informal activity would rise. The interaction between a national minimum wage and existing minimum wages and the collective bargaining system will also be important. If the decision is made to introduce a minimum wage, an independent body should be established to balance potential job losses against social benefits and take into account the interests of the unemployed. It should include independent researchers and be accountable to the National Planning Commission. Because the cost of living differs markedly between regions, provision should be made for differing local conditions through regional variation in the minimum wage, as in Indonesia, or between urban and rural areas, as is generally the case for sectoral minimum wages. This would protect the living standards of those living in costly areas, while not damaging employment prospects elsewhere. The expert council should also consider the pros and cons of opt-out clauses for specific groups, like youth in training programmes. The wage should be reviewed and adjusted regularly in an independent and transparent way.
29
Table 3. Scenarios for minimum monthly wages based on 2013 information
Threshold Threshold
monthly wage (ZAR)
Workers below the threshold:
Number As share of all
covered workers (%)
Current median monthly wage
Lowest sectoral minimum wage (domestic workers in rural areas) 1 491 1 400 000 15.0 820
50% of the median full-time wage (typical in OECD countries) 1 950 2 800 000 29.5 1 300
Minimum discussed by COSATU1 (“minimum living level” for a family of five with one worker)
4 759 5 200 000 54.9 1 865
Note: Figures in this table are for 2013 and based on the wage distribution of formal sector employees (including workers in the agricultural sector and private households earning above the sectoral minimum wage) in the 2013 Labour Market Dynamics database. Calculations are based on implied hourly earnings and then converted to monthly equivalents.
1. Congress of South African Trade Unions.
Source: COSATU (2015), “Provincial Public Hearings on the National Minimum Wage”, 18 February 2015, www.cosatu.org.za/show.php?ID=10042; Statistics South Africa; OECD calculations.
Recommendations to promote inclusive growth by improving the labour market
Key recommendations
• Establish a public employment service as a one-stop shop for job seekers to lower the cost of job search and hiring costs for employers, which would improve the matching of workers to jobs.
• Increase the role of mediation and arbitration to make wage negotiations less confrontational.
Other recommendations
• Appoint an independent body including researchers to advise on key decisions regarding the minimum wage, balancing potential employment losses against social benefits (including level, scope and opt-outs). If established, the minimum wage should be regularly reviewed and adjusted in an independent and transparent way.
30
Promoting greener growth through structural change towards a more knowledge based economy
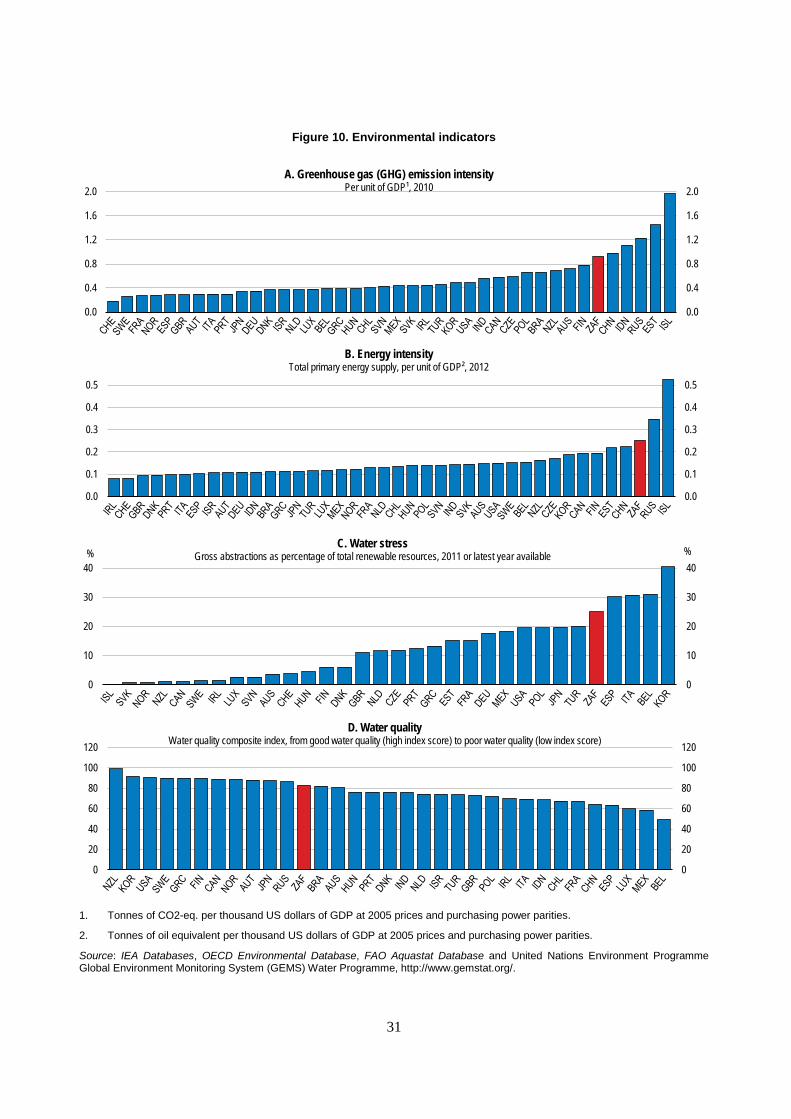
Environmental challenges such as climate change and water scarcity threaten the sustainability of economic growth (OECD, 2013a). South Africa is one of the most energy and greenhouse gas intensive economies (Figure 10), reflecting the huge minerals-energy complex, which relies heavily on domestic coal (Ashman et al., 2014). Coal accounts for around 70% of total energy supply, including over 90% of electricity generation and, in the form of synthetic fuels, 20% of transport fuels (IEA, 2014). Recognising the need to shift the economy’s growth path, the government is committed to reducing greenhouse gas emissions by 42% relative to a no-change scenario by 2025. The government’s Integrated Resource Plan aims to cap emissions from electricity and envisages that half of new generation capacity will come from renewable energy (Chapter 1). Nonetheless, policy still subsidises fossil fuel consumption through exemptions from the value-added tax, rebates on the fuel levy for certain industries and the free basic electricity allowance (OECD, 2015a). A (postponed) carbon tax is planned for 2016, which will cover almost all sectors, but under its current design and relatively modest effective tax rate, it is alone unlikely to achieve targeted emission reductions (Energy Research Centre, 2013). While its effectiveness could be enhanced (as discussed below), the introduction of this instrument is an important step towards a more sustainable growth path.
The main strategic objectives of the government’s Industrial Policy Action Plans, as stated, are diversification beyond commodity exports, moving towards a knowledge-based economy, promotion of a higher labour absorption capacity and overcoming the exclusion of disadvantaged people and regions. These objectives provide an opportunity to accelerate the transition to a greener economy (de Serres et al., 2010; OECD, 2011a). Some elements of the plans include expanding the local renewable energy industry and energy efficiency. But other initiatives, such as increasing downstream processing of minerals, are energy intensive. Renewable energy currently meets a small fraction of total electricity supply but the development of renewable energy supply capacity through an auction programme is proceeding rapidly, with projects totalling 5 200 MW approved since 2012. Experiences from other countries show that green growth can create business opportunities and jobs if relative prices provide the right incentives and if framework conditions encourage innovation (OECD, 2011b). In agriculture, for instance, uncertainty about property rights has reduced investment incentives on competitive and big commercial farms, while communal land suffers from over-use. Mines, on the other hand, exploit loopholes to avoid cleaning up the environmental damage from closed mines, and non-operating mines therefore continue to pose an environmental hazard (Eberhard, 2014).
South Africa has relatively little water, leading to a high abstraction rate (Figure 10, Panel C). Looking ahead, population and economic growth, as well as climate change, will further increase the demand for water (OECD, 2013a). Allocation of water-use licences, appropriate pricing and enforcement are all crucial policy instruments that have yet to be fully deployed (OECD, 2013a, 2013b; Chapter 1). Overall, water quality is comparatively high. However, localised pollution threatens contamination of groundwater by acidic water from flooded old mines, pits, stockpiles and tailings (“acid mine drainage”), reflecting uneven enforcement of the polluter-pays principle in mining (Leiman, 2014). In 2014 the Department of Water Affairs launched the first stage of a large project to clean this water, but funding issues mean that progress in this area has been slow. In other areas, such as agriculture, charging for the discharge of polluted water is yet to be implemented. Experience in countries with strict water pricing rules reveals that such a policy can increase value added per used water unit.
31
Figure 10. Environmental indicators
1. Tonnes of CO2-eq. per thousand US dollars of GDP at 2005 prices and purchasing power parities.
2. Tonnes of oil equivalent per thousand US dollars of GDP at 2005 prices and purchasing power parities.
Source: IEA Databases, OECD Environmental Database, FAO Aquastat Database and United Nations Environment Programme Global Environment Monitoring System (GEMS) Water Programme, http://www.gemstat.org/.
0.0
0.4
0.8
1.2
1.6
2.0
0.0
0.4
0.8
1.2
1.6
2.0A. Greenhouse gas (GHG) emission intensity
Per unit of GDP¹, 2010
0.0
0.1
0.2
0.3
0.4
0.5
0.0
0.1
0.2
0.3
0.4
0.5
B. Energy intensityTotal primary energy supply, per unit of GDP², 2012
0
10
20
30
40
0
10
20
30
40%%
C. Water stressGross abstractions as percentage of total renewable resources, 2011 or latest year available
0
20
40
60
80
100
120
0
20
40
60
80
100
120
D. Water qualityWater quality composite index, from good water quality (high index score) to poor water quality (low index score)
32
Tackling regional income inequality
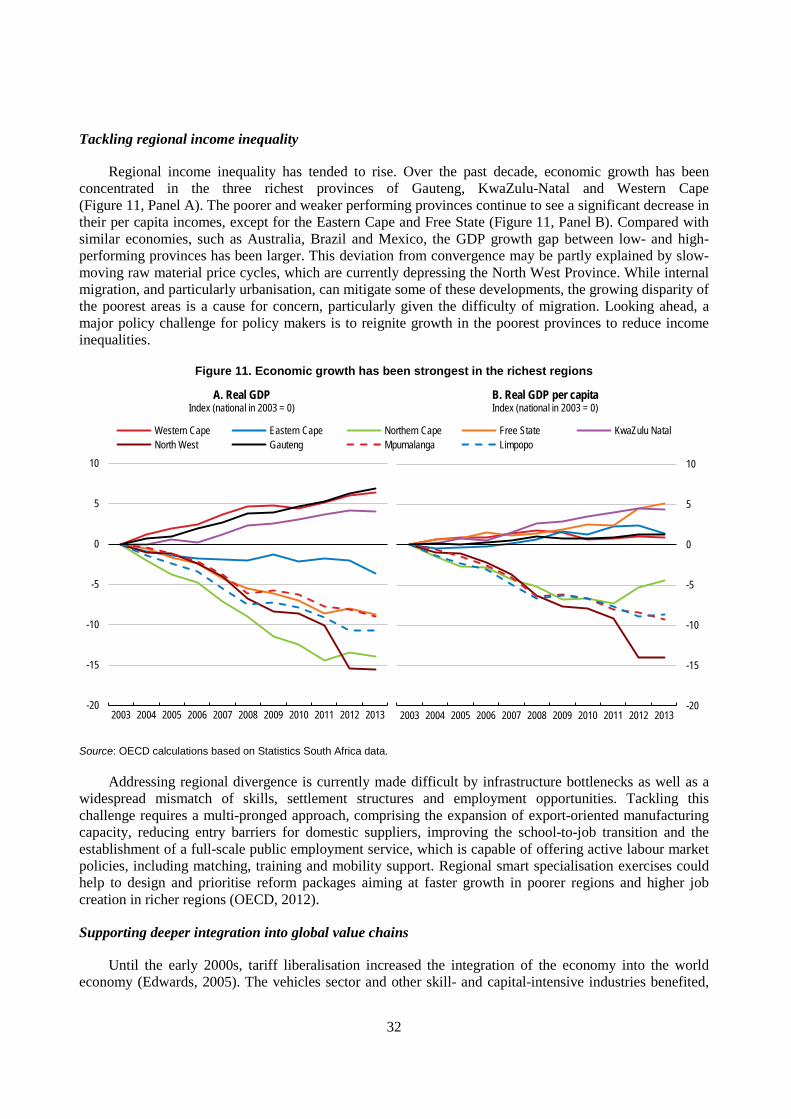
Regional income inequality has tended to rise. Over the past decade, economic growth has been concentrated in the three richest provinces of Gauteng, KwaZulu-Natal and Western Cape (Figure 11, Panel A). The poorer and weaker performing provinces continue to see a significant decrease in their per capita incomes, except for the Eastern Cape and Free State (Figure 11, Panel B). Compared with similar economies, such as Australia, Brazil and Mexico, the GDP growth gap between low- and high-performing provinces has been larger. This deviation from convergence may be partly explained by slow-moving raw material price cycles, which are currently depressing the North West Province. While internal migration, and particularly urbanisation, can mitigate some of these developments, the growing disparity of the poorest areas is a cause for concern, particularly given the difficulty of migration. Looking ahead, a major policy challenge for policy makers is to reignite growth in the poorest provinces to reduce income inequalities.
Figure 11. Economic growth has been strongest in the richest regions
Source: OECD calculations based on Statistics South Africa data.
Addressing regional divergence is currently made difficult by infrastructure bottlenecks as well as a widespread mismatch of skills, settlement structures and employment opportunities. Tackling this challenge requires a multi-pronged approach, comprising the expansion of export-oriented manufacturing capacity, reducing entry barriers for domestic suppliers, improving the school-to-job transition and the establishment of a full-scale public employment service, which is capable of offering active labour market policies, including matching, training and mobility support. Regional smart specialisation exercises could help to design and prioritise reform packages aiming at faster growth in poorer regions and higher job creation in richer regions (OECD, 2012).
Supporting deeper integration into global value chains
Until the early 2000s, tariff liberalisation increased the integration of the economy into the world economy (Edwards, 2005). The vehicles sector and other skill- and capital-intensive industries benefited,
-20
-15
-10
-5
0
5
10
2003 2004 2005 2006 2007 2008 2009 2010 2011 2012 2013
A. Real GDPIndex (national in 2003 = 0)
-20
-15
-10
-5
0
5
10
2003 2004 2005 2006 2007 2008 2009 2010 2011 2012 2013
B. Real GDP per capitaIndex (national in 2003 = 0)
-500502003 2006 2009 2012
Western Cape Eastern Cape Northern Cape Free State KwaZulu NatalNorth West Gauteng Mpumalanga Limpopo
33
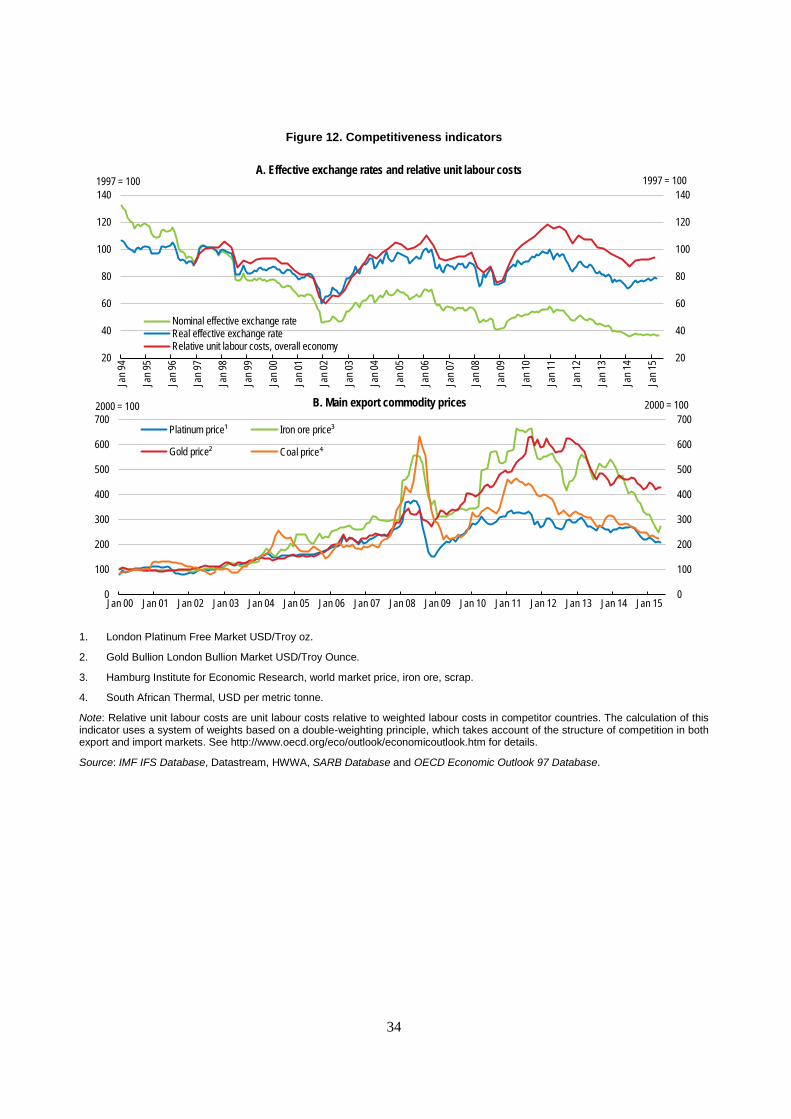
resulting in larger skill- and capital-intensive firms dominating exports. Fewer than 200 firms now account for almost 90% of manufactured exports (Farole et al., 2014). At the same time, goods from low-skilled and labour-intensive manufacturing industries (such as textiles and leather) were exposed to more intense competition, despite relatively high effective import tariffs (Edwards and Rankin, 2015; Edwards and Jenkins, 2013). High tariffs enabled relatively fast wage growth in these manufacturing sectors, reducing their cost competitiveness and ability to participate in global value chains (Edwards and Rankin, 2015). Bargaining councils and the legal extension of their wage agreements to all firms in an industry may have played a role in this development, as they seem to have led to relatively fast wage growth for low-skilled workers, putting smaller firms, which often use relatively labour-intensive and low-wage production techniques, at a disadvantage (Edwards and Rankin, 2015). External cost competitiveness as measured by relative unit labour costs weakened during the commodity price boom as wage growth outstripped productivity growth, although there has been some correction since 2011 (Figure 12) (Hodge, 2012).
Thus, while some sectors are relatively well integrated into global value chains, the economy’s overall participation is the lowest among the OECD and BRIICS countries; the contribution of the service sector to manufacturing exports is also on the low side (Figures 13 and 14). Areas where the economy is most integrated include mining, the automotive industry, regional finance and retail trade. Broadening integration to other industries is key to moving up the value-added production curve. Relying on a model of exploiting natural resources to boost employment corresponds poorly with declining employment in the increasingly capital-intensive mining sector. Rather, there is a need for better framework conditions to improve external cost competitiveness, for example by removing entry barriers, tackling infrastructure bottlenecks and securing a better alignment between wage and productivity growth.
34
Figure 12. Competitiveness indicators
1. London Platinum Free Market USD/Troy oz.
2. Gold Bullion London Bullion Market USD/Troy Ounce.
3. Hamburg Institute for Economic Research, world market price, iron ore, scrap.
4. South African Thermal, USD per metric tonne.
Note: Relative unit labour costs are unit labour costs relative to weighted labour costs in competitor countries. The calculation of this indicator uses a system of weights based on a double-weighting principle, which takes account of the structure of competition in both export and import markets. See http://www.oecd.org/eco/outlook/economicoutlook.htm for details.
Source: IMF IFS Database, Datastream, HWWA, SARB Database and OECD Economic Outlook 97 Database.
20
40
60
80
100
120
140
Jan 9
4
Jan 9
5
Jan 9
6
Jan 9
7
Jan 9
8
Jan 9
9
Jan 0
0
Jan 0
1
Jan 0
2
Jan 0
3
Jan 0
4
Jan 0
5
Jan 0
6
Jan 0
7
Jan 0
8
Jan 0
9
Jan 1
0
Jan 1
1
Jan 1
2
Jan 1
3
Jan 1
4
Jan 1
5 20
40
60
80
100
120
1401997 = 1001997 = 100
A. Effective exchange rates and relative unit labour costs
Nominal effective exchange rateReal effective exchange rateRelative unit labour costs, overall economy
0
100
200
300
400
500
600
700
0
100
200
300
400
500
600
700
Jan 00 Jan 01 Jan 02 Jan 03 Jan 04 Jan 05 Jan 06 Jan 07 Jan 08 Jan 09 Jan 10 Jan 11 Jan 12 Jan 13 Jan 14 Jan 15
2000 = 1002000 = 100 B. Main export commodity prices
Platinum price¹ Iron ore price³
Gold price² Coal price⁴
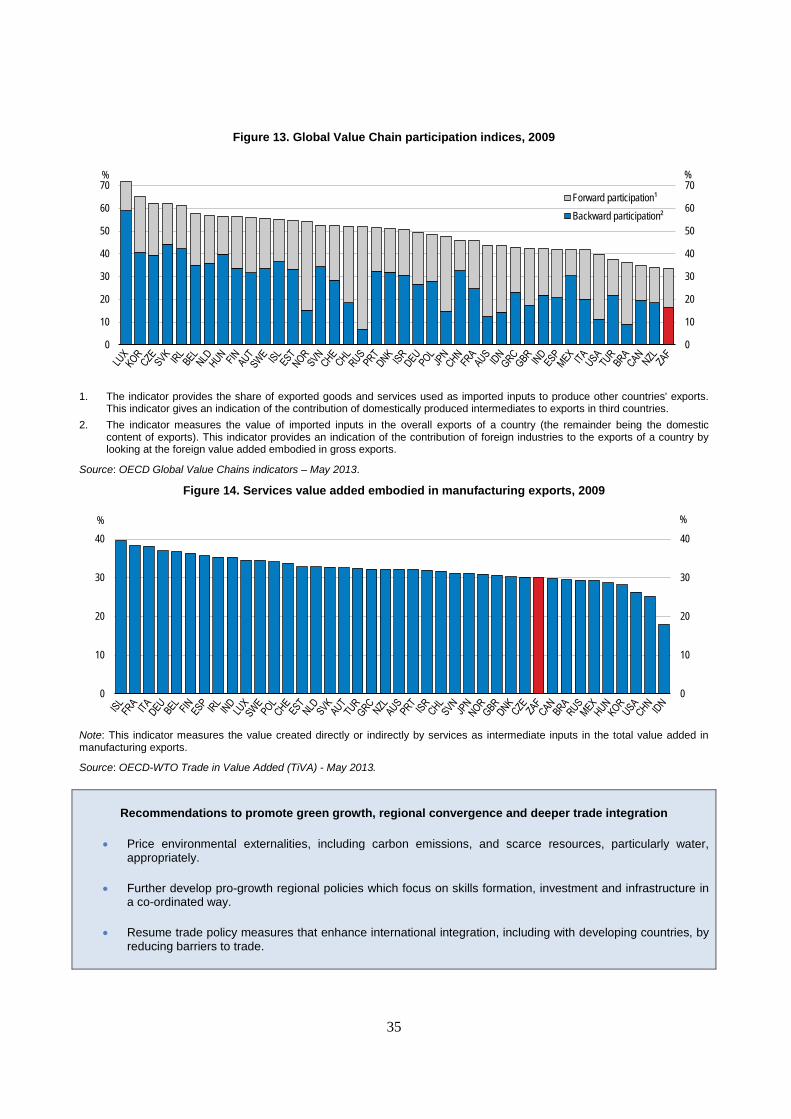
35
Figure 13. Global Value Chain participation indices, 2009
1. The indicator provides the share of exported goods and services used as imported inputs to produce other countries' exports.
This indicator gives an indication of the contribution of domestically produced intermediates to exports in third countries. 2. The indicator measures the value of imported inputs in the overall exports of a country (the remainder being the domestic
content of exports). This indicator provides an indication of the contribution of foreign industries to the exports of a country by looking at the foreign value added embodied in gross exports.
Source: OECD Global Value Chains indicators – May 2013.
Figure 14. Services value added embodied in manufacturing exports, 2009
Note: This indicator measures the value created directly or indirectly by services as intermediate inputs in the total value added in manufacturing exports.
Source: OECD-WTO Trade in Value Added (TiVA) - May 2013.
Recommendations to promote green growth, regional convergence and deeper trade integration
• Price environmental externalities, including carbon emissions, and scarce resources, particularly water, appropriately.
• Further develop pro-growth regional policies which focus on skills formation, investment and infrastructure in a co-ordinated way.
• Resume trade policy measures that enhance international integration, including with developing countries, by reducing barriers to trade.
0
10
20
30
40
50
60
70
0
10
20
30
40
50
60
70%%
Forward participation¹Backward participation²
0
10
20
30
40
0
10
20
30
40
%%
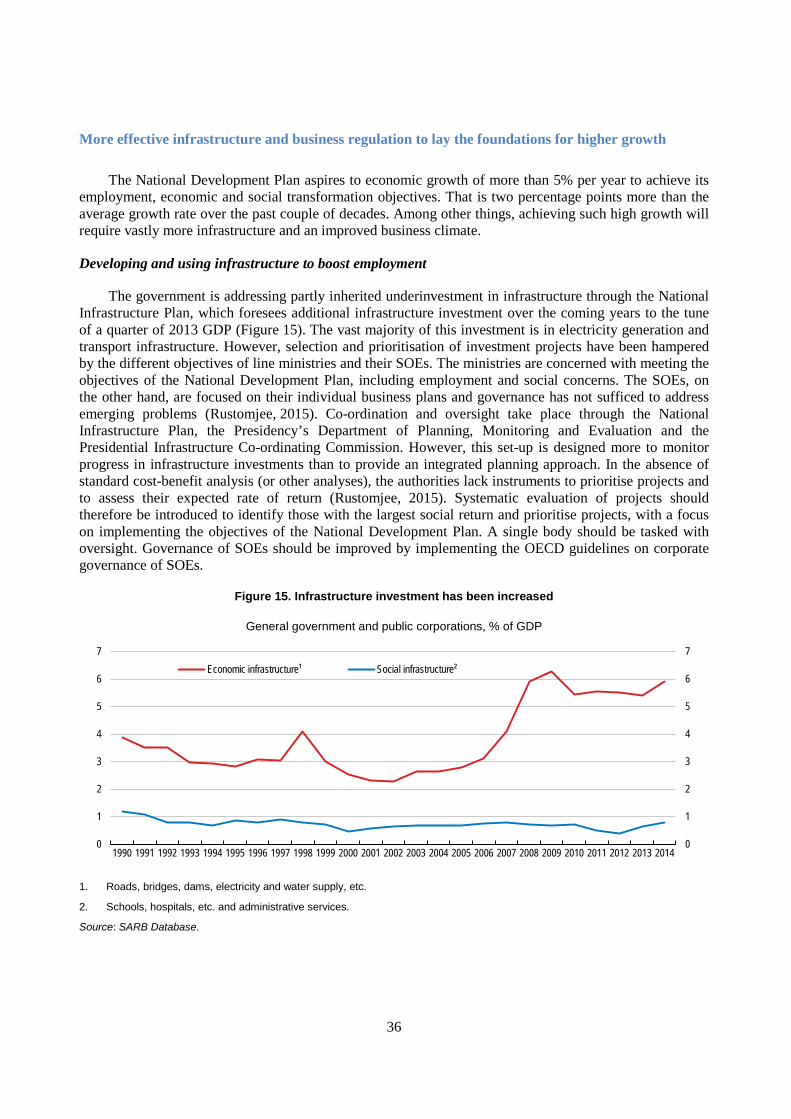
36
More effective infrastructure and business regulation to lay the foundations for higher growth
The National Development Plan aspires to economic growth of more than 5% per year to achieve its employment, economic and social transformation objectives. That is two percentage points more than the average growth rate over the past couple of decades. Among other things, achieving such high growth will require vastly more infrastructure and an improved business climate.
Developing and using infrastructure to boost employment
The government is addressing partly inherited underinvestment in infrastructure through the National Infrastructure Plan, which foresees additional infrastructure investment over the coming years to the tune of a quarter of 2013 GDP (Figure 15). The vast majority of this investment is in electricity generation and transport infrastructure. However, selection and prioritisation of investment projects have been hampered by the different objectives of line ministries and their SOEs. The ministries are concerned with meeting the objectives of the National Development Plan, including employment and social concerns. The SOEs, on the other hand, are focused on their individual business plans and governance has not sufficed to address emerging problems (Rustomjee, 2015). Co-ordination and oversight take place through the National Infrastructure Plan, the Presidency’s Department of Planning, Monitoring and Evaluation and the Presidential Infrastructure Co-ordinating Commission. However, this set-up is designed more to monitor progress in infrastructure investments than to provide an integrated planning approach. In the absence of standard cost-benefit analysis (or other analyses), the authorities lack instruments to prioritise projects and to assess their expected rate of return (Rustomjee, 2015). Systematic evaluation of projects should therefore be introduced to identify those with the largest social return and prioritise projects, with a focus on implementing the objectives of the National Development Plan. A single body should be tasked with oversight. Governance of SOEs should be improved by implementing the OECD guidelines on corporate governance of SOEs.
Figure 15. Infrastructure investment has been increased
General government and public corporations, % of GDP
1. Roads, bridges, dams, electricity and water supply, etc.
2. Schools, hospitals, etc. and administrative services.
Source: SARB Database.
0
1
2
3
4
5
6
7
1990 1991 1992 1993 1994 1995 1996 1997 1998 1999 2000 2001 2002 2003 2004 2005 2006 2007 2008 2009 2010 2011 2012 2013 2014 0
1
2
3
4
5
6
7Economic infrastructure¹ Social infrastructure²
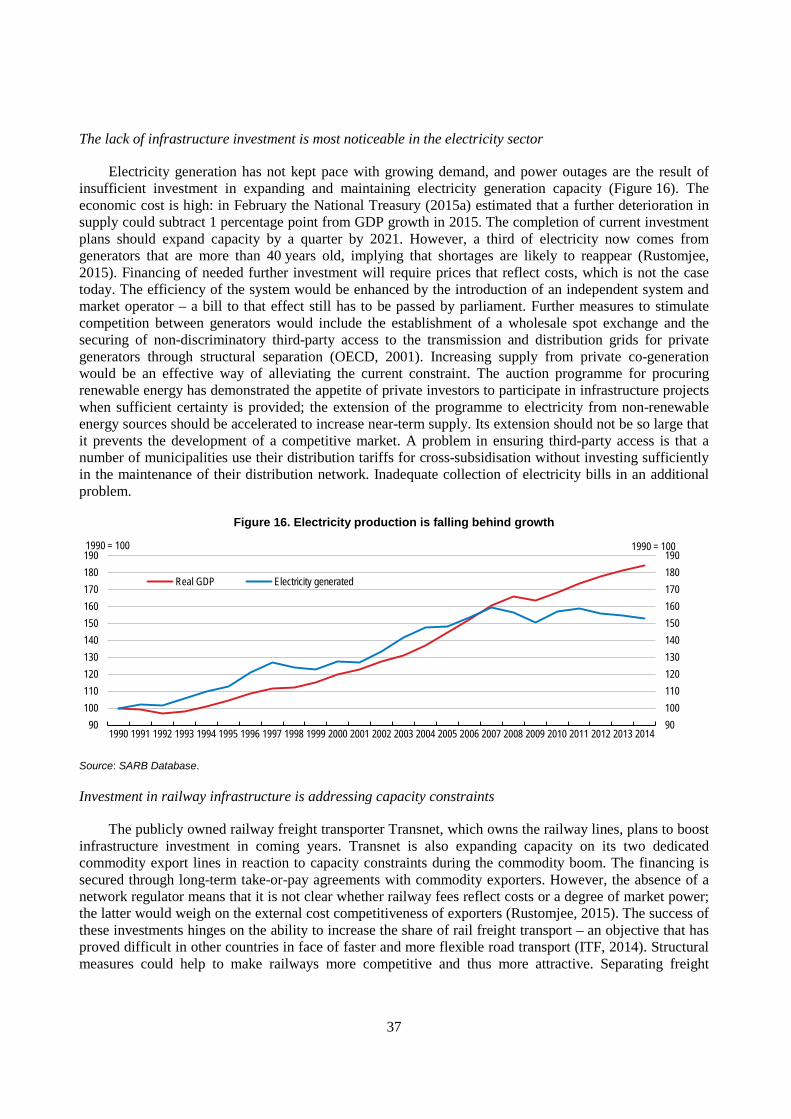
37
The lack of infrastructure investment is most noticeable in the electricity sector
Electricity generation has not kept pace with growing demand, and power outages are the result of insufficient investment in expanding and maintaining electricity generation capacity (Figure 16). The economic cost is high: in February the National Treasury (2015a) estimated that a further deterioration in supply could subtract 1 percentage point from GDP growth in 2015. The completion of current investment plans should expand capacity by a quarter by 2021. However, a third of electricity now comes from generators that are more than 40 years old, implying that shortages are likely to reappear (Rustomjee, 2015). Financing of needed further investment will require prices that reflect costs, which is not the case today. The efficiency of the system would be enhanced by the introduction of an independent system and market operator – a bill to that effect still has to be passed by parliament. Further measures to stimulate competition between generators would include the establishment of a wholesale spot exchange and the securing of non-discriminatory third-party access to the transmission and distribution grids for private generators through structural separation (OECD, 2001). Increasing supply from private co-generation would be an effective way of alleviating the current constraint. The auction programme for procuring renewable energy has demonstrated the appetite of private investors to participate in infrastructure projects when sufficient certainty is provided; the extension of the programme to electricity from non-renewable energy sources should be accelerated to increase near-term supply. Its extension should not be so large that it prevents the development of a competitive market. A problem in ensuring third-party access is that a number of municipalities use their distribution tariffs for cross-subsidisation without investing sufficiently in the maintenance of their distribution network. Inadequate collection of electricity bills in an additional problem.
Figure 16. Electricity production is falling behind growth
Source: SARB Database.
Investment in railway infrastructure is addressing capacity constraints
The publicly owned railway freight transporter Transnet, which owns the railway lines, plans to boost infrastructure investment in coming years. Transnet is also expanding capacity on its two dedicated commodity export lines in reaction to capacity constraints during the commodity boom. The financing is secured through long-term take-or-pay agreements with commodity exporters. However, the absence of a network regulator means that it is not clear whether railway fees reflect costs or a degree of market power; the latter would weigh on the external cost competitiveness of exporters (Rustomjee, 2015). The success of these investments hinges on the ability to increase the share of rail freight transport – an objective that has proved difficult in other countries in face of faster and more flexible road transport (ITF, 2014). Structural measures could help to make railways more competitive and thus more attractive. Separating freight
90100110120130140150160170180190
1990 1991 1992 1993 1994 1995 1996 1997 1998 1999 2000 2001 2002 2003 2004 2005 2006 2007 2008 2009 2010 2011 2012 2013 201490
100110120130140150160170180190
1990 = 1001990 = 100
Real GDP Electricity generated
38
service provision from rail infrastructure could ensure that users are financing investment in infrastructure, but could reduce technical efficiency.
A single transport economic regulator is expected to be established in 2017 and in the interim the Ministry of Transport is addressing urgent issues, such as tariff and access disputes. Introducing a regulator to secure non-discriminatory third-party access to the rail infrastructure would enhance competition, promote efficient operations (including access to the rail network for passenger rail) and lower freight costs to businesses (OECD, 2013c). In a number of other resource-rich countries, such dedicated goods railway lines are private. South Africa could consider whether to adopt a similar approach, particularly as there are no obvious co-ordination problems that require public ownership. Such a measure would encourage a faster adjustment of railway capacity in response to changes in demand than the current planning approach, provided that regulations can be put in place to prevent abuse of market power.
Improving public transportation
Part of the unemployment problem in poor urban neighbourhoods stems from under-developed commuter links. These neighbourhoods can be characterised into three (often mixed) types of urban housing: i) older townships with some access to public railway transport; ii) newer government-provided subsidised housing which tends to be constructed relatively far from economic centres and have little public commuter transport; and iii) informal settlements that are closer to economic centres and have no connection with public urban transport. An insufficient supply of public bus and rail transport services means that poor households tend to commute by time-consuming walking or are rationed by the high costs of minibus services (World Bank, 2014b).
Low-cost public rail commuter transport is provided by PRASA (an SOE) which has not adjusted the geographical reach of its services to take account of changes in spatial use around urban areas. The company is tripling its investment programme, mostly aimed at replacing rolling stock and upgrading stations (Rustomjee, 2015) in order to reverse past underinvestment and the associated decline of service quality. Thus, there is no change in the geographical reach in the current investment programme. Moreover, access to the Transnet-owned railway network is an issue for PRASA in the absence of a sector regulator as Transnet gives preferential access to its own transport services. Better integration with local needs would require an increasing role for local governments as purchasers of commuter services. Local governments can apply to the Minister of Transport to take over the contracting and regulatory functions. So far bus contracting has been devolved to the provinces, while the City of Cape Town has applied for the regulatory function. Further devolution of transport functions, as called for by the National Development Plan, should be accompanied by the necessary development of administrative capacity.
The gap left by the limited availability of public rail transport has been filled by often informally regulated private minibus services offering commuter services to inhabitants of many poor neighbourhoods (Figure 17). The fleet of minibuses has the flexibility to cover many pick-up points without additional infrastructure investments in rail and bus stations. However, the cost for low-income workers is often prohibitively high. Local governments are engaging more with minibus operators, with the rolling out of regular bus services in larger cities (so-called Bus Rapid Transit systems) sometimes involving minibus operators (as shareholders) and drivers. Commuter services could be tendered from formal regulation-compliant minibus operators to integrate minibuses into the system, providing lower-cost commuting solutions and better co-ordination with the planning- and investment-intensive new bus and train services.
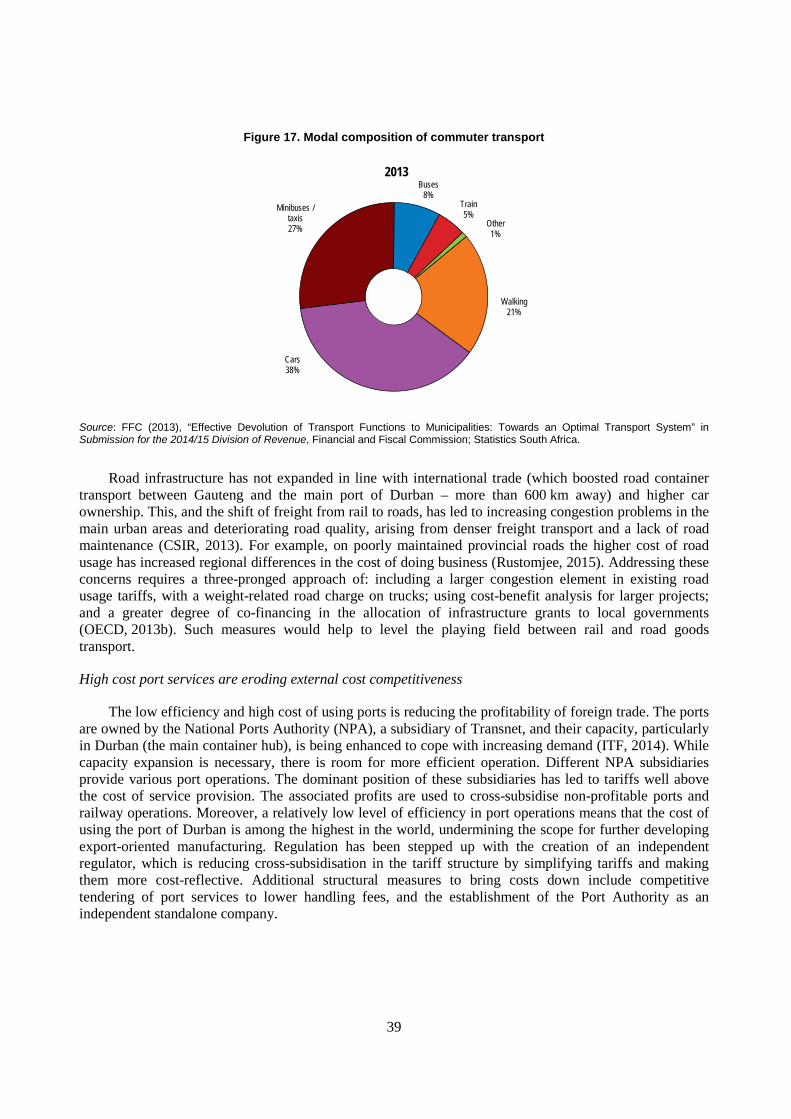
39
Figure 17. Modal composition of commuter transport
Source: FFC (2013), “Effective Devolution of Transport Functions to Municipalities: Towards an Optimal Transport System” in Submission for the 2014/15 Division of Revenue, Financial and Fiscal Commission; Statistics South Africa.
Road infrastructure has not expanded in line with international trade (which boosted road container transport between Gauteng and the main port of Durban – more than 600 km away) and higher car ownership. This, and the shift of freight from rail to roads, has led to increasing congestion problems in the main urban areas and deteriorating road quality, arising from denser freight transport and a lack of road maintenance (CSIR, 2013). For example, on poorly maintained provincial roads the higher cost of road usage has increased regional differences in the cost of doing business (Rustomjee, 2015). Addressing these concerns requires a three-pronged approach of: including a larger congestion element in existing road usage tariffs, with a weight-related road charge on trucks; using cost-benefit analysis for larger projects; and a greater degree of co-financing in the allocation of infrastructure grants to local governments (OECD, 2013b). Such measures would help to level the playing field between rail and road goods transport.
High cost port services are eroding external cost competitiveness
The low efficiency and high cost of using ports is reducing the profitability of foreign trade. The ports are owned by the National Ports Authority (NPA), a subsidiary of Transnet, and their capacity, particularly in Durban (the main container hub), is being enhanced to cope with increasing demand (ITF, 2014). While capacity expansion is necessary, there is room for more efficient operation. Different NPA subsidiaries provide various port operations. The dominant position of these subsidiaries has led to tariffs well above the cost of service provision. The associated profits are used to cross-subsidise non-profitable ports and railway operations. Moreover, a relatively low level of efficiency in port operations means that the cost of using the port of Durban is among the highest in the world, undermining the scope for further developing export-oriented manufacturing. Regulation has been stepped up with the creation of an independent regulator, which is reducing cross-subsidisation in the tariff structure by simplifying tariffs and making them more cost-reflective. Additional structural measures to bring costs down include competitive tendering of port services to lower handling fees, and the establishment of the Port Authority as an independent standalone company.
Other1%
Walking21%
Cars38%
Minibuses / taxis27%
Buses8%
Train5%
2013
40
Telecommunications could support growth more
Twenty years ago, the telecommunication system was characterised by very low fixed-line coverage. In the mid-1990s, the mobile phone market was opened up and the five operators achieved nearly full 3G coverage for most of the population, placing South Africa ahead of many OECD countries in terms of liberalisation and technology. However, further liberalisation has stalled in recent years. The full benefits of competition-enabling regulation, such as supporting consumers’ ability to switch providers, have not materialised owing to the entrenched position of the incumbents. As a result, prices and service quality compare less favourably than in advanced OECD countries, raising the cost of telecommunications to the detriment of businesses and consumer welfare.
Compared with other countries, there are considerably fewer resellers of mobile phone services (so-called MVNOs) and the roll-out of more modern 4G networks has not yet started due to the cancellation of 4G mobile licence auctions. As a result, the economy has slow internet connections by international standards while fixed-line penetration remains very low (Akamai, 2015). Recent regulatory action includes a lowering of termination rates (charged for the use networks) to European levels (ICASA, 2014). However, promoting competition requires structural measures, including the finalisation of the spectrum auction for 4G licences, steps to facilitate the entry of resellers of mobile phone services and further privatisation.
Better business regulation could boost growth and job creation
The current administration has identified SMEs as key to bolstering growth and employment and in 2014 established a Ministry of Small Business Development. Since the international crisis started in 2008, however, SMEs have reduced employment by more than larger firms have expanded theirs. Research from OECD countries highlights the role of young firms as job creators both through new start-ups and firm growth; young SMEs generated 42% of new jobs on average over 2001-11 even though they represented 17% of employment (Criscuolo, et al., 2014). Businesses and entrepreneurs that would like to create and expand SMEs are faced with numerous barriers across a wide range of areas, including extensive business regulation and insufficient infrastructure. These are relatively more costly for SMEs as they lack the administrative capacity and internal flexibility of large firms. In particular, high levels of regulation and labour market institutions that tend to focus on addressing the concerns of large unions and large firms limit SMEs’ flexibility.
The OECD’s product market regulation indicator suggests that regulatory restrictions are still relatively high. This includes a high level of government involvement in the economy, tariff barriers, restrictions on foreign direct investment, complex rules for licences and permits, obstacles to the creation of start-ups, and protection of existing businesses from competition (particularly in the network industries). All of these issues are particularly detrimental to the creation and operation of SMEs (Figure 18). In addition, businesses are faced with frequent regulatory changes that increase uncertainty, with surveys indicating that only about 40% of SMEs are confident that they know all the relevant regulations (Darroll, 2015). Policy action in this area should focus on reducing the overall regulatory burden and creating a more stable regulatory framework to facilitate forward planning. Standard application of regulatory impact assessments to new laws and rules could be helpful in securing cost-efficient and effective regulation. Lighter or simplified regulations could be experimented with in special economic zones located close to poor urban areas, to help attract businesses to where labour supply is abundant, overcoming spatial mismatches between housing and economic activity (World Bank, 2014b).
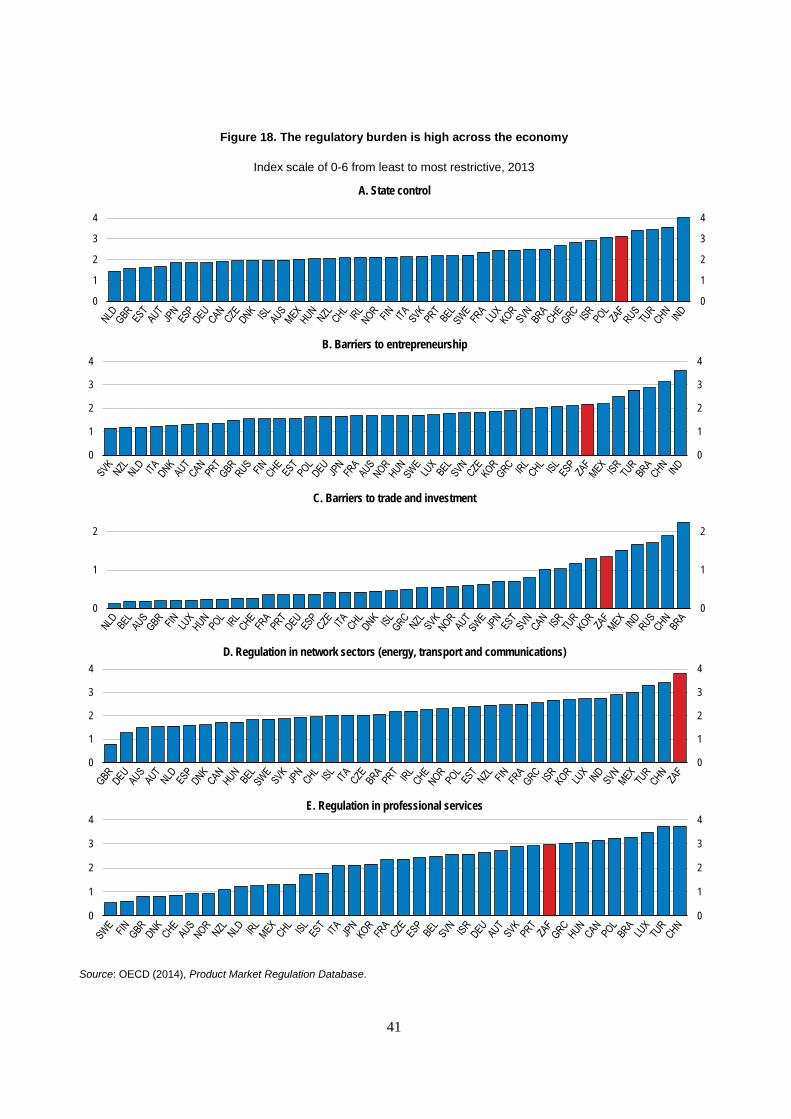
41
Figure 18. The regulatory burden is high across the economy
Index scale of 0-6 from least to most restrictive, 2013
Source: OECD (2014), Product Market Regulation Database.
E. Regulation in professional services
A. State control
B. Barriers to entrepreneurship
C. Barriers to trade and investment
D. Regulation in network sectors (energy, transport and communications)
0
1
2
3
4
0
1
2
3
4
0
1
2
3
4
0
1
2
3
4
0
1
2
0
1
2
0
1
2
3
4
0
1
2
3
4
0
1
2
3
4
0
1
2
3
4
42
The competition policy framework is broadly at par with best practices in the OECD, and enforcement action has been ramped up in recent years. Amended legislation on leniency policy and criminalisation of cartel activity is still not fully operational, as in a number of OECD countries. However, the Competition Law includes a particularly wide-ranging and all-encompassing public interest clause. This clause assigns to competition policy multiple objectives in addition to ensuring economic efficiency, such as maintaining employment and supporting black economic empowerment. This is particularly problematic in merger cases as there is no clear method for balancing the public interest and competition assessments (OECD, 2008a; Smith, 2015). Furthermore, such other policy objectives can often be achieved more effectively by alternative means than limiting competition. An OECD Peer Review of Competition Policy or similar expert review could be helpful in terms of identifying clear rules for the application of merger control and other aspects of the competition framework.
Labour market regulation in South Africa reduces employment turnover and wage flexibility, which limits the ability of SMEs to expand and adjust to the more intensive competition that arises from regulatory changes and lower trade barriers. Few SMEs in the manufacturing sector produce intermediate inputs for the domestic market and many exporters rely on imported intermediate inputs (Edwards and Rankin, 2015). Surveys point to the problems of the strict labour laws, with more than a third of SMEs reporting that this framework (and particularly bargaining councils) represents the largest obstacle to new hiring (SBP, 2013). Moreover, wage outcomes from the bargaining councils tend be relatively high for low-skilled workers. According to one estimate, the presence of bargaining councils reduces employment by 8-13% in affected industries, with losses concentrated among SMEs, which rely heavily on low-skilled workers (Magruder, 2012). Labour market reform to support creation and expansion of SMEs could include the introduction of full or partial opt-outs from sector wage agreements and the reorganisation of bargaining councils to ensure broader coverage.
Recommendations to tackle infrastructure bottlenecks and improve business regulation
Key recommendations
• Choose infrastructure investments with the highest social returns to facilitate prioritisation and cost control.
• In network industries, complete the introduction of independent regulators and charge them with ensuring non-discriminatory third-party access. Secure additional electricity generation capacity by accelerating the independent power producer programme and facilitating private co-generation.
• Improve employment opportunities by expanding affordable public transport, including integrating minibuses into the public transport system, and building new, denser settlements closer to economic centres.
• Support SMEs by increasing the use of regulatory impact analysis in order to reduce the regulatory burden, eliminating entry barriers, and promoting competition.
• Systematically identify and eliminate competition-hampering regulation. Privatise state-owned companies, such as telecoms, that are in markets with a sufficient degree of competition.
Other recommendations
• Experiment with support schemes and regulation for special economic zones to move jobs to poor urban neighbourhoods.
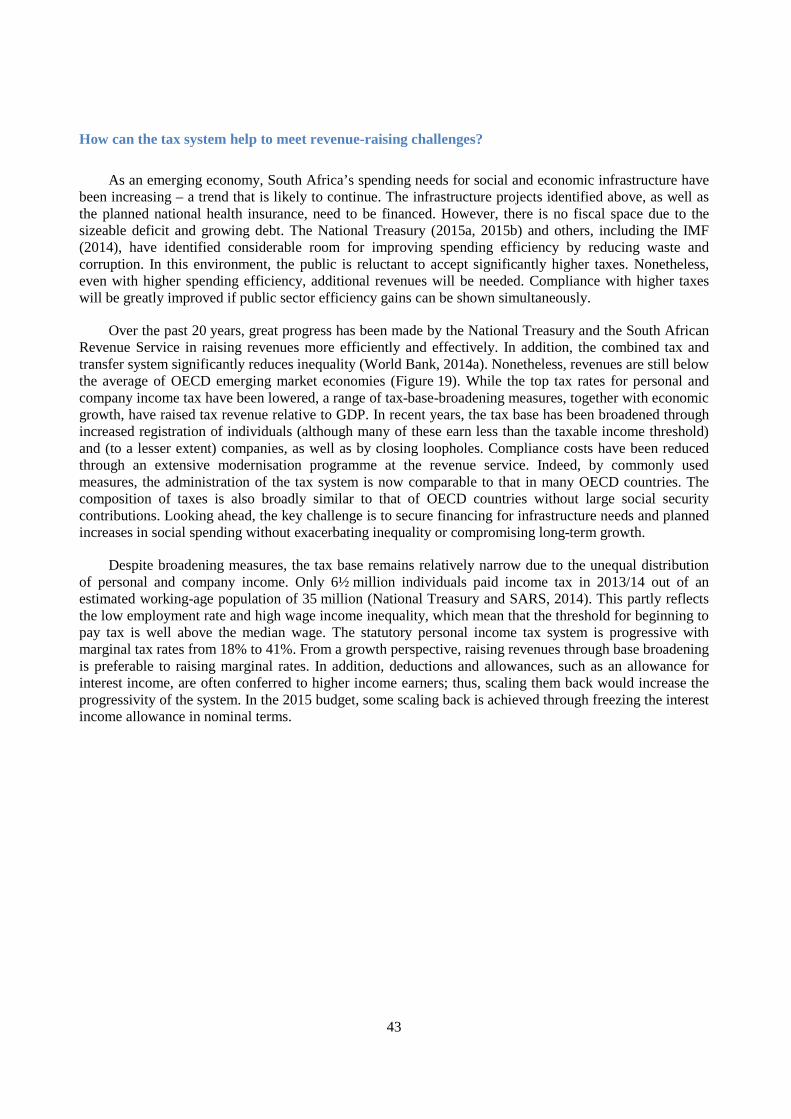
43
How can the tax system help to meet revenue-raising challenges?
As an emerging economy, South Africa’s spending needs for social and economic infrastructure have been increasing – a trend that is likely to continue. The infrastructure projects identified above, as well as the planned national health insurance, need to be financed. However, there is no fiscal space due to the sizeable deficit and growing debt. The National Treasury (2015a, 2015b) and others, including the IMF (2014), have identified considerable room for improving spending efficiency by reducing waste and corruption. In this environment, the public is reluctant to accept significantly higher taxes. Nonetheless, even with higher spending efficiency, additional revenues will be needed. Compliance with higher taxes will be greatly improved if public sector efficiency gains can be shown simultaneously.
Over the past 20 years, great progress has been made by the National Treasury and the South African Revenue Service in raising revenues more efficiently and effectively. In addition, the combined tax and transfer system significantly reduces inequality (World Bank, 2014a). Nonetheless, revenues are still below the average of OECD emerging market economies (Figure 19). While the top tax rates for personal and company income tax have been lowered, a range of tax-base-broadening measures, together with economic growth, have raised tax revenue relative to GDP. In recent years, the tax base has been broadened through increased registration of individuals (although many of these earn less than the taxable income threshold) and (to a lesser extent) companies, as well as by closing loopholes. Compliance costs have been reduced through an extensive modernisation programme at the revenue service. Indeed, by commonly used measures, the administration of the tax system is now comparable to that in many OECD countries. The composition of taxes is also broadly similar to that of OECD countries without large social security contributions. Looking ahead, the key challenge is to secure financing for infrastructure needs and planned increases in social spending without exacerbating inequality or compromising long-term growth.
Despite broadening measures, the tax base remains relatively narrow due to the unequal distribution of personal and company income. Only 6½ million individuals paid income tax in 2013/14 out of an estimated working-age population of 35 million (National Treasury and SARS, 2014). This partly reflects the low employment rate and high wage income inequality, which mean that the threshold for beginning to pay tax is well above the median wage. The statutory personal income tax system is progressive with marginal tax rates from 18% to 41%. From a growth perspective, raising revenues through base broadening is preferable to raising marginal rates. In addition, deductions and allowances, such as an allowance for interest income, are often conferred to higher income earners; thus, scaling them back would increase the progressivity of the system. In the 2015 budget, some scaling back is achieved through freezing the interest income allowance in nominal terms.
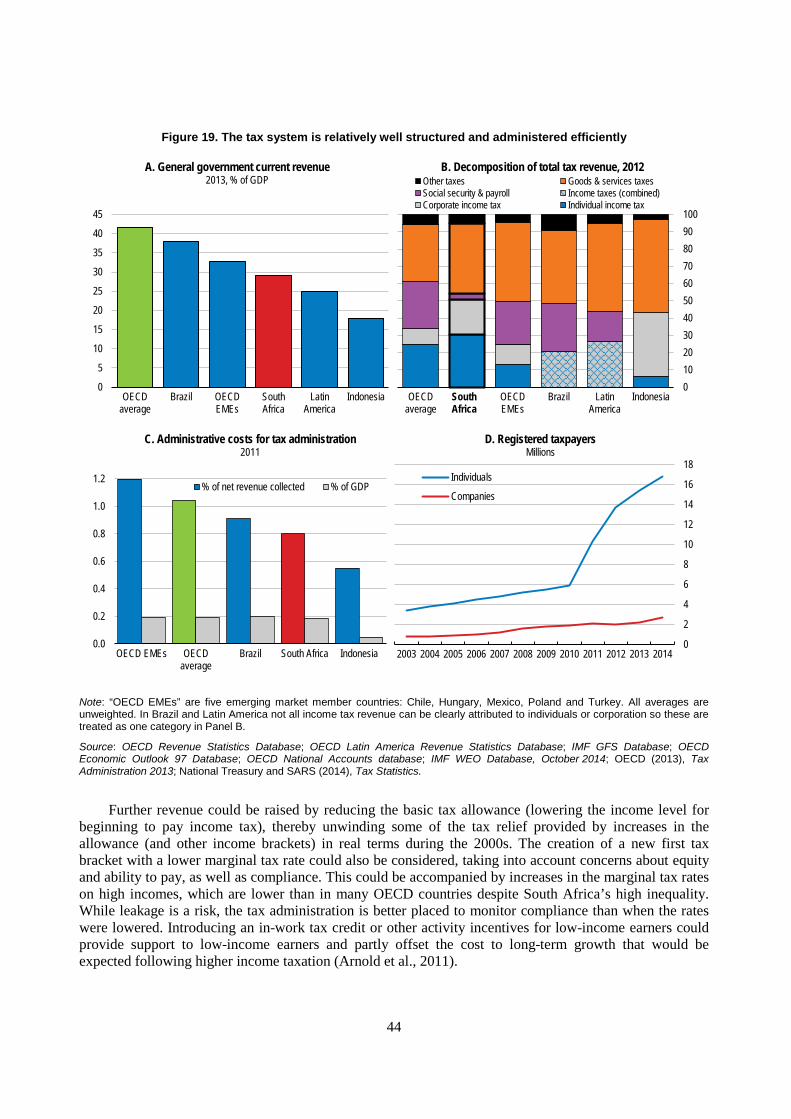
44
Figure 19. The tax system is relatively well structured and administered efficiently
Note: “OECD EMEs” are five emerging market member countries: Chile, Hungary, Mexico, Poland and Turkey. All averages are unweighted. In Brazil and Latin America not all income tax revenue can be clearly attributed to individuals or corporation so these are treated as one category in Panel B.
Source: OECD Revenue Statistics Database; OECD Latin America Revenue Statistics Database; IMF GFS Database; OECD Economic Outlook 97 Database; OECD National Accounts database; IMF WEO Database, October 2014; OECD (2013), Tax Administration 2013; National Treasury and SARS (2014), Tax Statistics.
Further revenue could be raised by reducing the basic tax allowance (lowering the income level for beginning to pay income tax), thereby unwinding some of the tax relief provided by increases in the allowance (and other income brackets) in real terms during the 2000s. The creation of a new first tax bracket with a lower marginal tax rate could also be considered, taking into account concerns about equity and ability to pay, as well as compliance. This could be accompanied by increases in the marginal tax rates on high incomes, which are lower than in many OECD countries despite South Africa’s high inequality. While leakage is a risk, the tax administration is better placed to monitor compliance than when the rates were lowered. Introducing an in-work tax credit or other activity incentives for low-income earners could provide support to low-income earners and partly offset the cost to long-term growth that would be expected following higher income taxation (Arnold et al., 2011).
0
5
10
15
20
25
30
35
40
45
OECDaverage
Brazil OECDEMEs
SouthAfrica
LatinAmerica
Indonesia
A. General government current revenue2013, % of GDP
0102030405060708090100
OECDaverage
OECDEMEs
Brazil LatinAmerica
Indonesia
B. Decomposition of total tax revenue, 2012Other taxes Goods & services taxesSocial security & payroll Income taxes (combined)Corporate income tax Individual income tax
0.0
0.2
0.4
0.6
0.8
1.0
1.2
OECD EMEs OECDaverage
Brazil South Africa Indonesia
C. Administrative costs for tax administration2011
% of net revenue collected % of GDP
0
2
4
6
8
10
12
14
16
18
2003 2004 2005 2006 2007 2008 2009 2010 2011 2012 2013 2014
D. Registered taxpayersMillions
Individuals
Companies
South Africa
45
Company taxation is high relative to OECD countries but lower than in non-OECD emerging economies. This partly reflects the statutory tax rate of 28%, compared with an OECD average of 25%. Given the negative effects of high statutory tax rates on productivity and investment, the focus should be on base broadening. Effective tax rates are reduced by numerous tax incentives, many of which appear to be used for industrial policy with little cost-benefit analysis and contribute to large differences in marginal effective tax rates on investment across industries (World Bank, 2015). Each incentive scheme should be examined and those which are not cost effective should be removed. The simplified tax regimes for small businesses (with tax rates increasing from 0% to 28% and accelerated asset write-offs) and microbusinesses are also considered ineffective (Davis Tax Committee, 2014).
As the level of company tax payments does not appear to be a main concern of SMEs (Herrington et al., 2013), other targeted reforms – such as reduced red tape – would likely be more useful than special tax regimes (Chapter 1). Rather than using a turnover tax to reduce compliance costs for microbusinesses and lower the barrier to formalising, VAT registration could be encouraged in conjunction with simplified processes for payment. Currently, the turnover threshold for compulsory VAT registration is much higher than in any OECD country (on a PPP-adjusted basis) but many firms register voluntarily. More focus should be put on reducing compliance costs, which are comparatively high (FIAS, 2007). In Chile and Mexico all firms must register but there are special regimes and support for SMEs. At the other end of the distribution of firms, base erosion and profit shifting are considered important issues, despite continuous amendments to existing legislation. International co-operation on this issue should continue.
Special taxation arrangements apply to the mining sector. Previously low marginal effective rates have been boosted by the 2010 introduction of a national royalty regime (World Bank, 2015). The new regime applies a profit-linked royalty rate (of between 0.5% and 7%) to gross sales, linking rates to commodity prices in order to capture some of the windfall gains in a commodity boom, while maintaining some revenue stability and investment incentives. The new regime has boosted the tax take from the industry, despite profit-linked royalty rates being depressed by the fall in commodity prices. On the other hand, OECD calculations suggest that the highest royalty rate would not have been applied during the height of the commodity boom. It seems there is scope to raise the effective royalty rate as the system matures but the need for regulatory stability, as discussed above, means that disruptive changes to the regime should be avoided. However, in the nascent oil and gas industries consideration should be given to a profit-based tax on resource rents, as adopted in Alaska, Algeria, and China, for example.
The VAT system is the second largest source of government revenue. Consumption taxes are relatively efficient taxes and are therefore less harmful for economic growth (Arnold et al., 2011). The current regime is well designed – it has few items with preferential treatment (exemptions or a zero-rate), a relatively low rate and is mildly progressive (World Bank, 2014a). However, such exemptions and zero-rates are not well targeted, as the associated tax savings disproportionately accrue to better-off households, including for many food items (National Treasury, 2007; Jansen and Caltiz, 2015). Further revenues could be raised within the existing system by reducing leakage. Nevertheless, the rate may need to be raised to finance large spending plans. Additional consumption tax revenues could be raised via higher excise duties on items like alcohol and tobacco, although there is a risk of revenue leakage from informal cross-border trading. Likewise, the list of luxury goods subject to excise should be updated to reflect changes in consumption patterns.
The import tariff regime should also be reviewed. Despite substantial trade liberalisation in the 1990s, the process of tariff reduction has largely stalled (Figure 20). As highlighted in OECD (2008b), consumer goods face higher duties than upstream goods, raising effective rates of protection and the final price to consumers. A substantial part of this burden falls on low-income households via the high tariffs on clothing and footwear – which have relatively large weights in their consumption basket. The OECD Economic Assessment of 2008 recommended reducing the level and dispersion of import tariffs to encourage
46
competition and long-term productivity growth (OECD, 2008b). As most tariff revenues collected are passed on to other members of the Southern African Customs Union through a fixed formula, the net budgetary effect would be small.
Figure 20. Tariff barriers are still relatively high for consumer goods
Weighted average tariff by type of good
Source: UNCTAD Trade Analysis Information System (TRAINS).
Property tax revenues represent only a small share of total revenues. They mostly comprise municipal taxes on land and buildings, in addition to less important transaction-based taxes. National legislation provides a framework for municipal taxes but their rates vary considerably. Greater use of this source of tax revenue would provide a number of advantages. It is one of the least harmful taxes for growth (Arnold et al., 2011) and can be equity enhancing. It could also allow municipalities to reduce their reliance on fees from electricity and water distribution. Higher recurrent property taxes could also allow distortionary transaction-based taxes to be scaled back. However, severe deficiencies in administrative capacity at the local level limit the feasibility of increasing tax rates in the near term. In particular, valuation rolls are not up to date, collecting property taxes appears to be difficult, and perceptions of corruption at the local government level are high. Therefore as a first step, problems at the local level should be addressed through capacity building and law enforcement.
Environmentally related taxes have increased in scope and size but could be expanded further to help secure a more sustainable growth path. Overall, carbon emissions are hardly taxed, reflecting that taxes on transport fuels cover only 10% of emissions, but electricity from non-renewable sources is subject to a low rate of tax and almost half of emissions are not taxed (OECD, 2015b). The government should proceed with plans to introduce a carbon tax to secure equal abatement costs across activities (thus replacing other taxes), as recommended in the 2013 Economic Survey (OECD, 2013a). Implementation should ensure that the rate rises gradually to effective levels. At the same time, exemptions should be scaled down slowly to avoid disruptive changes to the cost of production for heavy polluters. Such a process will slowly align South Africa’s climate change policy stance with those in most OECD countries. This would also gradually reduce the economy’s dependence on energy- and carbon-intensive production, while making production more labour intensive (Alton et al., 2014). As in the case of removing VAT exemptions, measures to compensate the poorest households could include cash transfers or vouchers . The tax system could also be used to address other environmental problems, in particular by implementing plans to apply polluter-pays principles to water discharged in the agriculture and mining sectors and continuing the development of a levy to help fund the clean-up of past pollution in the form of acid water from mines (OECD, 2013a, 2013b).
0
2
4
6
8
10
12
14
16
KOR CHL MEX TUR NOR CHE ISL CAN ISR EU JPN AUS USA NZL ARG BRA RUS COL IND ZAF CHN IDN SAU0
2
4
6
8
10
12
14
16MFN weighted average tariff, %, 2013 or latest
All products Consumer goods
47
Recommendations to meet revenue-raising challenges
Key recommendations
• Broaden personal and corporate income tax bases by reducing deductions, credits and allowances. Increase tax rates on higher incomes.
• Broaden the VAT base and strengthen VAT compliance. Proceed with the introduction of a carbon tax.
Other recommendations
• Increase property taxation by building capacity at the municipal government level.
• Reduce the complexity of the tariff regime and investigate areas where tariff reductions on consumer goods are possible.
• Increase reliance on environmentally related taxes.
48
BIBLIOGRAPHY
Akamai (2015), The State of the Internet: Q3 2014 Report, www.stateoftheinternet.com.
Alton, T., C. Arndt, R. Davies, F. Hartley, K. Makrelov, J. Thurlow, and D. Ubogu (2014), “Introducing carbon taxes in South Africa”, Applied Energy, No. 116, pp. 344-354.
Andrew Levy (2014), Wage Settlement Report September 2014.
Arnold, J. M., B. Brys, C. Heady, Å. Johansson, C. Schwellnus, and L. Vartia (2011), “Tax Policy for Economic Recovery and Growth”, The Economic Journal, Vol. 121, pp. F59–F80.
Ashman, S., B. Fine, V. Padachayee and J. Sender (2014), “The Political Economy of Restructuring in South Africa”, in Bhorat et al., 2014.
Bhorat, H., A. Hirsch, R. Kanbur and M. Ncube, eds. (2014), The Oxford Companion to the Economics of South Africa, Oxford University Press, Oxford.
Criscuolo, C., P. N. Gal and C. Menon (2014), “The Dynamics of Employment Growth: New Evidence from 18 Countries”, OECD Science, Technology and Industry Policy Papers, No. 14, OECD Publishing, Paris.
CSIR (2013), 10th Annual State of Logistics Survey for South Africa, www.csir.co.za/sol.
Darroll, C. (2015), “Barriers to SMEs in South Africa”, OECD Economics Department Working Papers, OECD Publishing, Paris, forthcoming.
Davis Tax Committee (2014), “Small and Medium Enterprises: Taxation Considerations”, Interim Report, July 2014.
de Serres, A., F. Murtin and G. Nicoletti (2010), “A Framework for Assessing Green Growth Policies”, OECD Economics Department Working Papers, No. 774, OECD Publishing, Paris.
Eberhard, R. (2014), “The Politics and Economics of Water in South Africa – 1994-2013”, in Bhorat et al., 2014.
Edwards, L. (2005), “Has South Africa Liberalised its Trade”, South African Journal of Economics, Vol. 73, No. 4, pp. 754-775.
Edwards, L. and R. Jenkins (2013), “The Impact of Chinese Import Penetration on the South African Manufacturing Sector”, Southern Africa Labour and Development Research Unit Working Paper Series, No. 102, SALDRU, University of Cape Town, Cape Town.
Edwards, L. and N. Rankin (2015), “Labour Market Policies, Firm Dynamics and Export Performance in South Africa”, OECD Economics Department Working Papers, OECD Publishing, Paris, forthcoming.
Energy Research Centre (2013), “Comments on the Carbon Tax Policy Paper Issued by the National Treasury in May 2013”, University of Cape Town.
Farole, T., T. Naughtin and N. Rankin (2014), “South Africa’s Super-exporters”, Manufacturing Led Growth for Employment and Equality International Conference, Johannesburg, www.developmentdialogue.co.za.
49
Field, S., P. Musset and J.L. Álvarez-Galván (2014), “A Skills Beyond School Review of South Africa”, OECD Reviews of Vocational Education and Training, OECD Publishing, Paris.
FIAS (2007), “Tax Compliance Burden for Small Businesses: A Survey of Tax Practitioners”, World Bank Group, Washington, DC.
Finn, A., M. Leibbrandt, and M. Oosthuizen (2014), “Poverty, Inequality, and Prices in Post-apartheid South Africa”, WIDER Working Papers, No. 2014/127, UNU-WIDER.
Herrington, M., J. Kew and P. Kew (2015), 2014 GEM South Africa Report, Global Enterprise Monitor.
Hodge, D. (2012), “The Exchange Rate, Dutch Disease and Manufacturing in South Africa: What do the Data Say?”, ERSA Working Paper, No. 281.
ICASA (2014), “Call Termination Regulations, 2014”, Independent Communications Authority of South Africa, Pretoria.
IEA (2014), World Energy Outlook 2014, International Energy Agency Publications, Paris.
IMF (2014), “South Africa: Selected Issues Paper”, IMF Country Report, No. 14/339, International Monetary Fund, Washington, DC.
ITF (2014), “The Competitiveness of Ports in Emerging Markets – the Case of Durban, South Africa”, International Transport Forum, OECD Publishing, Paris.
Jansen A. and E. Calitz, (2015), “Reconsidering the Effectiveness of Zero-rating of Value-added Tax in South Africa”, REDI3x3 Working Papers, forthcoming.
Leiman, T. (2014), “Environmental Policy and the State in Post-apartheid South Africa”, in Bhorat et al., 2014.
Magruder, J. (2012), “High Unemployment Yet Few Small Firms: The Role of Centralised Bargaining in South Africa”, American Economic Journal: Applied Economics, Vol. 4, No. 3, pp. 138-166.
National Planning Commission (2011), National Development Plan 2030: Executive Summary, Pretoria.
National Treasury (2007), “The VAT Treatment of Merit Goods and Services”, National Treasury Working Paper, No. T16/05, National Treasury, Pretoria.
National Treasury (2014), Budget Review 2014, Pretoria.
National Treasury (2015a), Budget Review 2015, Pretoria.
National Treasury (2015b), 2015 Public Sector Supply Chain Management Review, Pretoria.
National Treasury and SARS (2014), 2014 Tax Statistics, National Treasury and South African Revenue Service, Pretoria.
Neumark, D., J.M.I. Salas and W. Wascher (2013), “Revisiting the Minimum Wage-Employment Debate: Throwing Out the Baby with the Bathwater?”, IZA Discussion Paper Series, No. 7166.
OECD (2001), www.oecd.org/daf/competition/recommendationconcerningstructuralseparationinregulatedindustries.
50
OECD (2008a), Policy Roundtable on Market Studies, OECD Publishing, Paris.
OECD (2008b), Economic Assessment of South Africa, OECD Publishing, Paris.
OECD (2010), OECD Economic Surveys: South Africa 2010, OECD Publishing, Paris.
OECD (2011a), Towards Green Growth, OECD Publishing, Paris.
OECD (2011b), Fostering Innovation for Green Growth, OECD Green Growth Studies, OECD Publishing, Paris.
OECD (2012), Promoting Growth in all Regions, OECD Publishing, Paris.
OECD (2013a), OECD Economic Surveys: South Africa 2013, OECD Publishing, Paris.
OECD (2013b), Environmental Performance Review of South Africa, OECD Publishing, Paris.
OECD (2013c), Policy Roundtables – Recent Developments in Rail Transportation Services, 2013, OECD Publishing, Paris.
OECD (2015a), Inventory of Estimated Budgetary Support and Tax Expenditures for Fossil Fuels – 2015 Edition, OECD Publishing, Paris, forthcoming.
OECD (2015b), Taxing Energy Use 2015: OECD and Selected Partner Economies, OECD Publishing, Paris.
Rustomjee, Z. (2015), “Infrastructure in South Africa”, OECD Economics Department Working Papers, OECD Publishing, Paris, forthcoming.
Sabia, J.J. (2014), “The Effects of Minimum Wages over the Business Cycle”, Journal of Labor Research, Vol. 35, No. 3, pp. 227-245.
Sachs, M. (2014), “South Africa’s Long-term Fiscal Choices”, Fiscal Policy Workshop, 5 November 2014. National Treasury.
SARB (2014a), “Quarterly Economic Review”, Quarterly Bulletin, December 2014, South African Reserve Bank.
SARB (2014b), “Statement of the Monetary Policy Committee”, 17 July 2014.
SBP (2013), “Effect of Red Tape on Small Firms in South Africa”, SME Growth Index Thematic Paper, SBP, Johannesburg.
Smith, P. (2015), “Africa: Public Interest Factors in Competition Decisions”, in The African and Middle Eastern Antitrust Review, 2015.
Statistics South Africa (2014), Poverty Trends in South Africa - an Examination of Absolute Poverty between 2006 and 2011.
World Bank (2014a), “South Africa Economic Update: Fiscal Policy and Redistribution in an Unequal Society”, South Africa Economic Update, No. 6, World Bank Group, Washington, DC.
51
World Bank (2014b), Economics of South African Townships – Special Focus on Diepsloot, World Bank Group, Washington DC.
World Bank (2015), “Sector Study of Effective Tax Burden and Effectiveness of Investment Incentives in South Africa – Part 1”, World Bank Group, Washington, DC.
52
ANNEX
Progress in main structural reforms
This annex summarises key recommendations made in previous Surveys and actions taken since the OECD Economic Survey of South Africa published in March 2013.
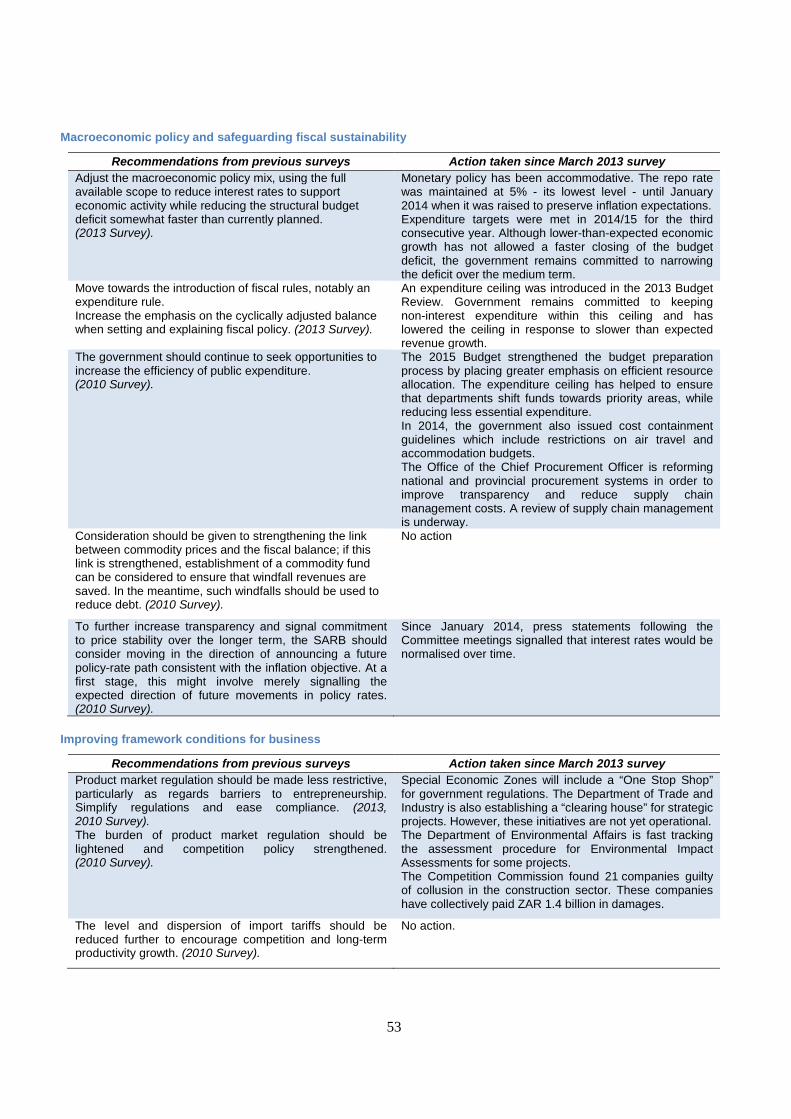
53
Macroeconomic policy and safeguarding fiscal sustainability
Recommendations from previous surveys Action taken since March 2013 survey Adjust the macroeconomic policy mix, using the full available scope to reduce interest rates to support economic activity while reducing the structural budget deficit somewhat faster than currently planned. (2013 Survey).
Monetary policy has been accommodative. The repo rate was maintained at 5% - its lowest level - until January 2014 when it was raised to preserve inflation expectations. Expenditure targets were met in 2014/15 for the third consecutive year. Although lower-than-expected economic growth has not allowed a faster closing of the budget deficit, the government remains committed to narrowing the deficit over the medium term.
Move towards the introduction of fiscal rules, notably an expenditure rule. Increase the emphasis on the cyclically adjusted balance when setting and explaining fiscal policy. (2013 Survey).
An expenditure ceiling was introduced in the 2013 Budget Review. Government remains committed to keeping non-interest expenditure within this ceiling and has lowered the ceiling in response to slower than expected revenue growth.
The government should continue to seek opportunities to increase the efficiency of public expenditure. (2010 Survey).
The 2015 Budget strengthened the budget preparation process by placing greater emphasis on efficient resource allocation. The expenditure ceiling has helped to ensure that departments shift funds towards priority areas, while reducing less essential expenditure. In 2014, the government also issued cost containment guidelines which include restrictions on air travel and accommodation budgets. The Office of the Chief Procurement Officer is reforming national and provincial procurement systems in order to improve transparency and reduce supply chain management costs. A review of supply chain management is underway.
Consideration should be given to strengthening the link between commodity prices and the fiscal balance; if this link is strengthened, establishment of a commodity fund can be considered to ensure that windfall revenues are saved. In the meantime, such windfalls should be used to reduce debt. (2010 Survey).
No action
To further increase transparency and signal commitment to price stability over the longer term, the SARB should consider moving in the direction of announcing a future policy-rate path consistent with the inflation objective. At a first stage, this might involve merely signalling the expected direction of future movements in policy rates. (2010 Survey).
Since January 2014, press statements following the Committee meetings signalled that interest rates would be normalised over time.
Improving framework conditions for business
Recommendations from previous surveys Action taken since March 2013 survey Product market regulation should be made less restrictive, particularly as regards barriers to entrepreneurship. Simplify regulations and ease compliance. (2013, 2010 Survey). The burden of product market regulation should be lightened and competition policy strengthened. (2010 Survey).
Special Economic Zones will include a “One Stop Shop” for government regulations. The Department of Trade and Industry is also establishing a “clearing house” for strategic projects. However, these initiatives are not yet operational. The Department of Environmental Affairs is fast tracking the assessment procedure for Environmental Impact Assessments for some projects. The Competition Commission found 21 companies guilty of collusion in the construction sector. These companies have collectively paid ZAR 1.4 billion in damages.
The level and dispersion of import tariffs should be reduced further to encourage competition and long-term productivity growth. (2010 Survey).
No action.
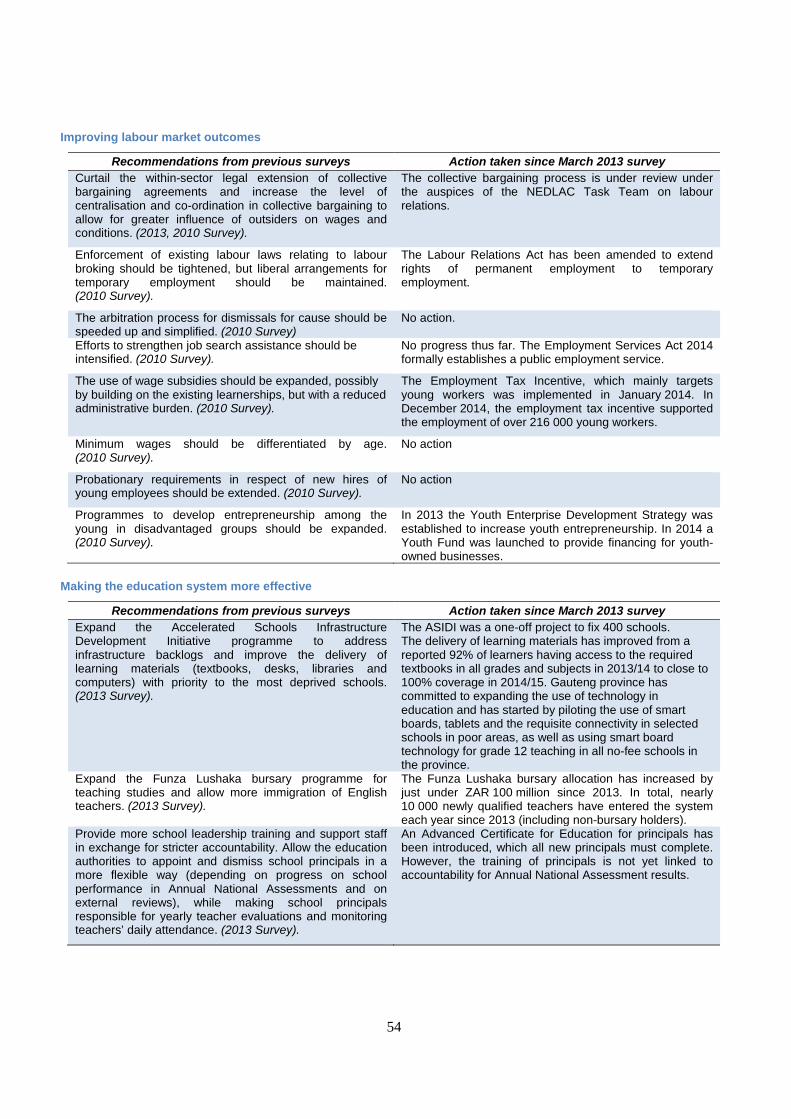
54
Improving labour market outcomes
Recommendations from previous surveys Action taken since March 2013 survey Curtail the within-sector legal extension of collective bargaining agreements and increase the level of centralisation and co-ordination in collective bargaining to allow for greater influence of outsiders on wages and conditions. (2013, 2010 Survey).
The collective bargaining process is under review under the auspices of the NEDLAC Task Team on labour relations.
Enforcement of existing labour laws relating to labour broking should be tightened, but liberal arrangements for temporary employment should be maintained. (2010 Survey).
The Labour Relations Act has been amended to extend rights of permanent employment to temporary employment.
The arbitration process for dismissals for cause should be speeded up and simplified. (2010 Survey)
No action.
Efforts to strengthen job search assistance should be intensified. (2010 Survey).
No progress thus far. The Employment Services Act 2014 formally establishes a public employment service.
The use of wage subsidies should be expanded, possibly by building on the existing learnerships, but with a reduced administrative burden. (2010 Survey).
The Employment Tax Incentive, which mainly targets young workers was implemented in January 2014. In December 2014, the employment tax incentive supported the employment of over 216 000 young workers.
Minimum wages should be differentiated by age. (2010 Survey).
No action
Probationary requirements in respect of new hires of young employees should be extended. (2010 Survey).
No action
Programmes to develop entrepreneurship among the young in disadvantaged groups should be expanded. (2010 Survey).
In 2013 the Youth Enterprise Development Strategy was established to increase youth entrepreneurship. In 2014 a Youth Fund was launched to provide financing for youth-owned businesses.
Making the education system more effective
Recommendations from previous surveys Action taken since March 2013 survey Expand the Accelerated Schools Infrastructure Development Initiative programme to address infrastructure backlogs and improve the delivery of learning materials (textbooks, desks, libraries and computers) with priority to the most deprived schools. (2013 Survey).
The ASIDI was a one-off project to fix 400 schools. The delivery of learning materials has improved from a reported 92% of learners having access to the required textbooks in all grades and subjects in 2013/14 to close to 100% coverage in 2014/15. Gauteng province has committed to expanding the use of technology in education and has started by piloting the use of smart boards, tablets and the requisite connectivity in selected schools in poor areas, as well as using smart board technology for grade 12 teaching in all no-fee schools in the province.
Expand the Funza Lushaka bursary programme for teaching studies and allow more immigration of English teachers. (2013 Survey).
The Funza Lushaka bursary allocation has increased by just under ZAR 100 million since 2013. In total, nearly 10 000 newly qualified teachers have entered the system each year since 2013 (including non-bursary holders).
Provide more school leadership training and support staff in exchange for stricter accountability. Allow the education authorities to appoint and dismiss school principals in a more flexible way (depending on progress on school performance in Annual National Assessments and on external reviews), while making school principals responsible for yearly teacher evaluations and monitoring teachers’ daily attendance. (2013 Survey).
An Advanced Certificate for Education for principals has been introduced, which all new principals must complete. However, the training of principals is not yet linked to accountability for Annual National Assessment results.
55
Recommendations from previous surveys Action taken since March 2013 survey Empower the independent federal evaluation unit NEEDU, join the Programme for International Student Assessment (PISA) and the Teaching and Learning International Survey (TALIS) and undertake an OECD Review of Evaluation and Assessment Frameworks for Improving School Outcomes. (2013 Survey).
The governance structure of NEEDU has not yet been finalised.
Foster on-the-job training with tax credits and simplify administrative procedures for hiring trainees from FET colleges. Widen the scope for apprenticeship programmes organised by public-private partnerships. (2013 Survey).
The employment tax incentive introduced in 2014 has reached around 200 000 employees and about 23 500 employers. In 2014, 85 900 occupationally-directed (apprenticeship or learnership) opportunities in collaboration with TVET colleges, SETAs and employers were created. An additional 37 423 learning programme opportunities in the form of 3 380 apprenticeships, 4 513 bursaries and 29 530 learnerships will be further provided by the SETAs. A total of 123 of the 212 targeted FET college partnerships with industry for 2014 have been established.
Improvements in basic education should be prioritised, even though the contribution to raising employment will be small in the near term. (2010 Survey).
There was a ZAR 2.1 billion increase in the fiscal allocation to the department of basic education in the 2014/15 budget but it was mainly for improvement in conditions of service for employees. Other initiatives prioritised by the sector include the Annual National Assessments, expanding workbooks, school infrastructure, the National Education Collaboration Trust.
Climate change mitigation and green growth
Recommendations from previous surveys Action taken since March 2013 survey In designing climate change mitigation policies, favour broad and easy-to-implement instruments with limited demands on administrative capacity, such as a simple carbon tax. (2013, 2010 Survey).
The National Treasury published the carbon tax policy paper for stakeholder consultation in 2013. A paper on carbon offsets was published in April 2014 for public comment. Draft legislation is due to be released in mid-2015 and the scheme is to be implemented in 2016. The Energy Efficiency Savings Tax Incentive was implemented in November 2013 and rewards businesses who can prove energy efficiency savings. More than 100 companies have registered and the incentive is being adjusted to make it more effective.
Reduce implicit and explicit subsidies for energy and coal consumption, and use other instruments, such as cash transfers or supply vouchers, for protecting the poor. (2013, 2010 Survey).
The 2015 Budget announced a reduction in the diesel fuel levy refunds for certain industries from 1 April 2016 and a review of the diesel refund system. The free basic electricity/energy allowance for low-income households remains in place.
Electricity prices should be allowed to rise further, in order to fully cover capital costs. Favourable pricing arrangements for large industrial users of electricity should be renegotiated. (2010 Survey).
The regulator, NERSA, has approved above inflation increases in electricity prices in recent years.
Accelerate the allocation of water-use licenses and ensure that charges for water reflect supply costs and scarcity. (2013 Survey).
The Strategic Integrated Project (SIP) 18 was launched in June 2013. It aims to address water supply and sanitation backlogs, including fast-tracking the issuing of water licences. The Department of Water Affairs and Sanitation received 599 water use license applications since April 2014, of which 184 have been finalised and 415 are in progress.
Greater use should be made of other green taxes, such as fuel levies. (2010 Survey).
The 2015 Budget raised fuel levies to around 40% of the retail fuel price. A levy on waste from tyres is in process and is expected to be implemented during 2015.
56
Other
Recommendations from previous surveys Action taken since March 2013 survey Further urbanisation should be facilitated to mitigate spatial mismatches: urban transport should be developed and affordable urban housing expanded. (2010 Survey).
Public transport continues to expand with an emphasis on integrated planning. Major metropolitan areas have invested in bus rapid transit systems. Operations on Phase 1 of Rea Vaya (Johannesburg) and My CiTi (Cape Town) services were expanded and the Tshwane Rapid Transit (A Re Yeng) started operating in 2014. The National Urban Reconstruction Housing Agency provided funding for 14 projects to the value of approximately ZAR 873 million for affordable housing (translating into 1 619 sites and services in 2013/14).
Access to credit for business start-ups should be improved, for example by easing collateral constraints. (2010 Survey).
A Department of Small Business Development was established in 2014 to support small businesses but has yet to announce measures to assist in accessing credit. The venture capital company scheme has been amended, effective from 1 April 2015, to make the tax deductions more valuable.
Remaining restrictions on capital outflows should be removed and replaced by prudential regulation. (2010 Survey).
The exchange control manual is being simplified and the following restrictions on individuals and institutions have been relaxed: • Authorised dealers may process corporate
investment up to ZAR 1 billion annually (from ZAR 500 million) and may carry forward any unused allowance.
• Residents’ foreign capital allowance increased from ZAR 4 million to ZAR 10 million per calendar year or upon emigration, or ZAR 20 million per family unit.
• The subcategories under the individual single discretionary allowance are removed and the annual ZAR 1 million allowances may be used for any legal purpose abroad.
Pension arrangements should be designed with a view to increasing private saving, in conjunction with other goals. Compulsory pension saving by employees is one promising way of doing this, while positive results might also be achieved via compulsory enrolment with an option to withdraw, particularly in combination with a “save more tomorrow” mechanism. (2010 Survey).
The taxation of pension contributions has been substantially simplified and harmonised across savings vehicles. The new treatment of retirement savings will be implemented on 1 March 2016. All contributions to retirement saving will be deductible up to 27.5% of the greater of remuneration or taxable income, with a cap of ZAR 350 000. The current pre-retirement preservation proposal is under discussion with social partners at NEDLAC. Once discussions have concluded, the proposal will be implemented following final consultations. Draft legislation on pre-retirement preservation is expected in 2015. Compulsory enrolment in a pension scheme is part of the broader social security reforms which is still under discussion at NEDLAC.

57

58
Thematic chapters

59
60
Chapter 1
More effective infrastructure and business regulation
Growth has been insufficient to lower the persistently high level of unemployment, particularly among black low-skilled workers. Achieving a sustained increase in growth requires a stronger performance of the business sector. This chapter analyses how such a stronger performance can by supported by better infrastructure and business regulation. Infrastructure investment is being increased to address bottlenecks in many network sectors. However, a lack of an integrated planning approach may hamper optimal project selection. Moreover, there seems to be little focus on applying economic instruments to use infrastructure more effectively. Small and medium sized enterprises are key to raise private sector employment. However, they are faced with a large range of barriers that hinders their creation and expansion, including high levels of regulation and skill shortages. In addition, their growth potential is hampered by spatial use of land that limits economic opportunities and induces high commuting costs, particularly for low-wage workers, which reduces access to jobs.
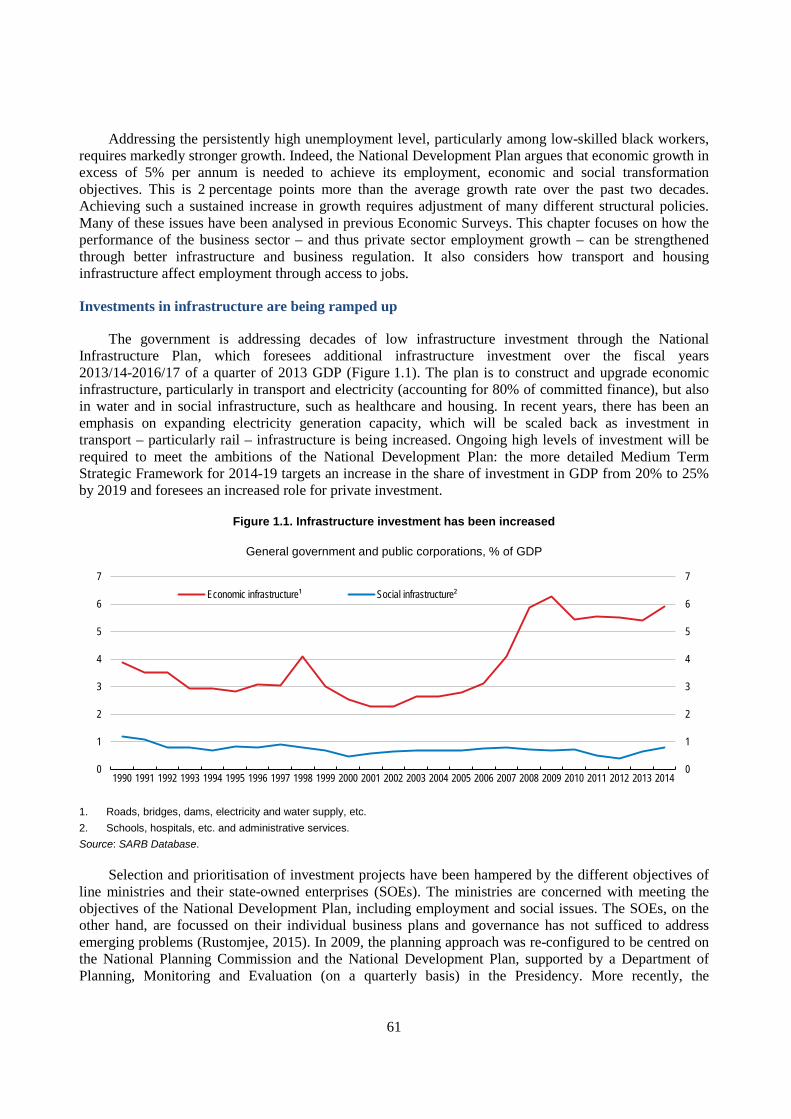
61
Addressing the persistently high unemployment level, particularly among low-skilled black workers, requires markedly stronger growth. Indeed, the National Development Plan argues that economic growth in excess of 5% per annum is needed to achieve its employment, economic and social transformation objectives. This is 2 percentage points more than the average growth rate over the past two decades. Achieving such a sustained increase in growth requires adjustment of many different structural policies. Many of these issues have been analysed in previous Economic Surveys. This chapter focuses on how the performance of the business sector – and thus private sector employment growth – can be strengthened through better infrastructure and business regulation. It also considers how transport and housing infrastructure affect employment through access to jobs.
Investments in infrastructure are being ramped up
The government is addressing decades of low infrastructure investment through the National Infrastructure Plan, which foresees additional infrastructure investment over the fiscal years 2013/14-2016/17 of a quarter of 2013 GDP (Figure 1.1). The plan is to construct and upgrade economic infrastructure, particularly in transport and electricity (accounting for 80% of committed finance), but also in water and in social infrastructure, such as healthcare and housing. In recent years, there has been an emphasis on expanding electricity generation capacity, which will be scaled back as investment in transport – particularly rail – infrastructure is being increased. Ongoing high levels of investment will be required to meet the ambitions of the National Development Plan: the more detailed Medium Term Strategic Framework for 2014-19 targets an increase in the share of investment in GDP from 20% to 25% by 2019 and foresees an increased role for private investment.
Figure 1.1. Infrastructure investment has been increased
General government and public corporations, % of GDP
1. Roads, bridges, dams, electricity and water supply, etc. 2. Schools, hospitals, etc. and administrative services. Source: SARB Database.
Selection and prioritisation of investment projects have been hampered by the different objectives of line ministries and their state-owned enterprises (SOEs). The ministries are concerned with meeting the objectives of the National Development Plan, including employment and social issues. The SOEs, on the other hand, are focussed on their individual business plans and governance has not sufficed to address emerging problems (Rustomjee, 2015). In 2009, the planning approach was re-configured to be centred on the National Planning Commission and the National Development Plan, supported by a Department of Planning, Monitoring and Evaluation (on a quarterly basis) in the Presidency. More recently, the
0
1
2
3
4
5
6
7
1990 1991 1992 1993 1994 1995 1996 1997 1998 1999 2000 2001 2002 2003 2004 2005 2006 2007 2008 2009 2010 2011 2012 2013 2014 0
1
2
3
4
5
6
7Economic infrastructure¹ Social infrastructure²
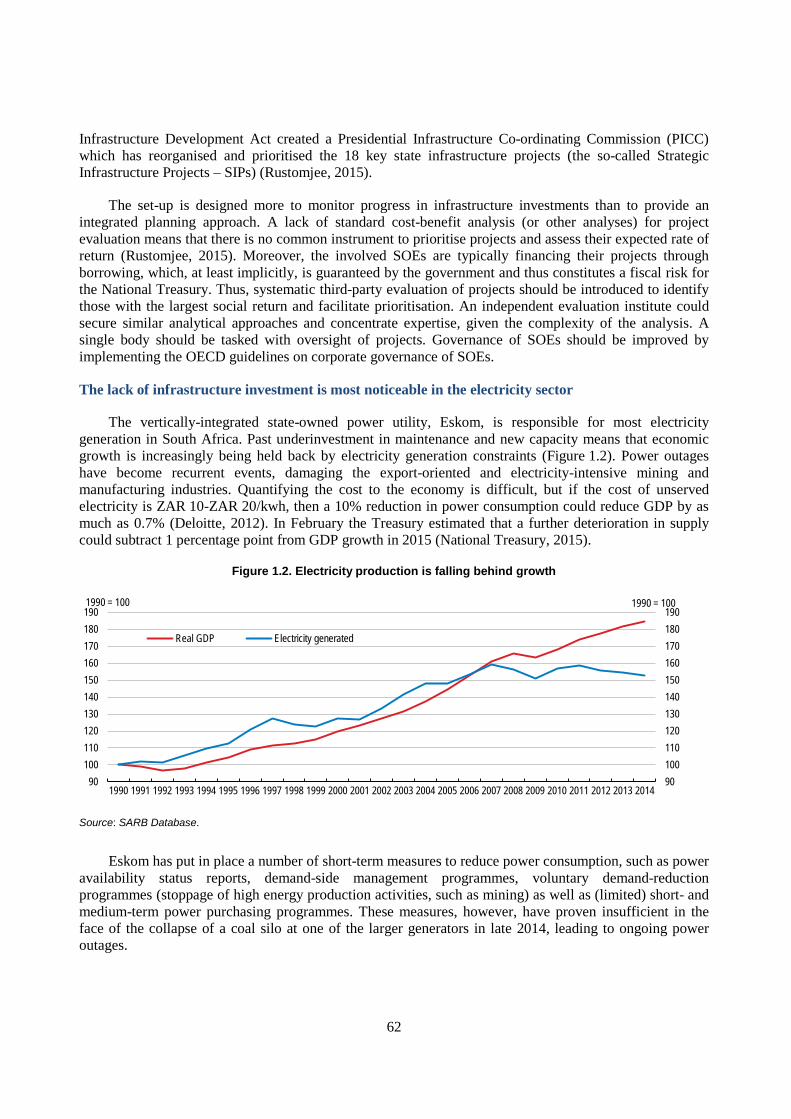
62
Infrastructure Development Act created a Presidential Infrastructure Co-ordinating Commission (PICC) which has reorganised and prioritised the 18 key state infrastructure projects (the so-called Strategic Infrastructure Projects – SIPs) (Rustomjee, 2015).
The set-up is designed more to monitor progress in infrastructure investments than to provide an integrated planning approach. A lack of standard cost-benefit analysis (or other analyses) for project evaluation means that there is no common instrument to prioritise projects and assess their expected rate of return (Rustomjee, 2015). Moreover, the involved SOEs are typically financing their projects through borrowing, which, at least implicitly, is guaranteed by the government and thus constitutes a fiscal risk for the National Treasury. Thus, systematic third-party evaluation of projects should be introduced to identify those with the largest social return and facilitate prioritisation. An independent evaluation institute could secure similar analytical approaches and concentrate expertise, given the complexity of the analysis. A single body should be tasked with oversight of projects. Governance of SOEs should be improved by implementing the OECD guidelines on corporate governance of SOEs.
The lack of infrastructure investment is most noticeable in the electricity sector
The vertically-integrated state-owned power utility, Eskom, is responsible for most electricity generation in South Africa. Past underinvestment in maintenance and new capacity means that economic growth is increasingly being held back by electricity generation constraints (Figure 1.2). Power outages have become recurrent events, damaging the export-oriented and electricity-intensive mining and manufacturing industries. Quantifying the cost to the economy is difficult, but if the cost of unserved electricity is ZAR 10-ZAR 20/kwh, then a 10% reduction in power consumption could reduce GDP by as much as 0.7% (Deloitte, 2012). In February the Treasury estimated that a further deterioration in supply could subtract 1 percentage point from GDP growth in 2015 (National Treasury, 2015).
Figure 1.2. Electricity production is falling behind growth
Source: SARB Database.
Eskom has put in place a number of short-term measures to reduce power consumption, such as power availability status reports, demand-side management programmes, voluntary demand-reduction programmes (stoppage of high energy production activities, such as mining) as well as (limited) short- and medium-term power purchasing programmes. These measures, however, have proven insufficient in the face of the collapse of a coal silo at one of the larger generators in late 2014, leading to ongoing power outages.
90100110120130140150160170180190
1990 1991 1992 1993 1994 1995 1996 1997 1998 1999 2000 2001 2002 2003 2004 2005 2006 2007 2008 2009 2010 2011 2012 2013 201490
100110120130140150160170180190
1990 = 1001990 = 100
Real GDP Electricity generated
63
As a long-term measure, Eskom is constructing two new large-scale 5 000 megawatt generators as part of the government’s Integrated Resource Plan (Box 1.1). Both projects have been delayed and a first unit of generation is expected to start in 2015, with a full roll-out only by 2020-21. When fully operational, the two stations will boost existing capacity by about one quarter. However, the existing generation capacity is relatively old with nearly one third of generation taking place in power stations that are at least 40 years old. In addition, maintenance has been postponed as all available units are continuously needed, leading to the use of expensive peak capacity to provide base load and further aggravating maintenance problems. Thus, additional investment in capacity is likely to be required to serve the needs of the economy.
Box 1.1. Supply-demand planning - the Integrated Resource Plan
Investments in the electricity infrastructure are guided by the Integrated Resource Plan (IRP2010) which provides detailed forecasts for supply, demand and pricing of different generation technologies, which are being used to model scenarios and options to identify the lowest national electricity price. For example, the feasibility of an additional nuclear power plant is being investigated in procurement negotiations with several vendors. The plan is being continuously updated and the latest 2014 version suggests that peak demand over the next decade could be lower than previously expected. However, considerable uncertainty surrounds such complex calculations, implying that at best the outcomes are only indicative of future developments.
The IRP2010 includes an expansion of renewable energy generation to account for nearly half of all new capacity, totalling about 12 000 MW. The first measure to stimulate such a development was the 2009 introduction of guaranteed feed-in tariffs, which subsequently was replaced by a competitive bidding process approach, resulting in a significantly lower cost of purchasing renewable energy. The 2011 Renewable Energy Independent Power Producers (REIPP) Programme created competitive bidding, where private-sector investors bid for the price at which they are willing to deliver a given amount of renewable energy over the lifespan of the project (as well as socio-economic development objectives). In terms of functionality, the network operator will be responsible for purchasing the electricity at the guaranteed price and reselling to distributors. The programme is divided into five bidding rounds and is currently in the midst of the fourth round. The completed bid rounds have been successful in generating very low electricity prices from renewables that are close to the grid price. This set-up means that REIPP investors are mostly left with the technical risks of operating the renewable generators. An ongoing problem for renewable energy producers is Eskom providing connection with the national grid – in mid-2014 only 20 of 47 awarded projects were connected to the grid. In some instances Eskom has had to pay for renewable energy from contracted suppliers that it failed to connect to the grid. In line with the IRP2010, the Department of Energy began in 2014 to plan for a bidding round for (relatively small amounts of) gas, coal fired and hydro-based base-load and mid-merit generation capacity as well as co-generation capacity (typically electricity from industrial stream boilers).
The positive environmental effects are partly offset by the extension of Eskom’s compliance date with the Air Quality Act from 2015 to 2020 on the basis that a number of its coal powered generators are scheduled to be retired and retrofitting them with emission reduction equipment will be prohibitively expensive considering their short remaining working lives.
Wholesale price increases are approved by the sector regulator – National Energy Regulator of South Africa (NERSA) – in principle on a long-term marginal cost basis. However, the regulator has repeatedly granted lower price increases than requested by Eskom and, as a result, the current low electricity prices reflect the amortised costs of the ageing stock of generators rather than the cost of new generation investment. This places any new generator in a loss-making position as the investment must be financed. This, together with the investment programme being behind schedule and over budget, has created Eskom’s funding gap of ZAR 225 billion over the next five years. As a short-term measure, the government will provide a capital injection of ZAR 23 billion, financed by the sale of non-core public assets.
Thus, it is unlikely that Eskom can finance additional generation investment programmes beyond its current commitment, requiring private sector involvement in the continued development of the electricity
64
sector, as called for in the government’s energy policy (Department of Minerals and Energy, 2008a). The auction programme for procuring renewable energy has demonstrated that this is possible when sufficient certainty is provided; accelerating the extension of the programme to electricity from non-renewable energy sources could help address near-term supply constraints. At the same time, the extension of the programme should not be so large that it prevents the development of a competitive market. To induce further private sector investment, a first step would be to set prices that reflect the cost of new investments, even though this would (at least temporarily) increase inflation (Department of Minerals and Energy, 2008b). An additional measure could be to resolve regulatory issues regarding power purchasing agreements – including purchasing guarantees from Eskom – to allow electricity import from a planned power station in Botswana – a project that is considered the most advanced independent power producer project that can meet South African demand in the medium term (OECD, 2015). Moreover, as recommended in the previous Survey, implicit and explicit subsidies for energy and coal consumption should be reduced, while vouchers or cash transfers should be used to protect poor consumers (OECD, 2013a). These measures should be complemented with the introduction of an independent system and market operator (ISMO) that would be responsible for purchasing electricity from generators, system operation, system balancing and all other aspects of running the electricity system. In 2011, the government introduced a bill in parliament to establish an ISMO but it was not passed (Republic of South Africa, 2011).
A more structural measure to secure an endogenous supply response to electricity shortages would be the introduction of competition between generators. In many OECD countries, this is secured via a wholesale spot exchange, where generators offer their electricity and distributors purchase it for their end-user clients. An additional measure to level the playing field could be to secure non-discriminatory third-party access to the transmission and distribution grids through structural separation and regulated transmission and distribution charges. This could facilitate a relatively fast response to the near-term supply constraints through private co-generation, for example. Currently, Eskom sets tariffs for transmission and distribution on its own networks and can use associated profits to cross-subsidise other activities, including generation. The creation of a competitive electricity market would secure prices that are in line with marginal costs, overcoming the current asymmetric information problem between the regulator and the incumbent. At the same time, the market-based incentives to expand capacity are likely to secure a faster supply response to shortages.
Better distribution could contribute to easing electricity shortages
Eskom is responsible for about 60% of electricity distribution, while 184 licensed municipalities (out of a total of 278 municipalities) exercise their constitutional right to distribute electricity. Many municipalities use distribution as a revenue-generating measure specifically with a view to cross-subsidise, without investing sufficiently in the maintenance of their distribution networks. In 2012, the estimated investment backlog was ZAR 35 billion (Department of Energy, 2012). In the same year, the Cabinet adopted the Approach to Distribution Asset Management programme to secure investments in distribution, although progress in reducing the backlog appears limited due to a lack of funding. Recent hearings on electricity distribution held by NERSA provided evidence of poor supply reliability and municipal distribution charges that are much higher than Eskom’s charges. In part this is due to higher costs faced by municipalities, including inadequate collection of electricity bills, inaccurate metering and an inability to perform real-time metering while paying time-based tariffs to Eskom. In some cases, firms investing in reducing their electricity consumption have been met with tariff increases to preserve municipalities’ revenue streams. The resulting higher cost of electricity is likely to put SMEs at a disadvantage compared with larger firms, which have greater negotiating power or direct access to the transmission grid. This may induce SMEs to – at least partly – base their start-up and location decisions on distribution tariffs to the likely detriment of poorer municipalities. In most OECD countries, distribution is considered a natural monopoly with regulated distribution tariffs.
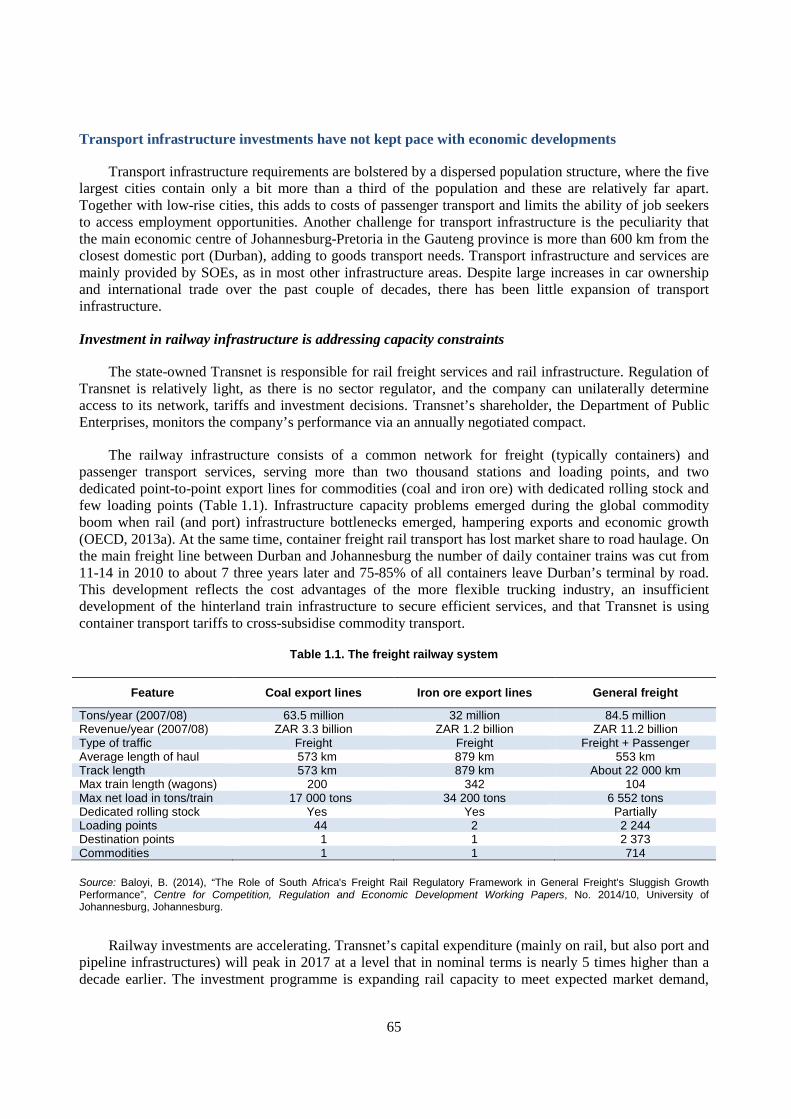
65
Transport infrastructure investments have not kept pace with economic developments
Transport infrastructure requirements are bolstered by a dispersed population structure, where the five largest cities contain only a bit more than a third of the population and these are relatively far apart. Together with low-rise cities, this adds to costs of passenger transport and limits the ability of job seekers to access employment opportunities. Another challenge for transport infrastructure is the peculiarity that the main economic centre of Johannesburg-Pretoria in the Gauteng province is more than 600 km from the closest domestic port (Durban), adding to goods transport needs. Transport infrastructure and services are mainly provided by SOEs, as in most other infrastructure areas. Despite large increases in car ownership and international trade over the past couple of decades, there has been little expansion of transport infrastructure.
Investment in railway infrastructure is addressing capacity constraints
The state-owned Transnet is responsible for rail freight services and rail infrastructure. Regulation of Transnet is relatively light, as there is no sector regulator, and the company can unilaterally determine access to its network, tariffs and investment decisions. Transnet’s shareholder, the Department of Public Enterprises, monitors the company’s performance via an annually negotiated compact.
The railway infrastructure consists of a common network for freight (typically containers) and passenger transport services, serving more than two thousand stations and loading points, and two dedicated point-to-point export lines for commodities (coal and iron ore) with dedicated rolling stock and few loading points (Table 1.1). Infrastructure capacity problems emerged during the global commodity boom when rail (and port) infrastructure bottlenecks emerged, hampering exports and economic growth (OECD, 2013a). At the same time, container freight rail transport has lost market share to road haulage. On the main freight line between Durban and Johannesburg the number of daily container trains was cut from 11-14 in 2010 to about 7 three years later and 75-85% of all containers leave Durban’s terminal by road. This development reflects the cost advantages of the more flexible trucking industry, an insufficient development of the hinterland train infrastructure to secure efficient services, and that Transnet is using container transport tariffs to cross-subsidise commodity transport.
Table 1.1. The freight railway system
Feature Coal export lines Iron ore export lines General freight
Tons/year (2007/08) 63.5 million 32 million 84.5 million Revenue/year (2007/08) ZAR 3.3 billion ZAR 1.2 billion ZAR 11.2 billion Type of traffic Freight Freight Freight + Passenger Average length of haul 573 km 879 km 553 km Track length 573 km 879 km About 22 000 km Max train length (wagons) 200 342 104 Max net load in tons/train 17 000 tons 34 200 tons 6 552 tons Dedicated rolling stock Yes Yes Partially Loading points 44 2 2 244 Destination points 1 1 2 373 Commodities 1 1 714
Source: Baloyi, B. (2014), “The Role of South Africa's Freight Rail Regulatory Framework in General Freight's Sluggish Growth Performance”, Centre for Competition, Regulation and Economic Development Working Papers, No. 2014/10, University of Johannesburg, Johannesburg.
Railway investments are accelerating. Transnet’s capital expenditure (mainly on rail, but also port and pipeline infrastructures) will peak in 2017 at a level that in nominal terms is nearly 5 times higher than a decade earlier. The investment programme is expanding rail capacity to meet expected market demand,
66
boosting operational efficiency, and shifting cargo from roads to rails. In commodity rail transport, the investment programme aims at expanding the capacity of the iron ore and coal export railways with financing based on long-term take-or-pay agreements. However, in the absence of an independent railway regulator it is difficult to assess whether the railway fees reflect cost fully or include an element of market power and thus undermine the external cost competitiveness of exporters.
The government plans to present a bill to parliament to create a Single Transport Economic Regulator, responsible for rail, roads, airports and ports (Department of Transport, 2014). The regulator would take over the regulatory responsibilities of ministries and the sector regulator of the national ports, and be in charge of securing fair and equal access in the transport sector. Such a measure could smooth the way for privatisation. In other countries, such as Brazil, Canada, the United States, and (in some instances) Australia, commodity rail lines are private. In Brazil the freight railway system was privatised in the mid-1990s, leading to substantial productivity increases and cuts in public subsidies, although the lack of non-discriminatory third-party access remains an issue (Mourougane and Pisu, 2011). A particular benefit of privatisation would be that a private operator would respond faster to increases in demand, making commodity railway capacity more responsive to the market. An independent regulator is also a prerequisite for greater private participation, such as concessions and franchises that could prepare the market for privatisation.
Transnet is committing nearly half of its investment programme to general freight, most of which is container transport. The financing of this part of the programme relies on expanding rail’s market share of the freight market. However, achieving this is relatively difficult as general freight is a much more complex and time-consuming operation than the dedicated iron ore and coal lines. As a result, rail transport of containers requires more efficient operations and better links between rail delivery points and final truck distribution to customers (so-called intermodal freight logistics connectivity) (CSIR, 2013). Transnet’s performance has improved, but because freight tariffs cover usage of tracks and service provision, it is difficult to evaluate if performance has improved to be in line with the cost of provision (Transnet, 2014; Rantasila and Ojala, 2012). In 2013-14, total rail tonnage increased, although general freight contracted by some 5%, thus making little inroad into the dominant position of container haulage. If Transnet is successful in boosting its market share of container transport, this could ease road congestion, reduce CO2 emissions and stem road damage from heavy hauling (ITF, 2014).
The challenge is to ensure that the planned expansion of rail freight capacity is optimal from society’s point of view. In this respect, it is unclear whether an unregulated government-owned monopoly with an implicit government guarantee makes the best investment choices from a national development perspective (Marsay, 2013). Transnet’s investment plans are made on the company’s perception of future transport needs and internal objectives. The plans are based on a model that takes into account current pricing and infrastructure for all transport modes to determine Transnet’s investment. However, this is not the same as an integrated planning procedure to optimise pricing and capacity expansion in all transport areas. A particular risk is that if the investment programme fails to secure the expected gains in activity, then Transnet could use its market power to secure higher tariffs to the detriment of exporters or the Treasury would have to provide additional fiscal subsidies.
Passenger rail plays relatively little role in commuting
The state-owned Passenger Rail Agency of South Africa (PRASA) provides passenger services – mostly commuting. Over the past decades, train commuting has seen a falling market share, which only recently has been somewhat reversed (despite a subsidy equal to 70% of operating costs). This reflects an increase in road commuting due to increased car ownership and minibuses providing services to neighbourhoods with poor public transport links (Table 1.2). An additional factor is that services have not been extended geographically in response to changes in the spatial use of land arising from urbanisation
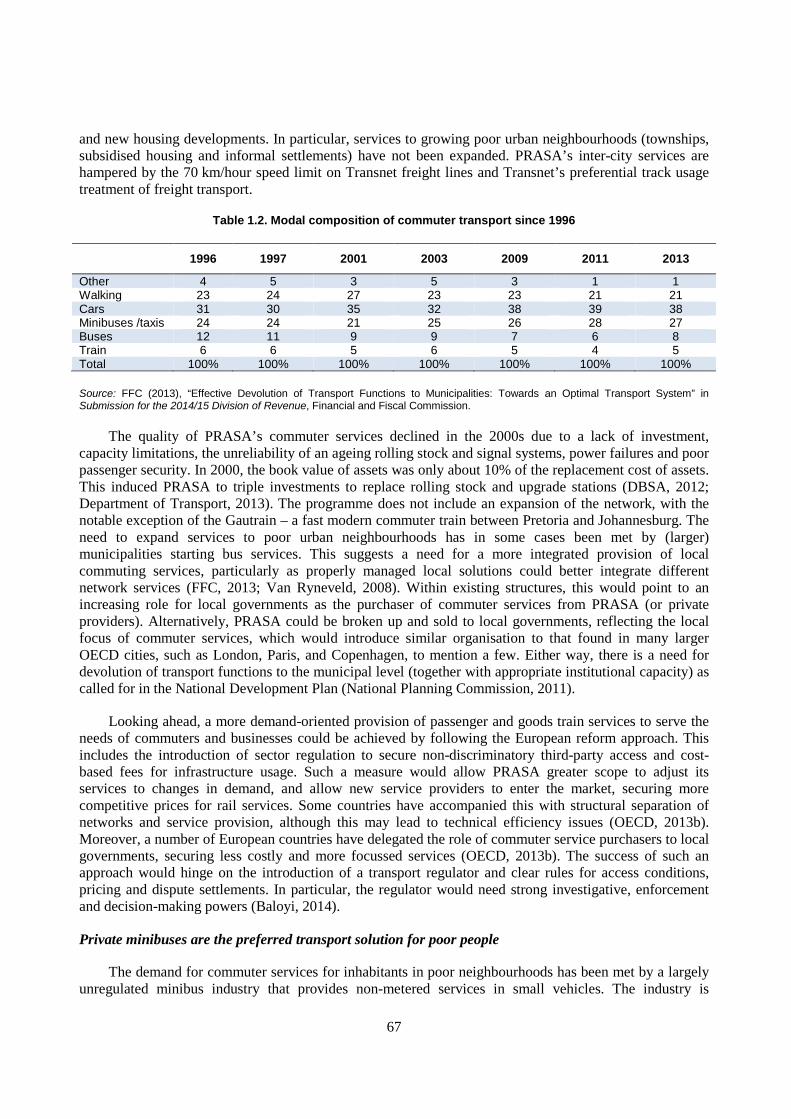
67
and new housing developments. In particular, services to growing poor urban neighbourhoods (townships, subsidised housing and informal settlements) have not been expanded. PRASA’s inter-city services are hampered by the 70 km/hour speed limit on Transnet freight lines and Transnet’s preferential track usage treatment of freight transport.
Table 1.2. Modal composition of commuter transport since 1996
1996 1997 2001 2003 2009 2011 2013
Other 4 5 3 5 3 1 1 Walking 23 24 27 23 23 21 21 Cars 31 30 35 32 38 39 38 Minibuses /taxis 24 24 21 25 26 28 27 Buses 12 11 9 9 7 6 8 Train 6 6 5 6 5 4 5 Total 100% 100% 100% 100% 100% 100% 100%
Source: FFC (2013), “Effective Devolution of Transport Functions to Municipalities: Towards an Optimal Transport System” in Submission for the 2014/15 Division of Revenue, Financial and Fiscal Commission.
The quality of PRASA’s commuter services declined in the 2000s due to a lack of investment, capacity limitations, the unreliability of an ageing rolling stock and signal systems, power failures and poor passenger security. In 2000, the book value of assets was only about 10% of the replacement cost of assets. This induced PRASA to triple investments to replace rolling stock and upgrade stations (DBSA, 2012; Department of Transport, 2013). The programme does not include an expansion of the network, with the notable exception of the Gautrain – a fast modern commuter train between Pretoria and Johannesburg. The need to expand services to poor urban neighbourhoods has in some cases been met by (larger) municipalities starting bus services. This suggests a need for a more integrated provision of local commuting services, particularly as properly managed local solutions could better integrate different network services (FFC, 2013; Van Ryneveld, 2008). Within existing structures, this would point to an increasing role for local governments as the purchaser of commuter services from PRASA (or private providers). Alternatively, PRASA could be broken up and sold to local governments, reflecting the local focus of commuter services, which would introduce similar organisation to that found in many larger OECD cities, such as London, Paris, and Copenhagen, to mention a few. Either way, there is a need for devolution of transport functions to the municipal level (together with appropriate institutional capacity) as called for in the National Development Plan (National Planning Commission, 2011).
Looking ahead, a more demand-oriented provision of passenger and goods train services to serve the needs of commuters and businesses could be achieved by following the European reform approach. This includes the introduction of sector regulation to secure non-discriminatory third-party access and cost-based fees for infrastructure usage. Such a measure would allow PRASA greater scope to adjust its services to changes in demand, and allow new service providers to enter the market, securing more competitive prices for rail services. Some countries have accompanied this with structural separation of networks and service provision, although this may lead to technical efficiency issues (OECD, 2013b). Moreover, a number of European countries have delegated the role of commuter service purchasers to local governments, securing less costly and more focussed services (OECD, 2013b). The success of such an approach would hinge on the introduction of a transport regulator and clear rules for access conditions, pricing and dispute settlements. In particular, the regulator would need strong investigative, enforcement and decision-making powers (Baloyi, 2014).
Private minibuses are the preferred transport solution for poor people
The demand for commuter services for inhabitants in poor neighbourhoods has been met by a largely unregulated minibus industry that provides non-metered services in small vehicles. The industry is
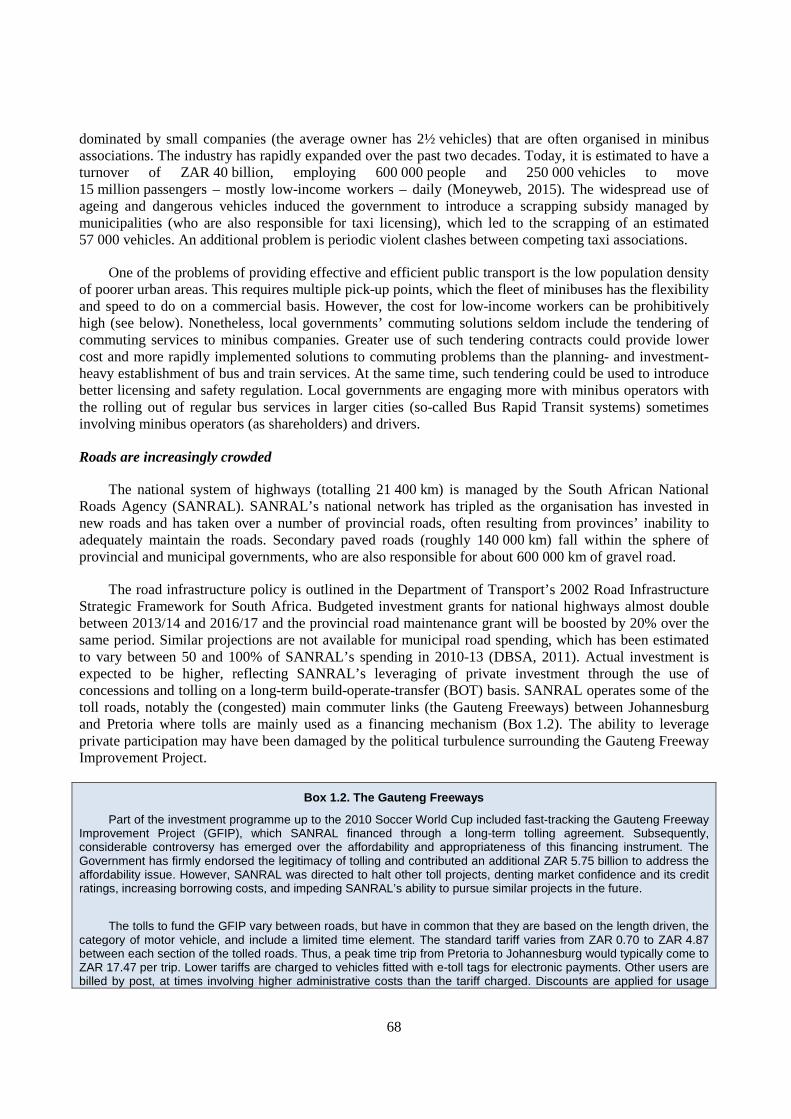
68
dominated by small companies (the average owner has 2½ vehicles) that are often organised in minibus associations. The industry has rapidly expanded over the past two decades. Today, it is estimated to have a turnover of ZAR 40 billion, employing 600 000 people and 250 000 vehicles to move 15 million passengers – mostly low-income workers – daily (Moneyweb, 2015). The widespread use of ageing and dangerous vehicles induced the government to introduce a scrapping subsidy managed by municipalities (who are also responsible for taxi licensing), which led to the scrapping of an estimated 57 000 vehicles. An additional problem is periodic violent clashes between competing taxi associations.
One of the problems of providing effective and efficient public transport is the low population density of poorer urban areas. This requires multiple pick-up points, which the fleet of minibuses has the flexibility and speed to do on a commercial basis. However, the cost for low-income workers can be prohibitively high (see below). Nonetheless, local governments’ commuting solutions seldom include the tendering of commuting services to minibus companies. Greater use of such tendering contracts could provide lower cost and more rapidly implemented solutions to commuting problems than the planning- and investment-heavy establishment of bus and train services. At the same time, such tendering could be used to introduce better licensing and safety regulation. Local governments are engaging more with minibus operators with the rolling out of regular bus services in larger cities (so-called Bus Rapid Transit systems) sometimes involving minibus operators (as shareholders) and drivers.
Roads are increasingly crowded
The national system of highways (totalling 21 400 km) is managed by the South African National Roads Agency (SANRAL). SANRAL’s national network has tripled as the organisation has invested in new roads and has taken over a number of provincial roads, often resulting from provinces’ inability to adequately maintain the roads. Secondary paved roads (roughly 140 000 km) fall within the sphere of provincial and municipal governments, who are also responsible for about 600 000 km of gravel road.
The road infrastructure policy is outlined in the Department of Transport’s 2002 Road Infrastructure Strategic Framework for South Africa. Budgeted investment grants for national highways almost double between 2013/14 and 2016/17 and the provincial road maintenance grant will be boosted by 20% over the same period. Similar projections are not available for municipal road spending, which has been estimated to vary between 50 and 100% of SANRAL’s spending in 2010-13 (DBSA, 2011). Actual investment is expected to be higher, reflecting SANRAL’s leveraging of private investment through the use of concessions and tolling on a long-term build-operate-transfer (BOT) basis. SANRAL operates some of the toll roads, notably the (congested) main commuter links (the Gauteng Freeways) between Johannesburg and Pretoria where tolls are mainly used as a financing mechanism (Box 1.2). The ability to leverage private participation may have been damaged by the political turbulence surrounding the Gauteng Freeway Improvement Project.
Box 1.2. The Gauteng Freeways
Part of the investment programme up to the 2010 Soccer World Cup included fast-tracking the Gauteng Freeway Improvement Project (GFIP), which SANRAL financed through a long-term tolling agreement. Subsequently, considerable controversy has emerged over the affordability and appropriateness of this financing instrument. The Government has firmly endorsed the legitimacy of tolling and contributed an additional ZAR 5.75 billion to address the affordability issue. However, SANRAL was directed to halt other toll projects, denting market confidence and its credit ratings, increasing borrowing costs, and impeding SANRAL’s ability to pursue similar projects in the future.
The tolls to fund the GFIP vary between roads, but have in common that they are based on the length driven, the category of motor vehicle, and include a limited time element. The standard tariff varies from ZAR 0.70 to ZAR 4.87 between each section of the tolled roads. Thus, a peak time trip from Pretoria to Johannesburg would typically come to ZAR 17.47 per trip. Lower tariffs are charged to vehicles fitted with e-toll tags for electronic payments. Other users are billed by post, at times involving higher administrative costs than the tariff charged. Discounts are applied for usage
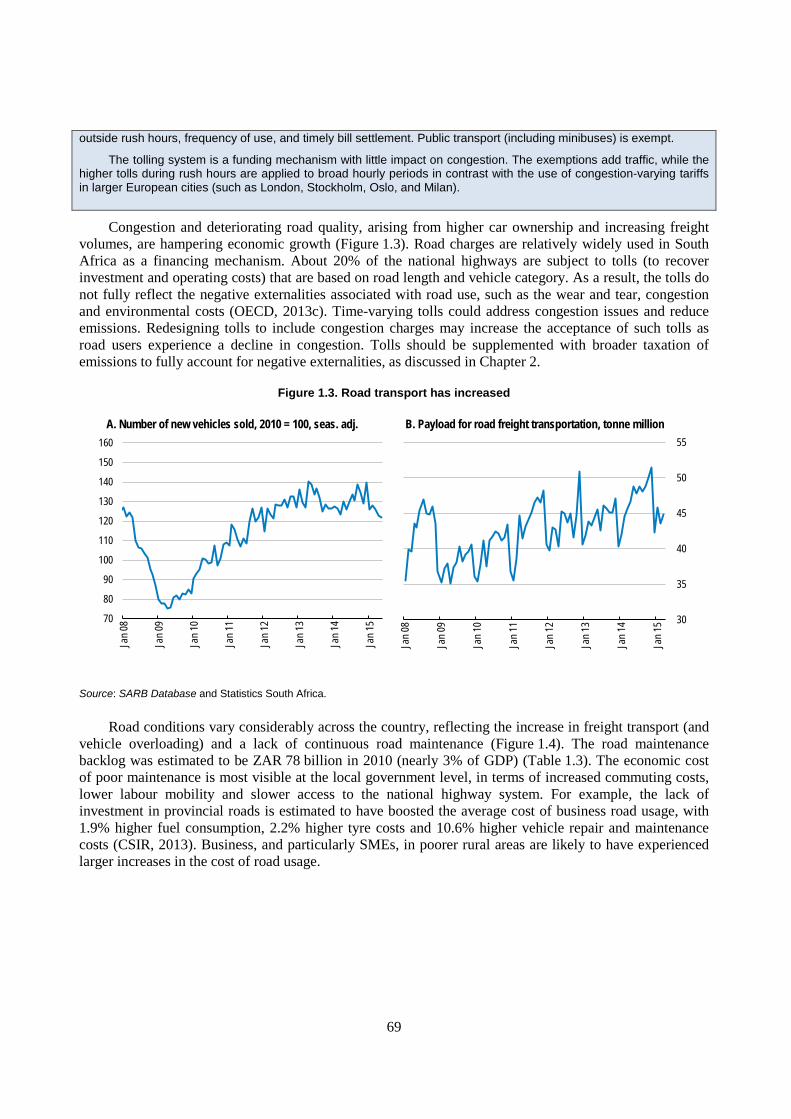
69
outside rush hours, frequency of use, and timely bill settlement. Public transport (including minibuses) is exempt.
The tolling system is a funding mechanism with little impact on congestion. The exemptions add traffic, while the higher tolls during rush hours are applied to broad hourly periods in contrast with the use of congestion-varying tariffs in larger European cities (such as London, Stockholm, Oslo, and Milan).
Congestion and deteriorating road quality, arising from higher car ownership and increasing freight volumes, are hampering economic growth (Figure 1.3). Road charges are relatively widely used in South Africa as a financing mechanism. About 20% of the national highways are subject to tolls (to recover investment and operating costs) that are based on road length and vehicle category. As a result, the tolls do not fully reflect the negative externalities associated with road use, such as the wear and tear, congestion and environmental costs (OECD, 2013c). Time-varying tolls could address congestion issues and reduce emissions. Redesigning tolls to include congestion charges may increase the acceptance of such tolls as road users experience a decline in congestion. Tolls should be supplemented with broader taxation of emissions to fully account for negative externalities, as discussed in Chapter 2.
Figure 1.3. Road transport has increased
Source: SARB Database and Statistics South Africa.
Road conditions vary considerably across the country, reflecting the increase in freight transport (and vehicle overloading) and a lack of continuous road maintenance (Figure 1.4). The road maintenance backlog was estimated to be ZAR 78 billion in 2010 (nearly 3% of GDP) (Table 1.3). The economic cost of poor maintenance is most visible at the local government level, in terms of increased commuting costs, lower labour mobility and slower access to the national highway system. For example, the lack of investment in provincial roads is estimated to have boosted the average cost of business road usage, with 1.9% higher fuel consumption, 2.2% higher tyre costs and 10.6% higher vehicle repair and maintenance costs (CSIR, 2013). Business, and particularly SMEs, in poorer rural areas are likely to have experienced larger increases in the cost of road usage.
A. Number of new vehicles sold, 2010 = 100, seas. adj. B. Payload for road freight transportation, tonne million
70
80
90
100
110
120
130
140
150
160
Jan 0
8
Jan 0
9
Jan 1
0
Jan 1
1
Jan 1
2
Jan 1
3
Jan 1
4
Jan 1
5 30
35
40
45
50
55
Jan 0
8
Jan 0
9
Jan 1
0
Jan 1
1
Jan 1
2
Jan 1
3
Jan 1
4
Jan 1
5
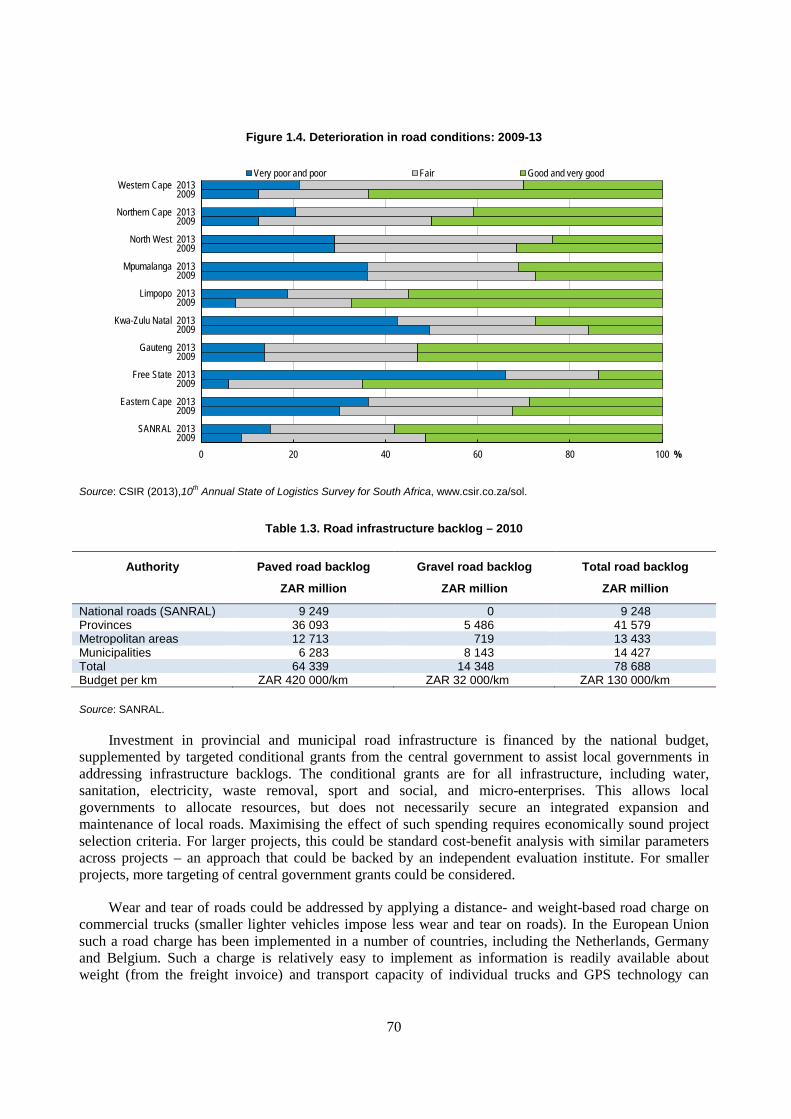
70
Figure 1.4. Deterioration in road conditions: 2009-13
Source: CSIR (2013),10th Annual State of Logistics Survey for South Africa, www.csir.co.za/sol.
Table 1.3. Road infrastructure backlog – 2010
Authority Paved road backlog
ZAR million
Gravel road backlog
ZAR million
Total road backlog
ZAR million
National roads (SANRAL) 9 249 0 9 248 Provinces 36 093 5 486 41 579 Metropolitan areas 12 713 719 13 433 Municipalities 6 283 8 143 14 427 Total 64 339 14 348 78 688 Budget per km ZAR 420 000/km ZAR 32 000/km ZAR 130 000/km
Source: SANRAL.
Investment in provincial and municipal road infrastructure is financed by the national budget, supplemented by targeted conditional grants from the central government to assist local governments in addressing infrastructure backlogs. The conditional grants are for all infrastructure, including water, sanitation, electricity, waste removal, sport and social, and micro-enterprises. This allows local governments to allocate resources, but does not necessarily secure an integrated expansion and maintenance of local roads. Maximising the effect of such spending requires economically sound project selection criteria. For larger projects, this could be standard cost-benefit analysis with similar parameters across projects – an approach that could be backed by an independent evaluation institute. For smaller projects, more targeting of central government grants could be considered.
Wear and tear of roads could be addressed by applying a distance- and weight-based road charge on commercial trucks (smaller lighter vehicles impose less wear and tear on roads). In the European Union such a road charge has been implemented in a number of countries, including the Netherlands, Germany and Belgium. Such a charge is relatively easy to implement as information is readily available about weight (from the freight invoice) and transport capacity of individual trucks and GPS technology can
0 20 40 60 80 100
Western Cape 20132009
Northern Cape 20132009
North West 20132009
Mpumalanga 20132009
Limpopo 20132009
Kwa-Zulu Natal 20132009
Gauteng 20132009
Free State 20132009
Eastern Cape 20132009
SANRAL 20132009
%
Very poor and poor Fair Good and very good
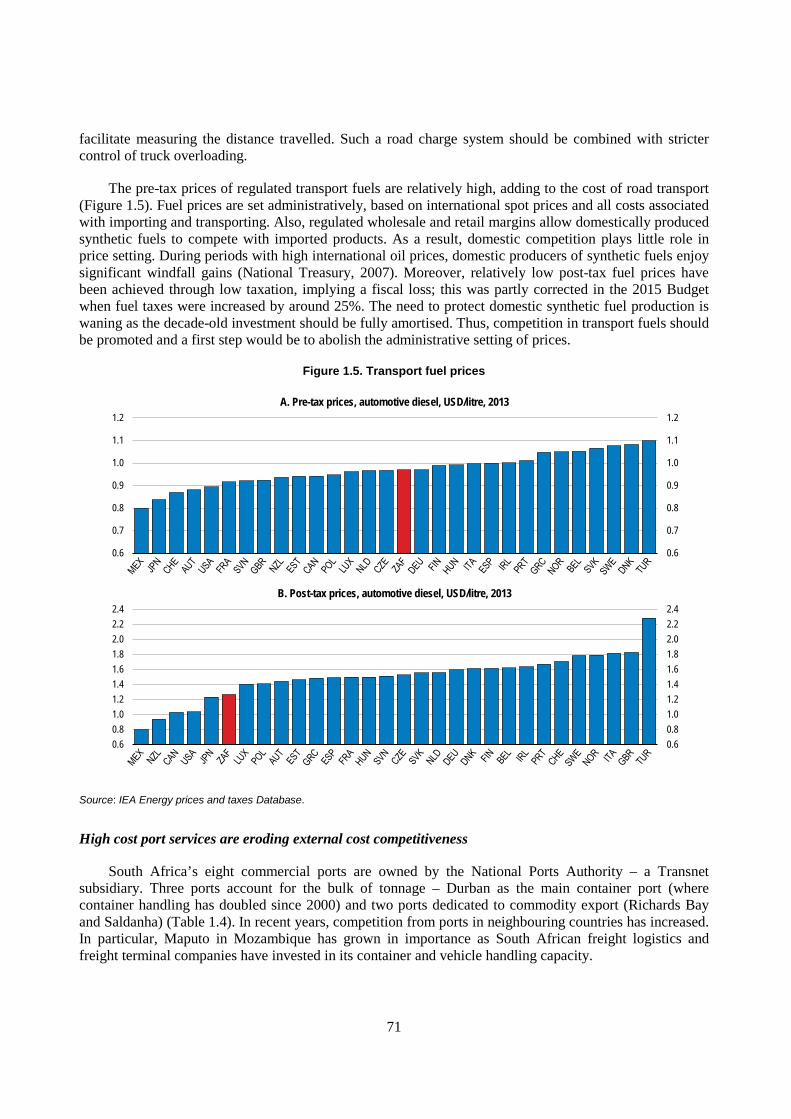
71
facilitate measuring the distance travelled. Such a road charge system should be combined with stricter control of truck overloading.
The pre-tax prices of regulated transport fuels are relatively high, adding to the cost of road transport (Figure 1.5). Fuel prices are set administratively, based on international spot prices and all costs associated with importing and transporting. Also, regulated wholesale and retail margins allow domestically produced synthetic fuels to compete with imported products. As a result, domestic competition plays little role in price setting. During periods with high international oil prices, domestic producers of synthetic fuels enjoy significant windfall gains (National Treasury, 2007). Moreover, relatively low post-tax fuel prices have been achieved through low taxation, implying a fiscal loss; this was partly corrected in the 2015 Budget when fuel taxes were increased by around 25%. The need to protect domestic synthetic fuel production is waning as the decade-old investment should be fully amortised. Thus, competition in transport fuels should be promoted and a first step would be to abolish the administrative setting of prices.
Figure 1.5. Transport fuel prices
Source: IEA Energy prices and taxes Database.
High cost port services are eroding external cost competitiveness
South Africa’s eight commercial ports are owned by the National Ports Authority – a Transnet subsidiary. Three ports account for the bulk of tonnage – Durban as the main container port (where container handling has doubled since 2000) and two ports dedicated to commodity export (Richards Bay and Saldanha) (Table 1.4). In recent years, competition from ports in neighbouring countries has increased. In particular, Maputo in Mozambique has grown in importance as South African freight logistics and freight terminal companies have invested in its container and vehicle handling capacity.
A. Pre-tax prices, automotive diesel, USD/litre, 2013
B. Post-tax prices, automotive diesel, USD/litre, 2013
0.6
0.7
0.8
0.9
1.0
1.1
1.2
0.6
0.7
0.8
0.9
1.0
1.1
1.2
0.60.81.01.21.41.61.82.02.22.4
0.60.81.01.21.41.61.82.02.22.4
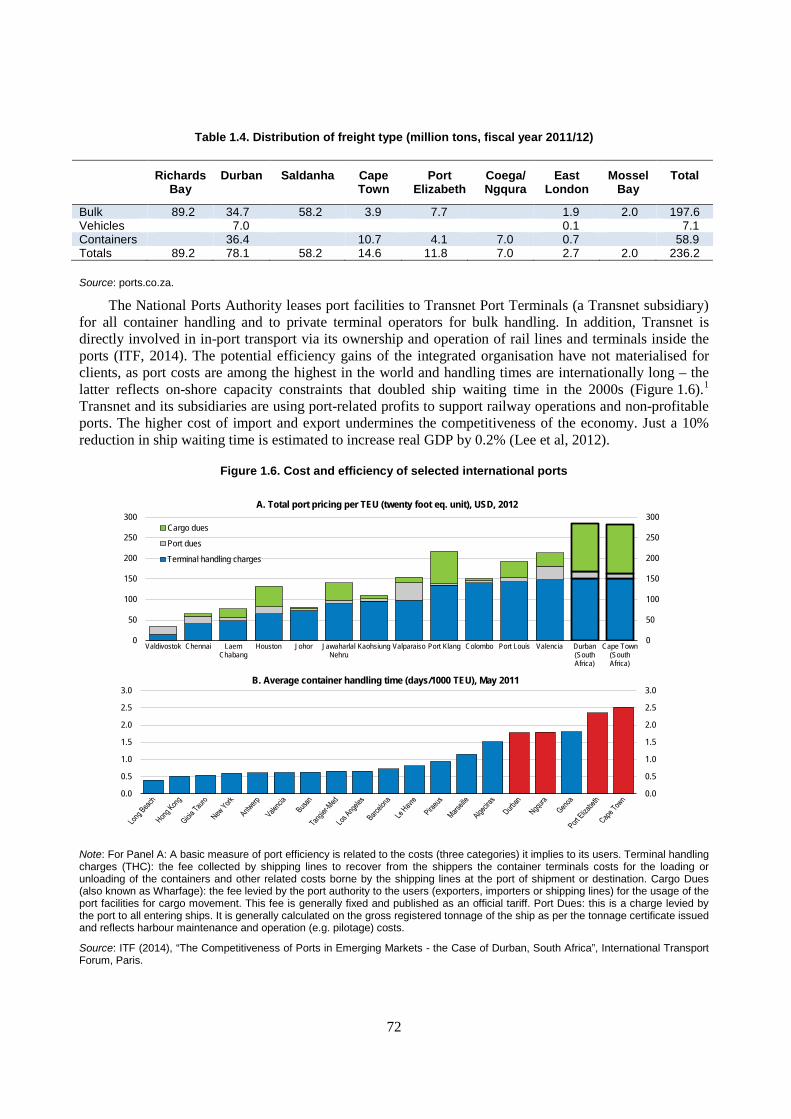
72
Table 1.4. Distribution of freight type (million tons, fiscal year 2011/12)
Richards Bay
Durban Saldanha Cape Town
Port Elizabeth
Coega/ Ngqura
East London
Mossel Bay
Total
Bulk 89.2 34.7 58.2 3.9 7.7 1.9 2.0 197.6 Vehicles 7.0 0.1 7.1 Containers 36.4 10.7 4.1 7.0 0.7 58.9 Totals 89.2 78.1 58.2 14.6 11.8 7.0 2.7 2.0 236.2
Source: ports.co.za.
The National Ports Authority leases port facilities to Transnet Port Terminals (a Transnet subsidiary) for all container handling and to private terminal operators for bulk handling. In addition, Transnet is directly involved in in-port transport via its ownership and operation of rail lines and terminals inside the ports (ITF, 2014). The potential efficiency gains of the integrated organisation have not materialised for clients, as port costs are among the highest in the world and handling times are internationally long – the latter reflects on-shore capacity constraints that doubled ship waiting time in the 2000s (Figure 1.6).1 Transnet and its subsidiaries are using port-related profits to support railway operations and non-profitable ports. The higher cost of import and export undermines the competitiveness of the economy. Just a 10% reduction in ship waiting time is estimated to increase real GDP by 0.2% (Lee et al, 2012).
Figure 1.6. Cost and efficiency of selected international ports
Note: For Panel A: A basic measure of port efficiency is related to the costs (three categories) it implies to its users. Terminal handling charges (THC): the fee collected by shipping lines to recover from the shippers the container terminals costs for the loading or unloading of the containers and other related costs borne by the shipping lines at the port of shipment or destination. Cargo Dues (also known as Wharfage): the fee levied by the port authority to the users (exporters, importers or shipping lines) for the usage of the port facilities for cargo movement. This fee is generally fixed and published as an official tariff. Port Dues: this is a charge levied by the port to all entering ships. It is generally calculated on the gross registered tonnage of the ship as per the tonnage certificate issued and reflects harbour maintenance and operation (e.g. pilotage) costs.
Source: ITF (2014), “The Competitiveness of Ports in Emerging Markets - the Case of Durban, South Africa”, International Transport Forum, Paris.
0
50
100
150
200
250
300
0
50
100
150
200
250
300
Valdivostok Chennai LaemChabang
Houston Johor JawaharlalNehru
Kaohsiung Valparaiso Port Klang Colombo Port Louis Valencia Durban(SouthAfrica)
Cape Town(SouthAfrica)
A. Total port pricing per TEU (twenty foot eq. unit), USD, 2012
Cargo dues
Port dues
Terminal handling charges
0.0
0.5
1.0
1.5
2.0
2.5
3.0
0.0
0.5
1.0
1.5
2.0
2.5
3.0B. Average container handling time (days/1000 TEU), May 2011
73
Port investments have been increasing since 2003 to accommodate rising port activity. The 2012 seven-year plan foresees capital spending of ZAR 80 billion (2½ per cent of 2012 GDP) to meet an expected doubling of container traffic by 2019. The plan also aims at boosting operational efficiency, although the operational efficiency target is lower than current global best practice (Transnet, 2012). Additional measures to boost efficiency include the introduction of the independent Ports Regulator Board that is responsible for approving tariff increases. The Board has consistently granted smaller increases than requested, reflecting the Board’s objective of reducing cross-subsidies within the tariff structure and making tariffs more internationally compatible. The planned Single Transport Economic Regulator could contribute to eliminating cross-subsidies through its regulation of tariffs in non-port areas. Additional structural measures to remove cross-subsidies should include competitive tendering of port services to lower handling fees and establishing the Port Authority as an independent standalone company.
Telecommunications could better support growth
The state-owned telecommunications monopoly ended in the mid-1990s, when the mobile market was opened up. The subsequent entry of five mobile phone operators boosted 3G networks to cover nearly the whole population and almost ¾ of the territory, at the time placing South Africa ahead of many OECD countries in terms of liberalisation and technology. However, the expected effects of competition-enabling regulation have not materialised, for instance relatively short contract periods with a legal minimum length of one year (although in practice 2-year contracts are the norm) and full number portability, and, until more recently, a lowering of termination rates (ICASA, 2014). The widespread use of prepaid cards provides easy access, but they are costly. Moreover, high-usage consumers are faced with relatively high prices and sub-par quality. For example, similarly priced packages in South Africa provide about 200-240 minutes of talk, 300-600 SMSs and 0.3-0.6 GB of data, compared with unlimited talk and SMSs and 23 GB of data over a faster network in France – a notably competitive market. In 2014, the lack of progress in reducing prices led the regulator, ICASA, to launch a sector inquiry into the state of competition.
The entrenched position of incumbents is reflected in the virtual absence of competition from Mobile Virtual Network Operators (MVNO – buyers of bulk capacity from network operators for reselling in the retail market). Wholesale prices are commercially negotiated, but the MVNOs cannot achieve viable prices. Their lack of negotiating power is overcome in other countries either by using the competition law’s prohibition on abuse of dominant position, such as in Denmark (which has nearly 60 MVNOs), or a more regulated approach as in France (which has 44 MVNOs). The recent cancellation of 4G spectrum auctions has further cemented the position of incumbents and delayed the introduction of new high speed wireless technology. The auction process has restarted, but the invitation for spectrum applications proposes to split the spectrum between a government-run operator, a wholesale operator and new entrants with specific characteristics (to support black economic empowerment and SMEs). Such a prescriptive use of spectrum will slow the roll-out of new technology, as existing operators that are excluded from the auction are prevented from using their network of antenna stations. The government should finalise an open spectrum auction. In addition, completing the transition to digital television broadcasting would free up spectrum for mobile broadband use.
Fixed-line penetration remains low by international comparison, covering 7% of the population, which is almost unchanged over the past 20 years (Telkom, 2014). New entrants are rolling out fibre networks in high-income residential areas and business centres, moving the South African telecommunication infrastructure up the technology curve in the main cities and enabling the provision of new and faster services. Despite the roll-out of fibre networks, average and peak internet speeds remain slower than in most other countries, with South Africa ranking 81 and 97, respectively, in the world (Akamai, 2015). A factor behind this development is the absence of local loop unbundling. The government should secure such unbundling to create incentives to upgrade the speed of the existing fixed-line network and to secure third-party access to the new fibre networks.
74
Better business regulation to boost growth
The National Development Plan envisions an annual growth rate above 5% and identifies SMEs as pivotal players in achieving this objective. SMEs constitute the largest source of employment as firms with less than 250 employees account for 84-89% of total employment (Kerr et al, 2013). However, since 2008 employment in firms with less than 10 employees has dropped by 1 million (Darroll, 2015; Kerr et al, 2013). Looking ahead, a worrying development from the perspective of innovation and adoption of new technologies is that SMEs and their owners are ageing, as relatively few new small firms are founded, and they have an internationally high failure rate in their first two years of existence (SBP, 2013; Olawale and Garwe, 2010).
SMEs will play an increasing role in securing inclusive growth
OECD research shows that dynamic SMEs are an important factor in moving production up the value-added chain and as job generators (Andrews et al, 2014). Research shows that young firms play an important role as job creators in OECD countries both through new start-ups and firm growth; young SMEs generated 42% of new jobs on average over 2001-11 even though they represented 17% of employment (Criscuolo, et al., 2014). Increased creation and expansion of SMEs will in itself enhance inclusive growth as SMEs are more likely to employ unskilled and younger workers than larger firms, helping to reduce existing inequalities (Edwards and Rankin, 2015; SBP, 2013). One of the main planks in the government’s strategy to enhance the inclusiveness of economic growth is black economic empowerment policies, which use public procurement policy, via a points system, to induce firms to include larger numbers of historically disadvantaged population groups (Blacks, Coloured, Indians, Chinese, people with disabilities and women) in their production and supply chains as workers, managers and owners (Box 1.3). Upcoming revisions to these policies mean that more of these points can be obtained from sub-contractors, potentially affecting many more SMEs that are not directly engaged in public procurement themselves.
Box 1.3. Black economic empowerment policies
Black economic empowerment policies aim at increasing the economic inclusiveness of previously disadvantaged groups. These include Blacks, Coloured, Indians, Chinese who arrived before 1994, females and people with disabilities. Distinctions are made between the different disadvantaged groups, for example granting more individual points to blacks that never had voting rights than other historically disadvantaged groups and granting more points to females than people with disability. An individual can have several characteristics that qualify for BBBEE points. State-owned companies have similar rules and often higher black empowerment requirements.
The first policy programme (Black Economic Empowerment) is from 2003 and was revised in 2007 under the name Broad-Based Black Economic Empowerment (BBBEE) and further amended in 2013. Originally, BBBEE was measured using seven pillars, which have since been reduced to five (management control, skills development, new enterprise and supplier development, and social-economic development) (Table 1.5) (DTI, 2012). These have to be fulfilled to obtain a verified BBBEE Certificate. This is a fairly complex document that indicates the BBBEE level, which ranks from 1, the highest with procurement recognition of 135%, to 8, the lowest with 10% procurement recognition.
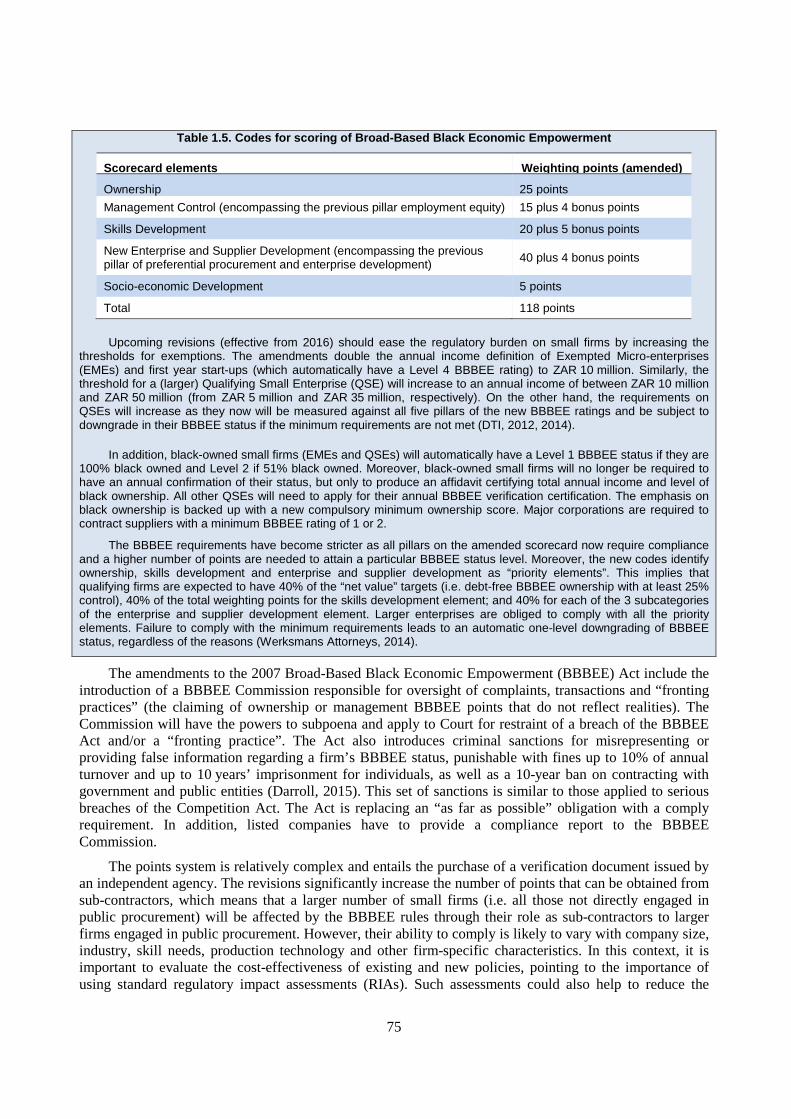
75
Table 1.5. Codes for scoring of Broad-Based Black Economic Empowerment
Scorecard elements Weighting points (amended)
Ownership 25 points Management Control (encompassing the previous pillar employment equity) 15 plus 4 bonus points
Skills Development 20 plus 5 bonus points
New Enterprise and Supplier Development (encompassing the previous pillar of preferential procurement and enterprise development) 40 plus 4 bonus points
Socio-economic Development 5 points
Total 118 points
Upcoming revisions (effective from 2016) should ease the regulatory burden on small firms by increasing the thresholds for exemptions. The amendments double the annual income definition of Exempted Micro-enterprises (EMEs) and first year start-ups (which automatically have a Level 4 BBBEE rating) to ZAR 10 million. Similarly, the threshold for a (larger) Qualifying Small Enterprise (QSE) will increase to an annual income of between ZAR 10 million and ZAR 50 million (from ZAR 5 million and ZAR 35 million, respectively). On the other hand, the requirements on QSEs will increase as they now will be measured against all five pillars of the new BBBEE ratings and be subject to downgrade in their BBBEE status if the minimum requirements are not met (DTI, 2012, 2014).
In addition, black-owned small firms (EMEs and QSEs) will automatically have a Level 1 BBBEE status if they are 100% black owned and Level 2 if 51% black owned. Moreover, black-owned small firms will no longer be required to have an annual confirmation of their status, but only to produce an affidavit certifying total annual income and level of black ownership. All other QSEs will need to apply for their annual BBBEE verification certification. The emphasis on black ownership is backed up with a new compulsory minimum ownership score. Major corporations are required to contract suppliers with a minimum BBBEE rating of 1 or 2.
The BBBEE requirements have become stricter as all pillars on the amended scorecard now require compliance and a higher number of points are needed to attain a particular BBBEE status level. Moreover, the new codes identify ownership, skills development and enterprise and supplier development as “priority elements”. This implies that qualifying firms are expected to have 40% of the “net value” targets (i.e. debt-free BBBEE ownership with at least 25% control), 40% of the total weighting points for the skills development element; and 40% for each of the 3 subcategories of the enterprise and supplier development element. Larger enterprises are obliged to comply with all the priority elements. Failure to comply with the minimum requirements leads to an automatic one-level downgrading of BBBEE status, regardless of the reasons (Werksmans Attorneys, 2014).
The amendments to the 2007 Broad-Based Black Economic Empowerment (BBBEE) Act include the introduction of a BBBEE Commission responsible for oversight of complaints, transactions and “fronting practices” (the claiming of ownership or management BBBEE points that do not reflect realities). The Commission will have the powers to subpoena and apply to Court for restraint of a breach of the BBBEE Act and/or a “fronting practice”. The Act also introduces criminal sanctions for misrepresenting or providing false information regarding a firm’s BBBEE status, punishable with fines up to 10% of annual turnover and up to 10 years’ imprisonment for individuals, as well as a 10-year ban on contracting with government and public entities (Darroll, 2015). This set of sanctions is similar to those applied to serious breaches of the Competition Act. The Act is replacing an “as far as possible” obligation with a comply requirement. In addition, listed companies have to provide a compliance report to the BBBEE Commission.
The points system is relatively complex and entails the purchase of a verification document issued by an independent agency. The revisions significantly increase the number of points that can be obtained from sub-contractors, which means that a larger number of small firms (i.e. all those not directly engaged in public procurement) will be affected by the BBBEE rules through their role as sub-contractors to larger firms engaged in public procurement. However, their ability to comply is likely to vary with company size, industry, skill needs, production technology and other firm-specific characteristics. In this context, it is important to evaluate the cost-effectiveness of existing and new policies, pointing to the importance of using standard regulatory impact assessments (RIAs). Such assessments could also help to reduce the
76
frequency of policy amendments. The government is in the process of introducing a Socio-Economic Impact Assessment System, which aims at taking a broader approach to assessing policies (Box 1.4). Moreover, the current approach uses a single policy measure to pursue multiple objectives, and a more direct approach of assigning individual policy instruments to each of the black empowerment objectives might achieve a higher degree of inclusiveness. For example, black entrepreneurship might be more effectively and efficiently promoted through greater use of direct support, such as subsidised access to finance like start-up capital, the removal of entry barriers, the creation of business angels to provide professional help with business plans, and subsidised access to management training programmes.
Box 1.4. Socio-Economic Impact Assessment System (SEIAS) in South Africa
In early 2015, the Cabinet approved the replacement of the Regulatory Impact Assessment system with a Socio-Economic Impact Assessment System (SEIAS) to get a broader assessment of policy initiatives. SEIAS will achieve this by considering the impacts on different stakeholders and by taking the country’s socio-economic context into account while advancing the government’s developmental policies. Four broad criteria are proposed in the application of the SEIAS: social cohesion and security, economic inclusion, economic growth, and environmental sustainability (Department of Planning, Monitoring and Evaluation, 2014).
The SEIAS unit in the Department of Planning, Monitoring and Evaluation will oversee implementation and provide capacity support to policy makers and legislators in conducting the assessments. This is a similar oversight system to the one that existed under the RIA system (Presidency, 2015). However, a problem for securing a common approach to the analysis is that the current guidelines suggest that these elements of the analysis are expected to vary according to the cost of the policy or intervention in question. The implementation approach to SEIAS is one of mutual learning and experimentation. To avoid confusion over the implementation of SEIAS, this approach requires clear and uniform criteria which inform the analysis and ensure that the methods of the analysis are comparable across proposals.
Regulatory burdens are high
The weak employment performance of SMEs occurs despite numerous government support programmes. At least five government agencies are engaged in providing support for young entrepreneurs, co-operatives, exports, R&D and providing sector specific grants. Individual programmes focus on addressing specific issues, but their heterogeneity complicates matters for small businesses, which often lack the administrative capacity to benefit from the large range of programmes. Surveys indicate that only 10% or less of SMEs in manufacturing and business services are involved in government-sponsored programmes (SBP, 2013). Another criticism is that the government’s approach to SME development is overly ambitious with a complicated and changing mix of strategies and a focus on a supply-driven one-size-fits-all approach with complex objectives (World Bank, 2007). In addition, special programmes do not address more general problems, such as high crime rates, and it is unclear how they interact with other policies that affect the industrial structure, such as beneficiation (Box 1.5). 2
Box 1.5. Beneficiation in South Africa
The government uses the term beneficiation for policies that aim to move production up the value-added chain, particularly developing manufacturing processing of minerals while expanding employment. The government is developing beneficiation strategies across the economy, and has specific beneficiation legislation for the mining and manufacturing sectors, including the Beneficiation Strategy for the Minerals Industry in South Africa (2011), the Industrial Policy Action Plan (IPAP), the 2002 Minerals and Petroleum Resources Development Act (MPRDA), and the 2013 MPRDA Amendment Bill (which was rejected by the president in January 2015 and send back to parliament).
The beneficiation strategy proposes a broad framework for the mining and manufacturing sectors and identifies platinum, gold, diamonds, iron ore, coal, chromium, manganese, vanadium, nickel and titanium as commodities targeted for beneficiation. The strategy also identifies some key value chains, including energy, steel and stainless steel, pigment production, auto catalyst and diesel particulate filters, diamond processing and jewellery (Department of Mineral Resources, 2011). The Department of Trade and Industry (DTI) is undertaking a study with the aim of developing a strategy and action plans for the beneficiation of platinum group metals, titanium and pigments, polymers
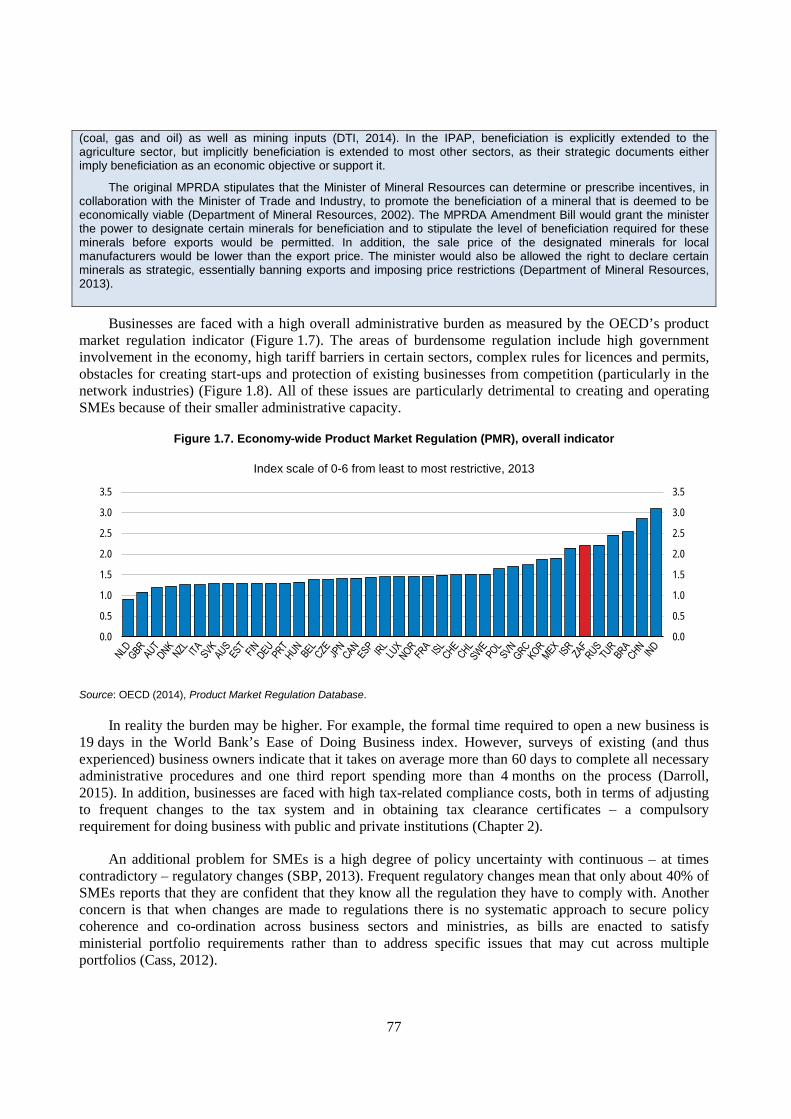
77
(coal, gas and oil) as well as mining inputs (DTI, 2014). In the IPAP, beneficiation is explicitly extended to the agriculture sector, but implicitly beneficiation is extended to most other sectors, as their strategic documents either imply beneficiation as an economic objective or support it.
The original MPRDA stipulates that the Minister of Mineral Resources can determine or prescribe incentives, in collaboration with the Minister of Trade and Industry, to promote the beneficiation of a mineral that is deemed to be economically viable (Department of Mineral Resources, 2002). The MPRDA Amendment Bill would grant the minister the power to designate certain minerals for beneficiation and to stipulate the level of beneficiation required for these minerals before exports would be permitted. In addition, the sale price of the designated minerals for local manufacturers would be lower than the export price. The minister would also be allowed the right to declare certain minerals as strategic, essentially banning exports and imposing price restrictions (Department of Mineral Resources, 2013).
Businesses are faced with a high overall administrative burden as measured by the OECD’s product market regulation indicator (Figure 1.7). The areas of burdensome regulation include high government involvement in the economy, high tariff barriers in certain sectors, complex rules for licences and permits, obstacles for creating start-ups and protection of existing businesses from competition (particularly in the network industries) (Figure 1.8). All of these issues are particularly detrimental to creating and operating SMEs because of their smaller administrative capacity.
Figure 1.7. Economy-wide Product Market Regulation (PMR), overall indicator
Index scale of 0-6 from least to most restrictive, 2013
Source: OECD (2014), Product Market Regulation Database.
In reality the burden may be higher. For example, the formal time required to open a new business is 19 days in the World Bank’s Ease of Doing Business index. However, surveys of existing (and thus experienced) business owners indicate that it takes on average more than 60 days to complete all necessary administrative procedures and one third report spending more than 4 months on the process (Darroll, 2015). In addition, businesses are faced with high tax-related compliance costs, both in terms of adjusting to frequent changes to the tax system and in obtaining tax clearance certificates – a compulsory requirement for doing business with public and private institutions (Chapter 2).
An additional problem for SMEs is a high degree of policy uncertainty with continuous – at times contradictory – regulatory changes (SBP, 2013). Frequent regulatory changes mean that only about 40% of SMEs reports that they are confident that they know all the regulation they have to comply with. Another concern is that when changes are made to regulations there is no systematic approach to secure policy coherence and co-ordination across business sectors and ministries, as bills are enacted to satisfy ministerial portfolio requirements rather than to address specific issues that may cut across multiple portfolios (Cass, 2012).
0.0
0.5
1.0
1.5
2.0
2.5
3.0
3.5
0.0
0.5
1.0
1.5
2.0
2.5
3.0
3.5

78
Figure 1.8. The regulatory burden is high across the economy
Index scale of 0-6 from least to most restrictive, 2013
Source: OECD (2014), Product Market Regulation Database.
E. Regulation in professional services
A. State control
B. Barriers to entrepreneurship
C. Barriers to trade and investment
D. Regulation in network sectors (energy, transport and communications)
0
1
2
3
4
0
1
2
3
4
0
1
2
3
4
0
1
2
3
4
0
1
2
0
1
2
0
1
2
3
4
0
1
2
3
4
0
1
2
3
4
0
1
2
3
4
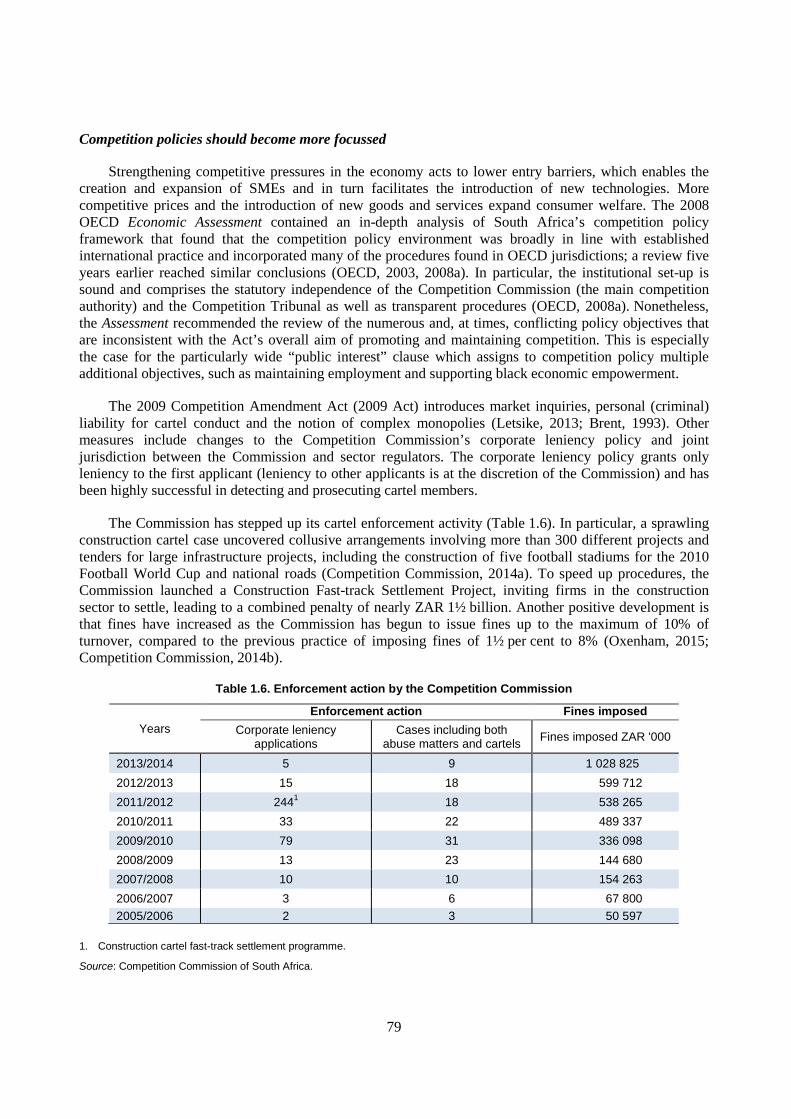
79
Competition policies should become more focussed
Strengthening competitive pressures in the economy acts to lower entry barriers, which enables the creation and expansion of SMEs and in turn facilitates the introduction of new technologies. More competitive prices and the introduction of new goods and services expand consumer welfare. The 2008 OECD Economic Assessment contained an in-depth analysis of South Africa’s competition policy framework that found that the competition policy environment was broadly in line with established international practice and incorporated many of the procedures found in OECD jurisdictions; a review five years earlier reached similar conclusions (OECD, 2003, 2008a). In particular, the institutional set-up is sound and comprises the statutory independence of the Competition Commission (the main competition authority) and the Competition Tribunal as well as transparent procedures (OECD, 2008a). Nonetheless, the Assessment recommended the review of the numerous and, at times, conflicting policy objectives that are inconsistent with the Act’s overall aim of promoting and maintaining competition. This is especially the case for the particularly wide “public interest” clause which assigns to competition policy multiple additional objectives, such as maintaining employment and supporting black economic empowerment.
The 2009 Competition Amendment Act (2009 Act) introduces market inquiries, personal (criminal) liability for cartel conduct and the notion of complex monopolies (Letsike, 2013; Brent, 1993). Other measures include changes to the Competition Commission’s corporate leniency policy and joint jurisdiction between the Commission and sector regulators. The corporate leniency policy grants only leniency to the first applicant (leniency to other applicants is at the discretion of the Commission) and has been highly successful in detecting and prosecuting cartel members.
The Commission has stepped up its cartel enforcement activity (Table 1.6). In particular, a sprawling construction cartel case uncovered collusive arrangements involving more than 300 different projects and tenders for large infrastructure projects, including the construction of five football stadiums for the 2010 Football World Cup and national roads (Competition Commission, 2014a). To speed up procedures, the Commission launched a Construction Fast-track Settlement Project, inviting firms in the construction sector to settle, leading to a combined penalty of nearly ZAR 1½ billion. Another positive development is that fines have increased as the Commission has begun to issue fines up to the maximum of 10% of turnover, compared to the previous practice of imposing fines of 1½ per cent to 8% (Oxenham, 2015; Competition Commission, 2014b).
Table 1.6. Enforcement action by the Competition Commission
Years Enforcement action Fines imposed
Corporate leniency applications
Cases including both abuse matters and cartels Fines imposed ZAR '000
2013/2014 5 9 1 028 825 2012/2013 15 18 599 712 2011/2012 2441 18 538 265 2010/2011 33 22 489 337 2009/2010 79 31 336 098 2008/2009 13 23 144 680 2007/2008 10 10 154 263 2006/2007 3 6 67 800 2005/2006 2 3 50 597
1. Construction cartel fast-track settlement programme.
Source: Competition Commission of South Africa.
80
The effectiveness of the leniency programme may be weakened by the introduction of individual liability and criminalisation of cartels. Even if leniency has been granted by the competition authority, courts may still hold individuals personally liable through fines or jail sentences, making individuals more hesitant to come forward. The promulgation of the 2009 Amendment Act has been delayed over concerns of such problems (Balkin and Njisane, 2013). The only provision from the 2009 Act in force is the chapter related to market inquiries which came into force on 1 April 2013, bringing the competition regime closer to established OECD practices and reinforcing the Commission’s ability to counter anti-competitive behaviour (OECD, 2008b; Oxenham, 2015). The Commission is currently undertaking inquiries in the healthcare and the liquefied petroleum gas markets.
Competition policy is putting a larger emphasis on public interest issues in merger decisions. This means that when the Competition Commission weighs up the consequences of a merger, its assessment goes beyond the competition effects, or even consumer welfare outcomes, and includes issues such as employment and black economic empowerment. As a consequence, the focus on productivity enhancing evaluation is removed and there is an unclear balance between the public interest and the competition assessments (Smith, 2015). This development has become increasingly prominent in a number of recent cases, such as the Wal-mart/Massmart (Box 1.6) and the Metropolitan Holdings/Momentum Group mergers (South African Competition Tribunal, 2010). In both cases, the Competition Tribunal found no competition concerns arising from the mergers, but the cases were appealed on public interest issue grounds. Subsequently, the Tribunal confirmed the public interest concern in its decisions. This may lead to inefficient outcomes with no improvement in consumer welfare or economic growth, particularly when the introduction of new production methods or organisation is prevented.
Box 1.6. Public interest considerations in South Africa’s review of the Wal-Mart / Massmart merger
Prior to the merger, the US-based Wal-Mart did not compete with Massmart in South Africa. Nonetheless, the transaction was reviewable under the merger provisions of South Africa’s Competition Act. The Act requires the Competition Commission to first examine whether a merger is “likely to substantially lessen or prevent competition” (a standard “Substantial Lessening of Competition” – SLC – type test) and then on “whether the merger can or cannot be justified on substantial public interest grounds” (a public interest test) (OECD, 2009).
Given the absence of competitive overlaps between the parties, the Competition Commission and the Competition Tribunal found that the merger did not raise competition concerns. Domestic trade unions and government ministries requested a review on the basis of public interest concerns relating to the effects of the merger on employment and local procurement.
The Tribunal acknowledged that many of the public interest concerns were exaggerated and not merger-specific, and that the merger would likely deliver pro-competitive benefits through the acceleration of Massmart’s expansion in South Africa and other merger-related efficiencies (including access to cheaper inputs). Nevertheless, the Tribunal requested remedies addressing the expressed concerns, including Wal-Mart’s agreement: not to lay off Massmart employees for a period of two years; to honour existing labour union agreements and practices; and to establish and fund a programme aimed exclusively at the development of local South African suppliers. On appeal, the Competition Appeal Court further ordered Wal-Mart to reinstate 503 workers who had been dismissed by Massmart prior to the merger, and conduct further expert study into the programme for local suppliers (a process that culminated in October 2012 with further guidance from the Court).
The recent merger decisions have prevented economic efficiencies through the streamlining of operations and slowed the introduction of new (retail) operation and supply chain techniques. In this sense, the decisions have favoured short-term and visible outcomes over harder-to-quantify dynamic effects. Moreover, the current situation creates substantial uncertainty for businesses wanting to merge as they cannot be sure how merger control will be exercised. Particularly problematic is the fact that in merger cases there is no clear method for balancing the public interest and competition assessments (OECD, 2008b). Most countries have narrowly defined public interest clauses with precise rules for application in their merger regulation frameworks, often based on national security concerns. The government should
81
review its merger policy along similar lines to create greater certainty for the business sector and to ensure that the competition policy’s pursuit of stronger competition to promote growth and consumer welfare is not hampered by an overly wide scope of public interest objectives. An OECD Peer Review of Competition Policy or similar expert review could be helpful in terms of identifying clear rules for the application of merger control and other aspects of the competition framework.
Another concern is the issue of joint jurisdiction for competition matters between the Competition Commission and the sector regulators. A number of ongoing mergers in the telecommunication industry, such as that of Vodacom and MTN, have dragged on, ostensibly as a result of divergences between the telecoms regulator, ICASA, and the Commission over the remedies to impose. Although the Commission has signed Memoranda of Understanding with most of the sector regulators, the issue of joint jurisdictions makes for an opaque operating environment and increases transaction and opportunity costs, pointing to a need for a clearer apportionment of responsibilities – a measure that would facilitate structural separation in network industries, especially in the electricity sector (OECD, 2001).
Labour market institutions are not supporting SMEs
More than a third of SMEs report labour laws as the greatest hindrance to hiring additional staff, emphasising the automatic extension of Bargaining Councils’ wage agreements to all firms within an industry as particularly problematic (Darroll, 2015; Benjamin, 2013). As a result of automatic extension, wage rates and employment terms and conditions that are primarily negotiated by larger firms are extended to SMEs in the same sector without them necessarily having the same internal flexibility and human resource capacity to adjust as large firms. In addition, smaller firms typically use relatively labour-intensive and low-wage production techniques (Nattrass and Seekings, 2014). As a consequence, the observed relatively higher wage increases at the lower end of the wage scale have been unfavourable to SMEs with their high share of low-skilled workers (Edwards and Rankin, 2015). The wage effects of Bargaining Councils are estimated to lower employment within sectors by 8-13%, particularly among small firms (Magruder, 2012; Darroll, 2015).
A concurrent development has been the liberalisation of trade, which has increased competitive pressures in domestic markets and provided access to foreign markets. However, changes in the labour laws have reduced manufacturing SMEs’ ability to adapt to the new challenges, unlike larger skill- and capital-intensive firms, which have been able to benefit from trade liberalisation by using their economies of scope and scale to exploit the larger market. This has led to a situation where less than 200 firms account for more than three quarters of manufactured exports and only 21 firms produce two-thirds of manufacturing exports (Farole, Naughtin and Rankin, 2014; Rankin, 2013). At the same time, a number of labour- and low-skill-intensive industries, including the clothing and textiles industry, still have relatively high effective rates of protection (as well as other government support), which means that they have responded more slowly to trade liberalisation and had relatively fast wage growth, reducing their ability to benefit from future trade liberalisation (Edwards and Rankin, 2015).
In manufacturing, SMEs play a relatively small role as producers of intermediate goods, particularly to larger exporting firms. The distribution of manufacturing firms is similar to that in other middle-income countries, but employment is biased towards larger firms (100 or more employees) (Table 1.7). This implies that SMEs in South Africa are relatively small – a sign that there are relatively few producers of intermediate inputs to larger firms.3 This is confirmed by the finding that South African firms are less likely to produce intermediate inputs than in countries like China, Brazil and Kenya, and that exporting companies tend to rely on imported intermediate goods (Edwards and Rankin, 2015).
The thinness of SMEs producing intermediate inputs reflects high concentration and a lack of competition in manufacturing, hampering new entry. Weak competition manifests itself in mark-ups that
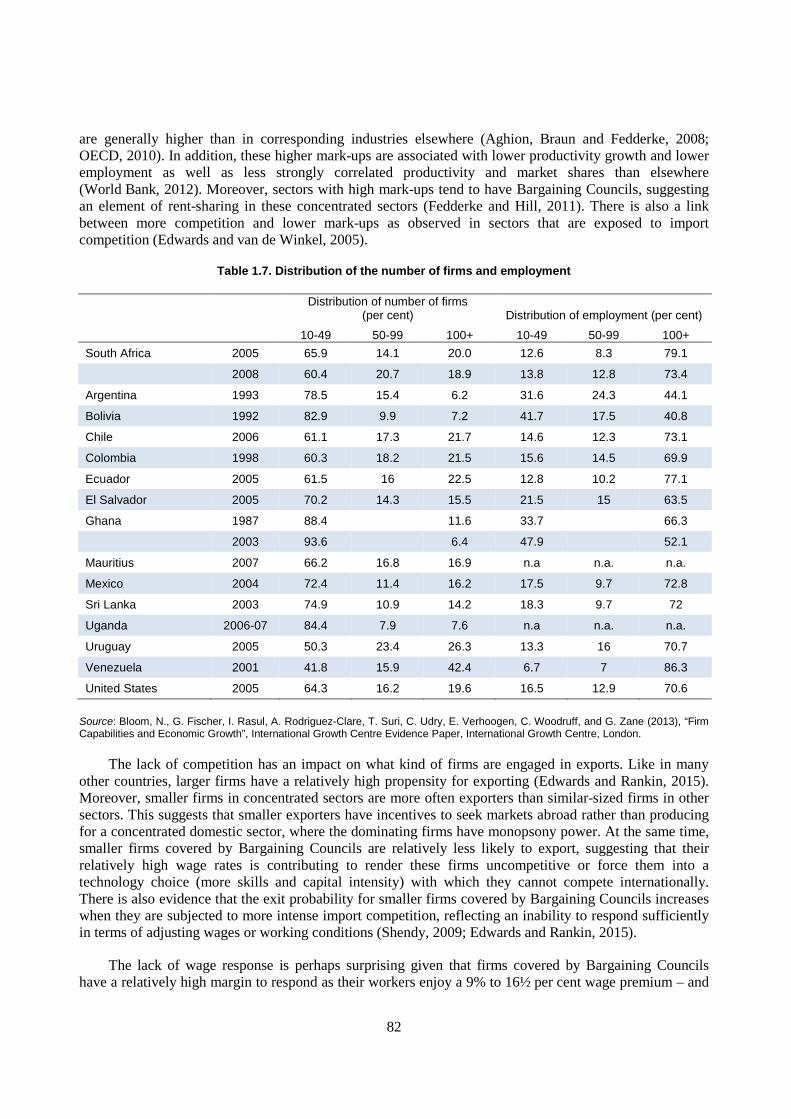
82
are generally higher than in corresponding industries elsewhere (Aghion, Braun and Fedderke, 2008; OECD, 2010). In addition, these higher mark-ups are associated with lower productivity growth and lower employment as well as less strongly correlated productivity and market shares than elsewhere (World Bank, 2012). Moreover, sectors with high mark-ups tend to have Bargaining Councils, suggesting an element of rent-sharing in these concentrated sectors (Fedderke and Hill, 2011). There is also a link between more competition and lower mark-ups as observed in sectors that are exposed to import competition (Edwards and van de Winkel, 2005).
Table 1.7. Distribution of the number of firms and employment
Distribution of number of firms
(per cent) Distribution of employment (per cent)
10-49 50-99 100+ 10-49 50-99 100+ South Africa 2005 65.9 14.1 20.0 12.6 8.3 79.1
2008 60.4 20.7 18.9 13.8 12.8 73.4
Argentina 1993 78.5 15.4 6.2 31.6 24.3 44.1
Bolivia 1992 82.9 9.9 7.2 41.7 17.5 40.8
Chile 2006 61.1 17.3 21.7 14.6 12.3 73.1
Colombia 1998 60.3 18.2 21.5 15.6 14.5 69.9
Ecuador 2005 61.5 16 22.5 12.8 10.2 77.1
El Salvador 2005 70.2 14.3 15.5 21.5 15 63.5
Ghana 1987 88.4 11.6 33.7 66.3
2003 93.6 6.4 47.9 52.1
Mauritius 2007 66.2 16.8 16.9 n.a n.a. n.a.
Mexico 2004 72.4 11.4 16.2 17.5 9.7 72.8
Sri Lanka 2003 74.9 10.9 14.2 18.3 9.7 72
Uganda 2006-07 84.4 7.9 7.6 n.a n.a. n.a.
Uruguay 2005 50.3 23.4 26.3 13.3 16 70.7
Venezuela 2001 41.8 15.9 42.4 6.7 7 86.3
United States 2005 64.3 16.2 19.6 16.5 12.9 70.6
Source: Bloom, N., G. Fischer, I. Rasul, A. Rodriguez-Clare, T. Suri, C. Udry, E. Verhoogen, C. Woodruff, and G. Zane (2013), “Firm Capabilities and Economic Growth”, International Growth Centre Evidence Paper, International Growth Centre, London.
The lack of competition has an impact on what kind of firms are engaged in exports. Like in many other countries, larger firms have a relatively high propensity for exporting (Edwards and Rankin, 2015). Moreover, smaller firms in concentrated sectors are more often exporters than similar-sized firms in other sectors. This suggests that smaller exporters have incentives to seek markets abroad rather than producing for a concentrated domestic sector, where the dominating firms have monopsony power. At the same time, smaller firms covered by Bargaining Councils are relatively less likely to export, suggesting that their relatively high wage rates is contributing to render these firms uncompetitive or force them into a technology choice (more skills and capital intensity) with which they cannot compete internationally. There is also evidence that the exit probability for smaller firms covered by Bargaining Councils increases when they are subjected to more intense import competition, reflecting an inability to respond sufficiently in terms of adjusting wages or working conditions (Shendy, 2009; Edwards and Rankin, 2015).
The lack of wage response is perhaps surprising given that firms covered by Bargaining Councils have a relatively high margin to respond as their workers enjoy a 9% to 16½ per cent wage premium – and
83
these premiums are mostly found among smaller firms and highest for low-skilled workers (Bhorat et al, 2012). This indicates that smaller firms covered by Bargaining Councils are faced with a wage floor that reduces their ability to respond through wage moderation, forcing them to change their skills and technology choice or leave the market. In both cases, the consequences are higher average labour productivity and wages, but lower employment.
Trade liberalisation is likely to continue, bringing additional benefits to the economy via lower import prices and better access to (larger) export markets. Large South African firms are well placed to reap these benefits. However, many smaller firms do not have the flexibility to overcome the challenges of greater international competition. A particular concern is the centralised setting of wages and working conditions that does not take into account local productivity growth and circumstances. Within the framework for labour market institutions, two measures may add the necessary flexibility: firstly, full or partial opt-out of the sectoral wage agreements for SMEs; and secondly, re-organising and expanding the number of Bargaining Councils so they represent sufficiently narrowly defined sectors to ensure that firms within the same sector have common interests and challenges.
SMEs are also faced with a skills barrier
The development of SMEs is also impeded by a lack of skilled workers (World Economic Forum, 2013). Indeed, the persistence of unemployment has been linked to the failure of the education system to provide students with the relevant skills (Statistics South Africa, 2014a). A recent OECD report finds that the vocational and educational training system is under-dimensioned to supply a sufficient number of well-qualified workers and lacks strong links with labour market needs (Box 1.7) (OECD, 2014a). The lack of qualified workers has induced almost two out of three SMEs to provide formal and on-the-job training (Darroll, 2015). The government has put in place 21 Sectoral Education and Training Authorities (SETAs) to help SMEs with up-skilling their employees. However, less than a third of SMEs use SETAs for training purposes. Most SMEs find that their training needs are poorly served by the SETAs as these authorities tend to focus on basic certification requirements rather than on firm-specific skill needs. An additional factor is that SMEs find it cumbersome to access their services (World Bank, 2007). Reforming the SETA system should rely on creating stronger links with SMEs along the lines of the OECD recommendations to strengthen the VET system as listed in Box 1.7.
Box 1.7. The VET system is poorly linked to labour market needs
The 50 Technical Vocational Education and Training (TVET) colleges have an enrolment of around 400 000 students. The government plans to increase enrolment to 2 500 000 by 2030. Currently nearly a third of the age cohort of 15-24 year-olds is not in employment, education or training (OECD, 2014b). In reaching the government’s ambitious goal, the OECD’s Education Directorate has identified a number of challenges and formulated policy recommendations:
The current system has a confusing mix of overlapping and competing programmes and qualifications with inadequately developed programmes for adults and limited post-secondary vocational qualifications.
• Merge upper secondary vocational programmes into a school-based and a work-based track. • Develop second chance vocational programmes and ensure flexible forms of provision. • Promote the development of post-matriculation level diplomas and certificates. • Improve pathways from initial vocational to academic programmes.
VET programmes do not respond enough to labour market needs. Key obstacles include: weak work-based learning; limited artisan programmes; an inadequate framework to co-ordinate provision with labour market actors; a mix of provision that is insufficiently driven by labour market needs; and poor data on labour market outcomes.
• Make workplace learning mandatory for vocational programmes. • Co-ordinate vocational provision through a body that also involves industry stakeholders. • Establish flexibility within the national curriculum to meet local needs.
84
• Collect data to trace labour market outcomes and career guidance.
The funding arrangements are administratively costly without responding to dropouts and specific needs.
• Simplify administration and shift responsibility for discretionary funding to the national level. • Reform the funding formula for TVET colleges to reflect the extra cost of provision in rural areas and
disadvantaged students as well as to include incentives for colleges to improve completion rates.
There is a need to improve skills and qualifications of lecturers and professional preparation of college leaders.
• Strengthen the professional preparation of TVET college lecturers with attention to the balance between pedagogical skills and work place experience. Ensure more systematic training for college leaders.
Dropout rates are worryingly high and guidance provision is patchy.
• Provide targeted support to ensure adequate levels of literacy and numeracy among TVET students. • Ensure adequate incentives for completion for both institutions and students. • Provide career guidance and information.
Informal SMEs are facing the same obstacles as formal SMEs
The informal sector, which almost exclusively consists of SMEs, is an important provider of employment (Box 1.8). However, the growth of informal SMEs and their transition into the formal sector are hindered by many of the same factors as those faced by SMEs in the formal sector. For a start, informal firms seldom register for tax purposes, inter alia because this can lead to excessive licensing requirements and all the other regulatory burdens that formal SMEs are faced with. Other concerns include crime, electricity constraints, high transportation costs and access to (formal) capital. Thus, measures to help formal SMEs may have broader effects on growth. Many of the informal firms are found in poor urban areas (World Bank, 2014) and those firms are particularly affected by poor transport links and spatial use of land as discussed below.4
Box 1.8. Employment in the informal sector
Estimates of employment in the informal sector range from about 16% of the working-age population (nearly 15 million workers, excluding those in the agricultural sector) (Statistics South Africa, 2014b) to 30% (Wills, 2009). The OECD estimates that 18% of employment (outside agriculture and private households) is in the informal sector (OECD, 2014b). The lower estimate comes from the quarterly labour force survey’s question about whether the employer is in the formal sector. This approach is likely to have a downwards bias as it excludes informal workers employed by formal firms. The higher estimate also comes from the labour force survey and measures the difference between total employment and workers with a contract and where employers pay social security contributions.
The majority of informal sector workers are in the Gauteng (26.7%), KwaZulu-Natal (17.6%), Limpopo (13.5%) and Eastern Cape (12.1%) provinces. These provinces also tend to have lower unemployment rates than provinces with fewer informal sector workers. This suggests that informality is often an alternative to unemployment, assisting low-income households (South African LED Network, 2010). The informal sector employs about 40% of working females, which is much less than in other Sub-Saharan countries, where the share is typically three-quarters (Vanek et al., 2014).
Informal sector workers are involved in a wide array of economic activities, ranging from construction to trade (retail and wholesale) – the latter involves 1 million workers, more than in any other sector. Unlike in other developing countries, relatively few are self-employed (around 40%) (Wills, 2009; South African LED Network, 2010).
Despite the activity generated by the informal sector, local authorities tend to view informality as a problem with spending obligations and missing revenue collection. Municipalities often implement policy interventions aimed at addressing the “problem of informality”. An example is “Operation Clean Sweep” in October 2013. On mayoral instruction, Johannesburg Metro Police evicted street traders (regardless of whether or not they had the requisite permits) from their places of business and confiscated their wares. The informal traders (with the help of civil society representatives) challenged the evictions through the judicial process, culminating in the Constitutional Court ruling that the operation was a "humiliation and degradation" of informal traders (Zondo, 2014).
85
Housing and spatial planning have to cope with ongoing urbanisation
Over the past couple of decades, urban housing for poor households has battled to adjust to population growth of over 30% over the past two decades and ongoing urbanisation (for example, since 1996 the population of the Gauteng province (where Johannesburg and Pretoria are located) has increased by 8 percentage points to 24% of South Africa’s population). The resultant growth in urban housing for poor households has not been well co-ordinated with their labour market needs, and they have ended up living relatively far away from economic centres and in areas with little economic activity (World Bank, 2014). The three types of housing are described here as geographically separate, but in reality they are often mixed:
• Older townships, such as Soweto in Johannesburg, were planned settlements for black workers with basic transport infrastructures for commuting purposes. Today, the commuting needs of the residents are covered by a relatively inexpensive public railway system, providing low quality and time-consuming services, or more expensive, but faster and more flexible, minibuses. The estimated population of the older townships is 15 million – some 27% of the South African population (World Bank, 2014).
• Newer government-subsidised housing – the de facto urban development strategy – for cost purposes tends to be constructed on cheap land and thus is far from economic centres. The housing has seldom been planned together with commuter transport links, often leaving minibuses as the sole means of commuting (Box 1.9) (Beg et al, 2014).5 Over the past two decades, 3.2 million subsidised housing units have been constructed, accommodating an estimated 15% of households and nearly one quarter of the South African population (Statistics South Africa, 2013). Nevertheless, the housing backlog is estimated to be in the order of 2 million dwellings.
• Informal settlements, which consist of squatters constructing (an estimated 2 million) shacks on unprepared land, accounting for 13% of households (6% of the South African population). These fast-growing settlements tend to be located closer to economic centres. Access to basic infrastructure services (roads, water and sanitation) is at best sporadic, while access to social services (education, hunger reduction programmes, etc.) is better (Housing Development Agency, 2013). The lack of public transport means that commuting options are mainly minibuses or walking.
Box 1.9. Different types of subsidised housing
Subsidised housing, or free houses, is for low-income households, following the Constitution and the Bill of Rights which stipulate that all South Africans have the right to a healthy environment, access to adequate housing and access to basic services. Eligibility is income based and 60% of the population live in households that qualify for free housing. A range of government policies (such as the Housing White Paper of 1994, the Housing Act, the Housing Code, and the Comprehensive Plan for the Development of Sustainable Human Settlement/Breaking New Ground Strategy of 2004) are geared at delivering public housing through a combination of financial intervention, incremental housing programmes, social and rental housing and rural housing programmes (National Treasury, 2014). Closing the housing backlog is estimated to cost ZAR 800 billion (Wilkinson, 2014). The provision of housing is organised in the following manner:
• The National Department of Human Settlements (DHS) drafts national housing policies and strategies and is responsible for monitoring and evaluating progress on these strategies and ensuring that provincial departments have the adequate manpower and financial resources to adopt national strategies.
• Provincial departments formulate provincial housing policies that are aligned with national priorities and ensure that interventions are prioritised and that municipalities have the roll-out capacity.
86
• Municipalities are responsible for identifying subsidised housing needs, finding and securing appropriate land, providing adequate infrastructure and services and contracting the construction of subsidised houses (DHS, 1997).
Subsidised housing is funded primarily through the Integrated Residential Development Programme with funds transferred to the provincial departments that are responsible for delivering the houses (National Treasury, 2014). Municipalities are funded by provincial governments. The construction of the houses is done by companies that meet the prescripts of public procurement legislation. The Norms and Standards from 2007 and amended in 2013 stipulate size, quality and amenities of subsidised houses, although surveys indicate that in practice more than 15% of houses reported quality problems with walls and roofs (DHS, 2013). Once houses are delivered to recipients for free, recipients are required to live in the houses for a minimum of eight years before they can sell them.
Even in cases where the distance is short, the lack of public transportation means that access to urban economic centres often takes the form of time-consuming walking or expensive minibuses. In Diepsloot, a relatively well placed township in Johannesburg, the cost of minibus commuting is equivalent to 17% of average income, and can be up to half of the income for the poorest inhabitants (World Bank, 2014). A consequence is high and persistent unemployment in these areas.
Looking ahead, continued urbanisation and larger cohorts entering the labour market will add to pressures on cities. This represents increased job creation opportunities as OECD research shows that urbanisation adds to growth through a greater set of economic opportunities as well as positive health and education effects (Ahrend et al., 2014; Collier and Venables, 2014; OECD, 2015b). However, for these positive effects to materialise, the spatial use of land and transport services have to create better access to employment for workers.
The current top-down planning approach to spatial use has ensured an expansion of housing, but with insufficient regard for wider economic links. Planning should integrate housing and public transport considerations. With the current set-up for subsidised housing this implies that municipalities should have greater responsibilities for local public transportation in the form of direct provision or via competitive tendering. Another measure could be to provide subsidised housing as a voucher that would allow future residents greater freedom in selecting the location and quality of their housing, thus internalising many planning decisions. Moreover, planning should be sufficiently advanced to avoid new informal settlements, particularly as retrofitting such areas with infrastructure is relatively much more expensive than a planned approach.
Consideration should also be given to generating economic opportunities in poor urban areas where single-storey housing contributes to low population density. The single-storey houses are cheaper to construct than multi-storey units, but the resulting low density limits the customer base for local providers of goods and services. Economic activity is further restricted by vigorously enforced bylaws that make it nearly impossible for entrepreneurial inhabitants to offer unsolicited services in nearby wealthy areas or find space to sell wares in or near commercial centres (World Bank, 2014). Spontaneous markets are becoming more organised with dedicated special areas, although often customer density is a concern. Bylaws could also be less strict, increasing entrepreneurial opportunities.
Economic activity in the vicinity of poor urban areas could be stimulated further. The spatial layout of urban areas means that poor urban areas often are surrounded by vacant land, which could be exploited by setting up experimental special economic zones with regulations that allow the zones to benefit from the relative abundance of land and labour (World Bank, 2014). Experimentation with lighter regulations or simplified procedures, such as the “one-stop shop” for government administration which has recently been introduced to special economic zones, is preferable to tax incentives that reduce the tax base, such as reduced corporate income tax rates (Chapter 2).
87
Another aspect of spatial land use is the tribal homelands. They tend to be relatively poor and far from urban centres and are often providers of migrant workers that move for extended periods (often for decades) to seek employment in higher economic activity areas, adding to urbanisation pressures (Box 1.10). A particular, although small, category of migrant workers is mining workers. Traditionally, mining workers were housed in hostels, but they can now choose a housing allowance (of up to a third of their monthly salary). In many cases, workers take the housing allowance and move into (informal) shacks, leading to additional issues of basic services provision and the establishment of second families. A recent development in the platinum mines is the possibility for miners to purchase a company-subsidised owner-occupied housing unit. Either way, settlement structures tend to be scattered around mines rather than being concentrated within commuting distance of cities, reducing economic opportunities. Promoting higher density population settlements is a spatial planning issue that requires better transport infrastructure for commuting.
Box 1.10. Migrant workers in modern South Africa – findings from a probit model
Migrant workers are a long-standing integral part of the economy, reflecting apartheid’s creation of homelands and the need to bring labour to remote mines. Remnants of these forces are still present. Micro data, and the use of a probit model, sheds light on the factors affecting migration decisions (Schiel and Leibbrand, 2015). The permanent rural residence of many migrant workers offers insurance for job-seekers, child care (often provided by grandmothers) and a place for retirement. The continued strong links to the rural communities from where the migrant workers originate are likely to be a factor behind the persistence of (temporary) low-quality housing in urban areas (Schiel and Leibbrandt, 2015). More recently, migrants have started to report a declining preference for returning to their communities of origin, putting additional pressure on urban housing for poor households. Furthermore, younger children (typically below 6 years) are increasingly joining their migrating parents. The presence of older children, on the other hand, has a negative effect on migration decisions. Moreover, migration does not appear to affect the choice of having children as there is no fertility difference between migrants and non-migrants.
Rural migrants mostly migrate to other rural areas, often within the same province, with the purpose of reducing commuting costs in areas with poorly developed public transport. This contributes to turning South Africa from a low-mobility country to one with internal migration rates that are in line with other developing countries. About a quarter of rural migrants migrate to the main economic hubs of the Gauteng province and the large coastline metropolitan cities, Durban, Cape Town and Port Elizabeth. Africans constitute the majority of the migrant population and a larger share than their share in the population.
Nearly one in five households has a migrant family member. The labour market accounts for about 40% of the reasons for relocation and marital status seems to have little influence on migration decisions. A small gender difference in favour of males remains, despite an increase in female migration to secure remittance income for rural households, with females typically seeking employment as domestic workers. Many migrant workers fail to find employment in high unemployment urban areas as the migrant workers are perceived to have inferior labour market characteristics compared with their urban competitors. This contributes to the fact that the highest incidence of poverty is found among new migrant workers in urban centres and may also explain why many rural unemployed stay back and align themselves with households that receive a pension.
The typical migrant worker is younger and better educated than non-migrants and originates from households with sufficient financial resources (including a pension) to overcome liquidity constraints and support migration. Moreover, the worker often comes from a community with high inequality levels. A significant proportion of migrants move into the labour market post migration as employed or job-seekers. However, a smaller, but still substantial, proportion is neither post migration. Thus, job market considerations are a strong motivator for migrating, but not all migrants are successful.
Occupational data indicate that migrants hold high-skill positions and are found in specific occupations within professional disciplines, highlighting a trend that migrants gravitate towards certain positions. Perhaps somewhat surprisingly, modelling earnings and taking into account the labour and education characteristics of migrants indicates that migration has a negative effect on wages, at least in the short-run. Thus, whilst not all migrants participate in the labour force, the migration and labour participation decisions remain nevertheless highly intertwined.
88
Recommendations for more efficient business regulation and infrastructure
• Introduce a more integrated approach to infrastructure planning by using cost-benefit or other criteria to identify projects with the largest social return, facilitate prioritisation and reduce fiscal risks.
• In network sectors, complete the introduction of independent sector regulators in all sectors, and make them responsible for securing non-discriminatory third-party access.
− Promote sufficient electricity generation capacity by introducing cost-reflective electricity prices. Introduce an independent system and market operator and establish a wholesale spot exchange to introduce competition between generators. Implement structural separation and secure cost-reflective transmission and distribution charges to secure non-discriminatory third party access. Take steps to secure additional electricity generation capacity in the short term, such as accelerating the independent power producer programme and facilitating private co-generation.
− Secure a more efficient expansion and use of railways by introducing an independent railway regulator to secure cost-based tariff and non-discriminatory third party access. Privatise dedicated commodity railway lines to secure market aligned investment incentives to capacity constraints.
− Improve the utilisation of roads by redesigning tolling schemes to address congestion and introduce a road charge (for commercial trucks and lorries) based on weight and distance. Improve targeting of local government road investments to address bottlenecks.
− Achieve internationally competitive ports by introducing competitive tendering of port services and removing remaining ownership links between Transnet and the Port Authority.
− Enable the introduction of new telecommunication technology by finalising an open spectrum auction for 4G licenses, facilitating the entry of MVNOs, and implementing local-loop unbundling.
− Privatise SOEs in sectors where there is a sufficient number of private firms to secure competition.
• Support SMEs by reducing the regulatory burden, increasing the use of regulatory impact analysis and promoting competition to facilitate entry into new markets. Introduce opt-outs of the sector wage agreements for SMEs and re-organise Bargaining Councils to ensure that affected firms have common interests and challenges. Focus competition policy on efficiency concerns and consumer welfare, including a review of merger policy to secure more narrowly defined public interest clauses with precise rules for application.
• Improve employment opportunities in poor urban neighbourhoods by providing affordable public transport, including integrating minibuses into the public transport system, and building new, denser settlements closer to economic centres. Experiment with support schemes and regulation special economic zones to move jobs to poor urban neighbourhoods.
NOTES 1. Part of Durban’s congestion problem is that the location of economic activity creates a North-South
transport pattern that is different from the East-West commuter pattern. As a result, there is competition for road space in key junctions. Adding to congestion is the fact that the main Ro-Ro container facility is on the opposite side of the town from its main client, the largest automotive plant in South Africa.
2. High crime is forcing firms to increase security spending, boosting employment in the private security sector to some 400 000 guards – twice the size of the police force. Since 2003, the number of business robberies has increased by a factor 4.5. On average more than 200 businesses are burgled each day, leading to lost production of at least ZAR 500 million, excluding cost of repair and replacement and the disruption of logistical chains and services (SACCI, 2014).
3. The growing importance of large firms is also confirmed by the finding that firms with less than 500 employees have been shedding jobs and that low-wage smaller firms have been more likely to exit (Kerr, Wittenberg, and Arrow, 2014).
89
4. Informal firms in poor urban areas have a considerable focus on preserving community solidarity, which
precludes competing with other nearby local businesses, leading to thin customer bases and relatively high mark-ups. This model has difficulties in competing with lower price models of retail chains and immigrant-run stores, limiting growth and new establishments (World Bank, 2014). The more competitive immigrant-run stores often belong to informal retail chains and benefit from the pooling of financial resources among fellow immigrants as well as from employees with better educational background (Doyle et al,, 2014).
5. An example is Cosmo City (an area of subsidised houses mixed with private owner-occupied housing) which is some 20 kilometres away from the nearest centres of economic activity and where the only commuting option is provided by a private bus company (PUTCO) with a single 5.30 AM service.
90
BIBLIOGRAPHY
Aghion, P., M. Braun, and J. Fedderke (2008), “Competition and Productivity Growth in South Africa”, Economics of Transition, Vol. 16, No. 4, pp. 741-768.
Ahrend, R., E. Farchy, I. Kaplanis, A. and C. Lembcke (2014), “What Makes Cities More Productive? Evidence on the Role of Urban Governance from Five OECD Countries”, OECD Regional Development Working Papers, No. 2014/05, OECD Publishing, Paris.
Akamai (2015), The State of the Internet: Q3 2014 Report, www.stateoftheinternet.com.
Andrews, D., C. Criscuolo and C. Menon (2014), “Do Resources Flow to Patenting Firms?: Cross-Country Evidence from Firm Level Data”, OECD Economics Department Working Papers, No. 1127, OECD Publishing, Paris.
Balkin, J. and Y. Njisane (2013), “The Competition Amendment Act, No. 1 of 2009: Market Inquiry Powers Promulgated To Come Into Effect As Of 1 April 2013”, ENSAfrica, 18 March 2013.
Baloyi, B. (2014), “The Role of South Africa’s Freight Rail Regulatory Framework in General Freight’s Sluggish Growth Performance”, Centre for Competition, Regulation and Economic Development Working Papers, No. 2014/10, University of Johannesburg, Johannesburg.
Beg F., G. Bickford, S. Denoon-Stevens, J. Harber, A. Jitsing, R. Moosajee and D. Schmidt (2014), How to Build Transit Oriented Cities: Exploring Possibilities, South African Cities Network, Braamfontein.
Benjamin, P. (2013), “Assessing South Africa’s Commission for Conciliation, Mediation and Arbitration (CCMA)”, ILO Working Papers, No. 47, Geneva.
Bhorat, H., S. Goga, and C. Van Der Westhuizen (2012), “Institutional Wage Effects: Revisiting Union and Bargaining Council Wage Premia in South Africa”, South African Journal of Economics, Vol. 80, No. 3, pp. 400-14.
Brent, R. (1993), “The Meaning of ‘Complex Monopoly’”, The Modern Law Review, Vol. 56, No. 6.
Business Day South Africa (2015), “Support for flawed mining bill is driven by fear not respect” 29 January 2015, www.bdlive.co.za/opinion/2015/01/29/support-for-flawed-mining-bill-is-driven-by-fear-not-respect.
Cass, R. (2012), Investigating Interdependent and Conflicting Objectives in South African SMME Policies: Competitiveness vs. Employment Creation, Master of Science in Engineering Thesis, University of the Witwatersrand, http://mobile.wiredspace.wits.ac.za/bitstream/handle/10539/11626/Competitiveness vs. Employment Creation in SMMEs %5bR. Cass%5d.pdf?sequence=2.
CSIR (2013), 10th Annual State of Logistics Survey for South Africa, www.csir.co.za/sol.
91
Competition Commission of South Africa (2014a), 15 Years of Competition Enforcement, Competition Commission of South Africa, Pretoria.
Competition Commission of South Africa (2014b), Annual Report 2013-14, Competition Commission of South Africa, Pretoria.
Collier, P. and A. J. Venables (2014), “Housing and Urbanization in Africa – Unleashing a Formal Market Process”, World Bank Policy Research Working Papers, No. 6871, World Bank Group, Washington, DC.
Criscuolo, C., P. N. Gal and C. Menon (2014), “The Dynamics of Employment Growth: New Evidence from 18 Countries”, OECD Science, Technology and Industry Policy Papers, No. 14, OECD Publishing, Paris.
Darroll, C. (2015), “Barriers to SMEs – South Africa”, OECD Economics Department Working Papers, OECD Publishing, Paris, forthcoming.
DBSA (2011), Infrastructure Inputs Monitoring Programme, Development Bank of South Africa, Pretoria.
DBSA (2012), The State of South Africa’s Economic Infrastructure: Report 2012, Development Bank of South Africa, Pretoria.
Deloitte (2012), The Economic Impact of Electricity Increases on Various Sectors of the South African Economy.
Department of Energy (2012), “Overview on Electricity Distribution Industry and Infrastructure Rehabilitation Program”, presentation to the Parliamentary Portfolio Committee, 25 July 2012, Pretoria.
Department of Human Settlements (1997), National Housing Act, Government Printers, Pretoria.
Department of Human Settlements (2013), “Enhancements to the National Norms and Standards for the Construction of Stand Alone Residential Dwellings and Engineering Services and Adjustment of the Housing Subsidy Quantum”, Pretoria.
Department of Human Settlements (2014), Celebrating 20 Years of Human Settlements: Bringing the Freedom Charter to Life, Pretoria.
Department of Minerals and Energy (2008a), White Paper on Energy Policy of the Republic of South Africa, Pretoria.
Department of Minerals and Energy (2008b), Electricity Pricing Policy of the South African Electricity Supply Industry, Department of Minerals and Energy, Pretoria.
Department of Mineral Resources (2002), Mineral and Petroleum Resources Development Act, Government Printers, Pretoria.
Department of Mineral Resources (2013), Mineral and Petroleum Resources Development Act Amendment Bill, Government Printers, Pretoria.
Department of Planning, Monitoring and Evaluation (2014), Socio-Economic Impact Assessment System Guidelines, Government Printers, Pretoria.
92
Department of Trade and Industry (2014), Industrial Policy Action Plan: 2013/14 – 2015/16, Pretoria.
Department of Transport (2013), “National road-based public transport transformation plan: from bus to public transport subsidisation”, National Council of Provinces presentation, 19 March 2013, Pretoria.
Department of Transport (2014), 2013/14 Performance Report: Quarter 4 – Strategic Planning and Monitoring, Pretoria.
Doyle, A., A.C. Peters and A. Sundaram (2014), “Skills Mismatch and Informal Sector Participation among Educated Immigrants: Evidence from South Africa”, Southern Africa Labour and Development Research Unit Working Paper Series, No. 137. SALDRU, University of Cape Town, Cape Town.
Edwards, L. and N. Rankin (2015), “Labour Market Policies, Firm Dynamics and Export Performance in South Africa”, OECD Economics Department Working Papers, OECD Publishing, Paris, forthcoming.
Edwards, L. and T. van de Winkel (2005), “The Market Disciplining Effects of Trade Liberalisation and Regional Import Penetration on Manufacturing in South Africa”, Trade and Industry Strategies Working Papers, No. 1-2005.
Farole, T., T. Naughtin, and N. Rankin, (2014), “South Africa’s Super-exporters”, Manufacturing Led Growth for Employment and Equality International Conference, Johannesburg, www.developmentdialogue.co.za.
Feddreke, J. and A. Hill (2011), “Industry Structure and Labour Market Flexibility in the South African Manufacturing Sector: A Time Series and Panel Data Approach”, Economic Modelling, Vol. 28, No. 3, pp. 1291-1302.
FFC (2013), “Effective Devolution of Transport Functions to Municipalities: Towards an Optimal Transport System” in Submission for the 2014/15 Division of Revenue, Financial and Fiscal Commission.
Housing Development Agency (2013), South Africa: Informal Settlements Status (2013), Pretoria.
ICASA (2014), “Call Termination Regulations, 2014”, Independent Communications Authority of South Africa, Pretoria.
ITF (2014), “The Competitiveness of Ports in Emerging Markets - the Case of Durban, South Africa”, International Transport Forum, Paris.
Kerr, A., M. Wittenberg and J. Arrow (2013), “Job Creation and Destruction in South Africa”, Southern Africa Labour and Development Research Unit Working Paper Series, No. 92. SALDRU, University of Cape Town, Cape Town.
Lee, T.C., P.T.W. Lee and T. Chen (2012), “Economic Impact Analysis of Port Development on the South African Economy”, South African Journal of Economics, Vol. 80, No. 2, pp. 228-245.
93
Letsike, T. (2013),“The criminalising of cartels – How effective will the new Section 73A of the Competition Amendment Act be?”, Presented to the Competition Commission, Competition Tribunal, Mandela Institute & University of Johannesburg Seventh Annual Competition Law, Economics & Policy Conference, Johannesburg, 5 – 6 September 2013.
Magruder, J. (2012), “High Unemployment Yet Few Small Firms: the Role of Centralized Bargaining in South Africa”, American Economic Journal: Applied Economics, Vol. 4, No. 3, pp. 138-166.
Marsay, A. (2013), “What is Sustainable Transport Infrastructure?”, Paper presented at 32nd Southern African Transport Conference (SATC), Pretoria, 8-11 July 2013.
Moll, P. (1996), “A Proposal for Research into Unemployment in South Africa”, Mission Economist.
Moneyweb (2015), “SA’s R398bn Taxi Industry”, www.moneyweb.co.za/moneyweb-economic-trends/sas-r398bn-taxi-industry.
Mourougane, A. and M. Pisu (2011), “Promoting Infrastructure Development in Brazil”, OECD Economics Department Working Papers, No. 898, OECD Publishing, Paris.
National Planning Commission (2011), National Development Plan 2030, Pretoria.
National Treasury (2007), “Windfall Taxes on the Liquid Fuels Industry – Response to the task team report on windfall profits in the liquid fuels industry”, Pretoria.
National Treasury (2014), Estimates of National Expenditure, Pretoria.
National Treasury (2015), Budget Review 2015, Pretoria.
Nattrass, N. and J. Seekings (2014), “Job Destruction in Newcastle: Minimum Wage-Setting and Low-Wage Employment in the South African Clothing Industry”, Transformation: Critical Perspectives on Southern Africa, Vol. 84, No. 1, pp. 1-30.
OECD (2001), www.oecd.org/daf/competition/recommendationconcerningstructuralseparationinregulatedindustries.
OECD (2003), Peer Review of South Africa’s Competition Law and Policy, OECD Publishing, Paris.
OECD (2008a), Economic Assessment of South Africa, OECD Publishing, Paris.
OECD (2008b), Policy Roundtable on Market Studies, OECD Publishing, Paris.
OECD (2009), Policy Review: Standard for Merger Review, OECD Publishing, Paris.
OECD (2010), OECD Economic Surveys: South Africa 2010, OECD Publishing, Paris.
OECD (2013a), OECD Economic Surveys: South Africa 2013, OECD Publishing, Paris.
OECD (2013b), Policy Roundtables – Recent Developments in Rail Transportation Services, OECD Publishing, Paris.
OECD (2013c), OECD Environmental Performance Reviews: South Africa 2013, OECD Publishing, Paris.
94
OECD (2014a), A Skills beyond School Review of South Africa, OECD Reviews of Vocational Education and Training, OECD Publishing, Paris.
OECD (2014b), Employment Outlook, OECD Publishing, Paris.
OECD (2015a), The Metropolitan Century – Understanding Urbanisation and its Consequences, OECD Publishing, Paris.
OECD (2015b), Fostering Investment in Infrastructure – Lessons learned from OECD Investment Policy Reviews, OECD Publishing, Paris.
Olawale, F. and D. Garwe (2010) “Obstacles to the Growth of New SMEs in South Africa: A Principal Component Analysis approach” African Journal of Business Management, Vol. 4, No. 5, pp. 729-738.
Oxenham, J. (2015), “South Africa: Developments in Cartel Enforcement”, in The African and Middle Eastern Antitrust Review 2015, http://globalcompetitionreview.com/reviews/68/sections/234/chapters/2727/south-africa-developments-cartel-enforcement/.
Presidency of the Republic of South Africa (2012), Guidelines for the Implementation of the Regulatory Impact Analysis/Assessment (RIA) Process in South Africa, Government Printers, South Africa.
Rankin, N. (2013), “Exporting and Export Dynamics Among South African Firms”, South African Institute of International Affairs Occasional Papers, No.149.
Republic of South Africa (2011), Independent System and Market Operator Bill, Government Printers, Pretoria.
Rustomjee, Z. (2015), “Infrastructure in South Africa”, OECD Economics Department Working Papers, OECD Publishing, Paris, forthcoming.
SACCI (2014), “SACCI Response to Crime Stats”, South African Chamber of Commerce and Industries press release, September 2014, www.sacci.org.za (accessed 8 April 2015).
SBP (2013), “Effect of red tape on small firms in South Africa”, SME Growth Index Thematic Paper, SBP, Johannesburg.
Schiel, R. and M. Leibbrandt (2015), “Migrant Labour in Contemporary South Africa”, OECD Economics Department Working Papers, OECD Publishing, Paris, forthcoming.
Shendy, R. (2009), Three Empirical Essays on Trade Reform in Post-Apartheid South Africa, Doctoral Thesis, Department of Economics, European University Institute, Florence.
Smith, P. (2015), “Africa: Public Interest Factors in Competition Decisions”, in The African and Middle Eastern Antitrust Review 2015, http://globalcompetitionreview.com/reviews/68/sections/234/chapters/2727/south-africa-developments-cartel-enforcement/.
South African Competition Tribunal (2010), “Metropolitan and Momentum - 9 December 2010”, www.comptrib.co.za/publications/press-releases/metropolitan-and-momentum-9-december-2010/.
95
South African LED Network (2010), Informal economy, www.led.co.za/topic/informal-economy.
Statistics South Africa (2013), General Household Survey, Key statistics, Pretoria.
Statistics South Africa (2014a), Youth Employment, Unemployment, Skills and Economic Growth 1994-2014, Pretoria.
Statistics South Africa (2014b), Labour Force Statistics, Pretoria.
Telkom (2014), Group Annual Results – for the year ended 31 March 2014.
Transnet (2012), Annual Report.
Transnet (2014), Financial Results Presentation for the year ending 31 March 2014.
Rantasila, K. and L. Ojala (2012), “Measurement of National-Level Logistics Costs and Performance”, International Transport Forum Discussion Papers, No. 2012-4, OECD Publishing, Paris.
van Ryneveld, P. (2008), 15 Year Review of Public Transport in South Africa with Emphasis on Metropolitan Areas, Hunter van Ryneveld (Pty) Ltd, www.infrastructuredialogue.co.za/wp-content/uploads/2013/05/MPT_Public_Transport_15yr.pdf.
Vanek, J., M.A. Chen, F. Carre, J. Heintz and R. Hussmanns (2014), “Statistics on the Informal Economy: Definitions, Regional Estimates and Challenges”. WIEGO Working Papers, No. 2, Women in Informal Employment: Globalizing and Organizing, Cambridge MA.
Werksmans Attorneys (2014), “Amendments to the BBBEE Act and the Codes”, www.werksmans.com/wp-content/uploads/2014/02/0400002-WERKSMANS-bbbee-booklet.pdf.
Wilkinson, K. (2014), “Factsheet: The Housing situation in South Africa”, Africa Check, http://africacheck.org/factsheets/factsheet-the-housing-situation-in-south-africa/.
Wills (2009), “South Africa’s Informal Economy- A Statistical Profile”, WIEGO Working Papers, No.6, Women in Informal Employment: Globalizing and Organizing, Cambridge MA.
World Bank (2007), South Africa: Enhancing the Effectiveness of Government in Promoting Micro, Small and Medium Enterprises, World Bank, Washington, DC.
World Bank (2012), Improving the Business Environment for Growth and Job Creation in South Africa: the Second Investment Climate Assessment, World Bank, Washington, DC.
World Bank (2014), Economics of South African Townships: Special Focus on Diepsloot, World Bank Group, Washington, DC.
World Economic Forum (2013), The Global Competitiveness Report 2013-2014, World Economic Forum, Geneva.
Zondo, N. (2014), “ConCourt slams JMPD's Operation Clean Sweep – SERI”, Politicsweb, www.politicsweb.co.za/politicsweb/view/politicsweb/en/page71654?oid=585775&sn=Detail&pid=71654.
96
Chapter 2
How can the tax system meet revenue raising challenges?
Reforms over the past two decades have produced a well-balanced, modern tax system. However, considerable revenues will be needed in the years ahead to expand social spending and infrastructure in order to raise growth and well-being. The challenge is to generate these revenues without penalising growth or exacerbating inequality. Income taxes represent around half of total tax revenue but are levied on small tax bases, partly reflecting the distribution of income. A revenue source less detrimental to growth is consumption taxes, which are mostly raised by the relatively broad value-added tax. Nonetheless, there is some scope to raise further revenue, particularly through broadening the base of these taxes. Revenues from property taxation are currently limited by the inefficient municipal rates system, which does not function well. An important additional source of revenue is environmentally related taxes. In the design of the tax system, consideration should also be given to the appropriate taxation of the natural resources sector, which remains an important issue for a resource-rich country like South Africa.
97
Over the past two decades, the tax system has faced unique challenges associated with opening the economy both internally and internationally following the transition to democracy. These are in addition to the common challenges of increasing globalisation and structural change. Today, the tax base is broader and the system is overseen by a modern administration. Together with cash transfers and in-kind benefits, the system is effective at redistributing revenue to achieve large reductions in poverty and income inequality (World Bank, 2014a).
At the same time, the demands on the tax system have been rising and will continue to do so given South Africa’s growing needs for infrastructure and social spending. These include social and infrastructure projects identified within this survey, as well as the planned national health insurance scheme. But the sizeable deficit and rising debt are constraining expenditure and the National Treasury’s focus is, appropriately, on improving spending efficiency by reducing waste and corruption. In this environment, the public is reluctant to accept considerably higher taxes. Nonetheless, it is unlikely that South Africa’s spending needs can be financed solely by savings elsewhere; additional revenues will be needed in the future. Against this background, this chapter explores directions for future tax reform with a focus on raising additional revenues in a way that does not damage growth and is equitable. Although it is beyond the scope of this chapter, demonstrated improvements in public sector spending efficiency would make tax changes more acceptable and raise compliance levels.
The existing tax system performs relatively well
Great progress has been made by the National Treasury and the South African Revenue Service (SARS) in raising revenues more efficiently and effectively. These improvements have raised government revenues from 25% of GDP in 1995 to 29% in 2013. However, revenues are lower than OECD member emerging market economies and Brazil (Figure 2.1, Panel A). Just over half of all tax revenue (which is around 95% of government current revenue) is raised through income taxes and other taxes on labour (social security contributions and payroll taxes). This share is in between the average of OECD countries and the share in other emerging market economies. Compared to OECD countries, the tax system relies more heavily on corporate income tax and less on taxation of labour (Figure 2.1, Panel B). Overall, the system is well balanced.
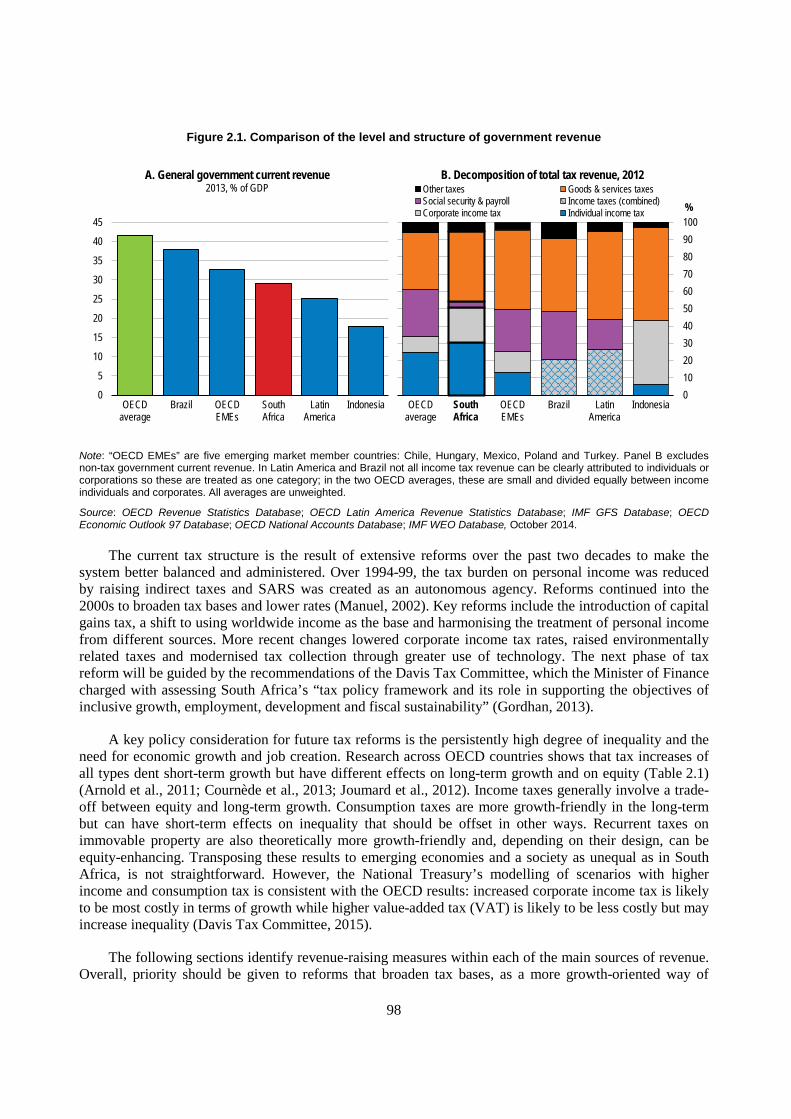
98
Figure 2.1. Comparison of the level and structure of government revenue
Note: “OECD EMEs” are five emerging market member countries: Chile, Hungary, Mexico, Poland and Turkey. Panel B excludes non-tax government current revenue. In Latin America and Brazil not all income tax revenue can be clearly attributed to individuals or corporations so these are treated as one category; in the two OECD averages, these are small and divided equally between income individuals and corporates. All averages are unweighted.
Source: OECD Revenue Statistics Database; OECD Latin America Revenue Statistics Database; IMF GFS Database; OECD Economic Outlook 97 Database; OECD National Accounts Database; IMF WEO Database, October 2014.
The current tax structure is the result of extensive reforms over the past two decades to make the system better balanced and administered. Over 1994-99, the tax burden on personal income was reduced by raising indirect taxes and SARS was created as an autonomous agency. Reforms continued into the 2000s to broaden tax bases and lower rates (Manuel, 2002). Key reforms include the introduction of capital gains tax, a shift to using worldwide income as the base and harmonising the treatment of personal income from different sources. More recent changes lowered corporate income tax rates, raised environmentally related taxes and modernised tax collection through greater use of technology. The next phase of tax reform will be guided by the recommendations of the Davis Tax Committee, which the Minister of Finance charged with assessing South Africa’s “tax policy framework and its role in supporting the objectives of inclusive growth, employment, development and fiscal sustainability” (Gordhan, 2013).
A key policy consideration for future tax reforms is the persistently high degree of inequality and the need for economic growth and job creation. Research across OECD countries shows that tax increases of all types dent short-term growth but have different effects on long-term growth and on equity (Table 2.1) (Arnold et al., 2011; Cournède et al., 2013; Joumard et al., 2012). Income taxes generally involve a trade-off between equity and long-term growth. Consumption taxes are more growth-friendly in the long-term but can have short-term effects on inequality that should be offset in other ways. Recurrent taxes on immovable property are also theoretically more growth-friendly and, depending on their design, can be equity-enhancing. Transposing these results to emerging economies and a society as unequal as in South Africa, is not straightforward. However, the National Treasury’s modelling of scenarios with higher income and consumption tax is consistent with the OECD results: increased corporate income tax is likely to be most costly in terms of growth while higher value-added tax (VAT) is likely to be less costly but may increase inequality (Davis Tax Committee, 2015).
The following sections identify revenue-raising measures within each of the main sources of revenue. Overall, priority should be given to reforms that broaden tax bases, as a more growth-oriented way of
0
5
10
15
20
25
30
35
40
45
OECDaverage
Brazil OECDEMEs
SouthAfrica
LatinAmerica
Indonesia
A. General government current revenue2013, % of GDP
0102030405060708090100
OECDaverage
OECDEMEs
Brazil LatinAmerica
Indonesia
%
B. Decomposition of total tax revenue, 2012Other taxes Goods & services taxesSocial security & payroll Income taxes (combined)Corporate income tax Individual income tax
South Africa
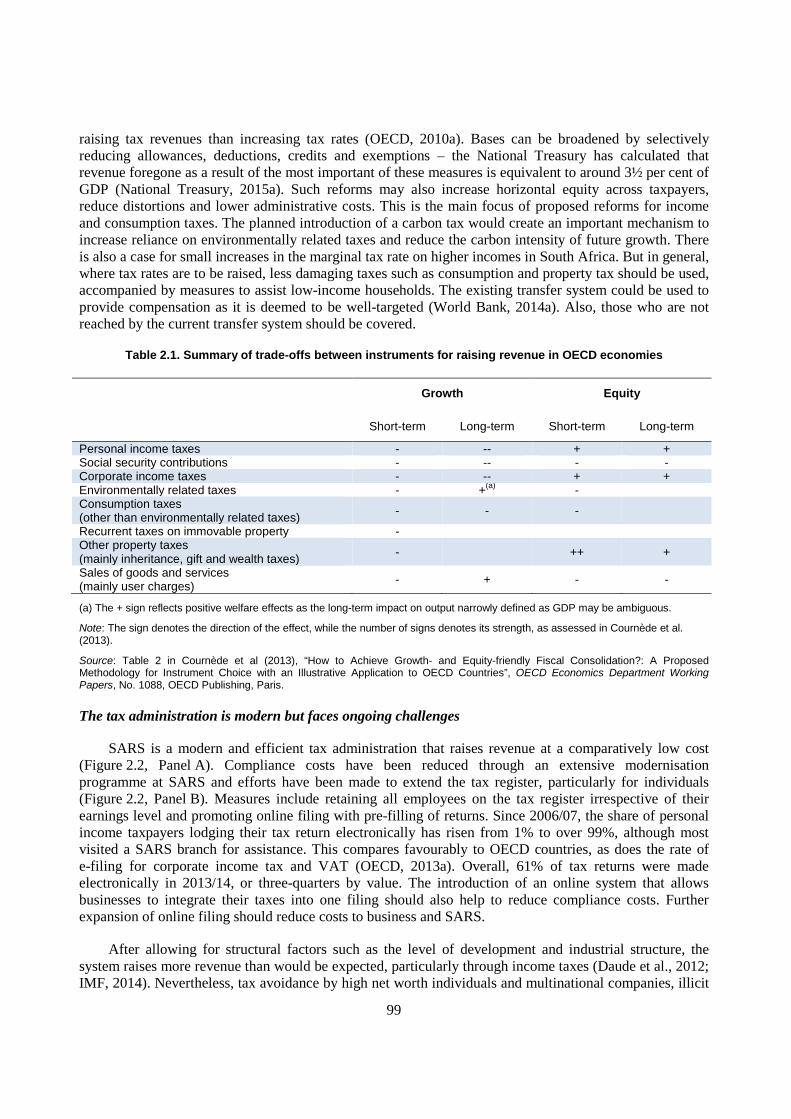
99
raising tax revenues than increasing tax rates (OECD, 2010a). Bases can be broadened by selectively reducing allowances, deductions, credits and exemptions – the National Treasury has calculated that revenue foregone as a result of the most important of these measures is equivalent to around 3½ per cent of GDP (National Treasury, 2015a). Such reforms may also increase horizontal equity across taxpayers, reduce distortions and lower administrative costs. This is the main focus of proposed reforms for income and consumption taxes. The planned introduction of a carbon tax would create an important mechanism to increase reliance on environmentally related taxes and reduce the carbon intensity of future growth. There is also a case for small increases in the marginal tax rate on higher incomes in South Africa. But in general, where tax rates are to be raised, less damaging taxes such as consumption and property tax should be used, accompanied by measures to assist low-income households. The existing transfer system could be used to provide compensation as it is deemed to be well-targeted (World Bank, 2014a). Also, those who are not reached by the current transfer system should be covered.
Table 2.1. Summary of trade-offs between instruments for raising revenue in OECD economies
Growth Equity
Short-term Long-term Short-term Long-term
Personal income taxes - -- + + Social security contributions - -- - - Corporate income taxes - -- + + Environmentally related taxes - +(a) - Consumption taxes (other than environmentally related taxes) - - -
Recurrent taxes on immovable property - Other property taxes (mainly inheritance, gift and wealth taxes) - ++ +
Sales of goods and services (mainly user charges) - + - -
(a) The + sign reflects positive welfare effects as the long-term impact on output narrowly defined as GDP may be ambiguous.
Note: The sign denotes the direction of the effect, while the number of signs denotes its strength, as assessed in Cournède et al. (2013).
Source: Table 2 in Cournède et al (2013), “How to Achieve Growth- and Equity-friendly Fiscal Consolidation?: A Proposed Methodology for Instrument Choice with an Illustrative Application to OECD Countries”, OECD Economics Department Working Papers, No. 1088, OECD Publishing, Paris.
The tax administration is modern but faces ongoing challenges
SARS is a modern and efficient tax administration that raises revenue at a comparatively low cost (Figure 2.2, Panel A). Compliance costs have been reduced through an extensive modernisation programme at SARS and efforts have been made to extend the tax register, particularly for individuals (Figure 2.2, Panel B). Measures include retaining all employees on the tax register irrespective of their earnings level and promoting online filing with pre-filling of returns. Since 2006/07, the share of personal income taxpayers lodging their tax return electronically has risen from 1% to over 99%, although most visited a SARS branch for assistance. This compares favourably to OECD countries, as does the rate of e-filing for corporate income tax and VAT (OECD, 2013a). Overall, 61% of tax returns were made electronically in 2013/14, or three-quarters by value. The introduction of an online system that allows businesses to integrate their taxes into one filing should also help to reduce compliance costs. Further expansion of online filing should reduce costs to business and SARS.
After allowing for structural factors such as the level of development and industrial structure, the system raises more revenue than would be expected, particularly through income taxes (Daude et al., 2012; IMF, 2014). Nevertheless, tax avoidance by high net worth individuals and multinational companies, illicit
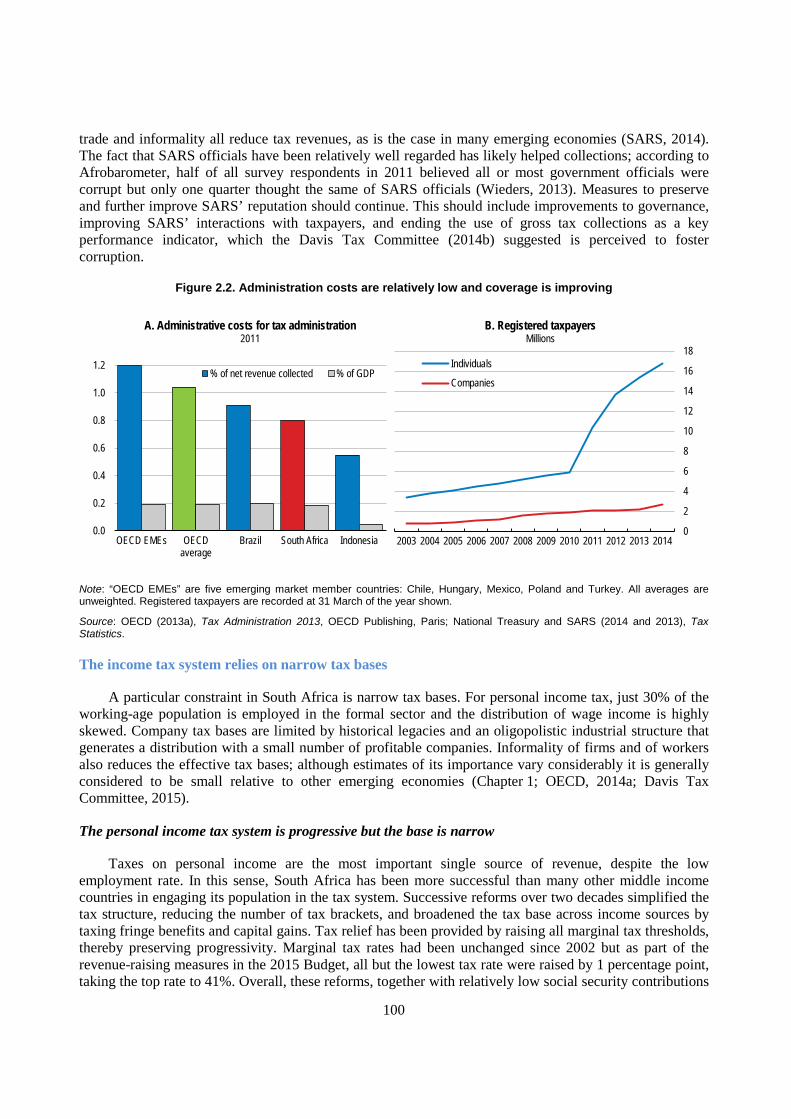
100
trade and informality all reduce tax revenues, as is the case in many emerging economies (SARS, 2014). The fact that SARS officials have been relatively well regarded has likely helped collections; according to Afrobarometer, half of all survey respondents in 2011 believed all or most government officials were corrupt but only one quarter thought the same of SARS officials (Wieders, 2013). Measures to preserve and further improve SARS’ reputation should continue. This should include improvements to governance, improving SARS’ interactions with taxpayers, and ending the use of gross tax collections as a key performance indicator, which the Davis Tax Committee (2014b) suggested is perceived to foster corruption.
Figure 2.2. Administration costs are relatively low and coverage is improving
Note: “OECD EMEs” are five emerging market member countries: Chile, Hungary, Mexico, Poland and Turkey. All averages are unweighted. Registered taxpayers are recorded at 31 March of the year shown.
Source: OECD (2013a), Tax Administration 2013, OECD Publishing, Paris; National Treasury and SARS (2014 and 2013), Tax Statistics.
The income tax system relies on narrow tax bases
A particular constraint in South Africa is narrow tax bases. For personal income tax, just 30% of the working-age population is employed in the formal sector and the distribution of wage income is highly skewed. Company tax bases are limited by historical legacies and an oligopolistic industrial structure that generates a distribution with a small number of profitable companies. Informality of firms and of workers also reduces the effective tax bases; although estimates of its importance vary considerably it is generally considered to be small relative to other emerging economies (Chapter 1; OECD, 2014a; Davis Tax Committee, 2015).
The personal income tax system is progressive but the base is narrow
Taxes on personal income are the most important single source of revenue, despite the low employment rate. In this sense, South Africa has been more successful than many other middle income countries in engaging its population in the tax system. Successive reforms over two decades simplified the tax structure, reducing the number of tax brackets, and broadened the tax base across income sources by taxing fringe benefits and capital gains. Tax relief has been provided by raising all marginal tax thresholds, thereby preserving progressivity. Marginal tax rates had been unchanged since 2002 but as part of the revenue-raising measures in the 2015 Budget, all but the lowest tax rate were raised by 1 percentage point, taking the top rate to 41%. Overall, these reforms, together with relatively low social security contributions
0.0
0.2
0.4
0.6
0.8
1.0
1.2
OECD EMEs OECDaverage
Brazil South Africa Indonesia
A. Administrative costs for tax administration2011
% of net revenue collected % of GDP
0
2
4
6
8
10
12
14
16
18
2003 2004 2005 2006 2007 2008 2009 2010 2011 2012 2013 2014
B. Registered taxpayersMillions
Individuals
Companies
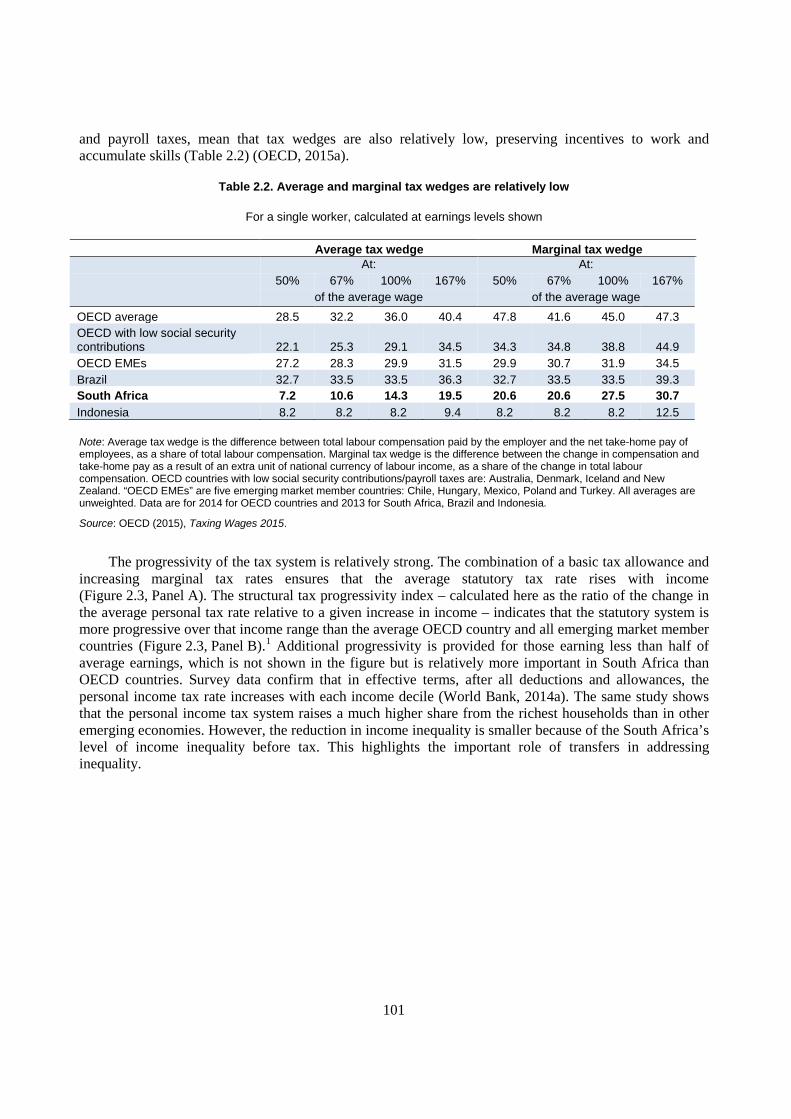
101
and payroll taxes, mean that tax wedges are also relatively low, preserving incentives to work and accumulate skills (Table 2.2) (OECD, 2015a).
Table 2.2. Average and marginal tax wedges are relatively low
For a single worker, calculated at earnings levels shown
Average tax wedge Marginal tax wedge At: At: 50% 67% 100% 167% 50% 67% 100% 167% of the average wage of the average wage
OECD average 28.5 32.2 36.0 40.4 47.8 41.6 45.0 47.3 OECD with low social security contributions 22.1 25.3 29.1 34.5 34.3 34.8 38.8 44.9 OECD EMEs 27.2 28.3 29.9 31.5 29.9 30.7 31.9 34.5 Brazil 32.7 33.5 33.5 36.3 32.7 33.5 33.5 39.3 South Africa 7.2 10.6 14.3 19.5 20.6 20.6 27.5 30.7 Indonesia 8.2 8.2 8.2 9.4 8.2 8.2 8.2 12.5
Note: Average tax wedge is the difference between total labour compensation paid by the employer and the net take-home pay of employees, as a share of total labour compensation. Marginal tax wedge is the difference between the change in compensation and take-home pay as a result of an extra unit of national currency of labour income, as a share of the change in total labour compensation. OECD countries with low social security contributions/payroll taxes are: Australia, Denmark, Iceland and New Zealand. “OECD EMEs” are five emerging market member countries: Chile, Hungary, Mexico, Poland and Turkey. All averages are unweighted. Data are for 2014 for OECD countries and 2013 for South Africa, Brazil and Indonesia.
Source: OECD (2015), Taxing Wages 2015.
The progressivity of the tax system is relatively strong. The combination of a basic tax allowance and increasing marginal tax rates ensures that the average statutory tax rate rises with income (Figure 2.3, Panel A). The structural tax progressivity index – calculated here as the ratio of the change in the average personal tax rate relative to a given increase in income – indicates that the statutory system is more progressive over that income range than the average OECD country and all emerging market member countries (Figure 2.3, Panel B).1 Additional progressivity is provided for those earning less than half of average earnings, which is not shown in the figure but is relatively more important in South Africa than OECD countries. Survey data confirm that in effective terms, after all deductions and allowances, the personal income tax rate increases with each income decile (World Bank, 2014a). The same study shows that the personal income tax system raises a much higher share from the richest households than in other emerging economies. However, the reduction in income inequality is smaller because of the South Africa’s level of income inequality before tax. This highlights the important role of transfers in addressing inequality.
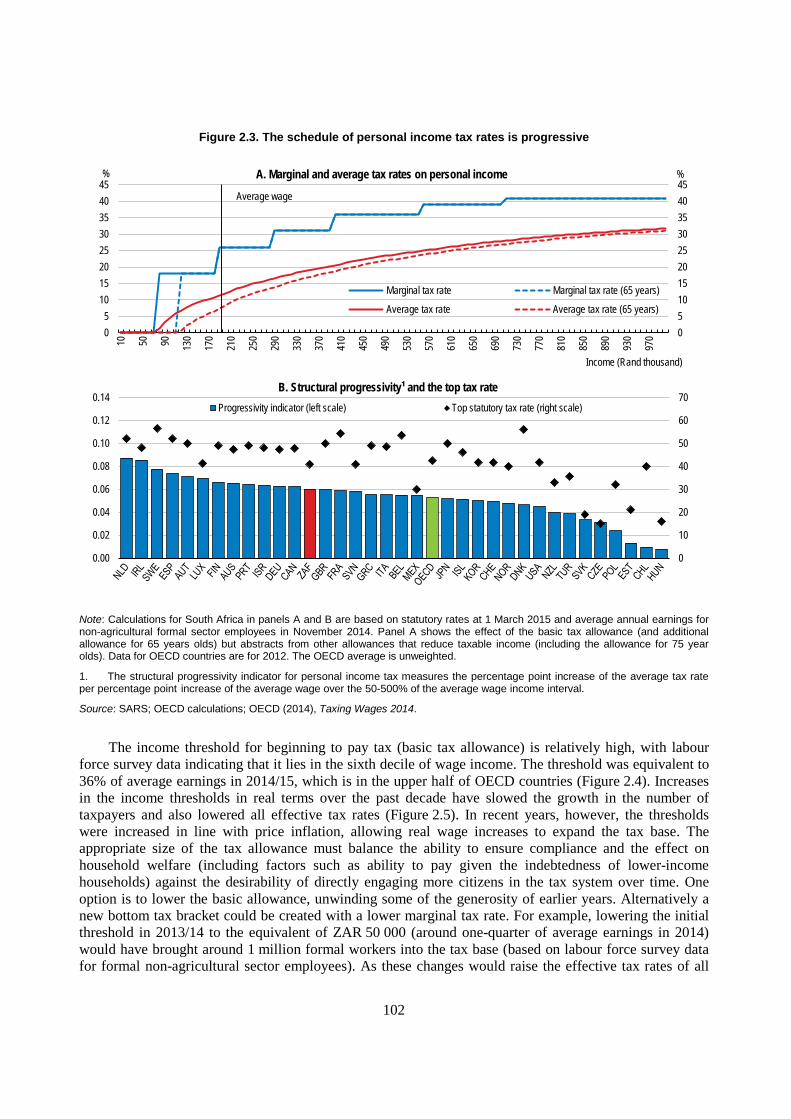
102
Figure 2.3. The schedule of personal income tax rates is progressive
Note: Calculations for South Africa in panels A and B are based on statutory rates at 1 March 2015 and average annual earnings for non-agricultural formal sector employees in November 2014. Panel A shows the effect of the basic tax allowance (and additional allowance for 65 years olds) but abstracts from other allowances that reduce taxable income (including the allowance for 75 year olds). Data for OECD countries are for 2012. The OECD average is unweighted.
1. The structural progressivity indicator for personal income tax measures the percentage point increase of the average tax rate per percentage point increase of the average wage over the 50-500% of the average wage income interval.
Source: SARS; OECD calculations; OECD (2014), Taxing Wages 2014.
The income threshold for beginning to pay tax (basic tax allowance) is relatively high, with labour force survey data indicating that it lies in the sixth decile of wage income. The threshold was equivalent to 36% of average earnings in 2014/15, which is in the upper half of OECD countries (Figure 2.4). Increases in the income thresholds in real terms over the past decade have slowed the growth in the number of taxpayers and also lowered all effective tax rates (Figure 2.5). In recent years, however, the thresholds were increased in line with price inflation, allowing real wage increases to expand the tax base. The appropriate size of the tax allowance must balance the ability to ensure compliance and the effect on household welfare (including factors such as ability to pay given the indebtedness of lower-income households) against the desirability of directly engaging more citizens in the tax system over time. One option is to lower the basic allowance, unwinding some of the generosity of earlier years. Alternatively a new bottom tax bracket could be created with a lower marginal tax rate. For example, lowering the initial threshold in 2013/14 to the equivalent of ZAR 50 000 (around one-quarter of average earnings in 2014) would have brought around 1 million formal workers into the tax base (based on labour force survey data for formal non-agricultural sector employees). As these changes would raise the effective tax rates of all
051015202530354045
05
1015202530354045
10 50 90 130
170
210
250
290
330
370
410
450
490
530
570
610
650
690
730
770
810
850
890
930
970
%%
Income (Rand thousand)
A. Marginal and average tax rates on personal income
Marginal tax rate Marginal tax rate (65 years)
Average tax rate Average tax rate (65 years)
Average wage
0
10
20
30
40
50
60
70
0.00
0.02
0.04
0.06
0.08
0.10
0.12
0.14B. Structural progressivity¹ and the top tax rate
Progressivity indicator (left scale) Top statutory tax rate (right scale)
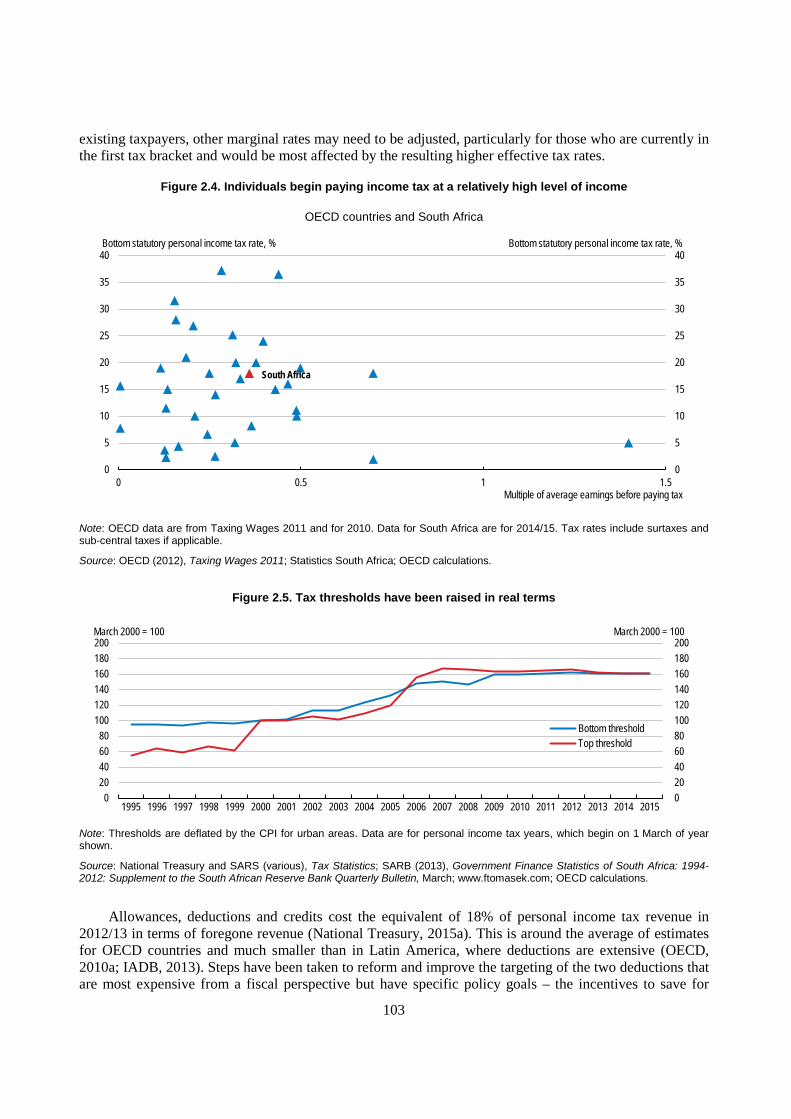
103
existing taxpayers, other marginal rates may need to be adjusted, particularly for those who are currently in the first tax bracket and would be most affected by the resulting higher effective tax rates.
Figure 2.4. Individuals begin paying income tax at a relatively high level of income
OECD countries and South Africa
Note: OECD data are from Taxing Wages 2011 and for 2010. Data for South Africa are for 2014/15. Tax rates include surtaxes and sub-central taxes if applicable.
Source: OECD (2012), Taxing Wages 2011; Statistics South Africa; OECD calculations.
Figure 2.5. Tax thresholds have been raised in real terms
Note: Thresholds are deflated by the CPI for urban areas. Data are for personal income tax years, which begin on 1 March of year shown.
Source: National Treasury and SARS (various), Tax Statistics; SARB (2013), Government Finance Statistics of South Africa: 1994-2012: Supplement to the South African Reserve Bank Quarterly Bulletin, March; www.ftomasek.com; OECD calculations.
Allowances, deductions and credits cost the equivalent of 18% of personal income tax revenue in 2012/13 in terms of foregone revenue (National Treasury, 2015a). This is around the average of estimates for OECD countries and much smaller than in Latin America, where deductions are extensive (OECD, 2010a; IADB, 2013). Steps have been taken to reform and improve the targeting of the two deductions that are most expensive from a fiscal perspective but have specific policy goals – the incentives to save for
South Africa
0
5
10
15
20
25
30
35
40
0
5
10
15
20
25
30
35
40
0 0.5 1 1.5
Bottom statutory personal income tax rate, %
Multiple of average earnings before paying tax
Bottom statutory personal income tax rate, %
0 20 40 60 80 100 120 140 160 180 200
0 20 40 60 80
100 120 140 160 180 200
1995 1996 1997 1998 1999 2000 2001 2002 2003 2004 2005 2006 2007 2008 2009 2010 2011 2012 2013 2014 2015
March 2000 = 100March 2000 = 100
Bottom thresholdTop threshold
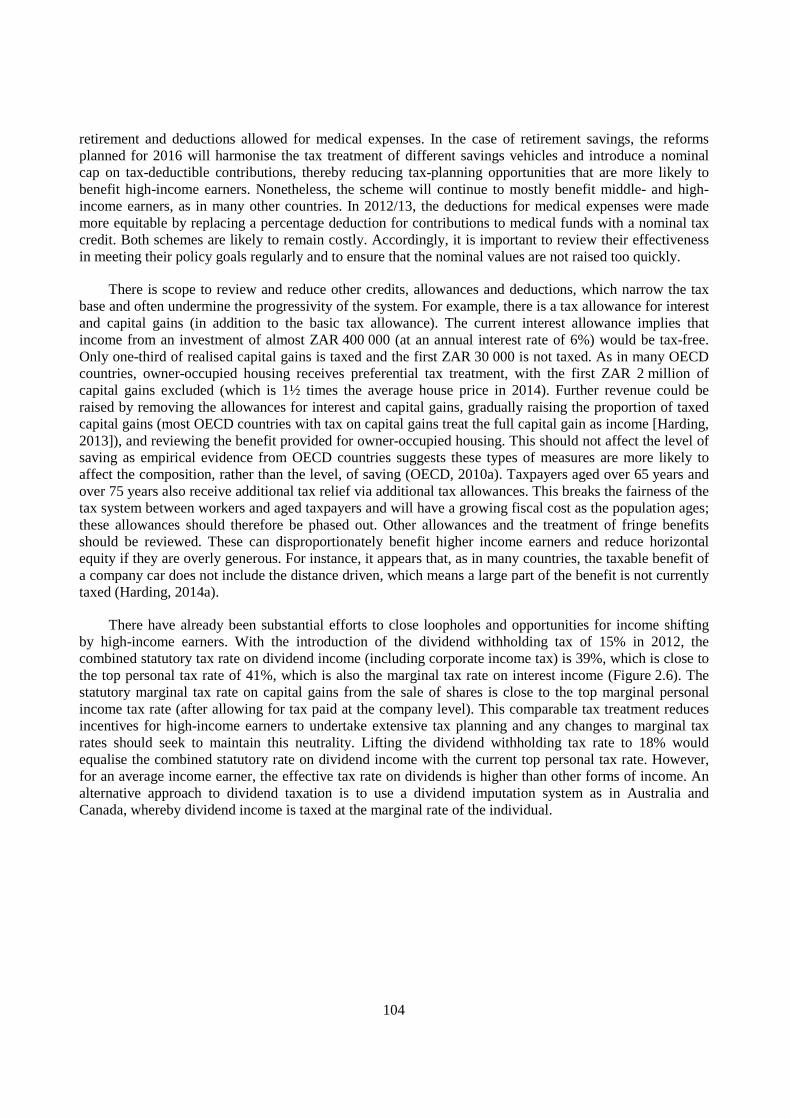
104
retirement and deductions allowed for medical expenses. In the case of retirement savings, the reforms planned for 2016 will harmonise the tax treatment of different savings vehicles and introduce a nominal cap on tax-deductible contributions, thereby reducing tax-planning opportunities that are more likely to benefit high-income earners. Nonetheless, the scheme will continue to mostly benefit middle- and high-income earners, as in many other countries. In 2012/13, the deductions for medical expenses were made more equitable by replacing a percentage deduction for contributions to medical funds with a nominal tax credit. Both schemes are likely to remain costly. Accordingly, it is important to review their effectiveness in meeting their policy goals regularly and to ensure that the nominal values are not raised too quickly.
There is scope to review and reduce other credits, allowances and deductions, which narrow the tax base and often undermine the progressivity of the system. For example, there is a tax allowance for interest and capital gains (in addition to the basic tax allowance). The current interest allowance implies that income from an investment of almost ZAR 400 000 (at an annual interest rate of 6%) would be tax-free. Only one-third of realised capital gains is taxed and the first ZAR 30 000 is not taxed. As in many OECD countries, owner-occupied housing receives preferential tax treatment, with the first ZAR 2 million of capital gains excluded (which is 1½ times the average house price in 2014). Further revenue could be raised by removing the allowances for interest and capital gains, gradually raising the proportion of taxed capital gains (most OECD countries with tax on capital gains treat the full capital gain as income [Harding, 2013]), and reviewing the benefit provided for owner-occupied housing. This should not affect the level of saving as empirical evidence from OECD countries suggests these types of measures are more likely to affect the composition, rather than the level, of saving (OECD, 2010a). Taxpayers aged over 65 years and over 75 years also receive additional tax relief via additional tax allowances. This breaks the fairness of the tax system between workers and aged taxpayers and will have a growing fiscal cost as the population ages; these allowances should therefore be phased out. Other allowances and the treatment of fringe benefits should be reviewed. These can disproportionately benefit higher income earners and reduce horizontal equity if they are overly generous. For instance, it appears that, as in many countries, the taxable benefit of a company car does not include the distance driven, which means a large part of the benefit is not currently taxed (Harding, 2014a).
There have already been substantial efforts to close loopholes and opportunities for income shifting by high-income earners. With the introduction of the dividend withholding tax of 15% in 2012, the combined statutory tax rate on dividend income (including corporate income tax) is 39%, which is close to the top personal tax rate of 41%, which is also the marginal tax rate on interest income (Figure 2.6). The statutory marginal tax rate on capital gains from the sale of shares is close to the top marginal personal income tax rate (after allowing for tax paid at the company level). This comparable tax treatment reduces incentives for high-income earners to undertake extensive tax planning and any changes to marginal tax rates should seek to maintain this neutrality. Lifting the dividend withholding tax rate to 18% would equalise the combined statutory rate on dividend income with the current top personal tax rate. However, for an average income earner, the effective tax rate on dividends is higher than other forms of income. An alternative approach to dividend taxation is to use a dividend imputation system as in Australia and Canada, whereby dividend income is taxed at the marginal rate of the individual.
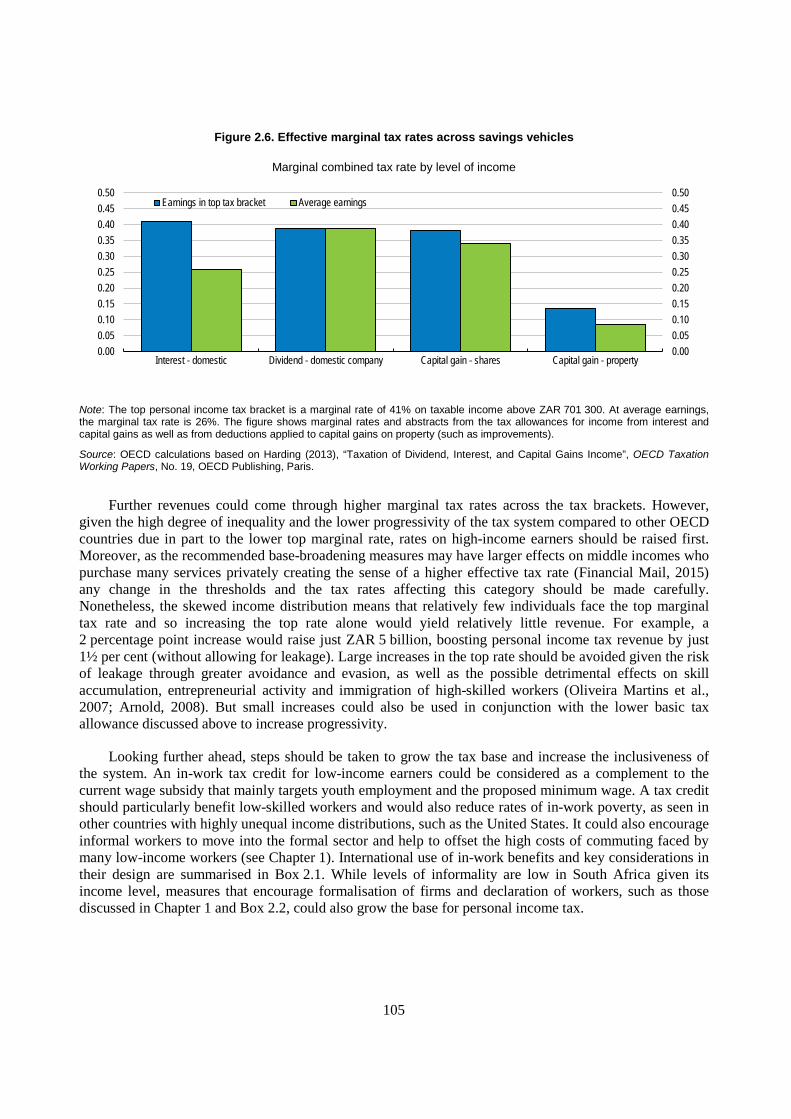
105
Figure 2.6. Effective marginal tax rates across savings vehicles
Marginal combined tax rate by level of income
Note: The top personal income tax bracket is a marginal rate of 41% on taxable income above ZAR 701 300. At average earnings, the marginal tax rate is 26%. The figure shows marginal rates and abstracts from the tax allowances for income from interest and capital gains as well as from deductions applied to capital gains on property (such as improvements).
Source: OECD calculations based on Harding (2013), “Taxation of Dividend, Interest, and Capital Gains Income”, OECD Taxation Working Papers, No. 19, OECD Publishing, Paris.
Further revenues could come through higher marginal tax rates across the tax brackets. However, given the high degree of inequality and the lower progressivity of the tax system compared to other OECD countries due in part to the lower top marginal rate, rates on high-income earners should be raised first. Moreover, as the recommended base-broadening measures may have larger effects on middle incomes who purchase many services privately creating the sense of a higher effective tax rate (Financial Mail, 2015) any change in the thresholds and the tax rates affecting this category should be made carefully. Nonetheless, the skewed income distribution means that relatively few individuals face the top marginal tax rate and so increasing the top rate alone would yield relatively little revenue. For example, a 2 percentage point increase would raise just ZAR 5 billion, boosting personal income tax revenue by just 1½ per cent (without allowing for leakage). Large increases in the top rate should be avoided given the risk of leakage through greater avoidance and evasion, as well as the possible detrimental effects on skill accumulation, entrepreneurial activity and immigration of high-skilled workers (Oliveira Martins et al., 2007; Arnold, 2008). But small increases could also be used in conjunction with the lower basic tax allowance discussed above to increase progressivity.
Looking further ahead, steps should be taken to grow the tax base and increase the inclusiveness of the system. An in-work tax credit for low-income earners could be considered as a complement to the current wage subsidy that mainly targets youth employment and the proposed minimum wage. A tax credit should particularly benefit low-skilled workers and would also reduce rates of in-work poverty, as seen in other countries with highly unequal income distributions, such as the United States. It could also encourage informal workers to move into the formal sector and help to offset the high costs of commuting faced by many low-income workers (see Chapter 1). International use of in-work benefits and key considerations in their design are summarised in Box 2.1. While levels of informality are low in South Africa given its income level, measures that encourage formalisation of firms and declaration of workers, such as those discussed in Chapter 1 and Box 2.2, could also grow the base for personal income tax.
0.000.050.100.150.200.250.300.350.400.450.50
0.000.050.100.150.200.250.300.350.400.450.50
Interest - domestic Dividend - domestic company Capital gain - shares Capital gain - property
Earnings in top tax bracket Average earnings
106
Box 2.1. International experience with in-work benefits
OECD countries have increasingly used measures to “make work pay” in order to strengthen financial incentives to work and support the living standards of low-income households at the same time. A growing number of these schemes offer benefits or a tax credit conditional on employment. Most of these take the form of a refundable tax credit, and imply a negative tax burden for some groups. In Ireland, the United Kingdom and the United States, the schemes are aimed at reducing poverty. There is evidence that the positive effects of additional employment on earnings outweigh the effects of reduced incentives to increase work (Immervoll and Pearson, 2009). There are a number of design considerations highlighted from these experiences (OECD, 2005; Immervoll and Pearson, 2009).
• Trading off size and cost: To increase the employment rate, the benefit needs to be sufficiently large relative to income received out of work. Given the need to contain costs, the system may need to be more targeted or to include a time limit for the benefit. For instance, some schemes are targeted at sole parents or are conditional on working a given number of hours. Targeting can also reduce the number of “windfall beneficiaries”: i.e. individuals who would work irrespectively of the benefit. Against this, targeting may be seen as inequitable. A time limit can maintain incentives for wage progression and skill accumulation but wage progression for low skilled workers is typically low (OECD, 2005).
• Phasing the benefit: The speed at which the credit is phased out can result in high effective marginal tax rates, reducing incentives to increase earnings. The phase-out will be less sleep when the benefit is lower. The phase-out can also provide support to individuals if their income falls. The benefit may also be phased in or available only above a threshold in order to target a minimum level of activity.
• Awareness: Target groups should be made aware of their entitlement.
• Administration: Payment could occur through the wage system or the benefit system. Payment through the wage system imposes a cost on employers and restricts the coverage of the credit to employees of formal firms but is administratively easier for government and may avoid the stigma of receiving benefits.
• Integration with the overall policy framework: The policy can be more effective if accompanied by active labour market policies, such as job search assistance. The interaction with the minimum wage is also important if the bargaining power of workers is very weak. Without a minimum wage, or with a low wage, employers may absorb the tax credit. With a minimum wage, the benefit is more likely to accrue to the worker. However, with a high minimum wage, in-work benefits have less “space” to operate effectively (Immervoll and Pearson, 2009).
Corporate tax revenues are highly concentrated
Corporate income tax is another important source of revenue. The standard statutory rate on corporate income has been largely unchanged since 1999 but there have been other important measures to lower the effective burden. Most notably, in 2012 the “secondary tax on companies” that was paid on all distributed dividends was replaced by the dividend tax, which is essentially paid only by individuals and foreign shareholders (but may be reduced by tax treaties). Tax rates for foreign firms were also lowered to the standard rate of 28%. Reforms over the past two decades have also aimed at increasing compliance and closing loopholes that facilitated tax avoidance. Overall, these changes to the corporate income tax system boosted its revenue-raising capacity and were reinforced by strong economic growth and the benefits of the commodity price boom during the early-to-mid 2000s, thereby doubling corporate tax revenues as a share of GDP (Figure 2.7, Panel A). However, revenues fell sharply during the financial crisis and have not yet recovered, reflecting the greater sensitivity of corporate income tax revenue to the economic cycle (compared to personal income tax revenue, for example) and that tax losses from earlier years are still being carried forward (National Treasury and SARS, 2014).
The corporate tax burden, measured as a percentage of GDP, appears relatively high compared to many OECD and non-OECD countries, despite falling after the crisis (Figure 2.7, Panel B). This partly reflects that the statutory rate is somewhat higher and has remained largely unchanged over the past decade, whereas many other countries lowered their rates (Figure 2.8). But it also reflects the economy’s concentrated industrial structure, with industries that are typically highly concentrated and have large rents, such as financial services and mining, as well as a general lack of medium-sized firms. This concentration
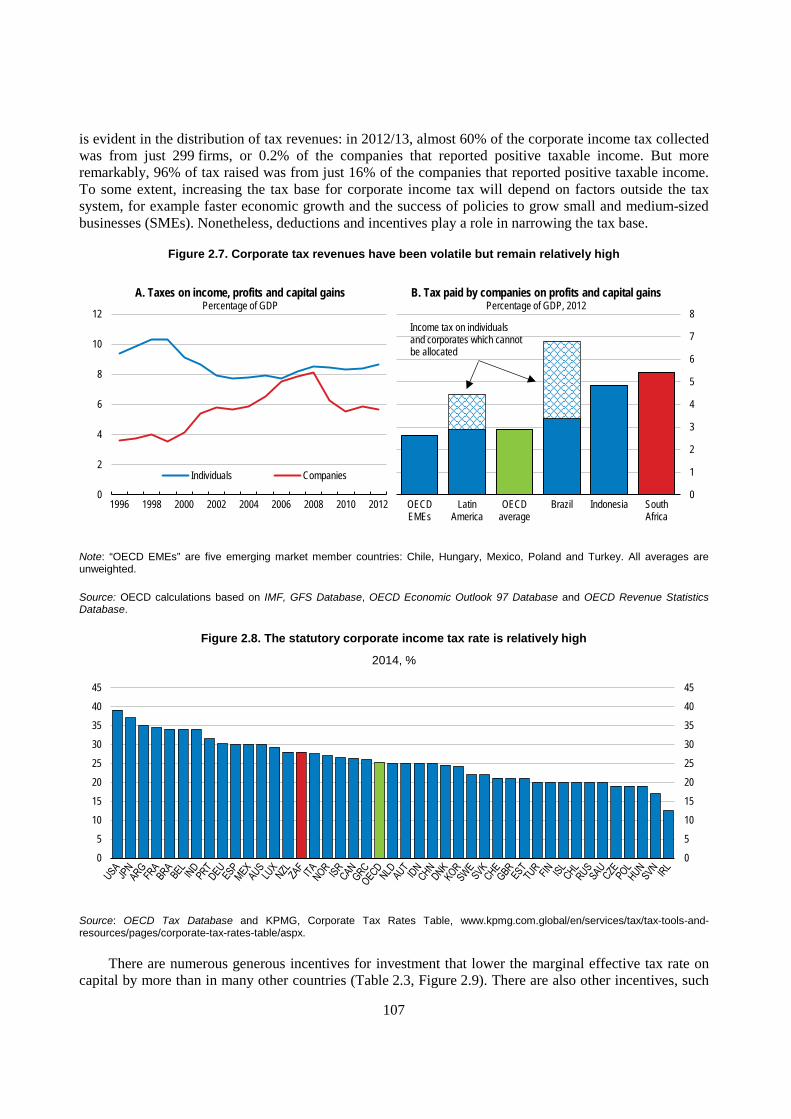
107
is evident in the distribution of tax revenues: in 2012/13, almost 60% of the corporate income tax collected was from just 299 firms, or 0.2% of the companies that reported positive taxable income. But more remarkably, 96% of tax raised was from just 16% of the companies that reported positive taxable income. To some extent, increasing the tax base for corporate income tax will depend on factors outside the tax system, for example faster economic growth and the success of policies to grow small and medium-sized businesses (SMEs). Nonetheless, deductions and incentives play a role in narrowing the tax base.
Figure 2.7. Corporate tax revenues have been volatile but remain relatively high
Note: “OECD EMEs” are five emerging market member countries: Chile, Hungary, Mexico, Poland and Turkey. All averages are unweighted.
Source: OECD calculations based on IMF, GFS Database, OECD Economic Outlook 97 Database and OECD Revenue Statistics Database.
Figure 2.8. The statutory corporate income tax rate is relatively high
2014, %
Source: OECD Tax Database and KPMG, Corporate Tax Rates Table, www.kpmg.com.global/en/services/tax/tax-tools-and-resources/pages/corporate-tax-rates-table/aspx.
There are numerous generous incentives for investment that lower the marginal effective tax rate on capital by more than in many other countries (Table 2.3, Figure 2.9). There are also other incentives, such
0
2
4
6
8
10
12
1996 1998 2000 2002 2004 2006 2008 2010 2012
A. Taxes on income, profits and capital gainsPercentage of GDP
Individuals Companies
0
1
2
3
4
5
6
7
8
OECDEMEs
LatinAmerica
OECDaverage
Brazil Indonesia SouthAfrica
B. Tax paid by companies on profits and capital gainsPercentage of GDP, 2012
Income tax on individuals and corporates which cannot be allocated
0
5
10
15
20
25
30
35
40
45
0
5
10
15
20
25
30
35
40
45
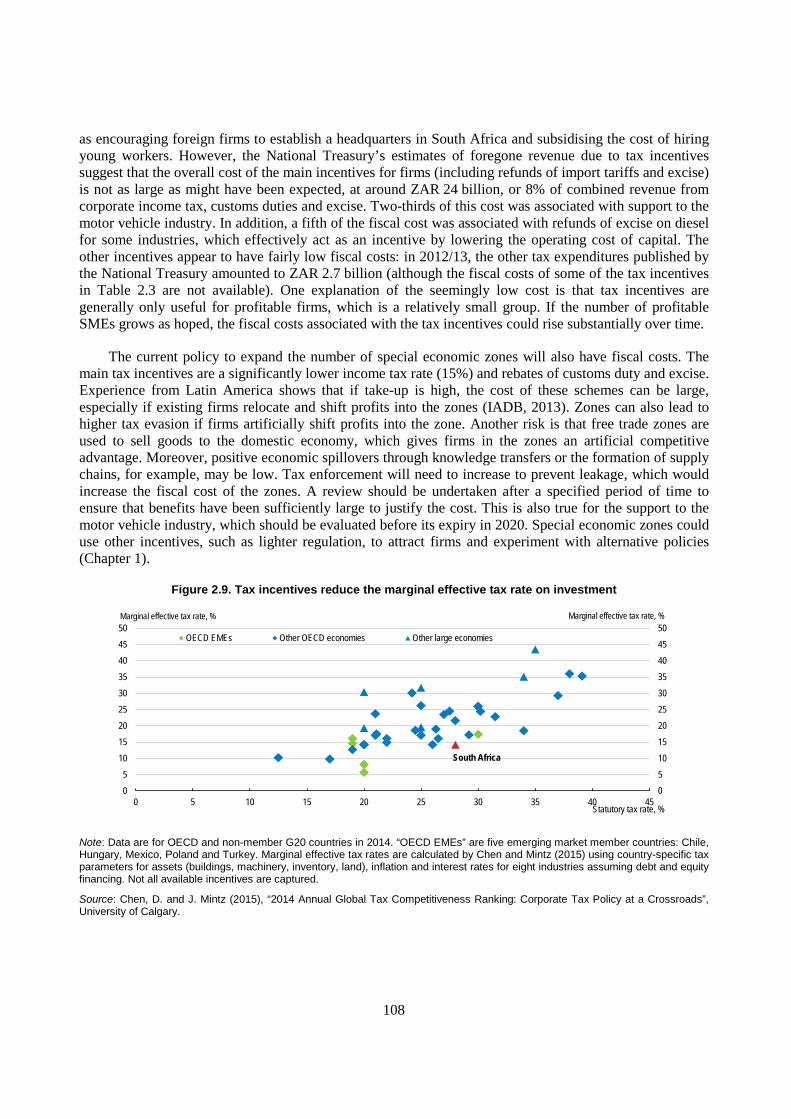
108
as encouraging foreign firms to establish a headquarters in South Africa and subsidising the cost of hiring young workers. However, the National Treasury’s estimates of foregone revenue due to tax incentives suggest that the overall cost of the main incentives for firms (including refunds of import tariffs and excise) is not as large as might have been expected, at around ZAR 24 billion, or 8% of combined revenue from corporate income tax, customs duties and excise. Two-thirds of this cost was associated with support to the motor vehicle industry. In addition, a fifth of the fiscal cost was associated with refunds of excise on diesel for some industries, which effectively act as an incentive by lowering the operating cost of capital. The other incentives appear to have fairly low fiscal costs: in 2012/13, the other tax expenditures published by the National Treasury amounted to ZAR 2.7 billion (although the fiscal costs of some of the tax incentives in Table 2.3 are not available). One explanation of the seemingly low cost is that tax incentives are generally only useful for profitable firms, which is a relatively small group. If the number of profitable SMEs grows as hoped, the fiscal costs associated with the tax incentives could rise substantially over time.
The current policy to expand the number of special economic zones will also have fiscal costs. The main tax incentives are a significantly lower income tax rate (15%) and rebates of customs duty and excise. Experience from Latin America shows that if take-up is high, the cost of these schemes can be large, especially if existing firms relocate and shift profits into the zones (IADB, 2013). Zones can also lead to higher tax evasion if firms artificially shift profits into the zone. Another risk is that free trade zones are used to sell goods to the domestic economy, which gives firms in the zones an artificial competitive advantage. Moreover, positive economic spillovers through knowledge transfers or the formation of supply chains, for example, may be low. Tax enforcement will need to increase to prevent leakage, which would increase the fiscal cost of the zones. A review should be undertaken after a specified period of time to ensure that benefits have been sufficiently large to justify the cost. This is also true for the support to the motor vehicle industry, which should be evaluated before its expiry in 2020. Special economic zones could use other incentives, such as lighter regulation, to attract firms and experiment with alternative policies (Chapter 1).
Figure 2.9. Tax incentives reduce the marginal effective tax rate on investment
Note: Data are for OECD and non-member G20 countries in 2014. “OECD EMEs” are five emerging market member countries: Chile, Hungary, Mexico, Poland and Turkey. Marginal effective tax rates are calculated by Chen and Mintz (2015) using country-specific tax parameters for assets (buildings, machinery, inventory, land), inflation and interest rates for eight industries assuming debt and equity financing. Not all available incentives are captured.
Source: Chen, D. and J. Mintz (2015), “2014 Annual Global Tax Competitiveness Ranking: Corporate Tax Policy at a Crossroads”, University of Calgary.
0
5
10
15
20
25
30
35
40
45
50
0
5
10
15
20
25
30
35
40
45
50
0 5 10 15 20 25 30 35 40 45
Marginal effective tax rate, %Marginal effective tax rate, %
Statutory tax rate, %
OECD EMEs Other OECD economies Other large economies
South Africa
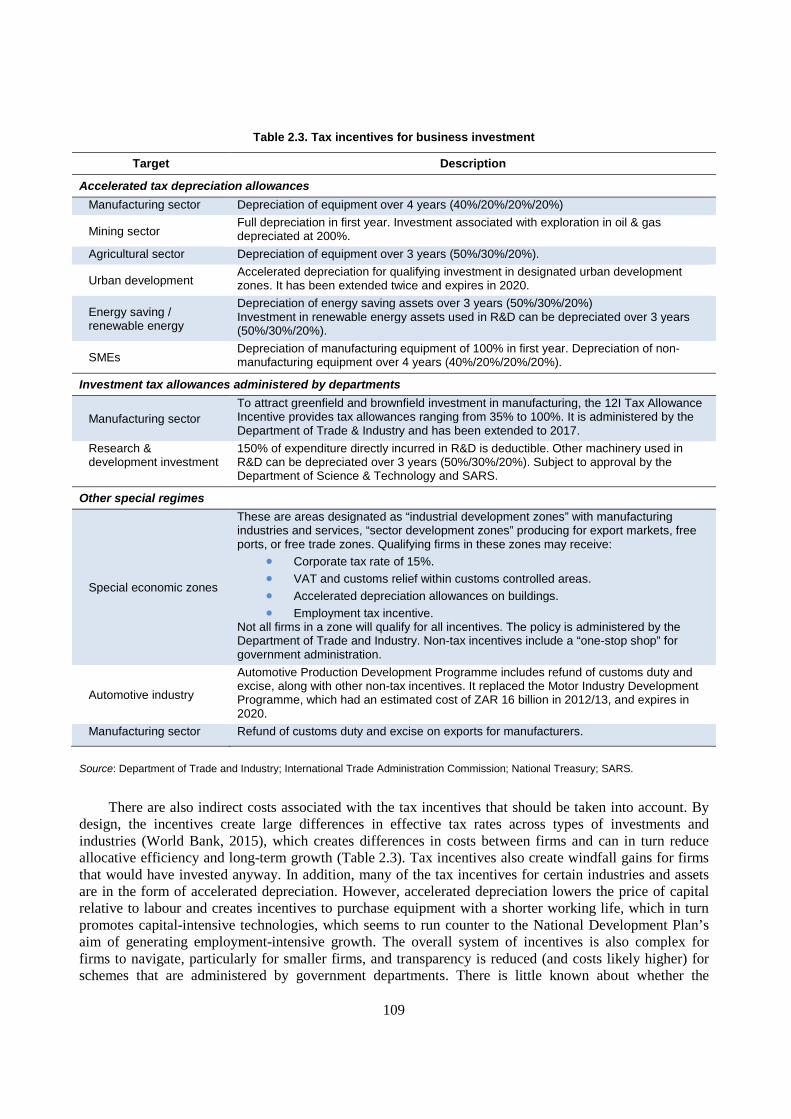
109
Table 2.3. Tax incentives for business investment
Target Description
Accelerated tax depreciation allowances Manufacturing sector Depreciation of equipment over 4 years (40%/20%/20%/20%)
Mining sector Full depreciation in first year. Investment associated with exploration in oil & gas depreciated at 200%.
Agricultural sector Depreciation of equipment over 3 years (50%/30%/20%).
Urban development Accelerated depreciation for qualifying investment in designated urban development zones. It has been extended twice and expires in 2020.
Energy saving / renewable energy
Depreciation of energy saving assets over 3 years (50%/30%/20%) Investment in renewable energy assets used in R&D can be depreciated over 3 years (50%/30%/20%).
SMEs Depreciation of manufacturing equipment of 100% in first year. Depreciation of non-manufacturing equipment over 4 years (40%/20%/20%/20%).
Investment tax allowances administered by departments
Manufacturing sector To attract greenfield and brownfield investment in manufacturing, the 12I Tax Allowance Incentive provides tax allowances ranging from 35% to 100%. It is administered by the Department of Trade & Industry and has been extended to 2017.
Research & development investment
150% of expenditure directly incurred in R&D is deductible. Other machinery used in R&D can be depreciated over 3 years (50%/30%/20%). Subject to approval by the Department of Science & Technology and SARS.
Other special regimes
Special economic zones
These are areas designated as “industrial development zones” with manufacturing industries and services, “sector development zones” producing for export markets, free ports, or free trade zones. Qualifying firms in these zones may receive:
• Corporate tax rate of 15%. • VAT and customs relief within customs controlled areas. • Accelerated depreciation allowances on buildings. • Employment tax incentive.
Not all firms in a zone will qualify for all incentives. The policy is administered by the Department of Trade and Industry. Non-tax incentives include a “one-stop shop” for government administration.
Automotive industry
Automotive Production Development Programme includes refund of customs duty and excise, along with other non-tax incentives. It replaced the Motor Industry Development Programme, which had an estimated cost of ZAR 16 billion in 2012/13, and expires in 2020.
Manufacturing sector Refund of customs duty and excise on exports for manufacturers.
Source: Department of Trade and Industry; International Trade Administration Commission; National Treasury; SARS.
There are also indirect costs associated with the tax incentives that should be taken into account. By design, the incentives create large differences in effective tax rates across types of investments and industries (World Bank, 2015), which creates differences in costs between firms and can in turn reduce allocative efficiency and long-term growth (Table 2.3). Tax incentives also create windfall gains for firms that would have invested anyway. In addition, many of the tax incentives for certain industries and assets are in the form of accelerated depreciation. However, accelerated depreciation lowers the price of capital relative to labour and creates incentives to purchase equipment with a shorter working life, which in turn promotes capital-intensive technologies, which seems to run counter to the National Development Plan’s aim of generating employment-intensive growth. The overall system of incentives is also complex for firms to navigate, particularly for smaller firms, and transparency is reduced (and costs likely higher) for schemes that are administered by government departments. There is little known about whether the
110
incentives are effective (Davis Tax Committee, 2015). The larger schemes, such as that for the automobile industry, have sunset clauses, securing regular reviews. Reviews should take into account the cost effectiveness of the policy and should be extended to all incentives, including targeted accelerated tax depreciation allowances. The system of deductions should be simplified with a view to reducing the fiscal and non-fiscal cost of the incentives. Alternative ways of boosting investment could include providing more regulatory certainty and reducing red tape (see Chapter 1) or lowering the statutory corporate tax rate.
SMEs pay relatively little tax due to low levels of profitability as well as low effective rates of tax. For profitable SMEs, effective tax rates are lowered by special regimes to lower barriers to formalisation and reduce compliance costs. A “Small Business Corporations” regime exists for firms with turnover between ZAR 1 million and ZAR 20 million, and has the same basic tax allowance as in the personal income tax system, progressive marginal tax rates up to the statutory corporate tax rate and accelerated depreciation allowances. A simplified regime exists for microbusinesses (including the self-employed) with turnover of up to ZAR 1 million. It allows tax-free income of ZAR 335 000 and a marginal rate that rises to 3% of turnover. In 2015, the tax burden for microbusinesses was lightened following recommendations by the Davis Tax Committee, which highlighted the low level of registration (just 7 827 firms) as evidence of the scheme’s ineffectiveness. The reduced rates and depreciation allowances under the Small Business Corporation scheme appear to be an ineffective way of compensating SMEs for compliance costs as SMEs are characterised by low levels of profitability and tend to be labour-intensive, which reduces the value of these incentives. Similar conclusions have been drawn from the experience of OECD countries (Johansson et al., 2008).
Directly lowering the compliance costs imposed by the tax system would provide tangible benefits to existing SMEs and also lower barriers to formalisation. A key cost is due to VAT (Smulders et al., 2012; FIAS, 2007). A common method of reducing the burden of VAT is to exempt firms below a turnover threshold. However, in South Africa, the exemption seems particularly high, at turnover of ZAR 1 million – around 5½ times the PPP-adjusted level of similar thresholds in OECD countries. Firms may – and do – register voluntarily if turnover is at least ZAR 50 000. Therefore, mechanisms to reduce VAT-related compliance costs should be explored. Options include a simplified VAT calculation for microbusinesses that register for VAT and allowing all SMEs to use cash accounting for VAT (OECD, 2009). Advances in technology can help lower costs by improving processes: in Chile, where VAT registration is compulsory, electronic invoicing has been crucial in making the system cost-effective (OECD, 2009; OECD, 2014b). Because of the benefits of linking firms to the formal sector, a lower VAT threshold should be considered. Determining the appropriate VAT threshold involves balancing several factors, including: the cost to the firm of increased compliance and tax; net VAT revenue to the government after administrative costs; benefits to firms of being brought into the formal system and keeping financial records; the improvement in the self-enforcement of the VAT; and the potential effect on tax fraud (OECD, 2009).
Compliance costs also arise from the complexity of the Small Business Corporation regime, inefficiencies within SARS and the frequent changes to policies and requirements for tax clearance certificates (Darroll, 2015; Smulders et al., 2012). (Tax clearance certificates certify that a business has no tax debt and are often required for business transactions but can be difficult to obtain, in part because they must be physically collected from a SARS branch.) The reduced rates under the Small Business Corporation regime could be removed if compliance costs could be lowered tangibly or a rebate for compliance was provided (as proposed by the Davis Tax Committee (2014a)). The process for obtaining a tax clearance certificate and resolving problems with outstanding certificates should be simplified further. Registration could be simplified and encouraged through incentives and penalties for delayed registration could also be reduced to ensure they are not a deterrent to registration. Reforms in Brazil and Mexico provide examples of schemes to encourage formalisation using reduced red tape, financial incentives and administrative assistance (Box 2.2). However, since many of the barriers facing SMEs in South Africa originate outside of the tax system, other reforms are also important (see Chapter 1).
111
Box 2.2. Schemes to encourage formalisation of small businesses in other countries
Brazilian initiatives
Brazil’s Simples Nacional regime, established in 2006, aims to lower tax compliance costs and encourage formalisation, and also includes a special programme targeting individual entrepreneurs. The scheme reduces red tape associated with company registration by using a website and replaces eight taxes and contributions with one monthly tax payment. Microbusinesses are those with annual gross revenue of up to ZAR 0.9 million (BRL 240 000) while small businesses have revenue between ZAR 0.9 million and ZAR 9 million (BRL 2.4 million).
A programme for individual entrepreneurs requires that they have annual income of no more than ZAR 140 000 (BRL 36 000), work alone or with just one employee, and do not own or manage another company. Benefits of the programme include: a fixed monthly tax; registration on the National Register of Legal Entities, which facilitates opening a bank account, applying for a loan and issuing invoices; and access to a retirement pension, sickness and maternity leave and workplace accident insurance.
Participation in the scheme has risen strongly and it has helped the encouraged formalisation of firms and workers (OECD, 2012).
Mexican initiatives
In 2014 Mexico replaced its scheme for self-employed entrepreneurs to encourage formalisation. The Regimen de Incorporacion Fiscal aims to encourage informal businesses to join the tax system with the certainty of a 10-year framework. After that period, they would be transferred to the general income tax scheme. The scheme includes a number of incentives to join: a 100% reduction in income tax, which is phased down to zero over the 10 years; a 100% credit against VAT and excise taxes (Special Tax on Production and Services) in the first year; access to financing from the Nacional Financiera (a public bank), financial support from the National Institute of the Entrepreneur and training by the tax office; and electronic tools that simplify tax compliance.
It is still relatively early to judge its success but it appears to have encouraged registration (OECD, 2015b).
The tax base is also reduced by (legal) tax avoidance and profit-shifting measures taken by multinational companies. The importance of these activities is difficult to estimate but the Davis Tax Committee assesses it to be sizeable, pointing to a 33% increase in legal and marketing consulting services despite the financial crisis (Davis Tax Committee, 2014b). As well as directly reducing government revenue, these activities can affect growth, by distorting competition and reducing the efficient allocation of resources, and also reduce other taxpayers’ compliance (OECD, 2013b, 2013c). The main tools used to fight base erosion and profit shifting (BEPS), such as thin capitalisation rules and transfer pricing rules, were put in place following the re-opening of financial borders in 1994.2 Most recently, withholding tax rates on non-resident income from dividends, interest, and royalties were harmonised (and also service fees from 2016) and double taxation agreements that facilitated tax avoidance are gradually being renegotiated. The Davis Tax Committee made a number of reform recommendations (Box 2.3) which could boost tax revenues, particularly given the co-ordinated nature of the OECD/G20 project. International co-operation on these issues should continue; this involves ensuring South Africa’s regimes comply with the OECD/G20 BEPS guidelines on harmful tax practices issued as part of the BEPS project (OECD, 2014c).
Box 2.3. Davis Tax Committee recommendations for tackling base erosion and profit shifting (“BEPS”)
The Davis Tax Committee made general recommendations and specific recommendations pertaining to OECD/G20 BEPS Project action plan items, which can be summarised as follows:
• Consider requesting the IMF to undertake a comprehensive tax gap analysis identifying the difference between actual revenues and what should have been collected as the legislation intended.
112
• Endorse the OECD principle of an “Enhanced Relationship” between taxpayers, their advisers and tax authorities. SARS should build its administrative capacity and quality of staff. End the use of gross tax collections as a performance indicator for SARS.
• Increase collaboration between SARS and the Reserve Bank to prevent circumvention of existing rules. Making tax clearance certificate compulsory for some high risk transactions involving individuals was also proposed. (The report acknowledges these measures may be perceived as tightening exchange controls or increasing red tape.)
• Digital economy (Action 1): Introduce new rules and further guidelines to capture VAT based on the place of consumption. Require all non-resident suppliers to submit tax returns. Review the administrative burden imposed on foreign suppliers. Changes should be in line with OECD guidelines but review the economic impact of new rules before implementation.
• Hybrid mismatch arrangements (Action 2): Align hybrid entities legislation with OECD guidelines and G20 practices. Shift anti-avoidance legislation relating to hybrid instruments from a transactions-based to principles-based approach. In other areas, move slowly to avoid being out of line with other countries.
• Harmful tax practices (Action 5): Consider changing the special regime for company headquarters from a holding company regime to a full headquarter regime that meets minimum substance requirements under OECD principles and ensure special investment zones are also compliant. SARS should notify other countries’ tax authorities of relevant tax rulings and ensure that tax rulings do not foster harmful practices.
• Treaty abuse (Action 6): Renegotiate key treaties that lead to treaty shopping or amend them through a protocol. Be mindful of base erosion when negotiating future tax treaties. Reconsider the section of the tax act which transfers taxing rights to the treaty partner.
• Transfer pricing for intangibles (Action 8): Consider adopting OECD recommendations where appropriate, taking care not to disadvantage South Africa’s competitive position in intellectual property development through overly restrictive legislation.
• Transfer pricing documentation (Action 13): Revise guidelines which are currently outdated and vague to be in line with current OECD guidelines. Make the OECD-recommended approach regarding documentation compulsory for large multinational companies. SARS should balance requests for documentation against expected costs to the taxpayer and it should consider an incentive programme to encourage compliance. Share information across authorities, e.g. the Reserve Bank’s capital outflows data.
• Multilateral instrument (Action 15): Support the OECD’s proposed multilateral agreement instrument to amend bilateral treaties subject to the appropriateness of the amendments for South Africa.
Source: Davis Tax Committee (2014b)
Indirect taxation has a broad base
The VAT system performs relatively well
The VAT is the single largest source of indirect tax, averaging one fifth of government revenue over the past decade and raising revenue comparable to that of OECD countries (Figure 2.10). Since 1993, the standard VAT rate has remained at the comparatively low level of 14% and applied to the vast majority of goods and services. To mitigate the potentially regressive effects of the tax, preferential treatment for a number of items was negotiated with social partners, mostly in the form of a reduced VAT rate (of 0%).3 The items selected include specific types of food, such as maize meal (corn meal), milk and unprocessed fruit and vegetables, and public transport. In 2001 the VAT rate on paraffin was reduced to zero on equity grounds. Many of the other exemptions are common in VAT systems, such as financial services, which are
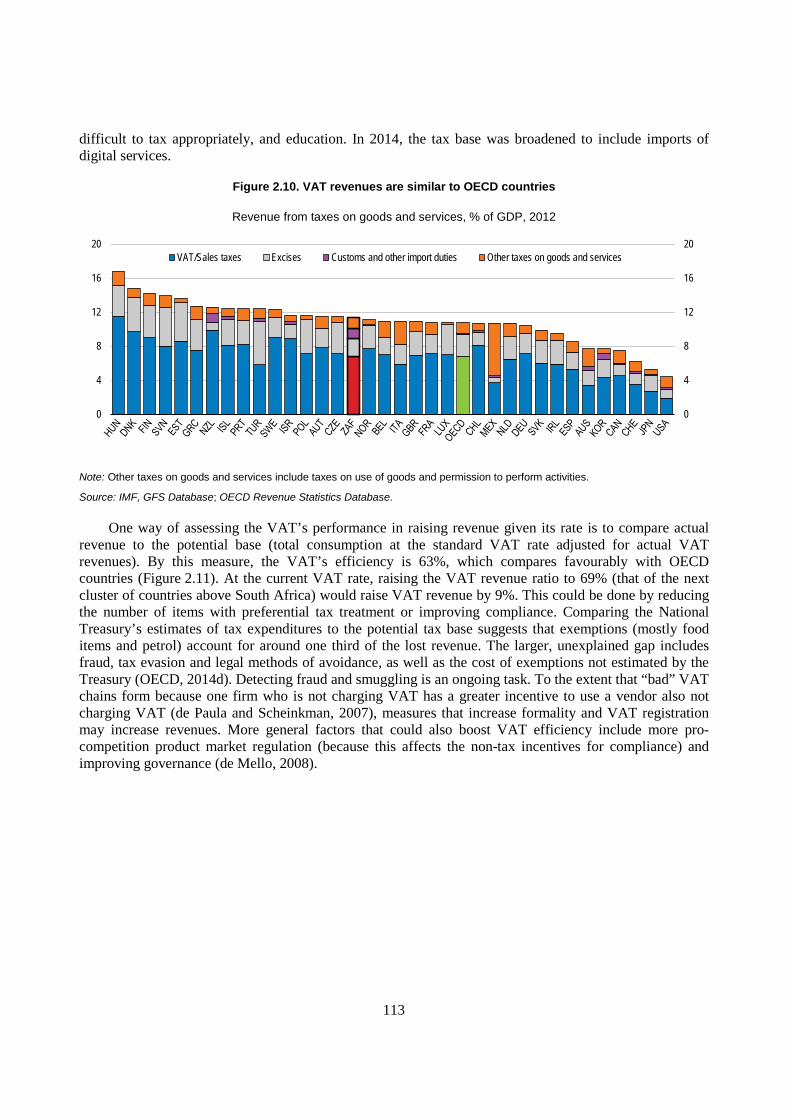
113
difficult to tax appropriately, and education. In 2014, the tax base was broadened to include imports of digital services.
Figure 2.10. VAT revenues are similar to OECD countries
Revenue from taxes on goods and services, % of GDP, 2012
Note: Other taxes on goods and services include taxes on use of goods and permission to perform activities.
Source: IMF, GFS Database; OECD Revenue Statistics Database.
One way of assessing the VAT’s performance in raising revenue given its rate is to compare actual revenue to the potential base (total consumption at the standard VAT rate adjusted for actual VAT revenues). By this measure, the VAT’s efficiency is 63%, which compares favourably with OECD countries (Figure 2.11). At the current VAT rate, raising the VAT revenue ratio to 69% (that of the next cluster of countries above South Africa) would raise VAT revenue by 9%. This could be done by reducing the number of items with preferential tax treatment or improving compliance. Comparing the National Treasury’s estimates of tax expenditures to the potential tax base suggests that exemptions (mostly food items and petrol) account for around one third of the lost revenue. The larger, unexplained gap includes fraud, tax evasion and legal methods of avoidance, as well as the cost of exemptions not estimated by the Treasury (OECD, 2014d). Detecting fraud and smuggling is an ongoing task. To the extent that “bad” VAT chains form because one firm who is not charging VAT has a greater incentive to use a vendor also not charging VAT (de Paula and Scheinkman, 2007), measures that increase formality and VAT registration may increase revenues. More general factors that could also boost VAT efficiency include more pro-competition product market regulation (because this affects the non-tax incentives for compliance) and improving governance (de Mello, 2008).
0
4
8
12
16
20
0
4
8
12
16
20VAT/Sales taxes Excises Customs and other import duties Other taxes on goods and services
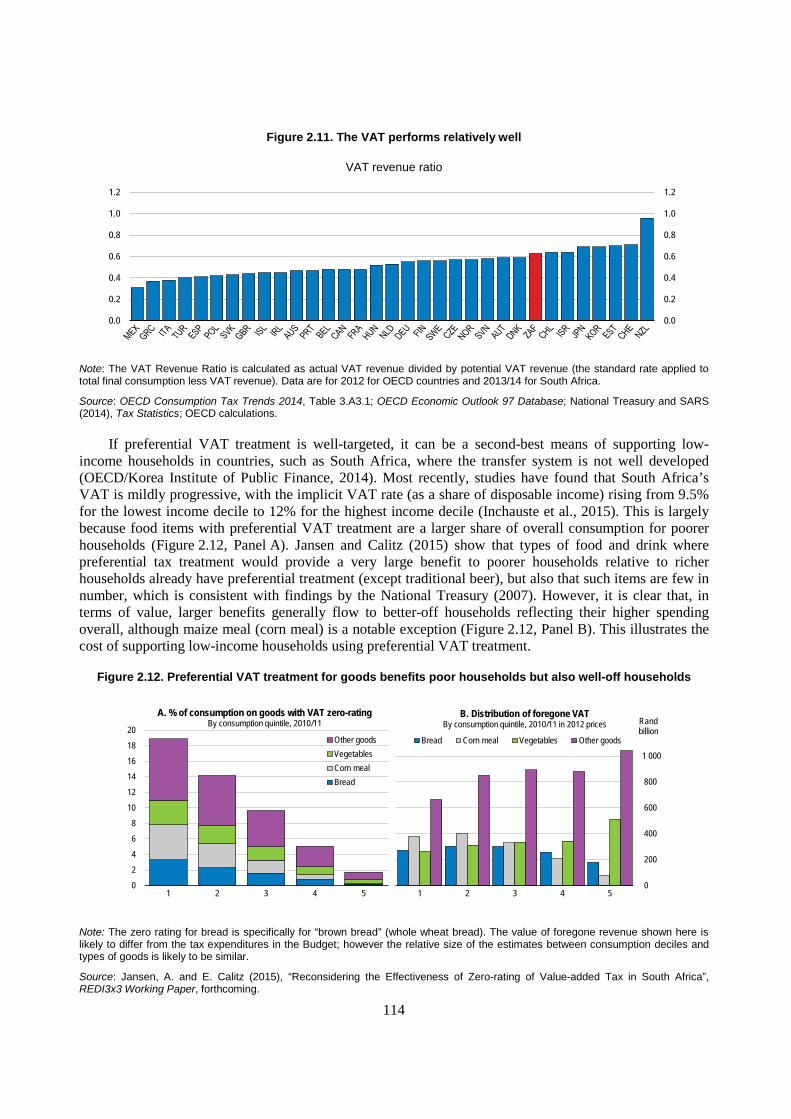
114
Figure 2.11. The VAT performs relatively well
VAT revenue ratio
Note: The VAT Revenue Ratio is calculated as actual VAT revenue divided by potential VAT revenue (the standard rate applied to total final consumption less VAT revenue). Data are for 2012 for OECD countries and 2013/14 for South Africa.
Source: OECD Consumption Tax Trends 2014, Table 3.A3.1; OECD Economic Outlook 97 Database; National Treasury and SARS (2014), Tax Statistics; OECD calculations.
If preferential VAT treatment is well-targeted, it can be a second-best means of supporting low-income households in countries, such as South Africa, where the transfer system is not well developed (OECD/Korea Institute of Public Finance, 2014). Most recently, studies have found that South Africa’s VAT is mildly progressive, with the implicit VAT rate (as a share of disposable income) rising from 9.5% for the lowest income decile to 12% for the highest income decile (Inchauste et al., 2015). This is largely because food items with preferential VAT treatment are a larger share of overall consumption for poorer households (Figure 2.12, Panel A). Jansen and Calitz (2015) show that types of food and drink where preferential tax treatment would provide a very large benefit to poorer households relative to richer households already have preferential treatment (except traditional beer), but also that such items are few in number, which is consistent with findings by the National Treasury (2007). However, it is clear that, in terms of value, larger benefits generally flow to better-off households reflecting their higher spending overall, although maize meal (corn meal) is a notable exception (Figure 2.12, Panel B). This illustrates the cost of supporting low-income households using preferential VAT treatment.
Figure 2.12. Preferential VAT treatment for goods benefits poor households but also well-off households
Note: The zero rating for bread is specifically for “brown bread” (whole wheat bread). The value of foregone revenue shown here is likely to differ from the tax expenditures in the Budget; however the relative size of the estimates between consumption deciles and types of goods is likely to be similar.
Source: Jansen, A. and E. Calitz (2015), “Reconsidering the Effectiveness of Zero-rating of Value-added Tax in South Africa”, REDI3x3 Working Paper, forthcoming.
0.0
0.2
0.4
0.6
0.8
1.0
1.2
0.0
0.2
0.4
0.6
0.8
1.0
1.2
0
2
4
6
8
10
12
14
16
18
20
1 2 3 4 5
A. % of consumption on goods with VAT zero-ratingBy consumption quintile, 2010/11
Other goodsVegetablesCorn mealBread
0
200
400
600
800
1 000
1 2 3 4 5
Randbillion
B. Distribution of foregone VAT By consumption quintile, 2010/11 in 2012 prices
Bread Corn meal Vegetables Other goods
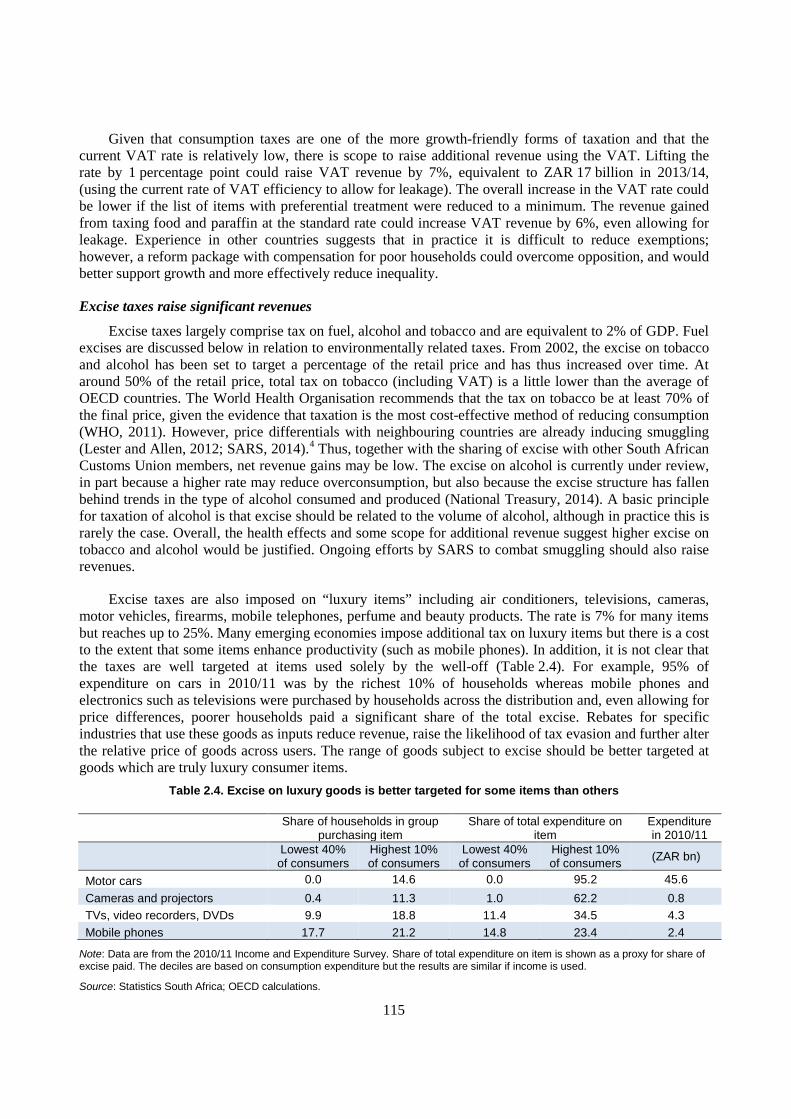
115
Given that consumption taxes are one of the more growth-friendly forms of taxation and that the current VAT rate is relatively low, there is scope to raise additional revenue using the VAT. Lifting the rate by 1 percentage point could raise VAT revenue by 7%, equivalent to ZAR 17 billion in 2013/14, (using the current rate of VAT efficiency to allow for leakage). The overall increase in the VAT rate could be lower if the list of items with preferential treatment were reduced to a minimum. The revenue gained from taxing food and paraffin at the standard rate could increase VAT revenue by 6%, even allowing for leakage. Experience in other countries suggests that in practice it is difficult to reduce exemptions; however, a reform package with compensation for poor households could overcome opposition, and would better support growth and more effectively reduce inequality.
Excise taxes raise significant revenues
Excise taxes largely comprise tax on fuel, alcohol and tobacco and are equivalent to 2% of GDP. Fuel excises are discussed below in relation to environmentally related taxes. From 2002, the excise on tobacco and alcohol has been set to target a percentage of the retail price and has thus increased over time. At around 50% of the retail price, total tax on tobacco (including VAT) is a little lower than the average of OECD countries. The World Health Organisation recommends that the tax on tobacco be at least 70% of the final price, given the evidence that taxation is the most cost-effective method of reducing consumption (WHO, 2011). However, price differentials with neighbouring countries are already inducing smuggling (Lester and Allen, 2012; SARS, 2014).4 Thus, together with the sharing of excise with other South African Customs Union members, net revenue gains may be low. The excise on alcohol is currently under review, in part because a higher rate may reduce overconsumption, but also because the excise structure has fallen behind trends in the type of alcohol consumed and produced (National Treasury, 2014). A basic principle for taxation of alcohol is that excise should be related to the volume of alcohol, although in practice this is rarely the case. Overall, the health effects and some scope for additional revenue suggest higher excise on tobacco and alcohol would be justified. Ongoing efforts by SARS to combat smuggling should also raise revenues.
Excise taxes are also imposed on “luxury items” including air conditioners, televisions, cameras, motor vehicles, firearms, mobile telephones, perfume and beauty products. The rate is 7% for many items but reaches up to 25%. Many emerging economies impose additional tax on luxury items but there is a cost to the extent that some items enhance productivity (such as mobile phones). In addition, it is not clear that the taxes are well targeted at items used solely by the well-off (Table 2.4). For example, 95% of expenditure on cars in 2010/11 was by the richest 10% of households whereas mobile phones and electronics such as televisions were purchased by households across the distribution and, even allowing for price differences, poorer households paid a significant share of the total excise. Rebates for specific industries that use these goods as inputs reduce revenue, raise the likelihood of tax evasion and further alter the relative price of goods across users. The range of goods subject to excise should be better targeted at goods which are truly luxury consumer items.
Table 2.4. Excise on luxury goods is better targeted for some items than others
Share of households in group purchasing item
Share of total expenditure on item
Expenditure in 2010/11
Lowest 40% of consumers
Highest 10% of consumers
Lowest 40% of consumers
Highest 10% of consumers (ZAR bn)
Motor cars 0.0 14.6 0.0 95.2 45.6 Cameras and projectors 0.4 11.3 1.0 62.2 0.8 TVs, video recorders, DVDs 9.9 18.8 11.4 34.5 4.3 Mobile phones 17.7 21.2 14.8 23.4 2.4
Note: Data are from the 2010/11 Income and Expenditure Survey. Share of total expenditure on item is shown as a proxy for share of excise paid. The deciles are based on consumption expenditure but the results are similar if income is used.
Source: Statistics South Africa; OECD calculations.
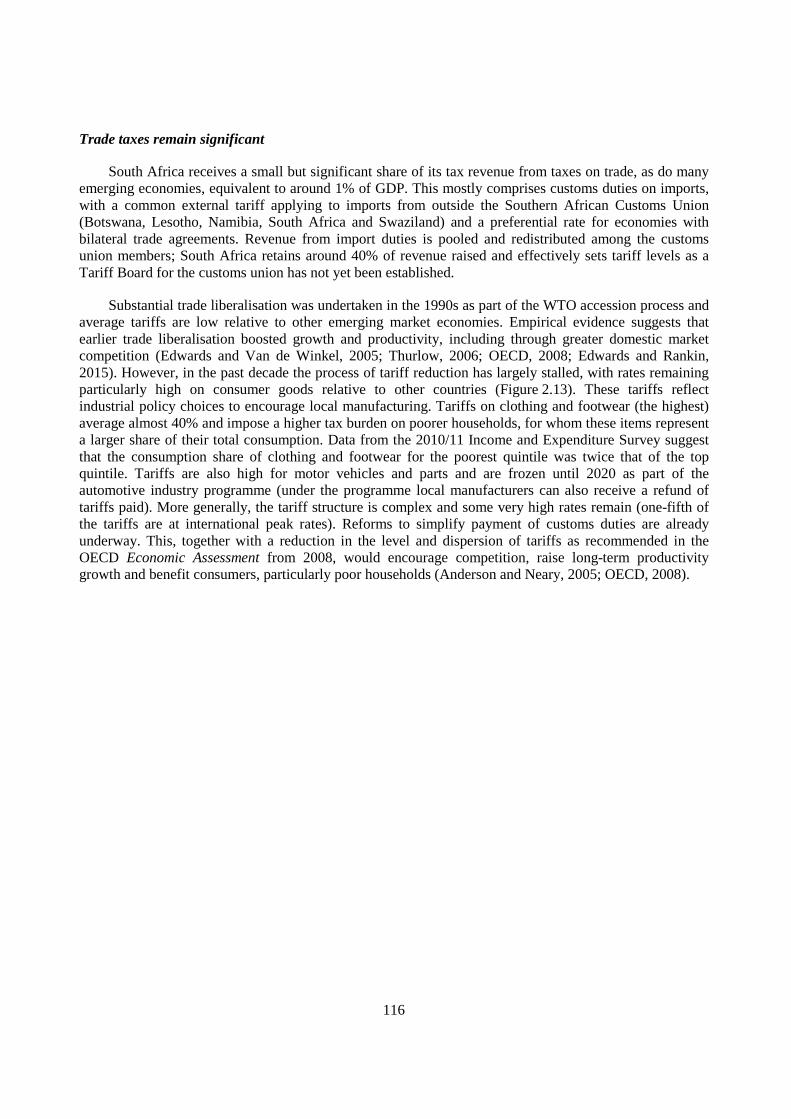
116
Trade taxes remain significant
South Africa receives a small but significant share of its tax revenue from taxes on trade, as do many emerging economies, equivalent to around 1% of GDP. This mostly comprises customs duties on imports, with a common external tariff applying to imports from outside the Southern African Customs Union (Botswana, Lesotho, Namibia, South Africa and Swaziland) and a preferential rate for economies with bilateral trade agreements. Revenue from import duties is pooled and redistributed among the customs union members; South Africa retains around 40% of revenue raised and effectively sets tariff levels as a Tariff Board for the customs union has not yet been established.
Substantial trade liberalisation was undertaken in the 1990s as part of the WTO accession process and average tariffs are low relative to other emerging market economies. Empirical evidence suggests that earlier trade liberalisation boosted growth and productivity, including through greater domestic market competition (Edwards and Van de Winkel, 2005; Thurlow, 2006; OECD, 2008; Edwards and Rankin, 2015). However, in the past decade the process of tariff reduction has largely stalled, with rates remaining particularly high on consumer goods relative to other countries (Figure 2.13). These tariffs reflect industrial policy choices to encourage local manufacturing. Tariffs on clothing and footwear (the highest) average almost 40% and impose a higher tax burden on poorer households, for whom these items represent a larger share of their total consumption. Data from the 2010/11 Income and Expenditure Survey suggest that the consumption share of clothing and footwear for the poorest quintile was twice that of the top quintile. Tariffs are also high for motor vehicles and parts and are frozen until 2020 as part of the automotive industry programme (under the programme local manufacturers can also receive a refund of tariffs paid). More generally, the tariff structure is complex and some very high rates remain (one-fifth of the tariffs are at international peak rates). Reforms to simplify payment of customs duties are already underway. This, together with a reduction in the level and dispersion of tariffs as recommended in the OECD Economic Assessment from 2008, would encourage competition, raise long-term productivity growth and benefit consumers, particularly poor households (Anderson and Neary, 2005; OECD, 2008).
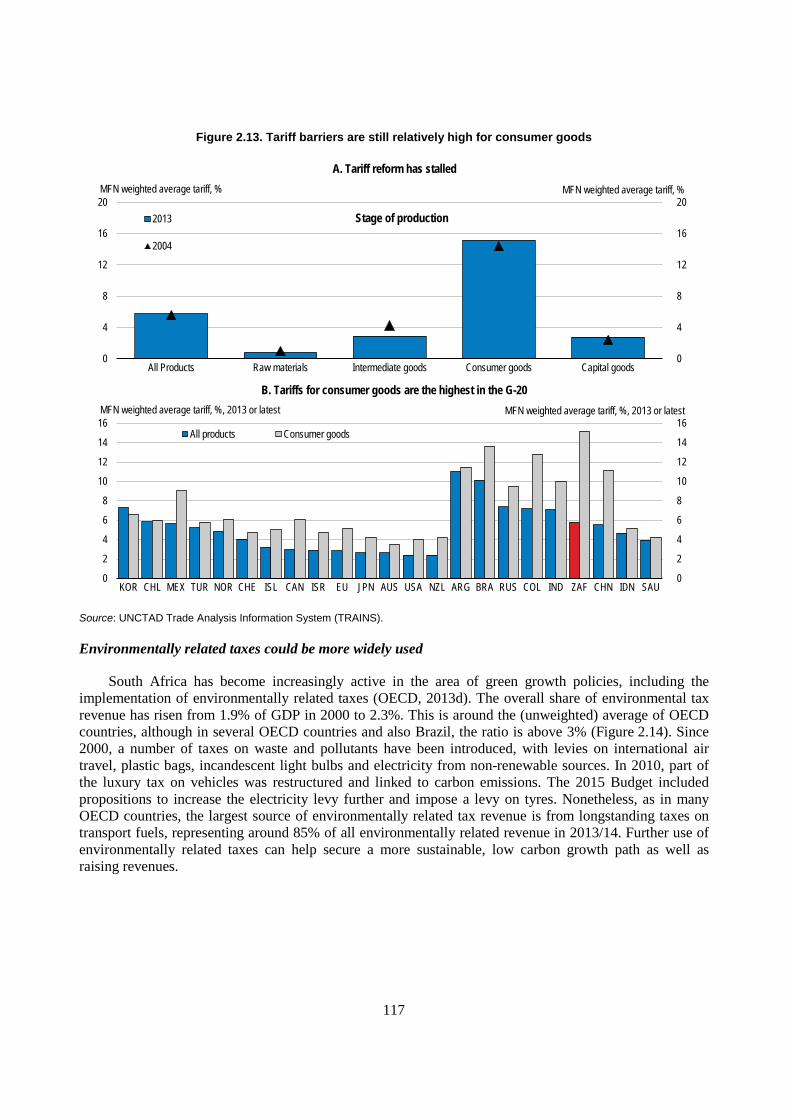
117
Figure 2.13. Tariff barriers are still relatively high for consumer goods
Source: UNCTAD Trade Analysis Information System (TRAINS).
Environmentally related taxes could be more widely used
South Africa has become increasingly active in the area of green growth policies, including the implementation of environmentally related taxes (OECD, 2013d). The overall share of environmental tax revenue has risen from 1.9% of GDP in 2000 to 2.3%. This is around the (unweighted) average of OECD countries, although in several OECD countries and also Brazil, the ratio is above 3% (Figure 2.14). Since 2000, a number of taxes on waste and pollutants have been introduced, with levies on international air travel, plastic bags, incandescent light bulbs and electricity from non-renewable sources. In 2010, part of the luxury tax on vehicles was restructured and linked to carbon emissions. The 2015 Budget included propositions to increase the electricity levy further and impose a levy on tyres. Nonetheless, as in many OECD countries, the largest source of environmentally related tax revenue is from longstanding taxes on transport fuels, representing around 85% of all environmentally related revenue in 2013/14. Further use of environmentally related taxes can help secure a more sustainable, low carbon growth path as well as raising revenues.
A. Tariff reform has stalled
B. Tariffs for consumer goods are the highest in the G-20
0
4
8
12
16
20
All Products Raw materials Intermediate goods Consumer goods Capital goods0
4
8
12
16
20MFN weighted average tariff, % MFN weighted average tariff, %
2013
2004
Stage of production
0
2
4
6
8
10
12
14
16
KOR CHL MEX TUR NOR CHE ISL CAN ISR EU JPN AUS USA NZL ARG BRA RUS COL IND ZAF CHN IDN SAU0
2
4
6
8
10
12
14
16MFN weighted average tariff, %, 2013 or latestMFN weighted average tariff, %, 2013 or latest
All products Consumer goods
118
Figure 2.14. Environmentally related taxes have increased but there is scope for further use
Note: Tax rates are as of 1 April 2012 (except 1 July 2012 for Australia and Brazil and 4 April 2012 for South Africa). Figures for Canada, India and the United States include only federal taxes. “OECD EMEs” are five emerging market Member countries: Chile, Hungary, Mexico, Poland and Turkey. All averages are unweighted.
Source: OECD (2015c), Taxing Energy Use 2015: OECD and Selected Partner Economies, OECD Publishing, Paris; OECD Database on instruments used for environmental policy and natural resources management.
Climate change mitigation represents a particular challenge for South Africa, as it is one of the most energy- and greenhouse gas-intensive economies (OECD, 2015c, 2015d). This largely stems from the economy’s reliance on coal, which accounts for around 70% of total energy, 90% of electricity generated and 20% of transport fuels (in the form of synthetic fuels; IEA, 2014). Recognising the need to shift the economy’s growth path, the government is committed to reducing greenhouse gas emissions by 34% by 2020 and 42% by 2025 compared to a “business as usual” path.5 But currently the effective tax rate on carbon is relatively low in part because South Africa has yet to price carbon. The average effective tax of EUR 10 per tonne of CO2 compares to an (unweighted) average of EUR 52 across OECD countries (Table 2.5). The difference is mostly due to the very low rate on the 90% of all emissions from activities other than transport. The implicit tax rate on electricity is ZAR 36.5 (EUR 2.50) per tonne of CO2, which is lower than the 2014 average carbon emission rights price of EUR 6.10 and much lower than the average implicit price across OECD countries.
Table 2.5. The tax rate on CO2 emissions varies considerably across sources and uses
% total carbon
emissions Effective tax rate per
ton of CO2 (EUR) Transport 10 83.1 Road 8.7 88.9 Off-road 1.3 5.5 Heating and process 47 1.4 Electricity 43 2.5 All energy 100 10.1 Memo: average of OECD countries 52
Note: Tax data are as at 4 April 2012; energy data are as at 2009 and the exchange rate is the 2014 average. The numbers shown here only differ from those in OECD (2015c) because of the exchange rate assumption.
Source: OECD (2015c), Taxing Energy Use 2015: OECD and Selected Partner Economies, OECD Publishing, Paris.
0
1
2
3
4
5
Slovenia Turkey Denmark Brazil SouthAfrica
OECDaverage
OECD -EMEs
A. Environmentally related taxesPercentage of GDP
2013 2000
0
1
2
3
4
5
6
7
Denmark Slovenia OECDaverage
Turkey OECD -EMEs
SouthAfrica
Brazil
B. Average effective tax rate on energyApril 2012, EUR per Gigajoule
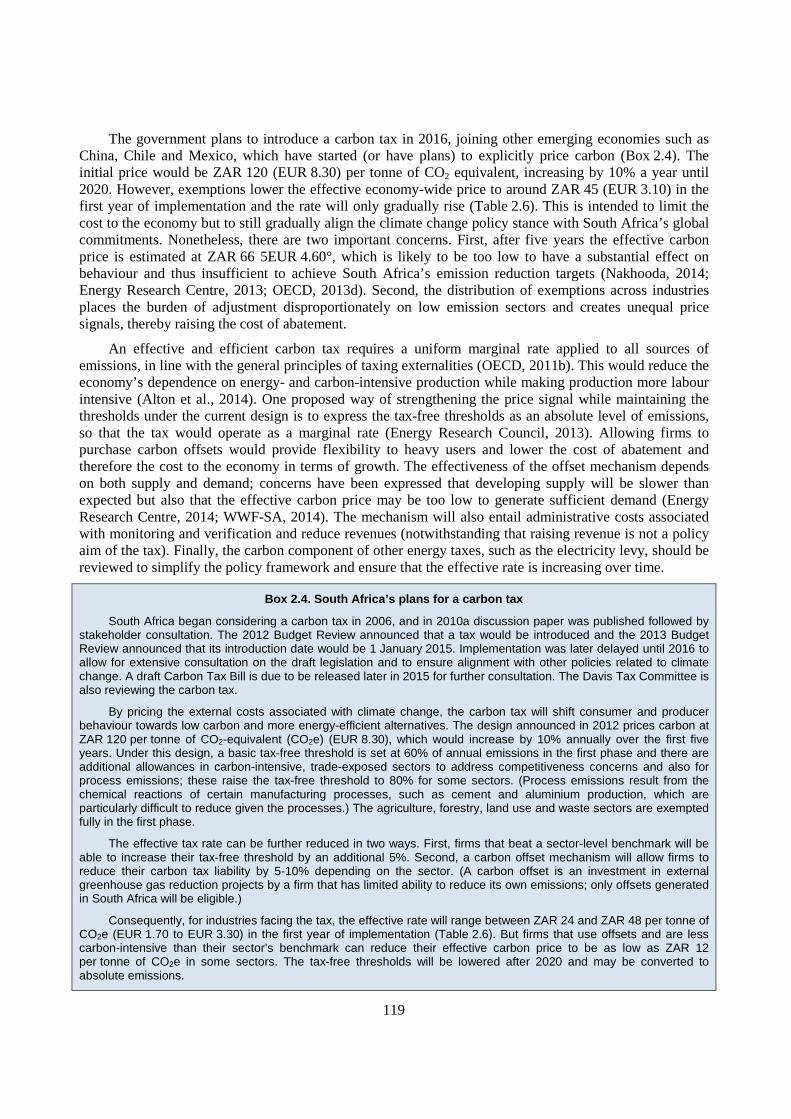
119
The government plans to introduce a carbon tax in 2016, joining other emerging economies such as China, Chile and Mexico, which have started (or have plans) to explicitly price carbon (Box 2.4). The initial price would be ZAR 120 (EUR 8.30) per tonne of CO2 equivalent, increasing by 10% a year until 2020. However, exemptions lower the effective economy-wide price to around ZAR 45 (EUR 3.10) in the first year of implementation and the rate will only gradually rise (Table 2.6). This is intended to limit the cost to the economy but to still gradually align the climate change policy stance with South Africa’s global commitments. Nonetheless, there are two important concerns. First, after five years the effective carbon price is estimated at ZAR 66 5EUR 4.60°, which is likely to be too low to have a substantial effect on behaviour and thus insufficient to achieve South Africa’s emission reduction targets (Nakhooda, 2014; Energy Research Centre, 2013; OECD, 2013d). Second, the distribution of exemptions across industries places the burden of adjustment disproportionately on low emission sectors and creates unequal price signals, thereby raising the cost of abatement.
An effective and efficient carbon tax requires a uniform marginal rate applied to all sources of emissions, in line with the general principles of taxing externalities (OECD, 2011b). This would reduce the economy’s dependence on energy- and carbon-intensive production while making production more labour intensive (Alton et al., 2014). One proposed way of strengthening the price signal while maintaining the thresholds under the current design is to express the tax-free thresholds as an absolute level of emissions, so that the tax would operate as a marginal rate (Energy Research Council, 2013). Allowing firms to purchase carbon offsets would provide flexibility to heavy users and lower the cost of abatement and therefore the cost to the economy in terms of growth. The effectiveness of the offset mechanism depends on both supply and demand; concerns have been expressed that developing supply will be slower than expected but also that the effective carbon price may be too low to generate sufficient demand (Energy Research Centre, 2014; WWF-SA, 2014). The mechanism will also entail administrative costs associated with monitoring and verification and reduce revenues (notwithstanding that raising revenue is not a policy aim of the tax). Finally, the carbon component of other energy taxes, such as the electricity levy, should be reviewed to simplify the policy framework and ensure that the effective rate is increasing over time.
Box 2.4. South Africa’s plans for a carbon tax
South Africa began considering a carbon tax in 2006, and in 2010a discussion paper was published followed by stakeholder consultation. The 2012 Budget Review announced that a tax would be introduced and the 2013 Budget Review announced that its introduction date would be 1 January 2015. Implementation was later delayed until 2016 to allow for extensive consultation on the draft legislation and to ensure alignment with other policies related to climate change. A draft Carbon Tax Bill is due to be released later in 2015 for further consultation. The Davis Tax Committee is also reviewing the carbon tax.
By pricing the external costs associated with climate change, the carbon tax will shift consumer and producer behaviour towards low carbon and more energy-efficient alternatives. The design announced in 2012 prices carbon at ZAR 120 per tonne of CO2-equivalent (CO2e) (EUR 8.30), which would increase by 10% annually over the first five years. Under this design, a basic tax-free threshold is set at 60% of annual emissions in the first phase and there are additional allowances in carbon-intensive, trade-exposed sectors to address competitiveness concerns and also for process emissions; these raise the tax-free threshold to 80% for some sectors. (Process emissions result from the chemical reactions of certain manufacturing processes, such as cement and aluminium production, which are particularly difficult to reduce given the processes.) The agriculture, forestry, land use and waste sectors are exempted fully in the first phase.
The effective tax rate can be further reduced in two ways. First, firms that beat a sector-level benchmark will be able to increase their tax-free threshold by an additional 5%. Second, a carbon offset mechanism will allow firms to reduce their carbon tax liability by 5-10% depending on the sector. (A carbon offset is an investment in external greenhouse gas reduction projects by a firm that has limited ability to reduce its own emissions; only offsets generated in South Africa will be eligible.)
Consequently, for industries facing the tax, the effective rate will range between ZAR 24 and ZAR 48 per tonne of CO2e (EUR 1.70 to EUR 3.30) in the first year of implementation (Table 2.6). But firms that use offsets and are less carbon-intensive than their sector’s benchmark can reduce their effective carbon price to be as low as ZAR 12 per tonne of CO2e in some sectors. The tax-free thresholds will be lowered after 2020 and may be converted to absolute emissions.
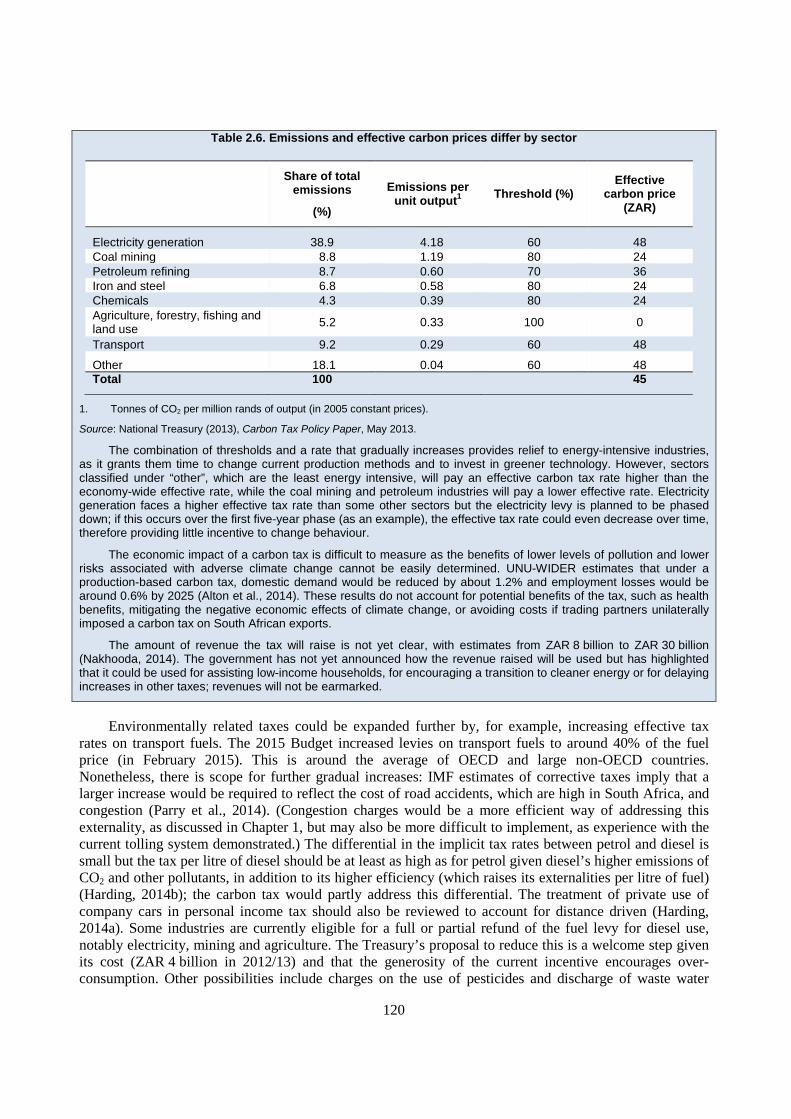
120
Table 2.6. Emissions and effective carbon prices differ by sector
Share of total
emissions
(%)
Emissions per unit output1 Threshold (%)
Effective carbon price
(ZAR)
Electricity generation 38.9 4.18 60 48 Coal mining 8.8 1.19 80 24 Petroleum refining 8.7 0.60 70 36 Iron and steel 6.8 0.58 80 24 Chemicals 4.3 0.39 80 24 Agriculture, forestry, fishing and land use 5.2 0.33 100 0
Transport 9.2 0.29 60 48
Other 18.1 0.04 60 48 Total 100
45
1. Tonnes of CO2 per million rands of output (in 2005 constant prices).
Source: National Treasury (2013), Carbon Tax Policy Paper, May 2013.
The combination of thresholds and a rate that gradually increases provides relief to energy-intensive industries, as it grants them time to change current production methods and to invest in greener technology. However, sectors classified under “other”, which are the least energy intensive, will pay an effective carbon tax rate higher than the economy-wide effective rate, while the coal mining and petroleum industries will pay a lower effective rate. Electricity generation faces a higher effective tax rate than some other sectors but the electricity levy is planned to be phased down; if this occurs over the first five-year phase (as an example), the effective tax rate could even decrease over time, therefore providing little incentive to change behaviour.
The economic impact of a carbon tax is difficult to measure as the benefits of lower levels of pollution and lower risks associated with adverse climate change cannot be easily determined. UNU-WIDER estimates that under a production-based carbon tax, domestic demand would be reduced by about 1.2% and employment losses would be around 0.6% by 2025 (Alton et al., 2014). These results do not account for potential benefits of the tax, such as health benefits, mitigating the negative economic effects of climate change, or avoiding costs if trading partners unilaterally imposed a carbon tax on South African exports.
The amount of revenue the tax will raise is not yet clear, with estimates from ZAR 8 billion to ZAR 30 billion (Nakhooda, 2014). The government has not yet announced how the revenue raised will be used but has highlighted that it could be used for assisting low-income households, for encouraging a transition to cleaner energy or for delaying increases in other taxes; revenues will not be earmarked.
Environmentally related taxes could be expanded further by, for example, increasing effective tax rates on transport fuels. The 2015 Budget increased levies on transport fuels to around 40% of the fuel price (in February 2015). This is around the average of OECD and large non-OECD countries. Nonetheless, there is scope for further gradual increases: IMF estimates of corrective taxes imply that a larger increase would be required to reflect the cost of road accidents, which are high in South Africa, and congestion (Parry et al., 2014). (Congestion charges would be a more efficient way of addressing this externality, as discussed in Chapter 1, but may also be more difficult to implement, as experience with the current tolling system demonstrated.) The differential in the implicit tax rates between petrol and diesel is small but the tax per litre of diesel should be at least as high as for petrol given diesel’s higher emissions of CO2 and other pollutants, in addition to its higher efficiency (which raises its externalities per litre of fuel) (Harding, 2014b); the carbon tax would partly address this differential. The treatment of private use of company cars in personal income tax should also be reviewed to account for distance driven (Harding, 2014a). Some industries are currently eligible for a full or partial refund of the fuel levy for diesel use, notably electricity, mining and agriculture. The Treasury’s proposal to reduce this is a welcome step given its cost (ZAR 4 billion in 2012/13) and that the generosity of the current incentive encourages over-consumption. Other possibilities include charges on the use of pesticides and discharge of waste water
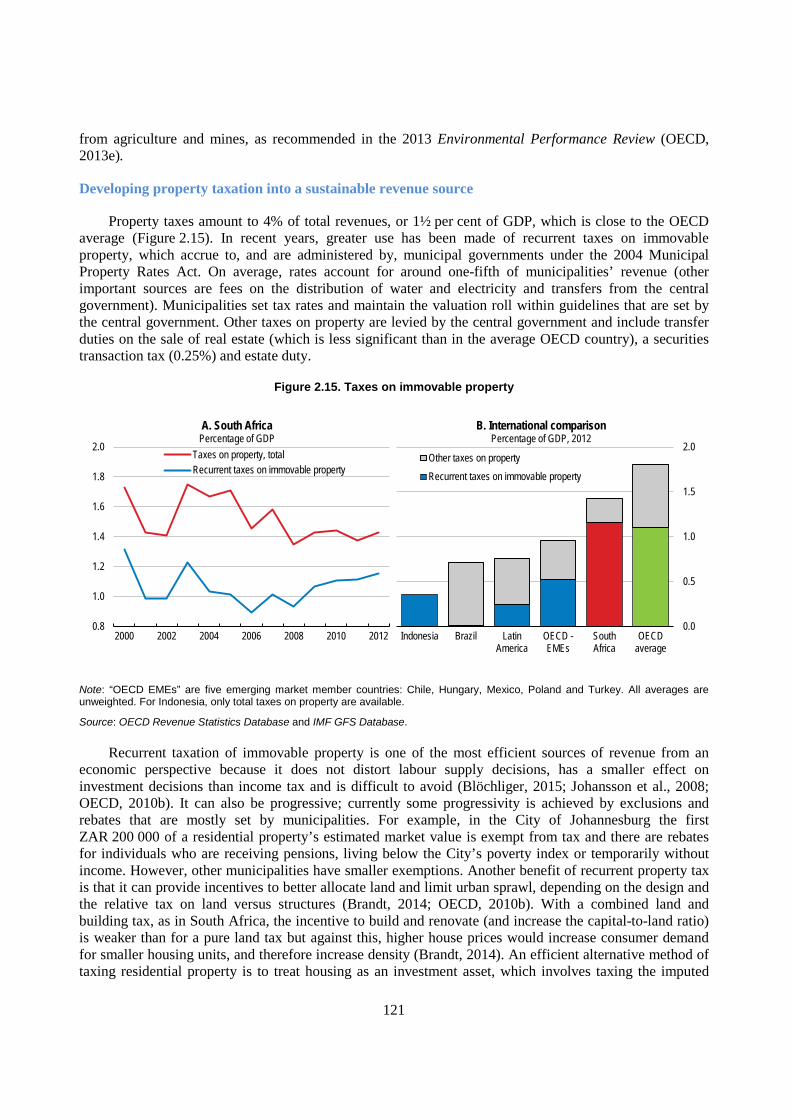
121
from agriculture and mines, as recommended in the 2013 Environmental Performance Review (OECD, 2013e).
Developing property taxation into a sustainable revenue source
Property taxes amount to 4% of total revenues, or 1½ per cent of GDP, which is close to the OECD average (Figure 2.15). In recent years, greater use has been made of recurrent taxes on immovable property, which accrue to, and are administered by, municipal governments under the 2004 Municipal Property Rates Act. On average, rates account for around one-fifth of municipalities’ revenue (other important sources are fees on the distribution of water and electricity and transfers from the central government). Municipalities set tax rates and maintain the valuation roll within guidelines that are set by the central government. Other taxes on property are levied by the central government and include transfer duties on the sale of real estate (which is less significant than in the average OECD country), a securities transaction tax (0.25%) and estate duty.
Figure 2.15. Taxes on immovable property
Note: “OECD EMEs” are five emerging market member countries: Chile, Hungary, Mexico, Poland and Turkey. All averages are unweighted. For Indonesia, only total taxes on property are available.
Source: OECD Revenue Statistics Database and IMF GFS Database.
Recurrent taxation of immovable property is one of the most efficient sources of revenue from an economic perspective because it does not distort labour supply decisions, has a smaller effect on investment decisions than income tax and is difficult to avoid (Blöchliger, 2015; Johansson et al., 2008; OECD, 2010b). It can also be progressive; currently some progressivity is achieved by exclusions and rebates that are mostly set by municipalities. For example, in the City of Johannesburg the first ZAR 200 000 of a residential property’s estimated market value is exempt from tax and there are rebates for individuals who are receiving pensions, living below the City’s poverty index or temporarily without income. However, other municipalities have smaller exemptions. Another benefit of recurrent property tax is that it can provide incentives to better allocate land and limit urban sprawl, depending on the design and the relative tax on land versus structures (Brandt, 2014; OECD, 2010b). With a combined land and building tax, as in South Africa, the incentive to build and renovate (and increase the capital-to-land ratio) is weaker than for a pure land tax but against this, higher house prices would increase consumer demand for smaller housing units, and therefore increase density (Brandt, 2014). An efficient alternative method of taxing residential property is to treat housing as an investment asset, which involves taxing the imputed
0.8
1.0
1.2
1.4
1.6
1.8
2.0
2000 2002 2004 2006 2008 2010 2012
A. South AfricaPercentage of GDP
Taxes on property, totalRecurrent taxes on immovable property
0.0
0.5
1.0
1.5
2.0
Indonesia Brazil LatinAmerica
OECD -EMEs
SouthAfrica
OECDaverage
B. International comparisonPercentage of GDP, 2012
Other taxes on propertyRecurrent taxes on immovable property
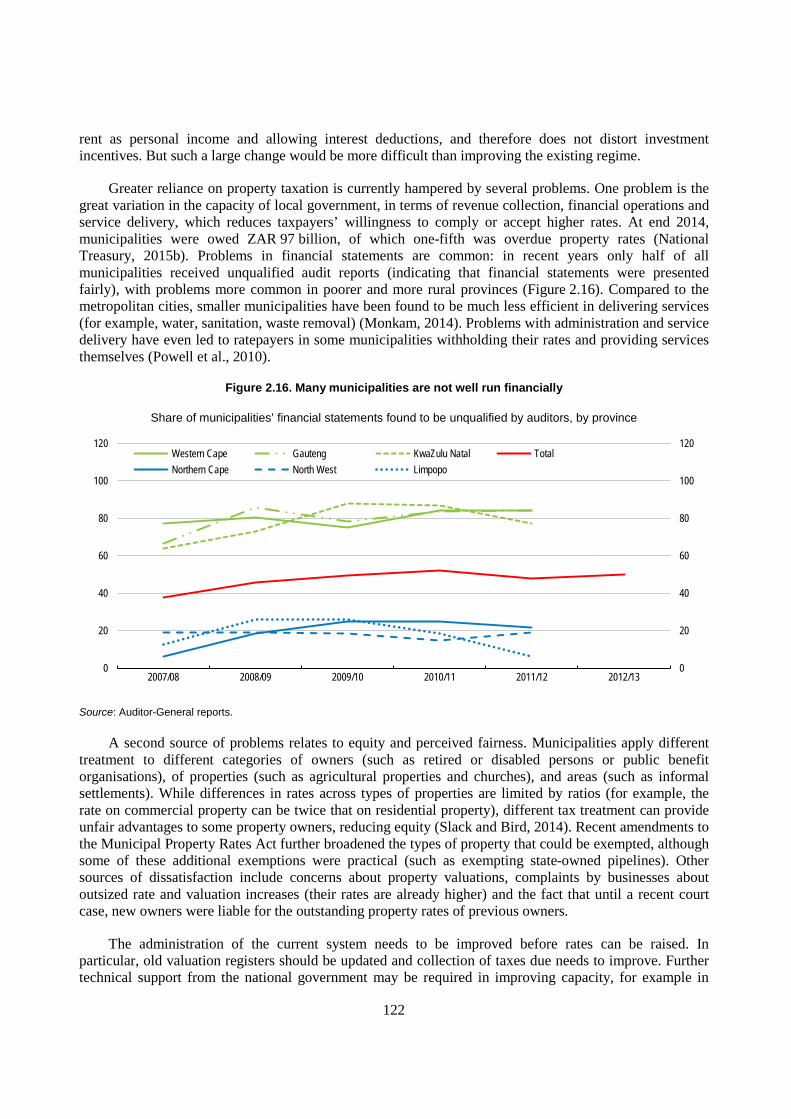
122
rent as personal income and allowing interest deductions, and therefore does not distort investment incentives. But such a large change would be more difficult than improving the existing regime.
Greater reliance on property taxation is currently hampered by several problems. One problem is the great variation in the capacity of local government, in terms of revenue collection, financial operations and service delivery, which reduces taxpayers’ willingness to comply or accept higher rates. At end 2014, municipalities were owed ZAR 97 billion, of which one-fifth was overdue property rates (National Treasury, 2015b). Problems in financial statements are common: in recent years only half of all municipalities received unqualified audit reports (indicating that financial statements were presented fairly), with problems more common in poorer and more rural provinces (Figure 2.16). Compared to the metropolitan cities, smaller municipalities have been found to be much less efficient in delivering services (for example, water, sanitation, waste removal) (Monkam, 2014). Problems with administration and service delivery have even led to ratepayers in some municipalities withholding their rates and providing services themselves (Powell et al., 2010).
Figure 2.16. Many municipalities are not well run financially
Share of municipalities’ financial statements found to be unqualified by auditors, by province
Source: Auditor-General reports.
A second source of problems relates to equity and perceived fairness. Municipalities apply different treatment to different categories of owners (such as retired or disabled persons or public benefit organisations), of properties (such as agricultural properties and churches), and areas (such as informal settlements). While differences in rates across types of properties are limited by ratios (for example, the rate on commercial property can be twice that on residential property), different tax treatment can provide unfair advantages to some property owners, reducing equity (Slack and Bird, 2014). Recent amendments to the Municipal Property Rates Act further broadened the types of property that could be exempted, although some of these additional exemptions were practical (such as exempting state-owned pipelines). Other sources of dissatisfaction include concerns about property valuations, complaints by businesses about outsized rate and valuation increases (their rates are already higher) and the fact that until a recent court case, new owners were liable for the outstanding property rates of previous owners.
The administration of the current system needs to be improved before rates can be raised. In particular, old valuation registers should be updated and collection of taxes due needs to improve. Further technical support from the national government may be required in improving capacity, for example in
0
20
40
60
80
100
120
0
20
40
60
80
100
120
2007/08 2008/09 2009/10 2010/11 2011/12 2012/13
Western Cape Gauteng KwaZulu Natal TotalNorthern Cape North West Limpopo
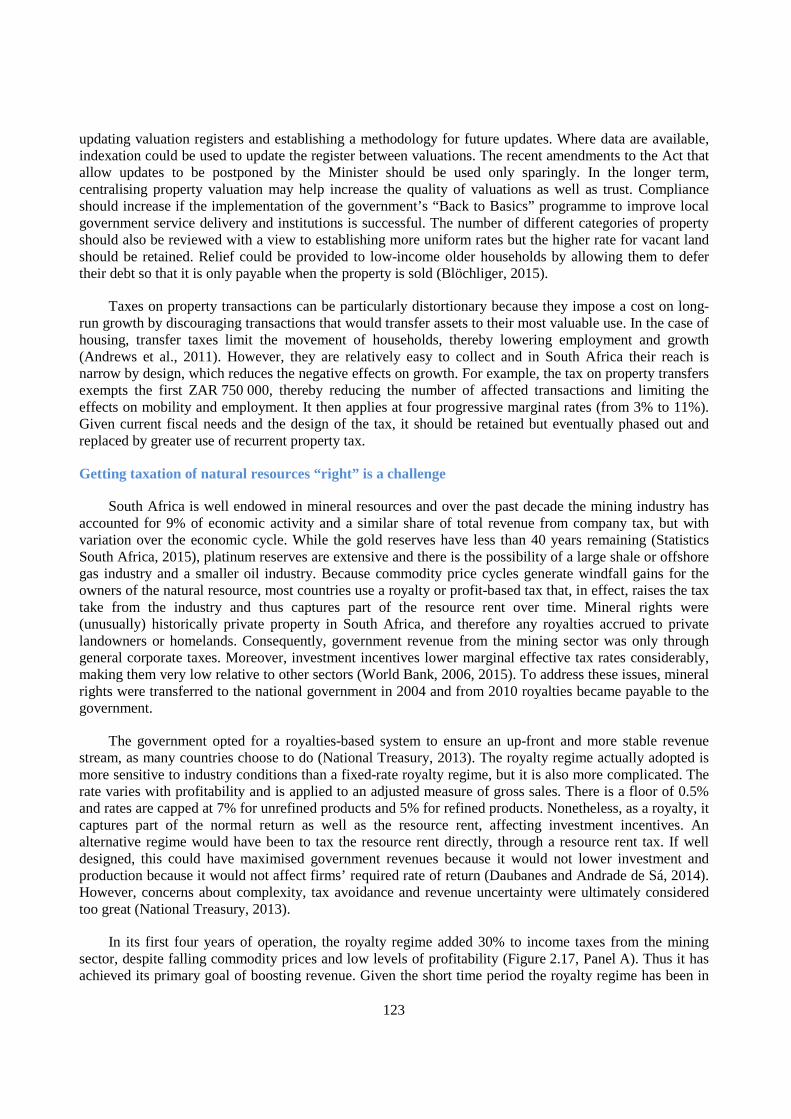
123
updating valuation registers and establishing a methodology for future updates. Where data are available, indexation could be used to update the register between valuations. The recent amendments to the Act that allow updates to be postponed by the Minister should be used only sparingly. In the longer term, centralising property valuation may help increase the quality of valuations as well as trust. Compliance should increase if the implementation of the government’s “Back to Basics” programme to improve local government service delivery and institutions is successful. The number of different categories of property should also be reviewed with a view to establishing more uniform rates but the higher rate for vacant land should be retained. Relief could be provided to low-income older households by allowing them to defer their debt so that it is only payable when the property is sold (Blöchliger, 2015).
Taxes on property transactions can be particularly distortionary because they impose a cost on long-run growth by discouraging transactions that would transfer assets to their most valuable use. In the case of housing, transfer taxes limit the movement of households, thereby lowering employment and growth (Andrews et al., 2011). However, they are relatively easy to collect and in South Africa their reach is narrow by design, which reduces the negative effects on growth. For example, the tax on property transfers exempts the first ZAR 750 000, thereby reducing the number of affected transactions and limiting the effects on mobility and employment. It then applies at four progressive marginal rates (from 3% to 11%). Given current fiscal needs and the design of the tax, it should be retained but eventually phased out and replaced by greater use of recurrent property tax.
Getting taxation of natural resources “right” is a challenge
South Africa is well endowed in mineral resources and over the past decade the mining industry has accounted for 9% of economic activity and a similar share of total revenue from company tax, but with variation over the economic cycle. While the gold reserves have less than 40 years remaining (Statistics South Africa, 2015), platinum reserves are extensive and there is the possibility of a large shale or offshore gas industry and a smaller oil industry. Because commodity price cycles generate windfall gains for the owners of the natural resource, most countries use a royalty or profit-based tax that, in effect, raises the tax take from the industry and thus captures part of the resource rent over time. Mineral rights were (unusually) historically private property in South Africa, and therefore any royalties accrued to private landowners or homelands. Consequently, government revenue from the mining sector was only through general corporate taxes. Moreover, investment incentives lower marginal effective tax rates considerably, making them very low relative to other sectors (World Bank, 2006, 2015). To address these issues, mineral rights were transferred to the national government in 2004 and from 2010 royalties became payable to the government.
The government opted for a royalties-based system to ensure an up-front and more stable revenue stream, as many countries choose to do (National Treasury, 2013). The royalty regime actually adopted is more sensitive to industry conditions than a fixed-rate royalty regime, but it is also more complicated. The rate varies with profitability and is applied to an adjusted measure of gross sales. There is a floor of 0.5% and rates are capped at 7% for unrefined products and 5% for refined products. Nonetheless, as a royalty, it captures part of the normal return as well as the resource rent, affecting investment incentives. An alternative regime would have been to tax the resource rent directly, through a resource rent tax. If well designed, this could have maximised government revenues because it would not lower investment and production because it would not affect firms’ required rate of return (Daubanes and Andrade de Sá, 2014). However, concerns about complexity, tax avoidance and revenue uncertainty were ultimately considered too great (National Treasury, 2013).
In its first four years of operation, the royalty regime added 30% to income taxes from the mining sector, despite falling commodity prices and low levels of profitability (Figure 2.17, Panel A). Thus it has achieved its primary goal of boosting revenue. Given the short time period the royalty regime has been in
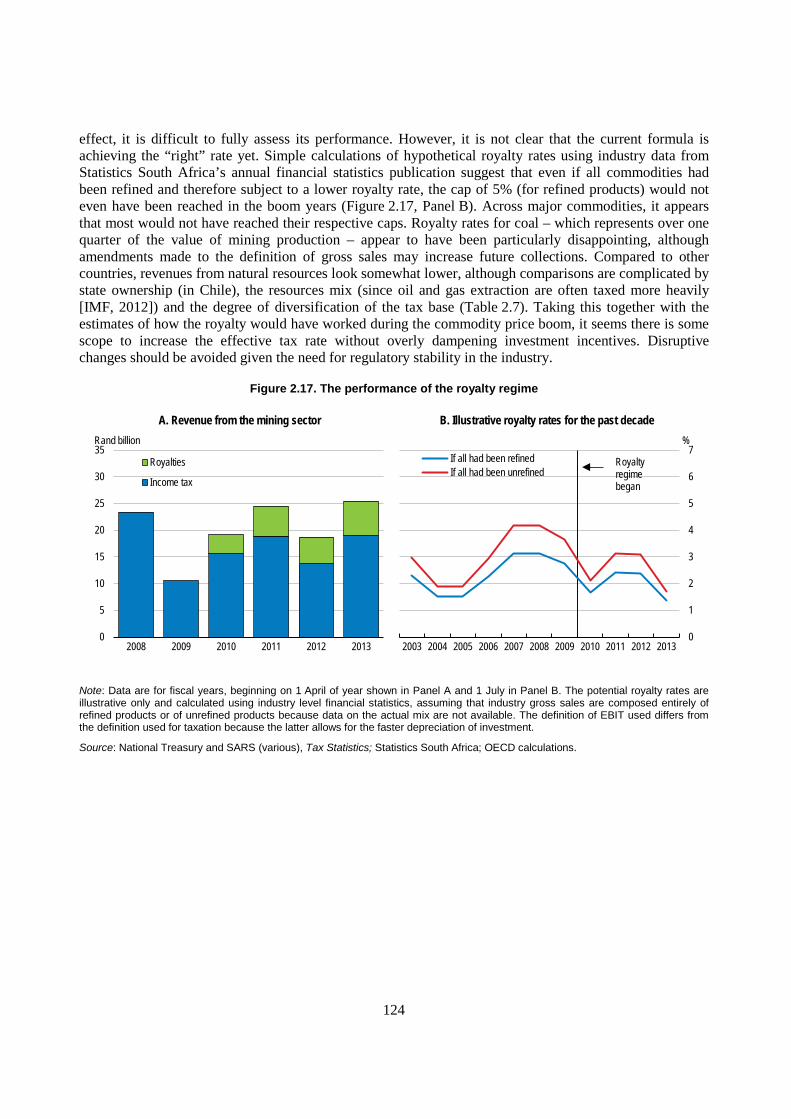
124
effect, it is difficult to fully assess its performance. However, it is not clear that the current formula is achieving the “right” rate yet. Simple calculations of hypothetical royalty rates using industry data from Statistics South Africa’s annual financial statistics publication suggest that even if all commodities had been refined and therefore subject to a lower royalty rate, the cap of 5% (for refined products) would not even have been reached in the boom years (Figure 2.17, Panel B). Across major commodities, it appears that most would not have reached their respective caps. Royalty rates for coal – which represents over one quarter of the value of mining production – appear to have been particularly disappointing, although amendments made to the definition of gross sales may increase future collections. Compared to other countries, revenues from natural resources look somewhat lower, although comparisons are complicated by state ownership (in Chile), the resources mix (since oil and gas extraction are often taxed more heavily [IMF, 2012]) and the degree of diversification of the tax base (Table 2.7). Taking this together with the estimates of how the royalty would have worked during the commodity price boom, it seems there is some scope to increase the effective tax rate without overly dampening investment incentives. Disruptive changes should be avoided given the need for regulatory stability in the industry.
Figure 2.17. The performance of the royalty regime
Note: Data are for fiscal years, beginning on 1 April of year shown in Panel A and 1 July in Panel B. The potential royalty rates are illustrative only and calculated using industry level financial statistics, assuming that industry gross sales are composed entirely of refined products or of unrefined products because data on the actual mix are not available. The definition of EBIT used differs from the definition used for taxation because the latter allows for the faster depreciation of investment.
Source: National Treasury and SARS (various), Tax Statistics; Statistics South Africa; OECD calculations.
A. Revenue from the mining sector B. Illustrative royalty rates for the past decade
0
5
10
15
20
25
30
35
2008 2009 2010 2011 2012 2013
Rand billion
Royalties
Income tax
0
1
2
3
4
5
6
7
2003 2004 2005 2006 2007 2008 2009 2010 2011 2012 2013
%If all had been refinedIf all had been unrefined
Royalty regime began
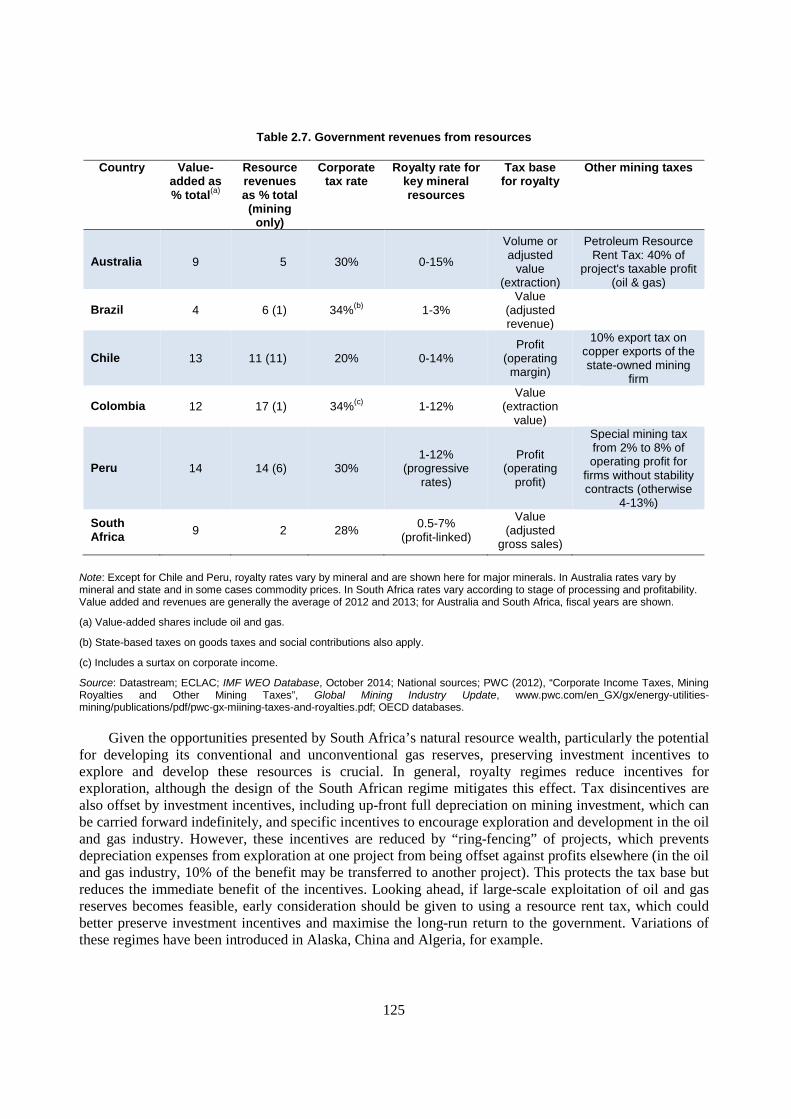
125
Table 2.7. Government revenues from resources
Country Value-added as % total(a)
Resource revenues as % total (mining
only)
Corporate tax rate
Royalty rate for key mineral resources
Tax base for royalty
Other mining taxes
Australia 9 5 30% 0-15%
Volume or adjusted
value (extraction)
Petroleum Resource Rent Tax: 40% of
project's taxable profit (oil & gas)
Brazil 4 6 (1) 34%(b) 1-3% Value
(adjusted revenue)
Chile 13 11 (11) 20% 0-14% Profit
(operating margin)
10% export tax on copper exports of the state-owned mining
firm
Colombia 12 17 (1) 34%(c) 1-12% Value
(extraction value)
Peru 14 14 (6) 30% 1-12%
(progressive rates)
Profit (operating
profit)
Special mining tax from 2% to 8% of operating profit for
firms without stability contracts (otherwise
4-13%)
South Africa 9 2 28% 0.5-7%
(profit-linked)
Value (adjusted
gross sales)
Note: Except for Chile and Peru, royalty rates vary by mineral and are shown here for major minerals. In Australia rates vary by mineral and state and in some cases commodity prices. In South Africa rates vary according to stage of processing and profitability. Value added and revenues are generally the average of 2012 and 2013; for Australia and South Africa, fiscal years are shown.
(a) Value-added shares include oil and gas.
(b) State-based taxes on goods taxes and social contributions also apply.
(c) Includes a surtax on corporate income.
Source: Datastream; ECLAC; IMF WEO Database, October 2014; National sources; PWC (2012), “Corporate Income Taxes, Mining Royalties and Other Mining Taxes”, Global Mining Industry Update, www.pwc.com/en_GX/gx/energy-utilities-mining/publications/pdf/pwc-gx-miining-taxes-and-royalties.pdf; OECD databases.
Given the opportunities presented by South Africa’s natural resource wealth, particularly the potential for developing its conventional and unconventional gas reserves, preserving investment incentives to explore and develop these resources is crucial. In general, royalty regimes reduce incentives for exploration, although the design of the South African regime mitigates this effect. Tax disincentives are also offset by investment incentives, including up-front full depreciation on mining investment, which can be carried forward indefinitely, and specific incentives to encourage exploration and development in the oil and gas industry. However, these incentives are reduced by “ring-fencing” of projects, which prevents depreciation expenses from exploration at one project from being offset against profits elsewhere (in the oil and gas industry, 10% of the benefit may be transferred to another project). This protects the tax base but reduces the immediate benefit of the incentives. Looking ahead, if large-scale exploitation of oil and gas reserves becomes feasible, early consideration should be given to using a resource rent tax, which could better preserve investment incentives and maximise the long-run return to the government. Variations of these regimes have been introduced in Alaska, China and Algeria, for example.
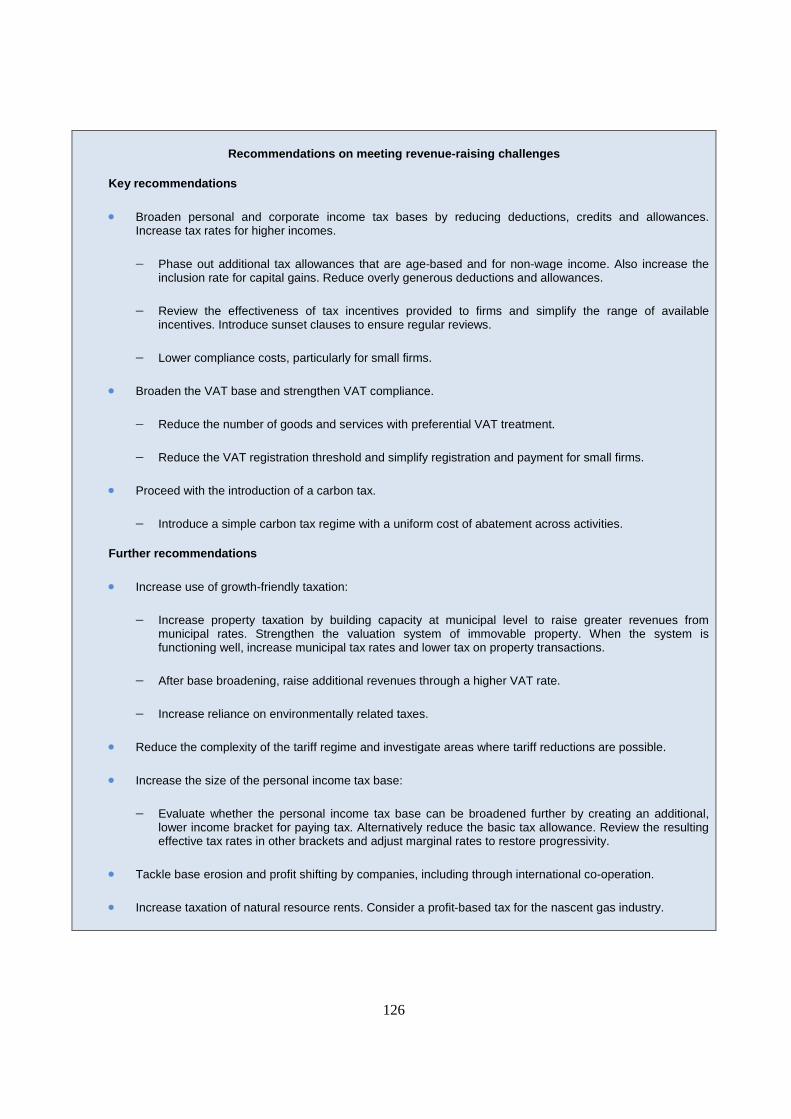
126
Recommendations on meeting revenue-raising challenges
Key recommendations
• Broaden personal and corporate income tax bases by reducing deductions, credits and allowances. Increase tax rates for higher incomes.
− Phase out additional tax allowances that are age-based and for non-wage income. Also increase the inclusion rate for capital gains. Reduce overly generous deductions and allowances.
− Review the effectiveness of tax incentives provided to firms and simplify the range of available incentives. Introduce sunset clauses to ensure regular reviews.
− Lower compliance costs, particularly for small firms.
• Broaden the VAT base and strengthen VAT compliance.
− Reduce the number of goods and services with preferential VAT treatment.
− Reduce the VAT registration threshold and simplify registration and payment for small firms.
• Proceed with the introduction of a carbon tax.
− Introduce a simple carbon tax regime with a uniform cost of abatement across activities.
Further recommendations
• Increase use of growth-friendly taxation:
− Increase property taxation by building capacity at municipal level to raise greater revenues from municipal rates. Strengthen the valuation system of immovable property. When the system is functioning well, increase municipal tax rates and lower tax on property transactions.
− After base broadening, raise additional revenues through a higher VAT rate.
− Increase reliance on environmentally related taxes.
• Reduce the complexity of the tariff regime and investigate areas where tariff reductions are possible.
• Increase the size of the personal income tax base:
− Evaluate whether the personal income tax base can be broadened further by creating an additional, lower income bracket for paying tax. Alternatively reduce the basic tax allowance. Review the resulting effective tax rates in other brackets and adjust marginal rates to restore progressivity.
• Tackle base erosion and profit shifting by companies, including through international co-operation.
• Increase taxation of natural resource rents. Consider a profit-based tax for the nascent gas industry.
127
NOTES
1. The structural progressivity indicator measures the percentage point increase of the average personal tax
rate per percentage point increase of the average wage over the 50-500% of the average wage income interval.
2. Thin capitalisation rules are designed to prevent companies from reducing their taxable income by deducting interest expense on excessive levels of debt. Transfer pricing rules aim to prevent companies from reducing taxable income by improperly pricing goods or services sold to or purchased from a subsidiary or other related party.
3. Preferential treatment is used to capture items with zero-ratings or exemptions from VAT. The difference between zero rating and exemption is that when a good or service is zero-rated the supplier may deduct tax paid on inputs. For simplicity, they are all referred to as exemptions here. Zero-rated items comprise: 19 basic food items, petrol, diesel, paraffin and municipal property rates, and exports. Exempted items include public transport, education, financial services and childcare services.
4. Estimates of illicit trade vary considerably, but for cigarettes (which feature most prominently), estimates from outside of the industry suggest that 23% of total consumption could be illicit (Lester and Allen, 2012), although other estimates are lower (van Walbeek, 2014).
5. The commitment as announced at the 2009 Copenhagen Climate Change Conference allows an absolute increase in emissions of almost 30% by 2020 and over 36% by 2025 relative to 2010 (OECD, 2013d) and is conditional on receiving the necessary finance, technology and support from the international community.
128
BIBLIOGRAPHY
Alton, T., C. Arndt, R. Davies, F. Hartley, K. Makrelov, J. Thurlow, and D. Ubogu (2014), “Introducing Carbon Taxes in South Africa”, Applied Energy, Vol. 116, pp. 344-354.
Anderson, J. E. and J. P. Neary (2005), Measuring the Restrictiveness of International Trade Policy, MIT Press, Cambridge.
Andrews, D., A. Caldera Sánchez, and A. Johansson (2011), “Housing Markets and Structural Policies in OECD Countries”, OECD Economics Department Working Paper, No. 836.
Arnold, J. (2008), “Do Tax Structures Affect Aggregate Economic Growth? Empirical Evidence From a Panel of OECD Countries”, OECD Economics Department Working Papers, No. 643, OECD Publishing, Paris.
Arnold, J., B. Brys, C. Heady, Å. Johansson, C. Schwellnus and L. Vartia (2011), “Tax Policy for Economic Recovery and Growth”, Economic Journal, Vol. 121, pp. F59–F80.
Brandt, N. (2014), “Greening the Property Tax”, OECD Working Papers on Fiscal Federalism, No. 17, OECD Publishing, Paris.
Blöchliger, H. (2015), “Reforming the Tax on Immovable Property: Taking Care of the Unloved”, OECD Economics Department Working Papers, No. 1205, OECD Publishing, Paris.
Cournède, B., A. Goujard and Á. Pina (2013), “How to Achieve Growth- and Equity-friendly Fiscal Consolidation?: A Proposed Methodology for Instrument Choice with an Illustrative Application to OECD Countries”, OECD Economics Department Working Papers, No. 1088, OECD Publishing, Paris.
Darroll, C. (2015), “Barriers to SMEs in South Africa”, OECD Economics Department Working Papers, OECD Publishing, Paris, forthcoming.
Daubanes, J. and S. Andrade de Sá (2014), “Taxing the Rent of Non-Renewable Resource Sectors: A Theoretical Note”, OECD Economics Department Working Papers, No. 1149, OECD Publishing, Paris.
Daude, C., H. Gutiérrez and A. Melguizo (2012), “What Drives Tax Morale”, OECD Development Centre Working Papers, No. 315, OECD Publishing, Paris.
Davis Tax Committee (2014a), “Small and Medium Enterprises: Taxation Considerations”, Interim Report, July 2014, Pretoria.
Davis Tax Committee (2014b), “First Interim Report on Base Erosion and Profit Shifting”, December 2014, Pretoria.
Davis Tax Committee (2015), “The Tax System and Inclusive Growth in South Africa: Towards and Analytical Framework for the Davis Tax Committee”, Discussion Document, June, Pretoria.
129
de Mello, L. (2008), “Avoiding the Value Added Tax: Theory and Cross-Country Evidence”, OECD Economics Department Working Papers, No. 604, OECD Publishing, Paris.
de Paula, Á and J.A. Scheinkman (2007), “The Informal Sector”, NBER Working Papers, No. 13486, NBER, Cambridge.
Edwards, L. and N. Rankin (2015), “Labour Market Policies, Firm Dynamics and Export Performance in South Africa”, OECD Economics Department Working Papers, OECD Publishing, Paris, forthcoming.
Edwards, L. and T. van de Winkel (2005), “The Market Disciplining Effects of Trade Liberalisation and Regional Import Penetration on Manufacturing in South Africa”, Trade and Industrial Policy Strategies Working Paper, No. 1/2005.
Energy Research Centre (2013), “Comments on the Carbon Tax Policy Paper Issued by the National Treasury in May 2013”, University of Cape Town.
Energy Research Centre (2014), “Comments on the Carbon Offsets Paper Issued by National Treasury in April 2014”, University of Cape Town.
FIAS (2007), “South Africa: Tax Compliance Burden for Small Businesses: A Survey of Tax Practitioners,” World Bank Group, Washington DC.
Financial Mail (2015), “SARS Must Repair the Social Contract”, 12 March 2015, www.financialmail.co.za/opinion/editorial/2015/03/12/editorial-sars-must-repair-the-social-contract.
Gordhan, P. (2013), Budget Speech, 27 February 2013, www.treasury.gov.za/documents/national%20budget/2013/speech/speech.pdf.
Harding, M. (2013), “Taxation of Dividend, Interest, and Capital Gains Income”, OECD Taxation Working Papers, No. 19, OECD Publishing, Paris.
Harding, M. (2014a), “Personal Tax Treatment of Company Cars and Commuting Expenses: Estimating the Fiscal and Environmental Costs”, OECD Taxation Working Papers, No. 20, OECD Publishing, Paris.
Harding, M. (2014b), “Differences in the Tax Treatment of Gasoline and Diesel for Road Use”, OECD Taxation Working Papers, No. 21, OECD Publishing, Paris.
Immervoll, H. and M. Pearson (2009), “A Good Time for Making Work Pay? Taking Stock of In-Work Benefits and Related Measures Across the OECD”, OECD Social, Employment and Migration Working Papers, No. 81, OECD Publishing, Paris.
Inchauste, G., N. Lustig, M. Maboshe, C. Purfield and I. Woolard (2015), “The Distributional Impact of Fiscal Policy in South Africa”, Policy Research Working Papers, No. 7194, The World Bank, Washington, DC.
IADB (2013), More Than Revenue: Taxation as a Development Tool, A. Corbacho, V. Fretes Cibils and E. Lora (eds.), Development in the Americas, Inter-American Development Bank, Palgrave McMillan, New York.
IEA (2014), World Energy Outlook 2014, International Energy Agency Publications, Paris.
130
IMF (2012), “Fiscal Regimes for Extractive Industries – Design and Implementation”, IMF Policy Paper, International Monetary Fund, Washington, DC.
IMF (2014), “South Africa: Selected Issues Paper”, IMF Country Report, No. 14/339, International Monetary Fund, Washington, DC.
Jansen A. and E. Calitz, (2015), “Reconsidering the Effectiveness of Zero-rating of Value-added Tax in South Africa”, REDI3x3 Working Papers, forthcoming.
Johansson, Å., C. Heady, J. Arnold, B. Brys and L. Vartia (2008), “Tax and Economic Growth”, OECD Economics Department Working Papers, No. 620, OECD Publishing, Paris.
Joumard, I., M. Pisu and D. Bloch (2012), “Tackling Income Inequality: The Role of Taxes and Transfers”, OECD Journal: Economic Studies, Vol. 2012, No. 1, pp. 37-70.
Lester, A. and E. Allen (2012), “SADC Review – Study into the Illicit Trade in Excisable Products with Particular Reference to Alcohol and Tobacco Products”, DNA Economics and GFA Consulting Group, www.sadc.int/files/3913/5895/1270/SADC_study_into_the_illicit_trade_in_excise_products.pdf.
Manuel, T. (2002), “The South African Tax Reform Experience Since 1994”, Address at the Conference of the International Bar Association, 24 October.
Monkam, N.F. (2014), “Local Municipality Productive Efficiency and its Determinants in South Africa”, Development South Africa, Vol. 31, No. 2, pp. 275-298.
Nakhooda, S. (2014), “Carbon Taxes in South Africa: The Political and Technical Challenges of Pricing Carbon”, ODI Working Papers, No. 399, Overseas Development Institute, London.
National Treasury (2007), “The VAT Treatment of Merit Goods and Services”, National Treasury Working Paper, No. T16/05, National Treasury, Pretoria.
National Treasury (2013), “Mining Taxation: the South African Context”, a report by Economic Tax Analysis, August, www.pmg-assets.s3-website-eu-west-1.amazonaws.com/131106mining.pdf.
National Treasury (2014), “A Review of the Taxation of Alcoholic Beverages in South Africa”, Discussion Document, May 2014.
National Treasury, (2015a), Budget Review 2015, Pretoria.
National Treasury, (2015b), “Local Government Revenue and Expenditure: Second Quarter Local Government Section 71 Report”, 20 March 2015, Pretoria.
National Treasury and SARS (2014), 2014 Tax Statistics, National Treasury and South African Revenue Service, Pretoria.
OECD (2005), “Increasing Financial Incentives to Work: the Role of In-work Benefits”, in OECD Employment Outlook, OECD Publishing, Paris.
OECD (2008), Economic Assessment of South Africa, OECD Publishing, Paris.
131
OECD (2009), Taxation of SMEs: Key Issues and Policy Considerations, OECD Tax Policy Studies, No. 18, OECD Publishing, Paris.
OECD (2010a), Choosing a Broad Base – Low Rate Approach to Taxation, OECD Tax Policy Studies, No. 19, OECD Publishing, Paris.
OECD (2010b), Tax Policy Reform and Economic Growth, OECD Tax Policy Studies, No. 20, OECD Publishing, Paris.
OECD (2010c), OECD Economic Surveys: South Africa 2010, OECD Publishing, Paris.
OECD (2011a), G20 Country Policy Briefs: Brazil, www.oecd.org/els/48723896.pdf.
OECD (2011b), Taxation, Innovation and the Environment, OECD Publishing, Paris.
OECD (2012), “Improving the Tax System”, in OECD Economic Surveys: Indonesia 2012, OECD Publishing, Paris.
OECD (2013a), Tax Administration 2013, OECD Publishing, Paris.
OECD (2013b), “Taxation and Knowledge Based Capital”, in Supporting Investment in Knowledge Capital, Growth and Innovation, OECD Publishing, Paris.
OECD (2013c), Addressing Base Erosion and Profit Shifting, OECD Publishing, Paris.
OECD (2013d), OECD Economic Surveys: South Africa 2013, OECD Publishing, Paris.
OECD (2013e), OECD Environmental Performance Reviews: South Africa 2013, OECD Publishing, Paris.
OECD/Korea Institute of Public Finance (2014), The Distributional Effects of Consumption Taxes in OECD Countries, OECD Tax Policy Studies, No. 22, OECD Publishing, Paris.
OECD (2014a), Employment Outlook 2014, OECD Publishing, Paris.
OECD (2014b), Tax Compliance by Design: Achieving Improved SME Tax Compliance by Adopting a System Perspective, OECD Publishing, Paris.
OECD (2014c), Countering Harmful Tax Practices More Effectively, Taking into Account Transparency and Substance, OECD/G20 Base Erosion and Profit Shifting Project, OECD Publishing, Paris.
OECD (2014d), “Measuring Performance of VAT”, in Consumption Tax Trends 2014: VAT/GST and Excise Rates, Trends and Policy Issues, OECD Publishing, Paris.
OECD (2015a), Taxing Wages 2015, OECD Publishing, Paris.
OECD (2015b), OECD Economic Surveys: Mexico 2015, OECD Publishing, Paris.
OECD (2015c), Taxing Energy Use 2015: OECD and Selected Partner Economies, OECD Publishing, Paris.
OECD (2015d), Synthesis Report on Assessing Progress on Climate Change Mitigation Policy, OECD Publishing, Paris, forthcoming.
132
Oliveira Martins, J., R. Boarini, H. Strauss, C. de la Maisonneuve and and C. Saadi (2007), “The Policy Determinants of Investment in Tertiary Education”, OECD Economics Department Working Papers, No. 576, OECD Publishing, Paris.
Parry, I., D. Heine, E. Lis and S. Li (2014), Getting Energy Prices Right: From Principle to Practice, International Monetary Fund, Washington, DC.
Powell, D., A. May, P. Ntliziywana and J. de Visser (2010), “The Withholding of Rates and Taxes in Five Local Municipalities”, Report of the Community Law Centre of SALGA.
Slack, E. and R. Bird (2014), "The Political Economy of Property Tax Reform", OECD Working Papers on Fiscal Federalism, No. 18, OECD Publishing, Paris.
Smulders, S., M. Stiglingh, R. Franzsen and L. Fletcher (2012), “Tax Compliance Costs for the Small Business Sector in South Africa – Establishing a Baseline”, eJournal of Tax Research, Vol. 10, No. 2, pp. 184-226.
SARS (2014), 2013-14 Annual Report, South African Revenue Service, Pretoria.
Statistics South Africa (2015), “2015 Environmental Accounts Compendium”, Report No. 04-05-20, Statistics South Africa, Pretoria.
Thurlow, J. (2006), “Trade Liberalisation and Pro-Poor Growth in South Africa”, Asgi-SA conference.
Van Walbeek, C. (2014), “Measuring Changes in the Illicit Cigarette Market Using Government Revenue Data: the Example of South Africa”, Tobacco Control, No. 23, e69-74.
Wieders, I. (2013), “Perceptions and Realities of Corruption in South Africa”, Afrobarometer Briefing Papers, No. 110.
World Bank (2006), Sector Study of the Effective Tax Burden, Foreign Investment Advisory Service, World Bank, Washington DC.
World Bank (2014a), “South Africa Economic Update: Fiscal Policy and Redistribution in an Unequal Society”, South Africa Economic Update, No. 6, World Bank Group, Washington, DC.
World Bank (2015), “Sector Study of Effective Tax Burden and Effectiveness of Investment Incentives in South Africa - Part 1”, World Bank Group, Washington, DC..
WHO (2011), “WHO Technical Manual on Tobacco Tax Administration”, World Health Organisation Press, Geneva.
WWF-SA (2014), “WWF South Africa’s Response to the Carbon Offset Discussion Paper Published by National Treasury”, http://awsassets.wwf.org.za/downloads/wwf_s_response_to_national_treasury_s_offset_paper___27_june_2014.pdf.

133