Embed Size (px)
Citation preview
B A Y L O R U N I V E R S I T Y
OFFICE OF INSTITUTIONAL RESEARCH AND TESTING ONE BEAR PLACE #97032 WACO, TEXAS 76798-7032 (254) 710-2061 FAX (254) 710-2062
IRT Series Vol. 10-11, No. 64 October 21, 2010
Profile of Non-Enrolling Accepted Students Fall 2010
Executive Summary
This report contains descriptive information about students who were accepted to Baylor University as first-time freshmen for Fall 2010 but did not enroll.
• Of the 16,316 first-time freshmen accepted for the Fall 2010 class, 3,259 (20.0%) enrolled. • Subsequent enrollment at another institution for the non-enrolling accepts was tracked using
data from the National Student Clearinghouse (NSC). Of the 13,057 students who did not enroll, the NSC had Fall 2010 enrollment information on 11,269 (86.3%) of these students. The largest group of those students tracked by NSC enrolled at a four-year public institution.
• Of those students tracked by NSC, 1,517 (13.5%) enrolled at Texas A&M University in Fall 2010.
• In general, students who were accepted but did not enroll at Baylor had higher entrance test scores and high school quartiles than those students who did enroll.
Detailed Report
This report contains descriptive information about students who were accepted to Baylor University as first-time freshmen for Fall 2010 but did not enroll. Included in this report is information about the following topics: Gender Minority Status Citizenship Status Racial/Ethnic Group
First Generation Student State of Permanent Address Religious Affiliation Entrance Test Scores
High School Quartile Academic Index Academic Unit
There were 16,316 first-time freshmen accepted for the Fall 2010 class. Of those accepted, 3,259 (20.0%) enrolled. In order to seek additional information on the 13,057 students who did not enroll, the Office of Institutional Research & Testing (IRT) submitted a file of these students to the National Student Clearinghouse (NSC). The NSC is a national repository of student records used for student degree and enrollment verification. The “Student Tracker” service from the NSC enables institutions to tap the nation’s largest enrollment database and track where students ultimately enroll. IRT submitted the file of the 13,057 non-enrolling accepts. The NSC had enrollment information on 11,269 (86.3%) of these students. NSC provided information for each of these students including institution of matriculation, matriculation dates, institution type, and institution location.
2
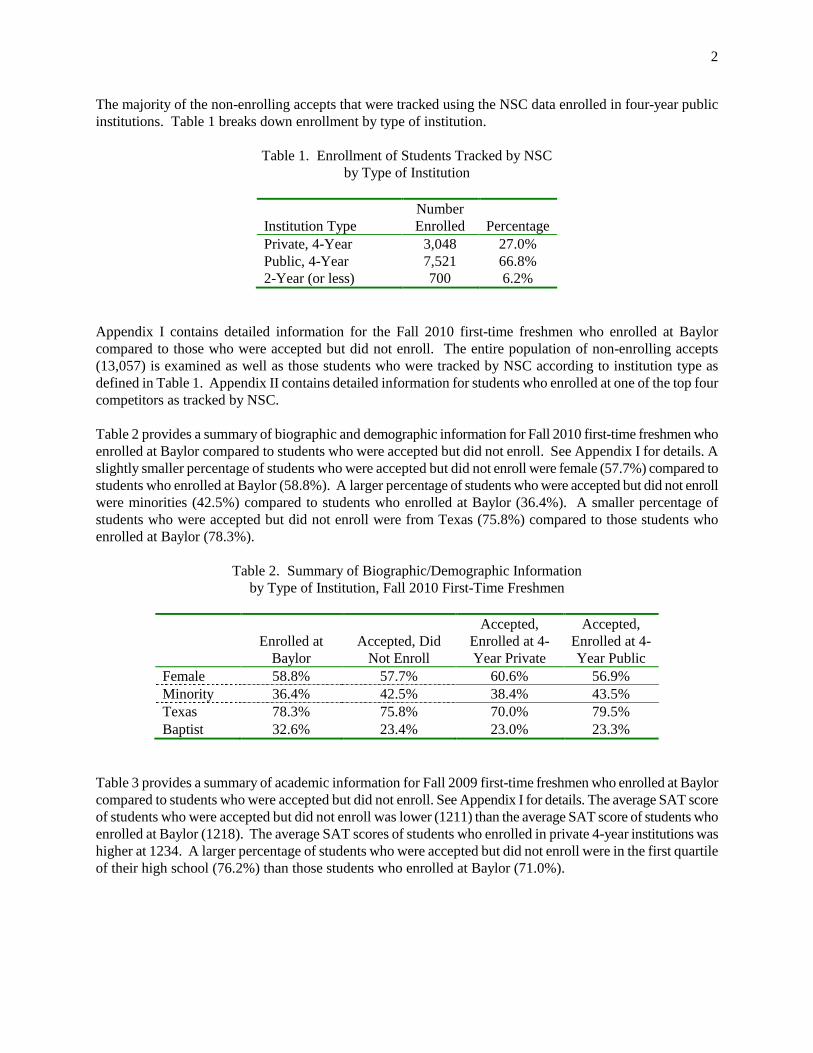
The majority of the non-enrolling accepts that were tracked using the NSC data enrolled in four-year public institutions. Table 1 breaks down enrollment by type of institution.
Table 1. Enrollment of Students Tracked by NSC by Type of Institution
Institution Type Number Enrolled Percentage
Private, 4-Year 3,048 27.0% Public, 4-Year 7,521 66.8% 2-Year (or less) 700 6.2%
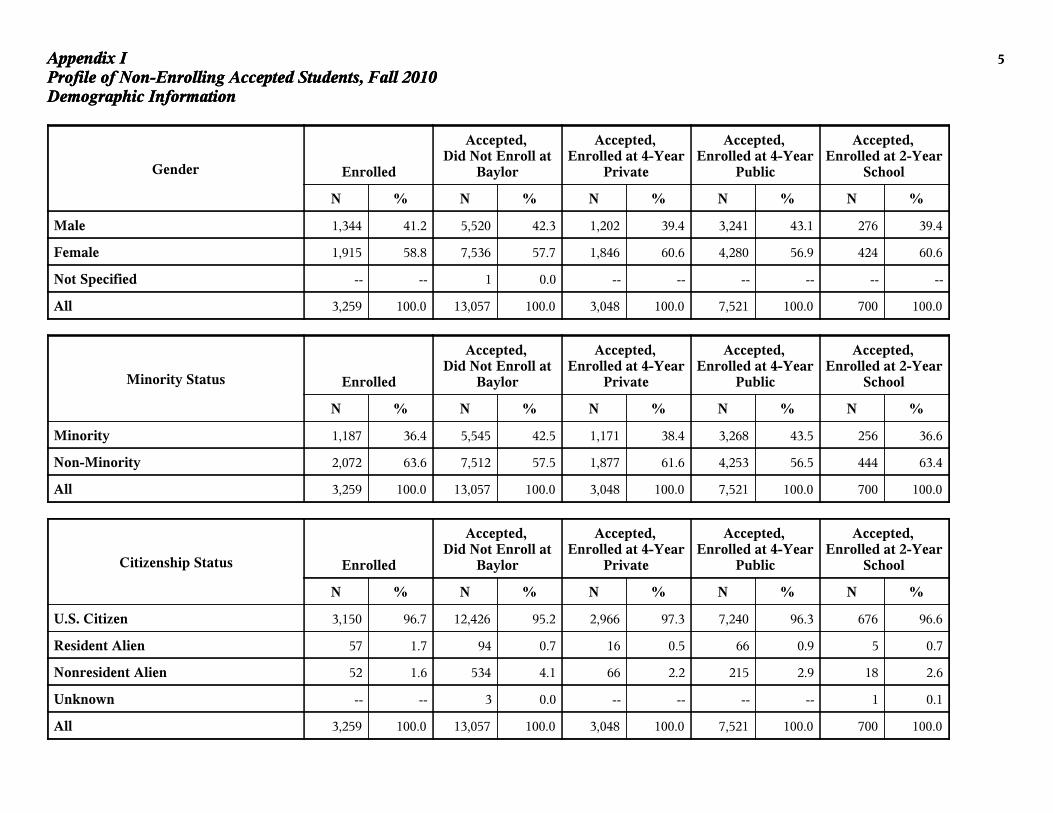
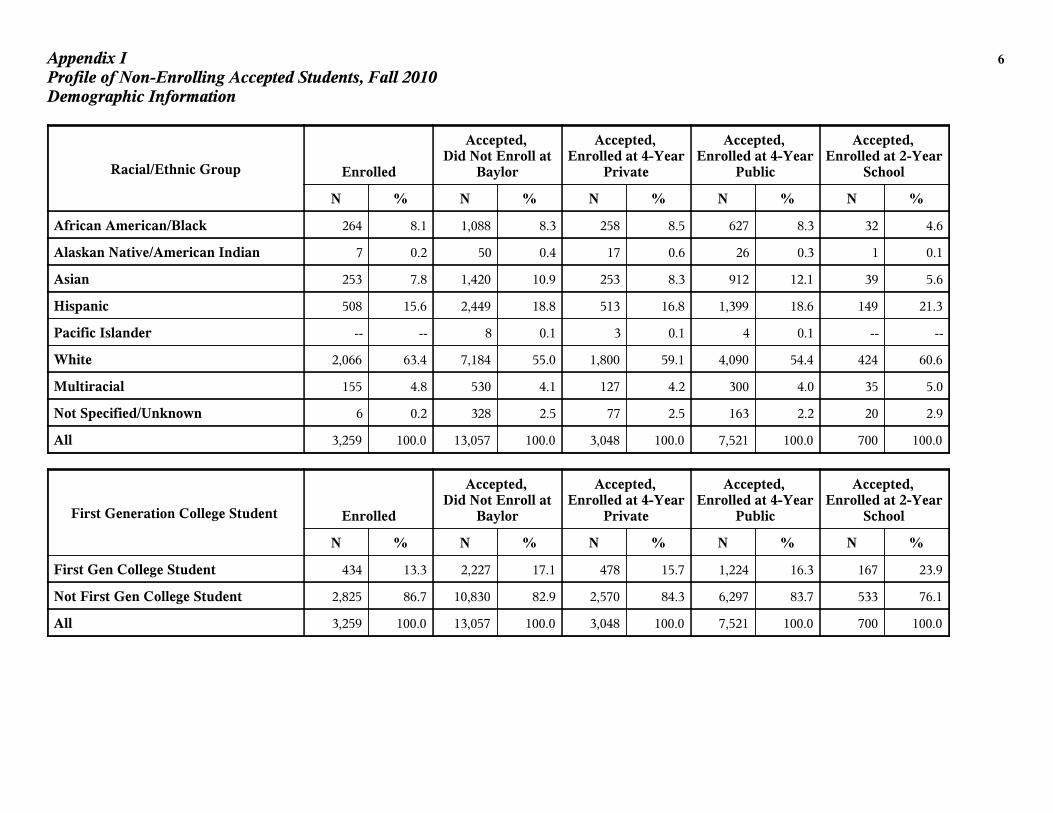
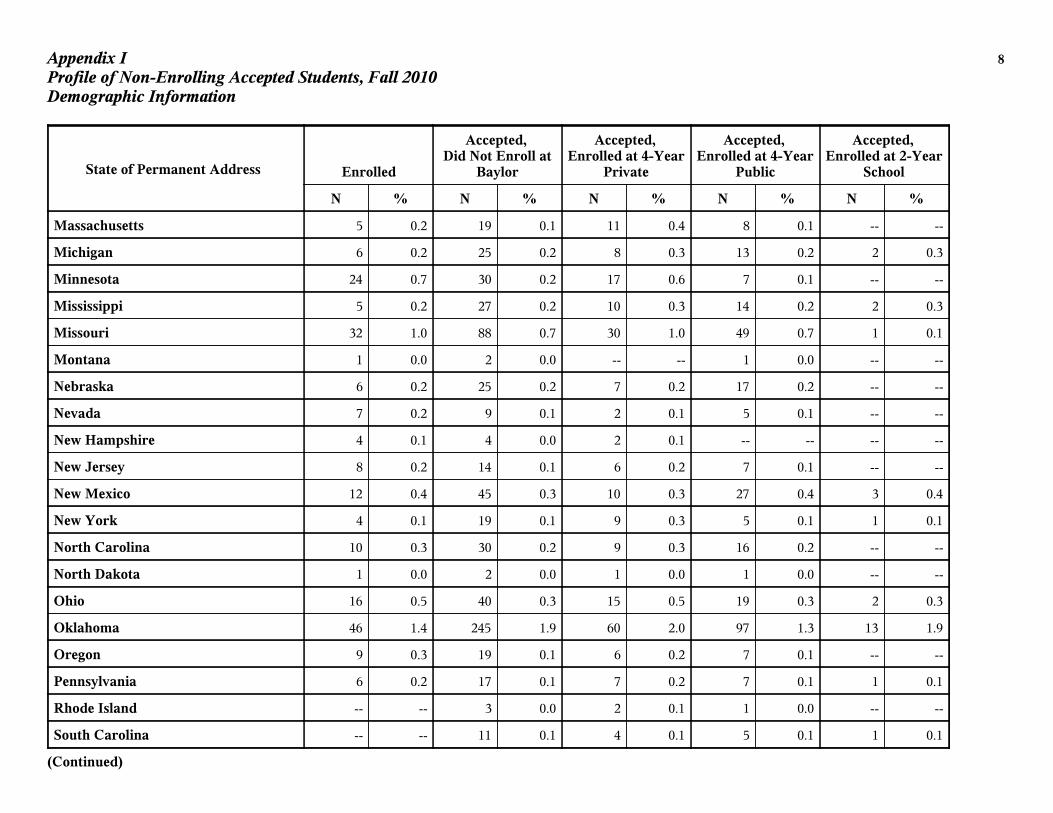
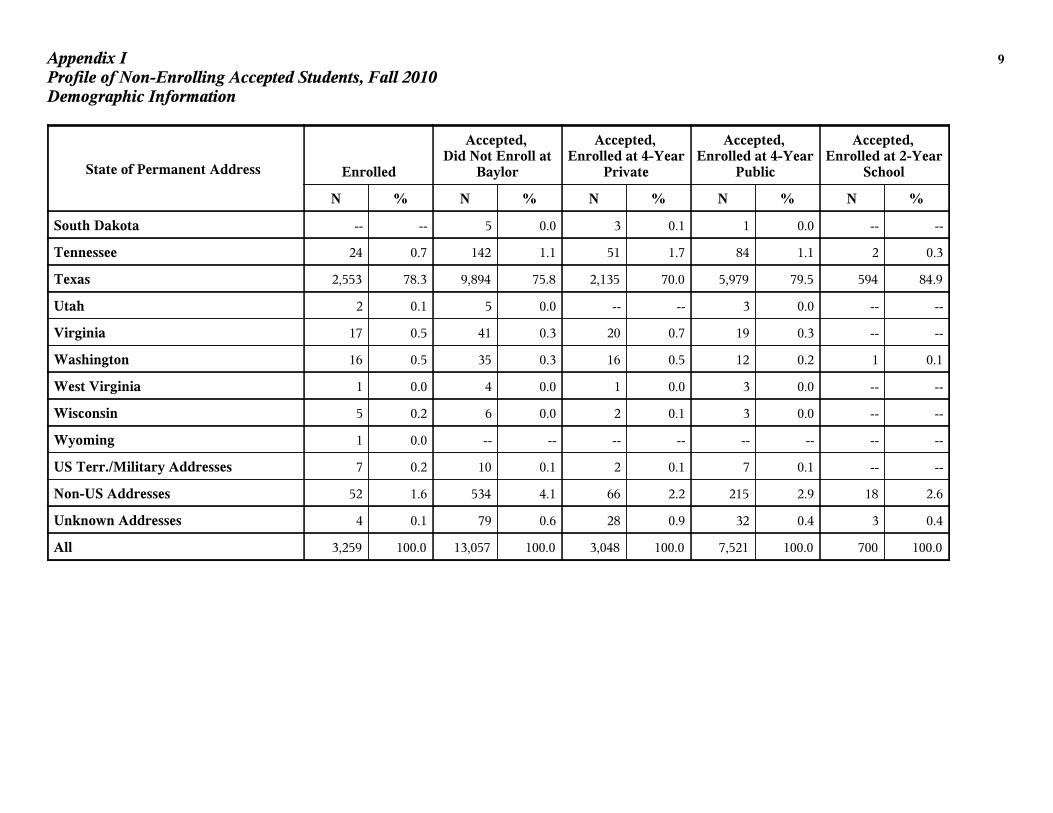
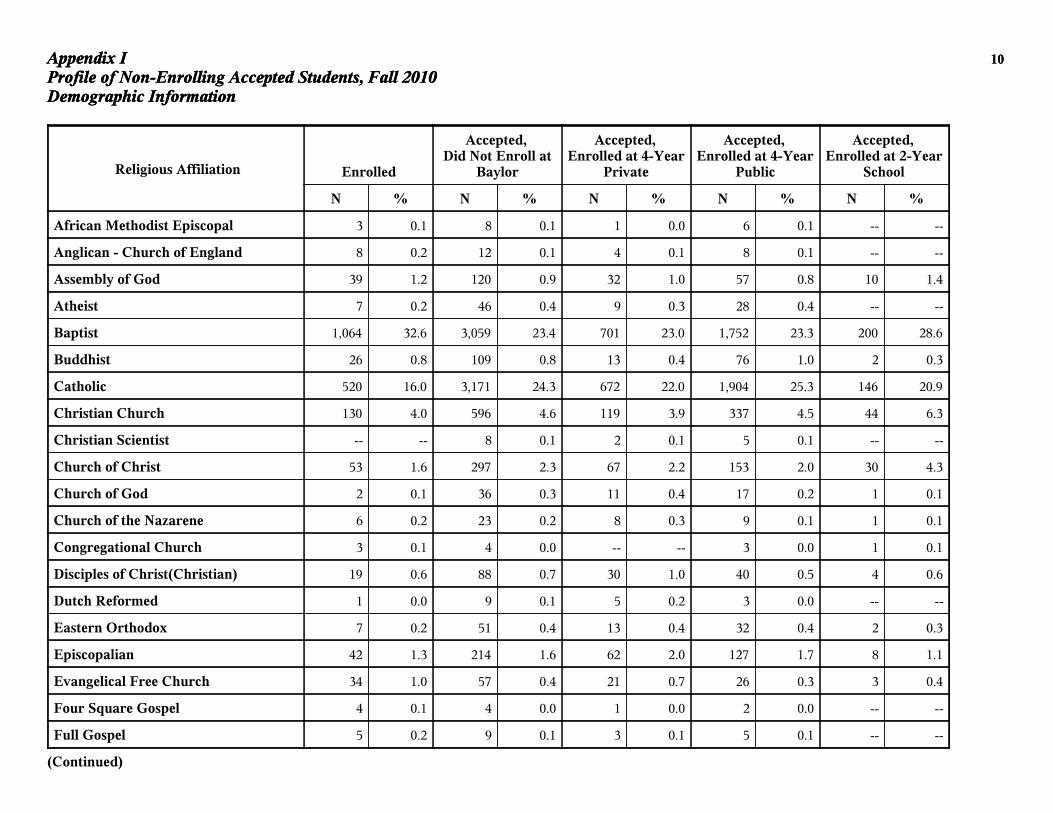
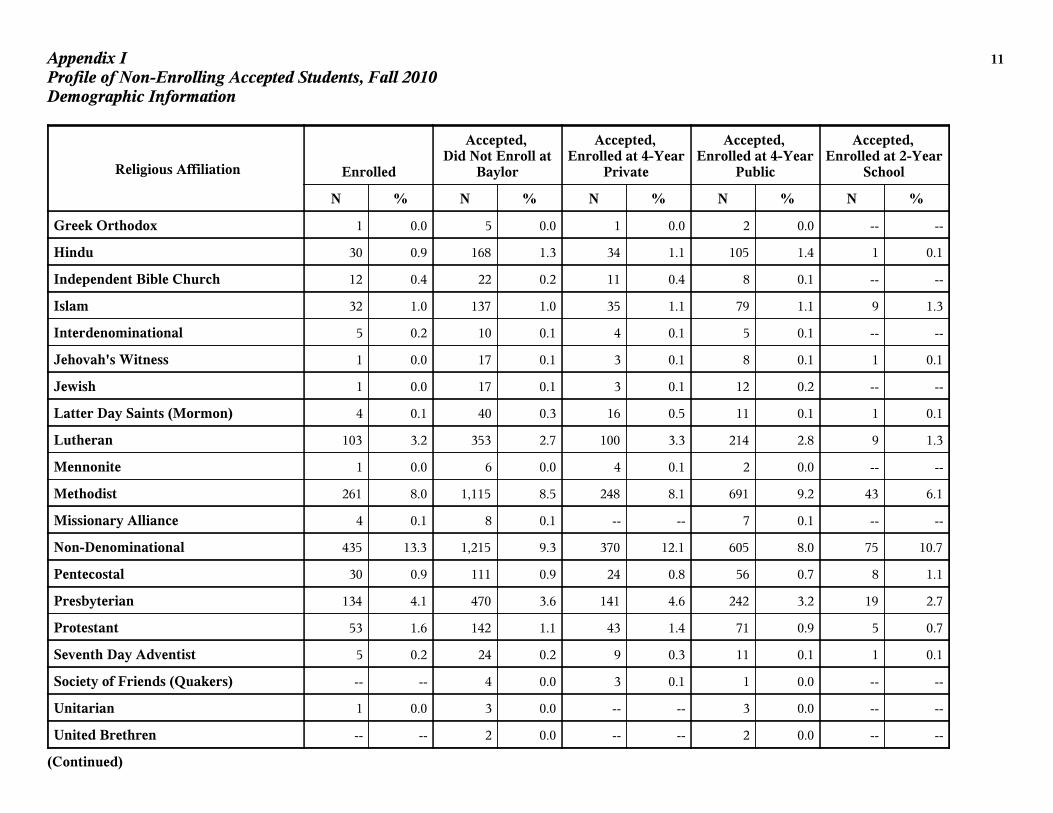
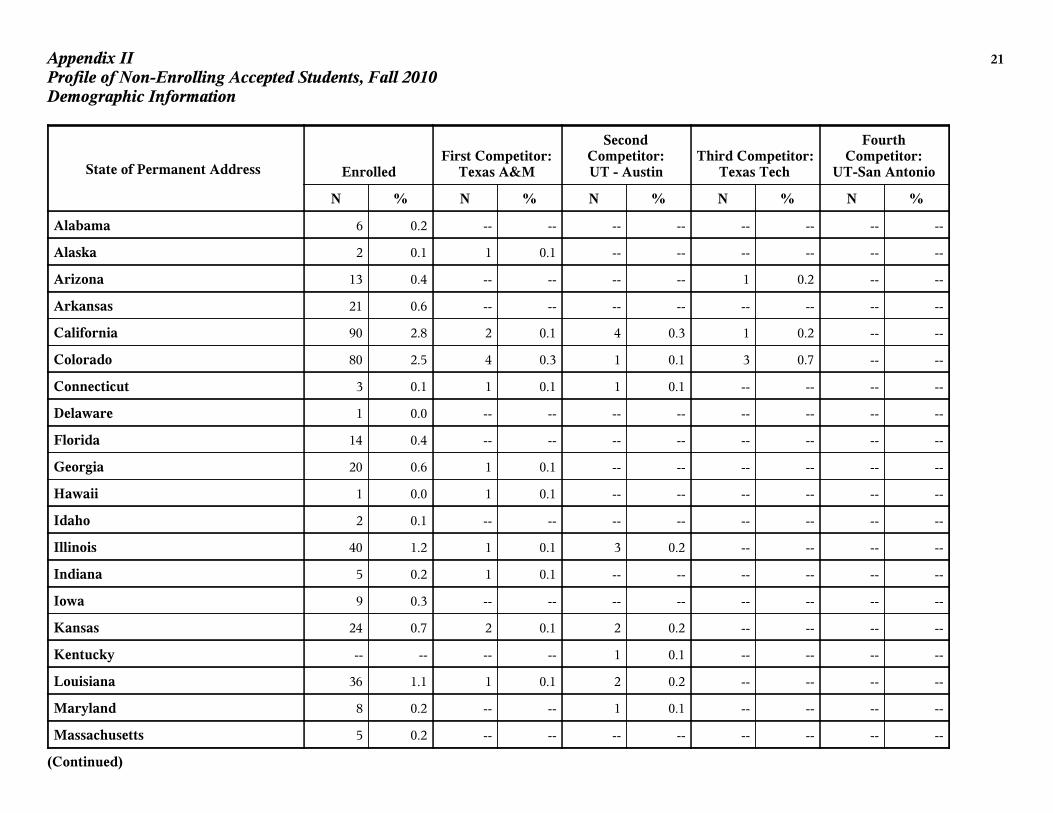
Appendix I contains detailed information for the Fall 2010 first-time freshmen who enrolled at Baylor compared to those who were accepted but did not enroll. The entire population of non-enrolling accepts (13,057) is examined as well as those students who were tracked by NSC according to institution type as defined in Table 1. Appendix II contains detailed information for students who enrolled at one of the top four competitors as tracked by NSC. Table 2 provides a summary of biographic and demographic information for Fall 2010 first-time freshmen who enrolled at Baylor compared to students who were accepted but did not enroll. See Appendix I for details. A slightly smaller percentage of students who were accepted but did not enroll were female (57.7%) compared to students who enrolled at Baylor (58.8%). A larger percentage of students who were accepted but did not enroll were minorities (42.5%) compared to students who enrolled at Baylor (36.4%). A smaller percentage of students who were accepted but did not enroll were from Texas (75.8%) compared to those students who enrolled at Baylor (78.3%).
Table 2. Summary of Biographic/Demographic Information by Type of Institution, Fall 2010 First-Time Freshmen
Enrolled at
Baylor Accepted, Did
Not Enroll
Accepted, Enrolled at 4-Year Private
Accepted, Enrolled at 4-Year Public
Female 58.8% 57.7% 60.6% 56.9% Minority 36.4% 42.5% 38.4% 43.5% Texas 78.3% 75.8% 70.0% 79.5% Baptist 32.6% 23.4% 23.0% 23.3%
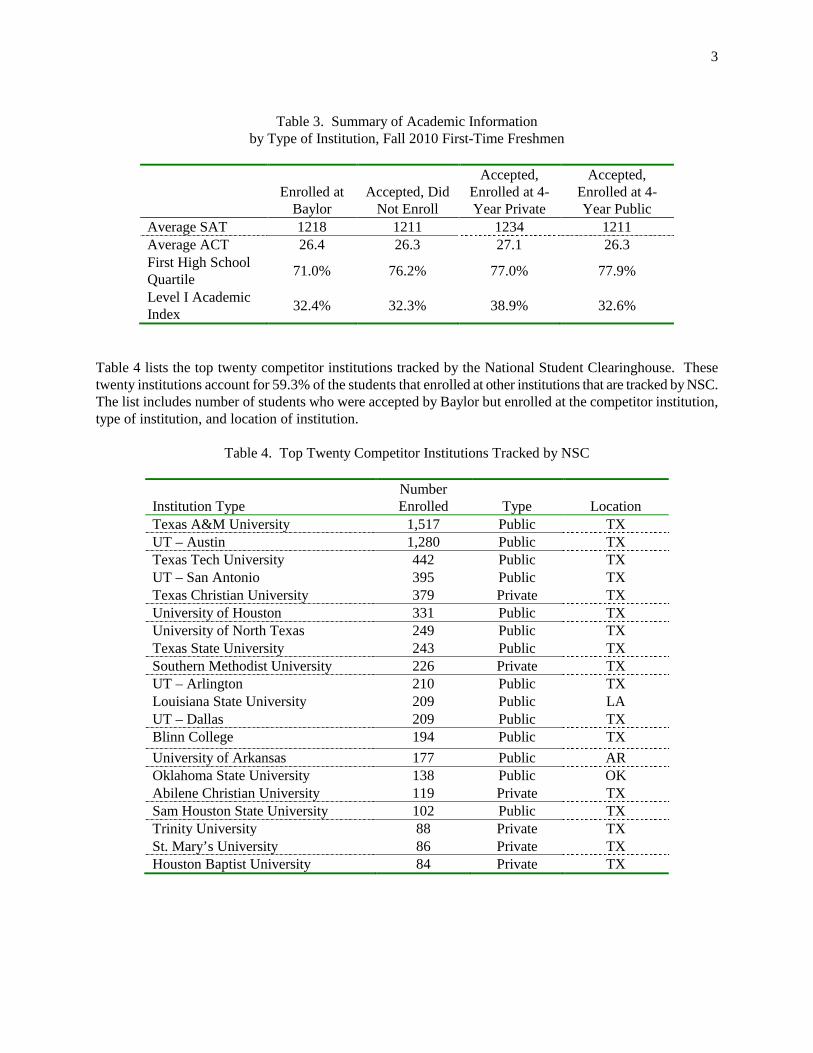
Table 3 provides a summary of academic information for Fall 2009 first-time freshmen who enrolled at Baylor compared to students who were accepted but did not enroll. See Appendix I for details. The average SAT score of students who were accepted but did not enroll was lower (1211) than the average SAT score of students who enrolled at Baylor (1218). The average SAT scores of students who enrolled in private 4-year institutions was higher at 1234. A larger percentage of students who were accepted but did not enroll were in the first quartile of their high school (76.2%) than those students who enrolled at Baylor (71.0%).
3
Table 3. Summary of Academic Information
by Type of Institution, Fall 2010 First-Time Freshmen
Enrolled at
Baylor Accepted, Did
Not Enroll
Accepted, Enrolled at 4-Year Private
Accepted, Enrolled at 4-Year Public
Average SAT 1218 1211 1234 1211 Average ACT 26.4 26.3 27.1 26.3 First High School Quartile 71.0% 76.2% 77.0% 77.9%
Level I Academic Index 32.4% 32.3% 38.9% 32.6%
Table 4 lists the top twenty competitor institutions tracked by the National Student Clearinghouse. These twenty institutions account for 59.3% of the students that enrolled at other institutions that are tracked by NSC. The list includes number of students who were accepted by Baylor but enrolled at the competitor institution, type of institution, and location of institution.
Table 4. Top Twenty Competitor Institutions Tracked by NSC
Institution Type Number Enrolled Type Location
Texas A&M University 1,517 Public TX UT – Austin 1,280 Public TX Texas Tech University 442 Public TX UT – San Antonio 395 Public TX Texas Christian University 379 Private TX University of Houston 331 Public TX University of North Texas 249 Public TX Texas State University 243 Public TX Southern Methodist University 226 Private TX UT – Arlington 210 Public TX Louisiana State University 209 Public LA UT – Dallas 209 Public TX Blinn College 194 Public TX University of Arkansas 177 Public AR Oklahoma State University 138 Public OK Abilene Christian University 119 Private TX Sam Houston State University 102 Public TX Trinity University 88 Private TX St. Mary’s University 86 Private TX Houston Baptist University 84 Private TX
4
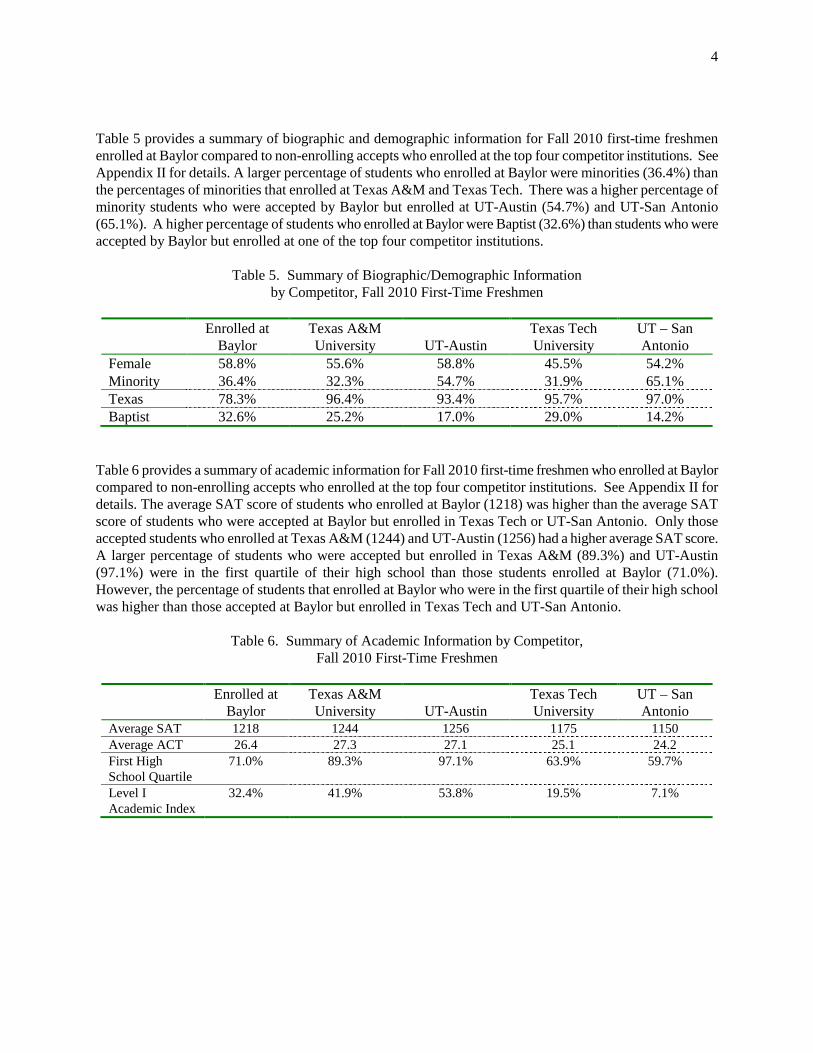
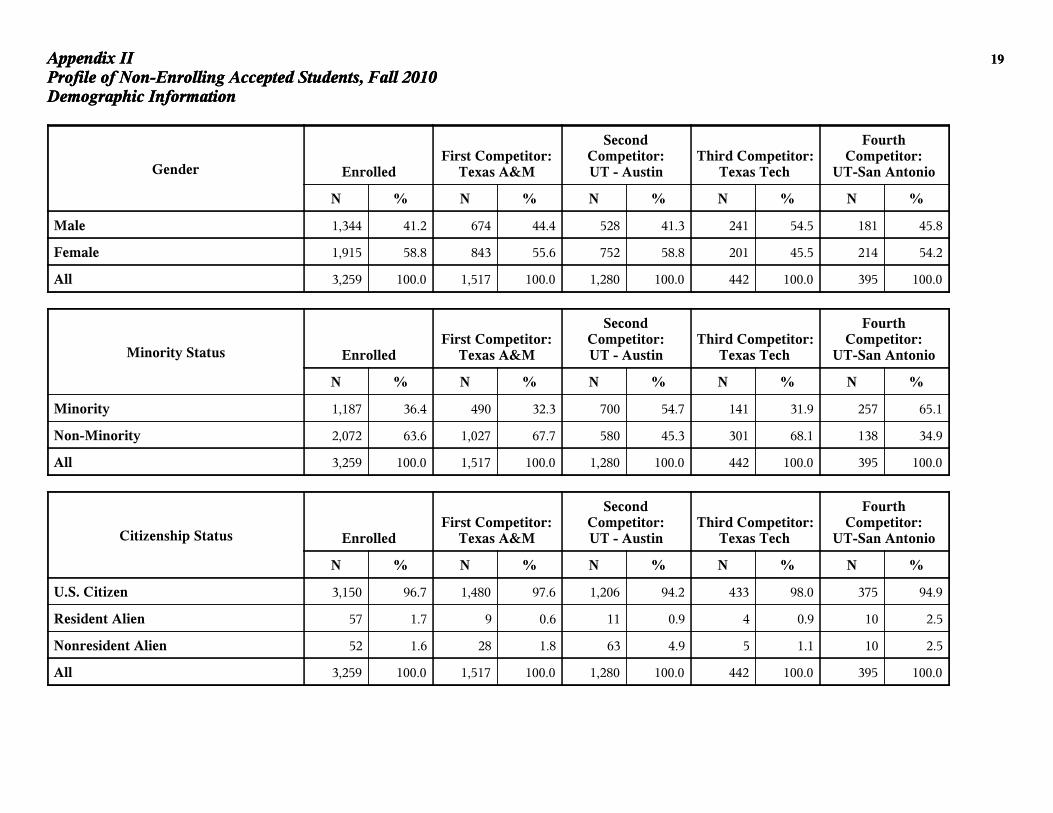
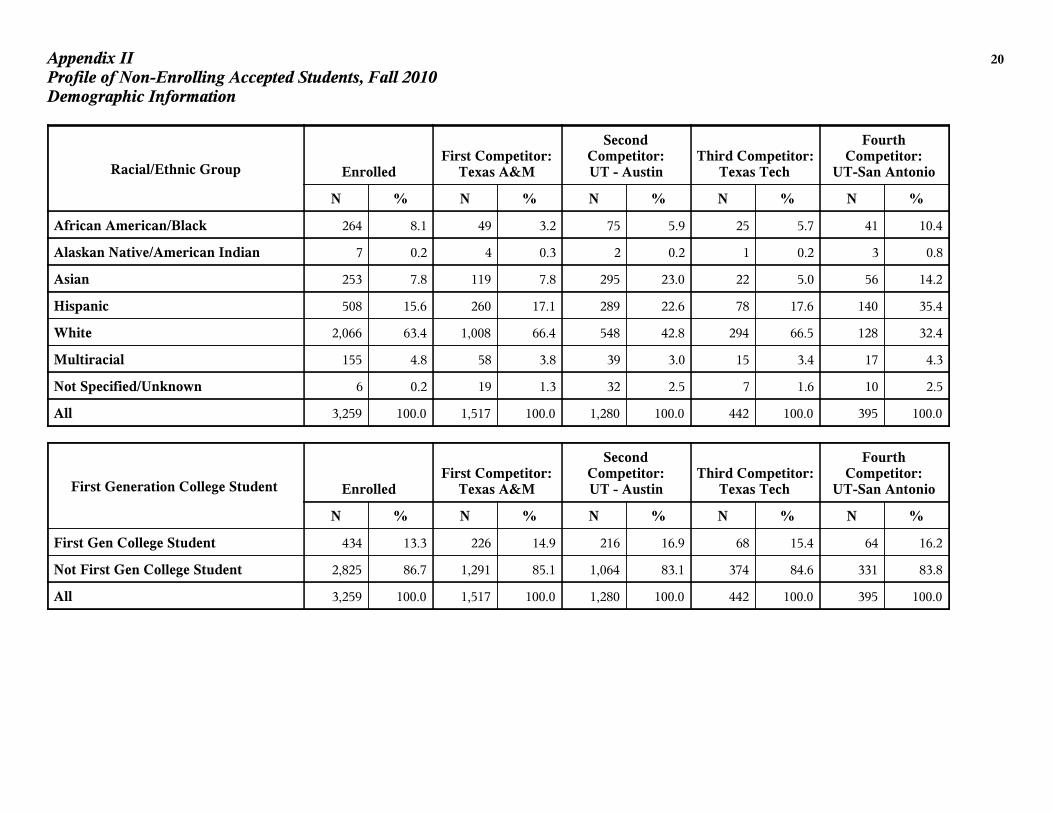
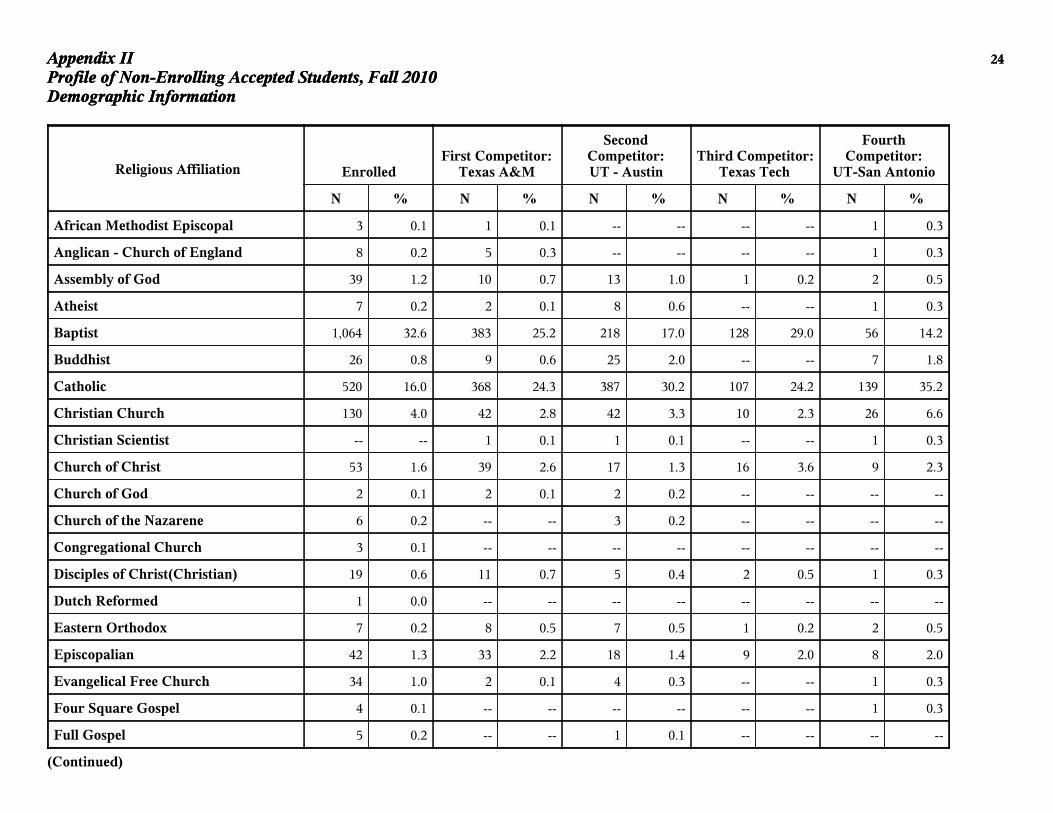
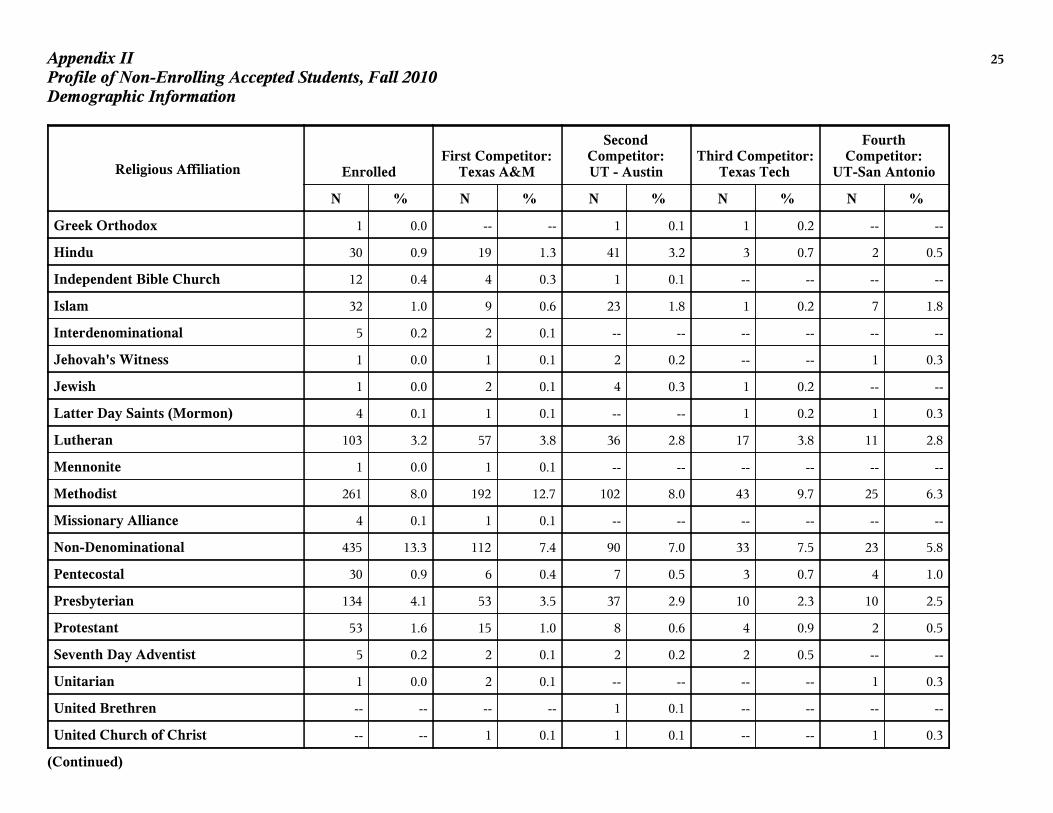
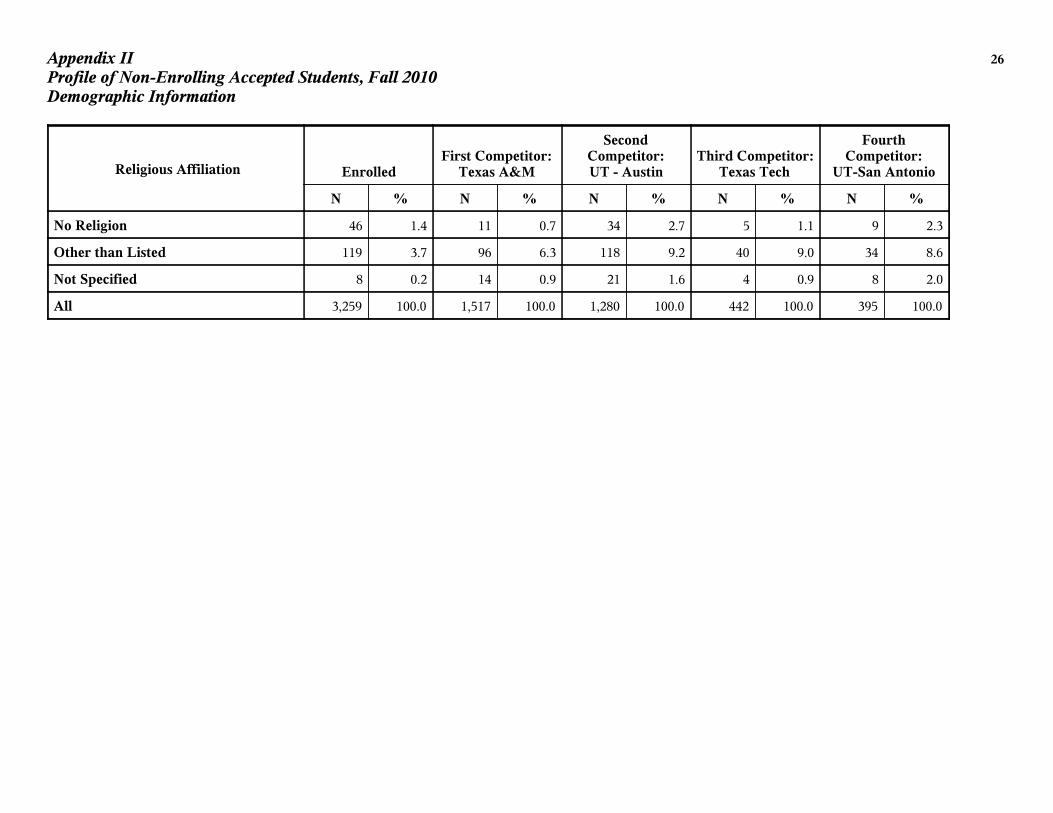
Table 5 provides a summary of biographic and demographic information for Fall 2010 first-time freshmen enrolled at Baylor compared to non-enrolling accepts who enrolled at the top four competitor institutions. See Appendix II for details. A larger percentage of students who enrolled at Baylor were minorities (36.4%) than the percentages of minorities that enrolled at Texas A&M and Texas Tech. There was a higher percentage of minority students who were accepted by Baylor but enrolled at UT-Austin (54.7%) and UT-San Antonio (65.1%). A higher percentage of students who enrolled at Baylor were Baptist (32.6%) than students who were accepted by Baylor but enrolled at one of the top four competitor institutions.
Table 5. Summary of Biographic/Demographic Information by Competitor, Fall 2010 First-Time Freshmen
Enrolled at
Baylor Texas A&M University UT-Austin
Texas Tech University
UT – San Antonio
Female 58.8% 55.6% 58.8% 45.5% 54.2% Minority 36.4% 32.3% 54.7% 31.9% 65.1% Texas 78.3% 96.4% 93.4% 95.7% 97.0% Baptist 32.6% 25.2% 17.0% 29.0% 14.2%
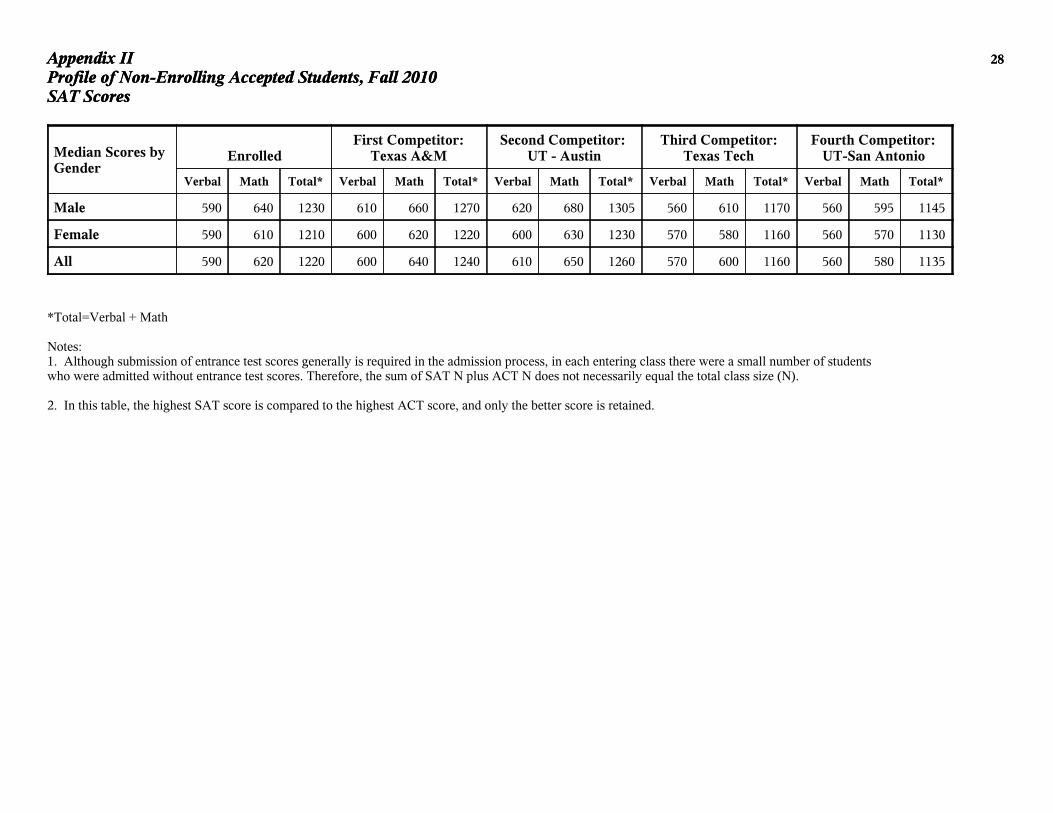
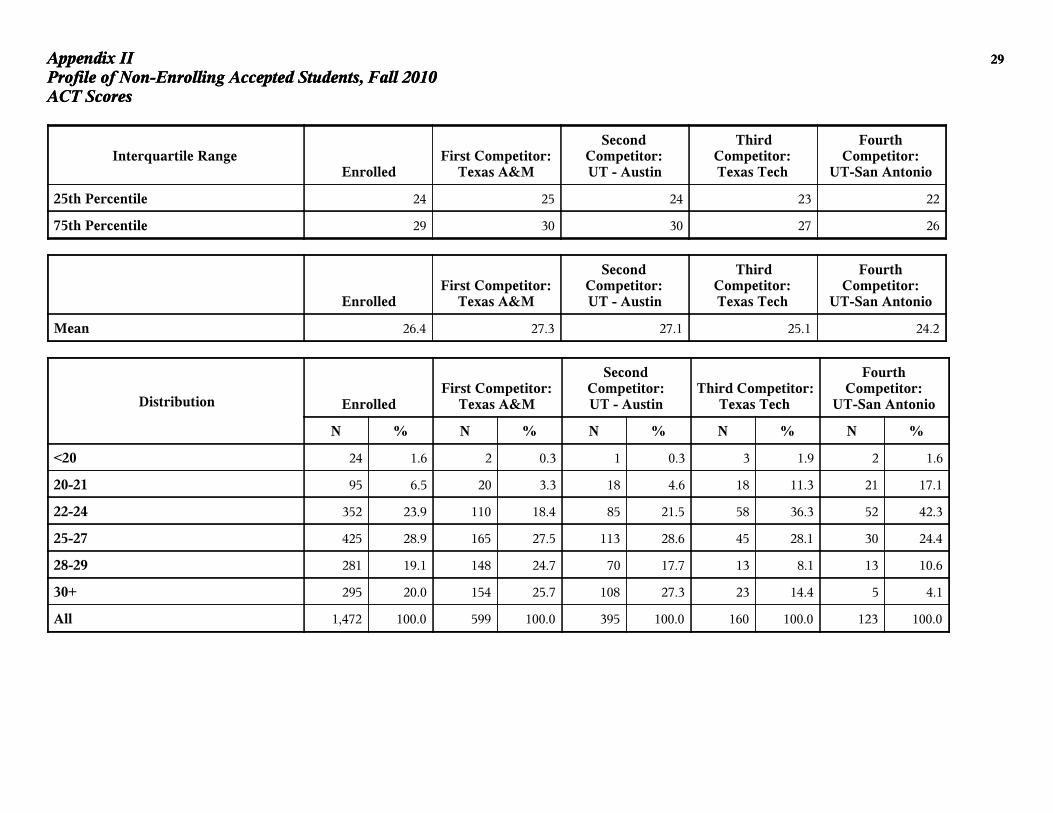
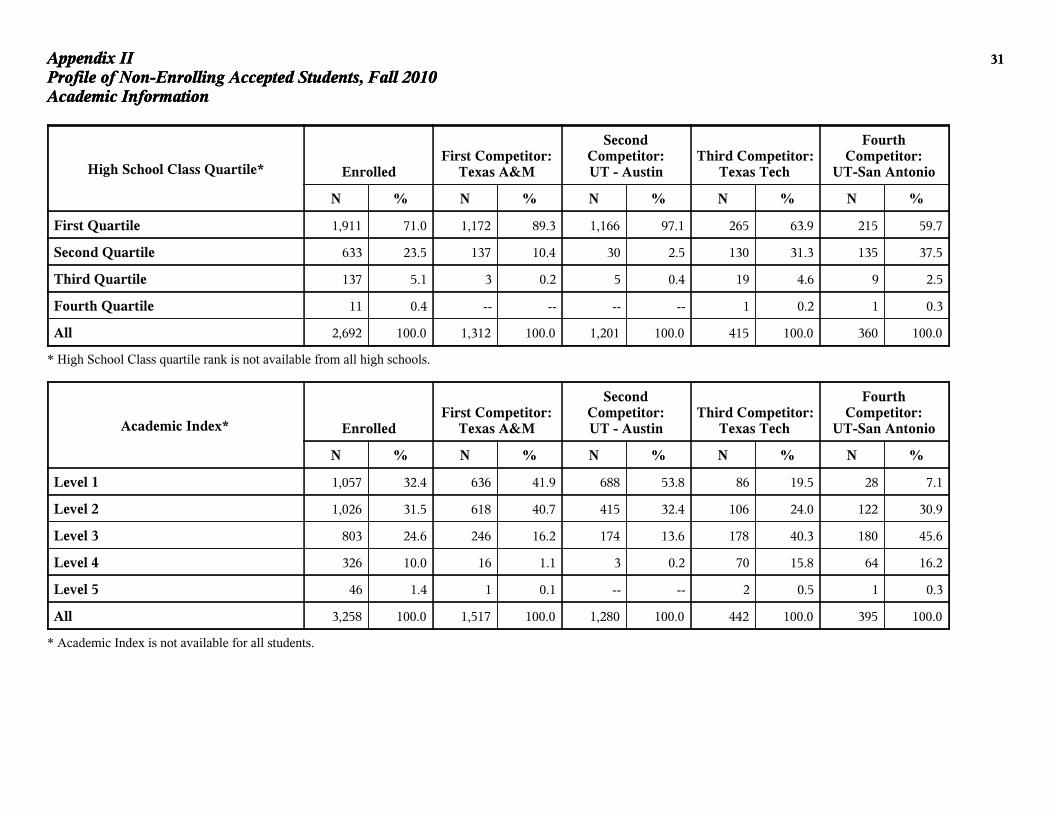
Table 6 provides a summary of academic information for Fall 2010 first-time freshmen who enrolled at Baylor compared to non-enrolling accepts who enrolled at the top four competitor institutions. See Appendix II for details. The average SAT score of students who enrolled at Baylor (1218) was higher than the average SAT score of students who were accepted at Baylor but enrolled in Texas Tech or UT-San Antonio. Only those accepted students who enrolled at Texas A&M (1244) and UT-Austin (1256) had a higher average SAT score. A larger percentage of students who were accepted but enrolled in Texas A&M (89.3%) and UT-Austin (97.1%) were in the first quartile of their high school than those students enrolled at Baylor (71.0%). However, the percentage of students that enrolled at Baylor who were in the first quartile of their high school was higher than those accepted at Baylor but enrolled in Texas Tech and UT-San Antonio.
Table 6. Summary of Academic Information by Competitor, Fall 2010 First-Time Freshmen
Enrolled at
Baylor Texas A&M University UT-Austin
Texas Tech University
UT – San Antonio
Average SAT 1218 1244 1256 1175 1150 Average ACT 26.4 27.3 27.1 25.1 24.2 First High School Quartile
71.0% 89.3% 97.1% 63.9% 59.7%
Level I Academic Index
32.4% 41.9% 53.8% 19.5% 7.1%
Appendix I 5
Profile of Non-Enrolling Accepted Students, Fall 2010Demographic Information
Appendix I 5
Profile of Non-Enrolling Accepted Students, Fall 2010Demographic Information
Gender Enrolled
Accepted,Did Not Enroll at
Baylor
Accepted,Enrolled at 4-Year
Private
Accepted,Enrolled at 4-Year
Public
Accepted,Enrolled at 2-Year
School
N % N % N % N % N %
Male 1,344 41.2 5,520 42.3 1,202 39.4 3,241 43.1 276 39.4
Female 1,915 58.8 7,536 57.7 1,846 60.6 4,280 56.9 424 60.6
Not Specified -- -- 1 0.0 -- -- -- -- -- --
All 3,259 100.0 13,057 100.0 3,048 100.0 7,521 100.0 700 100.0
Minority Status Enrolled
Accepted,Did Not Enroll at
Baylor
Accepted,Enrolled at 4-Year
Private
Accepted,Enrolled at 4-Year
Public
Accepted,Enrolled at 2-Year
School
N % N % N % N % N %
Minority 1,187 36.4 5,545 42.5 1,171 38.4 3,268 43.5 256 36.6
Non-Minority 2,072 63.6 7,512 57.5 1,877 61.6 4,253 56.5 444 63.4
All 3,259 100.0 13,057 100.0 3,048 100.0 7,521 100.0 700 100.0
Citizenship Status Enrolled
Accepted,Did Not Enroll at
Baylor
Accepted,Enrolled at 4-Year
Private
Accepted,Enrolled at 4-Year
Public
Accepted,Enrolled at 2-Year
School
N % N % N % N % N %
U.S. Citizen 3,150 96.7 12,426 95.2 2,966 97.3 7,240 96.3 676 96.6
Resident Alien 57 1.7 94 0.7 16 0.5 66 0.9 5 0.7
Nonresident Alien 52 1.6 534 4.1 66 2.2 215 2.9 18 2.6
Unknown -- -- 3 0.0 -- -- -- -- 1 0.1
All 3,259 100.0 13,057 100.0 3,048 100.0 7,521 100.0 700 100.0
Appendix I 6
Profile of Non-Enrolling Accepted Students, Fall 2010Demographic Information
Racial/Ethnic Group Enrolled
Accepted,Did Not Enroll at
Baylor
Accepted,Enrolled at 4-Year
Private
Accepted,Enrolled at 4-Year
Public
Accepted,Enrolled at 2-Year
School
N % N % N % N % N %
African American/Black 264 8.1 1,088 8.3 258 8.5 627 8.3 32 4.6
Alaskan Native/American Indian 7 0.2 50 0.4 17 0.6 26 0.3 1 0.1
Asian 253 7.8 1,420 10.9 253 8.3 912 12.1 39 5.6
Hispanic 508 15.6 2,449 18.8 513 16.8 1,399 18.6 149 21.3
Pacific Islander -- -- 8 0.1 3 0.1 4 0.1 -- --
White 2,066 63.4 7,184 55.0 1,800 59.1 4,090 54.4 424 60.6
Multiracial 155 4.8 530 4.1 127 4.2 300 4.0 35 5.0
Not Specified/Unknown 6 0.2 328 2.5 77 2.5 163 2.2 20 2.9
All 3,259 100.0 13,057 100.0 3,048 100.0 7,521 100.0 700 100.0
First Generation College Student Enrolled
Accepted,Did Not Enroll at
Baylor
Accepted,Enrolled at 4-Year
Private
Accepted,Enrolled at 4-Year
Public
Accepted,Enrolled at 2-Year
School
N % N % N % N % N %
First Gen College Student 434 13.3 2,227 17.1 478 15.7 1,224 16.3 167 23.9
Not First Gen College Student 2,825 86.7 10,830 82.9 2,570 84.3 6,297 83.7 533 76.1
All 3,259 100.0 13,057 100.0 3,048 100.0 7,521 100.0 700 100.0
Appendix I 7
Profile of Non-Enrolling Accepted Students, Fall 2010Demographic Information
State of Permanent Address Enrolled
Accepted,Did Not Enroll at
Baylor
Accepted,Enrolled at 4-Year
Private
Accepted,Enrolled at 4-Year
Public
Accepted,Enrolled at 2-Year
School
N % N % N % N % N %
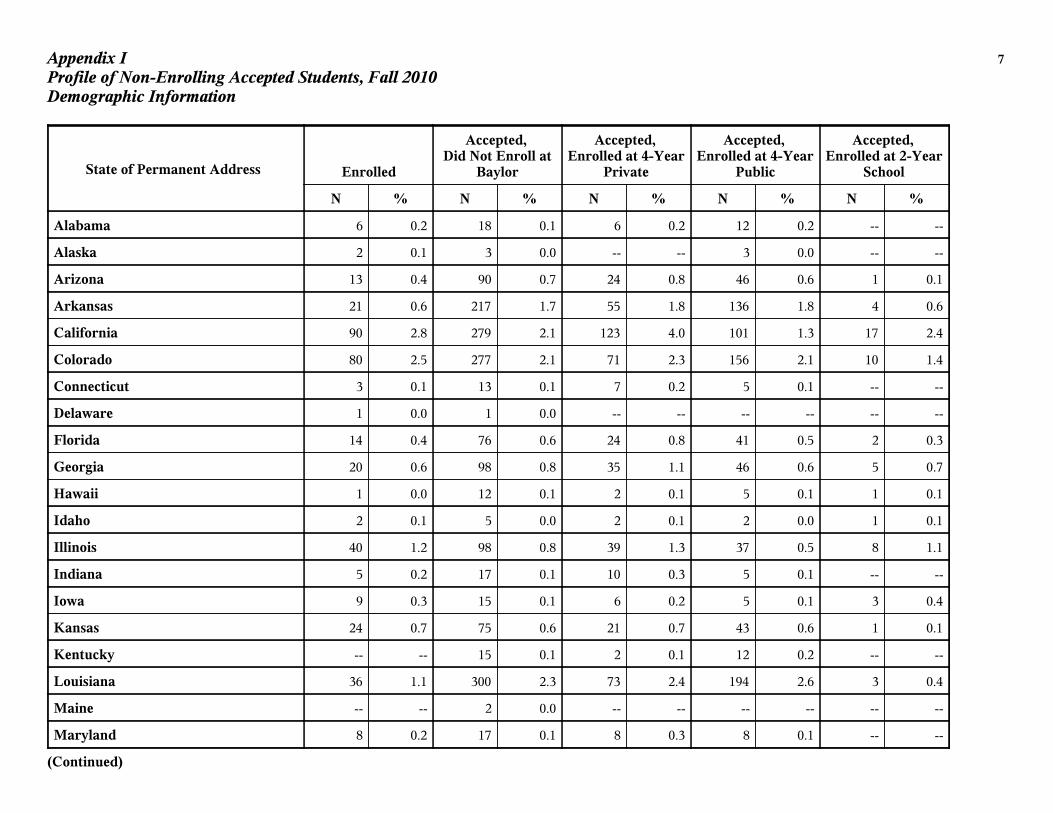
Alabama 6 0.2 18 0.1 6 0.2 12 0.2 -- --
Alaska 2 0.1 3 0.0 -- -- 3 0.0 -- --
Arizona 13 0.4 90 0.7 24 0.8 46 0.6 1 0.1
Arkansas 21 0.6 217 1.7 55 1.8 136 1.8 4 0.6
California 90 2.8 279 2.1 123 4.0 101 1.3 17 2.4
Colorado 80 2.5 277 2.1 71 2.3 156 2.1 10 1.4
Connecticut 3 0.1 13 0.1 7 0.2 5 0.1 -- --
Delaware 1 0.0 1 0.0 -- -- -- -- -- --
Florida 14 0.4 76 0.6 24 0.8 41 0.5 2 0.3
Georgia 20 0.6 98 0.8 35 1.1 46 0.6 5 0.7
Hawaii 1 0.0 12 0.1 2 0.1 5 0.1 1 0.1
Idaho 2 0.1 5 0.0 2 0.1 2 0.0 1 0.1
Illinois 40 1.2 98 0.8 39 1.3 37 0.5 8 1.1
Indiana 5 0.2 17 0.1 10 0.3 5 0.1 -- --
Iowa 9 0.3 15 0.1 6 0.2 5 0.1 3 0.4
Kansas 24 0.7 75 0.6 21 0.7 43 0.6 1 0.1
Kentucky -- -- 15 0.1 2 0.1 12 0.2 -- --
Louisiana 36 1.1 300 2.3 73 2.4 194 2.6 3 0.4
Maine -- -- 2 0.0 -- -- -- -- -- --
Maryland 8 0.2 17 0.1 8 0.3 8 0.1 -- --
(Continued)
Appendix I 8
Profile of Non-Enrolling Accepted Students, Fall 2010Demographic Information
State of Permanent Address Enrolled
Accepted,Did Not Enroll at
Baylor
Accepted,Enrolled at 4-Year
Private
Accepted,Enrolled at 4-Year
Public
Accepted,Enrolled at 2-Year
School
N % N % N % N % N %
Massachusetts 5 0.2 19 0.1 11 0.4 8 0.1 -- --
Michigan 6 0.2 25 0.2 8 0.3 13 0.2 2 0.3
Minnesota 24 0.7 30 0.2 17 0.6 7 0.1 -- --
Mississippi 5 0.2 27 0.2 10 0.3 14 0.2 2 0.3
Missouri 32 1.0 88 0.7 30 1.0 49 0.7 1 0.1
Montana 1 0.0 2 0.0 -- -- 1 0.0 -- --
Nebraska 6 0.2 25 0.2 7 0.2 17 0.2 -- --
Nevada 7 0.2 9 0.1 2 0.1 5 0.1 -- --
New Hampshire 4 0.1 4 0.0 2 0.1 -- -- -- --
New Jersey 8 0.2 14 0.1 6 0.2 7 0.1 -- --
New Mexico 12 0.4 45 0.3 10 0.3 27 0.4 3 0.4
New York 4 0.1 19 0.1 9 0.3 5 0.1 1 0.1
North Carolina 10 0.3 30 0.2 9 0.3 16 0.2 -- --
North Dakota 1 0.0 2 0.0 1 0.0 1 0.0 -- --
Ohio 16 0.5 40 0.3 15 0.5 19 0.3 2 0.3
Oklahoma 46 1.4 245 1.9 60 2.0 97 1.3 13 1.9
Oregon 9 0.3 19 0.1 6 0.2 7 0.1 -- --
Pennsylvania 6 0.2 17 0.1 7 0.2 7 0.1 1 0.1
Rhode Island -- -- 3 0.0 2 0.1 1 0.0 -- --
South Carolina -- -- 11 0.1 4 0.1 5 0.1 1 0.1
(Continued)
Appendix I 9
Profile of Non-Enrolling Accepted Students, Fall 2010Demographic Information
State of Permanent Address Enrolled
Accepted,Did Not Enroll at
Baylor
Accepted,Enrolled at 4-Year
Private
Accepted,Enrolled at 4-Year
Public
Accepted,Enrolled at 2-Year
School
N % N % N % N % N %
South Dakota -- -- 5 0.0 3 0.1 1 0.0 -- --
Tennessee 24 0.7 142 1.1 51 1.7 84 1.1 2 0.3
Texas 2,553 78.3 9,894 75.8 2,135 70.0 5,979 79.5 594 84.9
Utah 2 0.1 5 0.0 -- -- 3 0.0 -- --
Virginia 17 0.5 41 0.3 20 0.7 19 0.3 -- --
Washington 16 0.5 35 0.3 16 0.5 12 0.2 1 0.1
West Virginia 1 0.0 4 0.0 1 0.0 3 0.0 -- --
Wisconsin 5 0.2 6 0.0 2 0.1 3 0.0 -- --
Wyoming 1 0.0 -- -- -- -- -- -- -- --
US Terr./Military Addresses 7 0.2 10 0.1 2 0.1 7 0.1 -- --
Non-US Addresses 52 1.6 534 4.1 66 2.2 215 2.9 18 2.6
Unknown Addresses 4 0.1 79 0.6 28 0.9 32 0.4 3 0.4
All 3,259 100.0 13,057 100.0 3,048 100.0 7,521 100.0 700 100.0
Appendix I 10
Profile of Non-Enrolling Accepted Students, Fall 2010Demographic Information
Appendix I 10
Profile of Non-Enrolling Accepted Students, Fall 2010Demographic Information
Religious Affiliation Enrolled
Accepted,Did Not Enroll at
Baylor
Accepted,Enrolled at 4-Year
Private
Accepted,Enrolled at 4-Year
Public
Accepted,Enrolled at 2-Year
School
N % N % N % N % N %
African Methodist Episcopal 3 0.1 8 0.1 1 0.0 6 0.1 -- --
Anglican - Church of England 8 0.2 12 0.1 4 0.1 8 0.1 -- --
Assembly of God 39 1.2 120 0.9 32 1.0 57 0.8 10 1.4
Atheist 7 0.2 46 0.4 9 0.3 28 0.4 -- --
Baptist 1,064 32.6 3,059 23.4 701 23.0 1,752 23.3 200 28.6
Buddhist 26 0.8 109 0.8 13 0.4 76 1.0 2 0.3
Catholic 520 16.0 3,171 24.3 672 22.0 1,904 25.3 146 20.9
Christian Church 130 4.0 596 4.6 119 3.9 337 4.5 44 6.3
Christian Scientist -- -- 8 0.1 2 0.1 5 0.1 -- --
Church of Christ 53 1.6 297 2.3 67 2.2 153 2.0 30 4.3
Church of God 2 0.1 36 0.3 11 0.4 17 0.2 1 0.1
Church of the Nazarene 6 0.2 23 0.2 8 0.3 9 0.1 1 0.1
Congregational Church 3 0.1 4 0.0 -- -- 3 0.0 1 0.1
Disciples of Christ(Christian) 19 0.6 88 0.7 30 1.0 40 0.5 4 0.6
Dutch Reformed 1 0.0 9 0.1 5 0.2 3 0.0 -- --
Eastern Orthodox 7 0.2 51 0.4 13 0.4 32 0.4 2 0.3
Episcopalian 42 1.3 214 1.6 62 2.0 127 1.7 8 1.1
Evangelical Free Church 34 1.0 57 0.4 21 0.7 26 0.3 3 0.4
Four Square Gospel 4 0.1 4 0.0 1 0.0 2 0.0 -- --
Full Gospel 5 0.2 9 0.1 3 0.1 5 0.1 -- --
(Continued)
Appendix I 11
Profile of Non-Enrolling Accepted Students, Fall 2010Demographic Information
Religious Affiliation Enrolled
Accepted,Did Not Enroll at
Baylor
Accepted,Enrolled at 4-Year
Private
Accepted,Enrolled at 4-Year
Public
Accepted,Enrolled at 2-Year
School
N % N % N % N % N %
Greek Orthodox 1 0.0 5 0.0 1 0.0 2 0.0 -- --
Hindu 30 0.9 168 1.3 34 1.1 105 1.4 1 0.1
Independent Bible Church 12 0.4 22 0.2 11 0.4 8 0.1 -- --
Islam 32 1.0 137 1.0 35 1.1 79 1.1 9 1.3
Interdenominational 5 0.2 10 0.1 4 0.1 5 0.1 -- --
Jehovah's Witness 1 0.0 17 0.1 3 0.1 8 0.1 1 0.1
Jewish 1 0.0 17 0.1 3 0.1 12 0.2 -- --
Latter Day Saints (Mormon) 4 0.1 40 0.3 16 0.5 11 0.1 1 0.1
Lutheran 103 3.2 353 2.7 100 3.3 214 2.8 9 1.3
Mennonite 1 0.0 6 0.0 4 0.1 2 0.0 -- --
Methodist 261 8.0 1,115 8.5 248 8.1 691 9.2 43 6.1
Missionary Alliance 4 0.1 8 0.1 -- -- 7 0.1 -- --
Non-Denominational 435 13.3 1,215 9.3 370 12.1 605 8.0 75 10.7
Pentecostal 30 0.9 111 0.9 24 0.8 56 0.7 8 1.1
Presbyterian 134 4.1 470 3.6 141 4.6 242 3.2 19 2.7
Protestant 53 1.6 142 1.1 43 1.4 71 0.9 5 0.7
Seventh Day Adventist 5 0.2 24 0.2 9 0.3 11 0.1 1 0.1
Society of Friends (Quakers) -- -- 4 0.0 3 0.1 1 0.0 -- --
Unitarian 1 0.0 3 0.0 -- -- 3 0.0 -- --
United Brethren -- -- 2 0.0 -- -- 2 0.0 -- --
(Continued)
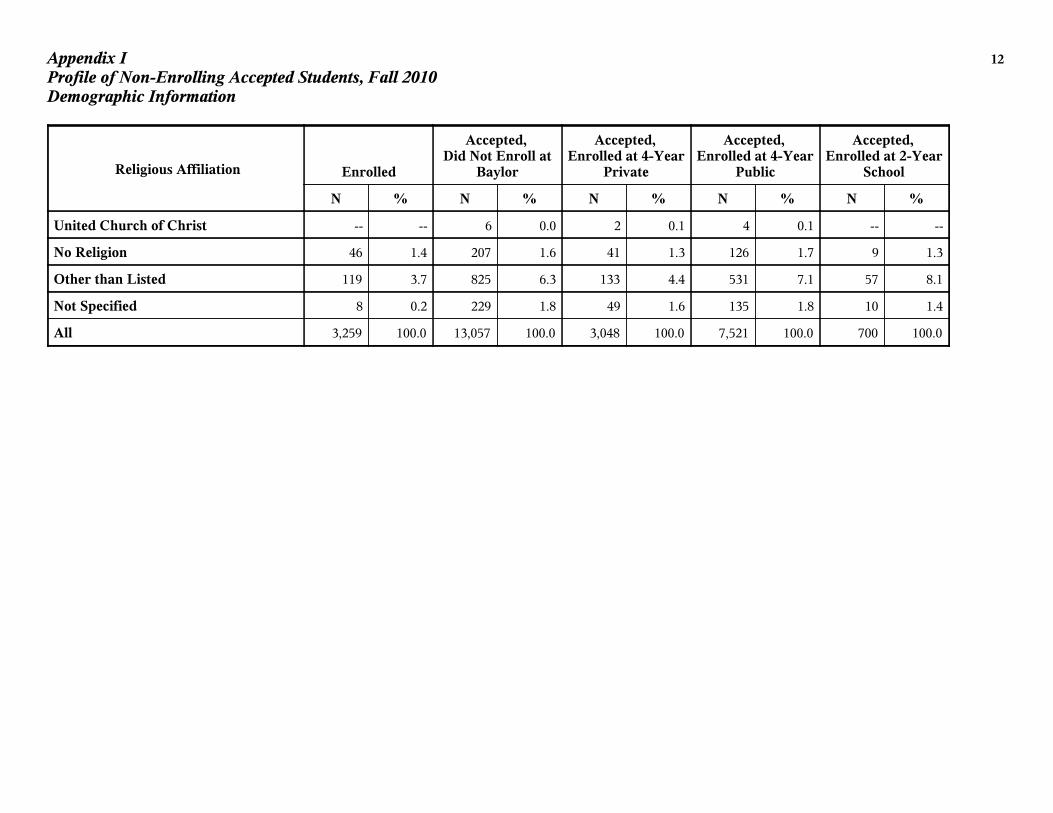
Appendix I 12
Profile of Non-Enrolling Accepted Students, Fall 2010Demographic Information
Religious Affiliation Enrolled
Accepted,Did Not Enroll at
Baylor
Accepted,Enrolled at 4-Year
Private
Accepted,Enrolled at 4-Year
Public
Accepted,Enrolled at 2-Year
School
N % N % N % N % N %
United Church of Christ -- -- 6 0.0 2 0.1 4 0.1 -- --
No Religion 46 1.4 207 1.6 41 1.3 126 1.7 9 1.3
Other than Listed 119 3.7 825 6.3 133 4.4 531 7.1 57 8.1
Not Specified 8 0.2 229 1.8 49 1.6 135 1.8 10 1.4
All 3,259 100.0 13,057 100.0 3,048 100.0 7,521 100.0 700 100.0
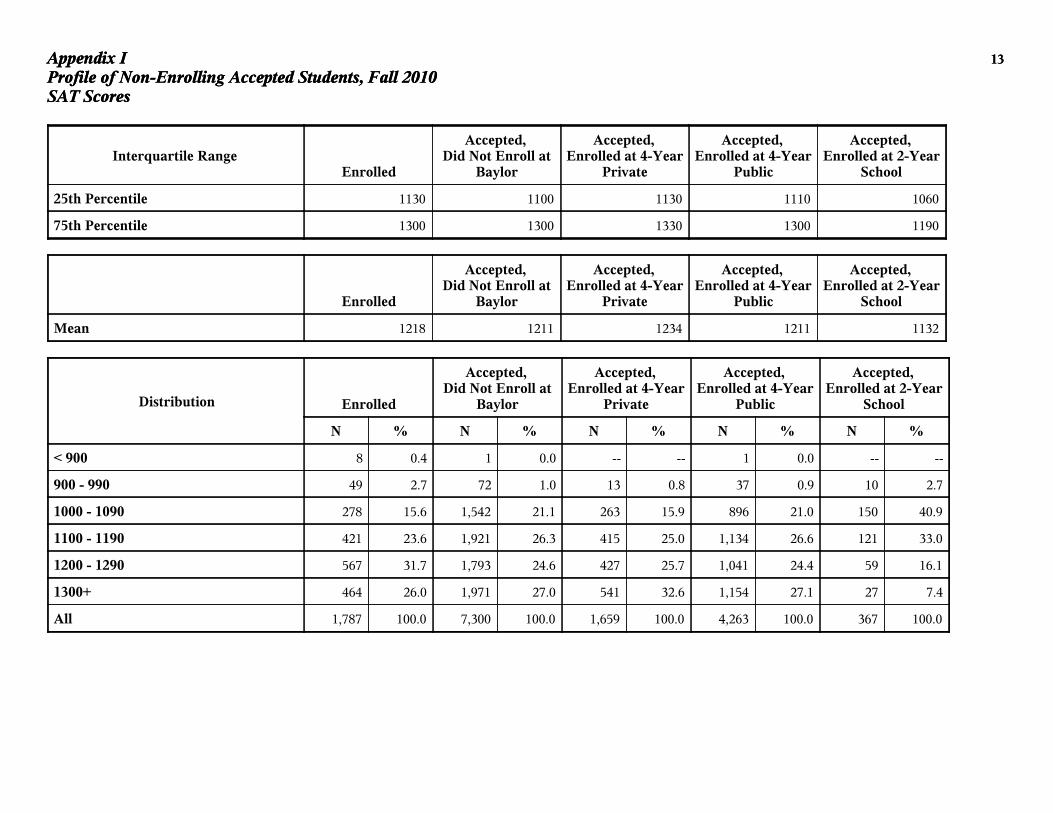
Appendix I 13
Profile of Non-Enrolling Accepted Students, Fall 2010SAT Scores
Appendix I 13
Profile of Non-Enrolling Accepted Students, Fall 2010SAT Scores
Interquartile RangeEnrolled
Accepted,Did Not Enroll at
Baylor
Accepted,Enrolled at 4-Year
Private
Accepted,Enrolled at 4-Year
Public
Accepted,Enrolled at 2-Year
School
25th Percentile 1130 1100 1130 1110 1060
75th Percentile 1300 1300 1330 1300 1190
Enrolled
Accepted,Did Not Enroll at
Baylor
Accepted,Enrolled at 4-Year
Private
Accepted,Enrolled at 4-Year
Public
Accepted,Enrolled at 2-Year
School
Mean 1218 1211 1234 1211 1132
Distribution Enrolled
Accepted,Did Not Enroll at
Baylor
Accepted,Enrolled at 4-Year
Private
Accepted,Enrolled at 4-Year
Public
Accepted,Enrolled at 2-Year
School
N % N % N % N % N %
< 900 8 0.4 1 0.0 -- -- 1 0.0 -- --
900 - 990 49 2.7 72 1.0 13 0.8 37 0.9 10 2.7
1000 - 1090 278 15.6 1,542 21.1 263 15.9 896 21.0 150 40.9
1100 - 1190 421 23.6 1,921 26.3 415 25.0 1,134 26.6 121 33.0
1200 - 1290 567 31.7 1,793 24.6 427 25.7 1,041 24.4 59 16.1
1300+ 464 26.0 1,971 27.0 541 32.6 1,154 27.1 27 7.4
All 1,787 100.0 7,300 100.0 1,659 100.0 4,263 100.0 367 100.0
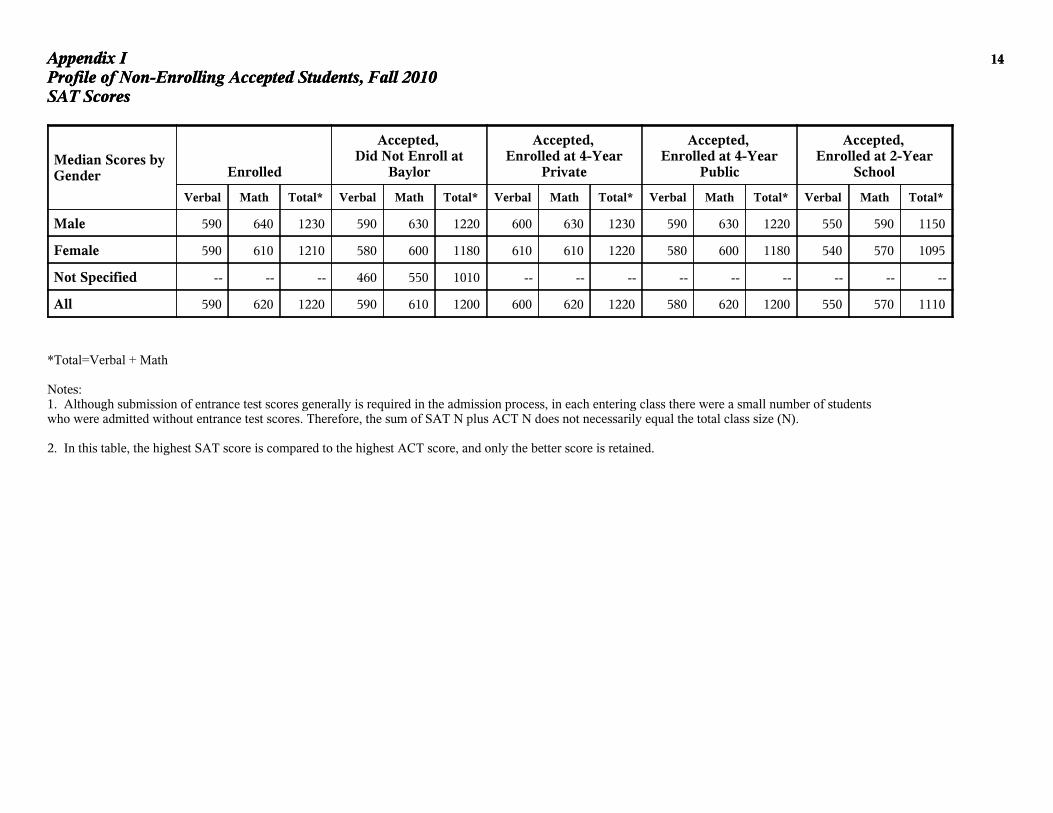
Appendix I 14
Profile of Non-Enrolling Accepted Students, Fall 2010SAT Scores
Appendix I 14
Profile of Non-Enrolling Accepted Students, Fall 2010SAT Scores
Median Scores byGender Enrolled
Accepted,Did Not Enroll at
Baylor
Accepted,Enrolled at 4-Year
Private
Accepted,Enrolled at 4-Year
Public
Accepted,Enrolled at 2-Year
School
Verbal Math Total* Verbal Math Total* Verbal Math Total* Verbal Math Total* Verbal Math Total*
Male 590 640 1230 590 630 1220 600 630 1230 590 630 1220 550 590 1150
Female 590 610 1210 580 600 1180 610 610 1220 580 600 1180 540 570 1095
Not Specified -- -- -- 460 550 1010 -- -- -- -- -- -- -- -- --
All 590 620 1220 590 610 1200 600 620 1220 580 620 1200 550 570 1110
*Total=Verbal + Math
Notes:1. Although submission of entrance test scores generally is required in the admission process, in each entering class there were a small number of studentswho were admitted without entrance test scores. Therefore, the sum of SAT N plus ACT N does not necessarily equal the total class size (N).
2. In this table, the highest SAT score is compared to the highest ACT score, and only the better score is retained.
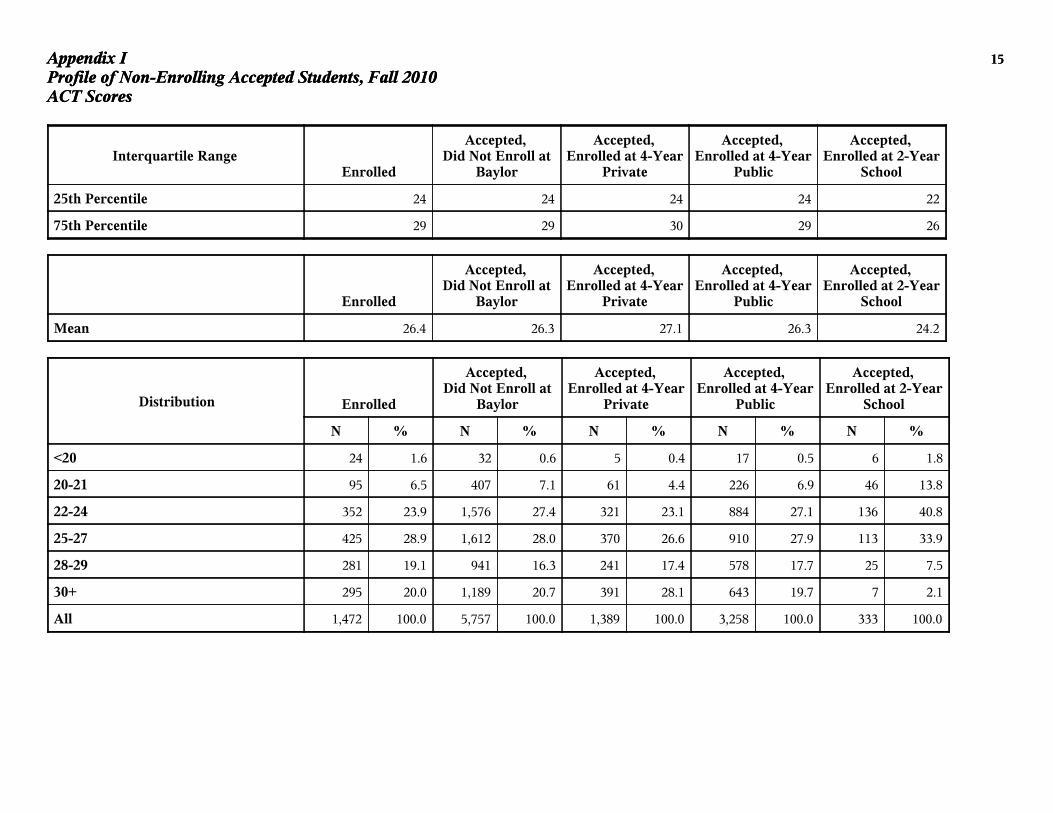
Appendix I 15
Profile of Non-Enrolling Accepted Students, Fall 2010ACT Scores
Appendix I 15
Profile of Non-Enrolling Accepted Students, Fall 2010ACT Scores
Interquartile RangeEnrolled
Accepted,Did Not Enroll at
Baylor
Accepted,Enrolled at 4-Year
Private
Accepted,Enrolled at 4-Year
Public
Accepted,Enrolled at 2-Year
School
25th Percentile 24 24 24 24 22
75th Percentile 29 29 30 29 26
Enrolled
Accepted,Did Not Enroll at
Baylor
Accepted,Enrolled at 4-Year
Private
Accepted,Enrolled at 4-Year
Public
Accepted,Enrolled at 2-Year
School
Mean 26.4 26.3 27.1 26.3 24.2
Distribution Enrolled
Accepted,Did Not Enroll at
Baylor
Accepted,Enrolled at 4-Year
Private
Accepted,Enrolled at 4-Year
Public
Accepted,Enrolled at 2-Year
School
N % N % N % N % N %
<20 24 1.6 32 0.6 5 0.4 17 0.5 6 1.8
20-21 95 6.5 407 7.1 61 4.4 226 6.9 46 13.8
22-24 352 23.9 1,576 27.4 321 23.1 884 27.1 136 40.8
25-27 425 28.9 1,612 28.0 370 26.6 910 27.9 113 33.9
28-29 281 19.1 941 16.3 241 17.4 578 17.7 25 7.5
30+ 295 20.0 1,189 20.7 391 28.1 643 19.7 7 2.1
All 1,472 100.0 5,757 100.0 1,389 100.0 3,258 100.0 333 100.0
Appendix I 16
Profile of Non-Enrolling Accepted Students, Fall 2010ACT Scores
Appendix I 16
Profile of Non-Enrolling Accepted Students, Fall 2010ACT Scores
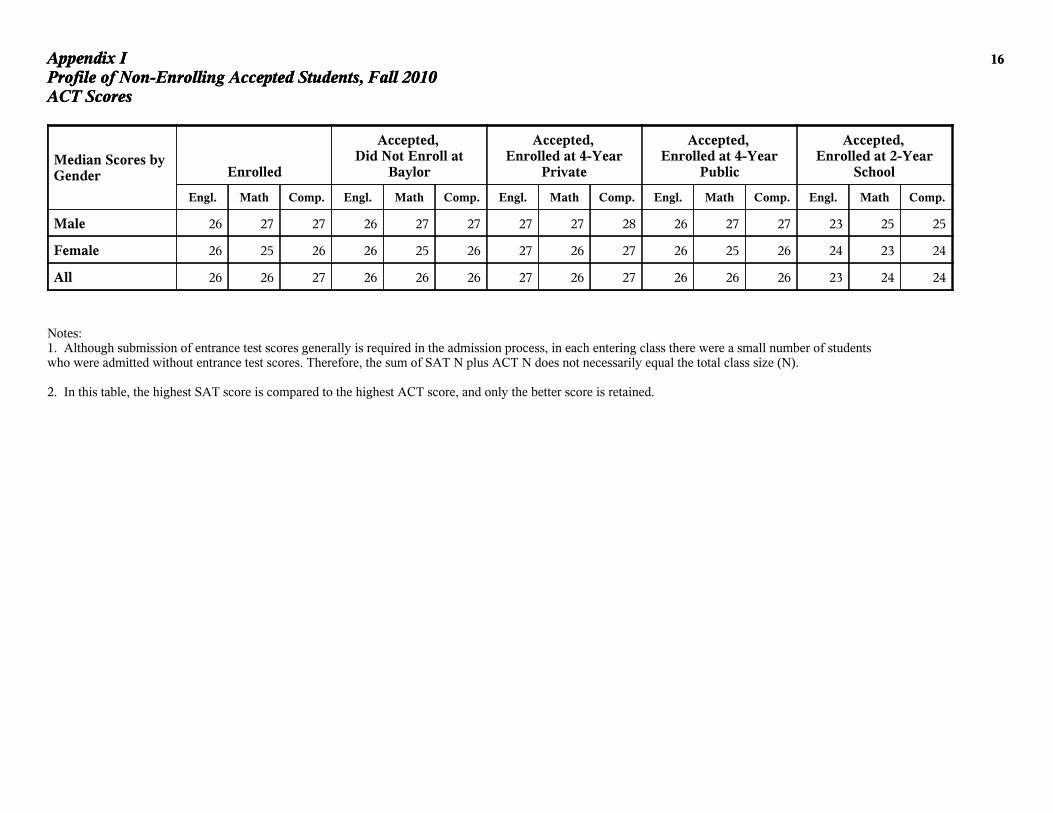
Median Scores byGender Enrolled
Accepted,Did Not Enroll at
Baylor
Accepted,Enrolled at 4-Year
Private
Accepted,Enrolled at 4-Year
Public
Accepted,Enrolled at 2-Year
School
Engl. Math Comp. Engl. Math Comp. Engl. Math Comp. Engl. Math Comp. Engl. Math Comp.
Male 26 27 27 26 27 27 27 27 28 26 27 27 23 25 25
Female 26 25 26 26 25 26 27 26 27 26 25 26 24 23 24
All 26 26 27 26 26 26 27 26 27 26 26 26 23 24 24
Notes:1. Although submission of entrance test scores generally is required in the admission process, in each entering class there were a small number of studentswho were admitted without entrance test scores. Therefore, the sum of SAT N plus ACT N does not necessarily equal the total class size (N).
2. In this table, the highest SAT score is compared to the highest ACT score, and only the better score is retained.
Appendix I 17
Profile of Non-Enrolling Accepted Students, Fall 2010Academic Information
Appendix I 17
Profile of Non-Enrolling Accepted Students, Fall 2010Academic Information
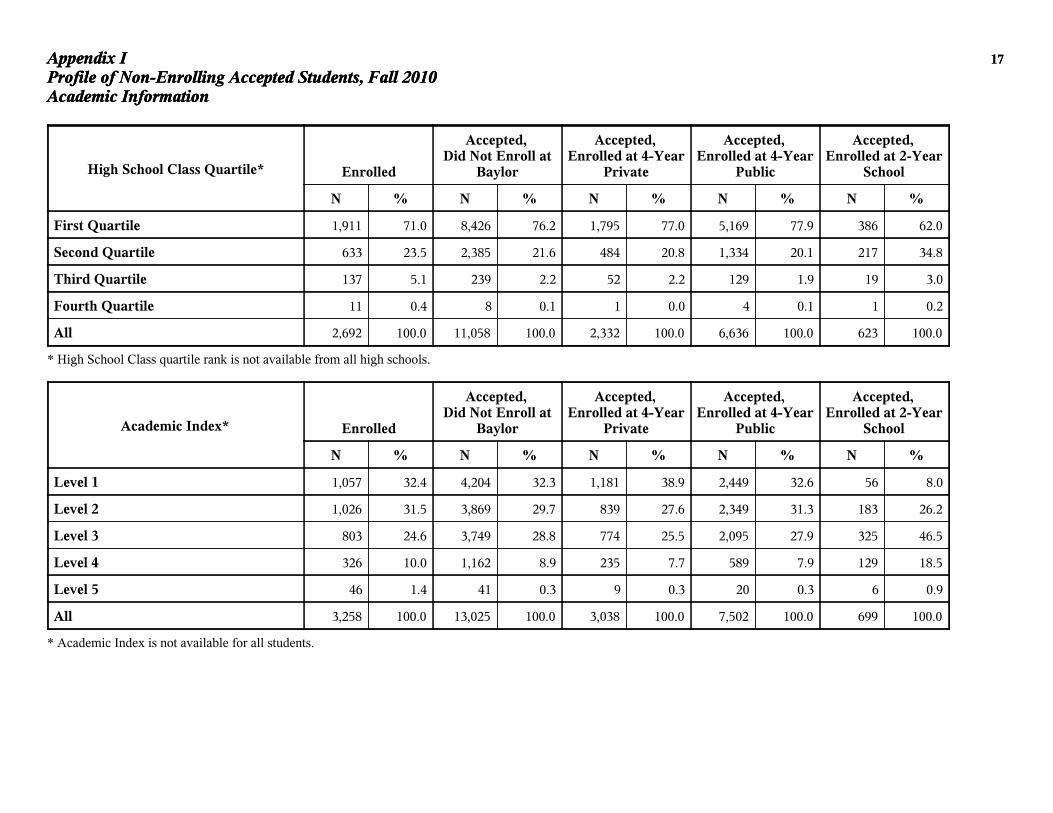
High School Class Quartile* Enrolled
Accepted,Did Not Enroll at
Baylor
Accepted,Enrolled at 4-Year
Private
Accepted,Enrolled at 4-Year
Public
Accepted,Enrolled at 2-Year
School
N % N % N % N % N %
First Quartile 1,911 71.0 8,426 76.2 1,795 77.0 5,169 77.9 386 62.0
Second Quartile 633 23.5 2,385 21.6 484 20.8 1,334 20.1 217 34.8
Third Quartile 137 5.1 239 2.2 52 2.2 129 1.9 19 3.0
Fourth Quartile 11 0.4 8 0.1 1 0.0 4 0.1 1 0.2
All 2,692 100.0 11,058 100.0 2,332 100.0 6,636 100.0 623 100.0
* High School Class quartile rank is not available from all high schools.
Academic Index* Enrolled
Accepted,Did Not Enroll at
Baylor
Accepted,Enrolled at 4-Year
Private
Accepted,Enrolled at 4-Year
Public
Accepted,Enrolled at 2-Year
School
N % N % N % N % N %
Level 1 1,057 32.4 4,204 32.3 1,181 38.9 2,449 32.6 56 8.0
Level 2 1,026 31.5 3,869 29.7 839 27.6 2,349 31.3 183 26.2
Level 3 803 24.6 3,749 28.8 774 25.5 2,095 27.9 325 46.5
Level 4 326 10.0 1,162 8.9 235 7.7 589 7.9 129 18.5
Level 5 46 1.4 41 0.3 9 0.3 20 0.3 6 0.9
All 3,258 100.0 13,025 100.0 3,038 100.0 7,502 100.0 699 100.0
* Academic Index is not available for all students.
Appendix I 18
Profile of Non-Enrolling Accepted Students, Fall 2010Academic Information
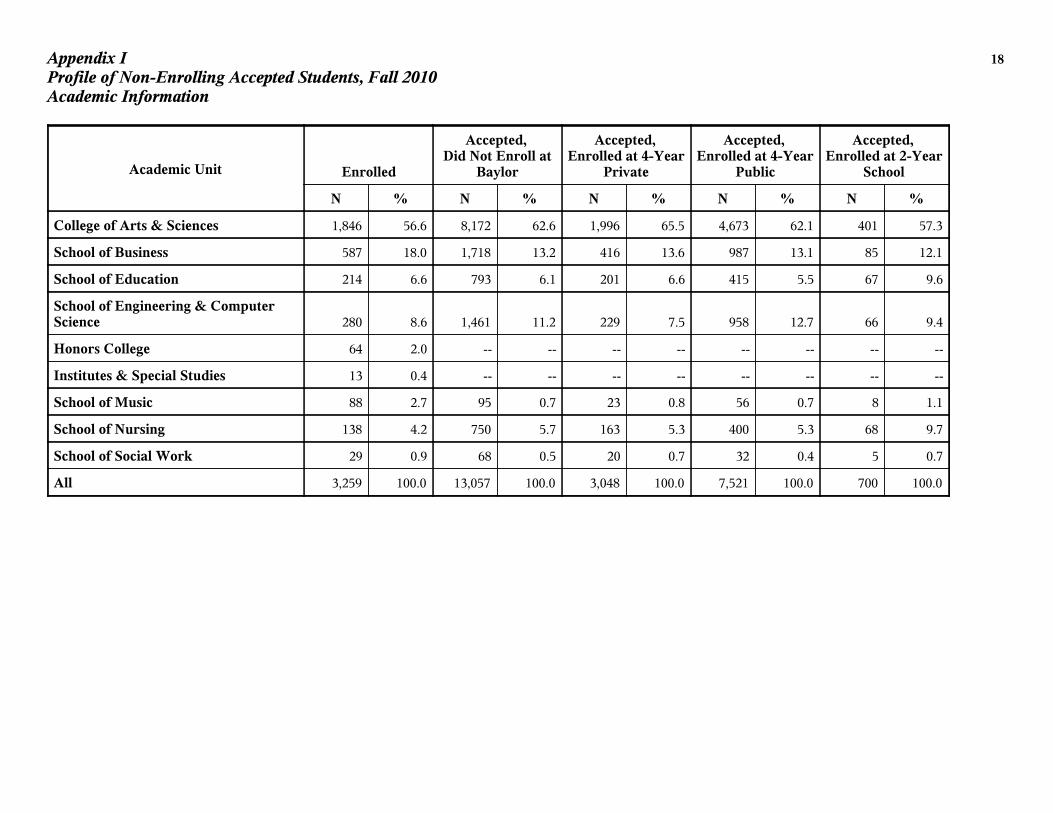
Academic Unit Enrolled
Accepted,Did Not Enroll at
Baylor
Accepted,Enrolled at 4-Year
Private
Accepted,Enrolled at 4-Year
Public
Accepted,Enrolled at 2-Year
School
N % N % N % N % N %
College of Arts & Sciences 1,846 56.6 8,172 62.6 1,996 65.5 4,673 62.1 401 57.3
School of Business 587 18.0 1,718 13.2 416 13.6 987 13.1 85 12.1
School of Education 214 6.6 793 6.1 201 6.6 415 5.5 67 9.6
School of Engineering & ComputerScience 280 8.6 1,461 11.2 229 7.5 958 12.7 66 9.4
Honors College 64 2.0 -- -- -- -- -- -- -- --
Institutes & Special Studies 13 0.4 -- -- -- -- -- -- -- --
School of Music 88 2.7 95 0.7 23 0.8 56 0.7 8 1.1
School of Nursing 138 4.2 750 5.7 163 5.3 400 5.3 68 9.7
School of Social Work 29 0.9 68 0.5 20 0.7 32 0.4 5 0.7
All 3,259 100.0 13,057 100.0 3,048 100.0 7,521 100.0 700 100.0
Appendix II 19
Profile of Non-Enrolling Accepted Students, Fall 2010Demographic Information
Appendix II 19
Profile of Non-Enrolling Accepted Students, Fall 2010Demographic Information
Gender EnrolledFirst Competitor:
Texas A&M
SecondCompetitor:UT - Austin
Third Competitor:Texas Tech
FourthCompetitor:
UT-San Antonio
N % N % N % N % N %
Male 1,344 41.2 674 44.4 528 41.3 241 54.5 181 45.8
Female 1,915 58.8 843 55.6 752 58.8 201 45.5 214 54.2
All 3,259 100.0 1,517 100.0 1,280 100.0 442 100.0 395 100.0
Minority Status EnrolledFirst Competitor:
Texas A&M
SecondCompetitor:UT - Austin
Third Competitor:Texas Tech
FourthCompetitor:
UT-San Antonio
N % N % N % N % N %
Minority 1,187 36.4 490 32.3 700 54.7 141 31.9 257 65.1
Non-Minority 2,072 63.6 1,027 67.7 580 45.3 301 68.1 138 34.9
All 3,259 100.0 1,517 100.0 1,280 100.0 442 100.0 395 100.0
Citizenship Status EnrolledFirst Competitor:
Texas A&M
SecondCompetitor:UT - Austin
Third Competitor:Texas Tech
FourthCompetitor:
UT-San Antonio
N % N % N % N % N %
U.S. Citizen 3,150 96.7 1,480 97.6 1,206 94.2 433 98.0 375 94.9
Resident Alien 57 1.7 9 0.6 11 0.9 4 0.9 10 2.5
Nonresident Alien 52 1.6 28 1.8 63 4.9 5 1.1 10 2.5
All 3,259 100.0 1,517 100.0 1,280 100.0 442 100.0 395 100.0
Appendix II 20
Profile of Non-Enrolling Accepted Students, Fall 2010Demographic Information
Racial/Ethnic Group EnrolledFirst Competitor:
Texas A&M
SecondCompetitor:UT - Austin
Third Competitor:Texas Tech
FourthCompetitor:
UT-San Antonio
N % N % N % N % N %
African American/Black 264 8.1 49 3.2 75 5.9 25 5.7 41 10.4
Alaskan Native/American Indian 7 0.2 4 0.3 2 0.2 1 0.2 3 0.8
Asian 253 7.8 119 7.8 295 23.0 22 5.0 56 14.2
Hispanic 508 15.6 260 17.1 289 22.6 78 17.6 140 35.4
White 2,066 63.4 1,008 66.4 548 42.8 294 66.5 128 32.4
Multiracial 155 4.8 58 3.8 39 3.0 15 3.4 17 4.3
Not Specified/Unknown 6 0.2 19 1.3 32 2.5 7 1.6 10 2.5
All 3,259 100.0 1,517 100.0 1,280 100.0 442 100.0 395 100.0
First Generation College Student EnrolledFirst Competitor:
Texas A&M
SecondCompetitor:UT - Austin
Third Competitor:Texas Tech
FourthCompetitor:
UT-San Antonio
N % N % N % N % N %
First Gen College Student 434 13.3 226 14.9 216 16.9 68 15.4 64 16.2
Not First Gen College Student 2,825 86.7 1,291 85.1 1,064 83.1 374 84.6 331 83.8
All 3,259 100.0 1,517 100.0 1,280 100.0 442 100.0 395 100.0
Appendix II 21
Profile of Non-Enrolling Accepted Students, Fall 2010Demographic Information
State of Permanent Address EnrolledFirst Competitor:
Texas A&M
SecondCompetitor:UT - Austin
Third Competitor:Texas Tech
FourthCompetitor:
UT-San Antonio
N % N % N % N % N %
Alabama 6 0.2 -- -- -- -- -- -- -- --
Alaska 2 0.1 1 0.1 -- -- -- -- -- --
Arizona 13 0.4 -- -- -- -- 1 0.2 -- --
Arkansas 21 0.6 -- -- -- -- -- -- -- --
California 90 2.8 2 0.1 4 0.3 1 0.2 -- --
Colorado 80 2.5 4 0.3 1 0.1 3 0.7 -- --
Connecticut 3 0.1 1 0.1 1 0.1 -- -- -- --
Delaware 1 0.0 -- -- -- -- -- -- -- --
Florida 14 0.4 -- -- -- -- -- -- -- --
Georgia 20 0.6 1 0.1 -- -- -- -- -- --
Hawaii 1 0.0 1 0.1 -- -- -- -- -- --
Idaho 2 0.1 -- -- -- -- -- -- -- --
Illinois 40 1.2 1 0.1 3 0.2 -- -- -- --
Indiana 5 0.2 1 0.1 -- -- -- -- -- --
Iowa 9 0.3 -- -- -- -- -- -- -- --
Kansas 24 0.7 2 0.1 2 0.2 -- -- -- --
Kentucky -- -- -- -- 1 0.1 -- -- -- --
Louisiana 36 1.1 1 0.1 2 0.2 -- -- -- --
Maryland 8 0.2 -- -- 1 0.1 -- -- -- --
Massachusetts 5 0.2 -- -- -- -- -- -- -- --
(Continued)
Appendix II 22
Profile of Non-Enrolling Accepted Students, Fall 2010Demographic Information
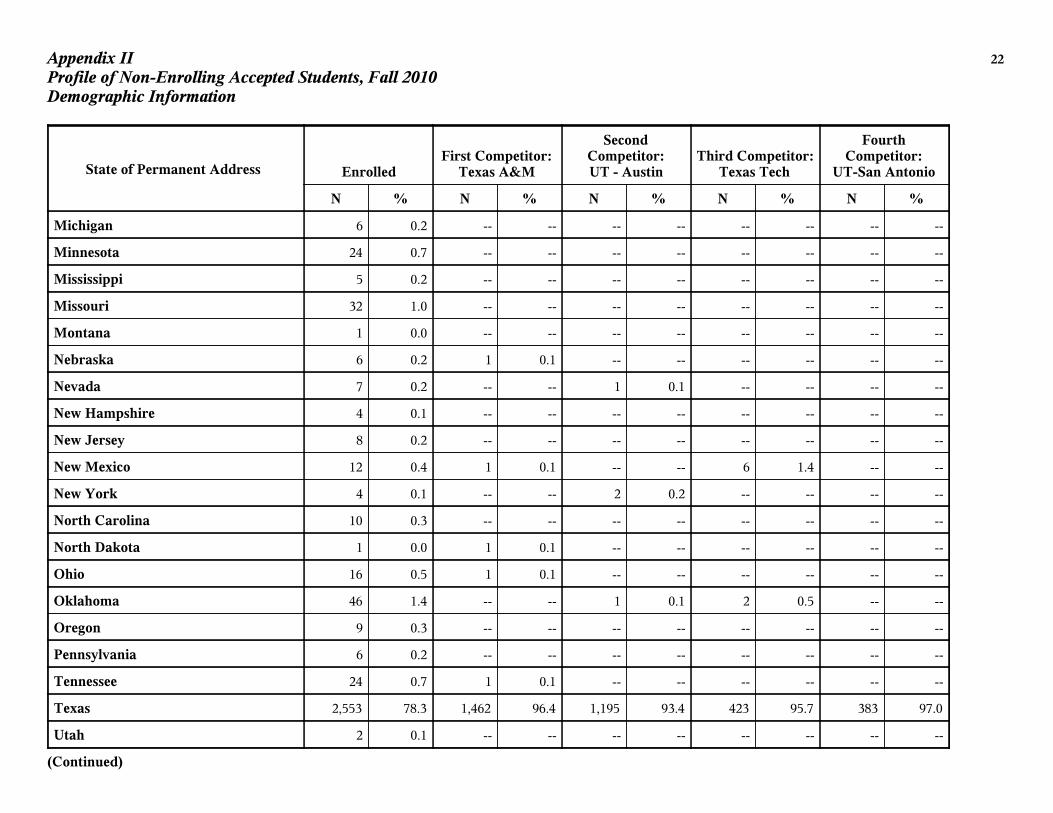
State of Permanent Address EnrolledFirst Competitor:
Texas A&M
SecondCompetitor:UT - Austin
Third Competitor:Texas Tech
FourthCompetitor:
UT-San Antonio
N % N % N % N % N %
Michigan 6 0.2 -- -- -- -- -- -- -- --
Minnesota 24 0.7 -- -- -- -- -- -- -- --
Mississippi 5 0.2 -- -- -- -- -- -- -- --
Missouri 32 1.0 -- -- -- -- -- -- -- --
Montana 1 0.0 -- -- -- -- -- -- -- --
Nebraska 6 0.2 1 0.1 -- -- -- -- -- --
Nevada 7 0.2 -- -- 1 0.1 -- -- -- --
New Hampshire 4 0.1 -- -- -- -- -- -- -- --
New Jersey 8 0.2 -- -- -- -- -- -- -- --
New Mexico 12 0.4 1 0.1 -- -- 6 1.4 -- --
New York 4 0.1 -- -- 2 0.2 -- -- -- --
North Carolina 10 0.3 -- -- -- -- -- -- -- --
North Dakota 1 0.0 1 0.1 -- -- -- -- -- --
Ohio 16 0.5 1 0.1 -- -- -- -- -- --
Oklahoma 46 1.4 -- -- 1 0.1 2 0.5 -- --
Oregon 9 0.3 -- -- -- -- -- -- -- --
Pennsylvania 6 0.2 -- -- -- -- -- -- -- --
Tennessee 24 0.7 1 0.1 -- -- -- -- -- --
Texas 2,553 78.3 1,462 96.4 1,195 93.4 423 95.7 383 97.0
Utah 2 0.1 -- -- -- -- -- -- -- --
(Continued)
Appendix II 23
Profile of Non-Enrolling Accepted Students, Fall 2010Demographic Information
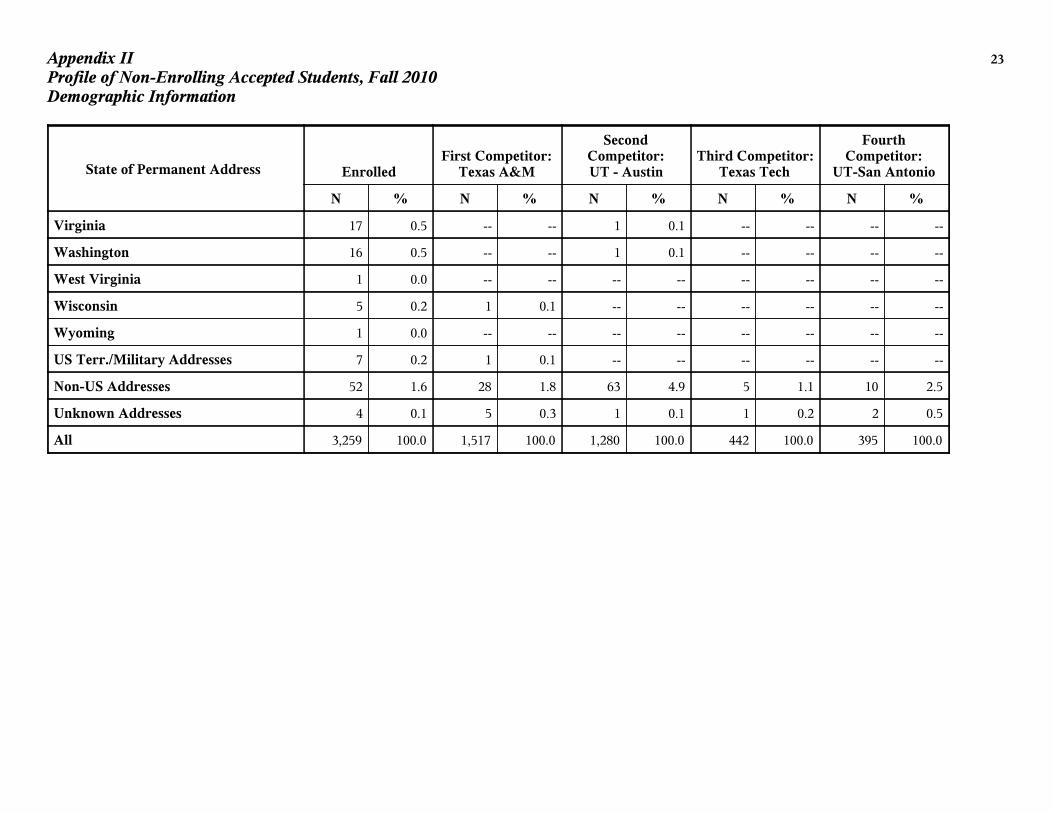
State of Permanent Address EnrolledFirst Competitor:
Texas A&M
SecondCompetitor:UT - Austin
Third Competitor:Texas Tech
FourthCompetitor:
UT-San Antonio
N % N % N % N % N %
Virginia 17 0.5 -- -- 1 0.1 -- -- -- --
Washington 16 0.5 -- -- 1 0.1 -- -- -- --
West Virginia 1 0.0 -- -- -- -- -- -- -- --
Wisconsin 5 0.2 1 0.1 -- -- -- -- -- --
Wyoming 1 0.0 -- -- -- -- -- -- -- --
US Terr./Military Addresses 7 0.2 1 0.1 -- -- -- -- -- --
Non-US Addresses 52 1.6 28 1.8 63 4.9 5 1.1 10 2.5
Unknown Addresses 4 0.1 5 0.3 1 0.1 1 0.2 2 0.5
All 3,259 100.0 1,517 100.0 1,280 100.0 442 100.0 395 100.0
Appendix II 24
Profile of Non-Enrolling Accepted Students, Fall 2010Demographic Information
Appendix II 24
Profile of Non-Enrolling Accepted Students, Fall 2010Demographic Information
Religious Affiliation EnrolledFirst Competitor:
Texas A&M
SecondCompetitor:UT - Austin
Third Competitor:Texas Tech
FourthCompetitor:
UT-San Antonio
N % N % N % N % N %
African Methodist Episcopal 3 0.1 1 0.1 -- -- -- -- 1 0.3
Anglican - Church of England 8 0.2 5 0.3 -- -- -- -- 1 0.3
Assembly of God 39 1.2 10 0.7 13 1.0 1 0.2 2 0.5
Atheist 7 0.2 2 0.1 8 0.6 -- -- 1 0.3
Baptist 1,064 32.6 383 25.2 218 17.0 128 29.0 56 14.2
Buddhist 26 0.8 9 0.6 25 2.0 -- -- 7 1.8
Catholic 520 16.0 368 24.3 387 30.2 107 24.2 139 35.2
Christian Church 130 4.0 42 2.8 42 3.3 10 2.3 26 6.6
Christian Scientist -- -- 1 0.1 1 0.1 -- -- 1 0.3
Church of Christ 53 1.6 39 2.6 17 1.3 16 3.6 9 2.3
Church of God 2 0.1 2 0.1 2 0.2 -- -- -- --
Church of the Nazarene 6 0.2 -- -- 3 0.2 -- -- -- --
Congregational Church 3 0.1 -- -- -- -- -- -- -- --
Disciples of Christ(Christian) 19 0.6 11 0.7 5 0.4 2 0.5 1 0.3
Dutch Reformed 1 0.0 -- -- -- -- -- -- -- --
Eastern Orthodox 7 0.2 8 0.5 7 0.5 1 0.2 2 0.5
Episcopalian 42 1.3 33 2.2 18 1.4 9 2.0 8 2.0
Evangelical Free Church 34 1.0 2 0.1 4 0.3 -- -- 1 0.3
Four Square Gospel 4 0.1 -- -- -- -- -- -- 1 0.3
Full Gospel 5 0.2 -- -- 1 0.1 -- -- -- --
(Continued)
Appendix II 25
Profile of Non-Enrolling Accepted Students, Fall 2010Demographic Information
Religious Affiliation EnrolledFirst Competitor:
Texas A&M
SecondCompetitor:UT - Austin
Third Competitor:Texas Tech
FourthCompetitor:
UT-San Antonio
N % N % N % N % N %
Greek Orthodox 1 0.0 -- -- 1 0.1 1 0.2 -- --
Hindu 30 0.9 19 1.3 41 3.2 3 0.7 2 0.5
Independent Bible Church 12 0.4 4 0.3 1 0.1 -- -- -- --
Islam 32 1.0 9 0.6 23 1.8 1 0.2 7 1.8
Interdenominational 5 0.2 2 0.1 -- -- -- -- -- --
Jehovah's Witness 1 0.0 1 0.1 2 0.2 -- -- 1 0.3
Jewish 1 0.0 2 0.1 4 0.3 1 0.2 -- --
Latter Day Saints (Mormon) 4 0.1 1 0.1 -- -- 1 0.2 1 0.3
Lutheran 103 3.2 57 3.8 36 2.8 17 3.8 11 2.8
Mennonite 1 0.0 1 0.1 -- -- -- -- -- --
Methodist 261 8.0 192 12.7 102 8.0 43 9.7 25 6.3
Missionary Alliance 4 0.1 1 0.1 -- -- -- -- -- --
Non-Denominational 435 13.3 112 7.4 90 7.0 33 7.5 23 5.8
Pentecostal 30 0.9 6 0.4 7 0.5 3 0.7 4 1.0
Presbyterian 134 4.1 53 3.5 37 2.9 10 2.3 10 2.5
Protestant 53 1.6 15 1.0 8 0.6 4 0.9 2 0.5
Seventh Day Adventist 5 0.2 2 0.1 2 0.2 2 0.5 -- --
Unitarian 1 0.0 2 0.1 -- -- -- -- 1 0.3
United Brethren -- -- -- -- 1 0.1 -- -- -- --
United Church of Christ -- -- 1 0.1 1 0.1 -- -- 1 0.3
(Continued)
Appendix II 26
Profile of Non-Enrolling Accepted Students, Fall 2010Demographic Information
Religious Affiliation EnrolledFirst Competitor:
Texas A&M
SecondCompetitor:UT - Austin
Third Competitor:Texas Tech
FourthCompetitor:
UT-San Antonio
N % N % N % N % N %
No Religion 46 1.4 11 0.7 34 2.7 5 1.1 9 2.3
Other than Listed 119 3.7 96 6.3 118 9.2 40 9.0 34 8.6
Not Specified 8 0.2 14 0.9 21 1.6 4 0.9 8 2.0
All 3,259 100.0 1,517 100.0 1,280 100.0 442 100.0 395 100.0

Appendix II 27
Profile of Non-Enrolling Accepted Students, Fall 2010SAT Scores
Appendix II 27
Profile of Non-Enrolling Accepted Students, Fall 2010SAT Scores
Interquartile RangeEnrolled
First Competitor:Texas A&M
SecondCompetitor:UT - Austin
ThirdCompetitor:Texas Tech
FourthCompetitor:
UT-San Antonio
25th Percentile 1130 1160 1150 1090 1070
75th Percentile 1300 1320 1360 1250 1210
EnrolledFirst Competitor:
Texas A&M
SecondCompetitor:UT - Austin
ThirdCompetitor:Texas Tech
FourthCompetitor:
UT-San Antonio
Mean 1218 1244 1256 1175 1150
Distribution EnrolledFirst Competitor:
Texas A&M
SecondCompetitor:UT - Austin
Third Competitor:Texas Tech
FourthCompetitor:
UT-San Antonio
N % N % N % N % N %
< 900 8 0.4 -- -- -- -- -- -- -- --
900 - 990 49 2.7 2 0.2 3 0.3 2 0.7 3 1.1
1000 - 1090 278 15.6 109 11.9 114 12.9 74 26.2 88 32.4
1100 - 1190 421 23.6 203 22.1 191 21.6 98 34.8 101 37.1
1200 - 1290 567 31.7 283 30.8 217 24.5 67 23.8 60 22.1
1300+ 464 26.0 321 35.0 360 40.7 41 14.5 20 7.4
All 1,787 100.0 918 100.0 885 100.0 282 100.0 272 100.0
Appendix II 28
Profile of Non-Enrolling Accepted Students, Fall 2010SAT Scores
Appendix II 28
Profile of Non-Enrolling Accepted Students, Fall 2010SAT Scores
Median Scores byGender
EnrolledFirst Competitor:
Texas A&MSecond Competitor:
UT - AustinThird Competitor:
Texas TechFourth Competitor:
UT-San Antonio
Verbal Math Total* Verbal Math Total* Verbal Math Total* Verbal Math Total* Verbal Math Total*
Male 590 640 1230 610 660 1270 620 680 1305 560 610 1170 560 595 1145
Female 590 610 1210 600 620 1220 600 630 1230 570 580 1160 560 570 1130
All 590 620 1220 600 640 1240 610 650 1260 570 600 1160 560 580 1135
*Total=Verbal + Math
Notes:1. Although submission of entrance test scores generally is required in the admission process, in each entering class there were a small number of studentswho were admitted without entrance test scores. Therefore, the sum of SAT N plus ACT N does not necessarily equal the total class size (N).
2. In this table, the highest SAT score is compared to the highest ACT score, and only the better score is retained.
Appendix II 29
Profile of Non-Enrolling Accepted Students, Fall 2010ACT Scores
Appendix II 29
Profile of Non-Enrolling Accepted Students, Fall 2010ACT Scores
Interquartile RangeEnrolled
First Competitor:Texas A&M
SecondCompetitor:UT - Austin
ThirdCompetitor:Texas Tech
FourthCompetitor:
UT-San Antonio
25th Percentile 24 25 24 23 22
75th Percentile 29 30 30 27 26
EnrolledFirst Competitor:
Texas A&M
SecondCompetitor:UT - Austin
ThirdCompetitor:Texas Tech
FourthCompetitor:
UT-San Antonio
Mean 26.4 27.3 27.1 25.1 24.2
Distribution EnrolledFirst Competitor:
Texas A&M
SecondCompetitor:UT - Austin
Third Competitor:Texas Tech
FourthCompetitor:
UT-San Antonio
N % N % N % N % N %
<20 24 1.6 2 0.3 1 0.3 3 1.9 2 1.6
20-21 95 6.5 20 3.3 18 4.6 18 11.3 21 17.1
22-24 352 23.9 110 18.4 85 21.5 58 36.3 52 42.3
25-27 425 28.9 165 27.5 113 28.6 45 28.1 30 24.4
28-29 281 19.1 148 24.7 70 17.7 13 8.1 13 10.6
30+ 295 20.0 154 25.7 108 27.3 23 14.4 5 4.1
All 1,472 100.0 599 100.0 395 100.0 160 100.0 123 100.0

Appendix II 30
Profile of Non-Enrolling Accepted Students, Fall 2010ACT Scores
Appendix II 30
Profile of Non-Enrolling Accepted Students, Fall 2010ACT Scores
Median Scores byGender
EnrolledFirst Competitor:
Texas A&MSecond Competitor:
UT - AustinThird Competitor:
Texas TechFourth Competitor:
UT-San Antonio
Engl. Math Comp. Engl. Math Comp. Engl. Math Comp. Engl. Math Comp. Engl. Math Comp.
Male 26 27 27 27 28 28 27 29 28 22 25 24 24 25 24
Female 26 25 26 27 26 27 27 27 27 24 25 25 23 23 24
All 26 26 27 27 27 28 27 27 27 24 25 25 23 24 24
Notes:1. Although submission of entrance test scores generally is required in the admission process, in each entering class there were a small number of studentswho were admitted without entrance test scores. Therefore, the sum of SAT N plus ACT N does not necessarily equal the total class size (N).
2. In this table, the highest SAT score is compared to the highest ACT score, and only the better score is retained.
Appendix II 31
Profile of Non-Enrolling Accepted Students, Fall 2010Academic Information
Appendix II 31
Profile of Non-Enrolling Accepted Students, Fall 2010Academic Information
High School Class Quartile* EnrolledFirst Competitor:
Texas A&M
SecondCompetitor:UT - Austin
Third Competitor:Texas Tech
FourthCompetitor:
UT-San Antonio
N % N % N % N % N %
First Quartile 1,911 71.0 1,172 89.3 1,166 97.1 265 63.9 215 59.7
Second Quartile 633 23.5 137 10.4 30 2.5 130 31.3 135 37.5
Third Quartile 137 5.1 3 0.2 5 0.4 19 4.6 9 2.5
Fourth Quartile 11 0.4 -- -- -- -- 1 0.2 1 0.3
All 2,692 100.0 1,312 100.0 1,201 100.0 415 100.0 360 100.0
* High School Class quartile rank is not available from all high schools.
Academic Index* EnrolledFirst Competitor:
Texas A&M
SecondCompetitor:UT - Austin
Third Competitor:Texas Tech
FourthCompetitor:
UT-San Antonio
N % N % N % N % N %
Level 1 1,057 32.4 636 41.9 688 53.8 86 19.5 28 7.1
Level 2 1,026 31.5 618 40.7 415 32.4 106 24.0 122 30.9
Level 3 803 24.6 246 16.2 174 13.6 178 40.3 180 45.6
Level 4 326 10.0 16 1.1 3 0.2 70 15.8 64 16.2
Level 5 46 1.4 1 0.1 -- -- 2 0.5 1 0.3
All 3,258 100.0 1,517 100.0 1,280 100.0 442 100.0 395 100.0
* Academic Index is not available for all students.
Appendix II 32
Profile of Non-Enrolling Accepted Students, Fall 2010Academic Information
Academic Unit EnrolledFirst Competitor:
Texas A&M
SecondCompetitor:UT - Austin
Third Competitor:Texas Tech
FourthCompetitor:
UT-San Antonio
N % N % N % N % N %
College of Arts & Sciences 1,846 56.6 863 56.9 837 65.4 258 58.4 244 61.8
School of Business 587 18.0 243 16.0 173 13.5 66 14.9 53 13.4
School of Education 214 6.6 80 5.3 42 3.3 28 6.3 22 5.6
School of Engineering & ComputerScience 280 8.6 273 18.0 164 12.8 63 14.3 49 12.4
Honors College 64 2.0 -- -- -- -- -- -- -- --
Institutes & Special Studies 13 0.4 -- -- -- -- -- -- -- --
School of Music 88 2.7 2 0.1 5 0.4 5 1.1 1 0.3
School of Nursing 138 4.2 51 3.4 56 4.4 20 4.5 23 5.8
School of Social Work 29 0.9 5 0.3 3 0.2 2 0.5 3 0.8
All 3,259 100.0 1,517 100.0 1,280 100.0 442 100.0 395 100.0