Embed Size (px)
Citation preview
OFFICE OF INSPECTOR GENERAL
MEDICARE PART B DRUG PAYMENTS: IMPACT OF PRICE SUBSTITUTIONS BASED
ON 2014 AVERAGE SALES PRICES
Suzanne Murrin Deputy Inspector General
OEI-03-16-00540 August 2017
of
Report in Brief August 2017 OEI-03-16-00540
Medicare Part B Drug Payments: Impact of Price Substitutions Based on 2014 Average Sales Prices
What OIG Found
CMS lowered Part B reimbursement for 14 drugs on the basis of
2014 data.
CMS’s price-substitution policy saved Medicare and its beneficiaries
$24 million over 1 year based on 2014 data.
Medicare and its beneficiaries could have saved up to an additional
$9 million over 1 year by expanding the price-substitution criteria to
include drugs that exceeded the 5-percent threshold in a single quarter.
Exhibit 1: Results of the Medicare Part B
Price-Substitution Policy
Source: OIG analysis of ASP and AMP data from 2014
What OIG Recommends
Because of the potential for savings to Medicare beneficiaries and the program,
OIG recommends that CMS expand the price-substitution policy. CMS did not
concur with the recommendation. However, CMS stated that as additional data
becomes available and as it continues to gain experience with the
price-substitution policy, it will consider further changes as necessary. OIG
recognizes that CMS, in setting policy for payment substitution, needs to
achieve an important balance between safeguarding access to drugs and
ensuring that Medicare and its beneficiaries do not overpay for drugs. To
provide greater flexibility and achieve this continued balance, any future
expansion of the payment-substitution policy could contain a provision that
would prevent a price substitution when there are indications that the
substitution amount is below the provider acquisition cost.
Why OIG Did This Review When Congress established average sales price (ASP) as the basis for Medicare Part B drug reimbursement, it also provided a mechanism for monitoring market prices and limiting potentially excessive payment amounts. The Social Security Act mandates that the Office of Inspector General (OIG) compare ASPs with average manufacturer prices (AMPs). If OIG finds that the ASP for a drug exceeds the AMP by a certain percentage (currently 5 percent), the Act directs the Secretary of Health and Human Services to substitute the ASP-based payment amount with a lower calculated rate. Through regulation, the Centers for Medicare & Medicaid Services (CMS) outlined that it would make this substitution only if the ASP for a drug exceeds the AMP by 5 percent in the 2 previous quarters or 3 of the previous 4 quarters.
Over the last decade, OIG has produced annual reports aggregating the results of our mandated quarterly ASP-to-AMP comparisons. This annual report quantifies the savings to Medicare and its beneficiaries that are a direct result of CMS’s price-substitution policy based on 2014 average sales prices, and this report also offers ways for additional savings.
How OIG Did This Review To determine the effects of the price-substitution policy, we determined the difference between ASP-based payment and AMP-based payment for each drug with a price substitution. We then applied this difference to the Medicare utilization for each of these drugs. To account for a 3-quarter lag between the reporting of pricing data and applying price substitutions, we used drug utilization data for the fourth quarter of 2014 through the third quarter of 2015 to calculate the savings based on 2014 ASP data.
Full report can be found at http://oig.hhs.gov/oei/reports/oei-03-16-00540.asp
Medicare Part B Drug Payments: Impact of Price Substitutions Based on 2014 Average Sales Prices 1 OEI-03-16-00540
BACKGROUND
When Congress established average sales price (ASP) as the basis for Medicare Part B drug
reimbursement, it also provided a mechanism for monitoring market prices and adjusting ASP-based
payments in certain situations. Specifically, the Social Security Act (the Act) mandates that the Office of
Inspector General (OIG) compare ASPs with average manufacturer prices (AMPs).1 If OIG finds that the
ASP for a drug exceeds the AMP by a certain percentage (currently 5 percent), the Act directs the
Secretary of Health and Human Services (after being
notified by OIG) to substitute the payment amount with
the lesser of the widely available market price (if any)
or 103 percent of the AMP.2, 3
Payments for Prescription Drugs Under Medicare Part B Medicare Part B covers a limited number of outpatient
prescription drugs. These drugs are usually
administered in a physician’s office or other outpatient
setting and include, for example, drugs used to treat
cancer. To obtain reimbursement for Part B drugs,
health care providers submit claims to Medicare
contractors using Healthcare Common Procedure
Coding System (HCPCS) codes. (Hereafter in this report,
we refer to HCPCS codes as “drugs.”4)
CMS calculates the payment amount for these drugs
using information provided by manufacturers. Certain
manufacturers must provide CMS with the ASP and
volume of sales for each of their national drug codes
(NDCs) on a quarterly basis.5, 6 CMS then calculates an
ASP-based payment amount for the drug, which
includes all of the NDCs associated with the drug.7
Under the ASP pricing methodology, the Medicare
reimbursement for most Part B drugs is equal to
106 percent of the volume-weighted ASP for the drug.8
However, under sequestration legislation, the payment
amount for most drugs is reduced by 2 percent.9
Quarterly reimbursement amounts are not based on
current quarter data because there is a 2-quarter lag
between the sales period for which ASPs are reported
and the effective date of the reimbursement amounts.
For example, manufacturers’ ASPs from the first
quarter of 2014 were used to establish reimbursement
amounts for the third quarter of 2014.
Manufacturer’s Average Sales Price (ASP)
In general, the manufacturer’s ASP for
a unit of drug that is sold is defined as the
manufacturer’s sales of a drug to all
purchasers in the United States in
a calendar quarter divided by the total
number of units of the drug sold by the
manufacturer in that same quarter.
Average Manufacturer Price (AMP)
In general, AMP is defined as the average
price paid to the manufacturer for the drug
in the United States by (1) wholesalers for
drugs distributed to retail community
pharmacies and (2) retail community
pharmacies that purchase drugs directly
from the manufacturer.
National Drug Code (NDC)
An NDC is a code used to identify a drug
based on its manufacturer, product, and
package size.
Healthcare Common Procedure Coding System (HCPCS) Code
A HCPCS code is a standardized billing code
that is used primarily to identify products,
supplies, and other services. A HCPCS code
specifies the name and the amount of the
drug and may represent one or more
NDCs.
Drug Pricing Terms
Medicare Part B Drug Payments: Impact of Price Substitutions Based on 2014 Average Sales Prices 2 OEI-03-16-00540
Manufacturer Reporting of AMPs In addition to providing quarterly ASPs, certain manufacturers must provide CMS quarterly with the
AMP for each of their NDCs.10, 11 The AMP is generally calculated as a weighted average of prices for all
of a manufacturer’s package sizes of a drug and is reported for the lowest identifiable quantity of the
drug, e.g., 1 milliliter, one tablet, one capsule.
AMP-Based Price Substitutions Through regulation, CMS established the criteria under which it would implement a price substitution
for a drug. CMS may substitute 103 percent of the AMP for the ASP-based reimbursement amount
when OIG identifies a drug that exceeds the 5-percent threshold in the two previous quarters or three
of the previous four quarters.12 CMS implemented the AMP substitution policy in April 2013. Because
CMS believes that comparisons based on partial AMP data may not adequately reflect market trends,
the agency will consider lowering reimbursement amounts only when corresponding AMP data is
available for each of the NDCs used to determine the published reimbursement amount for a drug.13
To prevent the price-substitution policy from inadvertently raising Medicare reimbursement amounts,
CMS does not substitute prices when the substituted amount is greater than the ASP-based payment
amount calculated for the quarter in which the price substitution takes effect.14 CMS also does not
substitute prices when a drug is identified by the Food and Drug Administration (FDA) as being in short
supply.15 Price substitutions take effect in the quarter after OIG shares the results of its most recent
pricing comparison and remain in effect for one quarter.16
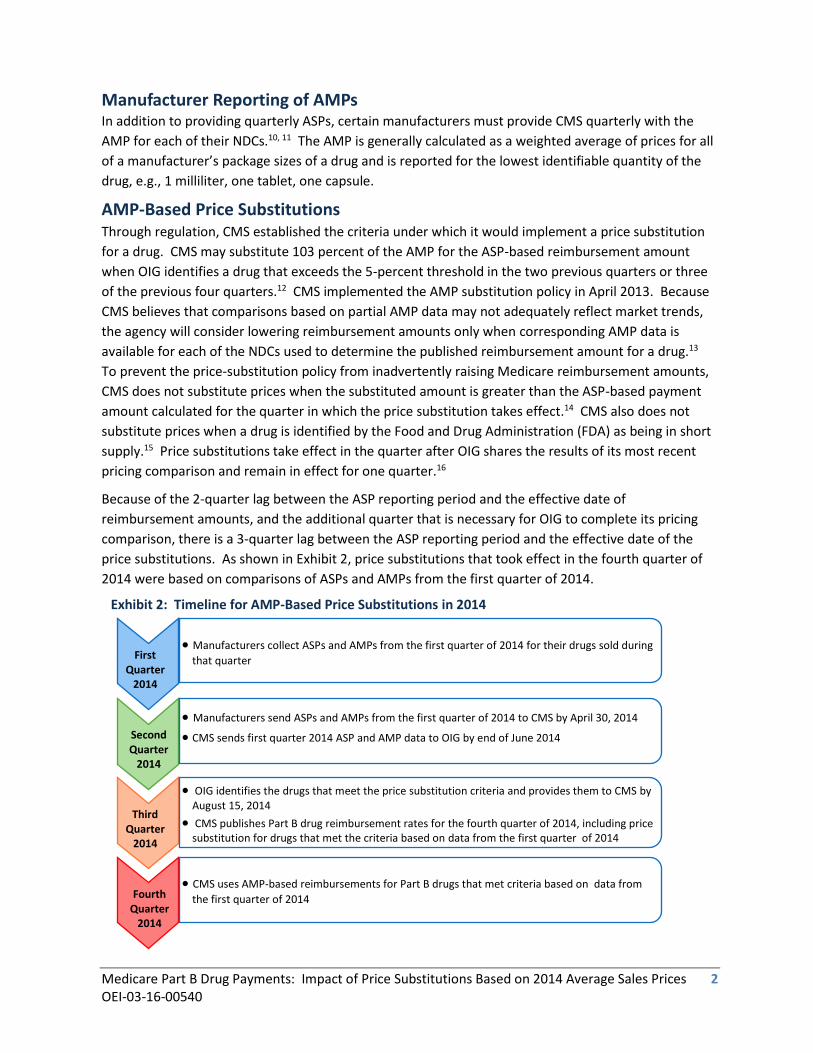
Because of the 2-quarter lag between the ASP reporting period and the effective date of
reimbursement amounts, and the additional quarter that is necessary for OIG to complete its pricing
comparison, there is a 3-quarter lag between the ASP reporting period and the effective date of the
price substitutions. As shown in Exhibit 2, price substitutions that took effect in the fourth quarter of
2014 were based on comparisons of ASPs and AMPs from the first quarter of 2014.
Exhibit 2: Timeline for AMP-Based Price Substitutions in 2014
First Quarter
2014
Second Quarter
2014
Third Quarter
2014
Fourth Quarter
2014
Manufacturers collect ASPs and AMPs from the first quarter of 2014 for their drugs sold during
that quarter
OIG identifies the drugs that meet the price substitution criteria and provides them to CMS by August 15, 2014
CMS publishes Part B drug reimbursement rates for the fourth quarter of 2014, including price substitution for drugs that met the criteria based on data from the first quarter of 2014
Manufacturers send ASPs and AMPs from the first quarter of 2014 to CMS by April 30, 2014
CMS sends first quarter 2014 ASP and AMP data to OIG by end of June 2014
CMS uses AMP-based reimbursements for Part B drugs that met criteria based on data from
the first quarter of 2014
Medicare Part B Drug Payments: Impact of Price Substitutions Based on 2014 Average Sales Prices 3 OEI-03-16-00540
OIG Monitoring of ASPs and AMPs To comply with its statutory mandate, OIG has provided CMS with pricing comparisons since the
January 2005 implementation of the ASP reimbursement methodology for Part B drugs. OIG issued
six annual public reports for the years prior to CMS’s April 2013 implementation of the AMP
price-substitution policy. These reports estimated that Medicare and its beneficiaries would have
saved $35 million if CMS implemented AMP price substitutions. OIG’s 2013 annual report was the first
to provide annual savings that were a direct result of CMS’s price-substitution policy. CMS’s price
substitutions based on 2013 data saved Medicare and its beneficiaries an estimated $13 million.
RESULTS
CMS’s price-substitution policy saved Medicare and its beneficiaries $24 million over 1 year
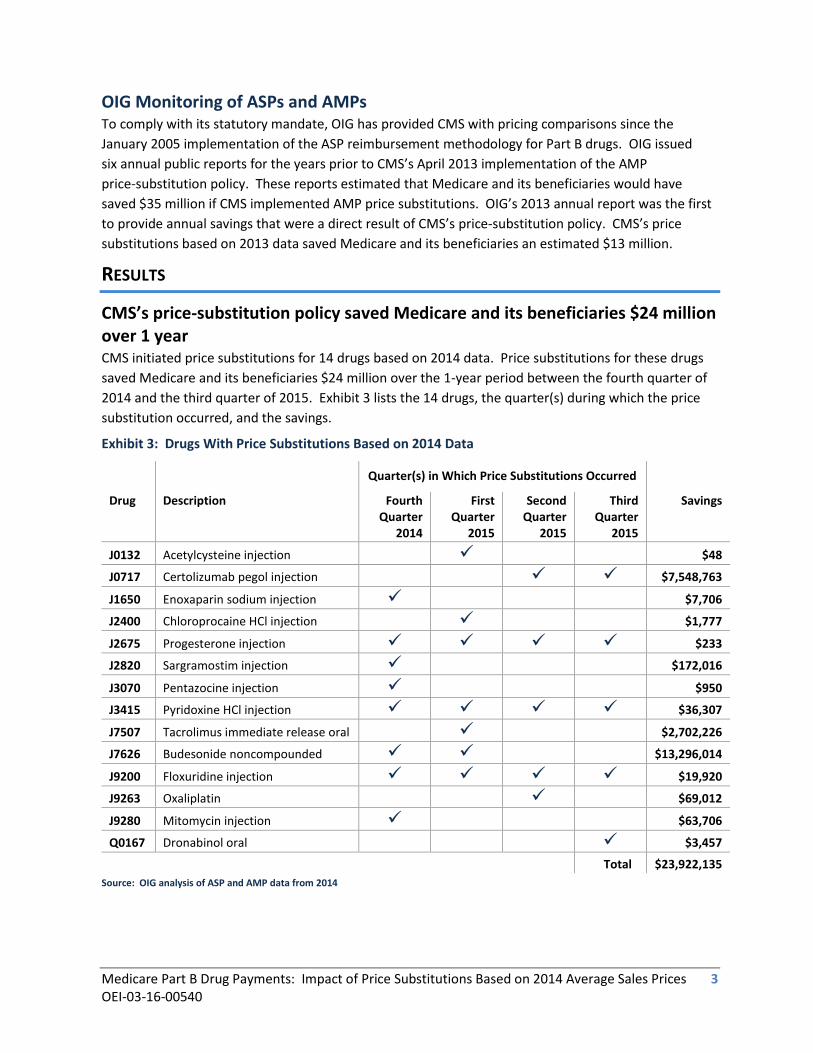
CMS initiated price substitutions for 14 drugs based on 2014 data. Price substitutions for these drugs
saved Medicare and its beneficiaries $24 million over the 1-year period between the fourth quarter of
2014 and the third quarter of 2015. Exhibit 3 lists the 14 drugs, the quarter(s) during which the price
substitution occurred, and the savings.
Exhibit 3: Drugs With Price Substitutions Based on 2014 Data
Quarter(s) in Which Price Substitutions Occurred
Drug
Description Fourth Quarter
2014
First Quarter
2015
Second Quarter
2015
Third Quarter
2015
Savings
J0132 Acetylcysteine injection $48
J0717 Certolizumab pegol injection $7,548,763
J1650 Enoxaparin sodium injection $7,706
J2400 Chloroprocaine HCl injection $1,777
J2675 Progesterone injection $233
J2820 Sargramostim injection $172,016
J3070 Pentazocine injection $950
J3415 Pyridoxine HCl injection $36,307
J7507 Tacrolimus immediate release oral $2,702,226
J7626 Budesonide noncompounded $13,296,014
J9200 Floxuridine injection $19,920
J9263 Oxaliplatin $69,012
J9280 Mitomycin injection $63,706
Q0167 Dronabinol oral $3,457
Total $23,922,135
Source: OIG analysis of ASP and AMP data from 2014
Medicare Part B Drug Payments: Impact of Price Substitutions Based on 2014 Average Sales Prices 4 OEI-03-16-00540
Expanding the price-substitution criteria could have generated up to $9 million in additional savings for Medicare and its beneficiaries CMS has maintained a cautious approach to price substitutions. However, this cautious approach may
restrict the Government’s ability to limit potentially excessive payment amounts based on ASPs. If CMS
had expanded its price-substitution criteria to include certain other Part B drugs in 2014, Medicare and
its beneficiaries could have saved up to an additional $9 million over 1 year.
Millions could be saved by expanding the substitution criteria to include drugs that exceeded the
5-percent threshold in a single quarter. Nineteen drugs with complete AMP data exceeded this
threshold in at least 1 quarter of 2014 but were not eligible for price substitution in that quarter
because they did not meet CMS’s duration criteria, i.e., they did not exceed the threshold in the
2 previous quarters or 3 of the previous 4 quarters.17 If the 19 drugs had been eligible for price
reductions on the basis of data from a single quarter only, Medicare and its beneficiaries could have
saved up to an additional $9 million between the fourth quarter of 2014 and the third quarter of 2015.
Previously, CMS has expressed concern that price substitutions based on results from a single quarter
may represent 1 aberrant quarter of pricing rather than a market trend. 18 However, price
discrepancies for the majority of the 19 drugs do not appear to have resulted from isolated
fluctuations. According to 2013 and 2014 data, 11 of these 19 drugs exceeded the 5-percent threshold
more than once over the 2-year period.19 Over the 2-year period, 6 of the 19 exceeded the threshold in
2 of the 8 quarters, and another 5 drugs exceeded the threshold three or four times in the 8 quarters.
If CMS would prefer to employ a more cautious approach than substitution based on a single quarter of
data, it could expand its price-substitution criteria to include drugs that exceed the 5-percent threshold
in 2 of the previous 6 quarters. Under this approach, 6 drugs would have been eligible for price
substitutions, and Medicare and its beneficiaries could have saved an estimated $3 million on these
6 drugs.
CONCLUSION AND RECOMMENDATION
Under the current price-substitution policy, 14 drugs were subject to reimbursement reductions on the
basis of data from 2014, saving Medicare and its beneficiaries $24 million between the fourth quarter
of 2014 and the third quarter of 2015. The agency could achieve even greater savings for Medicare and
its beneficiaries by expanding its criteria for AMP-based price substitutions.
OIG has previously recommended that CMS expand the price-substitution criteria. CMS indicated that
it does not concur with expanding the price-substitution policy and continues to believe that more
experience with this policy is needed before it can be expanded. CMS also expressed concern that
expanding price-substitution criteria may impede physician and beneficiary access to drugs. OIG agrees
that access to prescription drugs should always be considered when contemplating pricing policies and
supports current safeguards to prevent substitutions for drugs that are identified by FDA as being in
short supply. However, OIG continues to believe that CMS can achieve a better balance between
safeguarding access to drugs and ensuring that Medicare and its beneficiaries do not overpay for drugs.
To provide CMS with greater flexibility, any revisions that CMS makes to its’ price-substitution policy
Medicare Part B Drug Payments: Impact of Price Substitutions Based on 2014 Average Sales Prices 5 OEI-03-16-00540
could contain a provision that would prevent a price substitution when there are indications that the
substitution amount would be below provider acquisition costs.
Therefore, we continue to recommend that CMS:
Expand the price-substitution policy
To more effectively limit excessive payment amounts based on ASPs and to generate greater
savings for Medicare and its beneficiaries, CMS should consider broadening its
price-substitution criteria to include at least some additional drugs. For example, a more
expansive policy might include drugs with complete AMP data that exceed the 5-percent
threshold in a single quarter. However, CMS also could consider a more modest expansion of
the policy that better captures drugs that repeatedly exceed the threshold. It could expand the
criteria to include drugs with complete AMP data that exceed the 5-percent threshold in
2 of 6 quarters.
AGENCY COMMENTS AND OFFICE OF INSPECTOR GENERAL RESPONSE
CMS did not concur with our recommendation. However, CMS stated that as additional data becomes
available and as it continues to gain experience with the price-substitution policy, it will consider
further changes as necessary. CMS believes the current policy safeguards—which identify drugs that
exceed the 5-percent threshold for 2 consecutive quarters or 3 of 4 quarters—identify situations in
which AMP consistently exceeds ASP.
OIG continues to believe that expanding the policy can achieve a balance between safeguarding access
to drugs and ensuring that Medicare and its beneficiaries do not overpay for drugs. Our examination of
2014 data shows that if the policy had been expanded to include the 19 drugs that exceeded the
5-percent threshold in a single quarter, up to an additional $9 million could have been saved by
beneficiaries and the program. The majority of the 19 drugs we identified for these potential savings
exceeded the threshold multiple times over a 2-year period. Expanding the policy to capture drugs that
exceed the threshold in a single quarter could increase the savings to beneficiaries and the program
and still ensure access to drugs.
To help ensure that CMS has sufficient information for its consideration regarding the
price-substitution policy, OIG will continue to provide CMS with the results from our quarterly pricing
comparisons, along with annual reports on the impact of the price-substitution policy.
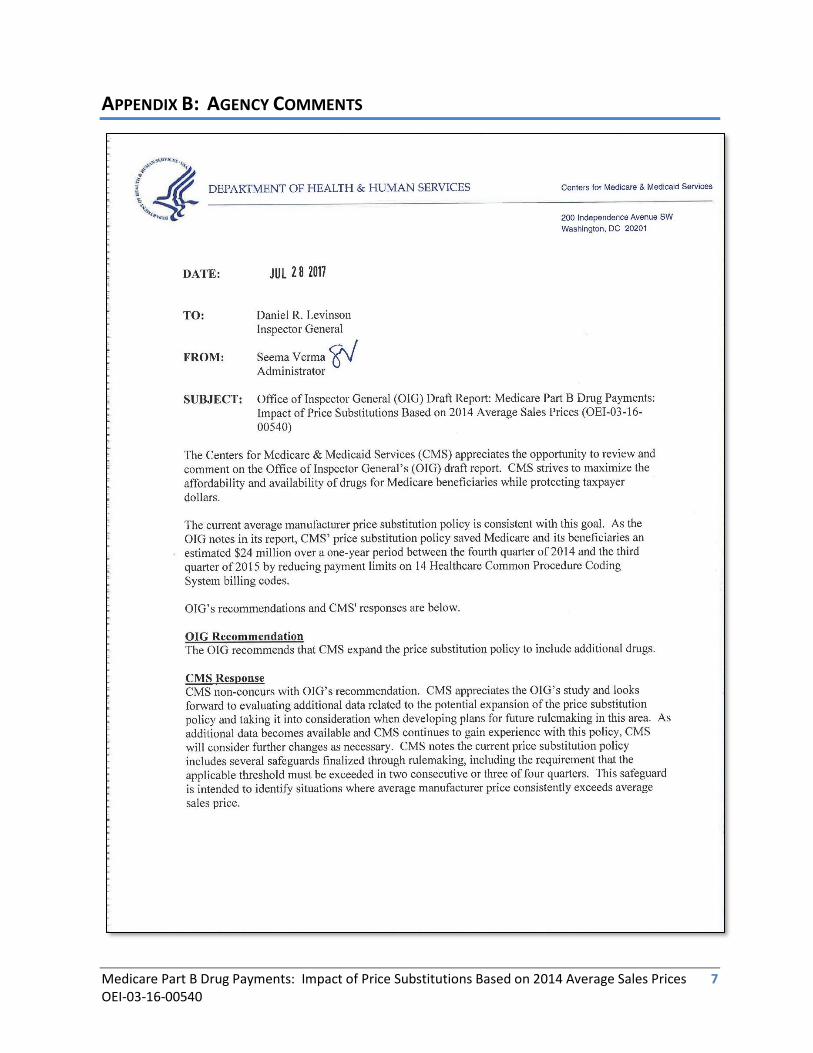
For the full text of CMS’s comments, see the Appendix B.

Medicare Part B Drug Payments: Impact of Price Substitutions Based on 2014 Average Sales Prices 6 OEI-03-16-00540
APPENDIX A: METHODOLOGY
Data Collection and Analysis
We obtained NDC-level ASP data and AMP data for Part B drugs from CMS for 2014. We also obtained
ASP-based reimbursement amounts and Part B drug utilization for the quarters in which price
substitutions occurred, i.e., the fourth quarter of 2014 through the third quarter of 2015. In addition,
we obtained the drugs that had price substitutions based on data from 2014.
For each quarter of 2014, we calculated volume-weighted AMPs for drugs consistent with CMS’s
methodology for calculating volume-weighted ASPs. We then compared the volume-weighted ASPs
and AMPs and identified all drugs with ASPs that exceeded the AMPs by at least 5 percent. We also
identified drugs that exceeded the 5-percent threshold but did not meet CMS’s duration criteria for
price substitution, i.e., they did not exceed the threshold in the 2 previous quarters or 3 of the previous
4 quarters.
To calculate the savings associated with price substitutions or potential price substitutions that could
be made by expanding the policy, we first reduced AMP-based and ASP-based reimbursement amounts
(103 percent of the volume-weighted AMP and 106 percent of the volume-weighted ASP, respectively)
by the 2-percent reduction required by sequestration legislation. We then subtracted the AMP-based
reimbursement from the ASP-based reimbursement amount for the quarter in which the price
substitution occurred20 and multiplied the difference by the Part B utilization for each drug in the
respective quarter that the price substitution occurred. We used this same method to calculate savings
for potential price substitutions that could be made if CMS expanded the price-substitution policy.
Limitations We did not verify the accuracy of manufacturer-reported ASP and AMP data, nor did we verify the
underlying methodology used by manufacturers to calculate ASPs and AMPs. We also did not verify the
accuracy of CMS’s calculations of Part B drug reimbursement amounts.
Manufacturers are required to submit their quarterly ASP and AMP data to CMS within 30 days after
the close of the quarter. We did not determine whether manufacturers provided any updated data to
CMS at a later date.
Standards This study was conducted in accordance with the Quality Standards for Inspection and Evaluation
issued by the Council of the Inspectors General on Integrity and Efficiency.
Medicare Part B Drug Payments: Impact of Price Substitutions Based on 2014 Average Sales Prices 7 OEI-03-16-00540
APPENDIX B: AGENCY COMMENTS
Medicare Part B Drug Payments: Impact of Price Substitutions Based on 2014 Average Sales Prices 8 OEI-03-16-00540
ENDNOTES
1 Section 1847A(d)(2)(B) of the Act. 2 Section 1847A(d)(3) of the Act. 3 Pursuant to § 1847A(d)(3)(B)(ii) of the Act, the threshold percentage has been maintained at 5 percent. 4 A HCPCS code for a drug defines the drug name and the amount of the drug represented by the HCPCS code but does not specify the manufacturer or package size. 5 Section 1927(b)(3) of the Act. 6 An NDC is a drug code that represents a specific manufacturer, product, and package size. 7 Section 1847A(c) of the Act. Certain types of sales are exempted from ASP, and ASP is net of any price concessions (with limited exceptions). 8 Section 1847A(b)(1) of the Act. Medicare beneficiaries are responsible for 20 percent of this amount in the form of coinsurance. 9 Part B claims dated on or after April 1, 2013, incur a reduction in payment in accordance with the Budget Control Act of 2011 and the American Taxpayer Relief Act of 2012 (see CMS Medicare FFS Provider e-News, Mandatory Payment Reductions in the Medicare Fee-for-Service (FFS) Program –“Sequestration,” March 8, 2013). Under this mandatory payment reduction, the payment rate for most Part B drugs is reduced by 2 percent. This reduction does not apply to the coinsurance portion of the Medicare allowed amount for Part B drugs. 10 Section 1927(b)(3) of the Act. 11 Section 1927(k)(1) of the Act. 12 42 CFR § 414.904(d)(3). 13 Ibid. 14 Ibid. 15 Ibid. 16 Ibid. 17 These 19 drugs were not identified by FDA as being in short supply and did not have AMP-based substitution amounts that were greater than the ASP-based reimbursement amounts in the quarters during which the substitutions would have occurred. 18 76 Fed. Reg. 73026, 73288 (Nov. 28, 2011). 19 This analysis is based on pricing comparison results for the 2-year period between the first quarter of 2013 and the last quarter of 2014. 20 AMP-based price substitutions based on data from the first through fourth quarters of 2014 were applied in the fourth quarter of 2014 through the third quarter of 2015, respectively.
Medicare Part B Drug Payments: Impact of Price Substitutions Based on 2014 Average Sales Prices 9 OEI-03-16-00540
ACKNOWLEDGMENTS
Conswelia McCourt served as the team leader for this study. Office of Evaluation and Inspections staff
who provided support include Joe Chiarenzelli, Althea Hosein, Meghan Kearns, and Christine Moritz.
This report was prepared under the direction of Linda Ragone, Regional Inspector General for
Evaluation and Inspections in the Philadelphia regional office, and Edward Burley, Deputy Regional
Inspector General.
To obtain additional information concerning this report or to obtain copies, contact the Office of Public
Affairs at [email protected].


![appendices - NASA 281 THE INSPECTOR GENERAL ACT AMENDMENTS The Inspector General Act Amendments of 1988(P.L. 100-504) [the Act], require that Inspectors General (IG) and Agency Heads](https://img.pdfslide.net/doc/110x75/5ac4329a7f8b9a12608cce96/appendices-nasa-281-the-inspector-general-act-amendments-the-inspector-general.jpg)


![INSPECTOR GENERAL ACT OF 1978 - House Office of the ... General Act Of 1978.pdf · INSPECTOR GENERAL ACT OF 1978 [Public Law 95–452; 5 U.S.C. App.] [As Amended Through P.L. 115–141,](https://img.pdfslide.net/doc/110x75/5b4f7df67f8b9a396e8c7160/inspector-general-act-of-1978-house-office-of-the-general-act-of-1978pdf.jpg)