Embed Size (px)
Citation preview
OFFSHORE INJURY, ILL HEALTH
AND INCIDENT STATISTICS 2009/2010
HID STATISTICS REPORT HSR 2010 - 1
Date of Issue: December 2010 Health and Safety Executive
OFFSHORE INJURY AND INCIDENT STATISTICS 2009/2010
Health & Safety Executive Hazardous Installations Directorate
Offshore Division (OSD)
i
Preface This is the tenth report in a series of HID Statistics reports covering offshore injury and incident statistics, which continues from the previous OTO series. It is the fourteenth under the Reporting of Injuries, Diseases and Dangerous Occurrences Regulations 1995 (RIDDOR), and presents data on injuries, diseases and incidents reported for the period 1 April 2008 to 31 March 2010. Copies of this report can be downloaded from HSE’s website at
http://www.hse.gov.uk/offshore
Copies of this report can also be obtained from:
Health and Safety Executive Hazardous Installations Directorate (OSD3.1)
5N.2 Redgrave Court Merton Road
Bootle Merseyside L20 7HS
Tel: 0151 951 3157 Fax: 0151 951 3260
e-mail:[email protected]
ii
CONTENTS
SECTION PAGE
Summary 1
Introduction 2
Commentary 3
Further analysis of major injuries 6
Hydrocarbon Releases 10
Annex 1 Data for 2009/10 11 – 33
Contents 11
Tables 12 – 20
Figures 21 – 34
iii
SUMMARY This report contains details of offshore accidents, dangerous occurrences and ill health reported to HSE from 1 April 2009 to 31 March 2010, with summarised data back to 1995/96 for comparison. The main points are:
• No fatalities arising from offshore work activities regulated by HSE were reported in 2009/10 for a third successive year.
• 50 major injuries were reported, compared to 30 in 2008/09 and 44 in 2007/8.
• The major injury rate per 100,000 workers rose from last year’s figure of 106.3 to 188.0 and is the highest recorded since 2005/6. The combined fatal and major injury rate is the same as the major injury rate.
• 110 ‘over-3-day’ injuries were reported, a decrease of 30 compared to the previous year. The over-3-day injury rate decreased from 496 per 100,000 workers to 413.6 – a decrease of 16.6% compared to 2008/09. This is 68% lower than the peak of 1293 in 1995/96.
• 434 dangerous occurrences were reported, compared to 477 in 2008/09, a decrease of 43. This is 43.2% less than the peak of 764 in 2000/01.
• The estimated offshore workforce was 26,598 compared to 28,224 in 2008/09 - a reduction of 5.76%.
• The ‘maintenance/construction’ work process environment continued to produce the highest number of ‘all injuries’ and ‘major injuries’ this year, followed by ‘deck operations’.
• ‘Struck by moving objects’ produced the most injuries in a single category followed by ‘slips, trips and falls’, ‘injuries from handling, lifting or carrying’ and ‘falls from height’. These four categories account for 85% of all injuries. Injuries from slips, trips and falls, including falls from heights, account for 52% of all major injuries. Two thirds of major injuries were to limbs.
• The ratio of over-3-day to major injuries decreased by 53% in 2009/10 to 2.2. This reflects the increased proportion of major injuries among the total of all reportable injuries compared to the previous year, although overall there was a reduction in the total of reportable injuries in 2009/10.
• This year the three-year rolling average of injury rate for combined fatal and major injuries rose compared to last year’s low value, though overall there remains a continuation of the overall downward trend over the past 10 years. The three-year rolling average rate for over-3-day injuries continued to decline.
.
1
INTRODUCTION 1.1 This report covers the period from April 2009 to March 2010, with summary data from 1995/96 included for comparison. It is based on incidents reported under the Reporting of Injuries, Diseases and Dangerous Occurrences Regulations 1995 (RIDDOR)1. For offshore operations, this covers incidents directly affecting offshore installations or workers or visitors on offshore installations2. It also includes certain diving operations in connection with operations on an offshore installation3. 1.2 Commentary is provided on the statistics as a whole as well as more detailed analysis of major injuries. Annex 1 contains tables and graphs of the 2009/10 statistics. 1.3 Provisional headline data on fatalities, injuries, and other reportable incidents was published on the HSE website in the Offshore Safety Statistics Bulletin 2009/2010 (http://www.hse.gov.uk/offshore/statistics.htm) in August 2010. This data was based on analysis of data conducted at quarterly intervals throughout the operating year. Data in the bulletin is regarded as provisional due to the potential for late submission or amendment of reported incident data. The data contained in this full annual report for 2009/2010 has undergone a detailed review for the whole operating year and contains a few minor amendments to the headline statistics contained in the bulletin. 1.4 OSD commissioned a review of the pre-1996/97 data to reclassify injuries from that period in line with the RIDDOR requirements. All data in this report now conforms to the RIDDOR classification. Care should be taken in making comparisons, particularly where small numbers of incidents are involved, to avoid reading too much significance into variations. 1.5 Incidents occurring in marine and transport activities are not regulated by HSE, but may be related to the offshore oil and gas industry operations. It is noted that on 1 April 2009, a helicopter flight returning from the Miller platform to Aberdeen ditched in the sea with the loss of 2 crew and 14 offshore workers. Also one worker was killed in a lifting related incident on a diving support vessel when in transit.
1 Reportable injuries and dangerous occurrences are defined in regulation 3 of RIDDOR. Further description of ‘Major Injuries’ is provided in RIDDOR under Schedule 1. Reference to over-3-day injuries in this annual report includes all other RIDDOR reportable injuries that are less severe than Major Injuries. Description of reportable Dangerous Occurrences is provided in Schedule 2. 2 The report does not include incidents arising from marine activities that are not directly connected with offshore operations (e.g. vessels or rigs in transit) or air transport activities (including transport to, from or between installations), except incidents affecting helicopters whilst located on an installation which are included if they occur. The report does include offshore wells and most activities in connection with them, as well as offshore pipelines, pipeline works and certain activities in connection with pipeline works. Incidents on offshore windfarms are included. 3 Whilst HSE Offshore Division retains responsibility for all aspects of offshore diving and inshore commercial diving, statistics stated in this report are for offshore diving and diving support activities associated with an offshore installation only.
2
COMMENTARY Population 2.1 Injury rates are calculated using offshore population data from the industry’s Vantage personnel tracking system. Up to and including 2003/04, data from the Inland Revenue was used. For 2009/10, the estimated offshore population (based on total number of hours worked divided by 2000 hours per worker year) was 26,598, a 5.76% reduction compared to the previous year’s figure of 28,224. Fatal injuries 2.2 There were no fatal injuries during 2009/10 for a third consecutive year. Major injuries 2.3 The number of major injuries (50) increased by twenty over the previous year. This figure includes 1 major injury to a worker working on a wind farm. The major injury rate per 100,000 workers rose 76.9% to 188. Since there were no fatalities, the combined number of fatal and major injuries also rose by twenty to 50 and the combined fatal and major injury rate per 100,000 workers also rose to 188. Over-3-day injuries 2.4 The number of over-3-day injuries (110) decreased 21.4% compared to 2008/09. The over-3-day injury rate also decreased by 16.6% to 413.6. This is a new low figure reflecting the maintained reduction in the number of injuries in a consistently high offshore working population, albeit a slightly reduced population compared to the previous year. Ratio of over-3-day to major injuries 2.5 Table 4 and Figure 5 show the ratio of over-3-day to major injuries for the last fifteen years. The fall in the ratio for 2009/10 reflects the increase in major injuries and decline in over-3-day injuries. Overall there has been a reduction in the total number of reportable injuries in 2009/10 but an increase in the proportion of those reported injuries being classed as major. It should be noted that conclusions derived from the ratio should be tempered by the extent to which over 3-day injuries might have had the potential to lead to major injuries if less fortunate circumstances had occurred and vice versa. Three-year rolling averages 2.6 Three-year rolling averages smooth out variations and give a clearer picture of overall trends - see Tables 3 and 3a and Figures 4 and 4a. The three-year rolling average for the combined number of fatal and major injuries showed a small increase (7.8%) in 2009/10 reflecting the moderate increase in major injuries for that year, but tempered by the general improvement that has been seen over the 3 year period. The average for the fatal and major injury rate, which takes account of the working population, has increased 10.4% over the last 12 months. This is largely influenced by both the increased number of major injuries during 2009/10 and the slightly reduced workforce population for that year. The rolling average for over-3-
3
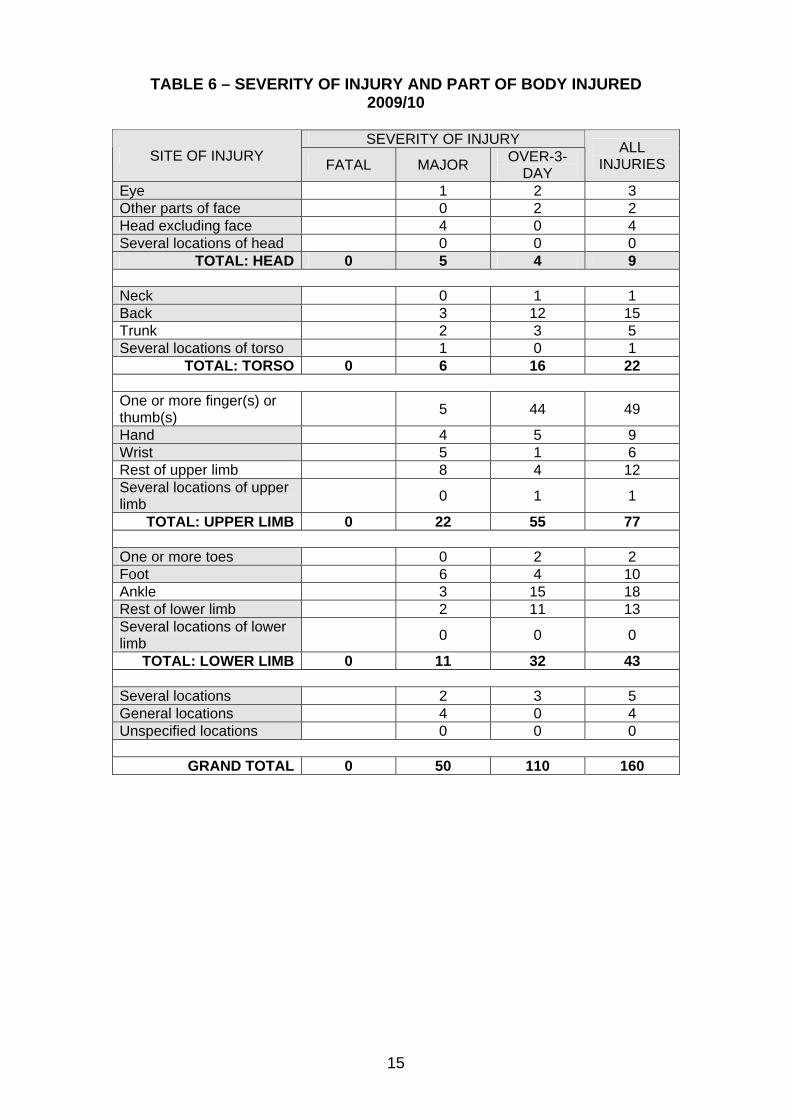
day injuries has fallen by 12%. However, the over-3-day injury rate rolling average has shown a 10.5% fall to a new low of 478.6 per 100,000 workers and reflects the significant fall in over-3-day injuries during 2009/10. Details of injuries Nature of injury 2.7 Table 5 categorises injuries by severity and nature of injury, and Figures 6 and 6a illustrate their distribution. The most frequent types of all injuries were fractures (27.5% - 44 injuries), sprains and strains (25% - 40 injuries), lacerations (15% - 24 injuries) and contusions (13.1% - 21 injuries). For major injuries, fracture was the most commonly occurring type, with 27 incidents which represents 54% of all major injuries (50). For over-3-day injuries, ‘Sprains and strains’ were the most common type of injury, with 40 incidents (36.4% of over-3-day injuries). Other frequent types of over-3-day injuries included lacerations (22 incidents – 20%), contusions (18 incidents – 16.4%) and fractures (17 incidents – 15.5%). Part of body injured 2.8 Table 6 and Figures 7 and 7a provide information on the site of injury. The upper limb4 accounted for 48.1% (77) of all injuries for 2009/10 and the lower limb accounted for 26.9% (43). The torso accounted for 13.8% (22) of all injuries. The number of head injuries (9) rose 50% accounting for 5.6% of the total. Injuries to the limbs accounted for 33 (66%) of all major injuries. For over-3-day injuries, injuries to the limbs accounted for 87 injuries (79% of over-3-day injuries). There were 55 incidents (50% of all over-3-day injuries or 63.2% of over-3-day limb injuries) affecting the upper limbs and 32 (29.1% of all over-3-day injuries) to the lower limbs. Of all upper limb injuries, 49 (63.6%) were attributed to injury to one or more fingers or thumbs (of which 89.8% were over-3-day injuries). Injuries to the torso accounted for 14.5% of all over-3-day incidents, with 16 incidents reported. Kind of accident 2.9 Table 7 and Figures 8 and 8a record the breakdown of the kind of accident against severity of injury. 32 (20%) of all injuries were associated with handling, lifting or carrying activities, 47 (29.4%) from being struck by moving, flying or falling objects, of which 11 resulted in major injury. 37 incidents (23.1% of all injuries) were as a result of slips, trips or falls at the same level and a further 20 (12.5%) involved a fall from height, resulting in a total 57 (35.6%) of all injuries being associated with slips, trips and falls of all types. Age of injured person 2.10 Table 8 and Figures 9 and 9a show the age of the injured persons. The majority of injuries (68.1%) were spread between ages ranging from 25 to 49 years of age, with the 35-39 year band recording the highest number of injuries with 30 (18.8%) incidents. The 40-44 year age band recorded the 4 Upper limb includes the fingers and the thumb, hand and wrist.
4
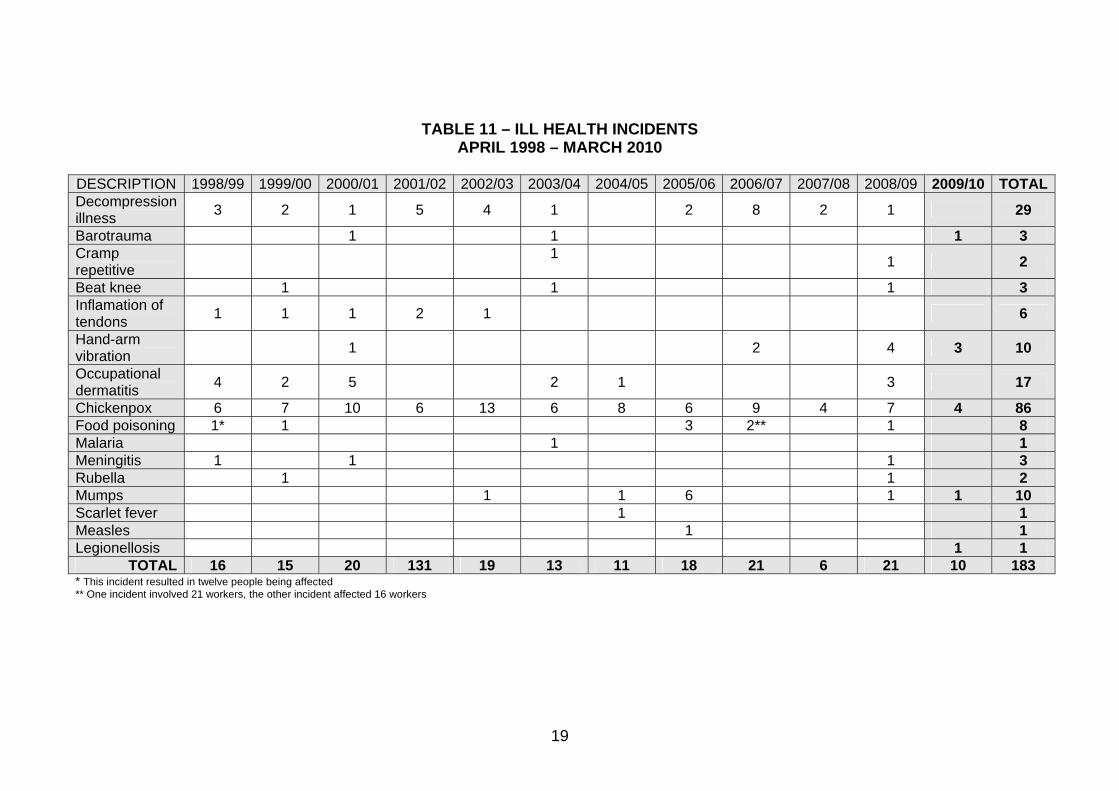
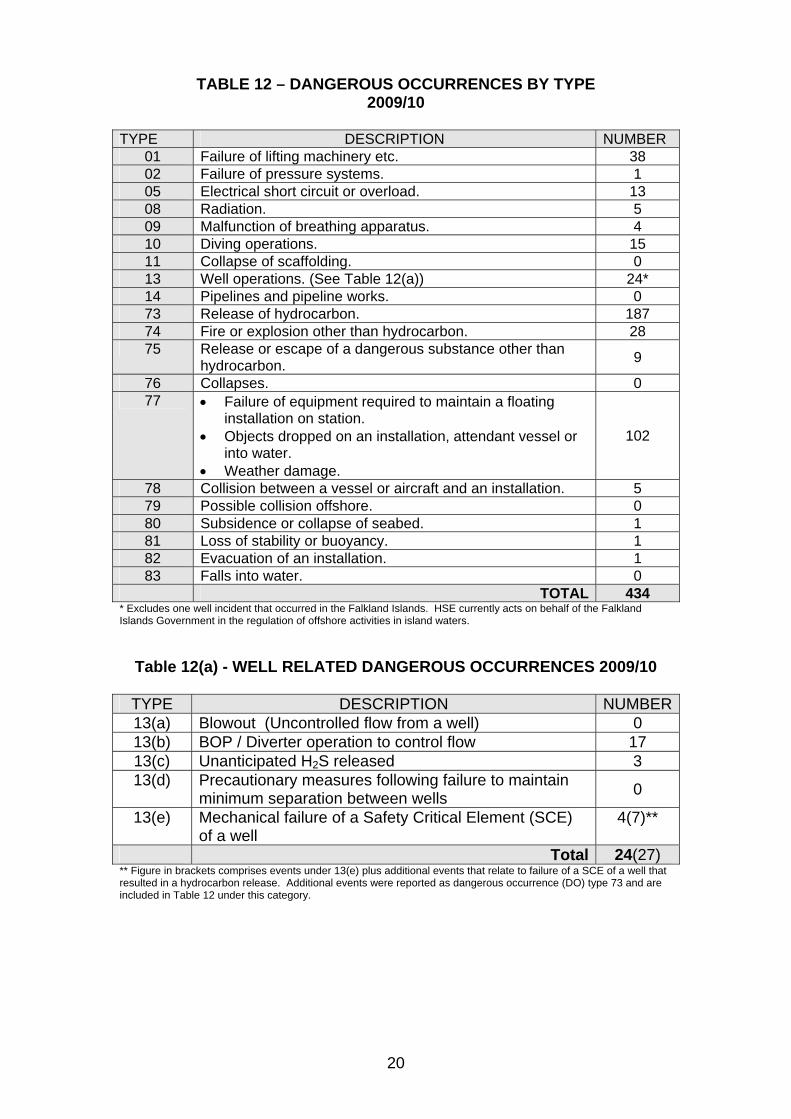
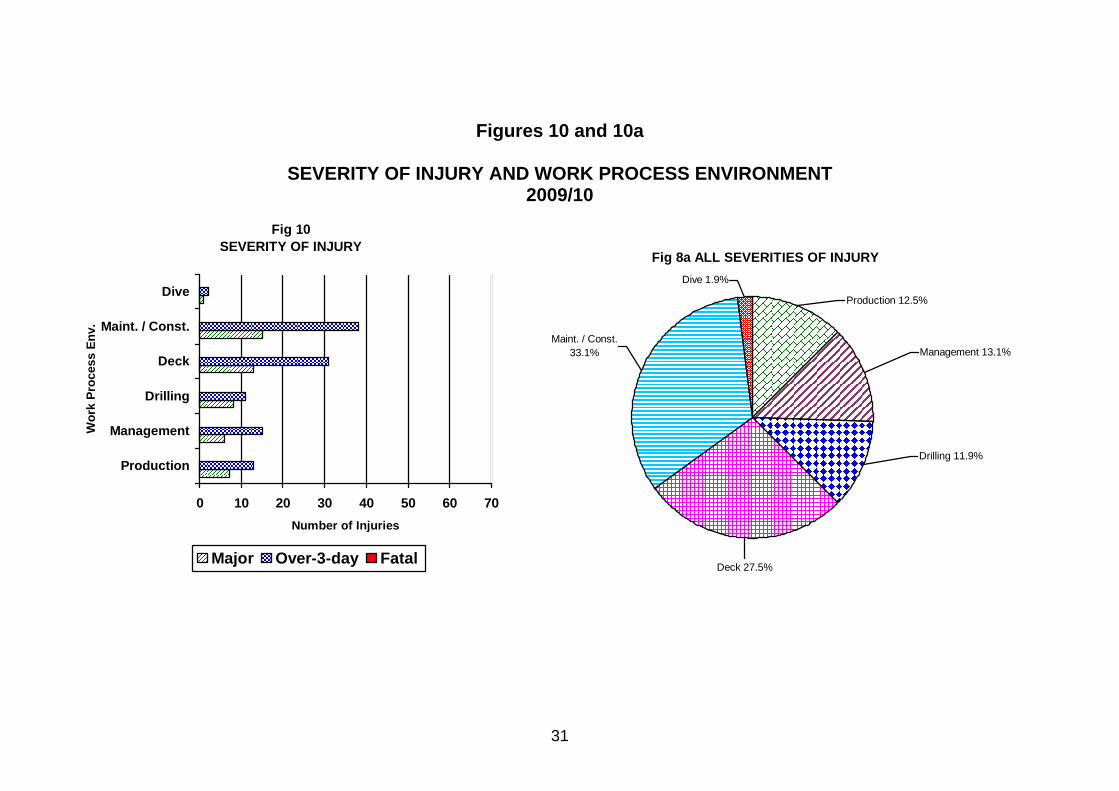
highest number of major injuries (9 incidents, 18% major injuries) closely followed by 45-49 year band with 8 incidents (16%). Work Process Environment 2.11 Table 9 and Figures 10 and 10a describe the type of activity being carried out when the incident occurred. Work Process Environment categories were introduced for offshore incidents from April 2001. Prior to that, categories under ‘operation’ were used. Any direct comparisons of these categories should therefore be used with care. Most injuries occurred in the ‘maintenance and construction’ environment (53 incidents, or 33.1% of all injuries). The ‘maintenance and construction’ environment also had the most major injuries (15 incidents, or 30% of all major injuries – the same proportion as last year), followed by ‘deck operations’ having 13 (26%) and ‘drill’ which produced 8 (16%) major injuries respectively. Agent of Accident 2.12 Table 10 and Figures 11 & 11a give information on the agent of accident against severity of injury. 38.1% of all injuries (61 incidents) involved ‘surfaces, structures and building access equipment’. 25 incidents (15.6% of the total) involved ‘conveying, lifting storage systems and hand-held pushed/pulled transport equipment’. These two categories also accounted for the majority of major injuries (28 – 56% of major injuries). Reportable Diseases 2.13 Table 11 indicates there were 10 cases of disease or ill health reported in 2009/10, compared with 21 in 2008/09. There were 4 cases of chickenpox and 3 cases of hand-arm vibration related injury. Dangerous Occurrences 2.14 The total of 434 reported dangerous occurrences (DO) for 2009/10 represents a 9% decrease compared to the figure for 2008/09 (477 incidents). Tables 12 and 12(a) gives a summary of dangerous occurrences by type. DO type 73 (release of hydrocarbon) accounted for 43% of all incidents (including 3 releases resulting from failure of safety critical equipment associated with a well) and DO type 77 (station-keeping, dropped objects and weather) accounted for 23.5% of all incidents in 2009/10. Failure of lifting machinery, etc. events (DO type 01) accounted for 8.8% of incidents and well related activities (DO type 13) accounted for 5.5%. No well related incidents (Table 12(a)) involved well blowout but 17 incidents involved operation of blowout preventers to control an unplanned influx into the well. Figure 12(a) shows the number of well related incidents since 2003/04 Fire or explosion incidents (DO type 74) decreased to 28, representing 6.5% of the total.
5
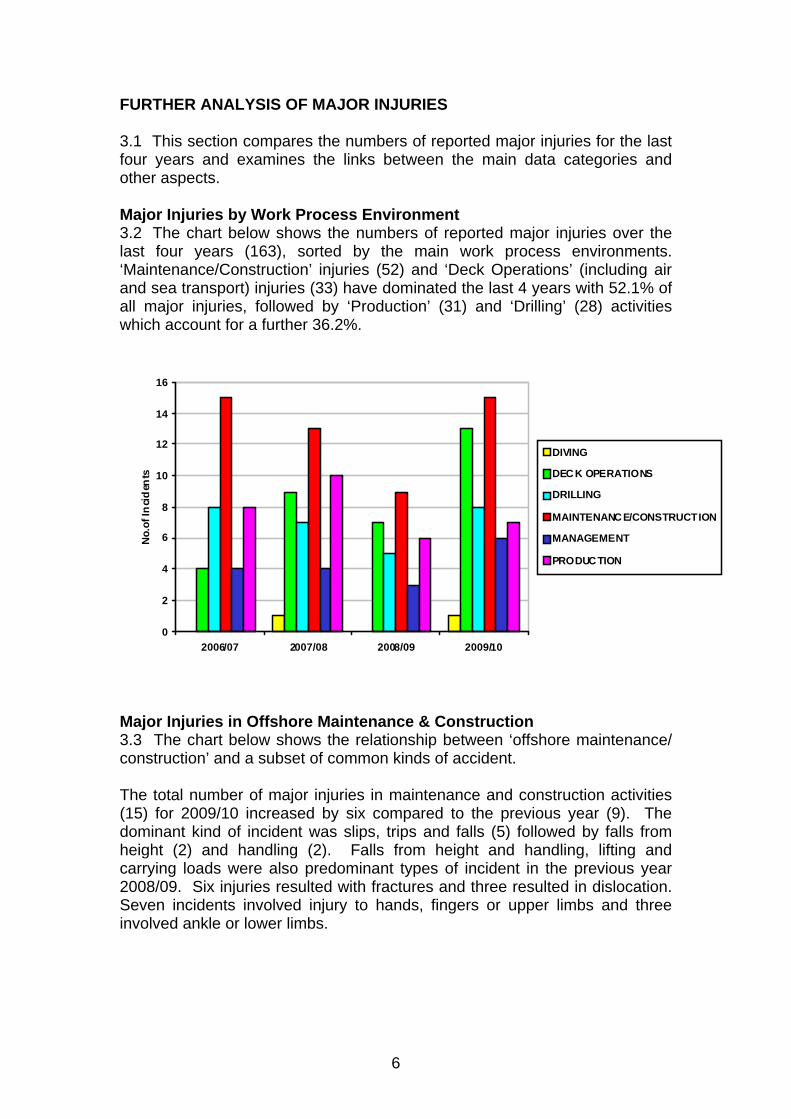
FURTHER ANALYSIS OF MAJOR INJURIES 3.1 This section compares the numbers of reported major injuries for the last four years and examines the links between the main data categories and other aspects. Major Injuries by Work Process Environment 3.2 The chart below shows the numbers of reported major injuries over the last four years (163), sorted by the main work process environments. ‘Maintenance/Construction’ injuries (52) and ‘Deck Operations’ (including air and sea transport) injuries (33) have dominated the last 4 years with 52.1% of all major injuries, followed by ‘Production’ (31) and ‘Drilling’ (28) activities which account for a further 36.2%.
0
2
4
6
8
10
12
14
16
2006/07 2007/08 2008/09 2009/10
No.
of In
cid
ents
DIVING
DEC K OPERATIONS
DRILLING
MAINTENANCE/CONSTRUCTION
MANAGEMENT
PRODUCTION
Major Injuries in Offshore Maintenance & Construction 3.3 The chart below shows the relationship between ‘offshore maintenance/ construction’ and a subset of common kinds of accident. The total number of major injuries in maintenance and construction activities (15) for 2009/10 increased by six compared to the previous year (9). The dominant kind of incident was slips, trips and falls (5) followed by falls from height (2) and handling (2). Falls from height and handling, lifting and carrying loads were also predominant types of incident in the previous year 2008/09. Six injuries resulted with fractures and three resulted in dislocation. Seven incidents involved injury to hands, fingers or upper limbs and three involved ankle or lower limbs.
6
0
1
2
3
4
5
6
2006/07 2007/08 2008/09 2009/10
No
. of i
ncid
ents
STRUCK BY
STRUCK AGAINST
SLIP, TR IP
HANDLING
FALLS FROM HEIGHT
EXPOSED TO DANGER OUSSUBSTANCEFIRE
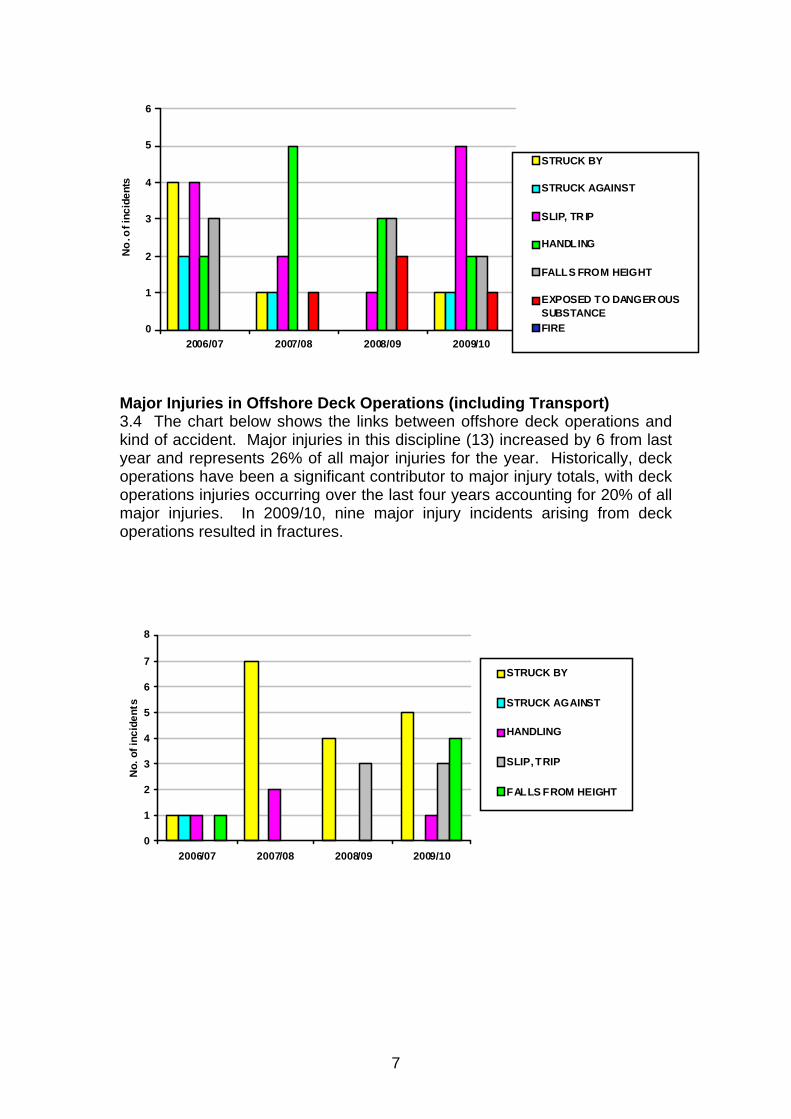
Major Injuries in Offshore Deck Operations (including Transport) 3.4 The chart below shows the links between offshore deck operations and kind of accident. Major injuries in this discipline (13) increased by 6 from last year and represents 26% of all major injuries for the year. Historically, deck operations have been a significant contributor to major injury totals, with deck operations injuries occurring over the last four years accounting for 20% of all major injuries. In 2009/10, nine major injury incidents arising from deck operations resulted in fractures.
0
1
2
3
4
5
6
7
8
2006/07 2007/08 2008/09 2009/10
No.
of i
ncid
ents
STRUCK BY
STRUCK AGAINST
HANDLING
SLIP, TRIP
FALLS FROM HEIGHT
7
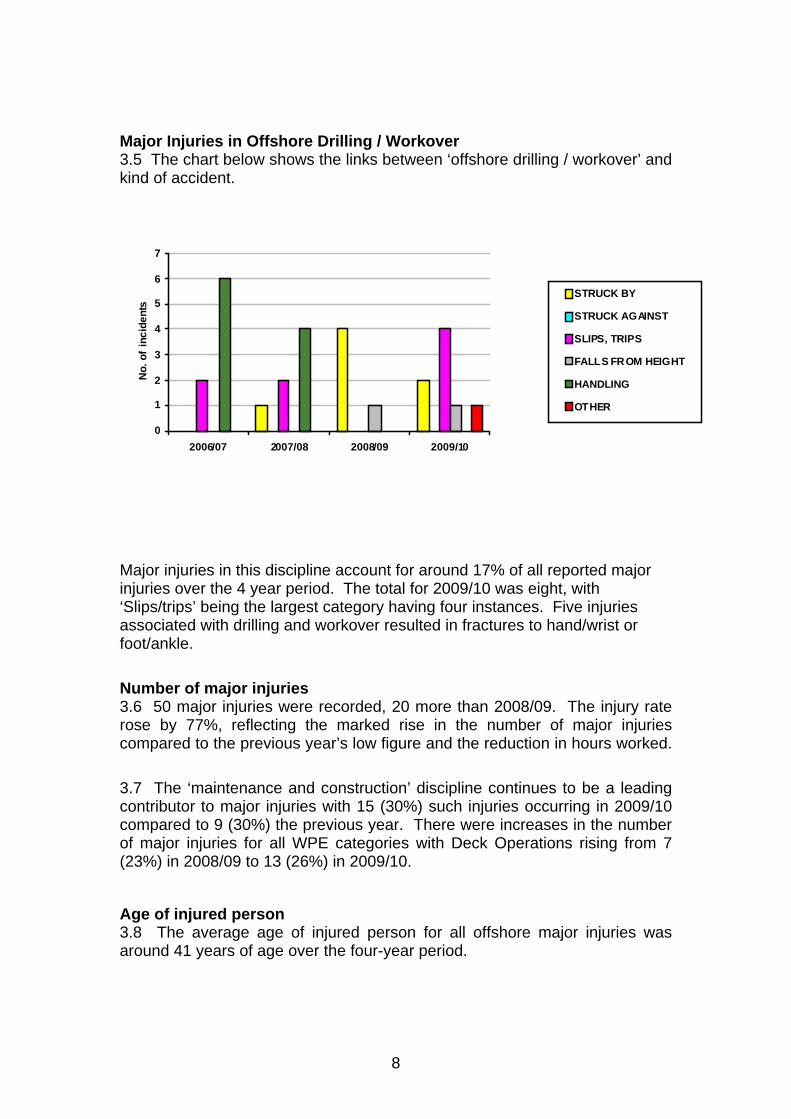
Major Injuries in Offshore Drilling / Workover 3.5 The chart below shows the links between ‘offshore drilling / workover’ and kind of accident.
0
1
2
3
4
5
6
7
2006/07 2007/08 2008/09 2009/10
No.
of
inci
dent
s
STRUCK BY
STRUCK AGAINST
SLIPS, TRIPS
FALLS FROM HEIGHT
HANDLING
OTHER
Major injuries in this discipline account for around 17% of all reported major injuries over the 4 year period. The total for 2009/10 was eight, with ‘Slips/trips’ being the largest category having four instances. Five injuries associated with drilling and workover resulted in fractures to hand/wrist or foot/ankle. Number of major injuries 3.6 50 major injuries were recorded, 20 more than 2008/09. The injury rate rose by 77%, reflecting the marked rise in the number of major injuries compared to the previous year’s low figure and the reduction in hours worked. 3.7 The ‘maintenance and construction’ discipline continues to be a leading contributor to major injuries with 15 (30%) such injuries occurring in 2009/10 compared to 9 (30%) the previous year. There were increases in the number of major injuries for all WPE categories with Deck Operations rising from 7 (23%) in 2008/09 to 13 (26%) in 2009/10. Age of injured person 3.8 The average age of injured person for all offshore major injuries was around 41 years of age over the four-year period.
8
Nature and Site of injury 3.9 ‘Fracture’ continues as the most frequently recorded single kind of major injury accounting 54% of major injuries in 2009/10. Fracture is also the highest occurring outcome of all injuries (i.e. including over-3-day injuries) with 27.5% of all injuries. The majority of fractures classed as major injuries were to the hand/wrist or foot/ankle or limbs. Amputations increased to four major injuries, all involving loss of finger parts.
Kind of Accident
3.10 The main single category for ‘kind of major accident’ during 2008/09, was ‘Slip, trip or fall on same level’ with 15 incidents (30% major injuries) followed jointly by ‘Struck by moving, including flying or falling object’ and ‘Fall from height’, each with 11 incidents (22% each of major injuries). Taken together, slips trips and falls of all types accounted for a total of 26 major injuries (52% major injuries). Other trends
3.11 Whilst the number of major injuries (50) increased in 2009/10 compared to the previous year (30), this was offset by a fall in the number of over-3-day injuries (from 140 to 110). The total number of all reportable injuries for the year is down by 10 (5.9%) compared to the previous year.
9
HYDROCARBON RELEASES (HCRs) 4.1 This section provides outline details relating to HCRs between 1998/99 and 2009/10. Fig. 12 shows the split between releases described as ‘Minor’ and those that are described as either ‘Major’ or ‘Significant’, based on severity classification definitions5 agreed with the offshore industry. 4.2 Detailed supplementary data (upon which Fig 12 is based) relating to HCRs reported under RIDDOR are voluntarily reported to HSE by offshore operators on Form OIR/12. Only those releases reported via Form OIR/12 are shown in Figure 12. 4.3 The combined number of major and significant (85) HCRs in 2009/10 was a notable increase compared to the low number (61) in the previous year and was the highest number since 2003/04. 4.4 The number of minor releases increased by 6.3% in 2009/10 (102) compared to 2008/09 (96). 4.5 Overall, the total number of releases of all severities reported on Form OIR/12 in 2009/10 (187) increased by 19.1% compared to 2008/09 (157) 4.6 Hydrocarbon gas releases accounted for 75% of all major and significant releases in 2009/10 compared to 59% the previous year. The one reported major release in 2009/10 was a gas release (defined as being greater than 300kg gas and having the potential to quickly impact outside the local area and be likely to cause a ‘Major Accident’ as defined in the Offshore Installations (Safety Case) Regulations 2005). Larger gas releases pose a significant risk of escalation to a more serious event, if ignited, due to the greater migration potential of gas clouds to other areas of an installation compared to an accumulated (pool of) liquid release. 26% of the combined total of all types of major and significant HCRs were significant gas releases greater than 25kg and 9.4% were gas releases greater than 100kg. The classification of a hydrocarbon release incident as ‘Significant’ or ‘Major’ implies the potential for that release, if ignited, to directly cause or escalate to an event severe enough to be viewed as a ‘Major Accident’. Emergency action is normally required to be taken to limit the potential consequences of ignition of a reportable leak of hydrocarbon.
5 ‘Severity Classification’ guidance for Major, Significant and Minor HCRs can be found on the HSE website at https://www.hse.gov.uk/hcr3/help/help_public.asp
10
11
Annex 1 CONTENTS Page
Table 1 Summary of injuries and dangerous occurrences April 1995 – March 2010 12
Table 2
Injury rates per 100,000 workers April 1995 – March 2010 12
Table 3 Three-year rolling average of number of injuries April 1995 – March 2010 13
Table 3a Three-year rolling average of injury rates per 100,000 workers April 1995 – March 2010 13
Table 4 Ratio of over-3-day to major injuries 1995/06 – 2009/10 14
Table 5 Severity of injury and nature of injury 2009/10 14
Table 6 Severity of injury and part of body injured 2009/10 15
Table 7 Severity of injury and kind of accident 2009/10 16
Table 8 Severity of injury and age of injured person 2009/10 17
Table 9 Severity of injury and work process environment 2009/10 17
Table 10 Severity of injury and agent of accident 2009/10 18
Table 11 Ill-health incidents April 1998 – March 2010 19
Table 12 Dangerous occurrence by type 2009/10 20
Table 12(a) Well related dangerous occurrences 2009/10 20
Figure 1 Injuries by severity April 1995 – March 2010 21
Figure 2 Combined fatal and major injury rate April 1995 – March 2010 22
Figure 3 Over-3-day injury rate April 1995 – March 2010 23
Figure 4 3-year rolling average of number of injuries April1995 – March 2010 24
Figure 4a 3-year rolling average of injury rates April 1995 – March 2010 25
Figure 5 Ratio of over-3-day to major injuries April 1995 – March 2010 26
Figure 6 & 6a Severity of injury and nature of injury 2009/10 27
Figure 7 & 7a Severity of injury and part of body 2009/10 28
Figure 8 & 8a Severity of injury and kind of accident 2009/10 29
Figure 9 & 9a Severity of injury and age of injured person 2009/10 30
Figure 10 & 10a Severity of injury and work process environment 2009/10 31
Figure 11 & 11a Severity of injury and agent of accident 2009/10 32
Figure 12 Offshore Hydrocarbon Releases 1998/99 to 2009/10 33
Figure 12(a) Well related dangerous occurrences (DO13) 2003/04 to 2009/10 34
TABLE 1 – SUMMARY OF INJURIES AND DANGEROUS OCCURRENCES APRIL 1995 – MARCH 2010
1995/
1996 96/97 97/98 98/99 1999/ 2000 00/01 01/02 02/03 03/04 04/05 05/06 06/07 07/08 08/09 09/10
Fatalities 5 2 3 1 2 3 3 0 3 0 2 2 0 0 0 Major injuries 42 44 74 74 53 53 47 64 48 48 50 39 44 30 *50(1) Total fatalities & major injuries 47 46 77 75 55 56 50 64 51 48 52 41 44 30 50(1)*
Over-3-day injuries 375 302 291 245 193 177 187 120 103 111 125 164 148 140 110(1)*
Total Injuries 422 348 368 320 248 233 237 184 154 159 177 205 192 170 160(2)* Dangerous occurrence 528 569 649 693 647 764 661 635 530 558 491 485 509 477 434
* Figure in brackets are offshore windfarm incidents included in the total
TABLE 2 – I NJURY RATES PER 100,000 WORKERS APRIL 1995 – MARCH 2010
1995/
1996 96/97 97/98 98/99 1999/ 2000 00/01 01/02 02/03 03/04 04/05 05/06 06/07 07/08 08/09 09/10
Workforce 29,003 26,853 23,000 25,500 19,000 23,330 23,206 20,619 18,793 18,940 23,072 28,176 28,132 28,224 26,598 Fatal injury rate 17.2 7.4 13.0 3.9 10.5 12.9 12.9 0 16.0 0 8.7 7.1 0 0 0
Major injury rate 144.8 163.9 321.7 290.2 278.9 227.2 202.5 310.4 255.4 253.4 216.7 138.4 156.4 106.3 188.0
Fatal + major injury rate
162.1 171.3 334.8 294.1 289.5 240.0 215.5 310.4 271.4 253.4 225.4 145.5 156.4 106.3 188.0
Over-3-day injury rate 1293 1124.6 1265.2 960.8 1015.8 758.7 805.8 582.0 548.1 586 541.8 582.1 526.1 496 413.6
12
TABLE 3 – THREE-YEAR ROLLING AVERAGE OF NUMBER OF INJURIES APRIL 1995 – MARCH 2010
1995/96 1996/97
1996/97 1998/99 1997/98 1999/00
1998/99 2000/01
1999/00 2001/02
2000/01 2002/03
2001/02 2003/04
2002/03 2004/05
2003/04 2005/06
2004/05 2006/07
2005/06 2007/08
2006/07 2008/09
2007/08 2009/10
Total fatalities + major injuries
56.7 66 69 62 53.4 56.7 55 54.3 50.3 47 45.7 38.3 41.3
Over-3-day injuries
323 279 243 205 185.7 161.3 136.7 111.3 113 133.3 145.7 150.7 132.7
TABLE 3a THREE-YEAR ROLLING AVERAGE OF INJURY RATES PER 100,000 WORKERS APRIL 1995 – MARCH 2010
1995/96
1996/971996/97 1998/99
1997/981999/00
1998/992000/01
1999/002001/02
2000/012002/03
2001/02 2003/04
2002/032004/05
2003/042005/06
2004/052006/07
2005/062007/08
2006/072008/09
2007/08 2009/10
Average workforce 26,285 25,118 22,500 22,610 21,845 22,385 20,873 19,451 20,268 23,396 26,460 28177 27651
Fatal + major injury rate
216.9 262.8 306.7 274.2 247.2 254.6 263.5 277.6 248.3 200.9 172.7 136.1 150.2
Over-3-day injury rate 1228.8 1110.8 1080.0 906.7 851.5 719.2 656.4 572.4 557.5 569.9 550.6 534.7 478.6
13
14
TABLE 4 – RATIO OF OVER-3-DAY TO MAJOR INJURIES 1995/06 – 2008/10
1995/
1996 96/97 97/98 98/99 1999/ 2000 00/01 01/02 02/03 03/04 04/05 05/06 06/07 07/08 08/09 09/10
MAJOR 42 44 74 74 53 53 47 64 48 48 50 39 44 30 50 OVER-3-DAY 375 302 291 245 193 177 187 120 103 111 125 164 148 140 110 Ratio 8.9 6.9 3.9 3.3 3.6 3.3 4 1.9 2.14 2.31 2.5 4.2 3.36 4.67 2.2
TABLE 5 – SEVERITY OF INJURY AND NATURE OF INJURY
2009/10
SEVERITY OF INJURY NATURE OF INJURY FATAL MAJOR OVER-3-DAY ALL INJURIES
Amputation 4 0 4 Contusion 3 18 21 Dislocation 5 0 5 Fracture 27 17 44 Laceration & open wound 2 22 24 Injuries of more than one of the other natures 2 4 6
Injuries not classified elsewhere 5 5 10
Sprains & strains 0 40 40 Superficial injury 1 1 2 Burn 1 3 4
Total 0 50 110 160
15
TABLE 6 – SEVERITY OF INJURY AND PART OF BODY INJURED 2009/10
SEVERITY OF INJURY
SITE OF INJURY FATAL MAJOR OVER-3-DAY
ALL INJURIES
Eye 1 2 3 Other parts of face 0 2 2 Head excluding face 4 0 4 Several locations of head 0 0 0
TOTAL: HEAD 0 5 4 9
Neck 0 1 1 Back 3 12 15 Trunk 2 3 5 Several locations of torso 1 0 1
TOTAL: TORSO 0 6 16 22
One or more finger(s) or thumb(s) 5 44 49
Hand 4 5 9 Wrist 5 1 6 Rest of upper limb 8 4 12 Several locations of upper limb 0 1 1
TOTAL: UPPER LIMB 0 22 55 77
One or more toes 0 2 2 Foot 6 4 10 Ankle 3 15 18 Rest of lower limb 2 11 13 Several locations of lower limb 0 0 0
TOTAL: LOWER LIMB 0 11 32 43
Several locations 2 3 5 General locations 4 0 4 Unspecified locations 0 0 0
GRAND TOTAL 0 50 110 160
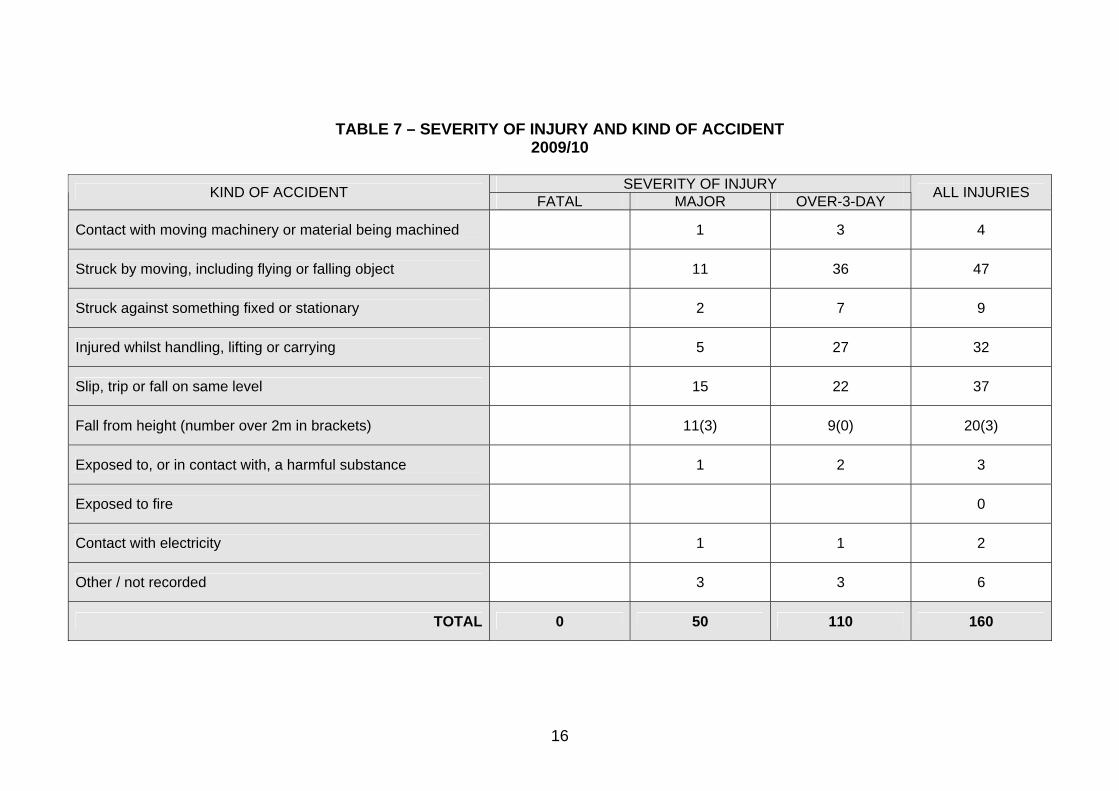
TABLE 7 – SEVERITY OF INJURY AND KIND OF ACCIDENT 2009/10
SEVERITY OF INJURY KIND OF ACCIDENT FATAL MAJOR OVER-3-DAY ALL INJURIES
Contact with moving machinery or material being machined 1 3 4
Struck by moving, including flying or falling object 11 36 47
Struck against something fixed or stationary 2 7 9
Injured whilst handling, lifting or carrying 5 27 32
Slip, trip or fall on same level 15 22 37
Fall from height (number over 2m in brackets) 11(3) 9(0) 20(3)
Exposed to, or in contact with, a harmful substance 1 2 3
Exposed to fire 0
Contact with electricity 1 1 2
Other / not recorded 3 3 6
TOTAL 0 50 110 160
16
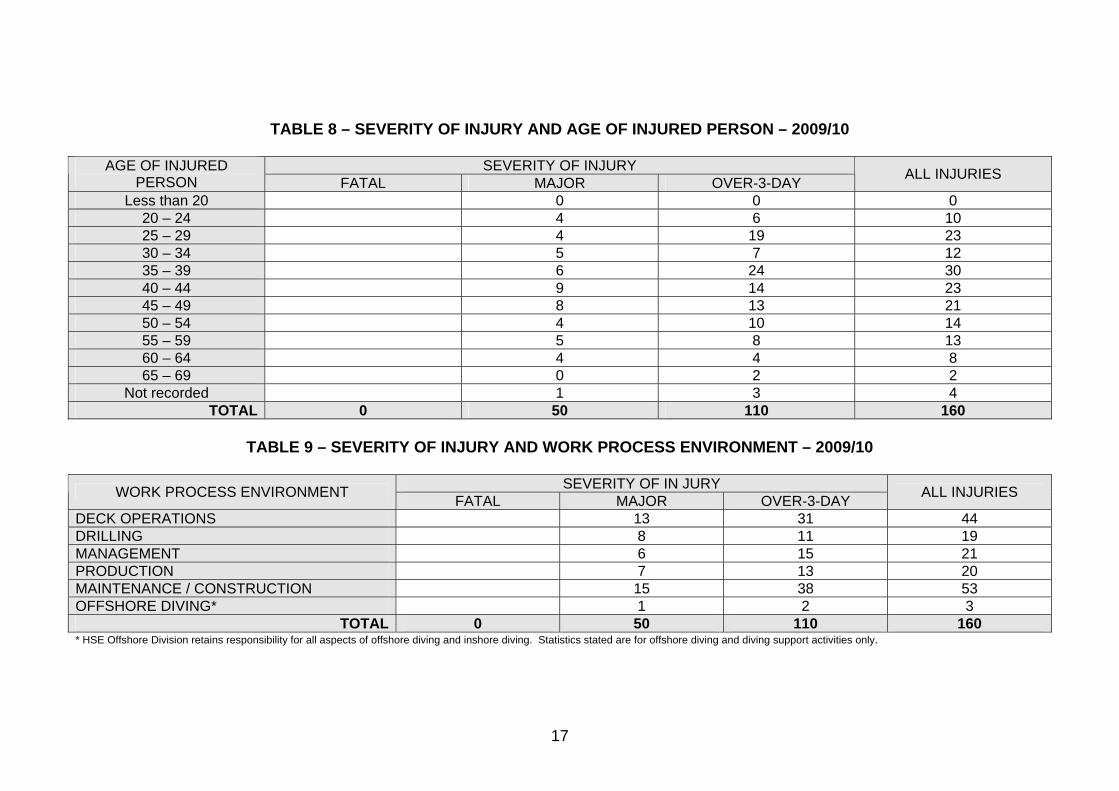
TABLE 8 – SEVERITY OF INJURY AND AGE OF INJURED PERSON – 2009/10
SEVERITY OF INJURY AGE OF INJURED PERSON FATAL MAJOR OVER-3-DAY ALL INJURIES
Less than 20 0 0 0 20 – 24 4 6 10 25 – 29 4 19 23 30 – 34 5 7 12 35 – 39 6 24 30 40 – 44 9 14 23 45 – 49 8 13 21 50 – 54 4 10 14 55 – 59 5 8 13 60 – 64 4 4 8 65 – 69 0 2 2
Not recorded 1 3 4 TOTAL 0 50 110 160
TABLE 9 – SEVERITY OF INJURY AND WORK PROCESS ENVIRONMENT – 2009/10
SEVERITY OF IN JURY WORK PROCESS ENVIRONMENT FATAL MAJOR OVER-3-DAY ALL INJURIES
DECK OPERATIONS 13 31 44 DRILLING 8 11 19MANAGEMENT 6 15 21PRODUCTION 7 13 20MAINTENANCE / CONSTRUCTION 15 38 53 OFFSHORE DIVING* 1 2 3
TOTAL 0 50 110 160 * HSE Offshore Division retains responsibility for all aspects of offshore diving and inshore diving. Statistics stated are for offshore diving and diving support activities only.
17
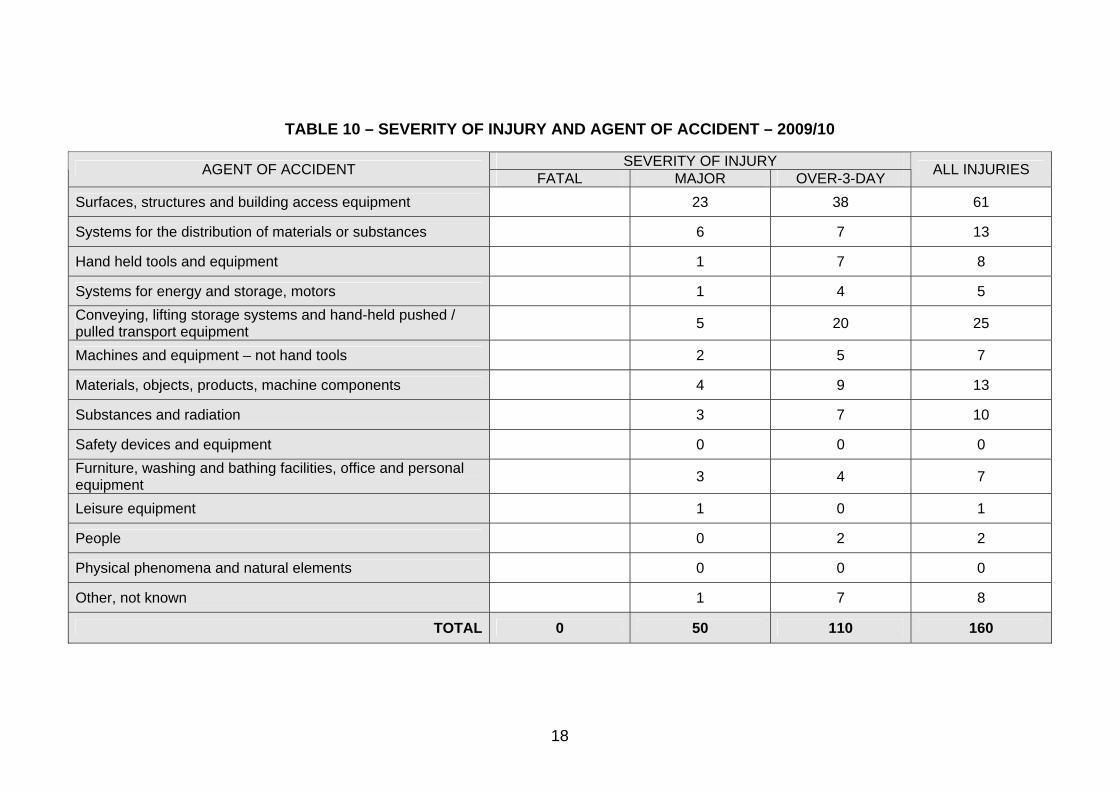
TABLE 10 – SEVERITY OF INJURY AND AGENT OF ACCIDENT – 2009/10
SEVERITY OF INJURY AGENT OF ACCIDENT FATAL MAJOR OVER-3-DAY ALL INJURIES
Surfaces, structures and building access equipment 23 38 61
Systems for the distribution of materials or substances 6 7 13
Hand held tools and equipment 1 7 8
Systems for energy and storage, motors 1 4 5 Conveying, lifting storage systems and hand-held pushed / pulled transport equipment 5 20 25
Machines and equipment – not hand tools 2 5 7
Materials, objects, products, machine components 4 9 13
Substances and radiation 3 7 10
Safety devices and equipment 0 0 0 Furniture, washing and bathing facilities, office and personal equipment 3 4 7
Leisure equipment 1 0 1
People 0 2 2
Physical phenomena and natural elements 0 0 0
Other, not known 1 7 8
TOTAL 0 50 110 160
18
19
TABLE 11 – ILL HEALTH INCIDENTS APRIL 1998 – MARCH 2010
DESCRIPTION 1998/99 1999/00 2000/01 2001/02 2002/03 2003/04 2004/05 2005/06 2006/07 2007/08 2008/09 2009/10 TOTAL Decompression illness 3 2 1 5 4 1 2 8 2 1 29
Barotrauma 1 1 1 3 Cramp repetitive
1 1 2
Beat knee 1 1 1 3 Inflamation of tendons 1 1 1 2 1 6
Hand-arm vibration 1 2 4 3 10
Occupational dermatitis 4 2 5 2 1 3 17
Chickenpox 6 7 10 6 13 6 8 6 9 4 7 4 86 Food poisoning 1* 1 3 2** 1 8 Malaria 1 1 Meningitis 1 1 1 3 Rubella 1 1 2 Mumps 1 1 6 1 1 10 Scarlet fever 1 1 Measles 1 1 Legionellosis 1 1
TOTAL 16 15 20 131 19 13 11 18 21 6 21 10 183 * This incident resulted in twelve people being affected ** One incident involved 21 workers, the other incident affected 16 workers
20
TABLE 12 – DANGEROUS OCCURRENCES BY TYPE 2009/10
TYPE DESCRIPTION NUMBER
01 Failure of lifting machinery etc. 38 02 Failure of pressure systems. 1 05 Electrical short circuit or overload. 13 08 Radiation. 5 09 Malfunction of breathing apparatus. 4 10 Diving operations. 15 11 Collapse of scaffolding. 0 13 Well operations. (See Table 12(a)) 24* 14 Pipelines and pipeline works. 0 73 Release of hydrocarbon. 187 74 Fire or explosion other than hydrocarbon. 28 75 Release or escape of a dangerous substance other than
hydrocarbon. 9
76 Collapses. 0 77 • Failure of equipment required to maintain a floating
installation on station. • Objects dropped on an installation, attendant vessel or
into water. • Weather damage.
102
78 Collision between a vessel or aircraft and an installation. 5 79 Possible collision offshore. 0 80 Subsidence or collapse of seabed. 1 81 Loss of stability or buoyancy. 1 82 Evacuation of an installation. 1 83 Falls into water. 0
TOTAL 434 * Excludes one well incident that occurred in the Falkland Islands. HSE currently acts on behalf of the Falkland Islands Government in the regulation of offshore activities in island waters.
Table 12(a) - WELL RELATED DANGEROUS OCCURRENCES 2009/10
TYPE DESCRIPTION NUMBER13(a) Blowout (Uncontrolled flow from a well) 0 13(b) BOP / Diverter operation to control flow 17 13(c) Unanticipated H2S released 3 13(d) Precautionary measures following failure to maintain
minimum separation between wells 0
13(e) Mechanical failure of a Safety Critical Element (SCE) of a well
4(7)**
Total 24(27) ** Figure in brackets comprises events under 13(e) plus additional events that relate to failure of a SCE of a well that resulted in a hydrocarbon release. Additional events were reported as dangerous occurrence (DO) type 73 and are included in Table 12 under this category.
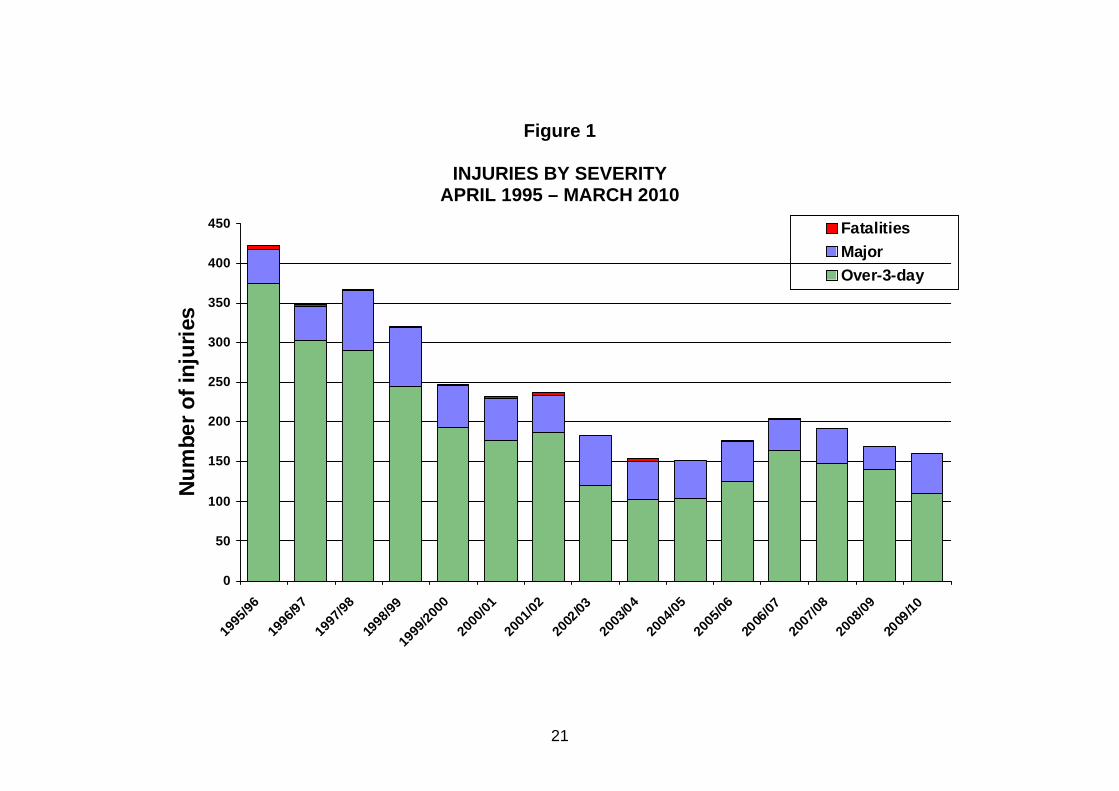
Figure 1
INJURIES BY SEVERITY APRIL 1995 – MARCH 2010
0
50
100
150
200
250
300
350
400
450
1995
/9619
96/97
1997
/9819
98/99
1999
/2000
2000
/0120
01/02
2002
/0320
03/04
2004
/0520
05/06
2006
/0720
07/08
2008
/0920
09/10
Num
ber o
f inj
urie
s
FatalitiesMajorOver-3-day
21
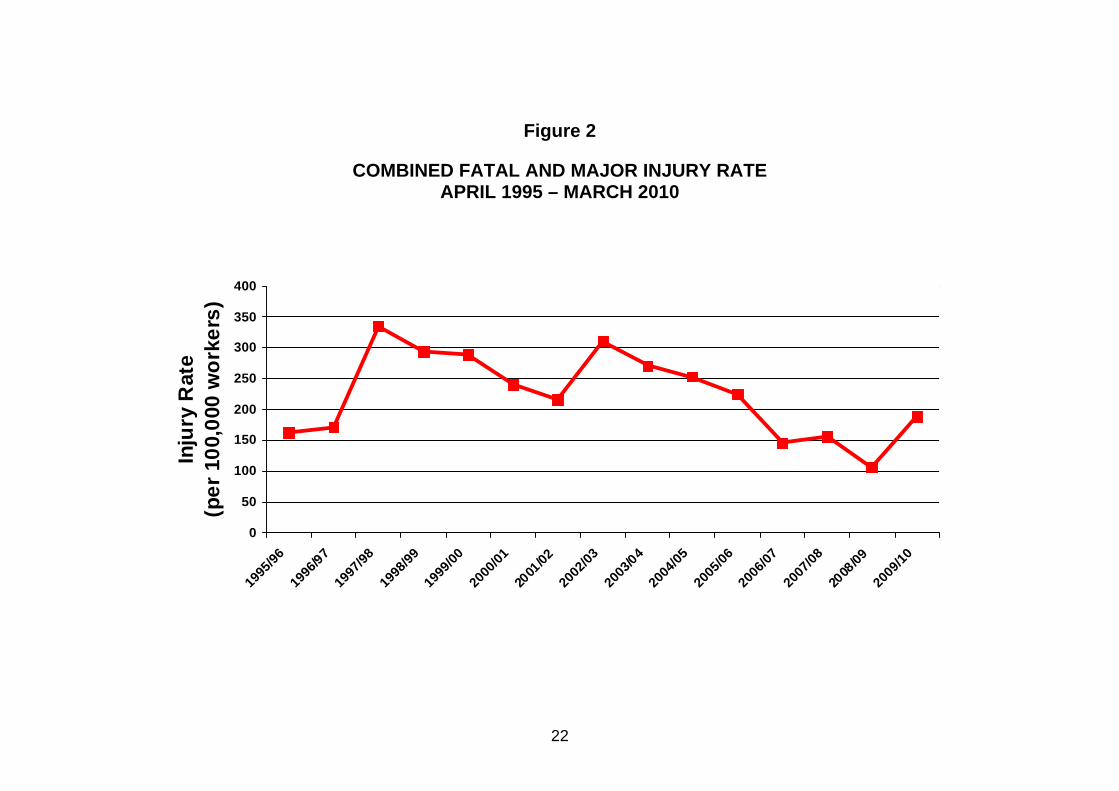
Figure 2
COMBINED FATAL AND MAJOR INJURY RATE APRIL 1995 – MARCH 2010
0
50
100
150
200
250
300
350
400
1995
/9619
96/97
1997
/9819
98/99
1999
/0020
00/01
2001
/0220
02/03
2003
/0420
04/05
2005
/0620
06/07
2007
/0820
08/09
2009
/10In
jury
Rat
e(p
er 1
00,0
00 w
orke
rs)
22
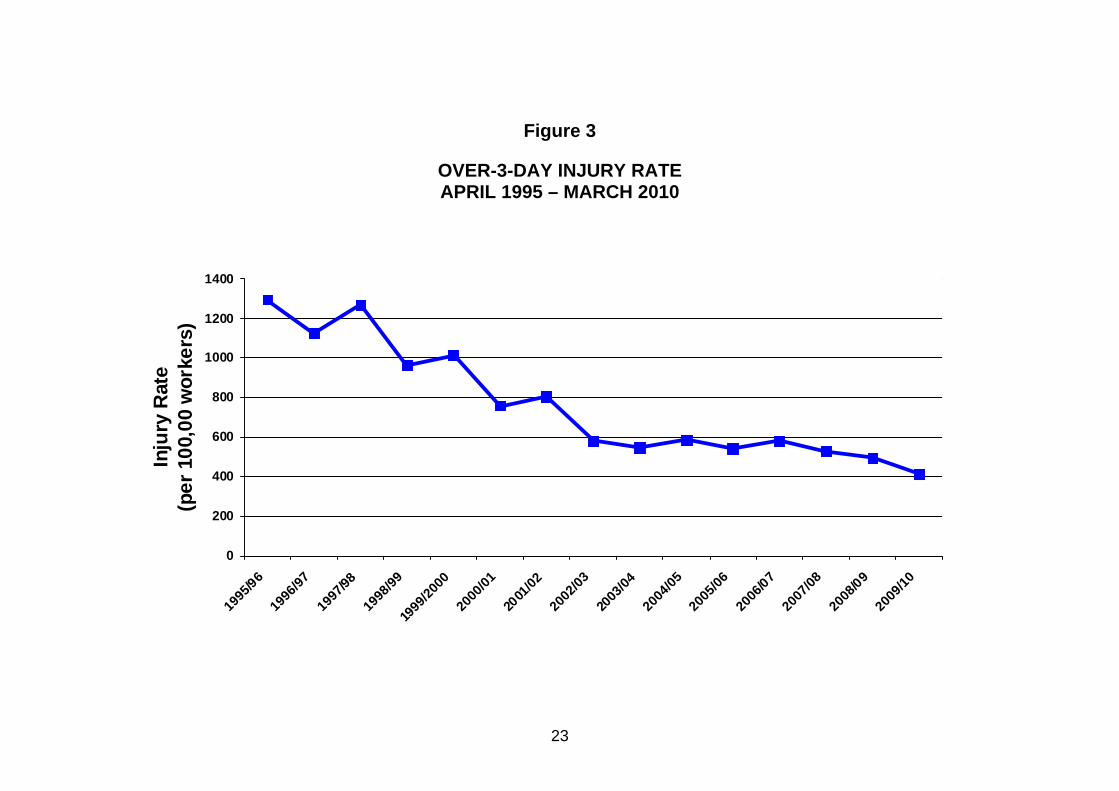
Figure 3
OVER-3-DAY INJURY RATE APRIL 1995 – MARCH 2010
0
200
400
600
800
1000
1200
1400
1995
/9619
96/97
1997
/9819
98/99
1999
/2000
2000
/0120
01/02
2002
/0320
03/04
2004
/0520
05/06
2006
/0720
07/08
2008
/0920
09/10
Inju
ry R
ate
(per
100
,00
wor
kers
)
23
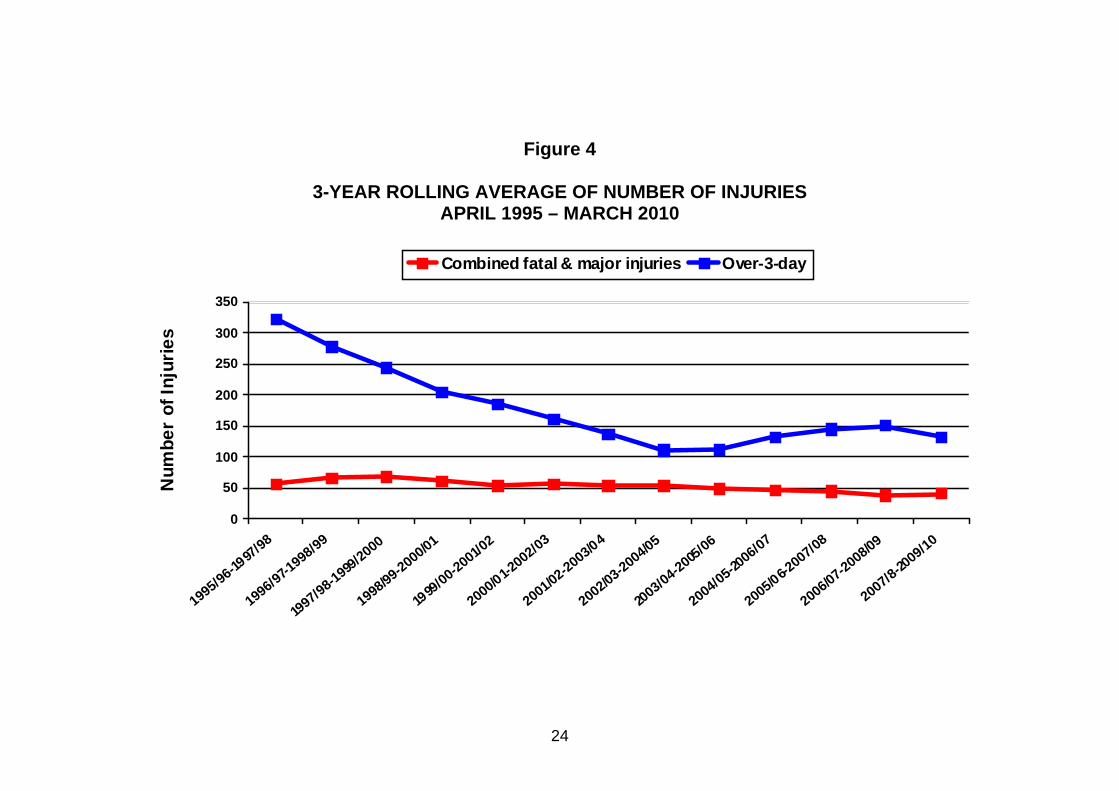
Figure 4
3-YEAR ROLLING AVERAGE OF NUMBER OF INJURIES
APRIL 1995 – MARCH 2010
0
50
100
150
200
250
300
350
1995/96-1997/98
1996/97-1998/99
1997/98-1999/2000
1998/99-2000/01
1999/00-2001/0
2
2000/01-2002/03
2001/02-2003/04
2002/03-2004/05
2003/04-2005/06
2004/05-2006/07
2005/06-2007/08
2006/07-2008/09
2007/8-2009/10
Num
ber
of In
jurie
s
Combined fatal & major injuries Over-3-day
24
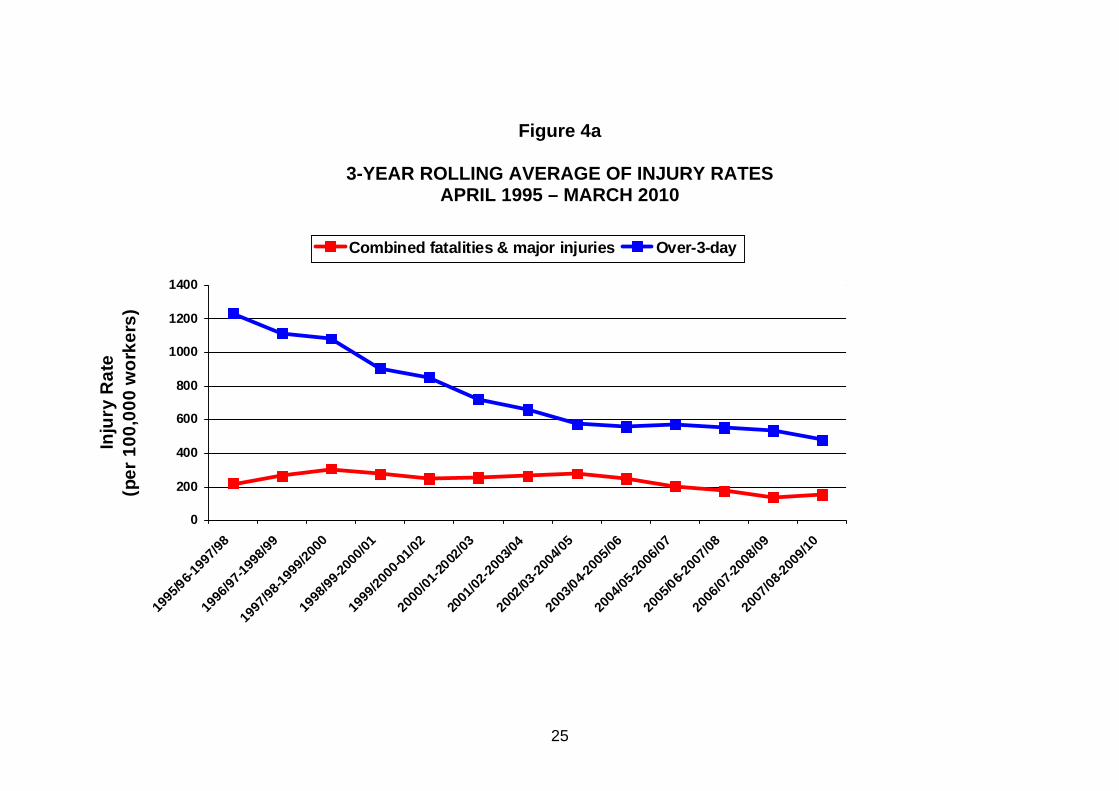
Figure 4a
3-YEAR ROLLING AVERAGE OF INJURY RATES APRIL 1995 – MARCH 2010
0
200
400
600
800
1000
1200
1400
1995
/96-199
7/98
1996
/97-19
98/99
1997
/98-19
99/20
0019
98/99
-2000
/0119
99/20
00-01
/0220
00/01
-2002
/0320
01/02
-2003
/0420
02/03
-2004
/0520
03/04-2
005/0
620
04/05
-2006
/0720
05/06-2
007/0
820
06/07
-2008
/0920
07/08
-2009
/10
Inju
ry R
ate
(per
100
,000
wor
kers
)
Combined fatalities & major injuries Over-3-day
25
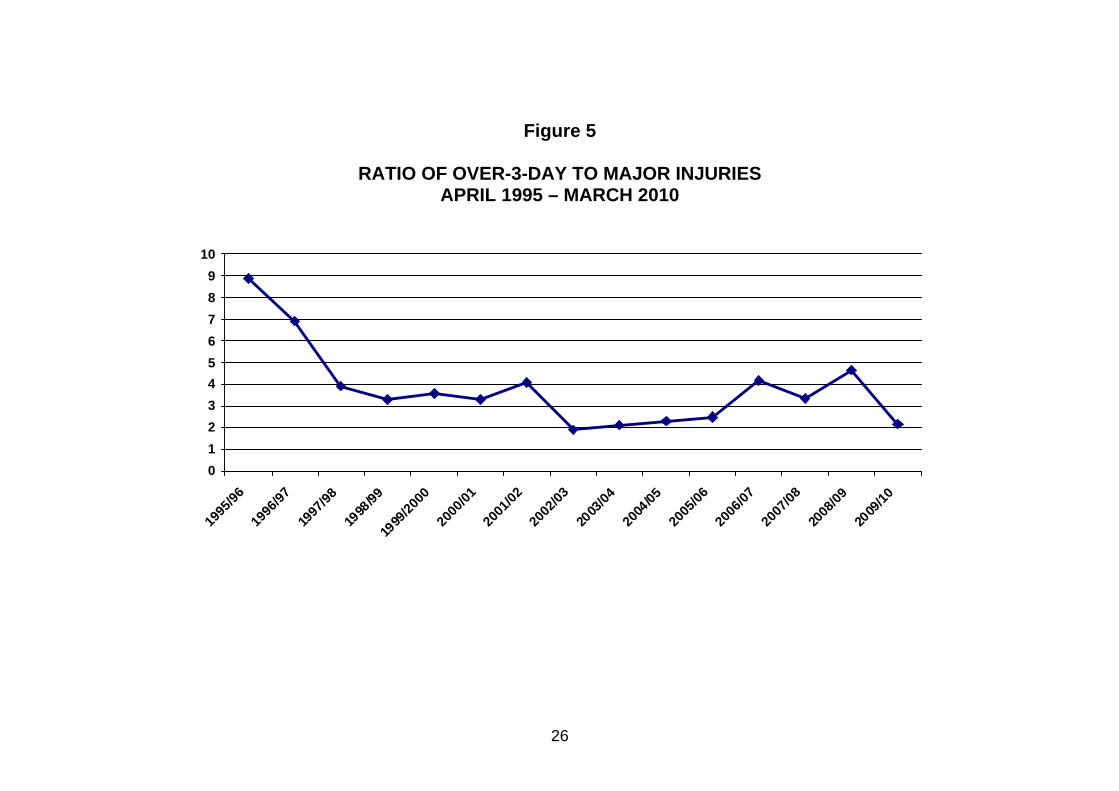
Figure 5
RATIO OF OVER-3-DAY TO MAJOR INJURIES APRIL 1995 – MARCH 2010
0123456789
10
1995
/9619
96/97
1997
/9819
98/99
1999
/2000
2000
/0120
01/02
2002
/0320
03/04
2004
/0520
05/06
2006
/0720
07/08
2008
/0920
09/10
26
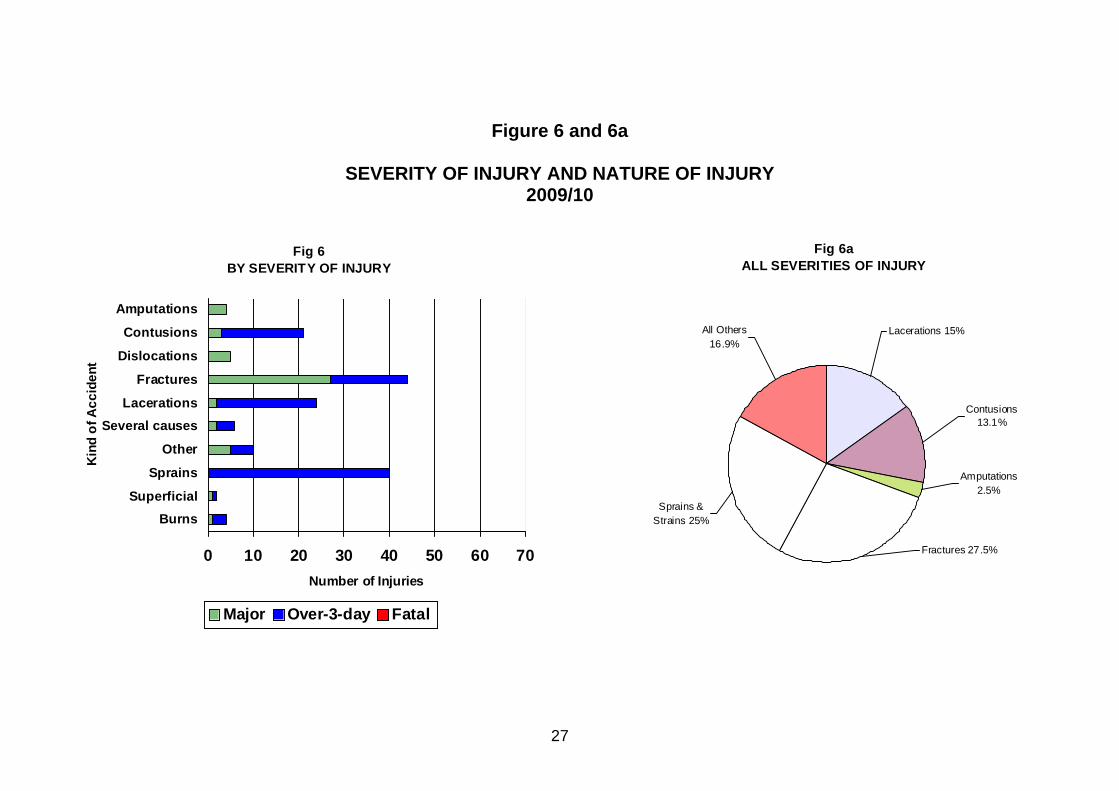
Figure 6 and 6a
SEVERITY OF INJURY AND NATURE OF INJURY 2009/10
Fig 6a
ALL SEVERITIES OF INJURY
Fractures 27.5%
Amputations 2.5%
Contusions 13.1%
Sprains & Strains 25%
All Others 16.9%
Lacerations 15%
Fig 6BY SEVERITY OF INJURY
0 10 20 30 40 50 60 70
BurnsSuperficial
Sprains
Other
Several causesLacerations
Fractures
Dislocations
Contusions
Amputations
Kin
d of
Acc
iden
t
Number of Injuries
Major Over-3-day Fatal
27
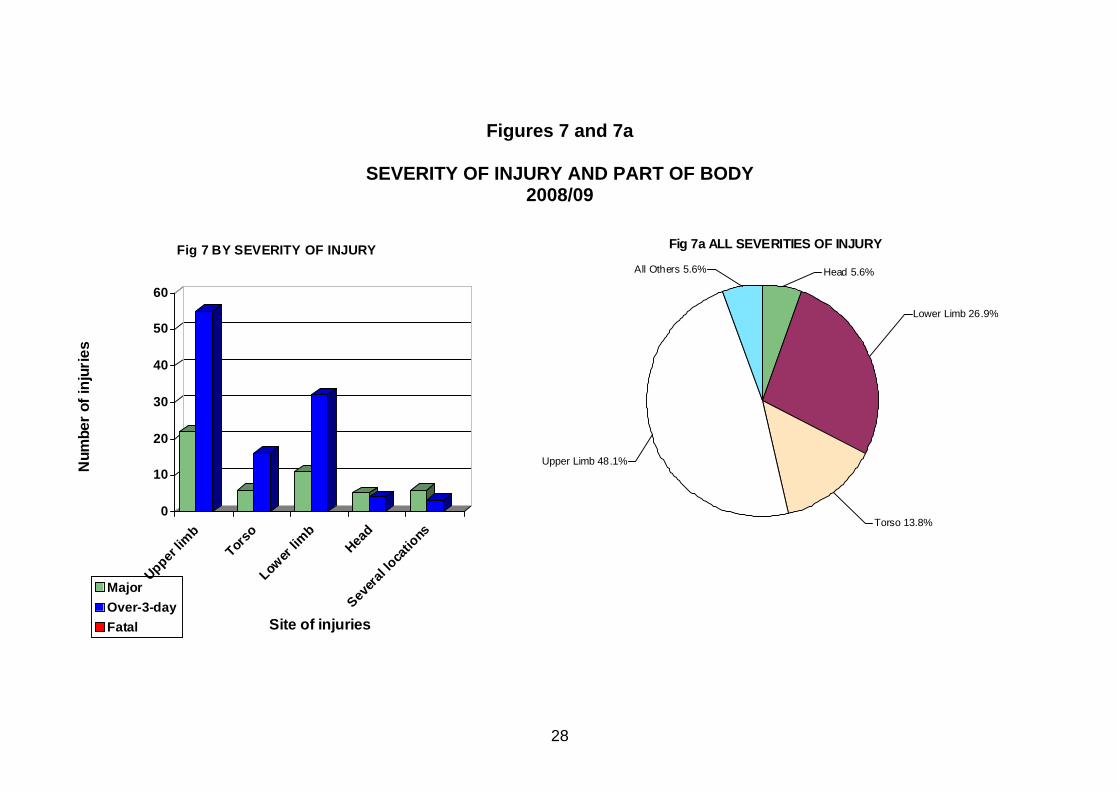
Figures 7 and 7a
SEVERITY OF INJURY AND PART OF BODY 2008/09
0
10
20
30
40
50
60
Num
ber o
f inj
urie
s
Upper lim
b
Torso
Lower
limb
Head
Severa
l loca
tions
Site of injuries
Fig 7 BY SEVERITY OF INJURY
MajorOver-3-dayFatal
Fig 7a ALL SEVERITIES OF INJURY
Head 5.6%All Others 5.6%
Upper Limb 48.1%
Torso 13.8%
Lower Limb 26.9%
28
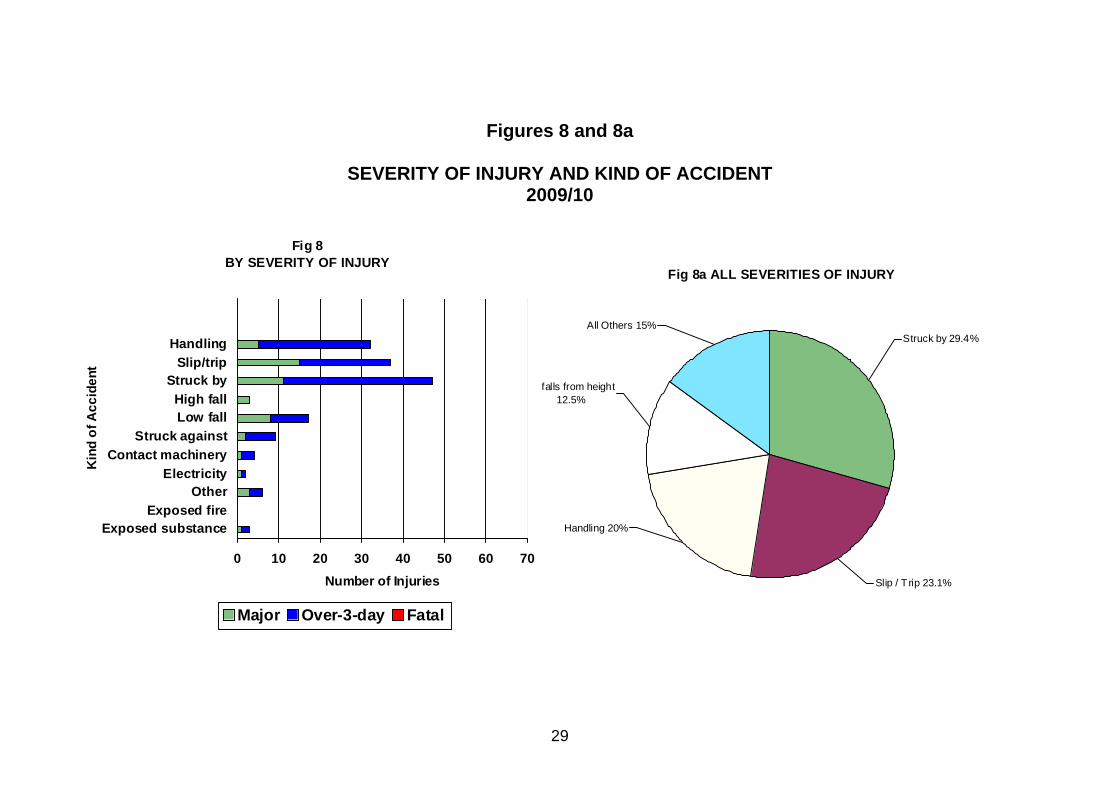
Figures 8 and 8a
SEVERITY OF INJURY AND KIND OF ACCIDENT 2009/10
Fig 8
BY SEVERITY OF INJURY
0 10 20 30 40 50 60 70
Exposed substanceExposed fire
OtherElectricity
Contact machineryStruck against
Low fallHigh fall
Struck bySlip/trip
Handling
Kin
d of
Acc
iden
t
Number of Injuries
Major Over-3-day Fatal
Fig 8a ALL SEVERITIES OF INJURY
Slip / T rip 23.1%
Handling 20%
falls from height 12.5%
All Others 15%Struck by 29.4%
29
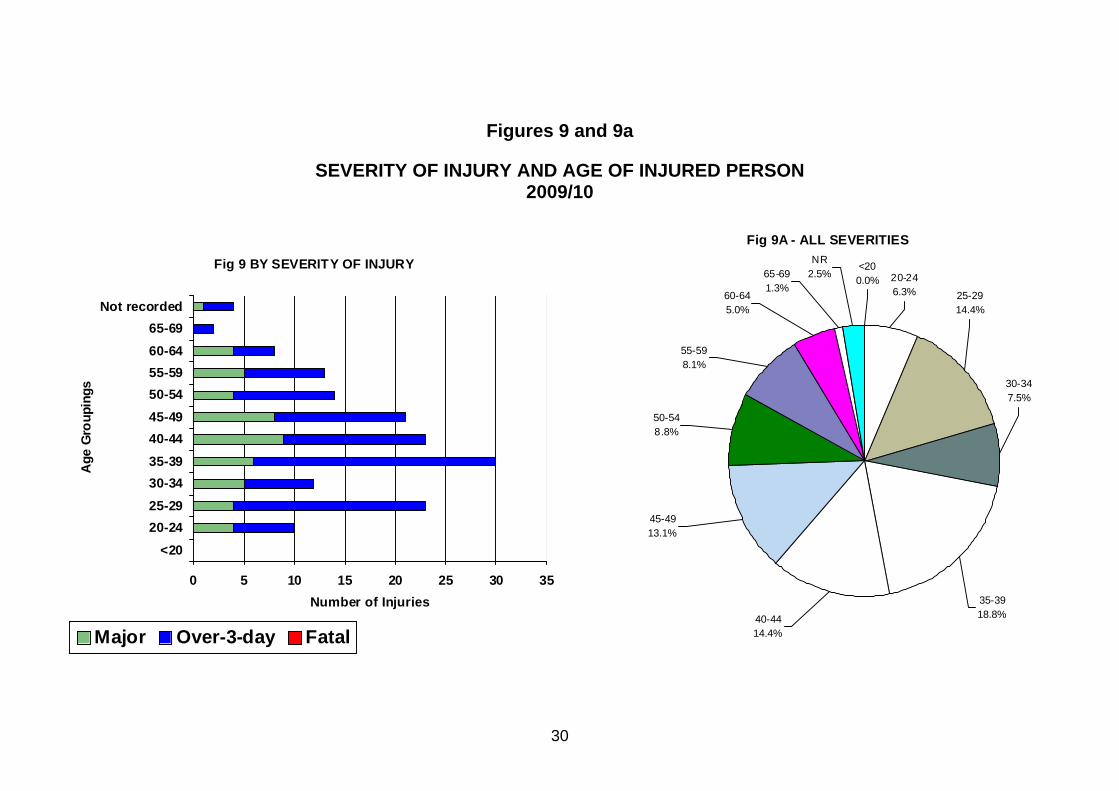
Figures 9 and 9a
SEVERITY OF INJURY AND AGE OF INJURED PERSON 2009/10
Fig 9A - ALL SEVERITIES
30-347.5%
25-2914.4%
35-3918.8%40-44
14.4%
45-4913.1%
50-548.8%
<200.0% 20-24
6.3%
NR2.5%65-69
1.3%
55-598.1%
60-645.0%
Fig 9 BY SEVERITY OF INJURY
0 5 10 15 20 25 30 35
<2020-2425-2930-3435-3940-4445-4950-5455-5960-6465-69
Not recorded
Age
Gro
upin
gs
Number of Injuries
Major Over-3-day Fatal
30
Figures 10 and 10a
SEVERITY OF INJURY AND WORK PROCESS ENVIRONMENT 2009/10
Fig 10SEVERITY OF INJURY
0 10 20 30 40 50 60 70
Production
Management
Drilling
Deck
Maint. / Const.
Dive
Wor
k Pr
oces
s En
v.
Number of Injuries
Major Over-3-day Fatal
Fig 8a ALL SEVERITIES OF INJURY
Deck 27.5%
Maint. / Const. 33.1%
Dive 1.9%
Drilling 11.9%
Management 13.1%
Production 12.5%
31

Figures 11 and 11a SEVERITY OF INJURY AND AGENT OF ACCIDENT
2009/10 Fig 11
BY SEVERITY OF INJURY
0 10 20 30 40
Systems f or energy etcSafety Devices
Machines not hand heldFurniture
M ater ials/ObjectsSubstances/radiation
Hand held tools
PeopleMaterials/Distr ibution systems
Conveying/lifting syst emsSurfaces
Leisure equipmentPhysical phenomena
Other /not known
Agen
t of A
ccid
ent
Number of Injuries
Major Over-3-day Fatal
Fig 11a ALL SEVERITIES OF INJURY
Hand Held Tools 5%
Conveying / lifting systems
15.6%Distr ibution
systems 8.1%
Machines / equipment 4.4%
Materials / Objects 8.1%
Surf aces 38.1%
All Other 20.7%
32
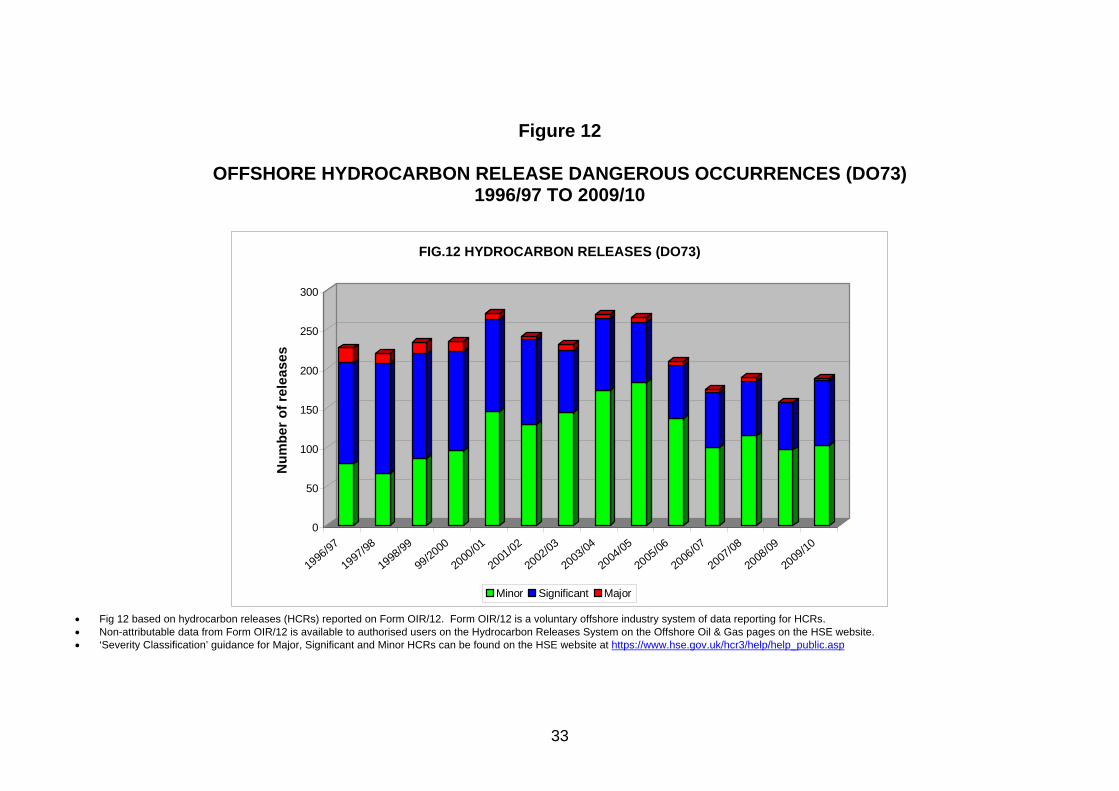
Figure 12
OFFSHORE HYDROCARBON RELEASE DANGEROUS OCCURRENCES (DO73) 1996/97 TO 2009/10
0
50
100
150
200
250
300N
umbe
r of r
elea
ses
1996
/97
1997/98
1998/99
99/20
00
2000
/01
2001
/02
2002/03
2003/04
2004
/05
2005
/06
2006/07
2007/08
2008
/09
2009
/10
FIG.12 HYDROCARBON RELEASES (DO73)
Minor Significant Major
• Fig 12 based on hydrocarbon releases (HCRs) reported on Form OIR/12. Form OIR/12 is a voluntary offshore industry system of data reporting for HCRs. • Non-attributable data from Form OIR/12 is available to authorised users on the Hydrocarbon Releases System on the Offshore Oil & Gas pages on the HSE website. • ‘Severity Classification’ guidance for Major, Significant and Minor HCRs can be found on the HSE website at https://www.hse.gov.uk/hcr3/help/help_public.asp
33
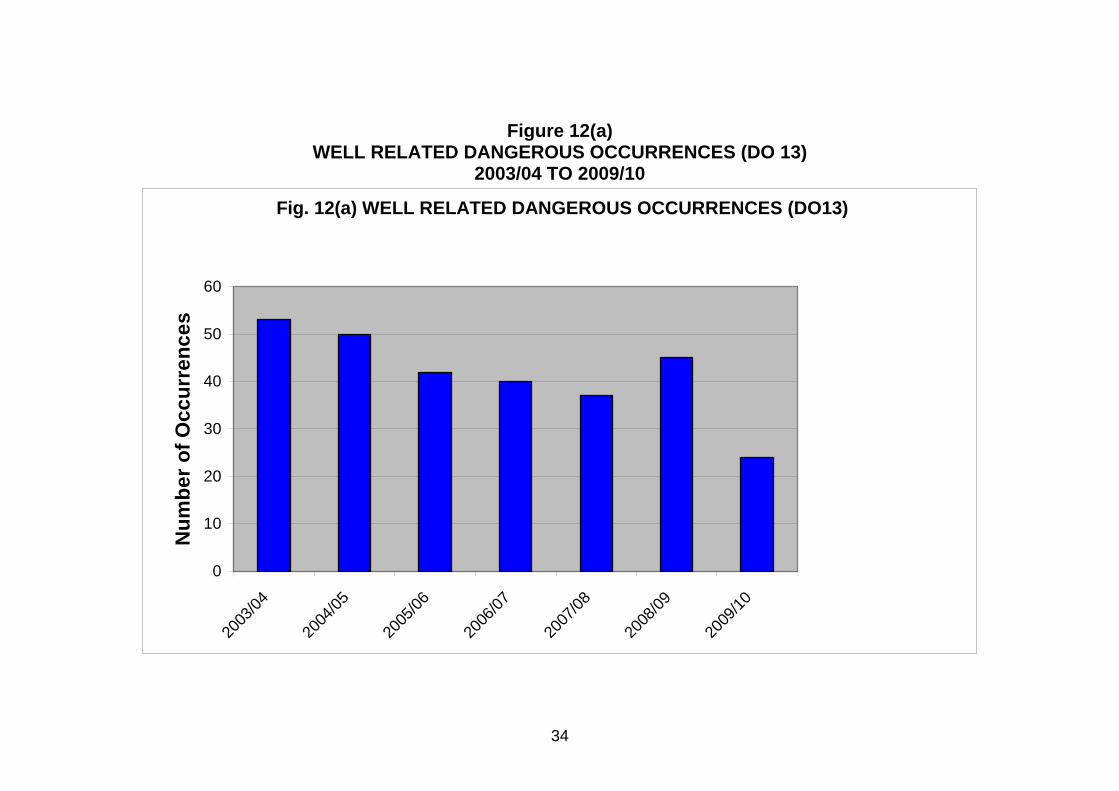
Figure 12(a) WELL RELATED DANGEROUS OCCURRENCES (DO 13)
2003/04 TO 2009/10
Fig. 12(a) WELL RELATED DANGEROUS OCCURRENCES (DO13)
0
10
20
30
40
50
60
2003
/04
2004
/05
2005
/06
2006
/07
2007
/08
2008
/09
2009
/10
Num
ber o
f Occ
urre
nces
34