Embed Size (px)
Citation preview
Journal of Hydrology (2007) 335, 389–405
ava i lab le a t www.sc iencedi rec t . com
journal homepage: www.elsevier .com/ locate / jhydrol
Okavango Delta Islands: Interaction betweendensity-driven flow and geochemical reactions underevapo-concentration
Peter Bauer-Gottwein a,*, Thomas Langer b, Henning Prommer c,Piotr Wolski d, Wolfgang Kinzelbach e
a Institute of Environment and Resources, Technical University of Denmark, Kgs. Lyngby, Denmarkb Geoklock Consultoria e Engenharia Ambiental, Sao Paulo, Brazilc CSIRO Land and Water, Wembley, Australiad Okavango Research Centre, University of Botswana, Maun, Botswanae Institute of Environmental Engineering, ETH Zurich, Switzerland
Received 1 June 2006; received in revised form 9 December 2006; accepted 14 December 2006
00do
*
la(Hba
KEYWORDSOkavango Delta;Density flow;Geochemistry;Evapotranspiration;Evapo-concentration
22-1694/$ - see front mattei:10.1016/j.jhydrol.2006.12
Corresponding author.E-mail addresses: pbg@er.
[email protected] (T.. Prommer), [email protected] (W. Kinzelbach)
r ª 200.010
dtu.dk (Langer),ub.bw (.
Summary This paper studies the interactions of density driven flow and geochemicalreactions under evapo-concentration. A numerical model that couples the relevant flow,transport and chemical processes was used to analyze density-driven flow on islands inthe Okavango Delta, Botswana. Evapo-concentration on the islands leads to steadilyincreasing solute concentrations until the onset of density-driven flow against the evapo-ration-induced upward flow. The modelling results suggest that lag times to the onset ofdensity-driven flow are strongly influenced by geochemical reactions. Mineral precipitationand carbon dioxide de-gassing increase the lag time. Carbon dioxide de-gassing is enhancedif humic substances are present at elevated concentrations. Simulation results were shownto be most sensitive to the longitudinal dispersivity. Modelling results are compared to fieldobservations from three islands in the Okavango Delta. A semi-quantitative correspon-dence between modelled and observed concentration patterns is established for the majorchemical constituents.ª 2006 Elsevier B.V. All rights reserved.
6 Elsevier B.V. All rights reserved
P. Bauer-Gottwein), [email protected]
P. Wolski), kinzelbach@ifu.
Introduction
Salt accumulation in surface waters, soils and groundwateris a common phenomenon in systems where the evapotrans-piration rate exceeds the precipitation rate. Examples of
.
390 P. Bauer-Gottwein et al.
such systems include closed-basin lakes, irrigated soils andshallow groundwater systems. Salt accumulation underclosed basin evaporation has been studied, among others,by Eugster and Jones (1979), Herczeg and Lyons (1991)and Yan et al. (2002). Salt accumulation in soils is one ofthe most serious global environmental problems. Through-out the semi-arid regions, soil salinization threatens agricul-tural productivity and food security (De Nys et al., 2005;Hendry and Buckland, 1990; Hendry et al., 1990; Kotbet al., 2000). Salt accumulation in shallow groundwater sys-tems can be observed in many semi-arid and arid regions. Aprominent example is the Okavango Delta in Botswana(Bauer et al., 2006a,b; Gieske, 1996; McCarthy and Ellery,1994; Zimmermann et al., 2006).
The hydrological process causing the accumulation ofsalts in these systems is evapotranspiration (ET). Evapo-transpiration is the sum of evaporation and transpirationby plants. Evaporation increases the concentrations of dis-solved solids in the residual water body, as water is removedand dissolved solids are left behind. Magnifying this effect,transpiration leads to an additional increase of total dis-solved solids (TDS), since plants selectively take up specificions and exclude others (e.g. Silberbush and Ben-Asher,2001). TDS accumulation due to evapotranspiration – whichwill be referred to as evapo-concentration in the remainderof this paper – can eventually lead to highly concentratedaqueous solutions in surface water bodies, soil water andshallow groundwater.
As evapo-concentration proceeds, two mechanisms be-come increasingly important: density-driven flow and geo-chemical reaction. The density of water is a function ofthe concentration of the various dissolved componentsand generally rises with increasing TDS. For moderate salin-ity ranges, a linear relationship between TDS and waterdensity is generally applied (Guo and Langevin, 2002). Formore accurate estimates of water density as a functionof the chemical composition, the concentrations of individ-ual aqueous components have to be taken into account(Monnin, 1994). Since most of the water is removed atthe surface, evapo-concentration leads to a hydrodynami-cally unstable concentration distribution with water ofhigher density being located on top of lower-density water.This may initiate density driven flow and therefore a down-ward transport of salinity against the upward flow estab-lished by evapotranspiration. The onset of density drivenflow occurs if the controlling Rayleigh number exceeds acritical value of about 7 (Simmons and Narayan, 1998;Wooding, 1960; Wooding et al., 1997a,b; Zimmermannet al., 2006).
Evapo-concentration can trigger a number of geochemi-cal reactions, most importantly mineral precipitation andde-gassing of carbon dioxide. These reactions remove partsof the dissolved solids from the solution and thus slow downthe rate of evapo-concentration. Depending on the initialcomposition of the water and the rate of evapo-concentra-tion, minerals will precipitate simultaneously and/or suc-cessively, with more soluble minerals precipitating at alater stage of evapo-concentration. In shallow groundwatersettings, the system is open with respect to gas exchangewith the atmosphere, and loss of carbon dioxide to theatmosphere leads to mass removal from the solution. Asan additional complication, natural waters contain
complexing agents in the form of humic substances (Tippingand Hurley, 1992). Since humic substances form complexeswith various metal ions, they will delay the precipitation ofminerals containing those metal ions. On the other hand,humic substances may lead to an increased carbon dioxideloss from carbonate-dominated waters under evapo-concen-tration, because they stabilize the pH value of the waterdue to their buffering capacity. This implies that more ofthe excess carbon accumulated by evapo-concentration es-capes to the gas phase compared to an unbuffered systemwhere the pH increases rapidly under evapo-concentration.During evapo-concentration in shallow groundwater sys-tems, a complex interplay of physical and chemical pro-cesses can thus be observed, including density-driven flowand various geochemical reactions.
The objective of this paper is to simulate and quantita-tively analyse the geochemical evolution of shallow ground-water under evapo-concentration on islands in theOkavango Delta. Idealized reactive transport simulationsare qualitatively compared to measured water qualityparameters from three islands in the Okavango Delta. Com-bining field data and numerical simulations, the paper inves-tigates the importance of individual processes andquantifies the interaction between variable density flow,advective–dispersive transport and geochemical reactions.Humic substance concentrations in the surface water andgroundwater are generally high in the Okavango Delta andtheir impact on geochemical and hydrogeological processeson the islands is investigated. In contrast to previous studies(e.g. Zimmermann et al., 2006) the simulations do not onlyconsider the physically driven accumulation process withinthe subsurface water body under the islands, but alsowhether geochemical reactions have a significant effecton (i) the accumulation rate (ii) the lag-time before den-sity-driven flow occurs and (iii) the steady-state chemicalcomposition of the brines. Simulation results are comparedwith a set of field data from three different islands in theOkavango Delta.
Materials and methods
Study sites
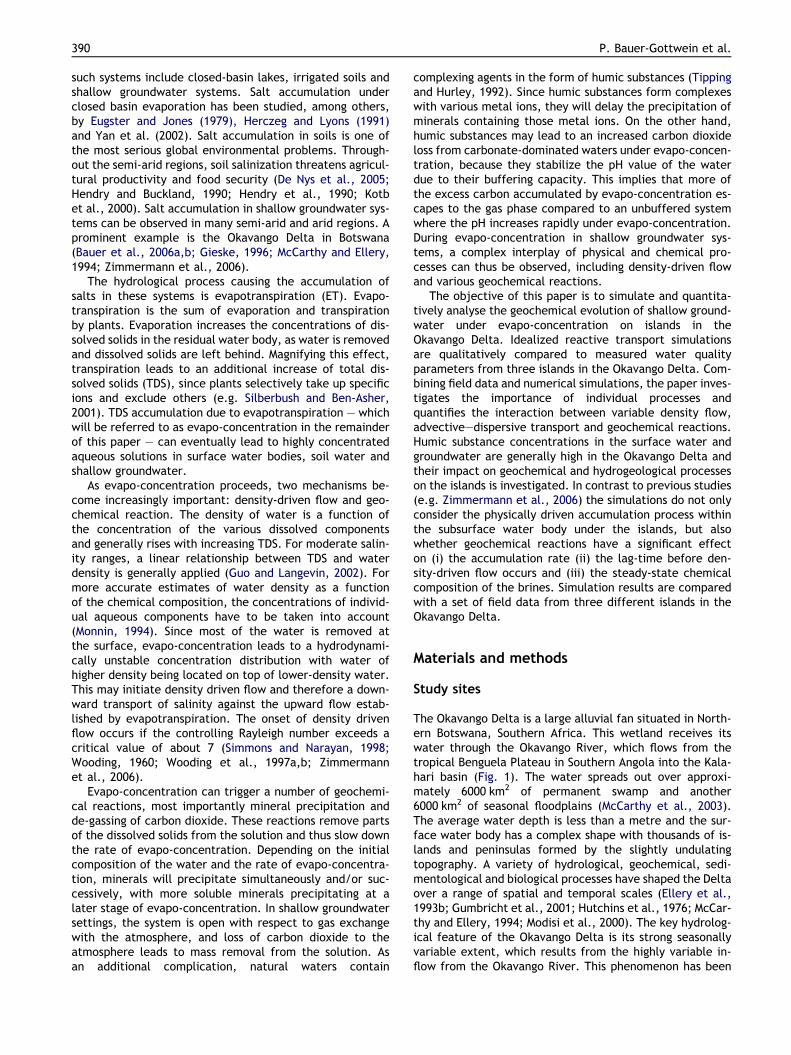
The Okavango Delta is a large alluvial fan situated in North-ern Botswana, Southern Africa. This wetland receives itswater through the Okavango River, which flows from thetropical Benguela Plateau in Southern Angola into the Kala-hari basin (Fig. 1). The water spreads out over approxi-mately 6000 km2 of permanent swamp and another6000 km2 of seasonal floodplains (McCarthy et al., 2003).The average water depth is less than a metre and the sur-face water body has a complex shape with thousands of is-lands and peninsulas formed by the slightly undulatingtopography. A variety of hydrological, geochemical, sedi-mentological and biological processes have shaped the Deltaover a range of spatial and temporal scales (Ellery et al.,1993b; Gumbricht et al., 2001; Hutchins et al., 1976; McCar-thy and Ellery, 1994; Modisi et al., 2000). The key hydrolog-ical feature of the Okavango Delta is its strong seasonallyvariable extent, which results from the highly variable in-flow from the Okavango River. This phenomenon has been
Figure 1 The Okavango River basin in Southern Africa.
Okavango Delta Islands: Interaction between density-driven flow and geochemical reactions under evapo-concentration 391
described in detail elsewhere (Bauer et al., 2006c; Dinceret al., 1987; Gieske, 1997; SMEC, 1987).
Of the 300 m3 s�1 of water entering the Delta, only about10 m3 s�1 proceed into the downstream Boteti River whilethe remainder is lost to evaporation or transpiration byplants. The TDS concentration in the inflow is around35 mg l�1. It increases to approximately 100 mg l�1 at thedownstream end of the Delta. Dincer et al. (1978) found aconcurrent enrichment of the heavier stable isotopes ofoxygen and hydrogen between the upstream and the down-stream end of the Delta. Mladenov et al. (2005) observedsuccessive accumulation of dissolved organic carbon(DOC), which they attributed partly to internal DOC sourcesand partly to evapo-concentration. Bauer et al. (2006b)evaluated the salt mass balance of the entire Okavango Del-ta and showed that the process balancing the salt budget ofthe Delta is accumulation along the wetland’s shorelines.On some of the small islands, which are surrounded by anabove-ground water level, evapo-concentration leads toan extremely high salinity (20 g l�1 and more). Vertical den-sity plumes were predicted by the hydrodynamic simulationmodels and were confirmed to exist by electrical resistivitytomography.
In our study the chemical evolution of the groundwaterwas investigated for three different islands, i.e., Thata Is-land, ORC Island and New Island (Fig. 2). Thata Island is lo-cated in the seasonal swamps of the Okavango Delta, on theNqoga reach. It displays a well-developed superficialgroundwater salinity anomaly (up to 30 g l�1). Along the is-land’s fringe, the vegetation is dense and vigorous, whereasin the centre, efflorescent salt crusts are exposed at thesurface. More detailed descriptions of the Thata Island fieldsite are given elsewhere (Bauer et al., 2006b; McCarthyet al., 1991).
ORC Island hosts a research station of the Okavango Re-search Centre, University of Botswana. The island is located
on the Boro reach. The island displays a strong shallowgroundwater salinity anomaly. The vegetated fringe is re-stricted to a thin band around the island’s edge and the cen-tral parts of ORC Island are barren and covered byefflorescent salt crusts.
New Island is located on the lower Boro. In contrast tothe other islands, the salt accumulation process on New Is-land is still in its early stage. The island is comparativelysmall (about 80 m by 200 m) and is partially encircled bythe Boro River. Since the island is located in the lower partof the Okavango Delta, the infiltrating surface water dis-plays somewhat higher TDS concentrations compared tothe other islands. The slightly higher groundwater level onthe upstream side of the island leads to a downstream shiftof the region that displays the highest concentrations andtherefore to asymmetric concentration patterns.
Data collection
An extensive set of groundwater samples was collected fromall three islands during various field campaigns between2002 and 2004. The samples were obtained from hand-drilled shallow piezometers, equipped with a PVC wellscreen. In all piezometers, the screen interval was locatedwithin the first metre below the water table. All sampleswere stored in tightly closed 100–200 ml plastic bottleswithout filtering or acidifying them in the field to avoid po-tential changes of their humic substance content. Neitherelectrical power nor cooling facilities were available onthe remote islands. Samples were therefore kept at ambienttemperature during the first couple of days and were subse-quently stored at 4 �C until laboratory analysis severalweeks later. Microbially induced changes of the water com-position can therefore not be ruled out. Field measurementsincluded electrical conductivity, temperature and pH. Lab-oratory measurements included alkalinity titration of a
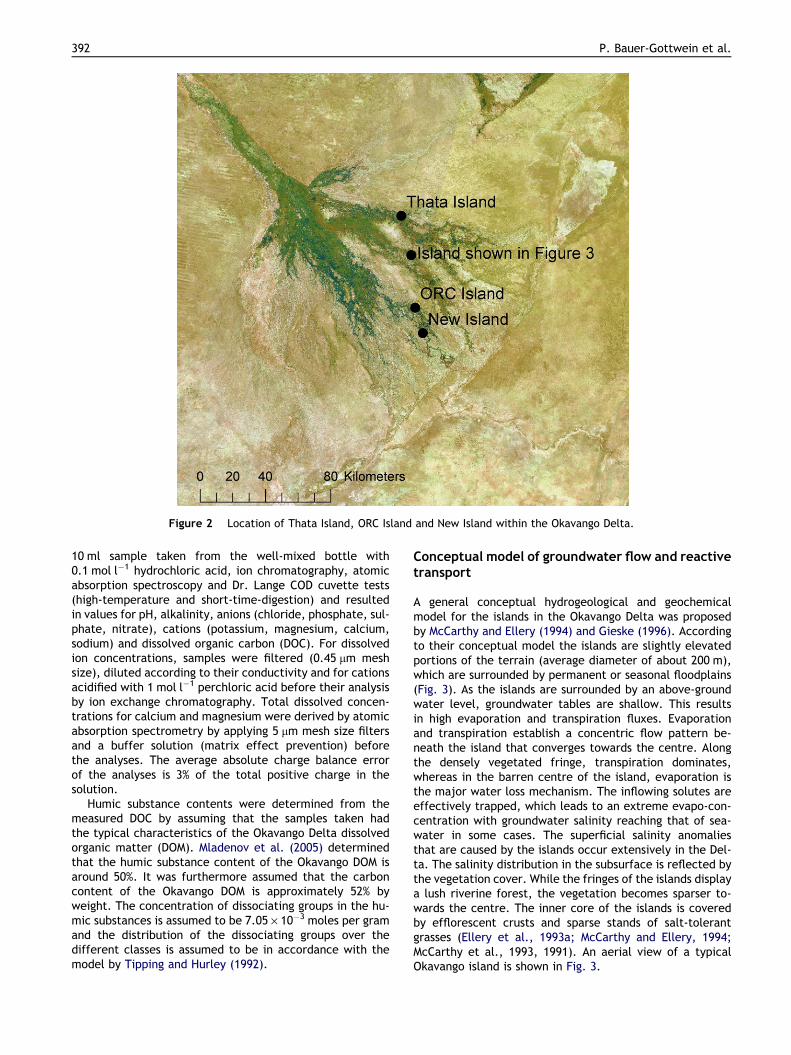
Figure 2 Location of Thata Island, ORC Island and New Island within the Okavango Delta.
392 P. Bauer-Gottwein et al.
10 ml sample taken from the well-mixed bottle with0.1 mol l�1 hydrochloric acid, ion chromatography, atomicabsorption spectroscopy and Dr. Lange COD cuvette tests(high-temperature and short-time-digestion) and resultedin values for pH, alkalinity, anions (chloride, phosphate, sul-phate, nitrate), cations (potassium, magnesium, calcium,sodium) and dissolved organic carbon (DOC). For dissolvedion concentrations, samples were filtered (0.45 lm meshsize), diluted according to their conductivity and for cationsacidified with 1 mol l�1 perchloric acid before their analysisby ion exchange chromatography. Total dissolved concen-trations for calcium and magnesium were derived by atomicabsorption spectrometry by applying 5 lm mesh size filtersand a buffer solution (matrix effect prevention) beforethe analyses. The average absolute charge balance errorof the analyses is 3% of the total positive charge in thesolution.
Humic substance contents were determined from themeasured DOC by assuming that the samples taken hadthe typical characteristics of the Okavango Delta dissolvedorganic matter (DOM). Mladenov et al. (2005) determinedthat the humic substance content of the Okavango DOM isaround 50%. It was furthermore assumed that the carboncontent of the Okavango DOM is approximately 52% byweight. The concentration of dissociating groups in the hu-mic substances is assumed to be 7.05 · 10�3 moles per gramand the distribution of the dissociating groups over thedifferent classes is assumed to be in accordance with themodel by Tipping and Hurley (1992).
Conceptual model of groundwater flow and reactivetransport
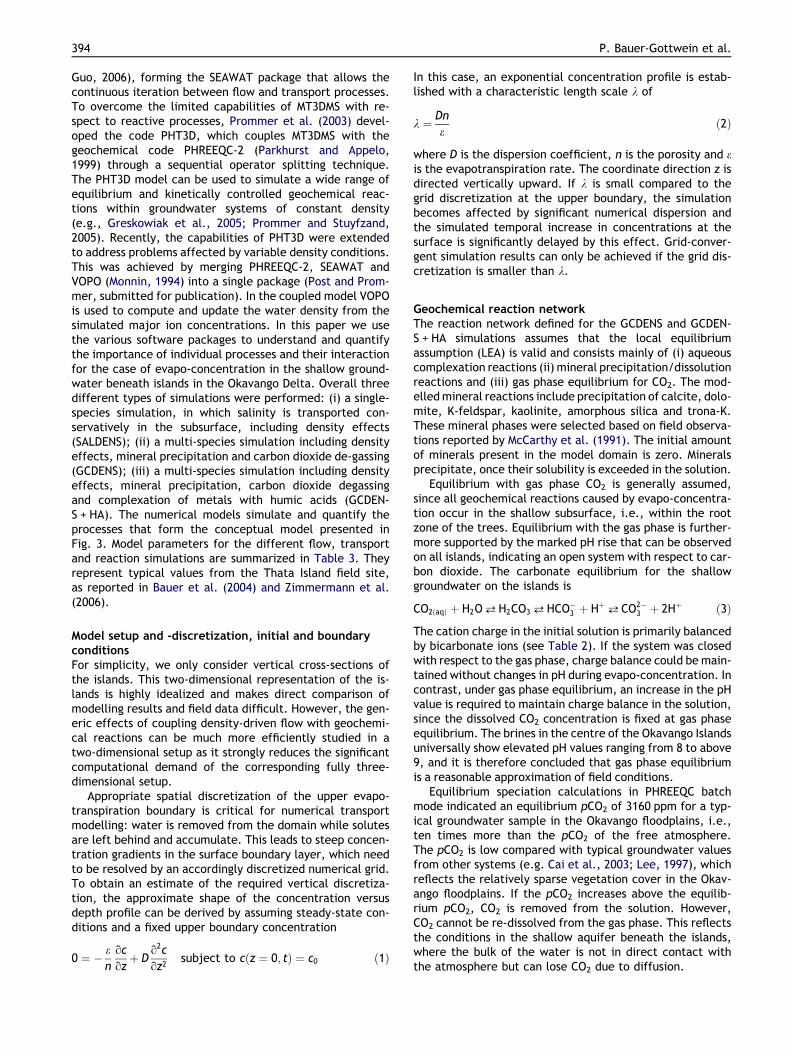
A general conceptual hydrogeological and geochemicalmodel for the islands in the Okavango Delta was proposedby McCarthy and Ellery (1994) and Gieske (1996). Accordingto their conceptual model the islands are slightly elevatedportions of the terrain (average diameter of about 200 m),which are surrounded by permanent or seasonal floodplains(Fig. 3). As the islands are surrounded by an above-groundwater level, groundwater tables are shallow. This resultsin high evaporation and transpiration fluxes. Evaporationand transpiration establish a concentric flow pattern be-neath the island that converges towards the centre. Alongthe densely vegetated fringe, transpiration dominates,whereas in the barren centre of the island, evaporation isthe major water loss mechanism. The inflowing solutes areeffectively trapped, which leads to an extreme evapo-con-centration with groundwater salinity reaching that of sea-water in some cases. The superficial salinity anomaliesthat are caused by the islands occur extensively in the Del-ta. The salinity distribution in the subsurface is reflected bythe vegetation cover. While the fringes of the islands displaya lush riverine forest, the vegetation becomes sparser to-wards the centre. The inner core of the islands is coveredby efflorescent crusts and sparse stands of salt-tolerantgrasses (Ellery et al., 1993a; McCarthy and Ellery, 1994;McCarthy et al., 1993, 1991). An aerial view of a typicalOkavango island is shown in Fig. 3.
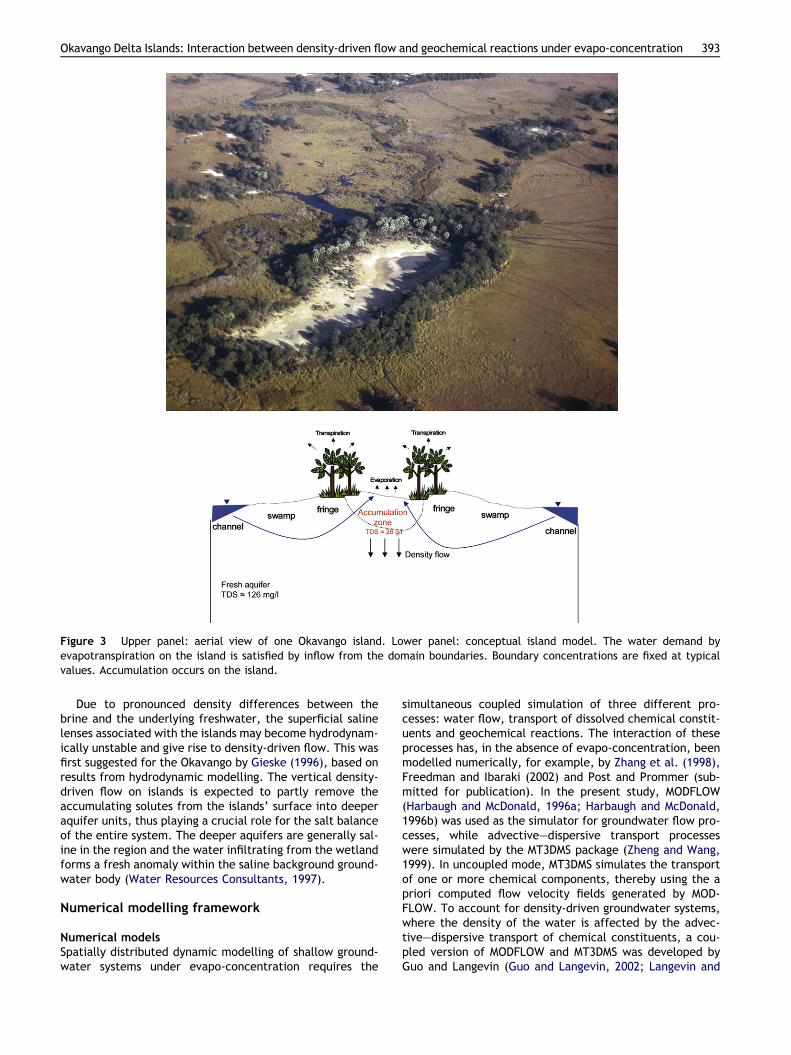
Figure 3 Upper panel: aerial view of one Okavango island. Lower panel: conceptual island model. The water demand byevapotranspiration on the island is satisfied by inflow from the domain boundaries. Boundary concentrations are fixed at typicalvalues. Accumulation occurs on the island.
Okavango Delta Islands: Interaction between density-driven flow and geochemical reactions under evapo-concentration 393
Due to pronounced density differences between thebrine and the underlying freshwater, the superficial salinelenses associated with the islands may become hydrodynam-ically unstable and give rise to density-driven flow. This wasfirst suggested for the Okavango by Gieske (1996), based onresults from hydrodynamic modelling. The vertical density-driven flow on islands is expected to partly remove theaccumulating solutes from the islands’ surface into deeperaquifer units, thus playing a crucial role for the salt balanceof the entire system. The deeper aquifers are generally sal-ine in the region and the water infiltrating from the wetlandforms a fresh anomaly within the saline background ground-water body (Water Resources Consultants, 1997).
Numerical modelling framework
Numerical modelsSpatially distributed dynamic modelling of shallow ground-water systems under evapo-concentration requires the
simultaneous coupled simulation of three different pro-cesses: water flow, transport of dissolved chemical constit-uents and geochemical reactions. The interaction of theseprocesses has, in the absence of evapo-concentration, beenmodelled numerically, for example, by Zhang et al. (1998),Freedman and Ibaraki (2002) and Post and Prommer (sub-mitted for publication). In the present study, MODFLOW(Harbaugh and McDonald, 1996a; Harbaugh and McDonald,1996b) was used as the simulator for groundwater flow pro-cesses, while advective–dispersive transport processeswere simulated by the MT3DMS package (Zheng and Wang,1999). In uncoupled mode, MT3DMS simulates the transportof one or more chemical components, thereby using the apriori computed flow velocity fields generated by MOD-FLOW. To account for density-driven groundwater systems,where the density of the water is affected by the advec-tive–dispersive transport of chemical constituents, a cou-pled version of MODFLOW and MT3DMS was developed byGuo and Langevin (Guo and Langevin, 2002; Langevin and
394 P. Bauer-Gottwein et al.
Guo, 2006), forming the SEAWAT package that allows thecontinuous iteration between flow and transport processes.To overcome the limited capabilities of MT3DMS with re-spect to reactive processes, Prommer et al. (2003) devel-oped the code PHT3D, which couples MT3DMS with thegeochemical code PHREEQC-2 (Parkhurst and Appelo,1999) through a sequential operator splitting technique.The PHT3D model can be used to simulate a wide range ofequilibrium and kinetically controlled geochemical reac-tions within groundwater systems of constant density(e.g., Greskowiak et al., 2005; Prommer and Stuyfzand,2005). Recently, the capabilities of PHT3D were extendedto address problems affected by variable density conditions.This was achieved by merging PHREEQC-2, SEAWAT andVOPO (Monnin, 1994) into a single package (Post and Prom-mer, submitted for publication). In the coupled model VOPOis used to compute and update the water density from thesimulated major ion concentrations. In this paper we usethe various software packages to understand and quantifythe importance of individual processes and their interactionfor the case of evapo-concentration in the shallow ground-water beneath islands in the Okavango Delta. Overall threedifferent types of simulations were performed: (i) a single-species simulation, in which salinity is transported con-servatively in the subsurface, including density effects(SALDENS); (ii) a multi-species simulation including densityeffects, mineral precipitation and carbon dioxide de-gassing(GCDENS); (iii) a multi-species simulation including densityeffects, mineral precipitation, carbon dioxide degassingand complexation of metals with humic acids (GCDEN-S + HA). The numerical models simulate and quantify theprocesses that form the conceptual model presented inFig. 3. Model parameters for the different flow, transportand reaction simulations are summarized in Table 3. Theyrepresent typical values from the Thata Island field site,as reported in Bauer et al. (2004) and Zimmermann et al.(2006).
Model setup and -discretization, initial and boundaryconditionsFor simplicity, we only consider vertical cross-sections ofthe islands. This two-dimensional representation of the is-lands is highly idealized and makes direct comparison ofmodelling results and field data difficult. However, the gen-eric effects of coupling density-driven flow with geochemi-cal reactions can be much more efficiently studied in atwo-dimensional setup as it strongly reduces the significantcomputational demand of the corresponding fully three-dimensional setup.
Appropriate spatial discretization of the upper evapo-transpiration boundary is critical for numerical transportmodelling: water is removed from the domain while solutesare left behind and accumulate. This leads to steep concen-tration gradients in the surface boundary layer, which needto be resolved by an accordingly discretized numerical grid.To obtain an estimate of the required vertical discretiza-tion, the approximate shape of the concentration versusdepth profile can be derived by assuming steady-state con-ditions and a fixed upper boundary concentration
0 ¼ � en
oc
ozþ D
o2c
oz2subject to cðz ¼ 0; tÞ ¼ c0 ð1Þ
In this case, an exponential concentration profile is estab-lished with a characteristic length scale k of
k ¼ Dn
eð2Þ
where D is the dispersion coefficient, n is the porosity and eis the evapotranspiration rate. The coordinate direction z isdirected vertically upward. If k is small compared to thegrid discretization at the upper boundary, the simulationbecomes affected by significant numerical dispersion andthe simulated temporal increase in concentrations at thesurface is significantly delayed by this effect. Grid-conver-gent simulation results can only be achieved if the grid dis-cretization is smaller than k.
Geochemical reaction networkThe reaction network defined for the GCDENS and GCDEN-S + HA simulations assumes that the local equilibriumassumption (LEA) is valid and consists mainly of (i) aqueouscomplexation reactions (ii) mineral precipitation/dissolutionreactions and (iii) gas phase equilibrium for CO2. The mod-elledmineral reactions include precipitation of calcite, dolo-mite, K-feldspar, kaolinite, amorphous silica and trona-K.These mineral phases were selected based on field observa-tions reported by McCarthy et al. (1991). The initial amountof minerals present in the model domain is zero. Mineralsprecipitate, once their solubility is exceeded in the solution.
Equilibrium with gas phase CO2 is generally assumed,since all geochemical reactions caused by evapo-concentra-tion occur in the shallow subsurface, i.e., within the rootzone of the trees. Equilibrium with the gas phase is further-more supported by the marked pH rise that can be observedon all islands, indicating an open system with respect to car-bon dioxide. The carbonate equilibrium for the shallowgroundwater on the islands is
CO2ðaqÞ þ H2O¢H2CO3 ¢HCO�3 þ Hþ¢CO2�3 þ 2Hþ ð3Þ
The cation charge in the initial solution is primarily balancedby bicarbonate ions (see Table 2). If the system was closedwith respect to the gas phase, charge balance could be main-tained without changes in pH during evapo-concentration. Incontrast, under gas phase equilibrium, an increase in the pHvalue is required to maintain charge balance in the solution,since the dissolved CO2 concentration is fixed at gas phaseequilibrium. The brines in the centre of the Okavango Islandsuniversally show elevated pH values ranging from 8 to above9, and it is therefore concluded that gas phase equilibriumis a reasonable approximation of field conditions.
Equilibrium speciation calculations in PHREEQC batchmode indicated an equilibrium pCO2 of 3160 ppm for a typ-ical groundwater sample in the Okavango floodplains, i.e.,ten times more than the pCO2 of the free atmosphere.The pCO2 is low compared with typical groundwater valuesfrom other systems (e.g. Cai et al., 2003; Lee, 1997), whichreflects the relatively sparse vegetation cover in the Okav-ango floodplains. If the pCO2 increases above the equilib-rium pCO2, CO2 is removed from the solution. However,CO2 cannot be re-dissolved from the gas phase. This reflectsthe conditions in the shallow aquifer beneath the islands,where the bulk of the water is not in direct contact withthe atmosphere but can lose CO2 due to diffusion.
Okavango Delta Islands: Interaction between density-driven flow and geochemical reactions under evapo-concentration 395
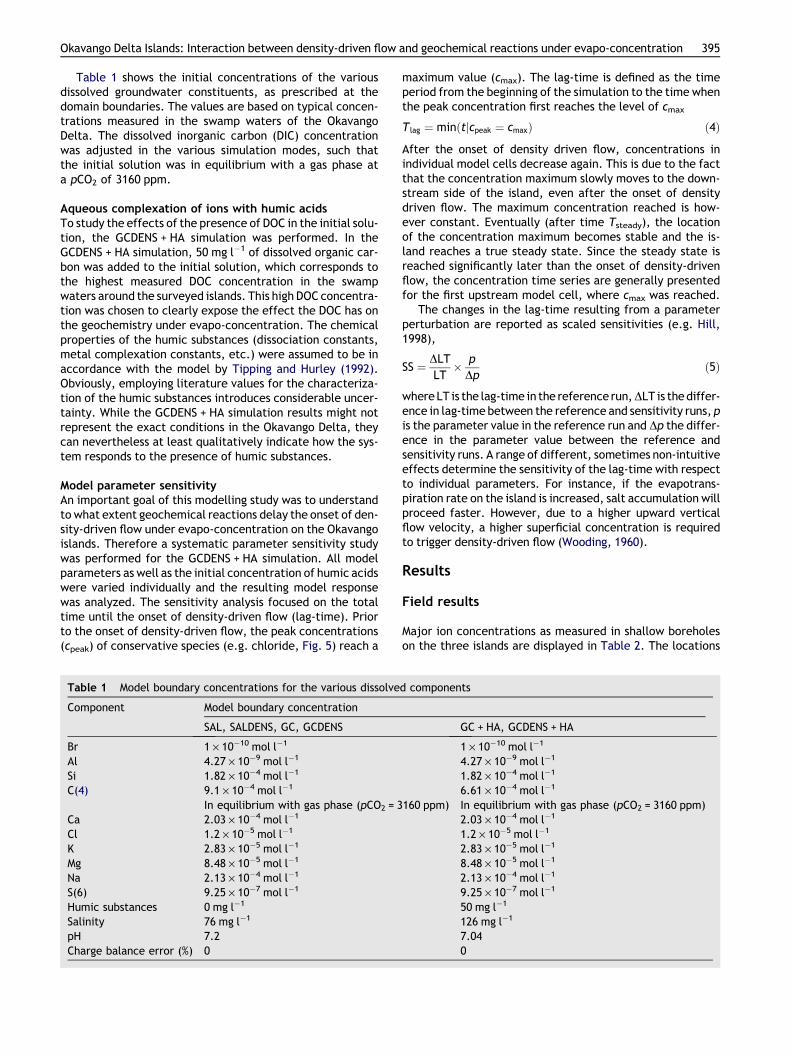
Table 1 shows the initial concentrations of the variousdissolved groundwater constituents, as prescribed at thedomain boundaries. The values are based on typical concen-trations measured in the swamp waters of the OkavangoDelta. The dissolved inorganic carbon (DIC) concentrationwas adjusted in the various simulation modes, such thatthe initial solution was in equilibrium with a gas phase ata pCO2 of 3160 ppm.
Aqueous complexation of ions with humic acidsTo study the effects of the presence of DOC in the initial solu-tion, the GCDENS + HA simulation was performed. In theGCDENS + HA simulation, 50 mg l�1 of dissolved organic car-bon was added to the initial solution, which corresponds tothe highest measured DOC concentration in the swampwaters around the surveyed islands. This high DOC concentra-tion was chosen to clearly expose the effect the DOC has onthe geochemistry under evapo-concentration. The chemicalproperties of the humic substances (dissociation constants,metal complexation constants, etc.) were assumed to be inaccordance with the model by Tipping and Hurley (1992).Obviously, employing literature values for the characteriza-tion of the humic substances introduces considerable uncer-tainty. While the GCDENS + HA simulation results might notrepresent the exact conditions in the Okavango Delta, theycan nevertheless at least qualitatively indicate how the sys-tem responds to the presence of humic substances.
Model parameter sensitivityAn important goal of this modelling study was to understandto what extent geochemical reactions delay the onset of den-sity-driven flow under evapo-concentration on the Okavangoislands. Therefore a systematic parameter sensitivity studywas performed for the GCDENS + HA simulation. All modelparameters as well as the initial concentration of humic acidswere varied individually and the resulting model responsewas analyzed. The sensitivity analysis focused on the totaltime until the onset of density-driven flow (lag-time). Priorto the onset of density-driven flow, the peak concentrations(cpeak) of conservative species (e.g. chloride, Fig. 5) reach a
Table 1 Model boundary concentrations for the various dissolve
Component Model boundary concentration
SAL, SALDENS, GC, GCDENS
Br 1 · 10�10 mol l�1
Al 4.27 · 10�9 mol l�1
Si 1.82 · 10�4 mol l�1
C(4) 9.1 · 10�4 mol l�1
In equilibrium with gas phase (pCO2 = 3Ca 2.03 · 10�4 mol l�1
Cl 1.2 · 10�5 mol l�1
K 2.83 · 10�5 mol l�1
Mg 8.48 · 10�5 mol l�1
Na 2.13 · 10�4 mol l�1
S(6) 9.25 · 10�7 mol l�1
Humic substances 0 mg l�1
Salinity 76 mg l�1
pH 7.2Charge balance error (%) 0
maximum value (cmax). The lag-time is defined as the timeperiod from the beginning of the simulation to the time whenthe peak concentration first reaches the level of cmax
T lag ¼ minðtjcpeak ¼ cmaxÞ ð4Þ
After the onset of density driven flow, concentrations inindividual model cells decrease again. This is due to the factthat the concentration maximum slowly moves to the down-stream side of the island, even after the onset of densitydriven flow. The maximum concentration reached is how-ever constant. Eventually (after time Tsteady), the locationof the concentration maximum becomes stable and the is-land reaches a true steady state. Since the steady state isreached significantly later than the onset of density-drivenflow, the concentration time series are generally presentedfor the first upstream model cell, where cmax was reached.
The changes in the lag-time resulting from a parameterperturbation are reported as scaled sensitivities (e.g. Hill,1998),
SS ¼ DLTLT� p
Dpð5Þ
where LT is the lag-time in the reference run,DLT is thediffer-ence in lag-time between the reference and sensitivity runs, pis the parameter value in the reference run and Dp the differ-ence in the parameter value between the reference andsensitivity runs. A range of different, sometimes non-intuitiveeffects determine the sensitivity of the lag-time with respectto individual parameters. For instance, if the evapotrans-piration rate on the island is increased, salt accumulation willproceed faster. However, due to a higher upward verticalflow velocity, a higher superficial concentration is requiredto trigger density-driven flow (Wooding, 1960).
Results
Field results
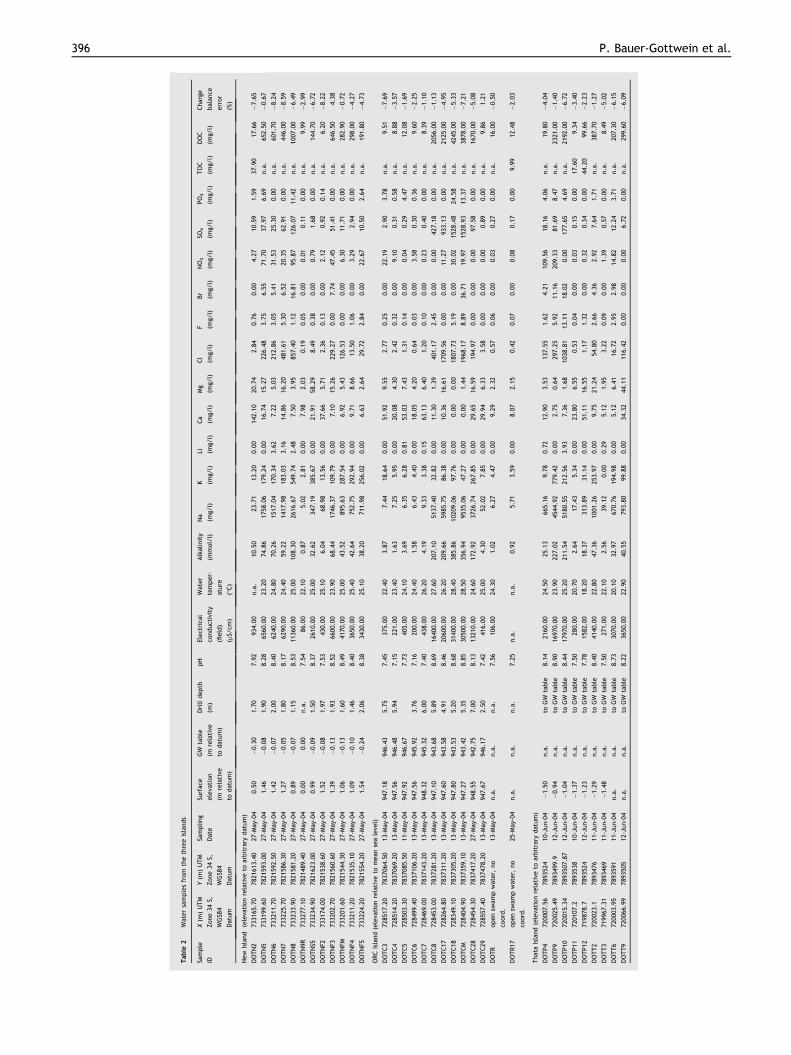
Major ion concentrations as measured in shallow boreholeson the three islands are displayed in Table 2. The locations
d components
GC + HA, GCDENS + HA
1 · 10�10 mol l�1
4.27 · 10�9 mol l�1
1.82 · 10�4 mol l�1
6.61 · 10�4 mol l�1
160 ppm) In equilibrium with gas phase (pCO2 = 3160 ppm)2.03 · 10�4 mol l�1
1.2 · 10�5 mol l�1
2.83 · 10�5 mol l�1
8.48 · 10�5 mol l�1
2.13 · 10�4 mol l�1
9.25 · 10�7 mol l�1
50 mg l�1
126 mg l�1
7.040
Table
2Watersamplesfrom
thethreeislands
Sample
ID
X(m
)UTM
Zone34
S,
WGS84
Datum
Y(m
)UTM
Zone34
S,
WGS84
Datum
Sampling
Date
Surfac
e
eleva
tion
(mrelative
todatum)
GW
table
(mrelative
todatum)
Drilldepth
(m)
pH
Electrica
l
conductivity
(field)
(lS/cm
)
Water
temper-
ature
(�C)
Alkalinity
(mmol/l)
Na
(mg/
l)
K (mg/
l)
Li (mg/
l)
Ca
(mg/
l)
Mg
(mg/
l)
Cl
(mg/
l)
F (mg/
l)
Br
(mg/
l)
NO3
(mg/
l)
SO4
(mg/
l)
PO4
(mg/
l)
TOC
(mg/
l)
DOC
(mg/
l)
Charge
balan
ce
error
(%)
New
Island
(eleva
tionrelative
toarbitrary
datum)
DOTN2
7331
65.70
7821
613.40
27-M
ay-04
0.50
�0.30
1.70
7.92
934.00
n.a.
10.50
23.71
13.20
0.00
142.10
20.74
2.84
0.76
0.00
4.27
10.59
1.59
37.90
17.66
�7.65
DOTN5
7331
99.60
782159
3.00
27-M
ay-04
1.46
�0.08
1.90
8.28
6560
.00
23.20
74.86
1758
.06
179.24
0.00
16.74
15.27
226.48
3.75
6.55
71.70
37.97
6.69
n.a.
652.50
�0.67
DOTN6
7332
11.70
7821
592.50
27-M
ay-04
1.42
�0.07
2.00
8.40
6240
.00
24.80
70.26
1517
.04
170.34
3.62
7.22
5.03
212.86
3.05
5.41
31.53
25.30
0.00
n.a.
601.70
�8.24
DOTN7
7332
25.70
782158
6.30
27-M
ay-04
1.27
�0.05
1.80
8.17
6290
.00
24.40
59.22
1417
.98
183.03
3.16
14.86
16.20
481.61
5.30
6.52
20.35
62.91
0.00
n.a.
446.00
�8.59
DOTN8
7332
33.90
7821
581.20
27-M
ay-04
0.89
�0.07
1.15
8.53
1136
0.00
25.00
108.30
2616
.67
549.74
2.48
7.50
3.95
857.40
1.12
16.81
95.87
126.07
11.42
n.a.
1007
.00
�6.49
DOTN9R
7332
77.10
782148
9.40
27-M
ay-04
0.00
0.00
n.a.
7.54
86.00
22.10
0.87
5.02
2.81
0.00
7.98
2.03
0.19
0.05
0.00
0.01
0.11
0.00
n.a.
9.99
�2.99
DOTNS5
7332
34.90
7821
623.00
27-M
ay-04
0.99
�0.09
1.50
8.37
2610
.00
25.00
32.62
347.19
385.67
0.00
21.91
58.29
8.49
0.38
0.00
0.79
1.68
0.00
n.a.
144.70
�6.72
DOTNF2
7331
74.00
782153
8.60
27-M
ay-04
1.52
�0.08
1.97
7.53
430.00
25.10
6.04
68.98
13.56
0.00
37.66
5.71
2.36
0.13
0.00
2.12
0.92
0.14
n.a.
6.20
�8.22
DOTNF3
7332
02.70
7821
560.60
27-M
ay-04
1.39
�0.13
1.93
8.52
6600
.00
23.90
68.44
1746
.37
109.79
0.00
7.10
15.26
229.27
0.00
7.74
47.45
51.41
0.00
n.a.
646.50
4.38
DOTNFM
73320
1.60
782
1544
.30
27-May
-04
1.06
�0.13
1.60
8.49
4170
.00
25.00
43.52
895.63
287.54
0.00
6.92
5.43
126.53
0.00
0.00
6.30
11.71
0.00
n.a.
282.90
�0.72
DOTNF4
7332
11.20
7821
535.10
27-M
ay-04
1.09
�0.10
1.46
8.40
3650
.00
25.40
42.64
752.75
292.94
0.00
9.71
8.66
13.50
1.06
0.00
3.29
2.94
0.00
n.a.
298.00
�4.27
DOTNF5
7332
24.20
782155
4.20
27-M
ay-04
1.54
�0.24
2.06
8.38
3430
.00
25.10
38.20
711.98
256.02
0.00
6.63
2.64
29.72
2.84
0.00
22.67
10.50
2.64
n.a.
191.80
�4.73
ORCIsland(eleva
tionrelative
tomean
sealeve
l)
DOTC3
7285
17.20
7837
064.50
13-M
ay-04
947.18
946.43
5.75
7.45
375.00
22.40
3.87
7.44
18.64
0.00
51.92
9.55
2.77
0.25
0.00
22.19
2.90
3.78
n.a.
9.51
�7.69
DOTC4
7285
14.20
783706
9.20
13-M
ay-04
947.56
946.48
5.94
7.15
221.00
23.40
1.63
7.25
5.95
0.00
20.08
4.30
2.42
0.32
0.00
9.10
0.31
0.58
n.a.
8.88
�3.57
DOTC5
7285
03.30
7837
085.50
11-M
ay-04
947.92
946.67
7.73
405.00
24.10
3.69
6.35
6.28
0.81
53.03
7.43
1.31
0.14
0.00
0.04
0.29
4.47
n.a.
12.08
�1.69
DOTC6
7284
99.40
783710
6.20
13-M
ay-04
947.56
945.92
3.76
7.16
200.00
24.40
1.58
6.43
4.40
0.00
18.05
4.20
0.64
0.03
0.00
3.58
0.30
0.36
n.a.
9.60
�2.25
DOTC7
7284
69.00
7837
143.20
13-M
ay-04
948.32
945.32
6.00
7.40
438.00
26.20
4.19
9.33
3.38
0.15
63.13
6.40
1.20
0.10
0.00
0.23
0.40
0.00
n.a.
8.39
�1.10
DOTC8
7284
53.00
783728
1.20
13-M
ay-04
947.10
943.68
5.89
8.69
1640
0.00
27.60
207.10
5137
.40
32.82
0.00
11.30
1.39
401.17
2.45
0.00
0.00
427.18
0.00
n.a.
2056
.00
�1.13
DOTC17
7282
64.80
7837
311.20
13-M
ay-04
947.60
943.58
4.91
8.46
2060
0.00
26.20
209.66
5985
.75
86.38
0.00
10.36
16.61
1709
.56
0.00
0.00
11.27
933.13
0.00
n.a.
2125
.00
�4.95
DOTC18
7283
49.10
783730
5.20
13-M
ay-04
947.80
943.53
5.20
8.68
3140
0.00
28.40
385.86
1020
9.06
97.76
0.00
0.00
0.00
1807
.73
5.19
0.00
30.02
1528
.48
24.58
n.a.
4245
.00
�5.33
DOTCM
7284
04.90
7837
359.10
13-M
ay-04
947.27
943.42
5.35
8.85
3050
0.00
28.50
356.94
9535
.06
47.27
0.00
0.00
1.44
1968
.17
8.89
36.71
19.97
1528
.93
13.37
n.a.
3878
.00
�7.21
DOTC28
7284
54.30
783741
7.20
27-M
ay-04
948.55
942.75
7.00
8.13
1321
0.00
24.60
172.92
3726
.74
267.85
0.00
29.65
16.59
194.97
0.00
0.00
0.00
97.58
0.00
n.a.
1670
.00
�5.08
DOTC29
7285
57.40
7837
478.20
13-M
ay-04
947.67
946.17
2.50
7.42
416.00
25.00
4.30
52.02
7.85
0.00
29.94
6.33
3.58
0.00
0.00
0.00
0.89
0.00
n.a.
9.86
1.21
DOTR
opensw
ampwater,
no
coord.
13-M
ay-04
n.a.
n.a.
n.a.
7.56
106.00
24.30
1.02
6.27
4.47
0.00
9.29
2.32
0.57
0.06
0.00
0.03
0.27
0.00
n.a.
16.00
�0.50
DOTR17
opensw
ampwater,
no
coord.
25-M
ay-04
n.a.
n.a.
n.a.
7.25
n.a.
n.a.
0.92
5.71
3.59
0.00
8.07
2.15
0.42
0.07
0.00
0.08
0.17
0.00
9.99
12.48
�2.03
Thata
Island(eleva
tionrelative
toarbitrary
datum)
DOTP4
7200
07.56
789
3524
10-Ju
n-04
�1.50
n.a.
toGW
table
8.14
2160
.00
24.50
25.13
665.16
9.78
0.72
12.90
3.53
137.55
1.62
4.21
109.56
18.16
4.06
n.a.
19.80
�4.04
DOTP9
7200
25.49
789
3499.9
12-Jun-04
�0.94
n.a.
toGW
table
8.90
1697
0.00
23.90
227.02
4544
.92
779.42
0.00
2.75
0.64
297.25
5.92
11.16
209.33
81.69
8.47
n.a.
2321
.00
�1.40
DOTP10
7200
15.34
789
3507
.87
12-Ju
n-04
�1.04
n.a.
toGW
table
8.44
1797
0.00
25.20
211.54
5180
.55
212.56
3.93
7.36
1.68
1038
.81
13.11
18.02
0.00
177.65
4.69
n.a.
2192
.00
�6.72
DOTP11
7201
07.2
789
3538
10-Jun-04
�1.37
n.a.
toGW
table
7.50
280.00
20.70
2.64
17.43
5.34
0.00
23.80
6.55
0.53
0.04
0.00
0.03
0.15
0.00
17.60
9.34
�3.40
DOTP12
7198
78.7
789
3524
12-Ju
n-04
�1.23
n.a.
toGW
table
7.78
1582
.00
18.20
18.37
313.89
31.14
0.00
51.11
16.55
1.17
1.32
0.00
0.32
0.34
0.00
44.20
99.66
�2.23
DOTT2
7200
23.1
789347
611
-Jun-04
�1.29
n.a.
toGW
table
8.40
4140
.00
22.80
47.36
1001
.26
253.97
0.00
9.75
21.24
54.80
2.66
4.36
2.92
7.64
1.71
n.a.
387.70
�1.27
DOTT3
7199
67.31
7893
469
11-Jun-04
�1.48
n.a.
toGW
table
7.50
271.00
22.10
2.56
39.12
0.00
0.29
5.12
1.95
3.22
0.09
0.00
1.39
0.57
0.00
n.a.
8.49
�5.02
DOTT6
7200
03.95
789359
111
-Jun-04
n.a.
n.a.
toGW
table
8.73
3070
.00
20.10
32.97
670.76
194.98
0.00
5.12
6.41
16.72
2.95
2.98
14.82
12.24
3.71
n.a.
207.30
�6.15
DOTT9
7200
66.99
789350
512
-Jun-04
n.a.
n.a.
toGW
table
8.22
3650
.00
22.90
40.55
793.80
99.88
0.00
34.32
44.11
116.42
0.00
0.00
0.00
6.72
0.00
n.a.
299.60
�6.09
396 P. Bauer-Gottwein et al.
Okavango Delta Islands: Interaction between density-driven flow and geochemical reactions under evapo-concentration 397
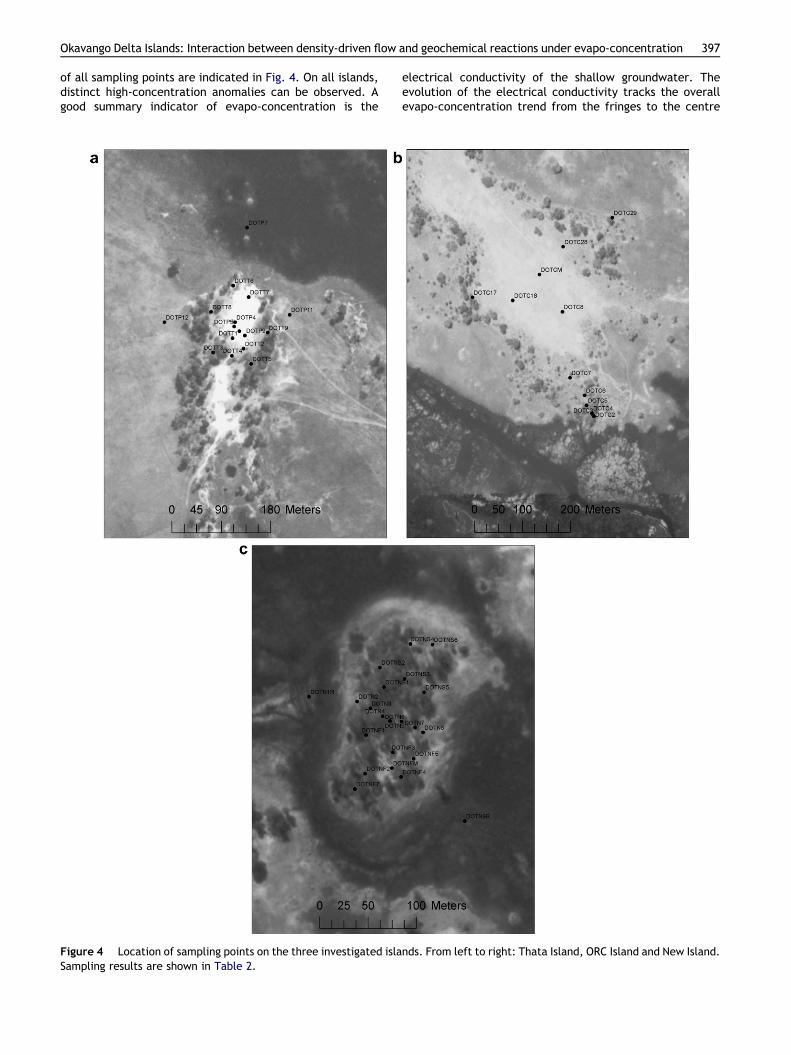
of all sampling points are indicated in Fig. 4. On all islands,distinct high-concentration anomalies can be observed. Agood summary indicator of evapo-concentration is the
Figure 4 Location of sampling points on the three investigated islaSampling results are shown in Table 2.
electrical conductivity of the shallow groundwater. Theevolution of the electrical conductivity tracks the overallevapo-concentration trend from the fringes to the centre
nds. From left to right: Thata Island, ORC Island and New Island.
398 P. Bauer-Gottwein et al.
of the islands. The maximum observed shallow-groundwaterelectrical conductivities are around 20,000 lS cm�1 onThata Island, 30,000 lS cm�1 on ORC Island and 10,000 lScm�1 on New Island. The concentration distribution onNew Island was found to be asymmetric, as a result of thestrong regional hydraulic gradient. Data from all three is-lands show that the evapo-concentration of conservativespecies (e.g. chloride) follows closely the behaviour ob-served for the electrical conductivity. On the other hand,the low calcium concentrations that were measured withinthe zone in which carbonate concentrations successively in-crease (due to evapo-concentration) provide evidence forthe occurrence of calcite (CaCO3) precipitation. The mea-sured pH in this zone also coincides with the equilibriumpH for this chemical system (c.f. charge balances in Table2). The pH significantly increases towards the centre onall islands and reaches values between 8.5 and 9 at the loca-tions where the maximum electrical conductivities wererecorded.
Modelling results
The temporal evolution of the concentrations of differentdissolved components at defined points in the model domaincharacterizes the inherent dynamics of the system. In allsimulation runs reported here, a steady state is reachedafter the onset of density driven flow. Our analysis focusesmainly on the transient hydrochemical changes until the on-set of density driven flow and the understanding of the asso-ciated interactions between geochemical reactions anddensity-driven flow. The concentration patterns observedin the field are however static and correspond to a specific
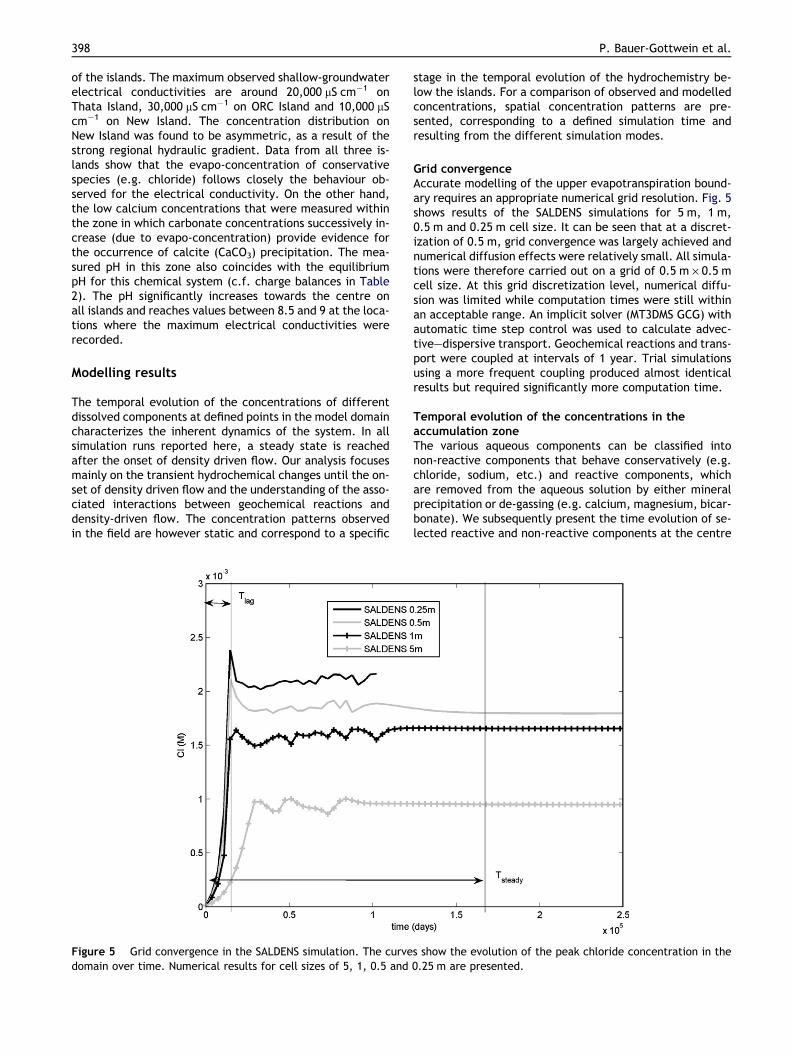
Figure 5 Grid convergence in the SALDENS simulation. The curvedomain over time. Numerical results for cell sizes of 5, 1, 0.5 and
stage in the temporal evolution of the hydrochemistry be-low the islands. For a comparison of observed and modelledconcentrations, spatial concentration patterns are pre-sented, corresponding to a defined simulation time andresulting from the different simulation modes.
Grid convergenceAccurate modelling of the upper evapotranspiration bound-ary requires an appropriate numerical grid resolution. Fig. 5shows results of the SALDENS simulations for 5 m, 1 m,0.5 m and 0.25 m cell size. It can be seen that at a discret-ization of 0.5 m, grid convergence was largely achieved andnumerical diffusion effects were relatively small. All simula-tions were therefore carried out on a grid of 0.5 m · 0.5 mcell size. At this grid discretization level, numerical diffu-sion was limited while computation times were still withinan acceptable range. An implicit solver (MT3DMS GCG) withautomatic time step control was used to calculate advec-tive–dispersive transport. Geochemical reactions and trans-port were coupled at intervals of 1 year. Trial simulationsusing a more frequent coupling produced almost identicalresults but required significantly more computation time.
Temporal evolution of the concentrations in theaccumulation zoneThe various aqueous components can be classified intonon-reactive components that behave conservatively (e.g.chloride, sodium, etc.) and reactive components, whichare removed from the aqueous solution by either mineralprecipitation or de-gassing (e.g. calcium, magnesium, bicar-bonate). We subsequently present the time evolution of se-lected reactive and non-reactive components at the centre
s show the evolution of the peak chloride concentration in the0.25 m are presented.
Okavango Delta Islands: Interaction between density-driven flow and geochemical reactions under evapo-concentration 399
of the accumulation zone on the island. The dynamic effectsresult from the interplay of evapo-concentration, density-driven flow and geochemical reactions.
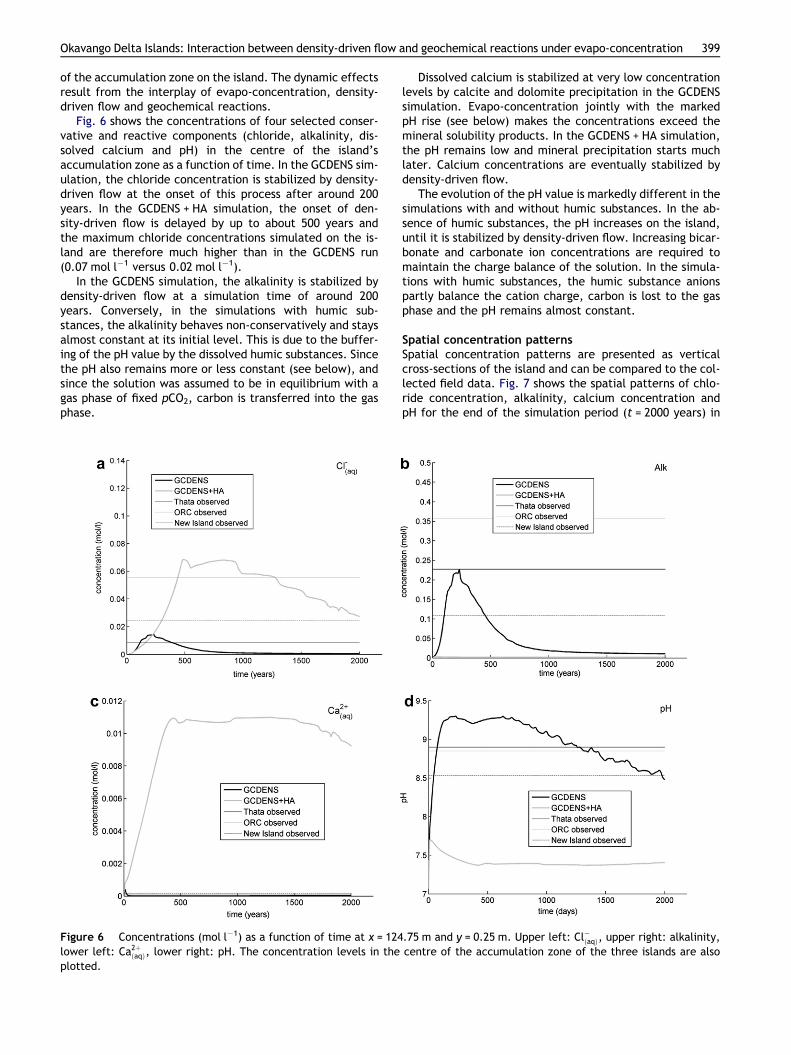
Fig. 6 shows the concentrations of four selected conser-vative and reactive components (chloride, alkalinity, dis-solved calcium and pH) in the centre of the island’saccumulation zone as a function of time. In the GCDENS sim-ulation, the chloride concentration is stabilized by density-driven flow at the onset of this process after around 200years. In the GCDENS + HA simulation, the onset of den-sity-driven flow is delayed by up to about 500 years andthe maximum chloride concentrations simulated on the is-land are therefore much higher than in the GCDENS run(0.07 mol l�1 versus 0.02 mol l�1).
In the GCDENS simulation, the alkalinity is stabilized bydensity-driven flow at a simulation time of around 200years. Conversely, in the simulations with humic sub-stances, the alkalinity behaves non-conservatively and staysalmost constant at its initial level. This is due to the buffer-ing of the pH value by the dissolved humic substances. Sincethe pH also remains more or less constant (see below), andsince the solution was assumed to be in equilibrium with agas phase of fixed pCO2, carbon is transferred into the gasphase.
Figure 6 Concentrations (mol l�1) as a function of time at x = 124lower left: Ca2þðaqÞ, lower right: pH. The concentration levels in theplotted.
Dissolved calcium is stabilized at very low concentrationlevels by calcite and dolomite precipitation in the GCDENSsimulation. Evapo-concentration jointly with the markedpH rise (see below) makes the concentrations exceed themineral solubility products. In the GCDENS + HA simulation,the pH remains low and mineral precipitation starts muchlater. Calcium concentrations are eventually stabilized bydensity-driven flow.
The evolution of the pH value is markedly different in thesimulations with and without humic substances. In the ab-sence of humic substances, the pH increases on the island,until it is stabilized by density-driven flow. Increasing bicar-bonate and carbonate ion concentrations are required tomaintain the charge balance of the solution. In the simula-tions with humic substances, the humic substance anionspartly balance the cation charge, carbon is lost to the gasphase and the pH remains almost constant.
Spatial concentration patternsSpatial concentration patterns are presented as verticalcross-sections of the island and can be compared to the col-lected field data. Fig. 7 shows the spatial patterns of chlo-ride concentration, alkalinity, calcium concentration andpH for the end of the simulation period (t = 2000 years) in
.75 m and y = 0.25 m. Upper left: Cl�ðaqÞ, upper right: alkalinity,centre of the accumulation zone of the three islands are also
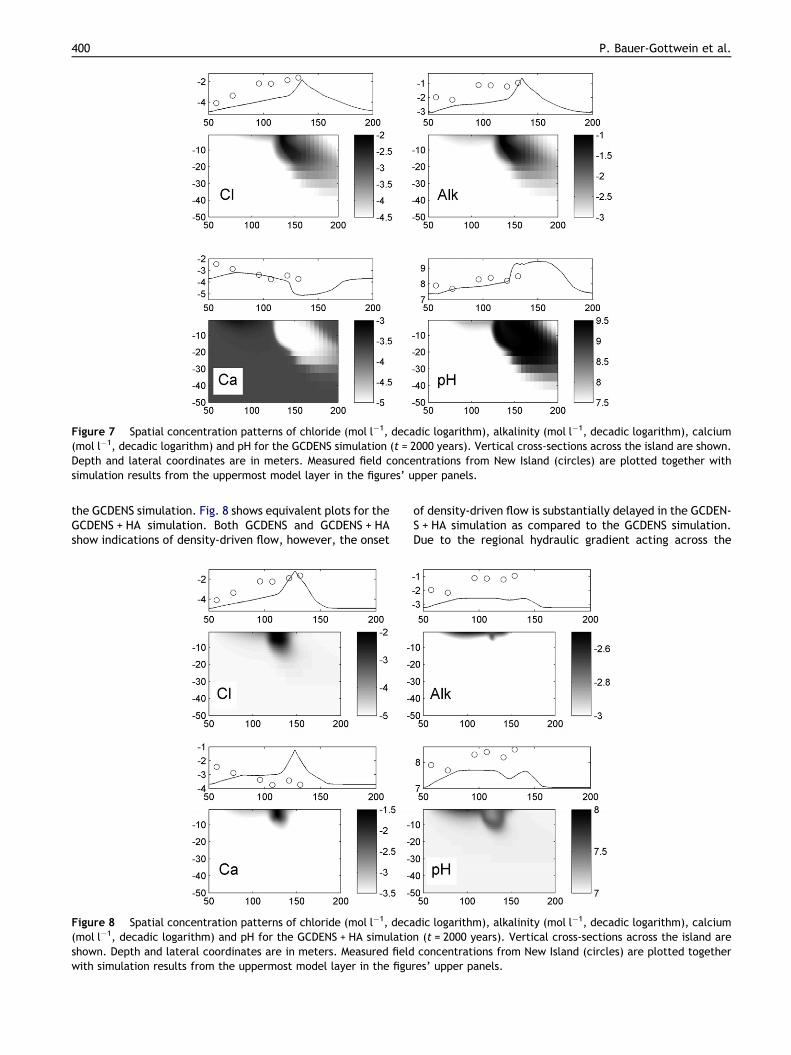
Figure 7 Spatial concentration patterns of chloride (mol l�1, decadic logarithm), alkalinity (mol l�1, decadic logarithm), calcium(mol l�1, decadic logarithm) and pH for the GCDENS simulation (t = 2000 years). Vertical cross-sections across the island are shown.Depth and lateral coordinates are in meters. Measured field concentrations from New Island (circles) are plotted together withsimulation results from the uppermost model layer in the figures’ upper panels.
400 P. Bauer-Gottwein et al.
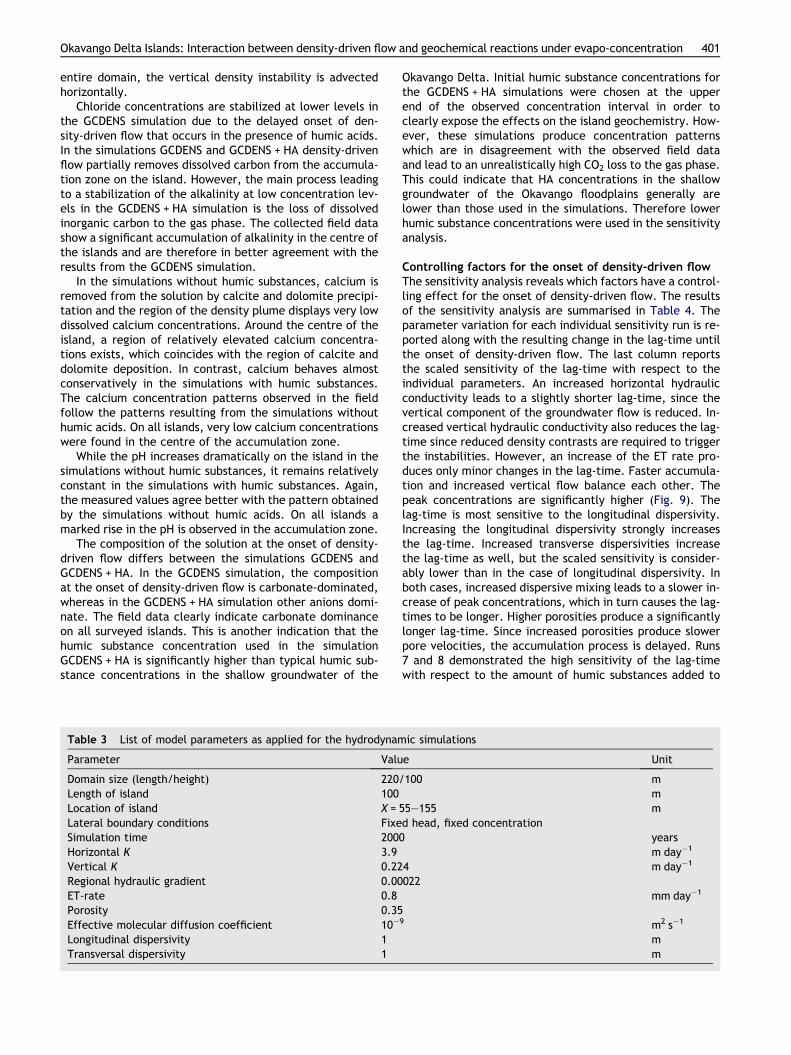
the GCDENS simulation. Fig. 8 shows equivalent plots for theGCDENS + HA simulation. Both GCDENS and GCDENS + HAshow indications of density-driven flow, however, the onset
Figure 8 Spatial concentration patterns of chloride (mol l�1, deca(mol l�1, decadic logarithm) and pH for the GCDENS + HA simulatioshown. Depth and lateral coordinates are in meters. Measured fieldwith simulation results from the uppermost model layer in the figu
of density-driven flow is substantially delayed in the GCDEN-S + HA simulation as compared to the GCDENS simulation.Due to the regional hydraulic gradient acting across the
dic logarithm), alkalinity (mol l�1, decadic logarithm), calciumn (t = 2000 years). Vertical cross-sections across the island areconcentrations from New Island (circles) are plotted together
res’ upper panels.
Okavango Delta Islands: Interaction between density-driven flow and geochemical reactions under evapo-concentration 401
entire domain, the vertical density instability is advectedhorizontally.
Chloride concentrations are stabilized at lower levels inthe GCDENS simulation due to the delayed onset of den-sity-driven flow that occurs in the presence of humic acids.In the simulations GCDENS and GCDENS + HA density-drivenflow partially removes dissolved carbon from the accumula-tion zone on the island. However, the main process leadingto a stabilization of the alkalinity at low concentration lev-els in the GCDENS + HA simulation is the loss of dissolvedinorganic carbon to the gas phase. The collected field datashow a significant accumulation of alkalinity in the centre ofthe islands and are therefore in better agreement with theresults from the GCDENS simulation.
In the simulations without humic substances, calcium isremoved from the solution by calcite and dolomite precipi-tation and the region of the density plume displays very lowdissolved calcium concentrations. Around the centre of theisland, a region of relatively elevated calcium concentra-tions exists, which coincides with the region of calcite anddolomite deposition. In contrast, calcium behaves almostconservatively in the simulations with humic substances.The calcium concentration patterns observed in the fieldfollow the patterns resulting from the simulations withouthumic acids. On all islands, very low calcium concentrationswere found in the centre of the accumulation zone.
While the pH increases dramatically on the island in thesimulations without humic substances, it remains relativelyconstant in the simulations with humic substances. Again,the measured values agree better with the pattern obtainedby the simulations without humic acids. On all islands amarked rise in the pH is observed in the accumulation zone.
The composition of the solution at the onset of density-driven flow differs between the simulations GCDENS andGCDENS + HA. In the GCDENS simulation, the compositionat the onset of density-driven flow is carbonate-dominated,whereas in the GCDENS + HA simulation other anions domi-nate. The field data clearly indicate carbonate dominanceon all surveyed islands. This is another indication that thehumic substance concentration used in the simulationGCDENS + HA is significantly higher than typical humic sub-stance concentrations in the shallow groundwater of the
Table 3 List of model parameters as applied for the hydrodynam
Parameter Valu
Domain size (length/height) 220/Length of island 100Location of island X = 5Lateral boundary conditions FixeSimulation time 2000Horizontal K 3.9Vertical K 0.22Regional hydraulic gradient 0.00ET-rate 0.8Porosity 0.35Effective molecular diffusion coefficient 10�
Longitudinal dispersivity 1Transversal dispersivity 1
Okavango Delta. Initial humic substance concentrations forthe GCDENS + HA simulations were chosen at the upperend of the observed concentration interval in order toclearly expose the effects on the island geochemistry. How-ever, these simulations produce concentration patternswhich are in disagreement with the observed field dataand lead to an unrealistically high CO2 loss to the gas phase.This could indicate that HA concentrations in the shallowgroundwater of the Okavango floodplains generally arelower than those used in the simulations. Therefore lowerhumic substance concentrations were used in the sensitivityanalysis.
Controlling factors for the onset of density-driven flowThe sensitivity analysis reveals which factors have a control-ling effect for the onset of density-driven flow. The resultsof the sensitivity analysis are summarised in Table 4. Theparameter variation for each individual sensitivity run is re-ported along with the resulting change in the lag-time untilthe onset of density-driven flow. The last column reportsthe scaled sensitivity of the lag-time with respect to theindividual parameters. An increased horizontal hydraulicconductivity leads to a slightly shorter lag-time, since thevertical component of the groundwater flow is reduced. In-creased vertical hydraulic conductivity also reduces the lag-time since reduced density contrasts are required to triggerthe instabilities. However, an increase of the ET rate pro-duces only minor changes in the lag-time. Faster accumula-tion and increased vertical flow balance each other. Thepeak concentrations are significantly higher (Fig. 9). Thelag-time is most sensitive to the longitudinal dispersivity.Increasing the longitudinal dispersivity strongly increasesthe lag-time. Increased transverse dispersivities increasethe lag-time as well, but the scaled sensitivity is consider-ably lower than in the case of longitudinal dispersivity. Inboth cases, increased dispersive mixing leads to a slower in-crease of peak concentrations, which in turn causes the lag-times to be longer. Higher porosities produce a significantlylonger lag-time. Since increased porosities produce slowerpore velocities, the accumulation process is delayed. Runs7 and 8 demonstrated the high sensitivity of the lag-timewith respect to the amount of humic substances added to
ic simulations
e Unit
100 mm
5–155 md head, fixed concentration
yearsm day�1
4 m day�1
022mm day�1
9 m2 s�1
mm
Table
4Resultsofthesensitivity
analysis
RunID
Parameter
Valuein
baserun
Valuein
sensitivity
run
%ch
ange
inparam
eter
Tim
euntil
onsetof
density
flow,
lag-time(years)
%ch
ange
inlag-time
Scaled
sensitivity
oflag-time
Chlorideco
nce
ntration
attheonsetof
density
drive
nflow,
Cmax(m
moll�
1)
%ch
ange
inCmax
Scaled
sensitivity
ofCmax
Base
0.00
480.00
0.00
68.50
0.00
1Horizo
ntalhyd
raulic
conductivity(m
d�1)
3.90
5.90
51.28
420.00
�12
.50
�0.24
61.00
�10
.95
�0.21
2Vertical
hyd
raulic
conductivity(m
d�1)
0.22
0.34
50.00
410.00
�14
.58
�0.29
52.80
�22
.92
�0.46
3ETrate
(mm
d�1)
0.80
1.20
50.00
470.00
�2.08
�0.04
100.90
47.30
0.95
4Lo
ngitudinal
dispersivity(m
)1.00
1.50
50.00
970.00
102.08
2.04
70.30
2.63
0.05
5Transverse
dispersivity(m
)1.00
0.66
�34
.00
420.00
�12
.50
0.37
66.70
�2.63
0.08
6Porosity
(–)
0.35
0.40
14.29
560.00
16.67
1.17
68.40
�0.15
�0.01
7DOC(m
gl�
1)
50.00
10.00
�80
.00
150.00
�68
.75
0.86
17.50
�74
.45
0.93
8DOC(m
gl�
1)
50.00
20.00
�60
.00
190.00
�60
.42
1.01
23.90
�65
.11
1.09
402 P. Bauer-Gottwein et al.
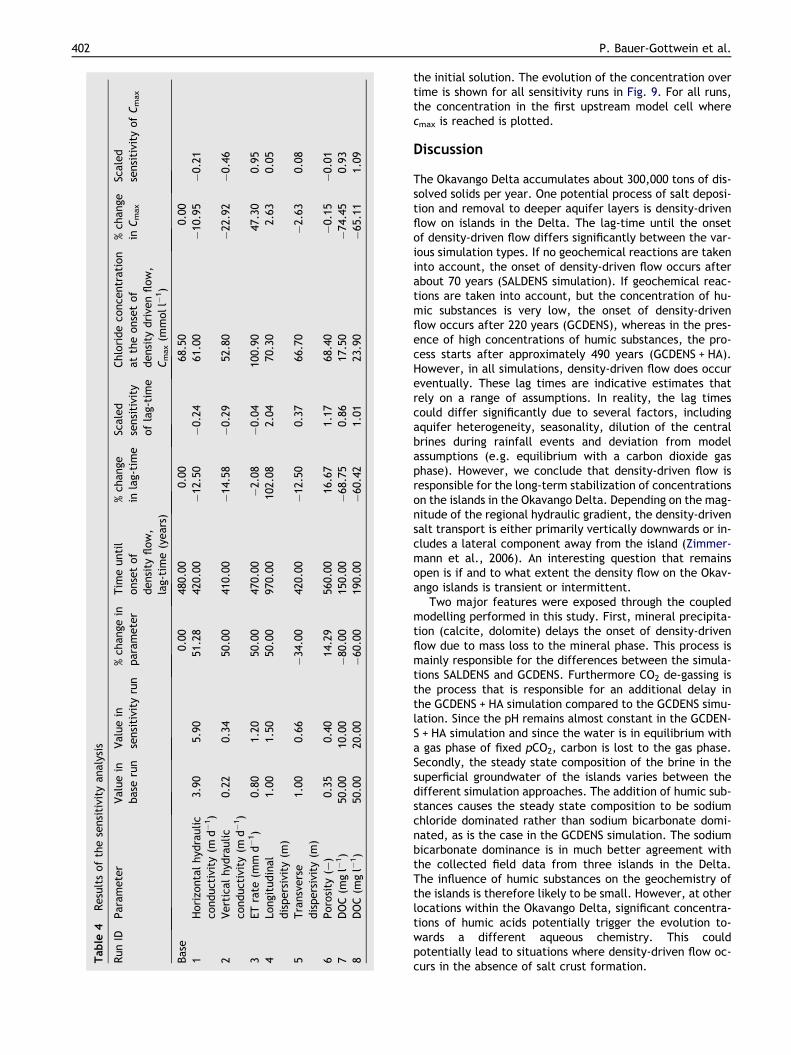
the initial solution. The evolution of the concentration overtime is shown for all sensitivity runs in Fig. 9. For all runs,the concentration in the first upstream model cell wherecmax is reached is plotted.
Discussion
The Okavango Delta accumulates about 300,000 tons of dis-solved solids per year. One potential process of salt deposi-tion and removal to deeper aquifer layers is density-drivenflow on islands in the Delta. The lag-time until the onsetof density-driven flow differs significantly between the var-ious simulation types. If no geochemical reactions are takeninto account, the onset of density-driven flow occurs afterabout 70 years (SALDENS simulation). If geochemical reac-tions are taken into account, but the concentration of hu-mic substances is very low, the onset of density-drivenflow occurs after 220 years (GCDENS), whereas in the pres-ence of high concentrations of humic substances, the pro-cess starts after approximately 490 years (GCDENS + HA).However, in all simulations, density-driven flow does occureventually. These lag times are indicative estimates thatrely on a range of assumptions. In reality, the lag timescould differ significantly due to several factors, includingaquifer heterogeneity, seasonality, dilution of the centralbrines during rainfall events and deviation from modelassumptions (e.g. equilibrium with a carbon dioxide gasphase). However, we conclude that density-driven flow isresponsible for the long-term stabilization of concentrationson the islands in the Okavango Delta. Depending on the mag-nitude of the regional hydraulic gradient, the density-drivensalt transport is either primarily vertically downwards or in-cludes a lateral component away from the island (Zimmer-mann et al., 2006). An interesting question that remainsopen is if and to what extent the density flow on the Okav-ango islands is transient or intermittent.
Two major features were exposed through the coupledmodelling performed in this study. First, mineral precipita-tion (calcite, dolomite) delays the onset of density-drivenflow due to mass loss to the mineral phase. This process ismainly responsible for the differences between the simula-tions SALDENS and GCDENS. Furthermore CO2 de-gassing isthe process that is responsible for an additional delay inthe GCDENS + HA simulation compared to the GCDENS simu-lation. Since the pH remains almost constant in the GCDEN-S + HA simulation and since the water is in equilibrium witha gas phase of fixed pCO2, carbon is lost to the gas phase.Secondly, the steady state composition of the brine in thesuperficial groundwater of the islands varies between thedifferent simulation approaches. The addition of humic sub-stances causes the steady state composition to be sodiumchloride dominated rather than sodium bicarbonate domi-nated, as is the case in the GCDENS simulation. The sodiumbicarbonate dominance is in much better agreement withthe collected field data from three islands in the Delta.The influence of humic substances on the geochemistry ofthe islands is therefore likely to be small. However, at otherlocations within the Okavango Delta, significant concentra-tions of humic acids potentially trigger the evolution to-wards a different aqueous chemistry. This couldpotentially lead to situations where density-driven flow oc-curs in the absence of salt crust formation.
Figure 9 Chloride concentration versus time for the various sensitivity runs at the cell of maximum concentration. Maximumobserved concentration levels in the centre of the accumulation zone of the three islands are shown as well.
Okavango Delta Islands: Interaction between density-driven flow and geochemical reactions under evapo-concentration 403
Lag-times until the onset of density driven flow andmodel results in general are sensitive to a number of modelparameters, most notably the dispersivity. The dispersivefluxes are caused by a wide variety of natural processes.This includes, for example, fluctuating groundwater tablesand gradients as well as rainwater ponding and subsequentinfiltration. The model’s parameterisation of dispersivity istherefore highly uncertain. Given the high sensitivity of thisparameter, it should not be expected that the model canquantitatively predict concentrations on the islands, unlessit is assumed that a steady state has already been reached.The steady-state value of cmax is fairly insensitive to thechoice of the dispersivity (Table 4).
In this study, a simple parameterization of the evapo-transpiration process is used. The evapotranspiration rateis taken as uniform over the entire island and static overtime. Furthermore, the process is assumed to take up purewater, such that all dissolved solids are accumulated in theresidual groundwater. In reality, the evapotranspirationrate along the vegetated fringe will differ from that in thecentre of the island. Moreover, at the beginning of the accu-mulation process, the groundwater quality will be suitableto allow plant growth across the entire island, which corre-sponds to high transpiration rates. As the centre of the is-land becomes successively salinized, plants die off and theevapotranspiration rate is reduced. Finally, contrary tothe model assumptions, the natural evapotranspiration pro-cess does not accumulate all dissolved components in thegroundwater. Some components are partly incorporatedinto the plants or deposited in the unsaturated soil zone.
Another important idealisation of the present model ap-proach is that we neglected the hydrogeological feedbackmechanism between simulated mineralogical changes andfluid flow. In reality the precipitation of minerals leads tocementation of the subsurface and successively reducesthe hydraulic conductivity and porosity. Reduced hydraulicconductivities may further delay the onset of density drivenflow while reduced porosities reduce the lag-time. The neteffect of changing the pore space geometry in the aquifer
cannot be estimated with the modelling approach presentedhere but may provide scope for future work.
The Okavango Delta is subject to a steady evolution ofthe flow system, which may result from channel blockages,sedimentation, rift system subsidence and/or tilting. Theseprocesses affect the life cycle of individual islands, sincewater levels and hydraulic gradients in the aquifer changeconstantly. Islands also evolve in time, even withoutchanges in the large-scale flow system. With time, the sali-nized central zone grows successively, as can be deducedfrom the dead trees that are frequently encountered just in-side a ring of healthy vegetation. Potentially, the chemicalstate of the individual islands could therefore give impor-tant information on overall system dynamics. The chemicalcomposition and the size of the accumulation zone couldboth be used as indicators or measures on how long presenthydrological conditions have prevailed in a specific area.
Conclusions
Density-driven flow establishes vertically downward direc-ted solute transport against an evapotranspiration-inducedupward hydraulic gradient on islands in the Okavango Delta.The major influence that geochemical reactions impose onthis process is an increased lag time before density-drivenflow patterns are established. All simulations show,however, that eventually, density-driven flow stabilizesdissolved solids concentrations on the islands. Mineral pre-cipitation is an important mass loss mechanism that in-creases the time until the onset of density-driven flow andchanges the chemical composition of the shallow groundwa-ter at the onset of density-driven flow. In the simulationswith high initial concentrations of humic substances, de-gassing of CO2 emerges as a major mass loss mechanism.However, the data collected as part of the present studyprovide very little evidence for this process to occur. Whilethe chemical processes control the duration of the accumu-lation phase and the chemical composition of the shallow
404 P. Bauer-Gottwein et al.
groundwater, it is evident that the direction of the salinityplume primarily depends on the regional flow field.
Lag-times to the onset of density driven flow vary be-tween the different simulation modes and are also sensitiveto several model parameters, most importantly the disper-sivity and the initial humic acid concentration. Peak con-centrations at the onset of density driven flow are mainlydetermined by three factors: the initial amount of humicsubstances, the evapotranspiration rate and the hydraulicconductivity. The concentrations measured in the centreof the accumulation zone on the islands are in good agree-ment with the modelled peak concentrations.
The model results presented here suggest that lag-timesare generally less than 1000 years after the start of theaccumulation. Mineral precipitation delays the onset ofdensity driven flow and slows down the rate of density dri-ven flow once a steady state flow/transport pattern isestablished, while complexation causes further delay. Thelatter results from the significant loss of dissolved carbonto the gas phase. For the investigated islands, complexationdoes not seem to play a significant role, but the process maybe more important at other locations, given the high organiccarbon concentrations that are generally encountered in theOkavango Delta.
The major physical and chemical phenomena observedon islands in the Okavango Delta can be quantitativelyunderstood by coupled numerical modelling. It was foundthat the observations from the three islands are in at leastqualitative agreement with modelling results. Sampling dataand results from geophysical surveys confirm that on ThataIsland, density-driven flow is fully developed. For the twoother islands, only a limited set of field data is currentlyavailable. However, these data suggest an ongoing accumu-lation on both of these islands. The phenomenon of saltaccumulation described in this article is ubiquitous in theOkavango Delta and can be observed on the vast majorityof the islands. Therefore density-driven flow appears to bean important salt removal process in the Delta. Its impor-tance for the system as a whole should be investigated usingregional-scale salinity mapping techniques such as airborneelectromagnetic surveys.
Acknowledgements
This research was partially funded under project number TH13/01-1 by ETH Zurich. H.P. was partially supported by the5th framework EU project CORONA and by the BP Center ofExpertise in Soil and Groundwater. T.L. was supported by atravel grant from CSIRO Land and Water, Australia. Com-ments by Rasmus Jakobsen, Mike Trefry and two anonymousreviewers significantly improved the manuscript.
References
Bauer, P., Thabeng, G., Stauffer, F., Kinzelbach, W., 2004. Estima-tion of the evapotranspiration rate from diurnal groundwaterlevel fluctuations in the Okavango Delta, Botswana. Journal ofHydrology 288 (3–4), 344–355.
Bauer, P., Held, R., Zimmermann, S., Linn, F., Kinzelbach, W.,2006a. Coupled flow and salinity transport modelling in semi-
arid environments: the Shashe River Valley, Botswana. Journalof Hydrology 316 (1–4), 163–183.
Bauer, P., Supper, R., Zimmermann, S., Kinzelbach, W., 2006b.Geoelectrical imagingofgroundwater salinization in theOkavangoDelta, Botswana. Journal of Applied Geophysics 60, 126–141.
Bauer, P., Gumbricht, T., Kinzelbach, W., 2006c. A regionalcoupled surface water/groundwater model of the OkavangoDelta, Botswana. Water Resources Research 42 (4), W04403.doi:10.1029/2005WR004234.
Cai, W.J., Wang, Y.C., Krest, J., Moore, W.S., 2003. The geochem-istry of dissolved inorganic carbon in a surficial groundwateraquifer in North Inlet, South Carolina, and the carbon fluxes tothe coastal ocean. Geochimica et Cosmochimica Acta 67 (4),631–639.
De Nys, E., Raes, D., Le Gal, P.Y., Cordeiro, G., Speelman, S.,Vandersypen, K., 2005. Predicting soil salinity under variousstrategies in irrigation systems. Journal of Irrigation and Drain-age Engineering – ASCE 131 (4), 351–357.
Dincer, T., Hutton, L.G., Khupe, B., 1978. The study of flowdistribution, surface-groundwater and evaporation-transpirationrelations in the Okavango Swamp, Botswana with stable iso-topes. In: I.A.E.A. Symposium on Isotope Hydrology. I.A.E.A.,Neuherberg, Germany, pp. 3-26.
Dincer, T., Child, S., Khupe, B.B.J., 1987. A simple mathematicalmodel of a complex hydrological system, Okavango Swamp,Botswana. Journal of Hydrology 93, 41–65.
Ellery, W.N., Ellery, K., McCarthy, T.S., 1993a. Plant distribution inislands of the Okavango Delta, Botswana: determinants andfeedback interactions. African Journal of Ecology 31, 118–134.
Ellery, W.N., Ellery, K., Rogers, K.H., McCarthy, T.S., Walker, B.H.,1993b. Vegetation, hydrology and sedimentation processes asdeterminants of channel form and dynamics in north-easternOkavango Delta, Botswana. African Journal of Ecology 31, 10–25.
Eugster, H.P., Jones, B.F., 1979. Behaviour of major solutes duringclosed-basin brine evolution. American Journal of Science 279(6), 609–631.
Freedman, V.L., Ibaraki, M., 2002. Effects of chemical reactions ondensity-dependent fluid flow: on the numerical formulation andthe development of instabilities. Advances in Water Resources25 (4), 439–453.
Gieske, A., 1996. Vegetation driven groundwater recharge belowthe Okavango Delta (Botswana) as a solute sink mechanism – anindicative model. Botswana Journal of Earth Sciences 3, 33–37.
Gieske, A., 1997. Modelling outflow from the Jao/Boro River systemin the Okavango Delta, Botswana. Journal of Hydrology 193,214–239.
Greskowiak, J., Prommer, H., Vanderzalm, J., Pavelic, P., Dillon,P., 2005. Modelling of carbon cycling and biogeochemicalchanges during a wastewater injection and recovery experimentat Bolivar/South Australia. Water Resources Research 41 (10),W10418. doi:10.1029/2005WR004095.
Gumbricht, T., McCarthy, T.S., Merry, C.L., 2001. The topographyof the Okavango Delta, Botswana, and its tectonic and sedi-mentological implications. South African Journal of Geology 104,243–264.
Guo, W., Langevin, C.D., 2002. User’s guide to SEAWAT: a computerprogram for simulation of three-dimensional variable-densityground-water flow, USGS, Techniques of Water-Resources Inves-tigations 6-A7, Tallahassee, Florida.
Harbaugh, A.W., McDonald, M.G., 1996a. User’s Documentation forMODFLOW-96, an update to the US geological survey modularfinite-difference ground-water flow model, US Geological Sur-vey, Reston, VI.
Harbaugh, A.W., McDonald, M.G., 1996b. Programmer’s documen-tation for MODFLOW-96, an update to the US Geological surveymodular finite-difference ground-water flow model, US Geolog-ical Survey, Reston, VI.
Okavango Delta Islands: Interaction between density-driven flow and geochemical reactions under evapo-concentration 405
Hendry, M.J., Buckland, G.D., 1990. Causes of soil salinization. 1. Abasin in SouthernAlberta, Canada.GroundWater 28 (3), 385–393.
Hendry, M.J., Chan, G.W., Harker, D.B., 1990. Causes of soilsalinization. 2 A basin in East-Central Alberta, Canada. GroundWater 28 (4), 544–550.
Herczeg,A.L., Lyons,W.B., 1991.A chemical-model for theevolutionof Australian sodium-chloride Lake Brines. PalaeogeographyPalaeoclimatology Palaeoecology 84 (1–4), 43–53.
Hill, M.C., 1998. Methods and guidelines for effective modelcalibration. US Geological Survey Water Resources InvestigationsReport 98-4005. USGS, Denver, Colorado.
Hutchins, D.G., Hutton, L.G., Hutton, S.M., Jones, C.R., Loenhert,E.P., 1976. A summary of the geology, seismicity, geomorphol-ogy and hydrogeology of the Okavango Delta, Geological SurveyBotswana, Gaborone.
Kotb, T.H.S., Watanabe, T., Ogino, Y., Tanji, K.K., 2000. Soilsalinization in the Nile Delta and related policy issues in Egypt.Agricultural Water Management 43 (2), 239–261.
Langevin, C.D., Guo, W.X., 2006. MODFLOW/MT3DMS-based simu-lation of variable-density ground water flow and transport.Ground Water 44 (3), 339–351.
Lee, R.W., 1997. Effects of carbon dioxide variations in theunsaturated zone on water chemistry in a glacial-outwashaquifer. Applied Geochemistry 12, 347–366.
McCarthy, T.S., Ellery, W.N., 1994. The effect of vegetation on soiland ground water chemistry and hydrology of islands in theseasonal swamps of the Okavango fan, Botswana. Journal ofHydrology 154, 169–193.
McCarthy, T.S., McIver, J.R., Verhagen, B.T., 1991. Groundwaterevolution, chemical sedimentation and carbonate brine forma-tion on an island in the Okavango delta swamp, Botswana.Applied Geochemistry 6, 577–598.
McCarthy, T.S., Ellery, W.N., Ellery, K., 1993. Vegetation-induced,subsurface precipitation of carbonate as an aggradationalprocess in the permanent swamps of the Okavango Delta.Chemical Geology 107, 111–131.
McCarthy, J., Gumbricht, T., McCarthy, T.S., Frost, P.E., Wessels,K., Seidel, F., 2003. Flooding patterns of the Okavango Wetlandin Botswana between 1972 and 2000. Ambio 32 (7), 453–457.
Mladenov, N., McKnight, D.M., Wolski, P., Ramberg, L., 2005.Effects of annual flooding on dissolved organic carbon dynamicswithin a pristine wetland, the Okavango Delta, Botswana.Wetlands 25 (3), 622–638.
Modisi, M.P., Atekwana, E.A., Kampunzu, A.B., Ngwisanyi, T.H.,2000. Rift kinematics during the incipient stages of continentalextension: evidence from the nascent Okavango rift basin,northwest Botswana. Geology 28 (10), 939–942.
Monnin, C., 1994. Density calculations and concentration scaleconversions for natural waters. Computers &Geosciences 20 (10),1435–1445.
Parkhurst, D.L., Appelo, C.A.J., 1999. Water resources investiga-tions report 99-4259: user’s guide to PHREEQC (Version 2) – acomputer program for speciation, batch-reaction, one-dimen-
sional transport and inverse geochemical calculations, USGeological Survey, Denver, Colorado.
Post, V.E.A., Prommer, H., submitted for publication. Multicom-ponent reactive transport simulation of the Elder problem:effects of chemical reactions on salt plume development. WaterResources Research.
Prommer, H., Stuyfzand, P.J., 2005. Identification of temperature-dependent water quality changes during a deep well injectionexperiment in a pyritic aquifer. Environmental Science &Technology 39, 2200–2209.
Prommer, H., Barry, D.A., Zheng, C., 2003. MODFLOW/MT3DMSbased reactive multi-component transport model. Ground Water42 (2), 247–257.
Silberbush, M., Ben-Asher, J., 2001. Simulation study of nutrientuptake by plants from soilless cultures as affected by salinitybuildup and transpiration. Plant and Soil 233 (1), 59–69.
Simmons, C.T., Narayan, K.A., 1998. Modelling density-dependentflow and solute transport at the Lake Tutchewop saline disposalcomplex, Victoria. Journal of Hydrology 206 (3-4), 219–236.
SMEC, 1987. Southern Okavango integrated water developmentphase 1. Final Report Technical Study, Snowy Mountain Engi-neering Corporation, Cooma, Australia.
Tipping, E., Hurley, M.A., 1992. A unifying model of cation bindingby humic substances. Geochimica et Cosmochimica Acta 56 (10),3627–3641.
Water Resources Consultants, 1997. Maun groundwater develop-ment project, Phase 1: exploration and resource assessment,Department of Water Affairs, Botswana, Gaborone.
Wooding, R.A., 1960. Rayleigh instability of a thermal boundary layerin flow through a porous medium. Journal of Fluid Mechanics 9,183–192.
Wooding, R.A., Tyler, S.W., White, I., 1997a. Convection in ground-water belowan evaporating salt lake: 1Onset of instability.WaterResources Research 33 (6), 1199–1217.
Wooding, R.A., Tyler, S.W., White, I., Anderson, P.A., 1997b.Convection in groundwater below an evaporating salt lake: 2Evolution of finger plumes. Water Resources Research 33 (6),1219–1228.
Yan, J.P., Hinderer, M., Einsele, G., 2002. Geochemical evolutionof closed-basin lakes: general model and application to LakesQinghai and Turkana. Sedimentary Geology 148 (1–2), 105–122.
Zhang, H., Schwartz, F.W., Wood, W.W., Garabedian, S.P., LeBlanc,D.R., 1998. Simulation of variable-density flow and transport ofreactive and nonreactive solutes during a tracer test at Cape CodMassachusetts. Water Resources Research 34, 67–82.
Zheng, C., Wang, P.P., 1999. MT3DMS: a modular three-dimensionalmultispecies transport model for simulation of advection,dispersion, and chemical reactions of contaminants in ground-water systems; documentation and user’s guide. US Army Corpsof Engineers, Washington, DC.
Zimmermann, S., Bauer, P., Held, R., Walther, J., Kinzelbach, W.,2006. Salt transport on Islands in the Okavango Delta: numericalinvestigations. Advances in Water Resources 29 (1), 11–29.