Embed Size (px)
Citation preview
Old Lineages in a New Ecosystem: Diversification ofArcellinid Amoebae (Amoebozoa) and Peatland MossesOmar Fiz-Palacios1*., Brian S. Leander2, Thierry J. Heger2.
1 Systematic Biology Program, Department of Organismal Biology, Evolutionary Biology Centre, Uppsala, Sweden, 2 Biodiversity Research Center, Departments of Zoology
and Botany, University of British Columbia, Vancouver, BC, Canada
Abstract
Arcellinid testate amoebae (Amoebozoa) form a group of free-living microbial eukaryotes with one of the oldest fossilrecords known, yet several aspects of their evolutionary history remain poorly understood. Arcellinids occur in a range ofterrestrial, freshwater and even brackish habitats; however, many arcellinid morphospecies such as Hyalosphenia papilio areparticularly abundant in Sphagnum-dominated peatlands, a relatively new ecosystem that appeared during thediversification of Sphagnum species in the Miocene (5–20 Myr ago). Here, we reconstruct divergence times in arcellinidtestate amoebae after selecting several fossils for clock calibrations and then infer whether or not arcellinids followed apattern of diversification that parallels the pattern described for Sphagnum. We found that the diversification of corearcellinids occurred during the Phanerozoic, which is congruent with most arcellinid fossils but not with the oldest knownamoebozoan fossil (i.e. at ca. 662 or ca. 750 Myr). Overall, Sphagnum and the Hyalospheniidae exhibit different patterns ofdiversification. However, an extensive molecular phylogenetic analysis of distinct clades within H. papilio species complexdemonstrated a correlation between the recent diversification of H. papilio, the recent diversification of Sphagnum mosses,and the establishment of peatlands.
Citation: Fiz-Palacios O, Leander BS, Heger TJ (2014) Old Lineages in a New Ecosystem: Diversification of Arcellinid Amoebae (Amoebozoa) and PeatlandMosses. PLoS ONE 9(4): e95238. doi:10.1371/journal.pone.0095238
Editor: Gareth Bloomfield, MRC Laboratory of Molecular Biology, United Kingdom
Received January 10, 2014; Accepted March 24, 2014; Published April 24, 2014
Copyright: � 2014 Fiz-Palacios et al. This is an open-access article distributed under the terms of the Creative Commons Attribution License, which permitsunrestricted use, distribution, and reproduction in any medium, provided the original author and source are credited.
Funding: This work was funded by Swedish Research Council Linne grant to OFP; the Swiss NSF project PA00P3 145374 to TJH; the National Science andEngineering Research Council of Canada (NSERC 283091-09); and the Tula Foundation’s Centre for Microbial Diversity and Evolution at the University of BritishColumbia. BSL is a Fellow of the Canadian Institute for Advanced Research. The funders had no role in study design, data collection and analysis, decision topublish, or preparation of the manuscript.
Competing Interests: The authors have declared that no competing interests exist.
* E-mail: [email protected]
. These authors contributed equally to this work.
Introduction
The Amoebozoa is a sister clade to animals and fungi and is
considered to reflect one of the most ancient lineages of eukaryotes
[1,2]. Amoebozoans are unicellular eukaryotes, but a few taxa
such as the model species Dictyostelium discoideum can form
multicellular structures when nutrient conditions are limiting.
Although the phylogenetic relationships within the Amoebozoa
are far from being fully resolved, one subgroup, the Tubulinea, has
been consistently recovered with strong statistical support [3–5],
and includes one of the most species-rich groups of amoebozoans,
namely the Arcellinida (.1000 species) [3,4,6]. Arcellinid amoe-
bae occur in a range of terrestrial, freshwater and even brackish
habitats [7,8], and are particularly diverse and abundant in
Sphagnum-dominated peatlands [9–11]. Several testate amoebae
within the Hyalospheniidae, such as Nebela carinata and Hyalosphenia
papilio, are very abundant in Sphagnum mosses, but they can be also
found in other mosses if relative constant moisture and low pH are
present [8,12,13]. Both the arcellinid amoebae, which are
characterized by the presence of a test (syn. shell) and the
Sphagnales mosses (Plantae: Sphagnopsida) have an ancient fossil
record of hundreds of millions of years [14,15]. Despite this long-
lasting persistence of the Sphagnales, the radiation of the current
diversity (ca. 300 species) occurred recently in the Miocene [16]. It
is inferred that Sphagnum-dominated peatlands are as recent as the
radiation of Sphagnum mosses.
The presence of a test in arcellinids makes them the only lineage
of amoebozoans with a rich and well-preserved fossil record, which
offers a rare opportunity to calibrate this part of the tree of
eukaryotes. However, despite being one of the oldest lineages of
eukaryotes in the fossil record (ca. 750 Myr fossils; [15]), the
evolutionary history and diversification of arcellinids have not
been studied in detail. It is unclear whether the high diversity of
arcellinids, and in particular the Hyalospheniidae [17], reflects
ancient and/or recent diversification events. Also, the taxonomic
assignments and phylogenetic positions of arcellinid fossils remain
largely ambiguous and are subject to much debate [1,2,18].
Although a putative arcellinid fossil of ca. 750 Myr has been
previously used to reconstruct divergence times [1,2], representa-
tives of the closest sister groups to arcellinids (Amoebidae,
Hartammellidae and Poseidonida) have not been incorporated
into previous analyses. Therefore, the 750 Myr old fossil has not
strictly been assigned to the Arcellinida but instead to nodes within
the Tubulinea. Ages much younger than the 750 Myr fossils have
been recently inferred for arcellinids in analyses of amoebozoan
divergence times using the closest sister groups to arcellinids (e.g.,
Nolandella; [19]).
The aim of the present study is to reconstruct the evolutionary
history of arcellinids, with special emphasis on the diversification
PLOS ONE | www.plosone.org 1 April 2014 | Volume 9 | Issue 4 | e95238
of the Hyalospheniidae. After careful examination of arcellinid
fossils, we reconstructed divergence times in these testate amoebae
using a robust phylogeny inferred from multiple genetic markers.
Moreover, we compared the diversification pattern recovered
within the Hyalospheniidae, particularly in species very abundant
in Sphagnum-dominated peatlands such as Hyalosphenia papilio, with
the pattern of diversification in Sphagnum mosses. A mitochondrial
cytochrome c oxidase subunit 1 (COI) dataset, including all
publicly available and new sequences, was used to reconstruct the
diversification pattern within the Hyalospheniidae. The 99%
sequence similarity threshold and the Generalized Mixed Yule
Coalescent (GMYC) model [20,21] were used to identify
evolutionarily independent units (i.e., putative species) for different
morphospecies within the Hyalospheniidae.
Materials and Methods
2.1 COI amplification and sequencingMitochondrial cytochrome c oxidase subunit I gene (COI)
fragments were obtained from a total of eighteen single cells of the
morphospecies Arcella sp (Figure S1A), Hyalosphenia papilio, Nebela
collaris, N. flabellulum, N. marginata (Figure S1C–E), and one
unidentified Nebela morphospecies (Figure S1B). The single cell
specimens were isolated, amplified by semi-nested PCR, and
sequenced as described in Heger and colleagues [22]. Single cell
specimens were isolated either from Sphagnum moss or litter
samples (Table S1). The specific and universal primers used in this
study are listed in Table S2. COI sequences were deposited in
GenBank with the accession numbers KJ544147- KJ544164. Five
of the single cells that we sequenced were also characterized with
light microscopy (Figure S1).
2.2 Dataset constructionsReconstruction of divergence times in arcellinids was carried
out using two datasets. The first matrix consisted of five
concatenated proteins (i.e. actin, alpha-tubulin, beta-tubulin,
eEF2 and 14-3-3) plus small subunit (SSU) rDNA sequences and
corresponds with the alignment recently published by Lahr and
colleagues [4]. This alignment contains a total of 53 tubulinean
taxa (including 29 arcellinids). In order to distinguish the signal
from these two sources, two sub-matrices were analyzed: one
consisted of the five proteins for 30 taxa (including 19 arcellinids)
and the other one consisted of SSU rDNA sequences for 49 taxa
(including 24 arcellinids).
The second matrix consisted of COI sequences which were
obtained from three different sources: (i) 16 Hyalospheniidae
isolates and two new sequences from Arcella sp. (Table S1); (ii) 85
additional isolates within the Hyalospheniidae from Kosakyan and
colleagues [23,24]; and (iii) 298 isolates of the morphospecies
Hyalosphenia papilio from Heger and colleagues [22]. These 401
COI sequences (Table S1 and Table S3) were manually aligned
into the Kosakyan and colleagues’ [24] alignment with the
program Bioedit 7.0.9 [25]. When several sequences were identical
or differed only by the presence of unknown nucleic acid residues
(N), only the longest sequence was kept. The final alignment
comprised 125 COI sequences.
2.3 Phylogenetic reconstructions of the COI datasetMolecular phylogenetic analyses were performed on the 125-
taxon alignment. Tree reconstructions were conducted using
Maximum Likelihood (ML) analyses using Treefinder [26] and
Bayesian inference methods using MrBayes v. 3.1.2 [27] as
described in Heger and colleagues [22]. The Modeltest program
[28] identified the general-time-reversible model with invariable
sites and gamma distribution (GTR+I+G) as the most appropriate
model of sequence evolution. Inferred trees were rooted with the
two new Arcella COI sequences, an inferred sister group of the
Hyalospheniidae [29]. ML analyses were run for 500 replicates.
Trees were viewed using FigTree (program distributed as part of
BEAST: http://tree.bio.ed.ac.uk/software/figtree/).
2.4 Species delimitationWe identified genetic lineages with the Hyalospheniidae based
on a 99% sequence similarity threshold, as suggested by Heger
and colleagues [22]. Sequence divergences were calculated using
the Kimura 2-parameter [30] in R, version 3.01 [31], using the
package ‘ape’, version 3.0-1. Subsequently, we used the General
Mixed Yule Coalescent (GMYC) model as a complementary
species criterion [20,21]. The GMYC method is based on the shift
in the branching rate of the phylogenetic tree [20,32,33]. GMYC
analyses were performed as described by Heger and colleagues
[22]. The performance of the single threshold [20] and multiple
threshold model [33] did not differ significantly, as revealed by the
Chi-squared comparison test (chi square = 4.419, d.f. = 3,
P = 0.219; Figure 1).
2.5 Reconstruction of divergence times and fossilassignment
Divergence times were reconstructed using BEAST v1.6 [34].
BEAST analyses on the five proteins plus SSU rDNA used the
WAG+G and GTR+G models of substitution, respectively. For
the COI dataset, the GTR+G model was used following the
Kosakyan and colleagues [24] analyses. Uncorrelated lognormal
(UCLN) model allowing different rates in different branches of the
tree was applied. All analyses were run for 206106 generations, of
which 5 million were discarded as burn-in. All fossils were
constrained applying a uniform distribution. Different combina-
tions of fossils were explored as described below.
Fossil calibration was applied to five nodes where 10 fossil
records could be assigned. These 10 fossil records correspond to
two arcellinids, two Arcella, two Centropyxis, one hyalospheniid, two
Difflugia and one Lesquereusia; all were selected from a wide variety
of publications (Table 1, Table S4). An age of 770 Myr from the
oldest arcellinid fossils (770-742 Myr; [15]) was used on the root as
a maximum bound (node A; Figure 2), which allows considering
the second oldest record (662 Myr, [35]). This node includes non-
arcellinid taxa but phylogenetic analyses have revealed that
arcellinid testate amoebae are paraphyletic within the Tubulinea
[4]; therefore, we used it only as a maximum age constraint. A
conservative age for the Arcella fossils was used for its crown node
(node D; Figure 2) at a minimum bound of 100 Myr (mid
Cretaceous; [36]) and a maximum bound of 5% older (105 Myr).
Because the phylogenetic position of Centropyxis is not resolved [4],
its fossil age (220 Myr, Carnian within the Triassic, [37]) was
assigned to the first well-resolved node containing Centropyxis as a
minimum age (node B; Figure 2) and a maximum bound equal to
the root age (770 Myr). The Hyalospheniidae fossil (node C;
Figure 2) was used as a conservative minimum bound (100 Myr,
Albian–Cenomanian, within the Cretaceous; [38]) and a maxi-
mum bound equal to the root age (770 Myr) was applied in order
to explore the uncertainty of the age of this clade. Two taxa
represented in our dataset, Difflugia and Lesquereusia, could be used
for the assignment of two fossils from the lower Albian
(Cretaceous; [39,40]). Difflugia is a paraphyletic group [41], which
leads to uncertainty. With this in mind, we explored the effect on
the initial calibration scheme of constraining the split of Difflugia-
Lesquereusia (node E) to a conservative minimum age of 100 Myr
and a maximum age equal to the root (770 Myr). In addition, to
Diversification of Arcellinid Amoebae
PLOS ONE | www.plosone.org 2 April 2014 | Volume 9 | Issue 4 | e95238
Diversification of Arcellinid Amoebae
PLOS ONE | www.plosone.org 3 April 2014 | Volume 9 | Issue 4 | e95238
evaluate the accuracy of nodes D and E, the Difflugia-Lesquereusia
calibration (node E .100,105 Myr) was combined with a
relaxation of Arcella upper bound (node D) to an age equal to the
root. All these calibrations were combined into three different
analyses to check congruency among them (Table 2).
In order to evaluate three recently published fossils records, we
also explored alternative fossil age assignments of 299 Myr for (i)
Arcella (node D), (ii) Centropyxis (node B) and (iii) Difflugia and
Lesquereusia (node E); we examined each of them independently
following two recent reports [42]. Because this new calibration is
three times older than the initial calibrations for Arcella and
Difflugia, an upper bound of 5% older (314 Myr) was applied in
both analyses. In light of the fact that preliminary analyses
recovered the maximum bound for the root (ca. 770 Myr), we
allowed a relaxation of the root age to ,3000 Myr.
For the COI marker analysis, the alignment comprises one
sequence from each evolutionarily independent lineage detected
with the GMYC model. The Hyalospheniidae crown age was
calibrated using an age range reconstructed from the result of the
three main analyses of arcellinids (Table 2; Figure 3). These results
were used as minimum and maximum bounds applying a uniform
distribution. The root between Arcella and the Hyalospheniidae
was constrained to a reasonable maximum bound of 500 Myr (five
times older than its fossil record). Inclusion of Arcella as the
outgroup in the COI analysis allowed us to evaluate the Arcella -
Hyalospheniidae split with results from the concatenated dataset.
2.6 Diversification rates and saturation analysesA model fit to speciation with one, two or three diversification
rates was tested with LASER [43]. This program compares birth-
death models with various rates of diversification against the null
expectation of a constant rate. LASER was used to identify when a
given shift on diversification rate occurred in our GMYC species
chronograms. One hundred trees were randomly taken from the
GMYC Highest Posterior Density trees (HPD) and analysed with
LASER. The critical Delta AICrc value was estimated from
simulations under rate-constant model. Lineage-Through-Time
(LTT) plots were drawn for these chronograms. The overall
diversification rate assuming an extinction between 0 and 0.9 was
estimated with Magallon and Sanderson [44] equation 7 as
implemented in R version 3.01 [31]. The program DAMBE [45]
was used to analyze nucleotide saturation in our dataset. No
saturation was observed for the COI data set (data not shown).
Results
3.1 New sequences obtained in this studyEighteen new COI sequences were obtained for the present
study (i.e., two Arcella sp. and 21 isolates within the Hyalo-
spheniidae; Table S1). The obtained COI fragment lengths ranged
from 338 bp to 631 bp. The two Arcella sp. sequences represented
the first arcellinid COI sequences that did not belong to the
Hyalospheniidae. Both Arcella sp. sequences were identical even
though they were isolated from different regions.
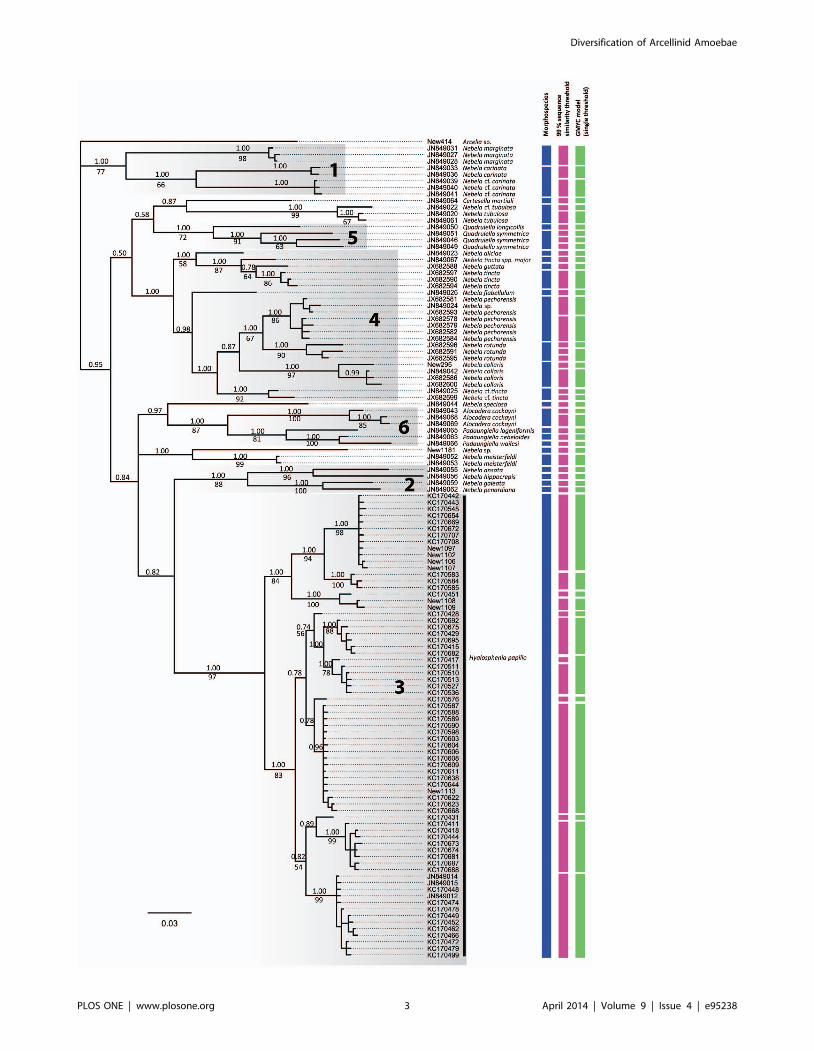
3.2 COI phylogeny and species delimitationBayesian and Maximum Likelihood analyses were congruent
with each other, with only a few exceptions. Our phylogenetic tree
revealed six main clades (Figure 1), as reported in Kosakyan and
colleagues [24]. Bayesian analyses provided the highest posterior
probabilities (PP) for these six lineages (i.e., 1.00 PP), and
Maximum Likelihood analyses provided strong to moderate
statistical support, except for clade 4, which is not supported
(Figure 1). Besides these six clades, a few species had an uncertain
affiliation, such as the newly sequenced Nebela sp. (Figure S1B).
Based on comparative morphology, a total of 26 morphospecies
were identified. Sequences from the same morphospecies formed a
monophyletic group, except the sequences from the N. tincta
complex (Figure 1). The number of non-identical sequences per
morphospecies varied from one to seventy one (i.e., Hyalosphenia
papilio). Based on a 99% sequence similarity threshold, forty-nine
lineages were identified. Similarly, the General Mixed Yule-
coalescent (GMYC), based either on the single or multiple
threshold model, revealed a total of forty-seven entities. Within
the H. papilio morphospecies, which has been intensively sampled,
both the 99% sequence similarity threshold and the GMYC model
Figure 1. Bayesian tree of 124 COI sequences from within the Hyalospheniidae (outgroup specimens excluded). Bayesian posteriorprobability $0.5 and Bootstrap values $50% are given above and beneath the node, respectively. The first column on the right (green boxes) clustersindividuals according to the morphology, the second column according to the 99% sequence similarity and the third according to the singlethreshold GMYC model. The grey boxes represent the six main clades described by Kosakyan and colleagues [24].doi:10.1371/journal.pone.0095238.g001
Table 1. Reference of relevant fossil records and calibrations used in this study.
Taxa Node Period Calibration (Myr) Reference
Arcellinida A Neoproterozoic, Cryogenian ca. 662 [35]
Arcellinida A Neoproterozoic ,770-742 [15]
Centropyxis B Carnian (Triassic) .220 [37]
Hyalospheniidae C Albian– Cenomanian (Cretaceous) .100 [38]
Arcella D Mid Cretaceous .100 [36]
Difflugia E Lower Albian (Cretaceous) .100 [40]
Lesquereusia, Difflugia E Late Albian (Cretaceous) .100 [39]
Arcella, Centropyxis Difflugia, Lesquereusia B, D, E Early Permian .299 [49]
Arcella, Centropyxis Difflugia B, D, E Late Carboniferous–Early Permian .299 [42]
Taxonomic assignment, geological time and period are taken from the references (right column). Placement of the fossil in each corresponding node (see Figure 2) isindicated. Time of the fossil record is in Myr (million years).doi:10.1371/journal.pone.0095238.t001
Diversification of Arcellinid Amoebae
PLOS ONE | www.plosone.org 4 April 2014 | Volume 9 | Issue 4 | e95238
revealed an important number of putative species (13 and 12,
respectively). Overall, the 99% sequence similarity threshold and
the GMYC model provide convincing support for the identifica-
tion of Evolutionarily Independent Units within the Hylalo-
spheniidae [22,46] (Figure 3).
3.3 Fossil calibrations in arcellinid testate amoebaeThe validity of the fossil records was evaluated by reconstructing
divergence times with different combinations of fossils. The
reconstructed age of the Hyalospheniidae is robust across different
calibration schemes (Table 2). The original scheme of four fossils
gives an age of 132 (100–198) Myr for the Hyalospheniidae. For
Arcella, Centropyxis, and Difflugia-Lesqueresia, two alternative fossil
ages were used. The use of two different combinations of the upper
bounds of the fifth fossil Difflugia-Lesqueresia (node E; 100 Myr) with
Arcella fossil (node D; 100 Myr) retrieved similar ages overall to the
four fossils scheme (Table 2): 141 (100–216) and 145 (100–228)
Myr for the Hyalospheniidae. The original scheme using 220 Myr
for Centropyxis also recovered similar ages to the alternative scheme
using 299 Myr (Table 2): 132 (100–198) vs 146 (100–225) Myr for
the Hyalospheniidae, respectively; 483 (334–703) vs. 573 (440–
757) Myr for the root, respectively. In contrast, the use of an
alternative age of 299 Myr vs 100 Myr for Arcella and for Difflugia-
Lesquereusia gave unrealistic ages given the oldest undisputed fossil
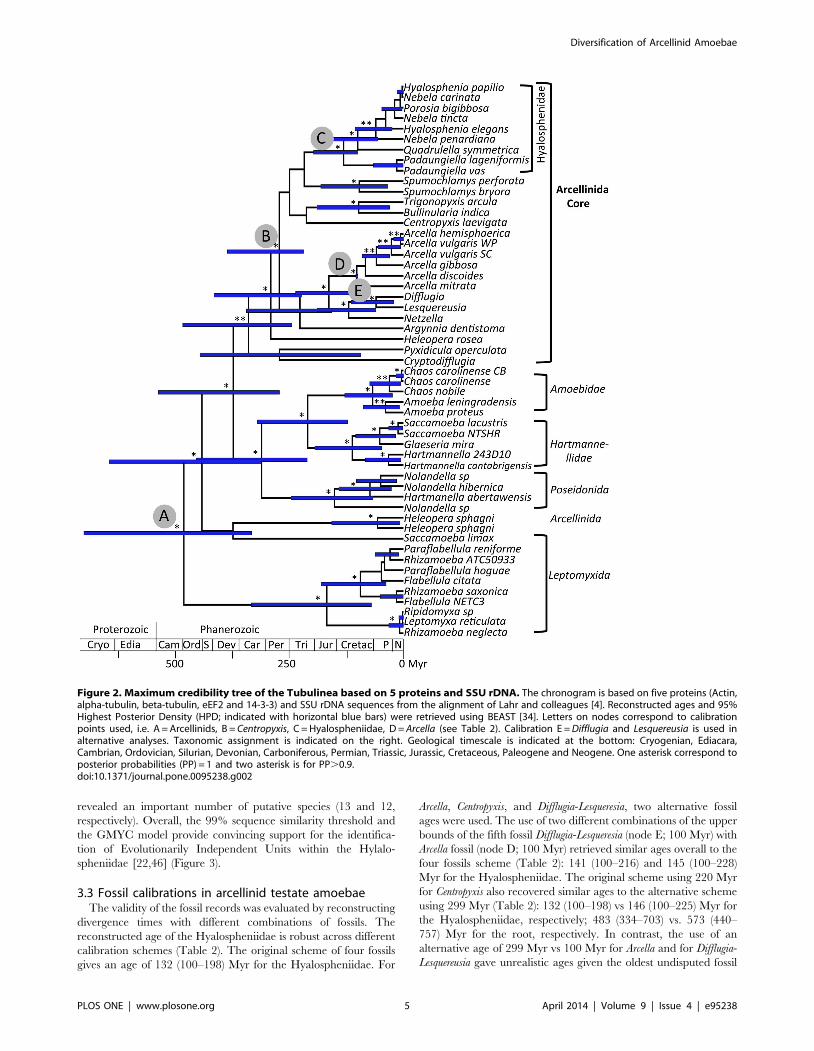
Figure 2. Maximum credibility tree of the Tubulinea based on 5 proteins and SSU rDNA. The chronogram is based on five proteins (Actin,alpha-tubulin, beta-tubulin, eEF2 and 14-3-3) and SSU rDNA sequences from the alignment of Lahr and colleagues [4]. Reconstructed ages and 95%Highest Posterior Density (HPD; indicated with horizontal blue bars) were retrieved using BEAST [34]. Letters on nodes correspond to calibrationpoints used, i.e. A = Arcellinids, B = Centropyxis, C = Hyalospheniidae, D = Arcella (see Table 2). Calibration E = Difflugia and Lesquereusia is used inalternative analyses. Taxonomic assignment is indicated on the right. Geological timescale is indicated at the bottom: Cryogenian, Ediacara,Cambrian, Ordovician, Silurian, Devonian, Carboniferous, Permian, Triassic, Jurassic, Cretaceous, Paleogene and Neogene. One asterisk correspond toposterior probabilities (PP) = 1 and two asterisk is for PP.0.9.doi:10.1371/journal.pone.0095238.g002
Diversification of Arcellinid Amoebae
PLOS ONE | www.plosone.org 5 April 2014 | Volume 9 | Issue 4 | e95238
records of eukaryotes: root 1098 (685–1550) Myr and 1213 (814–
1700) Myr (Table 2 and Table S5). Therefore, the 299 Myr fossil
record of Arcella and Difflugia-Lesquereusia was not taken into
account. Overall, the original scheme of four fossils gives slightly
narrower confidence intervals and the incorporation of the 299
Myr fossils for Centropyxis, Arcella and Difflugia-Lesquereusia clade
retrieved older ages.
3.4 Reconstruction of divergence times in ArcellinidaOur reconstruction of divergence times using five calibration
points recovered an age of arcellinids sensu stricto (i.e. core
Arcellinida) of 341–409 (245–529) Myr (Table 2). The age of the
root, in this study considered as Arcellinida sensu lato was
reconstructed at 483–573 (334–757) Myr. An age similar to the
oldest fossils attributed to arcellinids of 770–742 Myr [15] or
alternatively 662 Myr [35] was only reached when using
unrealistic fossil record ages like 299 Myr for Arcella, which
recovered an age of over 1000 Myr for the root (Table S5). By
contrast, the age reconstructed for the Hyalospheniidae of 132–
146 (100–225) Myr from multiple fossil combinations predates its
oldest fossil record (ca. 100 Myr; Albian–Cenomanian, [38]) that
was used as minimum bound in the reconstructions.
Results from the concatenated dataset were in agreement with
both the five-protein dataset alone and SSU rDNA dataset alone.
The root of the tree was 483 (334–703) Myr for the concatenated
dataset based on the original calibration scheme (Table 2 and
Table S5), 475 (289–705) Myr for the five-protein dataset and 429
(299–643) Myr for the SSU rDNA dataset. When considering the
confidence intervals, the SSU rDNA sequences retrieved slightly
younger ages (Table S5). The main difference between the
concatenated and the two partitioned analyses was the absence of
Centropyxis in the five-protein dataset; therefore, the confidence
intervals for its corresponding node (node B) recovered a lower
bound of 147 Myr (while fossil dates are 220 Myr). The main
incongruence between the two partitioned analyses and the
concatenated analyses comes from the Hyalospheniidae clade
that is reconstructed at 170 Myr in the analysis of the five-protein
dataset (Table S5). This was even more striking because the basal
split within the Hyalospheniidae (between Padaungiella and the rest
of Hyalospheniidae) was not present in the five-protein dataset.
The age of this node (170 Myr) correponded to 89 Myr in the
analysis of SSU rDNA and 100 Myr in the analysis of the
concatenated dataset. This discrepancy reflected the high propor-
tion of missing data and resulting long branches found for Nebela
carinata (170 Myr; Table S5) in the five-protein analysis as
compared to the concatenated analysis (Figure 2); the three
remaining species of Hyalospheniidae split 60 Myr ago.
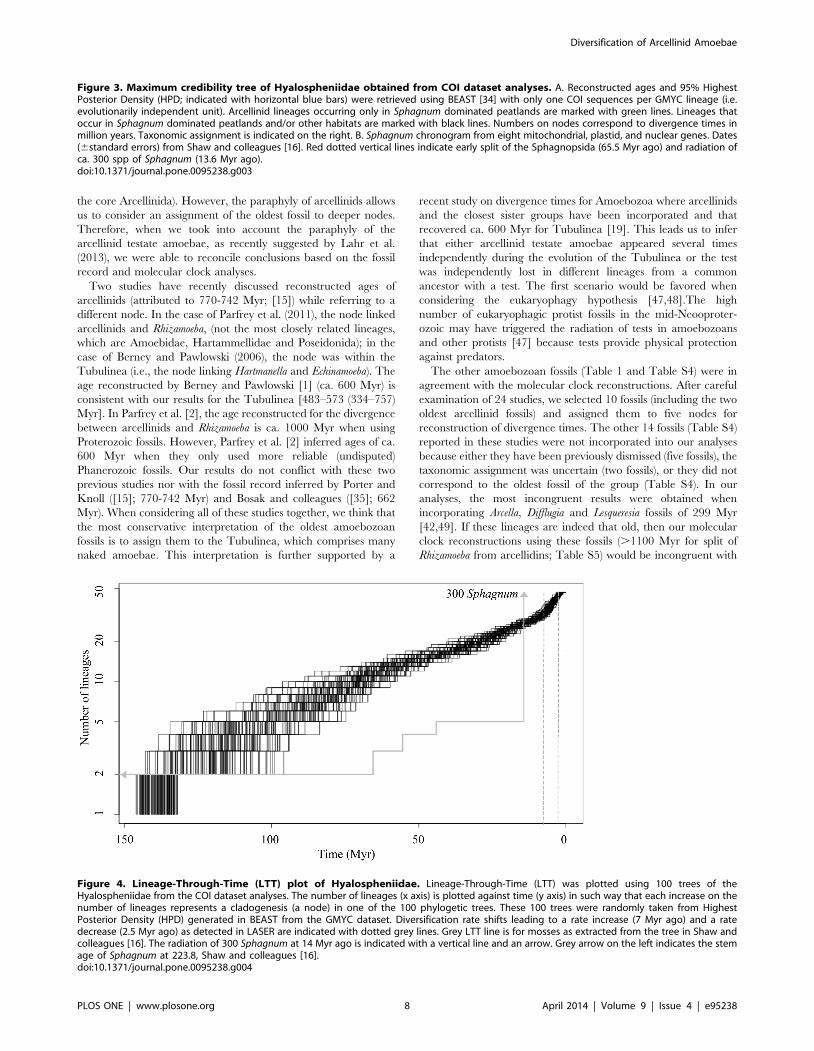
3.5 Diversification of Hyalospheniidae from COI markerA constant diversification was observed in the Lineage-
Through-Time (LTT) plots of the Hyalospheniidae from the
crown age until ca. 10 Myr from (Figure 4). Analyses of 100 trees
randomly taken from the GMYC Highest Posterior Density trees
(HPD) recovered a mean shift time leading to a rate increase 7
Myr ago (95% CI = 4.9–10.3) followed by a rate decrease 2.5 Myr
ago (95% CI = 2.1–10.3). Forty-five out of 100 trees showed a
Delta AICrc higher than the critical Delta AICrc value (4.15) for
the yule-3-rates against the best rate constant birth-death model.
The overall diversification rate from the GMYC trees varied
between 0.023–0.012 (extinction 0 and 0.9, respectively).
The analysis using the GMYC model demonstrated a high
proportion of evolutionarily independent units older than 7 Myr.
However, evenly distributed cladogenesis in the last 25 Myr was
only seen for three morphospecies complexes: Quadrulella symme-
trica, Nebella tincta sensu lato and Hyalosphenia papilio. The new
samples sequenced in this study recovered two new cladogenetic
events of ,7 Myr for N. tincta (New 295 = KJ544161) and H. papilio
(New 1108 = KJ544152 and New 1109 = KJ544153) and a new
cladogenesis event of .90 Myr for Nebela sp. (New
1181 = KJ544164). However, inclusion of more samples not
always means ancient cladogenesis (e.g., nine sequences of N.
marginata recovered only one cladogenesis event of ,1 Myr; results
not shown).
Discussion
4.1 A temporal scale for arcellinid diversificationDespite being the lineage of amoebozoans with the richest fossil
record, the assignment of the oldest arcellinid fossils to a
phylogenetic node is controversial [1,2,19]. In this study, we
found that the oldest amoebozoan fossil (770-742 Myr; [15])
cannot be assigned with certainty to the Arcellinida sensu stricto (i.e.,
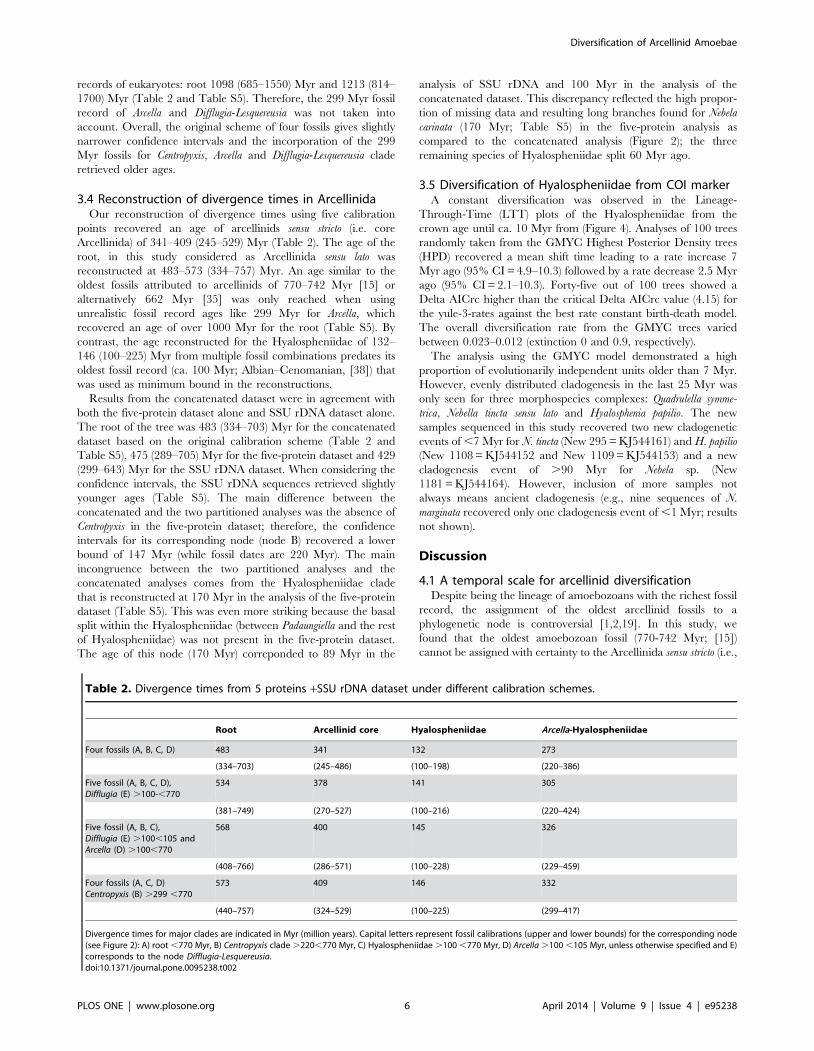
Table 2. Divergence times from 5 proteins +SSU rDNA dataset under different calibration schemes.
Root Arcellinid core Hyalospheniidae Arcella-Hyalospheniidae
Four fossils (A, B, C, D) 483 341 132 273
(334–703) (245–486) (100–198) (220–386)
Five fossil (A, B, C, D),Difflugia (E) .100-,770
534 378 141 305
(381–749) (270–527) (100–216) (220–424)
Five fossil (A, B, C),Difflugia (E) .100,105 andArcella (D) .100,770
568 400 145 326
(408–766) (286–571) (100–228) (229–459)
Four fossils (A, C, D)Centropyxis (B) .299 ,770
573 409 146 332
(440–757) (324–529) (100–225) (299–417)
Divergence times for major clades are indicated in Myr (million years). Capital letters represent fossil calibrations (upper and lower bounds) for the corresponding node(see Figure 2): A) root ,770 Myr, B) Centropyxis clade .220,770 Myr, C) Hyalospheniidae .100 ,770 Myr, D) Arcella .100 ,105 Myr, unless otherwise specified and E)corresponds to the node Difflugia-Lesquereusia.doi:10.1371/journal.pone.0095238.t002
Diversification of Arcellinid Amoebae
PLOS ONE | www.plosone.org 6 April 2014 | Volume 9 | Issue 4 | e95238
Diversification of Arcellinid Amoebae
PLOS ONE | www.plosone.org 7 April 2014 | Volume 9 | Issue 4 | e95238
the core Arcellinida). However, the paraphyly of arcellinids allows
us to consider an assignment of the oldest fossil to deeper nodes.
Therefore, when we took into account the paraphyly of the
arcellinid testate amoebae, as recently suggested by Lahr et al.
(2013), we were able to reconcile conclusions based on the fossil
record and molecular clock analyses.
Two studies have recently discussed reconstructed ages of
arcellinids (attributed to 770-742 Myr; [15]) while referring to a
different node. In the case of Parfrey et al. (2011), the node linked
arcellinids and Rhizamoeba, (not the most closely related lineages,
which are Amoebidae, Hartammellidae and Poseidonida); in the
case of Berney and Pawlowski (2006), the node was within the
Tubulinea (i.e., the node linking Hartmanella and Echinamoeba). The
age reconstructed by Berney and Pawlowski [1] (ca. 600 Myr) is
consistent with our results for the Tubulinea [483–573 (334–757)
Myr]. In Parfrey et al. [2], the age reconstructed for the divergence
between arcellinids and Rhizamoeba is ca. 1000 Myr when using
Proterozoic fossils. However, Parfrey et al. [2] inferred ages of ca.
600 Myr when they only used more reliable (undisputed)
Phanerozoic fossils. Our results do not conflict with these two
previous studies nor with the fossil record inferred by Porter and
Knoll ([15]; 770-742 Myr) and Bosak and colleagues ([35]; 662
Myr). When considering all of these studies together, we think that
the most conservative interpretation of the oldest amoebozoan
fossils is to assign them to the Tubulinea, which comprises many
naked amoebae. This interpretation is further supported by a
recent study on divergence times for Amoebozoa where arcellinids
and the closest sister groups have been incorporated and that
recovered ca. 600 Myr for Tubulinea [19]. This leads us to infer
that either arcellinid testate amoebae appeared several times
independently during the evolution of the Tubulinea or the test
was independently lost in different lineages from a common
ancestor with a test. The first scenario would be favored when
considering the eukaryophagy hypothesis [47,48].The high
number of eukaryophagic protist fossils in the mid-Neooproter-
ozoic may have triggered the radiation of tests in amoebozoans
and other protists [47] because tests provide physical protection
against predators.
The other amoebozoan fossils (Table 1 and Table S4) were in
agreement with the molecular clock reconstructions. After careful
examination of 24 studies, we selected 10 fossils (including the two
oldest arcellinid fossils) and assigned them to five nodes for
reconstruction of divergence times. The other 14 fossils (Table S4)
reported in these studies were not incorporated into our analyses
because either they have been previously dismissed (five fossils), the
taxonomic assignment was uncertain (two fossils), or they did not
correspond to the oldest fossil of the group (Table S4). In our
analyses, the most incongruent results were obtained when
incorporating Arcella, Difflugia and Lesqueresia fossils of 299 Myr
[42,49]. If these lineages are indeed that old, then our molecular
clock reconstructions using these fossils (.1100 Myr for split of
Rhizamoeba from arcellidins; Table S5) would be incongruent with
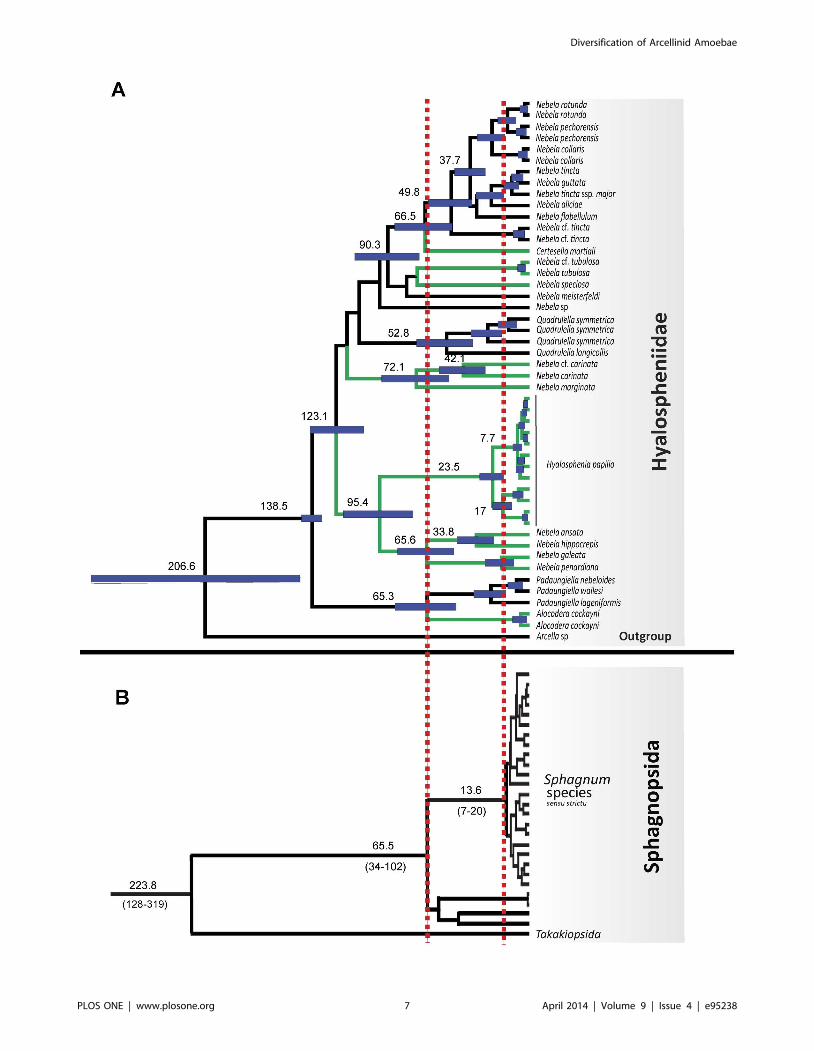
Figure 3. Maximum credibility tree of Hyalospheniidae obtained from COI dataset analyses. A. Reconstructed ages and 95% HighestPosterior Density (HPD; indicated with horizontal blue bars) were retrieved using BEAST [34] with only one COI sequences per GMYC lineage (i.e.evolutionarily independent unit). Arcellinid lineages occurring only in Sphagnum dominated peatlands are marked with green lines. Lineages thatoccur in Sphagnum dominated peatlands and/or other habitats are marked with black lines. Numbers on nodes correspond to divergence times inmillion years. Taxonomic assignment is indicated on the right. B. Sphagnum chronogram from eight mitochondrial, plastid, and nuclear genes. Dates(6standard errors) from Shaw and colleagues [16]. Red dotted vertical lines indicate early split of the Sphagnopsida (65.5 Myr ago) and radiation ofca. 300 spp of Sphagnum (13.6 Myr ago).doi:10.1371/journal.pone.0095238.g003
Figure 4. Lineage-Through-Time (LTT) plot of Hyalospheniidae. Lineage-Through-Time (LTT) was plotted using 100 trees of theHyalospheniidae from the COI dataset analyses. The number of lineages (x axis) is plotted against time (y axis) in such way that each increase on thenumber of lineages represents a cladogenesis (a node) in one of the 100 phylogetic trees. These 100 trees were randomly taken from HighestPosterior Density (HPD) generated in BEAST from the GMYC dataset. Diversification rate shifts leading to a rate increase (7 Myr ago) and a ratedecrease (2.5 Myr ago) as detected in LASER are indicated with dotted grey lines. Grey LTT line is for mosses as extracted from the tree in Shaw andcolleagues [16]. The radiation of 300 Sphagnum at 14 Myr ago is indicated with a vertical line and an arrow. Grey arrow on the left indicates the stemage of Sphagnum at 223.8, Shaw and colleagues [16].doi:10.1371/journal.pone.0095238.g004
Diversification of Arcellinid Amoebae
PLOS ONE | www.plosone.org 8 April 2014 | Volume 9 | Issue 4 | e95238
both previous molecular studies and with undisputed fossil records
assigned to deep nodes of eukaryotes [1,2,19]. If the rate of
molecular evolution decelerated in Arcella, Difflugia and Lesqueresia,
then using external calibrations would result in younger diver-
gence times than expected (299 Myr). By contrast, if we calibrated
these nodes with ancient dates (299 Myr fossils) and assumed a rate
deceleration, then all of the inferred ages would be pushed to the
past (Table S5).
4.2 Diversification of two ancient lineages: TheHyalospheniidae (Amoebozoa: Arcellinida) andSphagnum mosses (Plantae: Sphagnopsida)
Based on our reconstructed divergence time analyses, the
diversification of arcellinids during the Phanerozoic is the most
likely scenario (Figure 2). The age recovered for arcellinids sensu
stricto (core Arcellinida: 341–409 (245–529) Myr; Table 2) is in
agreement with divergence time analyses that used fossils from
outside the Tubulinea (arcellinid stem age: 254–522 Myr; [19]).
This is the time when land plants colonized terrestrial soils with the
oldest records of spores of ca. 470 Myr [50]. Among the oldest
lineages of land plants are Sphagnum with a fossil record of 330 Myr
[14] and with slightly older divergence times from molecular
phylogenetic analyses (380 Myr; [51]). Because several taxa within
the Hyalospheniidae exclusively, or almost exclusively, inhabit
Sphagnum-dominated peatlands (Figure 3), one can expect that the
Sphagnum lineage and the Hyalospheniidae lineage (or sublineages)
have experienced similar diversification dynamics through time,
especially if a longstanding ecological interaction between both
groups of organisms has occurred. Hubers and Kerp [14] pointed
out a similar ecological role between Carboniferous (359-299 Myr
ago) protosphagnales and modern Sphagnum in peatbogs. However
while Sphagnum shows a diversification stasis from ca. 220 to ca. 14
Myr (with only one cladogenesis; [16]; Figure 3), the Hyalo-
spheniidae seem to follow a more constant diversification pattern
from ca 140 Myr until very recent times (ca. 7 Myr) when they
increased the rate of diversification (Figure 3 and Figure 4).
The Cretaceous (145-65 Myr ago) was the beginning of a great
change in terrestrial ecosystems [52]. The age reconstructed for
the diversification of Hyalospheniidae matches precisely with the
origin and diversification of angiosperms (ca 130 Myr ago, [53]) as
well as the diversification of most mosses [52]. Therefore, the
Hyalospheniidae certainly not only depend on the diversity of
Sphagnum mosses but also on the diversification of different
terrestrial habitats with different lineages of modern mosses and
angiosperms. The relationship between Sphagnum and some of the
Hyalospheniidae clades occurring only in peatlands should be
interpreted as a recent specialization to the Sphagnum-dominated
peatland ecosystem during the Miocene (5–20 Myr ago; [16]).
The radiation of the Hyalospheniidae detected here (7 Myr ago)
occurs only after the diversification of Sphagnum (14 Myr ago; [16]).
However, the diversification pattern found in some parts of the
tree suggests that a deeper taxonomic sampling is required to
improve our understanding of these ecological relationships. Long
branches can indicate either long periods without diversification
(because of high extinction or low speciation rates) or poor
sampling. The inclusion of additional sequences from H. papilio (a
single morphospecies) in our molecular phylogenetic analyses
demonstrated its diversification in the last ca. 20 Myr. Expanding
the sequence sampling (even if taxonomic diversity is still awaiting
description) may lead to a pattern of similar diversification in other
parts of the Hyalospheniidae tree. This would produce a better fit
between the diversification of the Hyalospheniidae amoebae and
Sphagnum during the Miocene. If other Sphagnum-associated
morphospecies within the Hyalospheniidae, for instance, had a
diversification pattern similar to the one described for H. papilio,
then the hypothesis that the establishment of Sphagnum dominated-
peatland ecosystem influenced the diversification of clades within
the Hyalospheniidae would be supported. Although currently
unclear, it is also possible that the presence of arcellinid testate
amoebae may have in turn influenced the diversification of
Sphagnum mosses.
Supporting Information
Figure S1 Light micrographs illustrating six arcellinidspecimens we isolated for single-cell PCR. A: Arcella sp
(Genbank KJ544162), B: Nebela sp. (Genbank KJ544164), C–E:
Nebela marginata (Genbank KJ544160, KJ544156 and KJ544157).
A and C–E specimens were sampled from Sphagnum-dominated
peatland while B was sampled from forest litter. Scale
bars = 50 mm.
(TIF)
Table S1 List of the Hyalospheniidae single cells fromwhich COI sequences were obtained.
(XLS)
Table S2 Sequences of the primers used in this study.
(XLS)
Table S3 List of publicly available COI sequences fromthe Hyalospheniidae.
(XLS)
Table S4 References of the fossil records not consid-ered in this study.
(XLS)
Table S5 Divergence times from 5 protein + SSUdatasets combined and from 5protein and SSU indepen-dently under different calibration schemes. Divergence
times for major clades are indicated in Myr (million years). Capital
letters represent fossil calibrations (upper and lower bounds) for
the corresponding node (Figure 2): A) root ,770 Myr, B)
Centropyxis .220,770 Myr, C) Hyalospheniidae .100,770
Myr, D) Arcella .100,105 Myr, unless otherwise specified; * In
the 5 proteins dataset, Hyalospheniidae did not include the basal
split between Padaungiella and the rest of Hyalospheniidae. E)
corresponds to the node Difflugia-Lesquereusia.
(XLS)
Acknowledgments
We thank L. Valente for his help with diversification analyses, DJG Lahr
for providing us sequence alignments, EAD Mitchell and DW Wilkinson
for providing some samples and Y. Mazei and EAD Mitchell for comments
on testate amoeba taxonomy and ecology and V. Valcarcel, G. Bloomfield
and one anonymous referee for valuable comments on the manuscript.
Author Contributions
Conceived and designed the experiments: OFP TJH. Performed the
experiments: OFP TJH. Analyzed the data: OFP TJH. Contributed
reagents/materials/analysis tools: BSL. Wrote the paper: OFP TJH BSL.
Conception of the work: OFP. Acquisition of data (lab work): TJH.
Acquisition of data (databases): OFP.
Diversification of Arcellinid Amoebae
PLOS ONE | www.plosone.org 9 April 2014 | Volume 9 | Issue 4 | e95238
References
1. Berney C, Pawlowski J (2006) A molecular time-scale for eukaryote evolution
recalibrated with the continuous microfossil record. Proceedings of the RoyalSociety B-Biological Sciences 273: 1867–1872. doi:10.1098/rspb.2006.3537.
2. Parfrey LW, Lahr DJG, Knoll AH, Katz LA (2011) Estimating the timing ofearly eukaryotic diversification with multigene molecular clocks. Proceedings of
the National Academy of Sciences of the United States of America 108: 13624–
13629. doi:10.1073/pnas. 1110633108. PubMed: 21810989.3. Adl SM, Simpson AGB, Lane CE, Lukes J, Bass D, et al. (2012) The revised
classification of eukaryotes. Journal of Eukaryotic Microbiology 59: 429–493.4. Lahr DJG, Grant JR, Katz LA (2013) Multigene phylogenetic reconstruction of
the Tubulinea (Amoebozoa) corroborates four of the six major lineages, while
additionally revealing that shell composition does not predict phylogeny in theArcellinida. Protist 164: 323–339.
5. Smirnov AV, Chao E, Nassonova ES, Cavalier-Smith T (2011) A revisedclassification of naked lobose amoebae (Amoebozoa: Lobosa). Protist 162: 545–
570.6. Pawlowski J, Audic S, Adl S, Bass D, Belbahri L, et al. (2012) CBOL protist
working group: barcoding eukaryotic richness beyond the animal, plant, and
fungal kingdoms. PloS Biology 10(11): e1001419. doi:10.1371/journal.pbio.1001419.
7. Golemansky V (2007) Testate Amoebas and Monothalamous Foraminifera(Protozoa) from the Bulgarian Black Sea Coast. In: Fet V, Popov A, editors.
Biogeography and Ecology of Bulgaria. pp. 555–570.
8. Meisterfeld R (2002) Order Arcellinida Kent, 1880. In: Lee JJ, Leedale GF,Bradbury P, editors. The illustrated guide to the protozoa. Second edition ed.
Lawrence, Kansas, USA: Society of protozoologists. pp. 827–860.9. Booth RK, Zygmunt JR (2005) Biogeography and comparative ecology of testate
amoebae inhabiting Sphagnum-dominated peatlands in the Great Lakes andRocky Mountain regions of North America. Diversity and Distributions 11: 577–
590.
10. Deflandre G (1936) Etude monographique sur le genre Nebela Leidy. Annales deProtistologie 5: 201–286.
11. Mitchell EAD, Gilbert D, Buttler A, Amblard C, Grosvernier P, et al. (2003)Structure of microbial communities in Sphagnum peatlands and effect of
atmospheric carbon dioxide enrichment. Microbial Ecology 46: 187–199.
12. Mitchell EAD, Charman DJ, Warner BG (2008) Testate amoebae analysis inecological and paleoecological studies of wetlands: past, present and future.
Biodiversity and Conservation 17: 2115–2137.13. Charret R (1964) Contribution a l’etude cytologique et biologique de
Hyalosphenia papilio (Leidy), Rhizopode Testace. Bulletin Biologique de la Franceet de la Belgique XCVIII (2): 369–390.
14. Hubers M, Kerp H (2012) Oldest known mosses discovered in Mississippian (late
Visean) strata of Germany. Geology 40: 755–758.15. Porter SM, Knoll AH (2000) Testate amoebae in the Neoproterozoic Era:
evidence from vase-shaped microfossils in the Chuar Group, Grand Canyon.Paleobiology 26: 360–385.
16. Shaw AJ, Devos N, Cox CJ, Boles SB, Shaw B, et al. (2010) Peatmoss
(Sphagnum) diversification associated with Miocene Northern Hemisphereclimatic cooling? Molecular Phylogenetics and Evolution 55: 1139–1145.
17. Lara E, Heger TJ, Ekelund F, Lamentowicz M, Mitchell EAD (2008) RibosomalRNA genes challenge the monophyly of the Hyalospheniidae (Amoebozoa:
Arcellinida). Protist 159: 165–176.18. Cavalier-Smith T (2009) Megaphylogeny, cell body plans, adaptive zones: causes
and timing of eukaryote basal radiations. Journal of Eukaryotic Microbiology 56:
26–33.19. Fiz-Palacios O, Romeralo M, Ahmadzadeh A, Weststrand S, Ahlberg PE, et al.
(2013) Did terrestrial diversification of amoebas (Amoebozoa) occur insynchrony with Land plants? Plos One 8(9): e74374. doi:10.1371/journal.pone.
0074374.
20. Pons J, Barraclough TG, Gomez-Zurita J, Cardoso A, Duran DP, et al. (2006)Sequence-based species delimitation for the DNA taxonomy of undescribed
insects. Systematic Biology 55: 595–609.21. Fontaneto D, Herniou EA, Boschetti C, Caprioli M, Melone G, et al. (2007)
Independently evolving species in asexual bdelloid rotifers. Plos Biology 5(4):
e87. doi:10.1371/journal.pbio.0050087.22. Heger TJ, Mitchell EAD, Leander BS (2013) Holarctic phylogeography of the
testate amoeba Hyalosphenia papilio (Amoebozoa: Arcellinida) reveals extensivegenetic diversity explained more by environment than dispersal limitation.
Molecular Ecology 22: 5172–5184.23. Kosakyan A, Gomaa F, Mitchell EAD, Heger TJ, Lara E (2013) Using DNA-
barcoding for sorting out protist species complexes: A case study of the Nebela
tincta-collaris-bohemica group (Amoebozoa; Arcellinida, Hyalospheniidae). Euro-pean Journal of Protistology 49: 222–237.
24. Kosakyan A, Heger TJ, Leander BS, Todorov M, Mitchell EAD, et al. (2012)COI barcoding of Nebelid testate amoebae (Amoebozoa: Arcellinida): extensive
cryptic diversity and redefinition of the Hyalospheniidae Schultze. Protist 163:
415–434.25. Hall TA (1999) BioEdit: a user-friendly biological sequence alignment editor and
analysis program for Windows 95/98/NT. Nucleic Acids Symposium Series 41:95–98.
26. Jobb G, von Haeseler A, Strimmer K (2004) TREEFINDER: a powerful
graphical analysis environment for molecular phylogenetics. BMC EvolutionaryBiology 4.
27. Ronquist F, Huelsenbeck JP (2003) MrBayes 3: Bayesian phylogenetic inferenceunder mixed models. Bioinformatics 19: 1572–1574.
28. Posada D, Crandall KA (1998) MODELTEST: testing the model of DNA
substitution. Bioinformatics 14: 817–818.29. Lahr DJG, Grant J, Nguyen T, Lin JH, Katz LA (2011) Comprehensive
phylogenetic reconstruction of amoebozoa based on concatenated analyses ofSSU-rDNA and actin genes. Plos One 6(7): e22780. doi:10.1371/journal.pone.
0022780.
30. Kimura M (1980) A simple method for estimating evolutionary rates of basesubstitutions through comparative studies of nucleotide-sequences. Journal of
Molecular Evolution 16: 111–120.31. R Development Core Team (2010) R: A Language and Environment for
Statistical Computing. Foundation for Statistical Computing, Version 2.8.0. RDevelopment Core Team, Vienna, Austria. Available: http://wwwR-projectorg.
32. Fujisawa T, Barraclough TG (2013) Delimiting Species Using Single-Locus Data
and the Generalized Mixed Yule Coalescent Approach: A Revised Method andEvaluation on Simulated Data Sets. Systematic Biology 62: 707–724.
33. Monaghan MT, Wild R, Elliot M, Fujisawa T, Balke M, et al. (2009)Accelerated species inventory on Madagascar using coalescent-based models of
species delineation. Systematic Biology 58: 298–311.
34. Drummond AJ, Rambaut A (2007) BEAST: Bayesian evolutionary analysis bysampling trees. Bmc Evolutionary Biology 7.
35. Bosak T, Lahr DJG, Pruss SB, Macdonald FA, Dalton L, et al. (2011)Agglutinated tests in post-Sturtian cap carbonates of Namibia and Mongolia.
Earth and Planetary Science Letters 308: 29–40.36. Girard V, Neraudeau D, Adl SM, Breton G (2011) Protist-like inclusions in
amber, as evidenced by Charentes amber. European Journal of Protistology 47:
59–66.37. Schmidt AR, Ragazzi E, Coppellotti O, Roghi G (2006) A microworld in
Triassic amber. Nature 444: 835–835.38. Schmidt AR, Schonborn W, Schafer U (2004) Diverse fossil amoebae in
German Mesozoic amber. Palaeontology 47: 185–197.
39. van Hengstum PJ, Reinhardt EG, Medioli FS, Grocke DR (2007) Exceptionallypreserved late albian (cretaceous) arcellaceans (thecamoebians) from the Dakota
formation near Lincoln, Nebraska,USA. Journal of Foraminiferal Research 37:300–308.
40. Medioli FS, Scott DB, Collins ES, McCarthy FMG (1990) Fossil thecamoebians:Present status and prospects for the future. In: Hemleben C, Kaminski MA,
Kuhnt W, Scott DB, editors. Proceedings of the NATO Advanced Study
Institute on paleoecology, biostratigraphy, paleoceanography and taxonomy ofagglutinated foraminifera. Dordrecht-Boston, International: D. Reidel Publish-
ing Company. pp. 813–839.41. Gomaa F, Todorov M, Heger TJ, Mitchell EAD, Lara E (2012) SSU rRNA
phylogeny of Arcellinida (Amoebozoa) reveals that the largest Arcellinida genus,
Difflugia Leclerc 1815, is not monophyletic. Protist 163: 389–399.42. Kumar A (2011) Acid-resistant Cretaceous thecamoebian tests from the Arabian
Peninsula: a suggestion for study of agglutinated rhizopods in palynologicalslides. Journal of Micropalaeontology 30: 1–5.
43. Rabosky DL (2006) LASER: a maximum likelihood toolkit for detectingtemporal shifts in diversification rates from molecular phylogenies. Evolutionary
Bioinformatics 2: 247–250.
44. Magallon S, Sanderson (2006) Absolute diversification rates in angiospermclades (vol 55, pg 1762, 2001). Evolution 60: 2411–2411.
45. Xia X, Xie Z (2001) DAMBE: Software package for data analysis in molecularbiology and evolution. Journal of Heredity 92: 371–373.
46. Fontaneto D, Hortal J (2013) At least some protist species are not ubiquitous.
Molecular Ecology 22: 5053–5055.47. Knoll AH (2014) Paleobiological Perspectives on Early Eukaryotic Evolution.
Cold Spring Harbor Perspectives in Biology 6.48. Porter S (2011) The rise of predators. Geology 39: 607–608.
49. Farooqui A, Kumar AN, Jha N, Pande AC, Bhattacharya DD (2010) A
Thecamoebian assemblage from the Manjir Formation (Early Permian) ofNorthwest Himalaya. Earth Sci India 3: 146–153.
50. Rubinstein CV, Gerrienne P, de la Puente GS, Astini RA, Steemans P (2010)Early Middle Ordovician evidence for land plants in Argentina (eastern
Gondwana). New Phytologist 188: 365–369.51. Newton AE, Wikstrom N, Bell N, Forrest LL, Ignatov MS (2007) Dating the
Diversification of the Pleurocarpous mosses. In: Newton AE, Tangney RS,
editors. Pleurocarpous mosses: Systematics and Evolution Boca Raton, CRCPress. pp. 337–366.
52. Fiz-Palacios O, Schneider H, Heinrichs J, Savolainen V (2011) Diversification ofland plants: insights from a family-level phylogenetic analysis. Bmc Evolutionary
Biology 11.
53. Brenner GJ (1996) Evidence for the earliest stage of angiosperm pollen evolution:A paleoequatorial section from Israel. In: Taylor DW, Hickey LJ, editors.
Flowering plant origin, evolution and phylogeny. New York: Chapman. pp. 91–115.
Diversification of Arcellinid Amoebae
PLOS ONE | www.plosone.org 10 April 2014 | Volume 9 | Issue 4 | e95238