Embed Size (px)
Citation preview
OLDER AFRICAN AMERICANS’ EXTENDED FAMILY & CHURCH SUPPORT NETWORKS & DEPRESSIVE SYMPTOM TYPOLOGIES
Ann W. Nguyen, PhD, MSW, LMSW Edward R. Roybal Institute on Aging University of Southern California
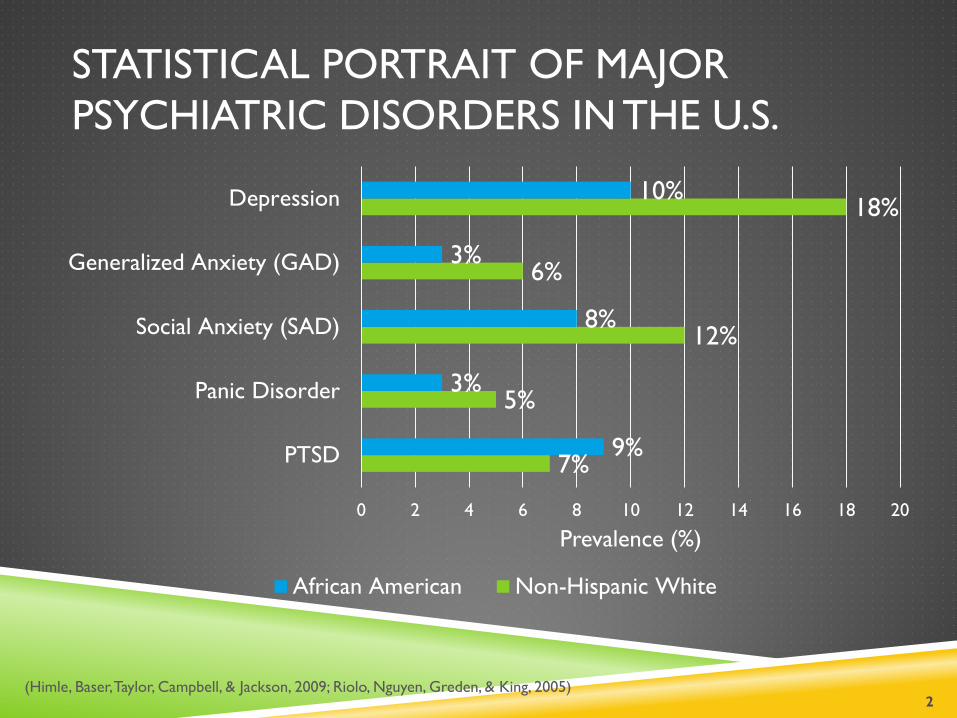
STATISTICAL PORTRAIT OF MAJOR PSYCHIATRIC DISORDERS IN THE U.S.
7%
5%
12%
6%
18%
9%
3%
8%
3%
10%
0 2 4 6 8 10 12 14 16 18 20
PTSD
Panic Disorder
Social Anxiety (SAD)
Generalized Anxiety (GAD)
Depression
Prevalence (%)
African American Non-Hispanic White
2 (Himle, Baser, Taylor, Campbell, & Jackson, 2009; Riolo, Nguyen, Greden, & King, 2005)
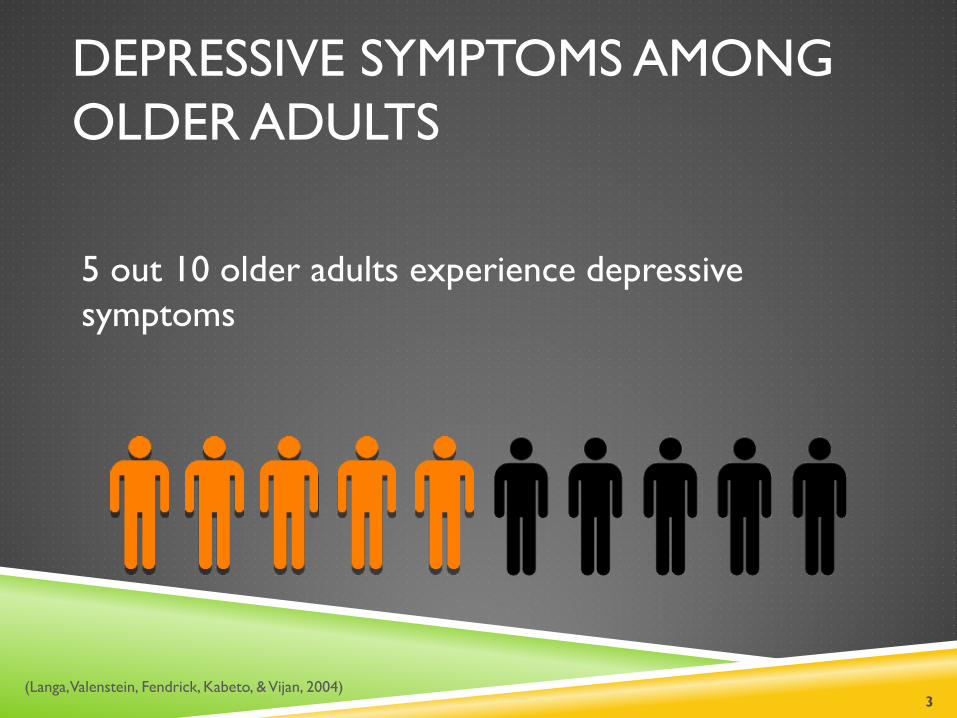
DEPRESSIVE SYMPTOMS AMONG OLDER ADULTS
5 out 10 older adults experience depressive symptoms
3 (Langa, Valenstein, Fendrick, Kabeto, & Vijan, 2004)
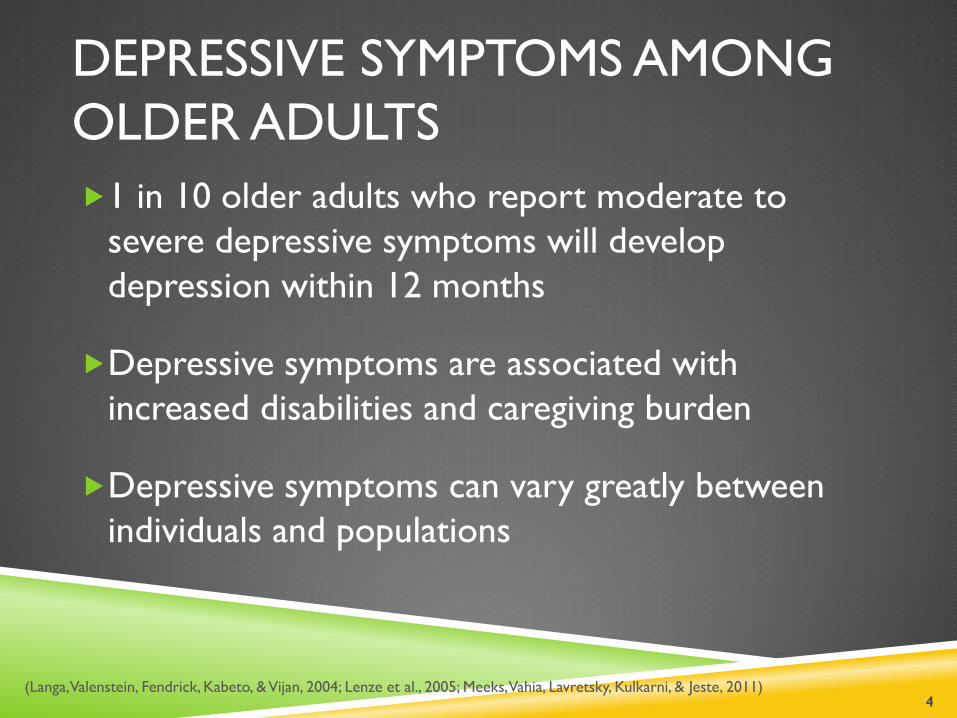
DEPRESSIVE SYMPTOMS AMONG OLDER ADULTS 1 in 10 older adults who report moderate to
severe depressive symptoms will develop depression within 12 months
Depressive symptoms are associated with increased disabilities and caregiving burden
Depressive symptoms can vary greatly between individuals and populations
4 (Langa, Valenstein, Fendrick, Kabeto, & Vijan, 2004; Lenze et al., 2005; Meeks, Vahia, Lavretsky, Kulkarni, & Jeste, 2011)

DEPRESSIVE SYMPTOM TYPOLOGIES
Patterns or clusters of depressive symptoms
Delineated by symptom severity and type
Lack information on depressive symptom typologies among minorities
5

SOCIAL SUPPORT NETWORKS &
MENTAL HEALTH
6
7
Lacking social support is equivalent to smoking 15
cigarettes a day.
(Holt-Lundstad, Smith, Baker, Harris, & Stephenson, 2015)
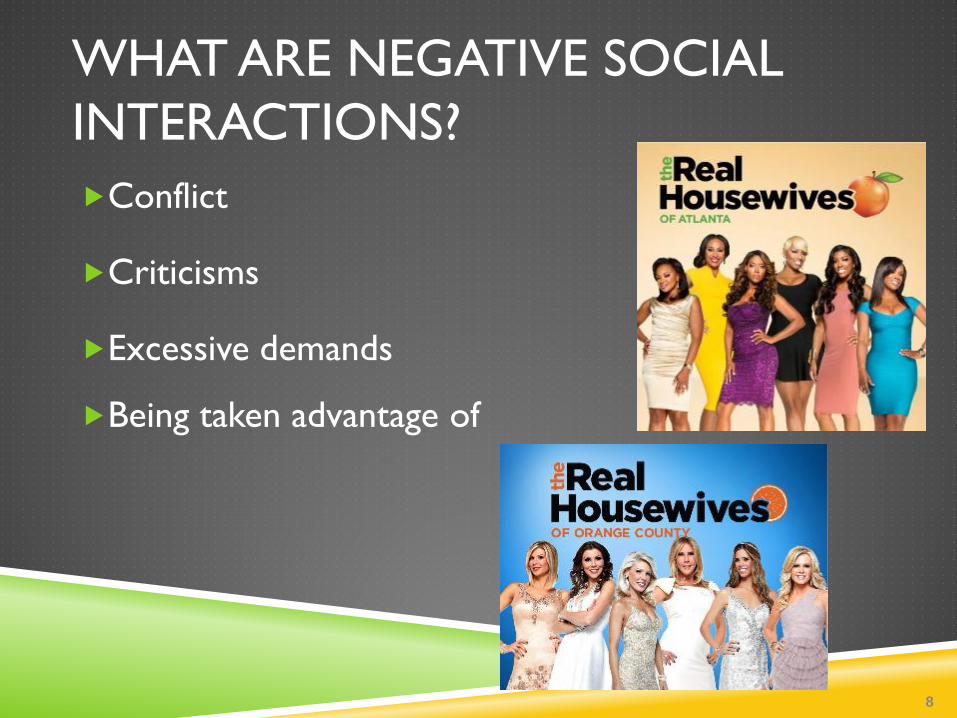
WHAT ARE NEGATIVE SOCIAL INTERACTIONS? Conflict
Criticisms
Excessive demands
Being taken advantage of
8
NEGATIVE SOCIAL INTERACTIONS
Detrimental to mental and physical health and psychological well-being
Effects of negative interactions tend to offset positive effects of social support
9
STUDY METHODS & FINDINGS
10
RESEARCH QUESTIONS
1. What depressive symptom typologies (DST) exist among older African Americans?
2. Are church-based and extended family support networks associated with depressive symptom typologies (DSTs)?
11
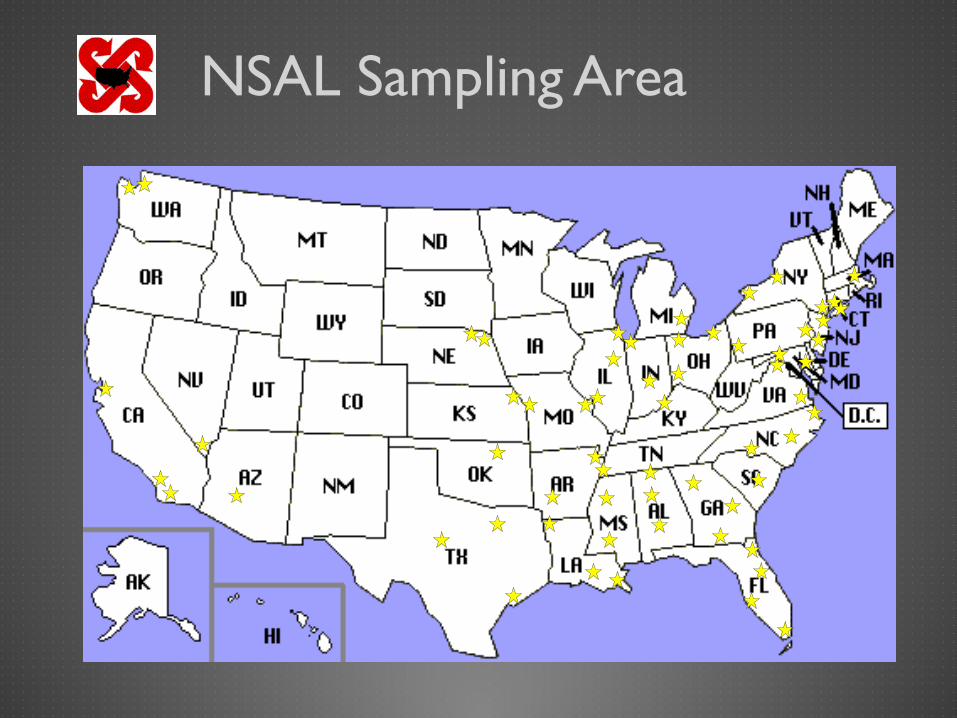
NSAL Sampling Area
SAMPLE
National Survey of American Life: Coping with Stress in the 21st Century
Aged 50+ (M = 63 years)
N = 1,135 African Americans (43% men)
13
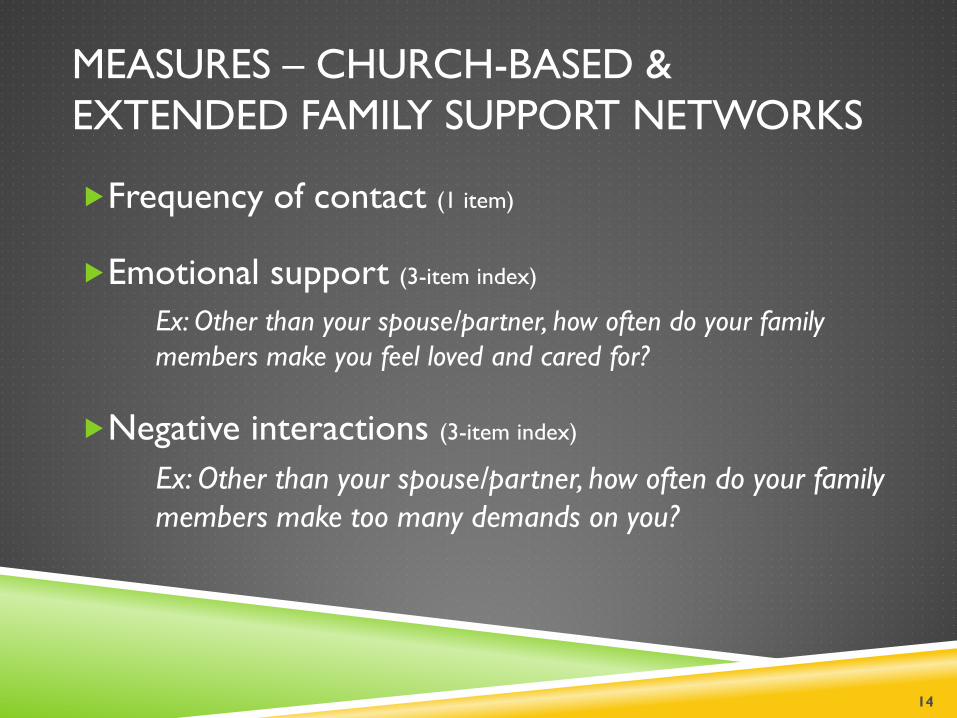
MEASURES – CHURCH-BASED & EXTENDED FAMILY SUPPORT NETWORKS
Frequency of contact (1 item)
Emotional support (3-item index)
Ex: Other than your spouse/partner, how often do your family members make you feel loved and cared for?
Negative interactions (3-item index)
Ex: Other than your spouse/partner, how often do your family members make too many demands on you?
14
LATENT CLASS ANALYSIS (LCA)
Type of structural equation modeling
Person-centered approach rather than variable-centered approach
Groups people based on their response to items within a scale
15
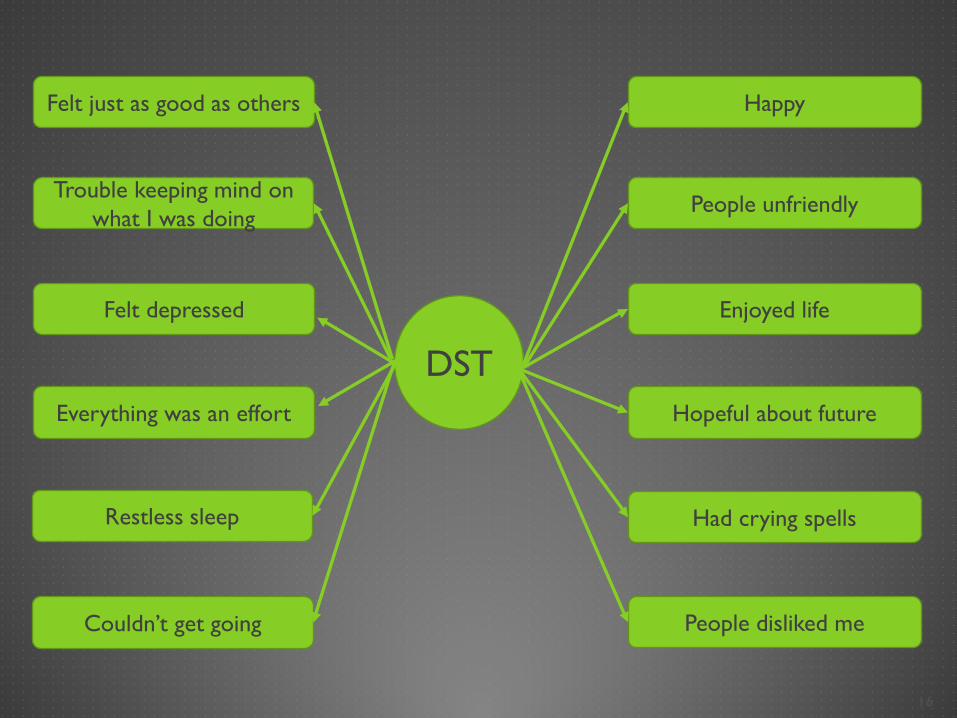
DST
People unfriendly
Enjoyed life
Had crying spells
People disliked me Couldn’t get going
Felt just as good as others
Restless sleep
Hopeful about future Everything was an effort
Felt depressed
Trouble keeping mind on what I was doing
Happy
16
17
0
0.2
0.4
0.6
0.8
1P
roba
bilit
y of
End
orse
mee
nt
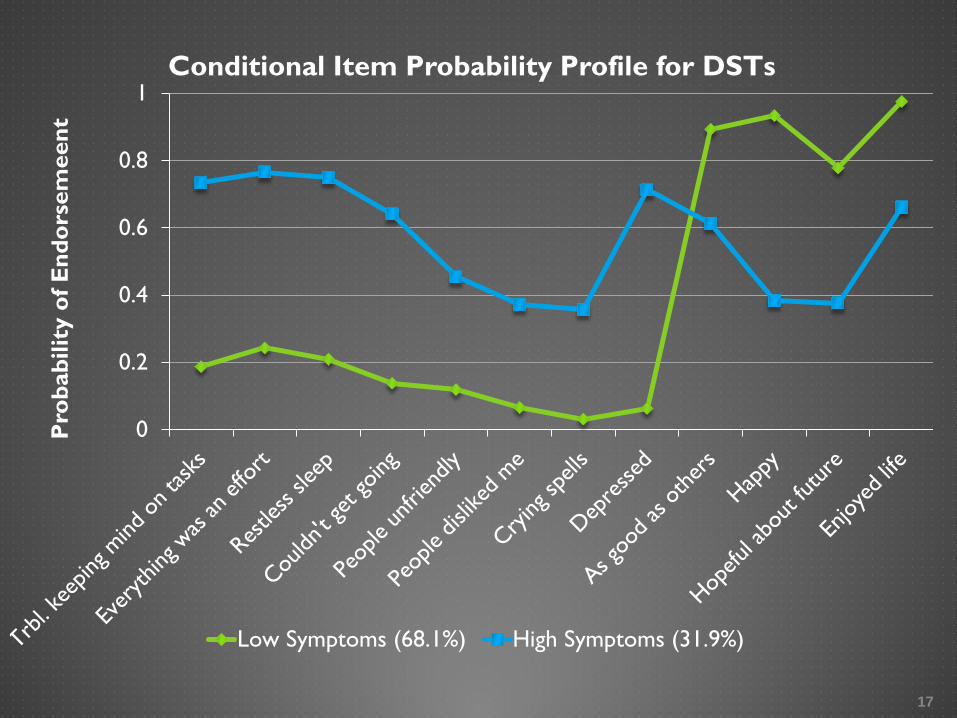
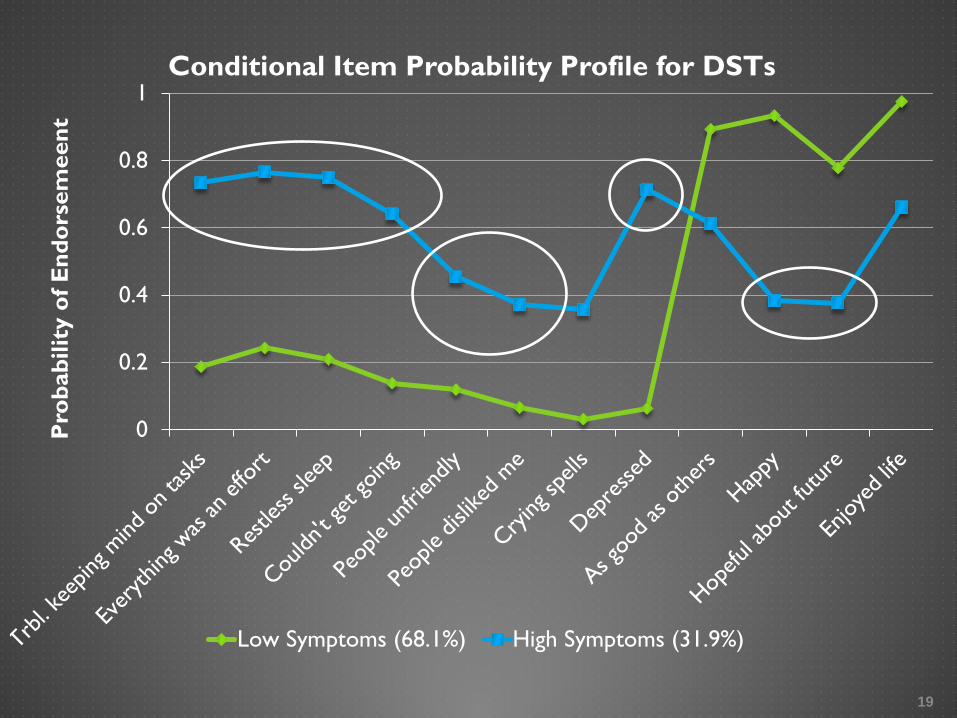
Conditional Item Probability Profile for DSTs
Low Symptoms (68.1%) High Symptoms (31.9%)
18
0
0.2
0.4
0.6
0.8
1P
roba
bilit
y of
End
orse
mee
nt
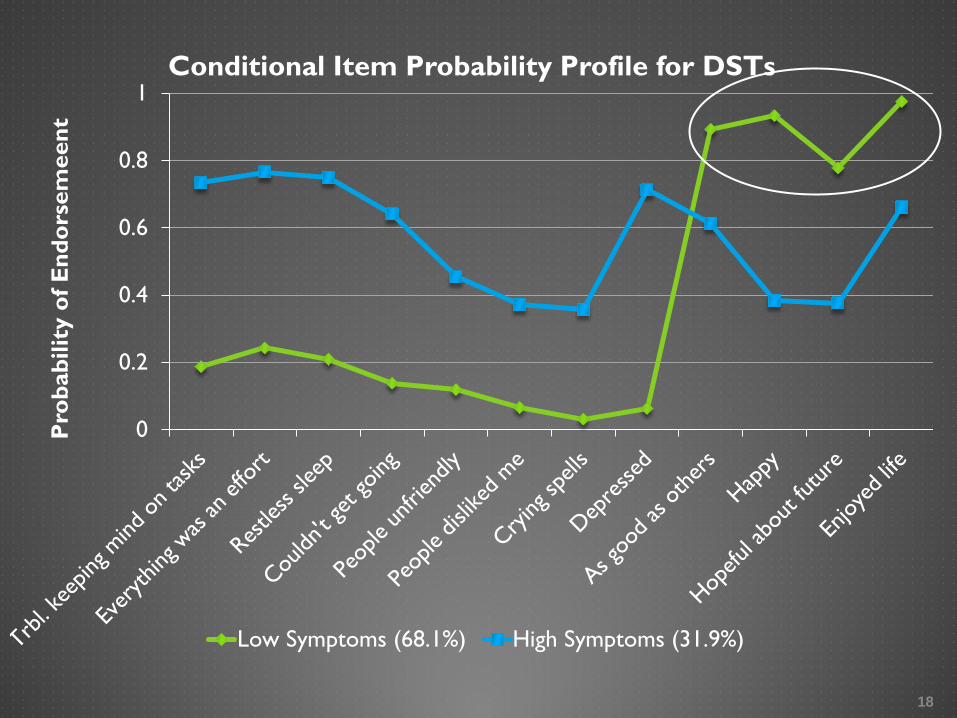
Conditional Item Probability Profile for DSTs
Low Symptoms (68.1%) High Symptoms (31.9%)
19
0
0.2
0.4
0.6
0.8
1P
roba
bilit
y of
End
orse
mee
nt
Conditional Item Probability Profile for DSTs
Low Symptoms (68.1%) High Symptoms (31.9%)
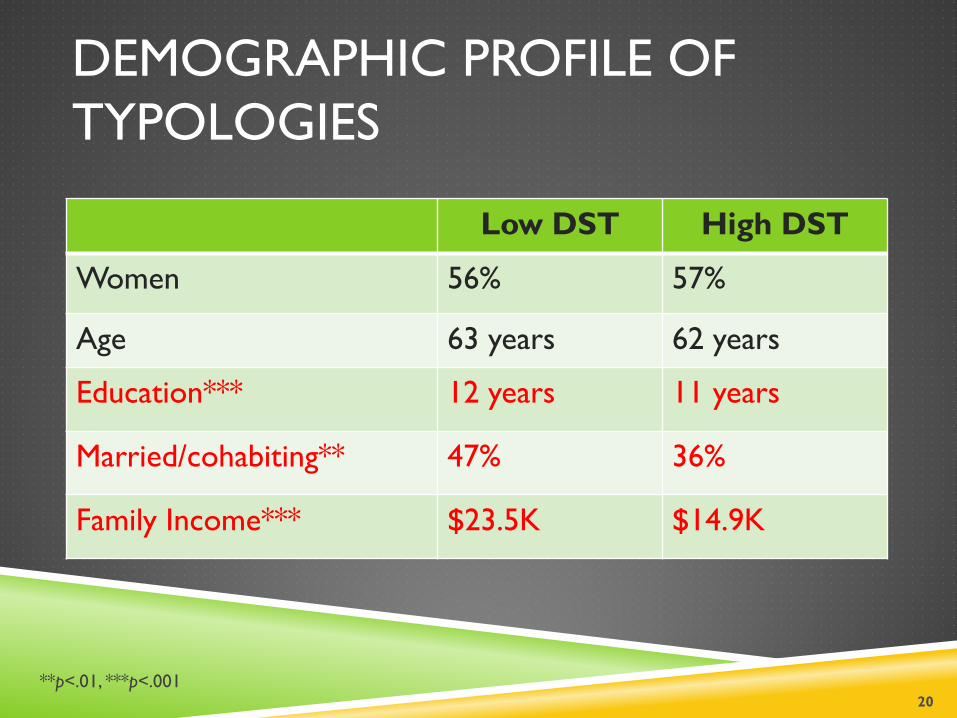
DEMOGRAPHIC PROFILE OF TYPOLOGIES
Low DST High DST
Women 56% 57%
Age 63 years 62 years
Education*** 12 years 11 years
Married/cohabiting** 47% 36%
Family Income*** $23.5K $14.9K
20 **p<.01, ***p<.001
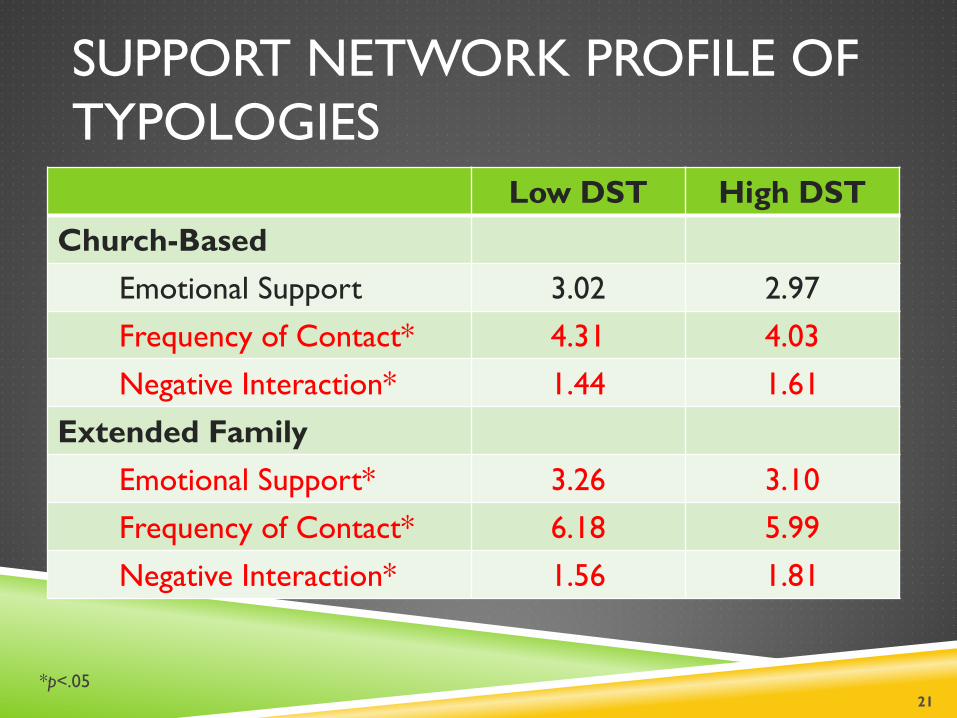
SUPPORT NETWORK PROFILE OF TYPOLOGIES
21
Low DST High DST Church-Based Emotional Support 3.02 2.97 Frequency of Contact* 4.31 4.03 Negative Interaction* 1.44 1.61 Extended Family Emotional Support* 3.26 3.10 Frequency of Contact* 6.18 5.99 Negative Interaction* 1.56 1.81
*p<.05
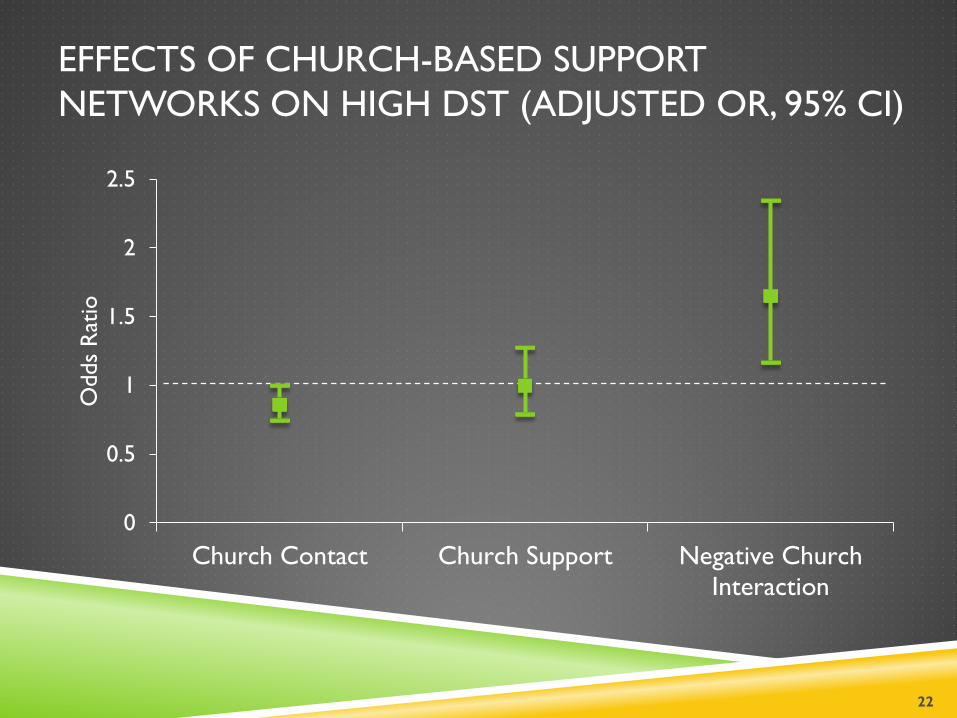
EFFECTS OF CHURCH-BASED SUPPORT NETWORKS ON HIGH DST (ADJUSTED OR, 95% CI)
0
0.5
1
1.5
2
2.5
Church Contact Church Support Negative ChurchInteraction
Odd
s R
atio
22
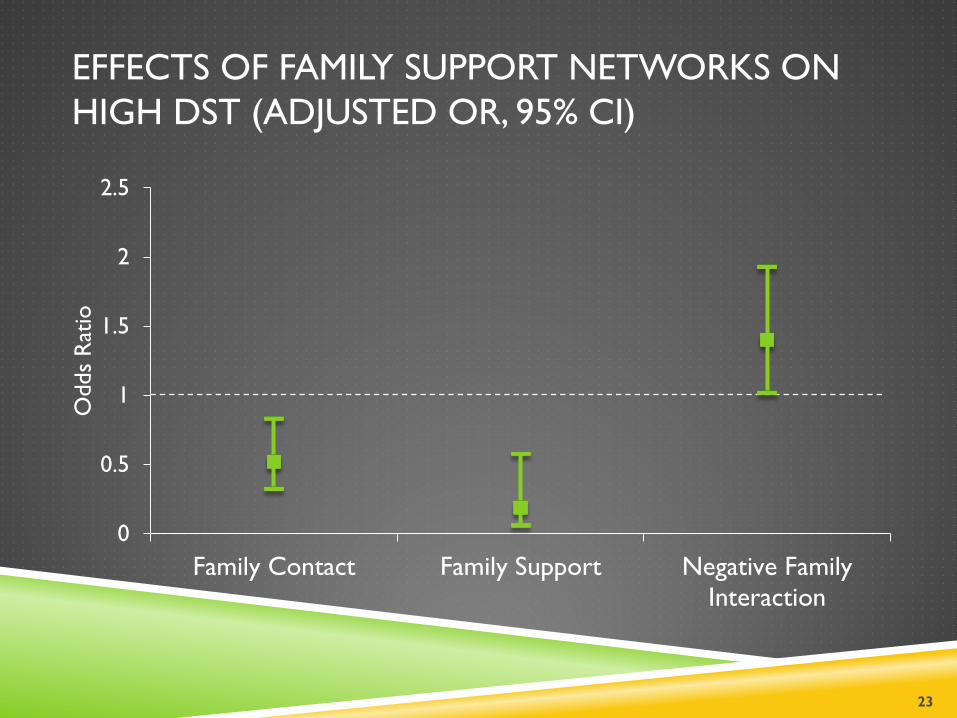
EFFECTS OF FAMILY SUPPORT NETWORKS ON HIGH DST (ADJUSTED OR, 95% CI)
0
0.5
1
1.5
2
2.5
Family Contact Family Support Negative FamilyInteraction
Odd
s R
atio
23
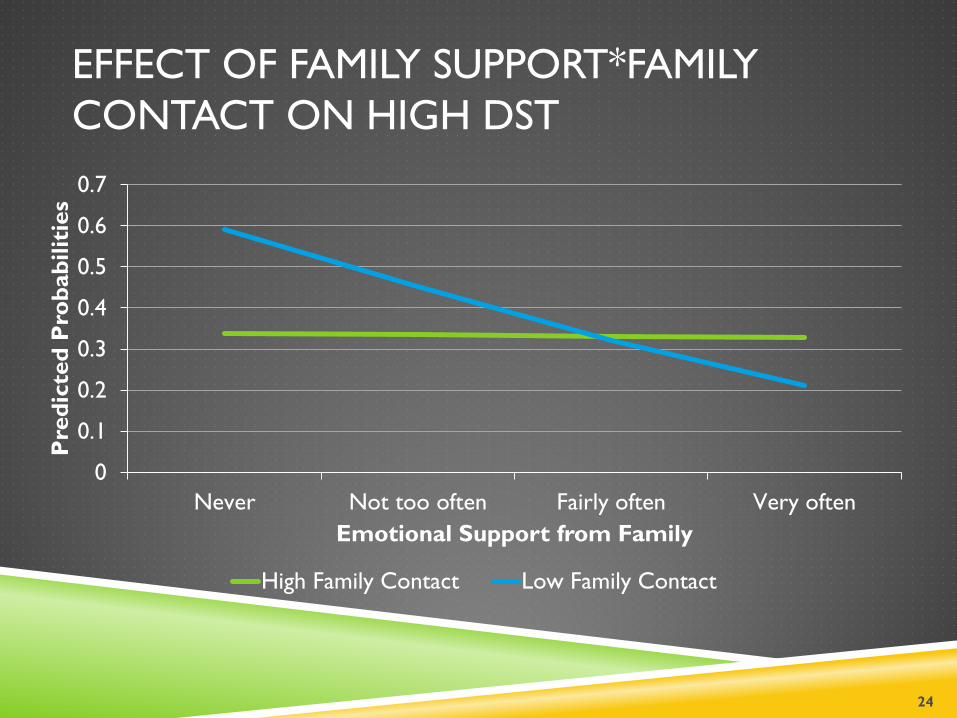
EFFECT OF FAMILY SUPPORT*FAMILY CONTACT ON HIGH DST
0
0.1
0.2
0.3
0.4
0.5
0.6
0.7
Never Not too often Fairly often Very often
Pre
dict
ed P
roba
bilit
ies
Emotional Support from Family
High Family Contact Low Family Contact
24
STUDY SUMMARY
2 depressive symptom typologies exist among older African Americans
More frequent contact with family & church members and receiving emotional support from family members protected against being in the High DST
25
STUDY SUMMARY
Negative interaction was a risk factor for being in the High DST
Family support can compensate for lack of contact with family
26
ACKNOWLEDGEMENTS
This work was supported by a grant from the USC-RCMAR/National Institute on Aging (P30AG043073).
27

THANK YOU &
QUESTIONS?
28
REFERENCES 1. Himle, J. A., Baser, R. E., Taylor, R. J., Campbell, R. D., & Jackson, J. S. (2009). Anxiety disorders
among African Americans, blacks of Caribbean descent, and non-Hispanic whites in the United States. J Anxiety Disord, 23(5), 578-590.
2. Riolo, S. A., Nguyen, T. A., Greden, J. F., & King, C. A. (2005). Prevalence of depression by race/ethnicity: findings from the National Health and Nutrition Examination Survey III. American Journal of Public Health, 95(6), 998-1000.
3. Langa, K. M., Valenstein, M. A., Fendrick, A. M., Kabeto, M. U., & Vijan, S. (2004). Extent and cost of informal caregiving for older Americans with symptoms of depression. American Journal of Psychiatry, 161, 857-863.
4. Lenze, E. J., Schulz, R., Martire, L. M., Zdaniuk, B., Glass, T., Kop, W. J., . . . Reynolds, C. F. (2005). The course of functional decline in older people with persistently elevated depressive symptoms: Longitudinal findings from the Cardiovascular Health Study. J Am Geriatr Soc, 53(4), 569-575.
5. Meeks, T. W., Vahia, I. V., Lavretsky, H., Kulkarni, G., & Jeste, D. V. (2011). A tune in “a minor” can “b major”: A review of epidemiology, illness course, and public health implications of subthreshold depression in older adults. Journal of affective disorders, 129(1), 126-142.
6. Holt-Lunstad, J., Smith, T. B., Baker, M., Harris, T., & Stephenson, D. (2015). Loneliness and social isolation as risk factors for mortality a meta-analytic review. Perspectives on Psychological Science, 10(2), 227-237.
29
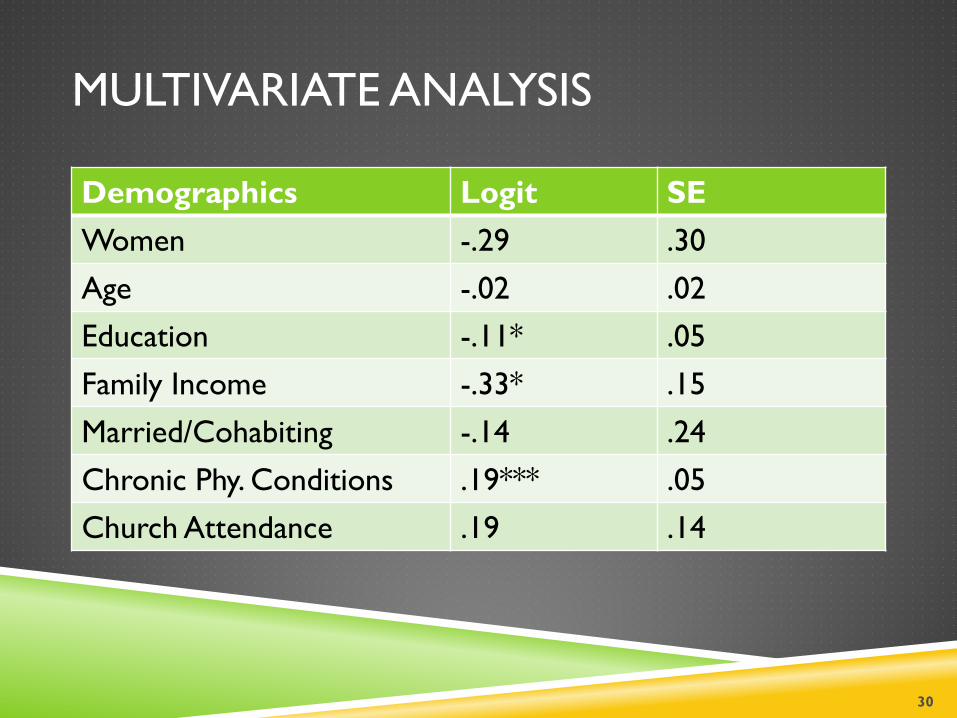
MULTIVARIATE ANALYSIS
Demographics Logit SE Women -.29 .30 Age -.02 .02 Education -.11* .05 Family Income -.33* .15 Married/Cohabiting -.14 .24 Chronic Phy. Conditions .19*** .05 Church Attendance .19 .14
30
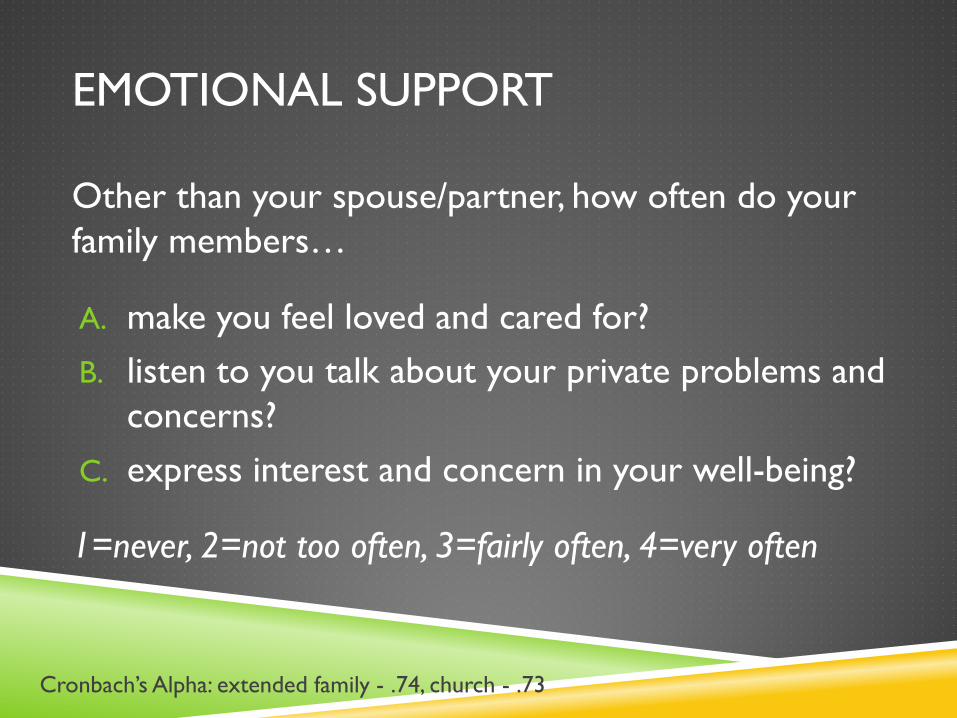
EMOTIONAL SUPPORT
Other than your spouse/partner, how often do your family members…
A. make you feel loved and cared for? B. listen to you talk about your private problems and
concerns? C. express interest and concern in your well-being?
1=never, 2=not too often, 3=fairly often, 4=very often
Cronbach’s Alpha: extended family - .74, church - .73
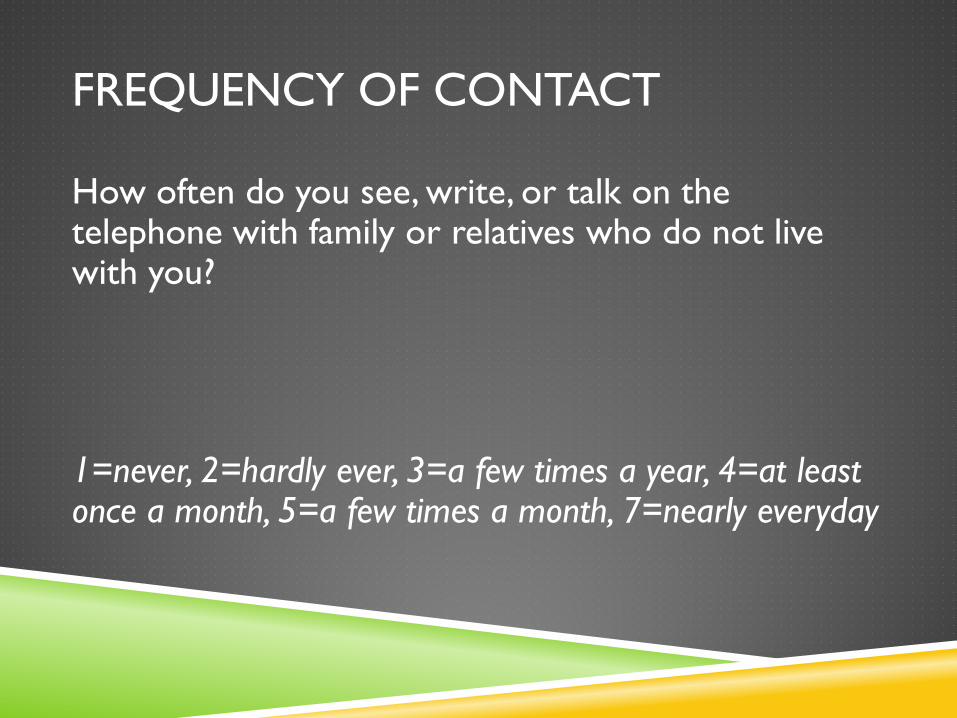
FREQUENCY OF CONTACT
How often do you see, write, or talk on the telephone with family or relatives who do not live with you? 1=never, 2=hardly ever, 3=a few times a year, 4=at least once a month, 5=a few times a month, 7=nearly everyday
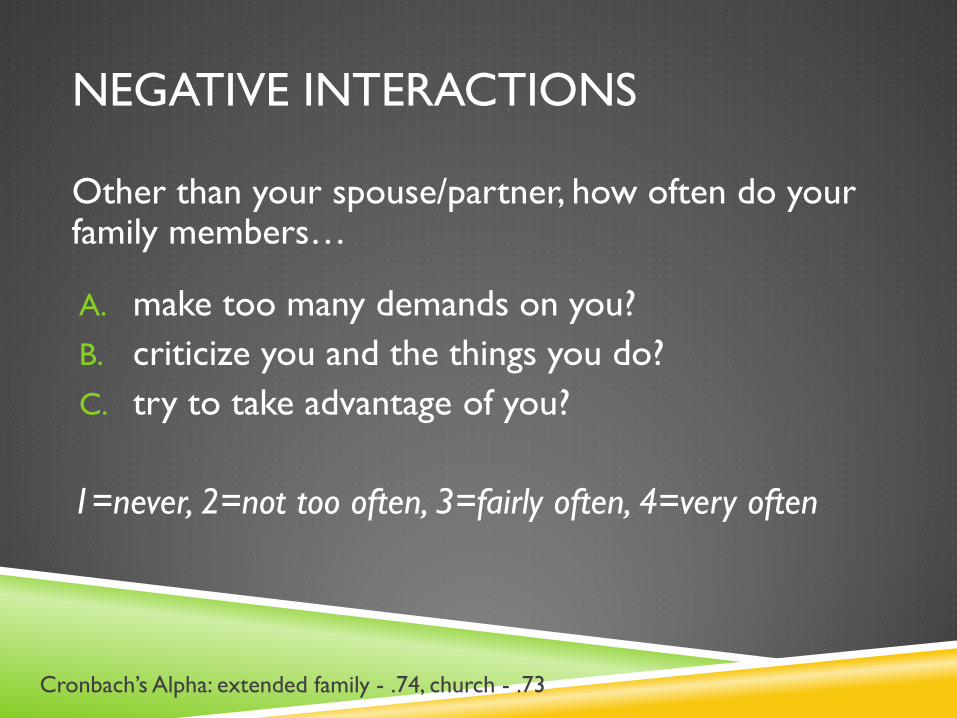
NEGATIVE INTERACTIONS
Other than your spouse/partner, how often do your family members…
A. make too many demands on you? B. criticize you and the things you do? C. try to take advantage of you? 1=never, 2=not too often, 3=fairly often, 4=very often
Cronbach’s Alpha: extended family - .74, church - .73
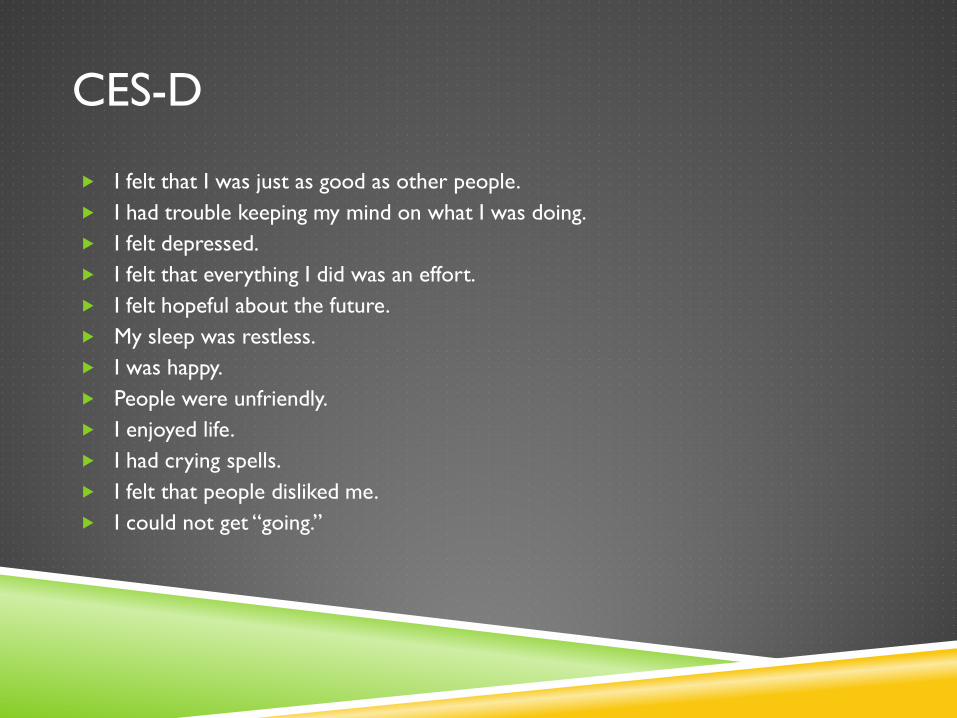
CES-D
I felt that I was just as good as other people. I had trouble keeping my mind on what I was doing. I felt depressed. I felt that everything I did was an effort. I felt hopeful about the future. My sleep was restless. I was happy. People were unfriendly. I enjoyed life. I had crying spells. I felt that people disliked me. I could not get “going.”