Embed Size (px)
Citation preview
On Being the Right Scale: Sizing Large Collections of 3D Models
Manolis Savva, Angel X. Chang, Gilbert Bernstein, Christopher D. Manning, Pat HanrahanComputer Science Department, Stanford University
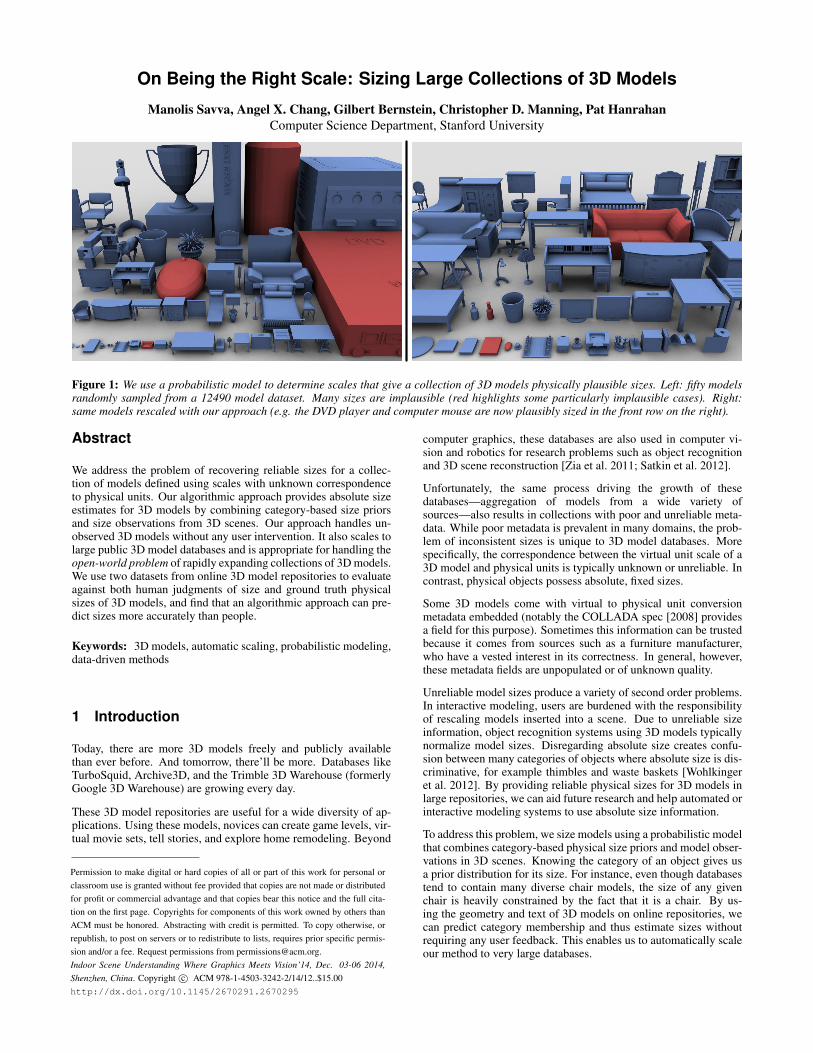
Figure 1: We use a probabilistic model to determine scales that give a collection of 3D models physically plausible sizes. Left: fifty modelsrandomly sampled from a 12490 model dataset. Many sizes are implausible (red highlights some particularly implausible cases). Right:same models rescaled with our approach (e.g. the DVD player and computer mouse are now plausibly sized in the front row on the right).
Abstract
We address the problem of recovering reliable sizes for a collec-tion of models defined using scales with unknown correspondenceto physical units. Our algorithmic approach provides absolute sizeestimates for 3D models by combining category-based size priorsand size observations from 3D scenes. Our approach handles un-observed 3D models without any user intervention. It also scales tolarge public 3D model databases and is appropriate for handling theopen-world problem of rapidly expanding collections of 3D models.We use two datasets from online 3D model repositories to evaluateagainst both human judgments of size and ground truth physicalsizes of 3D models, and find that an algorithmic approach can pre-dict sizes more accurately than people.
Keywords: 3D models, automatic scaling, probabilistic modeling,data-driven methods
Permission to make digital or hard copies of all or part of this work for personal orclassroom use is granted without fee provided that copies are not made or distributedfor profit or commercial advantage and that copies bear this notice and the full cita-tion on the first page. Copyrights for components of this work owned by others thanACM must be honored. Abstracting with credit is permitted. To copy otherwise, orrepublish, to post on servers or to redistribute to lists, requires prior specific permis-sion and/or a fee. Request permissions from [email protected] Scene Understanding Where Graphics Meets Vision’14, Dec. 03-06 2014,Shenzhen, China. Copyright c© ACM 978-1-4503-3242-2/14/12..$15.00http://dx.doi.org/10.1145/2670291.2670295
1 Introduction
Today, there are more 3D models freely and publicly availablethan ever before. And tomorrow, there’ll be more. Databases likeTurboSquid, Archive3D, and the Trimble 3D Warehouse (formerlyGoogle 3D Warehouse) are growing every day.
These 3D model repositories are useful for a wide diversity of ap-plications. Using these models, novices can create game levels, vir-tual movie sets, tell stories, and explore home remodeling. Beyond
computer graphics, these databases are also used in computer vi-sion and robotics for research problems such as object recognitionand 3D scene reconstruction [Zia et al. 2011; Satkin et al. 2012].
Unfortunately, the same process driving the growth of thesedatabases—aggregation of models from a wide variety ofsources—also results in collections with poor and unreliable meta-data. While poor metadata is prevalent in many domains, the prob-lem of inconsistent sizes is unique to 3D model databases. Morespecifically, the correspondence between the virtual unit scale of a3D model and physical units is typically unknown or unreliable. Incontrast, physical objects possess absolute, fixed sizes.
Some 3D models come with virtual to physical unit conversionmetadata embedded (notably the COLLADA spec [2008] providesa field for this purpose). Sometimes this information can be trustedbecause it comes from sources such as a furniture manufacturer,who have a vested interest in its correctness. In general, however,these metadata fields are unpopulated or of unknown quality.
Unreliable model sizes produce a variety of second order problems.In interactive modeling, users are burdened with the responsibilityof rescaling models inserted into a scene. Due to unreliable sizeinformation, object recognition systems using 3D models typicallynormalize model sizes. Disregarding absolute size creates confu-sion between many categories of objects where absolute size is dis-criminative, for example thimbles and waste baskets [Wohlkingeret al. 2012]. By providing reliable physical sizes for 3D models inlarge repositories, we can aid future research and help automated orinteractive modeling systems to use absolute size information.
To address this problem, we size models using a probabilistic modelthat combines category-based physical size priors and model obser-vations in 3D scenes. Knowing the category of an object gives usa prior distribution for its size. For instance, even though databasestend to contain many diverse chair models, the size of any givenchair is heavily constrained by the fact that it is a chair. By us-ing the geometry and text of 3D models on online repositories, wecan predict category membership and thus estimate sizes withoutrequiring any user feedback. This enables us to automatically scaleour method to very large databases.
To use category-based size knowledge we need to have data for thecategories we want to handle. However, manual collection of thisdata is not a scalable solution. We show how a small set of categorysize priors can be automatically collected from external informationsources, connected to 3D models and expanded to cover additionalcategories. In order to expand these priors, we use the key insightthat 3D scenes serve as a link between co-occurring 3D models.Scenes containing models from our database provide observationsof relative sizes between any two models. Given these observationsand absolute size values or priors for a subset of models in a scene,we use the network of relative size observations to propagate sizeknowledge to other models.
Contributions To our knowledge, we are the first to pose ab-solute scaling of 3D models as a research problem. We presenta probabilistic graphical model formalization of the problem anddemonstrate a series of methods that determine physically plausi-ble scales for models in 3D model databases. We show how thesemethods integrate different sources of size information: known sizereference models, observations from 3D scenes and category-basedabsolute size priors. We analyze the performance of these differentsources of size data independently and in combination for predict-ing 3D model scales. We evaluate against human size judgmentsand against manually annotated ground truth size models. Finally,we provide our learned size priors and best size estimates from twolarge 3D model datasets for the benefit of the research community.
2 Background
Computer vision research has recently shown that 3D modeldatabases can be used for object categorization, and pose and depthestimation [Zia et al. 2011; Wohlkinger et al. 2012]. The authorsobserve that size data is critical for such tasks but usually unavail-able. In the absence of reliably sized 3D model data, vision re-searchers have resorted to estimating object sizes from 2D imagesand camera parameters in order to show the benefit of size informa-tion for recognition tasks [Fritz et al. 2010].
Recent work in natural language processing has automatically ex-tracted numerical attributes from web text [Davidov and Rappoport2010]. That system provides estimates of height and weight valuesfor particular named entities (such as celebrities) or object classes(such as apples). This recent work motivates our focus on providinga general, scalable approach to consistently size 3D models in largepublic 3D databases.
Previous research related to sizing 3D models has focused just onthe geometric problem of non-homogeneous resizing [Kraevoy et al.2008; Wang and Zhang 2009]. Other researchers have noted thatthe scales of 3D models are frequently inconsistent between mod-els and result in physically implausible sizes [Wohlkinger et al.2012]. However, this problem only really comes to the forefrontwhen models are used in an external context such as a 3D sceneor connected to real world data. We believe absolute sizing of 3Dmodels has not been posed as a research problem until now becauselarge, publicly available 3D model datasets that enable 3D modelre-use and re-combination are a fairly recent phenomenon.
Thus far, work on systems that leverage absolute size informationfrom 3D models is typically restricted to smaller, manually vali-dated datasets [Shao et al. 2012]. However, manual validation isnot a scalable solution, nor can it be applied to growing modeldatabases. We thus target our approach to large, unstructured andunclean collections of 3D models.
Previous work has dealt with height estimation of annotated objectsin collections of photographs [Hoiem et al. 2006; Lalonde et al.
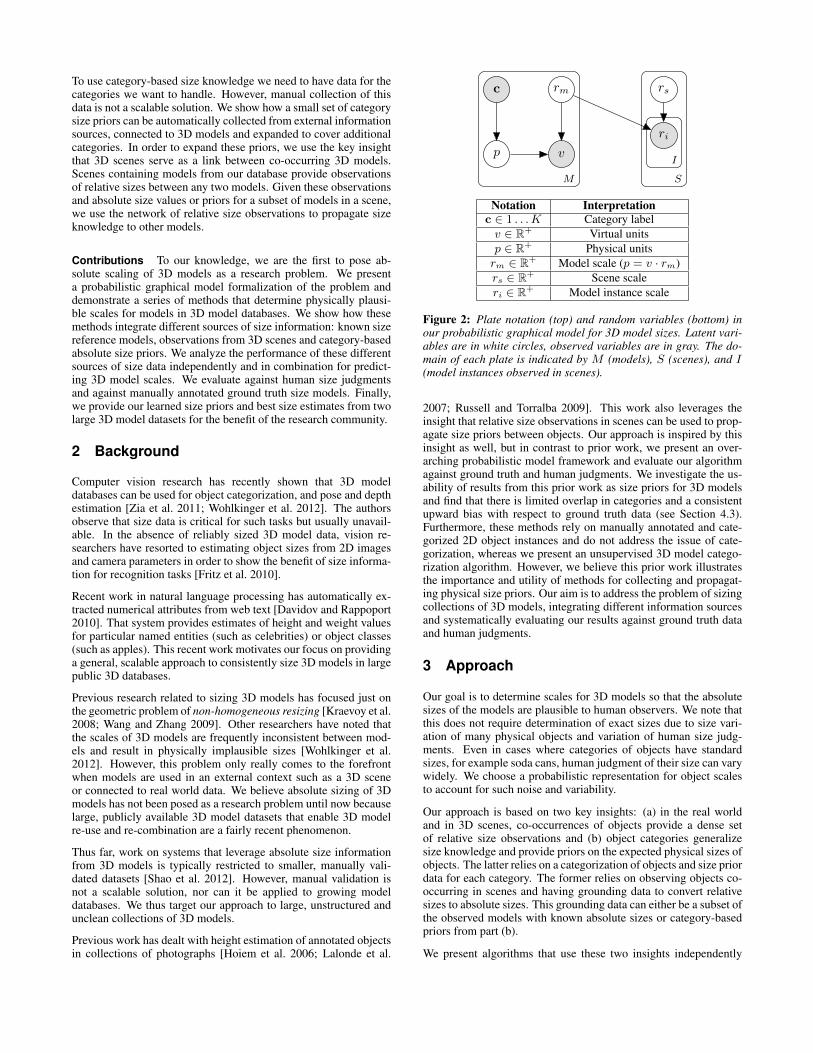
p
c
v
rm
ri
rs
M
I
S
Notation Interpretationc ∈ 1 . . .K Category labelv ∈ R+ Virtual unitsp ∈ R+ Physical unitsrm ∈ R+ Model scale (p = v · rm)rs ∈ R+ Scene scaleri ∈ R+ Model instance scale
Figure 2: Plate notation (top) and random variables (bottom) inour probabilistic graphical model for 3D model sizes. Latent vari-ables are in white circles, observed variables are in gray. The do-main of each plate is indicated by M (models), S (scenes), and I(model instances observed in scenes).
2007; Russell and Torralba 2009]. This work also leverages theinsight that relative size observations in scenes can be used to prop-agate size priors between objects. Our approach is inspired by thisinsight as well, but in contrast to prior work, we present an over-arching probabilistic model framework and evaluate our algorithmagainst ground truth and human judgments. We investigate the us-ability of results from this prior work as size priors for 3D modelsand find that there is limited overlap in categories and a consistentupward bias with respect to ground truth data (see Section 4.3).Furthermore, these methods rely on manually annotated and cate-gorized 2D object instances and do not address the issue of cate-gorization, whereas we present an unsupervised 3D model catego-rization algorithm. However, we believe this prior work illustratesthe importance and utility of methods for collecting and propagat-ing physical size priors. Our aim is to address the problem of sizingcollections of 3D models, integrating different information sourcesand systematically evaluating our results against ground truth dataand human judgments.
3 Approach
Our goal is to determine scales for 3D models so that the absolutesizes of the models are plausible to human observers. We note thatthis does not require determination of exact sizes due to size vari-ation of many physical objects and variation of human size judg-ments. Even in cases where categories of objects have standardsizes, for example soda cans, human judgment of their size can varywidely. We choose a probabilistic representation for object scalesto account for such noise and variability.
Our approach is based on two key insights: (a) in the real worldand in 3D scenes, co-occurrences of objects provide a dense setof relative size observations and (b) object categories generalizesize knowledge and provide priors on the expected physical sizes ofobjects. The latter relies on a categorization of objects and size priordata for each category. The former relies on observing objects co-occurring in scenes and having grounding data to convert relativesizes to absolute sizes. This grounding data can either be a subset ofthe observed models with known absolute sizes or category-basedpriors from part (b).
We present algorithms that use these two insights independently
and an approach combining both. First, we formalize our problemwith a probabilistic model (Figure 2). The left side of the plate di-agram corresponds to category-based size priors informing modelphysical sizes. The right side represents observations of model in-stances in 3D scenes with unobserved latent scene scales. The twosides interact through the assumption that the product of model in-stance scales ri and an overall scene scale rs should take modelsfrom virtual dimensions v to physical dimensions p, as does themodel scale rm. Formally: p = vrm = vrirs or rm = rirs.
We will treat the conditional probability of a given model havingvirtual size v: P (v|p, rm) = 1(v = p/rm) as a deterministic re-lation involving the physical size of the represented object p andthe latent scale of the model rm. Since we expect to see varia-tion in the observed model instance scales, we will model them asbeing drawn from a log-normal distribution: P (log(ri)|rm, rs) ∼N (log(rm)−log(rs), σ2). As ri is a ratio quantity, the variation inits distribution can be viewed as a product of independent randomvariables. Therefore ri is likely to follow a log normal distribu-tion. Working in log space also ensures that ri is always positiveand accommodates a wide range of scales across orders of magni-tude. We will similarly treat rm and rs as log-normally distributed:P (log(rm)) ∼ N (θm, σm) and P (log(rs)) ∼ N (θs, σs). Al-though here we use relatively simple distributions over our randomvariables, a probabilistic framework allows for principled future ex-tensions. We discuss improvements to the model, such as usingmulti-modal distributions or priors over the model scales in Sec-tion 7.1.
For the physical and virtual units we use the 3D model’s boundingbox diagonal. The diagonal is relatively stable with respect to axisaligned rotations in model alignment, which constitute the major-ity of cases of alignment inconsistency in our model datasets (seeSection 4.1). A more advanced approach might use multivariateGaussians for the distribution of physical and virtual dimensions,capturing additional information about the variability along eachdimension.
We will first look at the right side of our probabilistic model wherewe only deal with observations of model instances in scenes, with-out a notion of model categories (Section 5.1). We will show thatjust using scene information we can get fairly accurate sizes formodels observed in scenes. However, we cannot cover models thatare not observed in any scenes.
To address this shortcoming, we will use categories and categorysize priors. This corresponds to the left side of our probabilisticmodel which we will first look at in isolation in Section 5.2. Wewill describe how we collect and use priors for physical sizes pand then how we determine model scales rm for given models withvirtual sizes v. Then we will connect these two approaches by usingthe entirety of our probabilistic model (Section 5.3).
Different information sources impact the extent to which our ap-proach can cover a model dataset, as illustrated in Figure 3. Usingscenes alone, we can only expect to predict sizes for models occur-
3D Model Collection
Models in scenes
Models with size priors
Models with category labels
Sized reference
models
Figure 3: Representation of a collection of 3D models and the par-titioning of the models into sets based on available information.
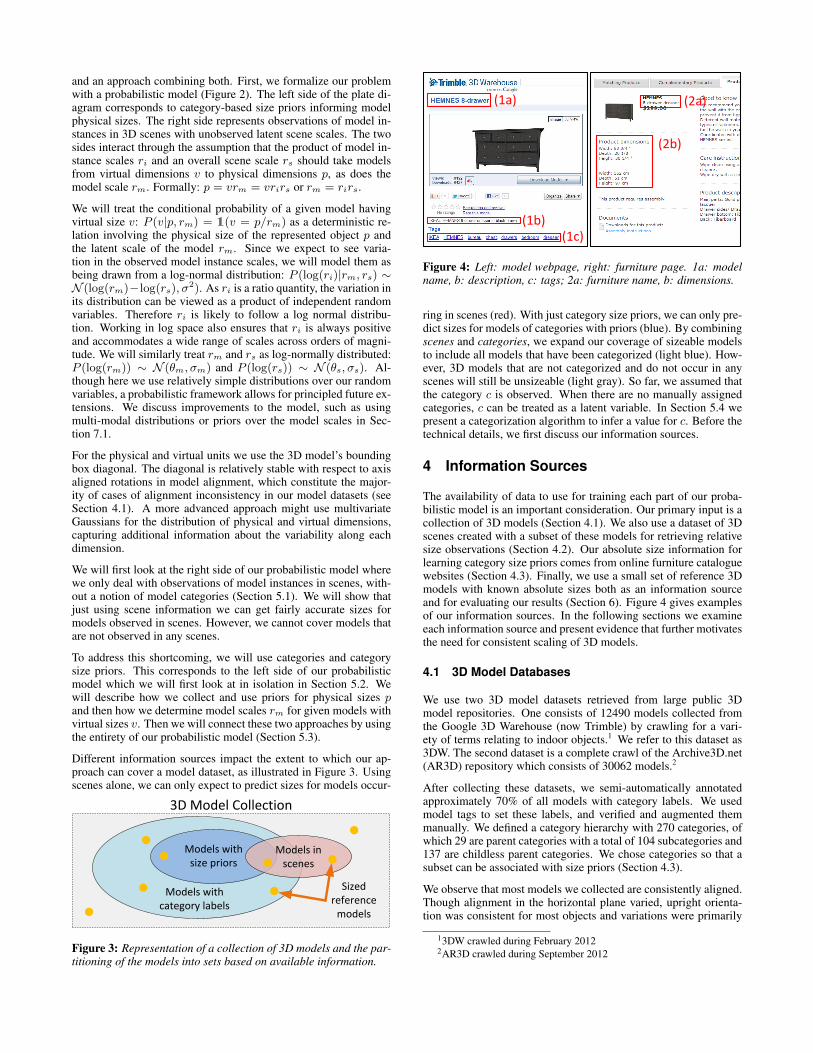
(1a)
(1c)(1b)
(2a)
(2b)
Figure 4: Left: model webpage, right: furniture page. 1a: modelname, b: description, c: tags; 2a: furniture name, b: dimensions.
ring in scenes (red). With just category size priors, we can only pre-dict sizes for models of categories with priors (blue). By combiningscenes and categories, we expand our coverage of sizeable modelsto include all models that have been categorized (light blue). How-ever, 3D models that are not categorized and do not occur in anyscenes will still be unsizeable (light gray). So far, we assumed thatthe category c is observed. When there are no manually assignedcategories, c can be treated as a latent variable. In Section 5.4 wepresent a categorization algorithm to infer a value for c. Before thetechnical details, we first discuss our information sources.
4 Information Sources
The availability of data to use for training each part of our proba-bilistic model is an important consideration. Our primary input is acollection of 3D models (Section 4.1). We also use a dataset of 3Dscenes created with a subset of these models for retrieving relativesize observations (Section 4.2). Our absolute size information forlearning category size priors comes from online furniture cataloguewebsites (Section 4.3). Finally, we use a small set of reference 3Dmodels with known absolute sizes both as an information sourceand for evaluating our results (Section 6). Figure 4 gives examplesof our information sources. In the following sections we examineeach information source and present evidence that further motivatesthe need for consistent scaling of 3D models.
4.1 3D Model Databases
We use two 3D model datasets retrieved from large public 3Dmodel repositories. One consists of 12490 models collected fromthe Google 3D Warehouse (now Trimble) by crawling for a vari-ety of terms relating to indoor objects.1 We refer to this dataset as3DW. The second dataset is a complete crawl of the Archive3D.net(AR3D) repository which consists of 30062 models.2
After collecting these datasets, we semi-automatically annotatedapproximately 70% of all models with category labels. We usedmodel tags to set these labels, and verified and augmented themmanually. We defined a category hierarchy with 270 categories, ofwhich 29 are parent categories with a total of 104 subcategories and137 are childless parent categories. We chose categories so that asubset can be associated with size priors (Section 4.3).
We observe that most models we collected are consistently aligned.Though alignment in the horizontal plane varied, upright orienta-tion was consistent for most objects and variations were primarily
13DW crawled during February 20122AR3D crawled during September 2012
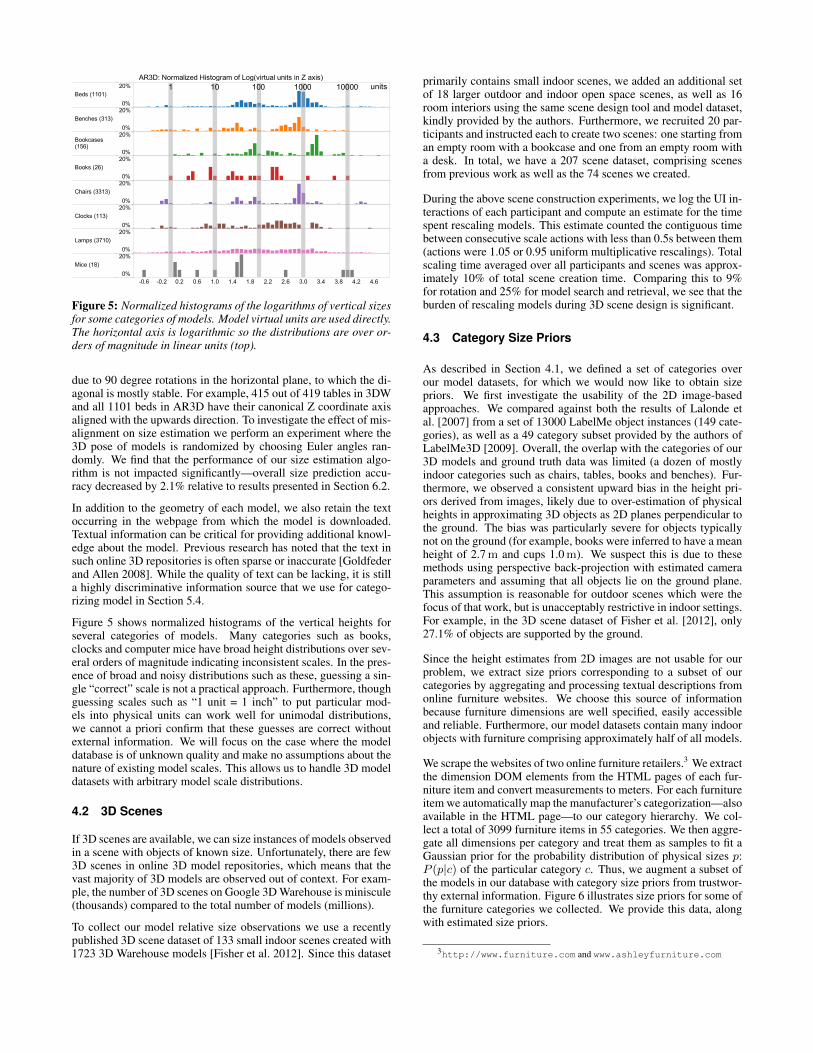
-0.6 -0.2 0.2 0.6 1.0 1.4 1.8 2.2 2.6 3.0 3.4 3.8 4.2 4.6
Beds (1101)Benches (313)Bookcases(156)Books (26)Chairs (3313)Clocks (113)Lamps (3710)Mice (18)
0%20%0%20%0%20%0%20%0%20%0%20%0%20%0%20%
1 10 100 100001000 unitsAR3D: Normalized Histogram of Log(virtual units in Z axis)
Figure 5: Normalized histograms of the logarithms of vertical sizesfor some categories of models. Model virtual units are used directly.The horizontal axis is logarithmic so the distributions are over or-ders of magnitude in linear units (top).
due to 90 degree rotations in the horizontal plane, to which the di-agonal is mostly stable. For example, 415 out of 419 tables in 3DWand all 1101 beds in AR3D have their canonical Z coordinate axisaligned with the upwards direction. To investigate the effect of mis-alignment on size estimation we perform an experiment where the3D pose of models is randomized by choosing Euler angles ran-domly. We find that the performance of our size estimation algo-rithm is not impacted significantly—overall size prediction accu-racy decreased by 2.1% relative to results presented in Section 6.2.
In addition to the geometry of each model, we also retain the textoccurring in the webpage from which the model is downloaded.Textual information can be critical for providing additional knowl-edge about the model. Previous research has noted that the text insuch online 3D repositories is often sparse or inaccurate [Goldfederand Allen 2008]. While the quality of text can be lacking, it is stilla highly discriminative information source that we use for catego-rizing model in Section 5.4.
Figure 5 shows normalized histograms of the vertical heights forseveral categories of models. Many categories such as books,clocks and computer mice have broad height distributions over sev-eral orders of magnitude indicating inconsistent scales. In the pres-ence of broad and noisy distributions such as these, guessing a sin-gle “correct” scale is not a practical approach. Furthermore, thoughguessing scales such as “1 unit = 1 inch” to put particular mod-els into physical units can work well for unimodal distributions,we cannot a priori confirm that these guesses are correct withoutexternal information. We will focus on the case where the modeldatabase is of unknown quality and make no assumptions about thenature of existing model scales. This allows us to handle 3D modeldatasets with arbitrary model scale distributions.
4.2 3D Scenes
If 3D scenes are available, we can size instances of models observedin a scene with objects of known size. Unfortunately, there are few3D scenes in online 3D model repositories, which means that thevast majority of 3D models are observed out of context. For exam-ple, the number of 3D scenes on Google 3D Warehouse is miniscule(thousands) compared to the total number of models (millions).
To collect our model relative size observations we use a recentlypublished 3D scene dataset of 133 small indoor scenes created with1723 3D Warehouse models [Fisher et al. 2012]. Since this dataset
primarily contains small indoor scenes, we added an additional setof 18 larger outdoor and indoor open space scenes, as well as 16room interiors using the same scene design tool and model dataset,kindly provided by the authors. Furthermore, we recruited 20 par-ticipants and instructed each to create two scenes: one starting froman empty room with a bookcase and one from an empty room witha desk. In total, we have a 207 scene dataset, comprising scenesfrom previous work as well as the 74 scenes we created.
During the above scene construction experiments, we log the UI in-teractions of each participant and compute an estimate for the timespent rescaling models. This estimate counted the contiguous timebetween consecutive scale actions with less than 0.5s between them(actions were 1.05 or 0.95 uniform multiplicative rescalings). Totalscaling time averaged over all participants and scenes was approx-imately 10% of total scene creation time. Comparing this to 9%for rotation and 25% for model search and retrieval, we see that theburden of rescaling models during 3D scene design is significant.
4.3 Category Size Priors
As described in Section 4.1, we defined a set of categories overour model datasets, for which we would now like to obtain sizepriors. We first investigate the usability of the 2D image-basedapproaches. We compared against both the results of Lalonde etal. [2007] from a set of 13000 LabelMe object instances (149 cate-gories), as well as a 49 category subset provided by the authors ofLabelMe3D [2009]. Overall, the overlap with the categories of our3D models and ground truth data was limited (a dozen of mostlyindoor categories such as chairs, tables, books and benches). Fur-thermore, we observed a consistent upward bias in the height pri-ors derived from images, likely due to over-estimation of physicalheights in approximating 3D objects as 2D planes perpendicular tothe ground. The bias was particularly severe for objects typicallynot on the ground (for example, books were inferred to have a meanheight of 2.7m and cups 1.0m). We suspect this is due to thesemethods using perspective back-projection with estimated cameraparameters and assuming that all objects lie on the ground plane.This assumption is reasonable for outdoor scenes which were thefocus of that work, but is unacceptably restrictive in indoor settings.For example, in the 3D scene dataset of Fisher et al. [2012], only27.1% of objects are supported by the ground.
Since the height estimates from 2D images are not usable for ourproblem, we extract size priors corresponding to a subset of ourcategories by aggregating and processing textual descriptions fromonline furniture websites. We choose this source of informationbecause furniture dimensions are well specified, easily accessibleand reliable. Furthermore, our model datasets contain many indoorobjects with furniture comprising approximately half of all models.
We scrape the websites of two online furniture retailers.3 We extractthe dimension DOM elements from the HTML pages of each fur-niture item and convert measurements to meters. For each furnitureitem we automatically map the manufacturer’s categorization—alsoavailable in the HTML page—to our category hierarchy. We col-lect a total of 3099 furniture items in 55 categories. We then aggre-gate all dimensions per category and treat them as samples to fit aGaussian prior for the probability distribution of physical sizes p:P (p|c) of the particular category c. Thus, we augment a subset ofthe models in our database with category size priors from trustwor-thy external information. Figure 6 illustrates size priors for some ofthe furniture categories we collected. We provide this data, alongwith estimated size priors.
3http://www.furniture.com and www.ashleyfurniture.com
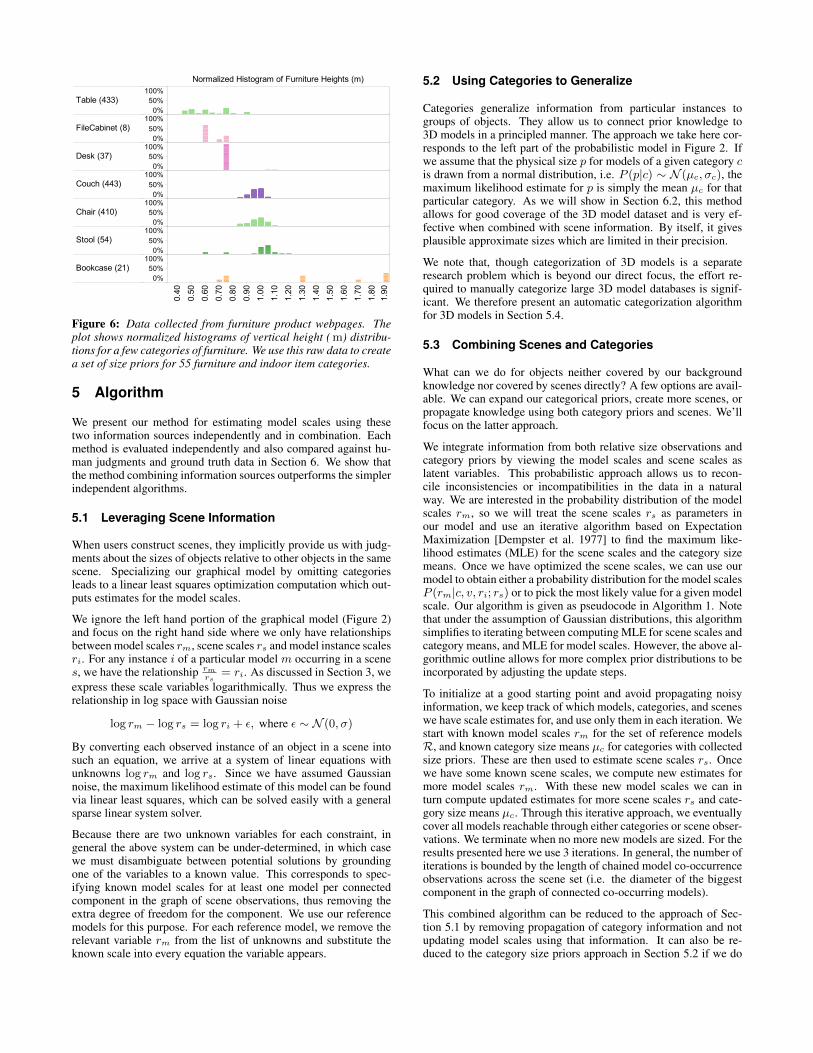
Normalized Histogram of Furniture Heights (m)
0.40 0.50 0.60 0.70 0.80 0.90 1.00 1.10 1.20 1.30 1.40 1.50 1.60 1.70 1.80 1.90
Table (433)FileCabinet (8)Desk (37)Couch (443)Chair (410)Stool (54)Bookcase (21)
0%50%100%0%50%100%0%50%100%0%50%100%0%50%100%0%50%100%0%50%100%
Figure 6: Data collected from furniture product webpages. Theplot shows normalized histograms of vertical height (m) distribu-tions for a few categories of furniture. We use this raw data to createa set of size priors for 55 furniture and indoor item categories.
5 Algorithm
We present our method for estimating model scales using thesetwo information sources independently and in combination. Eachmethod is evaluated independently and also compared against hu-man judgments and ground truth data in Section 6. We show thatthe method combining information sources outperforms the simplerindependent algorithms.
5.1 Leveraging Scene Information
When users construct scenes, they implicitly provide us with judg-ments about the sizes of objects relative to other objects in the samescene. Specializing our graphical model by omitting categoriesleads to a linear least squares optimization computation which out-puts estimates for the model scales.
We ignore the left hand portion of the graphical model (Figure 2)and focus on the right hand side where we only have relationshipsbetween model scales rm, scene scales rs and model instance scalesri. For any instance i of a particular model m occurring in a scenes, we have the relationship rm
rs= ri. As discussed in Section 3, we
express these scale variables logarithmically. Thus we express therelationship in log space with Gaussian noise
log rm − log rs = log ri + ε, where ε ∼ N (0, σ)
By converting each observed instance of an object in a scene intosuch an equation, we arrive at a system of linear equations withunknowns log rm and log rs. Since we have assumed Gaussiannoise, the maximum likelihood estimate of this model can be foundvia linear least squares, which can be solved easily with a generalsparse linear system solver.
Because there are two unknown variables for each constraint, ingeneral the above system can be under-determined, in which casewe must disambiguate between potential solutions by groundingone of the variables to a known value. This corresponds to spec-ifying known model scales for at least one model per connectedcomponent in the graph of scene observations, thus removing theextra degree of freedom for the component. We use our referencemodels for this purpose. For each reference model, we remove therelevant variable rm from the list of unknowns and substitute theknown scale into every equation the variable appears.
5.2 Using Categories to Generalize
Categories generalize information from particular instances togroups of objects. They allow us to connect prior knowledge to3D models in a principled manner. The approach we take here cor-responds to the left part of the probabilistic model in Figure 2. Ifwe assume that the physical size p for models of a given category cis drawn from a normal distribution, i.e. P (p|c) ∼ N (µc, σc), themaximum likelihood estimate for p is simply the mean µc for thatparticular category. As we will show in Section 6.2, this methodallows for good coverage of the 3D model dataset and is very ef-fective when combined with scene information. By itself, it givesplausible approximate sizes which are limited in their precision.
We note that, though categorization of 3D models is a separateresearch problem which is beyond our direct focus, the effort re-quired to manually categorize large 3D model databases is signif-icant. We therefore present an automatic categorization algorithmfor 3D models in Section 5.4.
5.3 Combining Scenes and Categories
What can we do for objects neither covered by our backgroundknowledge nor covered by scenes directly? A few options are avail-able. We can expand our categorical priors, create more scenes, orpropagate knowledge using both category priors and scenes. We’llfocus on the latter approach.
We integrate information from both relative size observations andcategory priors by viewing the model scales and scene scales aslatent variables. This probabilistic approach allows us to recon-cile inconsistencies or incompatibilities in the data in a naturalway. We are interested in the probability distribution of the modelscales rm, so we will treat the scene scales rs as parameters inour model and use an iterative algorithm based on ExpectationMaximization [Dempster et al. 1977] to find the maximum like-lihood estimates (MLE) for the scene scales and the category sizemeans. Once we have optimized the scene scales, we can use ourmodel to obtain either a probability distribution for the model scalesP (rm|c, v, ri; rs) or to pick the most likely value for a given modelscale. Our algorithm is given as pseudocode in Algorithm 1. Notethat under the assumption of Gaussian distributions, this algorithmsimplifies to iterating between computing MLE for scene scales andcategory means, and MLE for model scales. However, the above al-gorithmic outline allows for more complex prior distributions to beincorporated by adjusting the update steps.
To initialize at a good starting point and avoid propagating noisyinformation, we keep track of which models, categories, and sceneswe have scale estimates for, and use only them in each iteration. Westart with known model scales rm for the set of reference modelsR, and known category size means µc for categories with collectedsize priors. These are then used to estimate scene scales rs. Oncewe have some known scene scales, we compute new estimates formore model scales rm. With these new model scales we can inturn compute updated estimates for more scene scales rs and cate-gory size means µc. Through this iterative approach, we eventuallycover all models reachable through either categories or scene obser-vations. We terminate when no more new models are sized. For theresults presented here we use 3 iterations. In general, the number ofiterations is bounded by the length of chained model co-occurrenceobservations across the scene set (i.e. the diameter of the biggestcomponent in the graph of connected co-occurring models).
This combined algorithm can be reduced to the approach of Sec-tion 5.1 by removing propagation of category information and notupdating model scales using that information. It can also be re-duced to the category size priors approach in Section 5.2 if we do
not provide scene data.
Algorithm 1: EM for size propagation.input : set of 3D models M= {m = (c, v)}input : set of scenes S = {1 . . . S}input : set of categories C= {1 . . .K}input : set of priors on physical size conditioned on category
P = {(c, µ0c , σ0c )}
input : set of reference models R = {(m, rm)}input : set of model observations in scenes I = {(s,m, ri)}// Initialize mean of log of model scales θm and scene scales θs to {}
// Initialize θm for ref models
1 foreach (m, rm) in R do2 θm = log(rm)
// Initialize category size mean µc to prior mean
3 foreach (c, µ0c , σ0c ) in P do
4 µc = µ0c
// repeat for T iterations until convergence:
5 for t = 1 to T do// E-step: update MLE for non-ref model scales using estimated scene
scales and category means
6 foreach model m in M - R do// Average over Nmi = # of inst. scales for model m
7 θm =log(µc)+
∑i(θs+log(ri))
1(µc>0)+Nmi
// M-step: update MLE for scene scales and category means using
estimated model scales
8 foreach scene s in S do// Average over Nsi = # of inst. scales for scene s
9 θs =∑i(θm−log(ri))
Nsi
10 foreach category c in C do// Average physical size for category c
11 µc =1Nc
∑m vm exp(θm)
output : estimated mean of log of model scales θmoutput : estimated mean of log of scene scales θs
5.4 Automatic Categorization
Our method relies on categories to establish and propagate size pri-ors. We have defined a manual categorization for our models, but tohandle an open-world scenario we need to automatically categorizebeyond a small set of pre-defined categories. There is much litera-ture on retrieval and classification of 3D models using a variety ofapproaches [Min et al. 2004; Tangelder and Veltkamp 2008]. Theproblem of unsupervised 3D model categorization is a challengingone, and not our direct research focus but we present a sensibleapproach leveraging both text and geometry. To motivate our al-gorithm we first describe the semantic taxonomy we use, and thenempirically compare the predictive performance of text and geom-etry features on our 3D model dataset.
Taxonomy Our algorithm maps each model to a node in theWordNet hierarchy [Miller 1995]. WordNet is a lexical databasefor the English language which groups English words into sets ofsynonyms known as synsets, roughly corresponding to a seman-tic category. It provides short, general descriptions of each synsetand the synsets are arranged in a hierarchy containing hypernyms(wider categories) and hyponyms (narrower categories). Since weare interested in physical objects we consider only children of the“physical object” synset. We also filter out synsets corresponding toprocesses, locations and events. There are approximately 40 thou-sand physical object noun synsets that are valid prediction targetsfor our algorithm.
Text BoW Cosine
Light Field Descriptor
3D Zernike Descriptor
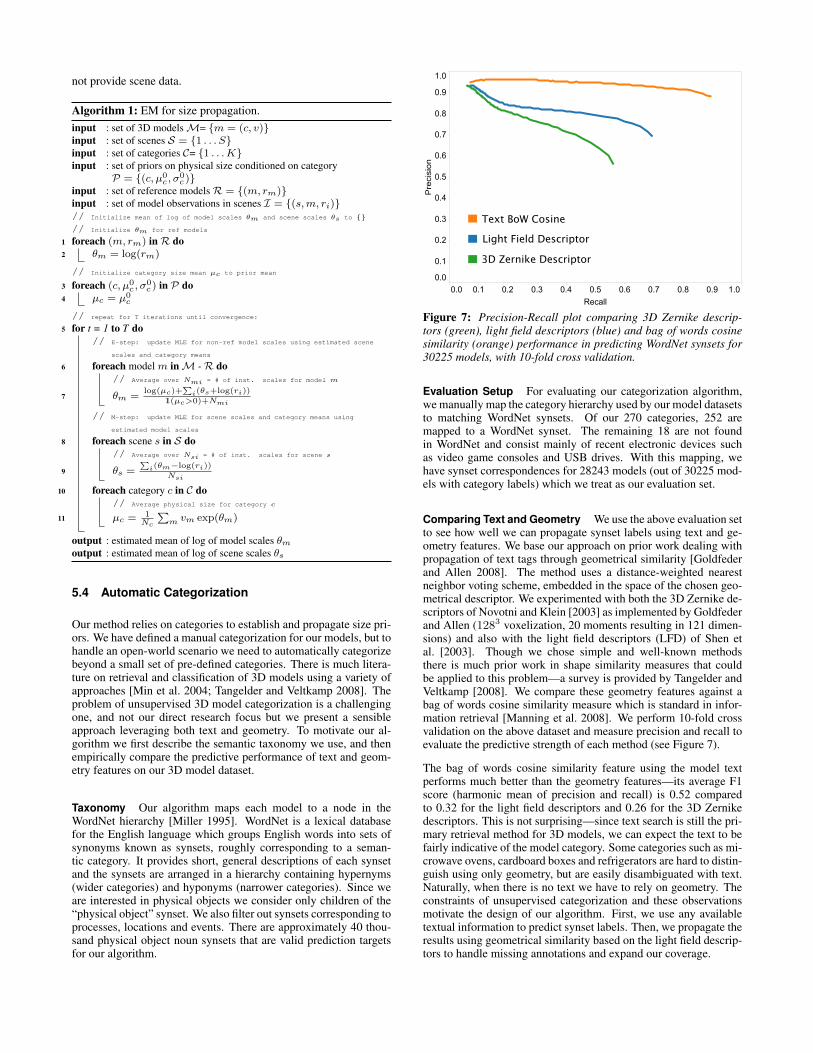
Figure 7: Precision-Recall plot comparing 3D Zernike descrip-tors (green), light field descriptors (blue) and bag of words cosinesimilarity (orange) performance in predicting WordNet synsets for30225 models, with 10-fold cross validation.
Evaluation Setup For evaluating our categorization algorithm,we manually map the category hierarchy used by our model datasetsto matching WordNet synsets. Of our 270 categories, 252 aremapped to a WordNet synset. The remaining 18 are not foundin WordNet and consist mainly of recent electronic devices suchas video game consoles and USB drives. With this mapping, wehave synset correspondences for 28243 models (out of 30225 mod-els with category labels) which we treat as our evaluation set.
Comparing Text and Geometry We use the above evaluation setto see how well we can propagate synset labels using text and ge-ometry features. We base our approach on prior work dealing withpropagation of text tags through geometrical similarity [Goldfederand Allen 2008]. The method uses a distance-weighted nearestneighbor voting scheme, embedded in the space of the chosen geo-metrical descriptor. We experimented with both the 3D Zernike de-scriptors of Novotni and Klein [2003] as implemented by Goldfederand Allen (1283 voxelization, 20 moments resulting in 121 dimen-sions) and also with the light field descriptors (LFD) of Shen etal. [2003]. Though we chose simple and well-known methodsthere is much prior work in shape similarity measures that couldbe applied to this problem—a survey is provided by Tangelder andVeltkamp [2008]. We compare these geometry features against abag of words cosine similarity measure which is standard in infor-mation retrieval [Manning et al. 2008]. We perform 10-fold crossvalidation on the above dataset and measure precision and recall toevaluate the predictive strength of each method (see Figure 7).
The bag of words cosine similarity feature using the model textperforms much better than the geometry features—its average F1score (harmonic mean of precision and recall) is 0.52 comparedto 0.32 for the light field descriptors and 0.26 for the 3D Zernikedescriptors. This is not surprising—since text search is still the pri-mary retrieval method for 3D models, we can expect the text to befairly indicative of the model category. Some categories such as mi-crowave ovens, cardboard boxes and refrigerators are hard to distin-guish using only geometry, but are easily disambiguated with text.Naturally, when there is no text we have to rely on geometry. Theconstraints of unsupervised categorization and these observationsmotivate the design of our algorithm. First, we use any availabletextual information to predict synset labels. Then, we propagate theresults using geometrical similarity based on the light field descrip-tors to handle missing annotations and expand our coverage.
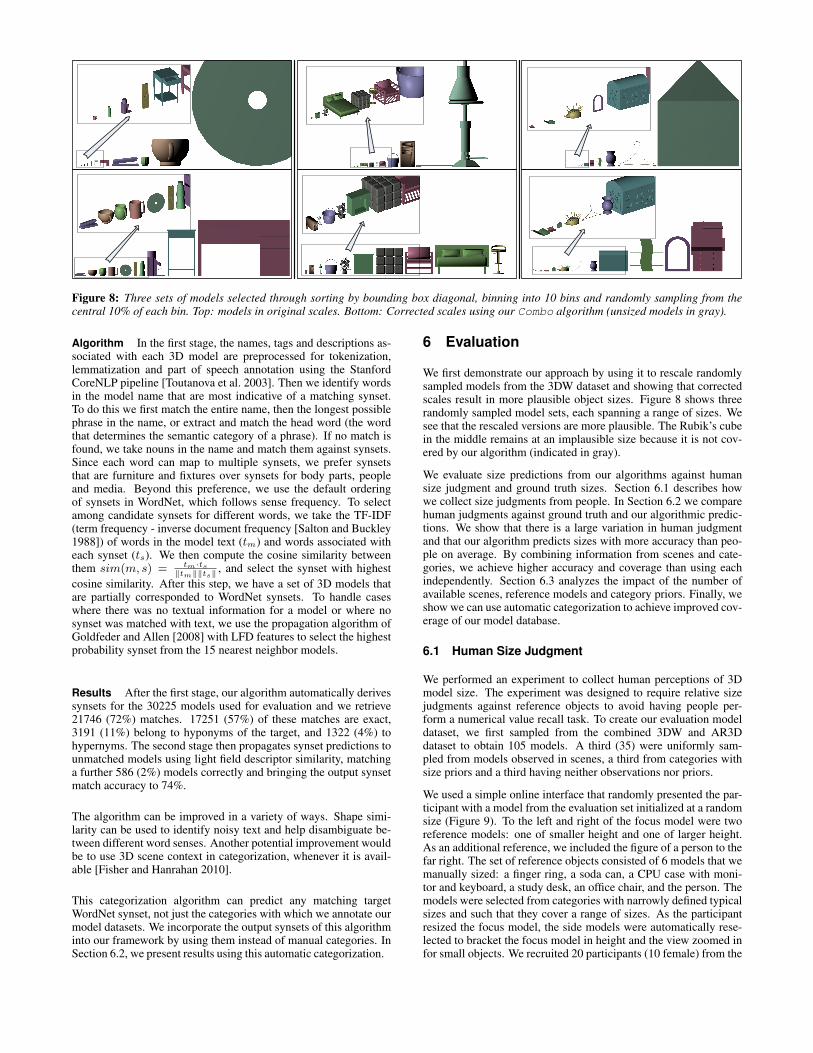
Figure 8: Three sets of models selected through sorting by bounding box diagonal, binning into 10 bins and randomly sampling from thecentral 10% of each bin. Top: models in original scales. Bottom: Corrected scales using our Combo algorithm (unsized models in gray).
Algorithm In the first stage, the names, tags and descriptions as-sociated with each 3D model are preprocessed for tokenization,lemmatization and part of speech annotation using the StanfordCoreNLP pipeline [Toutanova et al. 2003]. Then we identify wordsin the model name that are most indicative of a matching synset.To do this we first match the entire name, then the longest possiblephrase in the name, or extract and match the head word (the wordthat determines the semantic category of a phrase). If no match isfound, we take nouns in the name and match them against synsets.Since each word can map to multiple synsets, we prefer synsetsthat are furniture and fixtures over synsets for body parts, peopleand media. Beyond this preference, we use the default orderingof synsets in WordNet, which follows sense frequency. To selectamong candidate synsets for different words, we take the TF-IDF(term frequency - inverse document frequency [Salton and Buckley1988]) of words in the model text (tm) and words associated witheach synset (ts). We then compute the cosine similarity betweenthem sim(m, s) = tm·ts
‖tm‖‖ts‖ , and select the synset with highestcosine similarity. After this step, we have a set of 3D models thatare partially corresponded to WordNet synsets. To handle caseswhere there was no textual information for a model or where nosynset was matched with text, we use the propagation algorithm ofGoldfeder and Allen [2008] with LFD features to select the highestprobability synset from the 15 nearest neighbor models.
Results After the first stage, our algorithm automatically derivessynsets for the 30225 models used for evaluation and we retrieve21746 (72%) matches. 17251 (57%) of these matches are exact,3191 (11%) belong to hyponyms of the target, and 1322 (4%) tohypernyms. The second stage then propagates synset predictions tounmatched models using light field descriptor similarity, matchinga further 586 (2%) models correctly and bringing the output synsetmatch accuracy to 74%.
The algorithm can be improved in a variety of ways. Shape simi-larity can be used to identify noisy text and help disambiguate be-tween different word senses. Another potential improvement wouldbe to use 3D scene context in categorization, whenever it is avail-able [Fisher and Hanrahan 2010].
This categorization algorithm can predict any matching targetWordNet synset, not just the categories with which we annotate ourmodel datasets. We incorporate the output synsets of this algorithminto our framework by using them instead of manual categories. InSection 6.2, we present results using this automatic categorization.
6 Evaluation
We first demonstrate our approach by using it to rescale randomlysampled models from the 3DW dataset and showing that correctedscales result in more plausible object sizes. Figure 8 shows threerandomly sampled model sets, each spanning a range of sizes. Wesee that the rescaled versions are more plausible. The Rubik’s cubein the middle remains at an implausible size because it is not cov-ered by our algorithm (indicated in gray).
We evaluate size predictions from our algorithms against humansize judgment and ground truth sizes. Section 6.1 describes howwe collect size judgments from people. In Section 6.2 we comparehuman judgments against ground truth and our algorithmic predic-tions. We show that there is a large variation in human judgmentand that our algorithm predicts sizes with more accuracy than peo-ple on average. By combining information from scenes and cate-gories, we achieve higher accuracy and coverage than using eachindependently. Section 6.3 analyzes the impact of the number ofavailable scenes, reference models and category priors. Finally, weshow we can use automatic categorization to achieve improved cov-erage of our model database.
6.1 Human Size Judgment
We performed an experiment to collect human perceptions of 3Dmodel size. The experiment was designed to require relative sizejudgments against reference objects to avoid having people per-form a numerical value recall task. To create our evaluation modeldataset, we first sampled from the combined 3DW and AR3Ddataset to obtain 105 models. A third (35) were uniformly sam-pled from models observed in scenes, a third from categories withsize priors and a third having neither observations nor priors.
We used a simple online interface that randomly presented the par-ticipant with a model from the evaluation set initialized at a randomsize (Figure 9). To the left and right of the focus model were tworeference models: one of smaller height and one of larger height.As an additional reference, we included the figure of a person to thefar right. The set of reference objects consisted of 6 models that wemanually sized: a finger ring, a soda can, a CPU case with moni-tor and keyboard, a study desk, an office chair, and the person. Themodels were selected from categories with narrowly defined typicalsizes and such that they cover a range of sizes. As the participantresized the focus model, the side models were automatically rese-lected to bracket the focus model in height and the view zoomed infor small objects. We recruited 20 participants (10 female) from the
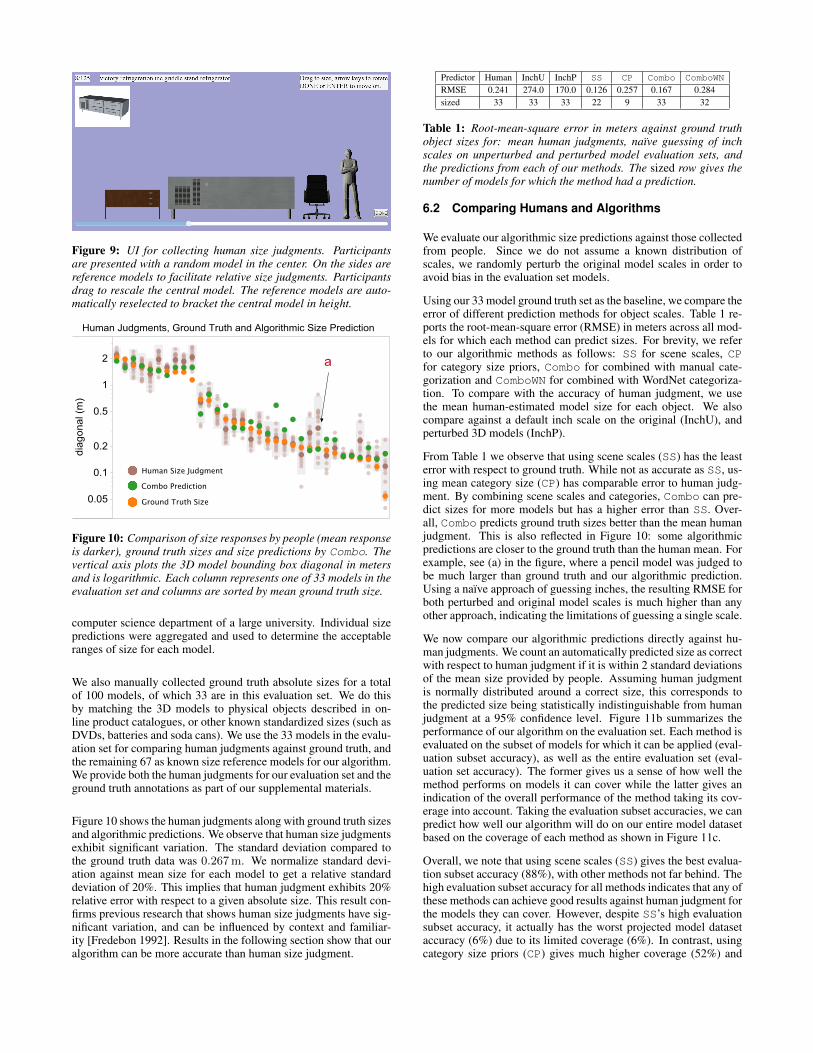
Figure 9: UI for collecting human size judgments. Participantsare presented with a random model in the center. On the sides arereference models to facilitate relative size judgments. Participantsdrag to rescale the central model. The reference models are auto-matically reselected to bracket the central model in height.
Human Size Judgment
Combo Prediction
Ground Truth Size
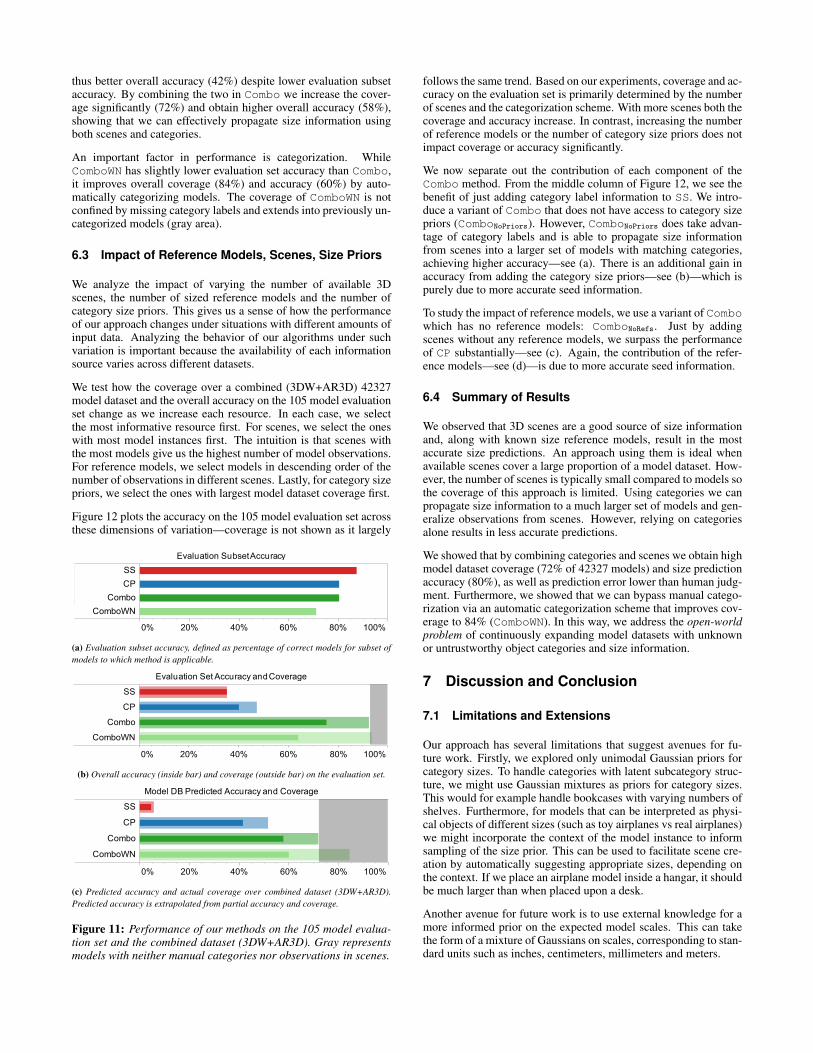
Figure 10: Comparison of size responses by people (mean responseis darker), ground truth sizes and size predictions by Combo. Thevertical axis plots the 3D model bounding box diagonal in metersand is logarithmic. Each column represents one of 33 models in theevaluation set and columns are sorted by mean ground truth size.
computer science department of a large university. Individual sizepredictions were aggregated and used to determine the acceptableranges of size for each model.
We also manually collected ground truth absolute sizes for a totalof 100 models, of which 33 are in this evaluation set. We do thisby matching the 3D models to physical objects described in on-line product catalogues, or other known standardized sizes (such asDVDs, batteries and soda cans). We use the 33 models in the evalu-ation set for comparing human judgments against ground truth, andthe remaining 67 as known size reference models for our algorithm.We provide both the human judgments for our evaluation set and theground truth annotations as part of our supplemental materials.
Figure 10 shows the human judgments along with ground truth sizesand algorithmic predictions. We observe that human size judgmentsexhibit significant variation. The standard deviation compared tothe ground truth data was 0.267m. We normalize standard devi-ation against mean size for each model to get a relative standarddeviation of 20%. This implies that human judgment exhibits 20%relative error with respect to a given absolute size. This result con-firms previous research that shows human size judgments have sig-nificant variation, and can be influenced by context and familiar-ity [Fredebon 1992]. Results in the following section show that ouralgorithm can be more accurate than human size judgment.
Predictor Human InchU InchP SS CP Combo ComboWN
RMSE 0.241 274.0 170.0 0.126 0.257 0.167 0.284sized 33 33 33 22 9 33 32
Table 1: Root-mean-square error in meters against ground truthobject sizes for: mean human judgments, naıve guessing of inchscales on unperturbed and perturbed model evaluation sets, andthe predictions from each of our methods. The sized row gives thenumber of models for which the method had a prediction.
6.2 Comparing Humans and Algorithms
We evaluate our algorithmic size predictions against those collectedfrom people. Since we do not assume a known distribution ofscales, we randomly perturb the original model scales in order toavoid bias in the evaluation set models.
Using our 33 model ground truth set as the baseline, we compare theerror of different prediction methods for object scales. Table 1 re-ports the root-mean-square error (RMSE) in meters across all mod-els for which each method can predict sizes. For brevity, we referto our algorithmic methods as follows: SS for scene scales, CPfor category size priors, Combo for combined with manual cate-gorization and ComboWN for combined with WordNet categoriza-tion. To compare with the accuracy of human judgment, we usethe mean human-estimated model size for each object. We alsocompare against a default inch scale on the original (InchU), andperturbed 3D models (InchP).
From Table 1 we observe that using scene scales (SS) has the leasterror with respect to ground truth. While not as accurate as SS, us-ing mean category size (CP) has comparable error to human judg-ment. By combining scene scales and categories, Combo can pre-dict sizes for more models but has a higher error than SS. Over-all, Combo predicts ground truth sizes better than the mean humanjudgment. This is also reflected in Figure 10: some algorithmicpredictions are closer to the ground truth than the human mean. Forexample, see (a) in the figure, where a pencil model was judged tobe much larger than ground truth and our algorithmic prediction.Using a naıve approach of guessing inches, the resulting RMSE forboth perturbed and original model scales is much higher than anyother approach, indicating the limitations of guessing a single scale.
We now compare our algorithmic predictions directly against hu-man judgments. We count an automatically predicted size as correctwith respect to human judgment if it is within 2 standard deviationsof the mean size provided by people. Assuming human judgmentis normally distributed around a correct size, this corresponds tothe predicted size being statistically indistinguishable from humanjudgment at a 95% confidence level. Figure 11b summarizes theperformance of our algorithm on the evaluation set. Each method isevaluated on the subset of models for which it can be applied (eval-uation subset accuracy), as well as the entire evaluation set (eval-uation set accuracy). The former gives us a sense of how well themethod performs on models it can cover while the latter gives anindication of the overall performance of the method taking its cov-erage into account. Taking the evaluation subset accuracies, we canpredict how well our algorithm will do on our entire model datasetbased on the coverage of each method as shown in Figure 11c.
Overall, we note that using scene scales (SS) gives the best evalua-tion subset accuracy (88%), with other methods not far behind. Thehigh evaluation subset accuracy for all methods indicates that any ofthese methods can achieve good results against human judgment forthe models they can cover. However, despite SS’s high evaluationsubset accuracy, it actually has the worst projected model datasetaccuracy (6%) due to its limited coverage (6%). In contrast, usingcategory size priors (CP) gives much higher coverage (52%) and
thus better overall accuracy (42%) despite lower evaluation subsetaccuracy. By combining the two in Combo we increase the cover-age significantly (72%) and obtain higher overall accuracy (58%),showing that we can effectively propagate size information usingboth scenes and categories.
An important factor in performance is categorization. WhileComboWN has slightly lower evaluation set accuracy than Combo,it improves overall coverage (84%) and accuracy (60%) by auto-matically categorizing models. The coverage of ComboWN is notconfined by missing category labels and extends into previously un-categorized models (gray area).
6.3 Impact of Reference Models, Scenes, Size Priors
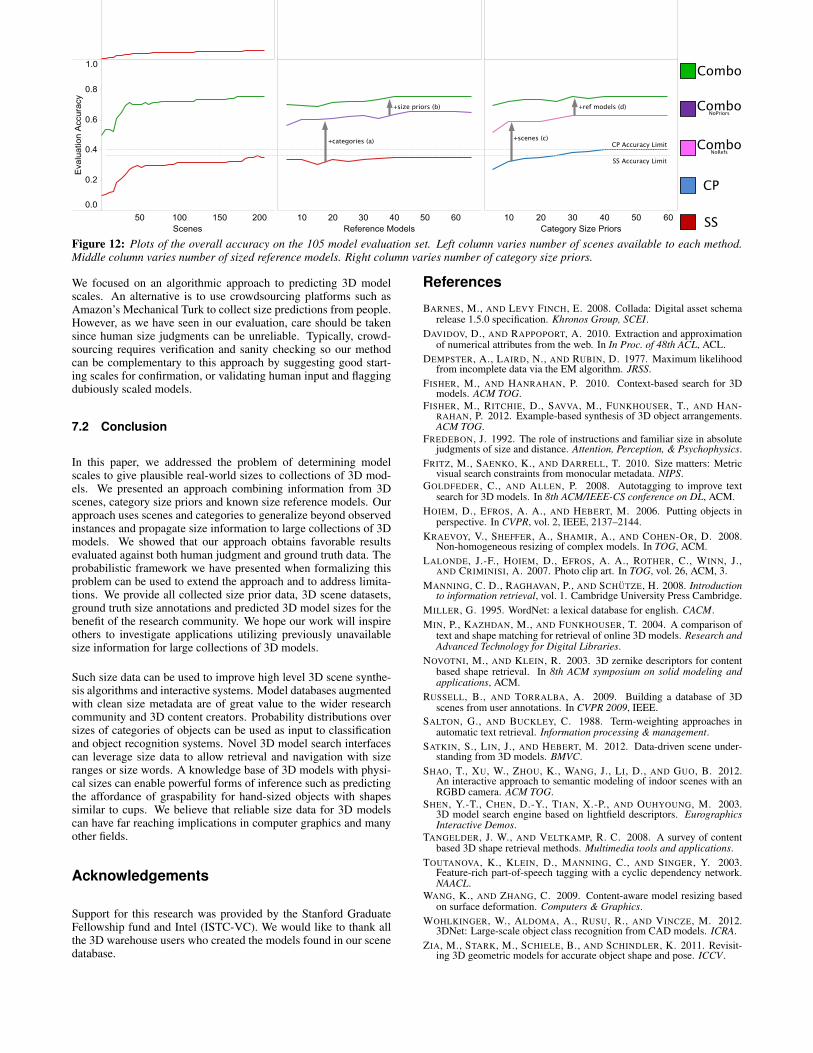
We analyze the impact of varying the number of available 3Dscenes, the number of sized reference models and the number ofcategory size priors. This gives us a sense of how the performanceof our approach changes under situations with different amounts ofinput data. Analyzing the behavior of our algorithms under suchvariation is important because the availability of each informationsource varies across different datasets.
We test how the coverage over a combined (3DW+AR3D) 42327model dataset and the overall accuracy on the 105 model evaluationset change as we increase each resource. In each case, we selectthe most informative resource first. For scenes, we select the oneswith most model instances first. The intuition is that scenes withthe most models give us the highest number of model observations.For reference models, we select models in descending order of thenumber of observations in different scenes. Lastly, for category sizepriors, we select the ones with largest model dataset coverage first.
Figure 12 plots the accuracy on the 105 model evaluation set acrossthese dimensions of variation—coverage is not shown as it largely
0% 20% 40% 60% 80% 100%SSCPComboComboWN
Evaluation Subset Accuracy
(a) Evaluation subset accuracy, defined as percentage of correct models for subset ofmodels to which method is applicable.
0% 20% 40% 60% 80% 100%SSCPComboComboWN
Evaluation Set Accuracy and Coverage
(b) Overall accuracy (inside bar) and coverage (outside bar) on the evaluation set.
0% 20% 40% 60% 80% 100%SSCPComboComboWN
Model DB Predicted Accuracy and Coverage
(c) Predicted accuracy and actual coverage over combined dataset (3DW+AR3D).Predicted accuracy is extrapolated from partial accuracy and coverage.
Figure 11: Performance of our methods on the 105 model evalua-tion set and the combined dataset (3DW+AR3D). Gray representsmodels with neither manual categories nor observations in scenes.
follows the same trend. Based on our experiments, coverage and ac-curacy on the evaluation set is primarily determined by the numberof scenes and the categorization scheme. With more scenes both thecoverage and accuracy increase. In contrast, increasing the numberof reference models or the number of category size priors does notimpact coverage or accuracy significantly.
We now separate out the contribution of each component of theCombo method. From the middle column of Figure 12, we see thebenefit of just adding category label information to SS. We intro-duce a variant of Combo that does not have access to category sizepriors (ComboNoPriors). However, ComboNoPriors does take advan-tage of category labels and is able to propagate size informationfrom scenes into a larger set of models with matching categories,achieving higher accuracy—see (a). There is an additional gain inaccuracy from adding the category size priors—see (b)—which ispurely due to more accurate seed information.
To study the impact of reference models, we use a variant of Combowhich has no reference models: ComboNoRefs. Just by addingscenes without any reference models, we surpass the performanceof CP substantially—see (c). Again, the contribution of the refer-ence models—see (d)—is due to more accurate seed information.
6.4 Summary of Results
We observed that 3D scenes are a good source of size informationand, along with known size reference models, result in the mostaccurate size predictions. An approach using them is ideal whenavailable scenes cover a large proportion of a model dataset. How-ever, the number of scenes is typically small compared to models sothe coverage of this approach is limited. Using categories we canpropagate size information to a much larger set of models and gen-eralize observations from scenes. However, relying on categoriesalone results in less accurate predictions.
We showed that by combining categories and scenes we obtain highmodel dataset coverage (72% of 42327 models) and size predictionaccuracy (80%), as well as prediction error lower than human judg-ment. Furthermore, we showed that we can bypass manual catego-rization via an automatic categorization scheme that improves cov-erage to 84% (ComboWN). In this way, we address the open-worldproblem of continuously expanding model datasets with unknownor untrustworthy object categories and size information.
7 Discussion and Conclusion
7.1 Limitations and Extensions
Our approach has several limitations that suggest avenues for fu-ture work. Firstly, we explored only unimodal Gaussian priors forcategory sizes. To handle categories with latent subcategory struc-ture, we might use Gaussian mixtures as priors for category sizes.This would for example handle bookcases with varying numbers ofshelves. Furthermore, for models that can be interpreted as physi-cal objects of different sizes (such as toy airplanes vs real airplanes)we might incorporate the context of the model instance to informsampling of the size prior. This can be used to facilitate scene cre-ation by automatically suggesting appropriate sizes, depending onthe context. If we place an airplane model inside a hangar, it shouldbe much larger than when placed upon a desk.
Another avenue for future work is to use external knowledge for amore informed prior on the expected model scales. This can takethe form of a mixture of Gaussians on scales, corresponding to stan-dard units such as inches, centimeters, millimeters and meters.
CP Accuracy Limit
SS Accuracy Limit
Combo
SS
CP
+size priors (b)
+categories (a) +scenes (c)
+ref models (d) ComboNoPriors
ComboNoRefs
Figure 12: Plots of the overall accuracy on the 105 model evaluation set. Left column varies number of scenes available to each method.Middle column varies number of sized reference models. Right column varies number of category size priors.
We focused on an algorithmic approach to predicting 3D modelscales. An alternative is to use crowdsourcing platforms such asAmazon’s Mechanical Turk to collect size predictions from people.However, as we have seen in our evaluation, care should be takensince human size judgments can be unreliable. Typically, crowd-sourcing requires verification and sanity checking so our methodcan be complementary to this approach by suggesting good start-ing scales for confirmation, or validating human input and flaggingdubiously scaled models.
7.2 Conclusion
In this paper, we addressed the problem of determining modelscales to give plausible real-world sizes to collections of 3D mod-els. We presented an approach combining information from 3Dscenes, category size priors and known size reference models. Ourapproach uses scenes and categories to generalize beyond observedinstances and propagate size information to large collections of 3Dmodels. We showed that our approach obtains favorable resultsevaluated against both human judgment and ground truth data. Theprobabilistic framework we have presented when formalizing thisproblem can be used to extend the approach and to address limita-tions. We provide all collected size prior data, 3D scene datasets,ground truth size annotations and predicted 3D model sizes for thebenefit of the research community. We hope our work will inspireothers to investigate applications utilizing previously unavailablesize information for large collections of 3D models.
Such size data can be used to improve high level 3D scene synthe-sis algorithms and interactive systems. Model databases augmentedwith clean size metadata are of great value to the wider researchcommunity and 3D content creators. Probability distributions oversizes of categories of objects can be used as input to classificationand object recognition systems. Novel 3D model search interfacescan leverage size data to allow retrieval and navigation with sizeranges or size words. A knowledge base of 3D models with physi-cal sizes can enable powerful forms of inference such as predictingthe affordance of graspability for hand-sized objects with shapessimilar to cups. We believe that reliable size data for 3D modelscan have far reaching implications in computer graphics and manyother fields.
Acknowledgements
Support for this research was provided by the Stanford GraduateFellowship fund and Intel (ISTC-VC). We would like to thank allthe 3D warehouse users who created the models found in our scenedatabase.
References
BARNES, M., AND LEVY FINCH, E. 2008. Collada: Digital asset schemarelease 1.5.0 specification. Khronos Group, SCEI.
DAVIDOV, D., AND RAPPOPORT, A. 2010. Extraction and approximationof numerical attributes from the web. In In Proc. of 48th ACL, ACL.
DEMPSTER, A., LAIRD, N., AND RUBIN, D. 1977. Maximum likelihoodfrom incomplete data via the EM algorithm. JRSS.
FISHER, M., AND HANRAHAN, P. 2010. Context-based search for 3Dmodels. ACM TOG.
FISHER, M., RITCHIE, D., SAVVA, M., FUNKHOUSER, T., AND HAN-RAHAN, P. 2012. Example-based synthesis of 3D object arrangements.ACM TOG.
FREDEBON, J. 1992. The role of instructions and familiar size in absolutejudgments of size and distance. Attention, Perception, & Psychophysics.
FRITZ, M., SAENKO, K., AND DARRELL, T. 2010. Size matters: Metricvisual search constraints from monocular metadata. NIPS.
GOLDFEDER, C., AND ALLEN, P. 2008. Autotagging to improve textsearch for 3D models. In 8th ACM/IEEE-CS conference on DL, ACM.
HOIEM, D., EFROS, A. A., AND HEBERT, M. 2006. Putting objects inperspective. In CVPR, vol. 2, IEEE, 2137–2144.
KRAEVOY, V., SHEFFER, A., SHAMIR, A., AND COHEN-OR, D. 2008.Non-homogeneous resizing of complex models. In TOG, ACM.
LALONDE, J.-F., HOIEM, D., EFROS, A. A., ROTHER, C., WINN, J.,AND CRIMINISI, A. 2007. Photo clip art. In TOG, vol. 26, ACM, 3.
MANNING, C. D., RAGHAVAN, P., AND SCHUTZE, H. 2008. Introductionto information retrieval, vol. 1. Cambridge University Press Cambridge.
MILLER, G. 1995. WordNet: a lexical database for english. CACM.MIN, P., KAZHDAN, M., AND FUNKHOUSER, T. 2004. A comparison of
text and shape matching for retrieval of online 3D models. Research andAdvanced Technology for Digital Libraries.
NOVOTNI, M., AND KLEIN, R. 2003. 3D zernike descriptors for contentbased shape retrieval. In 8th ACM symposium on solid modeling andapplications, ACM.
RUSSELL, B., AND TORRALBA, A. 2009. Building a database of 3Dscenes from user annotations. In CVPR 2009, IEEE.
SALTON, G., AND BUCKLEY, C. 1988. Term-weighting approaches inautomatic text retrieval. Information processing & management.
SATKIN, S., LIN, J., AND HEBERT, M. 2012. Data-driven scene under-standing from 3D models. BMVC.
SHAO, T., XU, W., ZHOU, K., WANG, J., LI, D., AND GUO, B. 2012.An interactive approach to semantic modeling of indoor scenes with anRGBD camera. ACM TOG.
SHEN, Y.-T., CHEN, D.-Y., TIAN, X.-P., AND OUHYOUNG, M. 2003.3D model search engine based on lightfield descriptors. EurographicsInteractive Demos.
TANGELDER, J. W., AND VELTKAMP, R. C. 2008. A survey of contentbased 3D shape retrieval methods. Multimedia tools and applications.
TOUTANOVA, K., KLEIN, D., MANNING, C., AND SINGER, Y. 2003.Feature-rich part-of-speech tagging with a cyclic dependency network.NAACL.
WANG, K., AND ZHANG, C. 2009. Content-aware model resizing basedon surface deformation. Computers & Graphics.
WOHLKINGER, W., ALDOMA, A., RUSU, R., AND VINCZE, M. 2012.3DNet: Large-scale object class recognition from CAD models. ICRA.
ZIA, M., STARK, M., SCHIELE, B., AND SCHINDLER, K. 2011. Revisit-ing 3D geometric models for accurate object shape and pose. ICCV .