Embed Size (px)
Citation preview
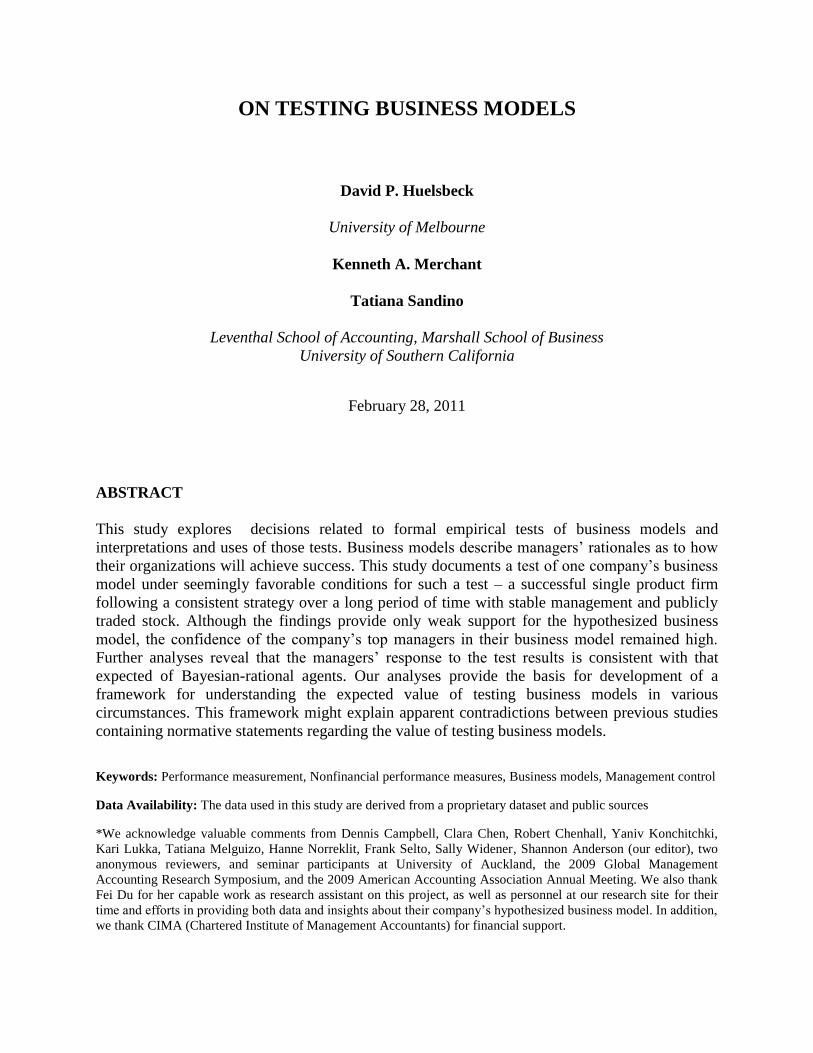
ON TESTING BUSINESS MODELS
David P. Huelsbeck
University of Melbourne
Kenneth A. Merchant
Tatiana Sandino
Leventhal School of Accounting, Marshall School of Business
University of Southern California
February 28, 2011
ABSTRACT
This study explores decisions related to formal empirical tests of business models and
interpretations and uses of those tests. Business models describe managers‘ rationales as to how
their organizations will achieve success. This study documents a test of one company‘s business
model under seemingly favorable conditions for such a test – a successful single product firm
following a consistent strategy over a long period of time with stable management and publicly
traded stock. Although the findings provide only weak support for the hypothesized business
model, the confidence of the company‘s top managers in their business model remained high.
Further analyses reveal that the managers‘ response to the test results is consistent with that
expected of Bayesian-rational agents. Our analyses provide the basis for development of a
framework for understanding the expected value of testing business models in various
circumstances. This framework might explain apparent contradictions between previous studies
containing normative statements regarding the value of testing business models.
Keywords: Performance measurement, Nonfinancial performance measures, Business models, Management control
Data Availability: The data used in this study are derived from a proprietary dataset and public sources
*We acknowledge valuable comments from Dennis Campbell, Clara Chen, Robert Chenhall, Yaniv Konchitchki,
Kari Lukka, Tatiana Melguizo, Hanne Norreklit, Frank Selto, Sally Widener, Shannon Anderson (our editor), two
anonymous reviewers, and seminar participants at University of Auckland, the 2009 Global Management
Accounting Research Symposium, and the 2009 American Accounting Association Annual Meeting. We also thank
Fei Du for her capable work as research assistant on this project, as well as personnel at our research site for their
time and efforts in providing both data and insights about their company‘s hypothesized business model. In addition,
we thank CIMA (Chartered Institute of Management Accountants) for financial support.
1
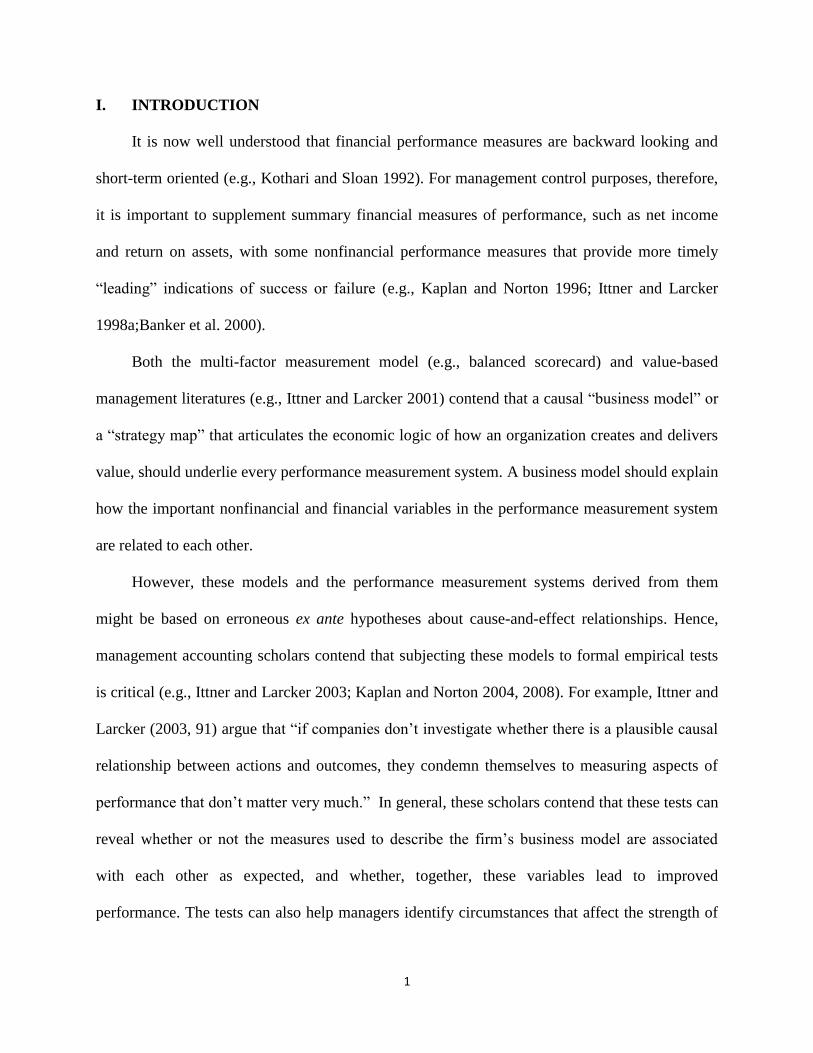
I. INTRODUCTION
It is now well understood that financial performance measures are backward looking and
short-term oriented (e.g., Kothari and Sloan 1992). For management control purposes, therefore,
it is important to supplement summary financial measures of performance, such as net income
and return on assets, with some nonfinancial performance measures that provide more timely
―leading‖ indications of success or failure (e.g., Kaplan and Norton 1996; Ittner and Larcker
1998a;Banker et al. 2000).
Both the multi-factor measurement model (e.g., balanced scorecard) and value-based
management literatures (e.g., Ittner and Larcker 2001) contend that a causal ―business model‖ or
a ―strategy map‖ that articulates the economic logic of how an organization creates and delivers
value, should underlie every performance measurement system. A business model should explain
how the important nonfinancial and financial variables in the performance measurement system
are related to each other.
However, these models and the performance measurement systems derived from them
might be based on erroneous ex ante hypotheses about cause-and-effect relationships. Hence,
management accounting scholars contend that subjecting these models to formal empirical tests
is critical (e.g., Ittner and Larcker 2003; Kaplan and Norton 2004, 2008). For example, Ittner and
Larcker (2003, 91) argue that ―if companies don‘t investigate whether there is a plausible causal
relationship between actions and outcomes, they condemn themselves to measuring aspects of
performance that don‘t matter very much.‖ In general, these scholars contend that these tests can
reveal whether or not the measures used to describe the firm‘s business model are associated
with each other as expected, and whether, together, these variables lead to improved
performance. The tests can also help managers identify circumstances that affect the strength of
2
the relations among the measures (Dikolli and Sedatole 2007; Campbell et al. 2008). Based on a
survey of 157 firms across different industries, Ittner and Larcker (2003) suggest that firms that
consistently build and verify causal models have higher ROA than other firms.
Although the arguments for testing business models seem to be compelling, the causal
assumptions embedded in companies‘ business models are almost never subjected to formal
empirical tests (Nørreklit 2000, 2003; Ittner and Larcker 2003). Ittner and Larcker (2003)
suggest that managers fail to do the needed testing because of laziness, thoughtlessness, and/or
mendacity. Regarding this last idea, they assert, ―Self-serving managers are able to choose—and
manipulate—measures solely for the purpose of making themselves look good and earning nice
bonuses‖ (2003, 89)
Conversely, we argue that there are rational and benign reasons for not subjecting business
models to formal empirical testing. The insights we present emerge both from a critical review of
the literature and our own experiences at a research site that provided us with a seemingly ―clean
setting‖ to conduct tests of the causal relationships underlying the business model of a company
with a single operating unit. Our site, which we will refer to as Medical Test Inc. (MTI), is a
publicly–traded, medium-sized medical test equipment manufacturer that develops, manufactures
and markets test systems used by hospital and medical laboratories throughout most of the world.
The company operates in a single line of business and has only one business model. Thus, the
overall corporate performance measures are not distorted by shifts in cross-business sales mix.
The company‘s top management has followed the same business model with considerable
success for more than a decade. During the 12 years that MTI operated under this model,
revenues grew at an annualized rate of 29% and annualized shareholder returns exceeded 40%.
3
We test the business model described by MTI‘s executives using proprietary data
monitored on a quarterly basis by the company‘s board of directors and top management over an
eight-and-a-half-year period (first quarter of 1998-second quarter of 2006) and publicly available
data from Compustat and CRSP. We use linear regressions to test whether the elements of the
business model are, individually and collectively, leading indicators of both financial
performance and shareholder returns. Additionally, we examine whether the structural path
described in the business model is supported by the data. Despite the seemingly favorable
conditions to test the business model and MTI‘s unequivocally successful track record, our
results provide only weak support for the business model.
We presented our findings to management both as a check as to whether we had tested the
model as they intended and to get their reactions to the results. The managers confirmed that we
tested the model that they had described to us earlier. Interestingly, they were neither surprised
nor disturbed by the general lack of validation of their company‘s business model. Furthermore,
they remained confident that their business model was correct.
The managers‘ lack of concern for our results could reflect their own biases. However, our
further explorations reveal that their reactions seem to be consistent with those of Bayesian-
rational agents, for two reasons. First, the managers‘ confidence in their business model was
built on more than a decade of experience with its implementation, with considerable success.
Second, the statistical tests are not powerful enough to provide conclusive evidence that the
business model is not valid. The fact that the managers at MTI seek to implement rather than to
test the business model leads them to take actions designed to keep the performance drivers at
what they believe to be ―optimal levels.‖ These actions lead to a decrease in measurement
variation and, consequently, to a decrease in the overall power of the analyses used to test the
4
relationships embedded in the business model. Oftentimes, it also leads to taking corrective
actions that are not reflected in the data. For these reasons, the managers were not surprised that
the analyses of these data do not support their company‘s business model with statistical
significance.
Over the course of our study, we learned lessons suggesting both how managers assess the
value of testing their companies‘ business models and why so many managers do not conduct
these tests. We propose that the expected value of testing a company‘s business model decreases
with the managers‘ prior confidence in the model. If the managers assign a high probability to
the premise that the business model is valid, then the expected benefits of the test decrease
because managers will probably not expect results that would contradict the assumptions of the
business model already in place. On the other hand, the expected costs of the test increase with
the managers‘ confidence in the model because the managers should demand very powerful tests
in order to take seriously any potential result that would not support their company‘s business
model.1 To increase the power of the statistical tests, the managers would need to induce, rather
than dampen, variation in their actions. These variations would be perceived to be costly since
they would require that the managers depart from pursuing what they consider to be ―optimal
levels‖ according to their business model. We propose that the managers‘ expected value of
testing the business model will also depend on the data readily available from the firm‘s
performance measurement system, the opportunity costs of implementing the business model,
and the direct costs of conducting the empirical tests.
1 For example, despite our extraordinary access to data—the longitudinal data used by top management and the
board over more than eight years—a power analysis suggests that our statistical tests lacked enough power to
effectively validate all the relationships tested or, from a Bayesian perspective, to influence the managers‘ beliefs. If
the managers had been interested in testing MTI‘s business model they would have needed to take actions to
increase the power of the tests, such as increasing the volume of data compiled, refining the definition of the
performance measures to increase the effects of the drivers of performance on financial performance, etc.
5
Our study contributes to the literature in management accounting suggesting that firms‘
business models be statistically validated to ensure the company is not following a performance
measurement system based on erroneous causal assumptions. Many of the scholars following
this literature describe managers‘ decisions to pursue business models that are not statistically
verified as ―behavioral anomalies.‖ We suggest instead that such behavior can be rational. We
explain that rationality using a Bayesian framework that helps us to understand how managers
should approach decisions about whether to test or not test their business models.
Our study highlights the importance of managers‘ prior beliefs and cost-benefit analyses on
their assessments of the value of testing business models. This view suggests that testing a
company‘s business model should not be expected to be equally useful for all firms and can help
bridge the divide between advocates and skeptics of statistically validating business models. For
example, testing business models can lead to relatively valuable insights in firms where the
managers‘ priors about the business model are weak and the confidence level and power of the
statistical tests are higher (e.g., the firms analyzed by Rucci et al. (1998), Campbell (2008), and
Campbell et al. (2008)). The insights are less useful in firms where the managers assume the
business model is correct and/or where the confidence level and power of the tests are lower
(e.g., as in the firm analyzed by Malina et al. (2007) and MTI, the firm we study).
We discuss both the research and managerial implications of these findings and propose
ways to identify and, whenever possible, overcome the costs of testing business models. Section
II reviews the relevant literature. Section III describes our tests of MTI‘s business model. Section
IV presents insights on how managers update their beliefs in response to testing their company‘s
business model and proposes a simplified cost-benefit analysis that can be used to assess the
value of testing business models from a manager‘s perspective. Section V concludes.
6
II. LITERATURE REVIEW
Managers have long included nonfinancial measures in management-by-objectives (MBO),
key performance indicators (KPI) or critical success factors (CSF) systems, some of which have
come to be known as ―dashboards‖ (e.g., Eckerson 2006).2 Although the terminology is
relatively recent, many of these nonfinancial measures are monitored as ―performance drivers‖—
i.e., metrics providing leading indications of future performance. Researchers have tested
relationships between some of these nonfinancial performance measures and future financial
performance and/or contemporaneous value creation.3 The vast majority of studies testing the
relationship between nonfinancial measures and future financial performance focus on just a
single performance driver. For example, generally positive relationships of these types have been
found for customer satisfaction (e.g., Anderson et al. 1994; Ittner and Larcker 1998b); employee
satisfaction (e.g., Banker and Mashruwala 2007; Chen et al. 2008); quality (e.g., Roth and
Jackson 1995; Sedatole 2003); and operational efficiency (e.g., Tsikriktsis 2007). Despite their
different focuses, studies in the so-called ―value relevance‖ literature in financial accounting
show that certain nonfinancial performance measures are associated with stock returns.4
2 The term ―nonfinancial measures‖ is typically defined broadly to include all measures other than GAAP summary
measures (i.e., accounting profits and returns). Other measures denominated in monetary terms, such as individual
income statement elements (e.g., revenues, gross margins, R&D expenditures) and ratios (e.g., revenue per
employee) are included under the nonfinancial rubric. 3 Contemporaneous value creation is commonly measured using stock market returns. It has been shown that stock
prices lead financial performance (Kothari and Sloan 1992) since they incorporate expectations of future cash flows
on a timely basis. 4 Studies in this literature tend to choose industries where accounting measures are least likely to be value-relevant.
They find that accounting profits and returns are generally not significantly related with stock price movements, but
they do find that various nonfinancial measures are relevant in explaining stock prices and returns. For example,
Amir and Lev‘s (1996) study of firms in the cellular telephone industry finds that population size in the provider’s
service area and market penetration are both value relevant. Hirschey et al. (2001) show that R&D expenditures and
the patents derived from them can explain stock returns. Similarly, patent citations by high-tech firms (Deng et al.
1999), and book-to-bill ratios of firms in the semiconductor industry (Chandra et al. 1999) are both found to be
value relevant. Trueman et al. (2000) find that measures of Internet usage (i.e., pageviews and unique visitors)
provide some significant explanations of stock prices.
7
One validity threat in these scope-limited studies is that many individual performance
drivers that are relevant in any given situation are not independent. Their effects can even
interact. For example, in a study of a convenience store chain, Campbell et al. (2008) show that
the success of a new strategy implemented (and subsequently abandoned) by the company
depended on employee skills at the store level, itself a nonfinancial performance indicator.
Without the requisite store-level employee skills, none of the other elements in the business
model can be associated with higher performance.
Numerous academics and consultants have made recommendations to array the measures
into stylized, complex business models that are more complete, yet parsimonious.5 These models
include the performance prism (Neely et al. 2002), the performance pyramid (Cross and Lynch
1988), the balanced scorecard (Kaplan and Norton 1992, 1996), the value chain scoreboard
model (Lev 2001), the customer equity model (Rust et al. 2000), the tableau de bord (Malo 1995;
Epstein and Manzoni 1997), and the European Foundation Quality Model (EFQM 2003). These
business models provide ―stories that explain how enterprises work‖ or ―How do we make
money in this business?‖ (Magretta 2002, 4), and are said to be superior to multi-factor KPI or
dashboard approaches to performance measurement because they are built around a hypothesized
causal structure. This causal structure is essential for tying a strategy to expectations of future
success (Magretta 2002). They describe how all, or at least many, of the elements of performance
fit together, thus providing order to the potentially vast numbers of measures in the organization.
This order allows for a focus on the aspects of performance that are most important, eliminating
others that are either redundant or inconsequential, reducing the cognitive load placed on
decision makers on the firm (Farrell et al. 2007). It also provides the structure for testing the
validity of an enacted strategy.
5 We use the term ―business model‖ to represent all of these stylized combinations of measures.
8
Managers have been criticized for failing to test the validity of the hypothesized causal
links on which models are built (Nørreklit 2000, 2003; Ittner and Larcker 2003). If the individual
measures, or the combination of measures, are not valid, then the measures are just data; they
have no information value. If the hypothesized links in the models are incorrect, these models
can actually mislead managers, causing them to pursue the wrong goals and to make flawed
decisions (Magretta 2002; Kaplan and Norton 2004, 2008).
Testing a company‘s business model not only allows managers to check whether their
overall business model is correct, but also to discover what measures matter, or do not matter,
under what conditions. The managers‘ improved understanding of the company‘s performance
drivers can in turn translate into a more efficient allocation of resources. Using data from a
survey of 157 companies in various industries, Ittner and Larcker (2003, 91) found that firms that
―consistently built and verified causal models‖ on average had 2.95% higher returns on assets
and 5.14% higher returns on equity than firms that did not rely on causal models.
Three longitudinal studies, all of which were conducted in multi-unit organizations,
illustrate useful insights that can be obtained when conducting these tests. First, during a
turnaround situation at Sears in 1994-95, Sears executives hired a consulting firm skilled in
econometrics to help analyze data taken from 800 stores, initially over two quarters (Rucci et al.
1998). The collection of measures provided to the consultants was based on a loose initial model
of firm performance linking employees, customers, and shareholders in a causal chain. The
executives hypothesized that in their retailing environment, employee attitudes affected customer
attitudes and behavior, which in combination affected Sears‘ financial performance. Since the
senior managers were unsure about the business model they should be pursuing, the consultants
used exploratory statistical methods to construct, rather than to test, the explicit causal model.
9
These studies led to identifying the measurement indicators that were driving Sears‘ performance
and that managers then used to successfully implement the company‘s well publicized ―three
C‘s‖ model—aimed at making Sears a ―Compelling Place to Work, a Compelling Place to Shop,
and a Compelling Place to Invest‖ (Rucci et al. 1998, 88-89)
Second, the executives of TD Canada Trust, a new bank resulting from the merger of
Canada Trust and Toronto-Dominion Bank, hired a consulting firm to identify the service
behaviors measured by the bank that were most likely to drive customer satisfaction and branch
network profitability (Campbell 2008). Using factor analyses, the consultants identified four
service dimensions and linked them to customer satisfaction and to branch profitability via
regression analyses. They also identified the service dimensions that had the strongest impact on
profitability.
Third, Campbell et al. (2008) conducted field interviews and then analyzed balanced-
scorecard data from a convenience store chain during the implementation of a new store-level
strategy. The new differentiation strategy emphasized theme-oriented promotions fostering
employee interactions with customers, rather than the traditional convenience store qualities of
speed and efficiency. But the researchers found evidence that whenever the new strategy had
been implemented, its effect on financial performance was negative. In further analyses, they
discovered an interaction effect: the new strategy had positive effects on financial performance
only in stores with high levels of crew skills. Without ever doing formal statistical analyses, the
company abandoned the new strategy two years after implementing it. Campbell et al. (2008)
argue that statistical analyses would have enabled earlier detection of the problems.
While the advantages of testing business models seem to be compelling, the causal
assumptions of companies‘ business models are rarely subjected to formal empirical testing
10
(Nørreklit 2000, 2003; Ittner and Larcker 2003). Only 21% of the companies in Ittner and
Larcker‘s (2003) study tested the cause-and-effect relationships in their business models, which
raises the question: Why do so many managers fail to validate their companies‘ business models?
The literature to date provides mostly untested explanatory presumptions, such as those provided
by Ittner and Larcker (2003)—i.e., laziness, thoughtlessness and/or mendacity—as mentioned
above. Some studies, such as Dikolli and Sedatole (2007), enumerate challenges managers can
experience when testing relationships between nonfinancial and financial measures of
performance, but such challenges do not imply that a firm should avoid testing its business
model. Instead they merely suggest that managers should consider different model specifications
and contingencies when testing their models to obtain richer information from the analyses.
To our knowledge, Malina et al. (2007) are the only scholars providing an explanation for
why companies would not test their business models. Malina et al. (2007) tested the cause-and-
effect properties of a ―distributor balanced scorecard‖ used by the North American distribution
channel of a Fortune 500 company. Their tests failed to validate the distribution channel‘s
business model, thereby refuting causality as an explanation for the scorecard‘s apparent success.
Despite these results, both the firm and its distributors continued to express satisfaction with the
scorecard and continued to use it for management control. Malina et al. (2007) address this
seeming paradox with evidence that the ostensibly causal links in their firm‘s distributor
balanced scorecard were not, in fact, causal, and therefore should not have been tested as such.
Further, they suggest that this lack of causality may be a common feature of stylized business
models such as the balanced scorecard.
While prior literature has pointed to some of the challenges researchers can confront when
testing business models or, more generally, conducting statistical analyses in organizations
11
(Dikolli and Sedatole 2007; Malina et al. 2007), we believe it has not yet provided a clear
explanation of why so few companies test their business models and, more generally, how
managers decide whether or not to test their companies‘ business models.
III. TEST OF THE CAUSAL RELATIONS IMPLICIT IN MTI’S BUSINESS MODEL
Our study took advantage of our access to what we believed to be a favorable setting to test
the causal relationships underlying a company‘s business model. MTI seemed to be a favorable
setting for multiple reasons: First, it operates only in a single line of business—production and
sale of equipment used for performing medical diagnostic tests. Thus the corporate performance
measures are not distorted by shifts in cross-business sales mix. Second, the firm had a stable
management team and followed the same business model with considerable success for more
than a decade. And third, MTI is publicly traded, allowing us to test the impact of the firm‘s
drivers of performance not only on accounting outcomes but also on stock returns. Notably, our
research site implemented a unique business model in a single operating unit, a more common
situation than the situation analyzed in previous studies, in which the business model is
implemented across multiple, homogenous business units.
As in most companies, managers at this research site have beliefs and assumptions about
their business model. They base many important business decisions on those beliefs and
assumptions but never test them statistically. In our field interviews, MTI managers explained
that the company follows what is commonly referred to as a ―razor/razor blade‖ strategy. That is,
it sells the test equipment (called ―instruments‖) at a small markup, or even at break-even. It then
makes most of its profits selling the consumable kits (called ―reagents‖) used within the
instruments to perform the tests. Its customers are mostly hospitals and independent laboratories
12
located in over 100 countries around the world. In various geographical regions, MTI sells either
directly to customers using its own sales force or indirectly through distributors.
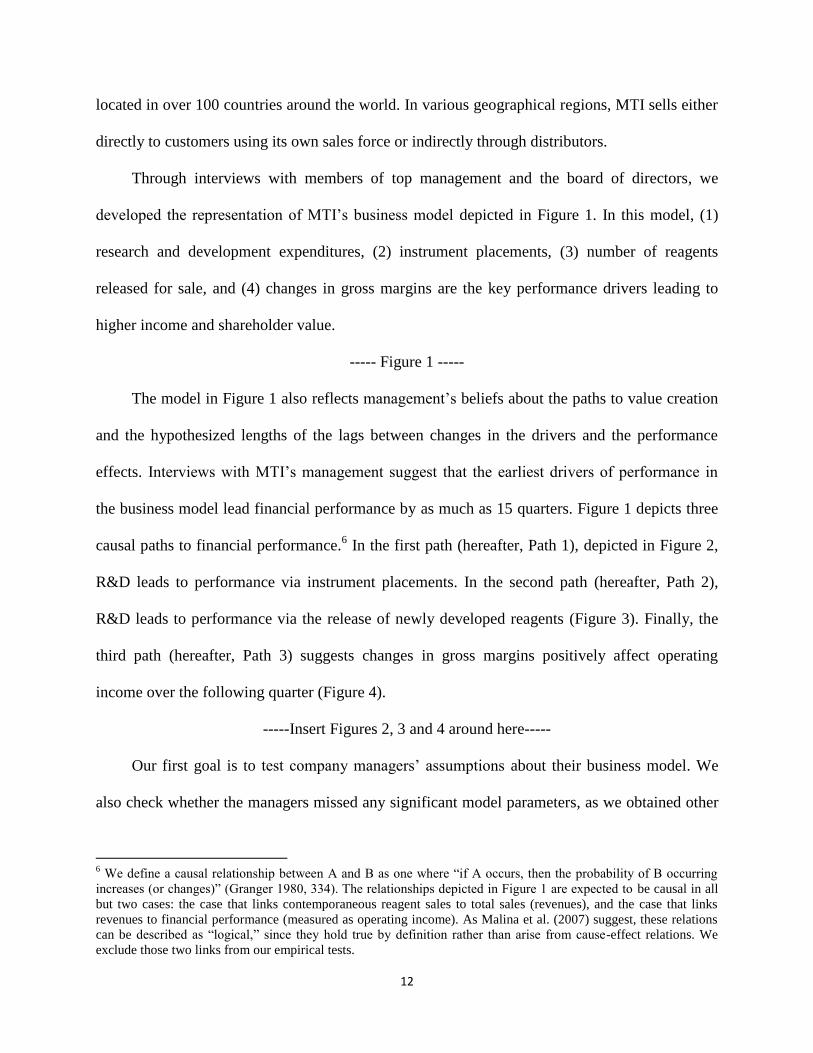
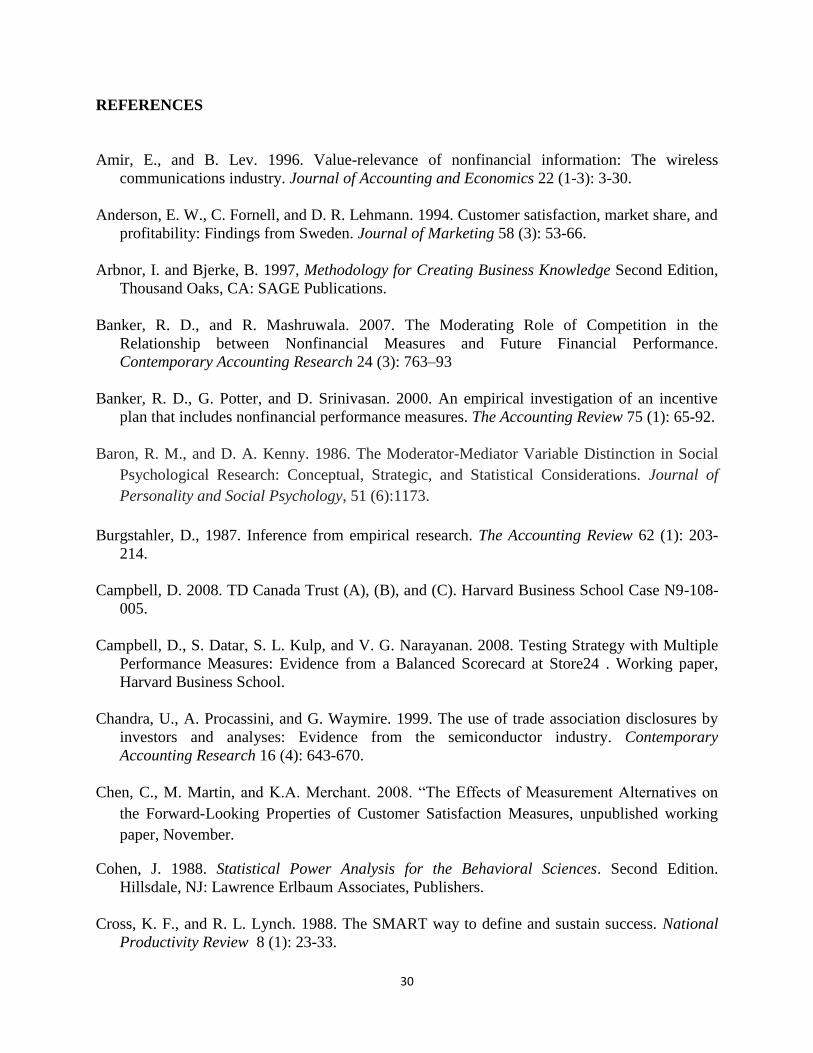
Through interviews with members of top management and the board of directors, we
developed the representation of MTI‘s business model depicted in Figure 1. In this model, (1)
research and development expenditures, (2) instrument placements, (3) number of reagents
released for sale, and (4) changes in gross margins are the key performance drivers leading to
higher income and shareholder value.
----- Figure 1 -----
The model in Figure 1 also reflects management‘s beliefs about the paths to value creation
and the hypothesized lengths of the lags between changes in the drivers and the performance
effects. Interviews with MTI‘s management suggest that the earliest drivers of performance in
the business model lead financial performance by as much as 15 quarters. Figure 1 depicts three
causal paths to financial performance.6 In the first path (hereafter, Path 1), depicted in Figure 2,
R&D leads to performance via instrument placements. In the second path (hereafter, Path 2),
R&D leads to performance via the release of newly developed reagents (Figure 3). Finally, the
third path (hereafter, Path 3) suggests changes in gross margins positively affect operating
income over the following quarter (Figure 4).
-----Insert Figures 2, 3 and 4 around here-----
Our first goal is to test company managers‘ assumptions about their business model. We
also check whether the managers missed any significant model parameters, as we obtained other
6 We define a causal relationship between A and B as one where ―if A occurs, then the probability of B occurring
increases (or changes)‖ (Granger 1980, 334). The relationships depicted in Figure 1 are expected to be causal in all
but two cases: the case that links contemporaneous reagent sales to total sales (revenues), and the case that links
revenues to financial performance (measured as operating income). As Malina et al. (2007) suggest, these relations
can be described as ―logical,‖ since they hold true by definition rather than arise from cause-effect relations. We
exclude those two links from our empirical tests.
13
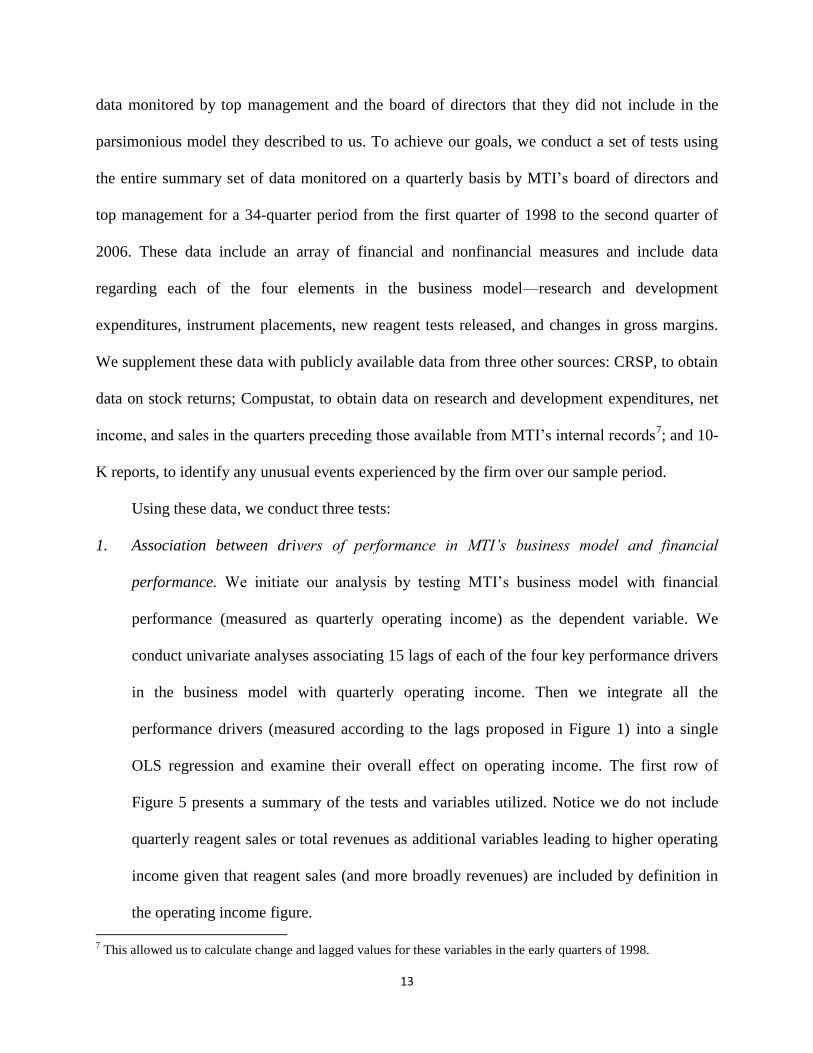
data monitored by top management and the board of directors that they did not include in the
parsimonious model they described to us. To achieve our goals, we conduct a set of tests using
the entire summary set of data monitored on a quarterly basis by MTI‘s board of directors and
top management for a 34-quarter period from the first quarter of 1998 to the second quarter of
2006. These data include an array of financial and nonfinancial measures and include data
regarding each of the four elements in the business model—research and development
expenditures, instrument placements, new reagent tests released, and changes in gross margins.
We supplement these data with publicly available data from three other sources: CRSP, to obtain
data on stock returns; Compustat, to obtain data on research and development expenditures, net
income, and sales in the quarters preceding those available from MTI‘s internal records7; and 10-
K reports, to identify any unusual events experienced by the firm over our sample period.
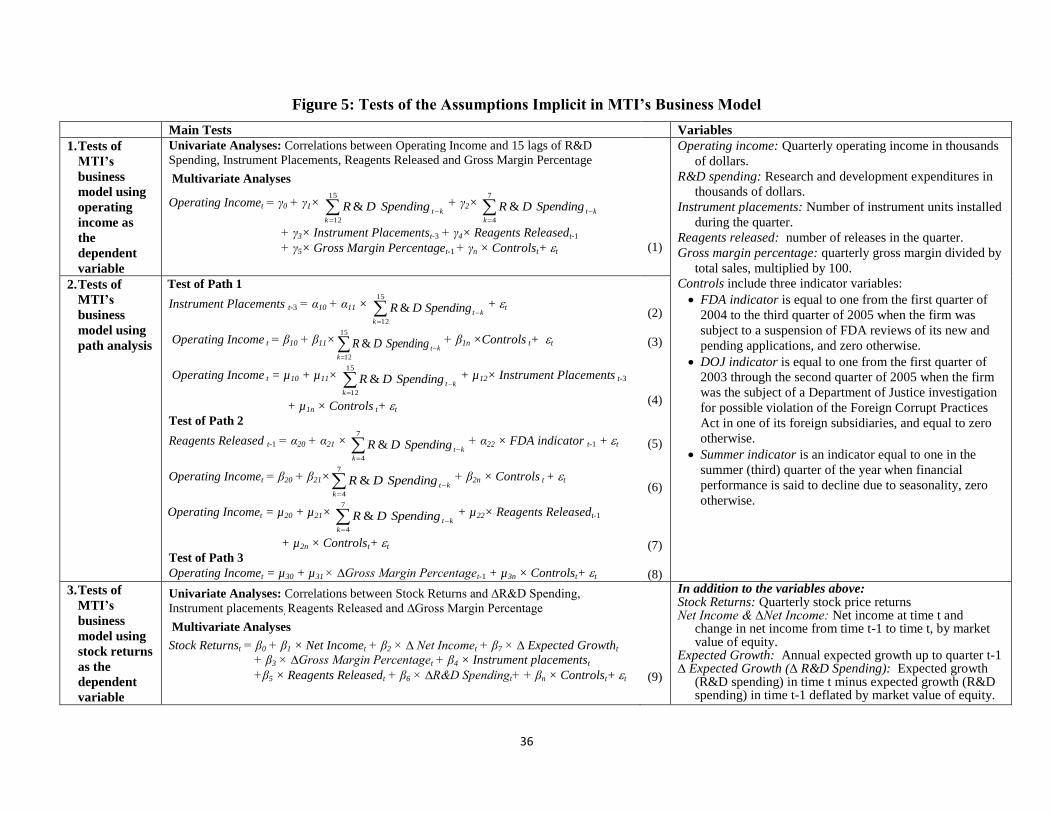
Using these data, we conduct three tests:
1. Association between drivers of performance in MTI’s business model and financial
performance. We initiate our analysis by testing MTI‘s business model with financial
performance (measured as quarterly operating income) as the dependent variable. We
conduct univariate analyses associating 15 lags of each of the four key performance drivers
in the business model with quarterly operating income. Then we integrate all the
performance drivers (measured according to the lags proposed in Figure 1) into a single
OLS regression and examine their overall effect on operating income. The first row of
Figure 5 presents a summary of the tests and variables utilized. Notice we do not include
quarterly reagent sales or total revenues as additional variables leading to higher operating
income given that reagent sales (and more broadly revenues) are included by definition in
the operating income figure.
7 This allowed us to calculate change and lagged values for these variables in the early quarters of 1998.
14
-----Insert Figure 5 around here-----
2. Path analysis of MTI’s business model. Next we examine the validity of each of the three
paths that lead to financial performance (proxied by quarterly operating income) according
to the business model (Figures 2, 3, and 4). The second row of Figure 5 depicts the OLS
regressions used to test the three paths. We used the Baron and Kenny (1986) approach to
test the mediation effects of instrument placements in Path 1 and of reagents released in
Path 2. An examination of the coefficients indicates whether or not mediation effects exist.
For example, assume β11 in Path 1 (see Path 1 in Figures 2 and 5) is positive and
significant. If coefficients α11 and µ12 are positive and significant, but coefficient µ11 is
insignificant, that would mean that the instrument placements metric fully mediates the
relation between R&D spending and operating income. If coefficient µ11 remains
significant, then the instrument placements metric would only be partially mediating the
relation. In this latter case, other aspects of R&D spending would play a role on the extent
to which the measure leads to financial performance.
3. Association between drivers of performance in MTI’s business model and stock returns.
Finally we examine whether changes in each of the four key performance drivers are
associated with stock market returns on a timely basis. To do this we define a baseline
model consistent with Ohlson (1995, 2001) that associates stock returns (i.e., change in
market value of equity) with net income (i.e., change in book value of equity), change in
net income, and changes in expected long term growth (proxied by changes in annual sales
growth up to the previous quarter). We add the leading indicators described in MTI‘s
business model (Figure 1), expressed as changes in earnings components (changes in R&D
expenditures) and increases in book value of equity due to increases in intangible assets
15
(change in gross margin percentage, number of reagents released, number of instrument
placements) to examine whether these changes lead to higher stock market returns. The
equation and variables used are shown in the third row of Figure 5.
Table 1 presents descriptive statistics for our variables. Our summary statistics show that
MTI generated positive operating income every quarter of the period studied. On average, it
generated $16 million in quarterly operating income.8 MTI‘s market performance was also
positive, with an average quarterly stock return of +6%. However, the stock price experienced
significant variation: quarterly stock returns ranged from -22% to +68%. In regards to our main
explanatory variables, research and development expenditures averaged $9 million per quarter,
and gross margins averaged 56% of sales. MTI installed an average of 168 instruments and
released an average of three reagents every quarter. It is important to note that of these four key
performance drivers gross margin percentage exhibits the smallest coefficient of variation (with a
standard deviation of only 1.66%, mean 56.23%), suggesting this driver is likely to explain
relatively less of the variation in firm performance.
-----Insert Table 1 around here-----
Our tests of the business model yielded three empirical results. First, our univariate tests in
Table 2 suggest that lagged values of both R&D Spending and Instrument Placements are
positively associated with operating income at time t, as predicted in Figure 1 (predicted lags are
highlighted in gray in Table 2). However, none of the lagged values of Changes in Gross Margin
Percentage are significantly related to operating income at time t, and lagged values of Reagents
Released are negatively, rather than positively, associated with operating income in quarter t
(though insignificantly). Our multivariate tests presented in Table 3 suggest that together the
leading indicators provide a statistically significant explanation of operating income. As in the
8 Some of these data have been scaled to maintain company confidentiality.
16
univariate analyses, R&D spending and instrument placements are positively and significantly
related to operating income.9 Changes in gross margin percentages also become significant in
this regression, indicating that the failure to find a significant relationship in Table 2 may have
been explained by the omission of the other business model indicators in the correlations.10
Overall, these analyses provide partial but not full support for MTI‘s business model.
----- Insert Tables 2 and 3 around here-----
Our second set of analyses, examining the three paths leading to value creation illustrated
in Figures 2, 3, and 4, and described in the second row of Figure 5, support only one of the three
paths leading to financial performance. Untabulated results show a significant relation between
R&D spending from quarters t-15 to t-12 and instrument placements at time t-3 (Equation 2,
Figure 5), and a significant association between R&D spending from quarters t-15 to t-12 and
operating income in quarter t (Equation 3, Figure 5). The results of Equation 4, Figure 5 further
show that the association between R&D spending and operating income is partially, but not fully,
mediated by instrument placements. While we found evidence consistent with the relations
depicted in Path 1 (Figure 2), we found no evidence supporting Path 2 (there is no association
between the number of reagents released and either R&D spending or future financial
performance) or Path 3 (a change in gross margin percentage at time t-1 is positively but
insignificantly related to operating income at time t). Overall the tests of Paths 1, 2, and 3 fail to
support the structural path depicted in Figure 1.
9 We replicate the model in Table 3 including each of the two variables of R&D Spending separately (i.e. one at a
time) to avoid multicollinearity concerns. Untabulated results are consistent with those reported in Table 3, except
that, when tested individually, both measures of R&D spending (rather than just one) are positively and significantly
associated with operating income at time t. 10
We replicate the model in Table 3 using Newey-West standard errors to correct for serial correlation. In two
alternative tests, we consider lags of up to four and eight quarters in the autocorrelation structure. Results remain
unchanged.
17
Finally, our third set of tests shows that the four key leading indicators in MTI‘s business
model provide only limited information explaining contemporaneous stock performance. Table 4
shows that none of the key leading indicators is correlated with contemporaneous quarterly stock
returns. When the change in R&D spending, instrument placements, reagents released, and
change in the gross margin percentage are included in the model together (see Table 5), the
coefficients for instrument placements and reagents released become statistically significant and
the adjusted R2 increases from 3.88% to 10.20%, yet the F-statistic comparing Model (2) to
Model (1) shows that the increase in the explanatory power is not statistically significant (F
=1.44, p =0.26). Overall, these results provide only weak support for a contemporaneous
association between the firm‘s value drivers and the market value of its equity.
----- Insert Tables 4 and 5 around here-----
We considered other data items included in the company‘s dashboard but not in its business
model as alternative drivers of performance, but none of them was significant, and none changed
the results obtained from testing the business model depicted in Figure 1.11
Our findings are also
robust to alternative specifications, including alternative lag structures and other refinements
suggested by top managers based on preliminary results.12
11
Specifically, we considered a measure capturing the percentage of sales from international operations, a measure
of the degree of integration among divisions (measured as the percentage of sales from intercompany operations),
and a measure capturing the income contribution from affiliates. We selected the lag-lengths of these performance
drivers that best explained operating income. Our analyses suggest that none of these additional variables provides
significant incremental information to explain future operating income or stock returns, relative to the leading
indicators already included in the business model. 12
The results from tests of Paths 1 and 2 using revenue from reagent sales in place of operating income support Path
1 but not Path 2. Likewise, the results of tests using other accumulation periods for lagged R&D spending to
encompass the full range of managers‘ estimates (i.e., in Path 1 we tested R&D Spending over t-23 to t-3 and in Path
2we tested R&D Spending over t-16 to t-5) support Path 1 but not Path 2. At the suggestion of MTI managers, tests
of Path 2 that include an interaction term between reagents released and the cumulative number of reagents released
to-date, to test for non-linearity arising from possible diminishing returns to new reagents, fail to find support for
Path 2. Specifications that include as additional explanatory variables lags of the dependent variable that correspond
in time to the principal independent variables also indicate that both R&D Spending and Instrument Placements are
incrementally informative about future Operating Income, but neither Reagents Released nor Change in Gross
Margin Percentage provide information incremental to their contemporaneous measures of Operating Income.
18
It surprised us that, despite the seemingly favorable conditions to test the business model
and MTI‘s unequivocally successful track record, our results provided only weak support of the
business model. We were also surprised by the fact that while our tests did not provide strong
support for the hypotheses implicit in MTI‘s business model, management continued to express
confidence in the validity of their model. The main insights from this study emerged from our
further explanations of these puzzles, as presented in the following section.
IV. INSIGHTS ON THE VALUE OF TESTING A COMPANY’S BUSINESS MODEL
As mentioned above, most researchers testing companies‘ business models suggest that
statistical validation should be a necessary condition to continue pursuit of a business model
(Ittner and Larcker 2003; Campbell et al. 2008). According to this view, the fact that the
managers would continue to rely on their existing business model despite its lack of statistical
validation might indicate either lack of confidence in the tests or some degree of management
irrationality or opportunism.
In follow-up interviews, the MTI managers claimed that they had no reason to question our
analyses, but they also believed that the data that we utilized were insufficient to be conclusive.
Just because the formal statistical techniques could not validate the model does not necessarily
mean that the model is not valid. During the 12 years that MTI had followed this business model,
sales had grown at an average rate of 29% annually, average annual shareholder returns were
greater than 40%, and the company had expanded its sales to customers based in over 100
countries. This success over an extended period of time provides considerable support for the
model‘s validity.
Similarly, regressions of stock returns on the postulated value-drivers lagged by one quarter to capture market
response to the release of quarterly reports or delayed incorporation of information into prices finds a positive
relationship between returns and instrument placements in the prior quarter but no significant relationship with other
drivers.
19
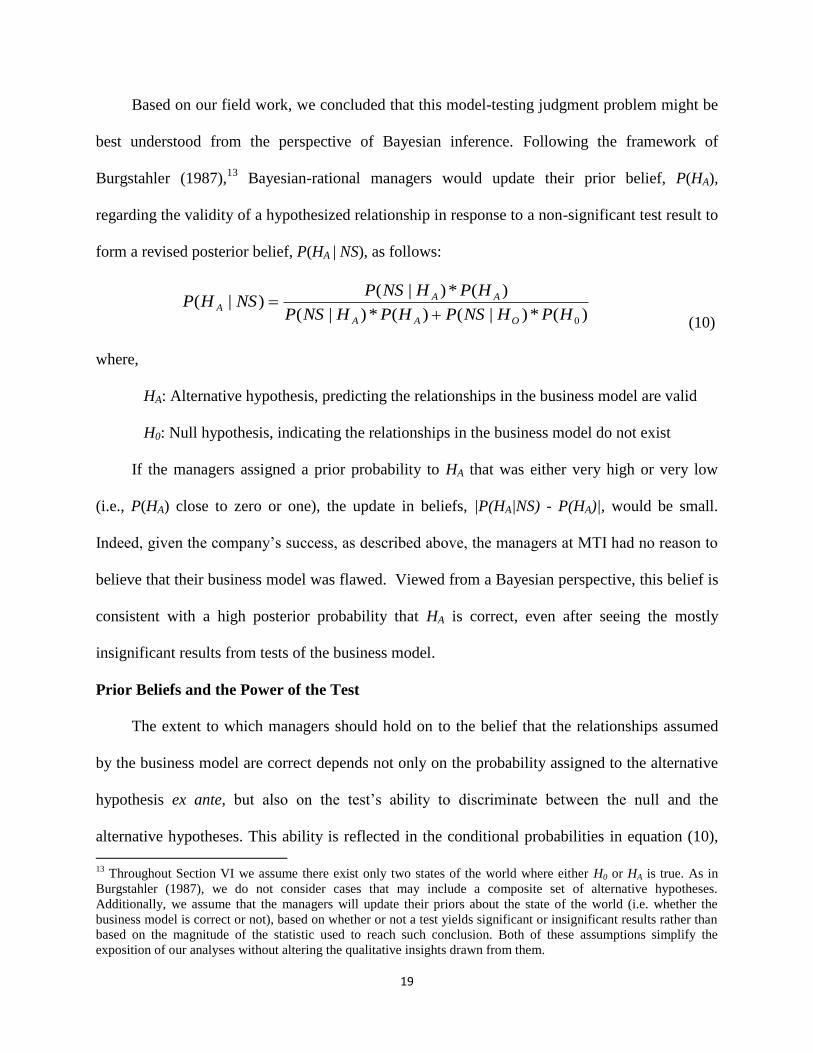
Based on our field work, we concluded that this model-testing judgment problem might be
best understood from the perspective of Bayesian inference. Following the framework of
Burgstahler (1987),13
Bayesian-rational managers would update their prior belief, P(HA),
regarding the validity of a hypothesized relationship in response to a non-significant test result to
form a revised posterior belief, P(HA | NS), as follows:
)(*)|()(*)|(
)(*)|()|(
0HPHNSPHPHNSP
HPHNSPNSHP
OAA
AAA
(10)
where,
HA: Alternative hypothesis, predicting the relationships in the business model are valid
H0: Null hypothesis, indicating the relationships in the business model do not exist
If the managers assigned a prior probability to HA that was either very high or very low
(i.e., P(HA) close to zero or one), the update in beliefs, |P(HA|NS) - P(HA)|, would be small.
Indeed, given the company‘s success, as described above, the managers at MTI had no reason to
believe that their business model was flawed. Viewed from a Bayesian perspective, this belief is
consistent with a high posterior probability that HA is correct, even after seeing the mostly
insignificant results from tests of the business model.
Prior Beliefs and the Power of the Test
The extent to which managers should hold on to the belief that the relationships assumed
by the business model are correct depends not only on the probability assigned to the alternative
hypothesis ex ante, but also on the test‘s ability to discriminate between the null and the
alternative hypotheses. This ability is reflected in the conditional probabilities in equation (10),
13
Throughout Section VI we assume there exist only two states of the world where either H0 or HA is true. As in
Burgstahler (1987), we do not consider cases that may include a composite set of alternative hypotheses.
Additionally, we assume that the managers will update their priors about the state of the world (i.e. whether the
business model is correct or not), based on whether or not a test yields significant or insignificant results rather than
based on the magnitude of the statistic used to reach such conclusion. Both of these assumptions simplify the
exposition of our analyses without altering the qualitative insights drawn from them.
20
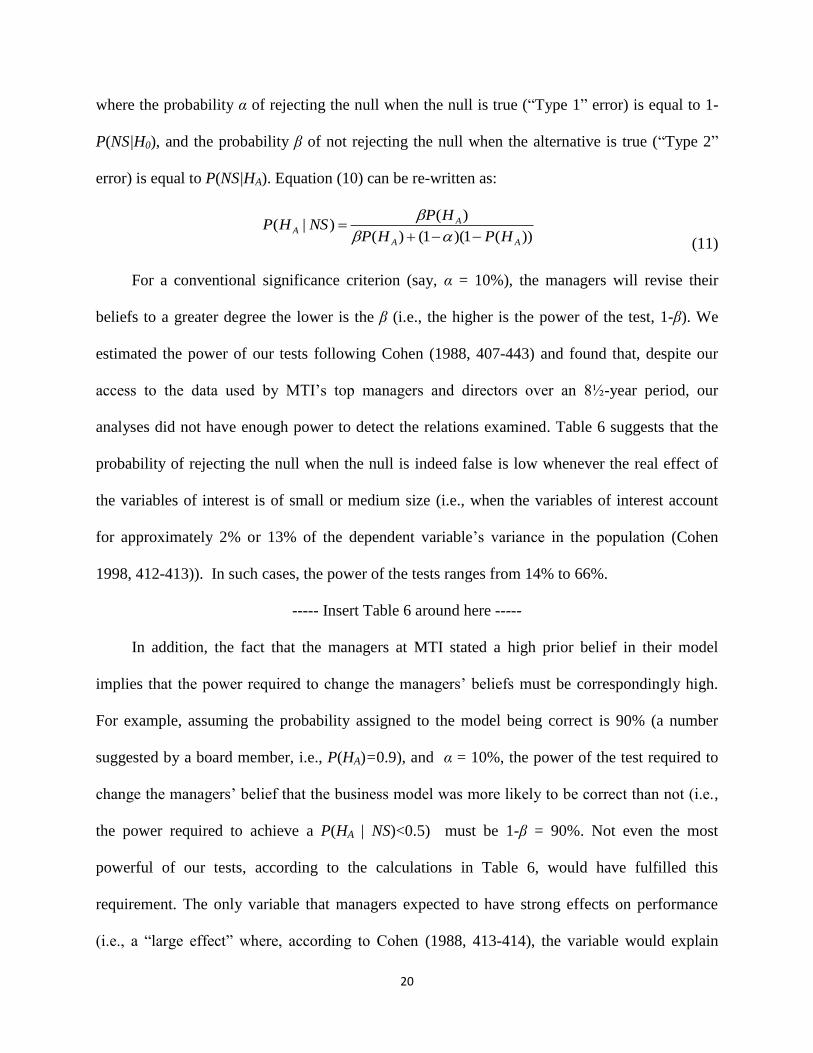
where the probability α of rejecting the null when the null is true (―Type 1‖ error) is equal to 1-
P(NS|H0), and the probability β of not rejecting the null when the alternative is true (―Type 2‖
error) is equal to P(NS|HA). Equation (10) can be re-written as:
))(1)(1()(
)()|(
AA
AA
HPHP
HPNSHP
(11)
For a conventional significance criterion (say, α = 10%), the managers will revise their
beliefs to a greater degree the lower is the β (i.e., the higher is the power of the test, 1-β). We
estimated the power of our tests following Cohen (1988, 407-443) and found that, despite our
access to the data used by MTI‘s top managers and directors over an 8½-year period, our
analyses did not have enough power to detect the relations examined. Table 6 suggests that the
probability of rejecting the null when the null is indeed false is low whenever the real effect of
the variables of interest is of small or medium size (i.e., when the variables of interest account
for approximately 2% or 13% of the dependent variable‘s variance in the population (Cohen
1998, 412-413)). In such cases, the power of the tests ranges from 14% to 66%.
----- Insert Table 6 around here -----
In addition, the fact that the managers at MTI stated a high prior belief in their model
implies that the power required to change the managers‘ beliefs must be correspondingly high.
For example, assuming the probability assigned to the model being correct is 90% (a number
suggested by a board member, i.e., P(HA)=0.9), and α = 10%, the power of the test required to
change the managers‘ belief that the business model was more likely to be correct than not (i.e.,
the power required to achieve a P(HA | NS)<0.5) must be 1-β = 90%. Not even the most
powerful of our tests, according to the calculations in Table 6, would have fulfilled this
requirement. The only variable that managers expected to have strong effects on performance
(i.e., a ―large effect‖ where, according to Cohen (1988, 413-414), the variable would explain
21
about 30% of the dependent variable‘s variance in the population) was instrument placements.
The other drivers were expected to have smaller effects (small or medium size effects) due to
measurement noise or lack of consistency on the extent to which variables such as R&D or
reagent approvals led to performance.
Prior Beliefs and Data Constraints for Testing the Business Model
The managers‘ initial confidence in the business model not only led to an increase in the
required power of the tests, it also led the managers to use their performance measurement
system in ways that were inconsistent with testing the company‘s business model. Instead of
using the model to predict future performance, the managers used the data collected to track how
the leading indicators deviated from the levels they deemed necessary to implement the business
model. The CFO indicated, ―You‘ve got to set the level that you know.‖ Managers explained that
they intervened to ensure that the measures did not vary much from those desired levels. They
described two specific cases:
(a) In some cases, leading indicators measured at a given time t-n were used to provide early
feedback to management, rather than to estimate operating income at time t. Using this
feedback, managers sought to take corrective actions between times t-n and t to achieve a
desired level of operating income. The fact that these actions were not measured or
incorporated in the tests of the business model led to a correlated omitted variable
problem. For example, according to the CFO, the goal was to avoid any drop in gross
margins. This could be done by cutting costs, by pulling low-margin reagents off the
market, or by changing prices. Unless the managers kept track of their corrective actions
and incorporated them into the test of the business model, their ability to learn whether
the leading indicators led to future performance would be impaired.
22
(b) Even if MTI managers did not take corrective actions, they constrained the leading
indicators within certain ranges thought to be optimal according to their business model,
limiting their predictive abilities due to lack of variation. For example, the level of R&D
expenditures was chosen based on estimates of how much investment they could manage
effectively. Typically, this consistently resulted in R&D expenditures in the range of 10
to 12 percent of sales. Had the managers been interested in learning whether or not R&D
led to performance, they would have induced variability rather than stability in this
leading indicator (Dye 2004).
Reflections on the Value of Testing Business Models
While the reasons that prior researchers have given for testing business models have merit,
our analyses suggest that this advice should not apply universally. Not all company and business
unit managers will be or should be willing to test their business models. We suggest that rational
managers will assess the costs and benefits of testing their companies‘ business models,
considering (explicitly or implicitly) the following factors. First, they will consider the strength
of their prior beliefs (i.e., the probability P(HA) that the managers assign to the belief that the
assumptions underlying their business models are correct). On the one hand, the benefits
expected by managers with a high P(HA) would be limited, as they would expect to find evidence
consistent with the business model already implemented in their companies (HA) instead of
evidence that would suggest a flawed business model that could lead them to improve their
actions. On the other hand, the expected costs for managers with strong prior beliefs would be
high because: (1) the cost of taking actions different from those suggested by the business
model—to induce variation in the data and be able to test the model—would be perceived to be
high, and (2) the statistical power required to alter the managers‘ confidence in pursuing the
23
business model would also be high, requiring a rich dataset to conduct the tests. Second, the
managers will consider the data available from the firm. For example, if the statistical power
required to test the business model is higher than the power that could be obtained with the data
available, the managers will have to consider the cost and feasibility of gathering additional data.
Similarly, if a key component of the company‘s business model such as employee satisfaction is
not measured, the cost of measuring this construct will affect the manager‘s decision to test or
not test the business model. Third, managers will consider the opportunity costs of implementing
the business model. The expected gains from testing the business model will decrease when the
benefit of pursing the business model, if it is correct (HA is true), is high relative to the benefit of
pursing the best alternative use of the firm‘s resources, and will increase if the payoff of pursing
the business model, if incorrect (H0 is true), is low relative to the payoff of pursing the best
alternative use of the firm‘s resources. Finally, managers will consider the direct cost of
conducting the empirical tests. Many companies will require assistance from a consulting firm.
While the Bayesian inference framework is undoubtedly a simplification or an
approximation of how real managers incorporate the results of statistical tests into their beliefs
and how they might decide whether or not to test their companies‘ business models, it yields
qualitative insights that are consistent with the responses of MTI‘s managers. The managers at
MTI stated that they were highly confident in their business model well before the model was
subjected to statistical validation. They did not seek to use their data to test their business model,
but instead strove to achieve consistency in their measures (to conform to what were perceived to
be ―optimal‖ standards) and to take corrective actions whenever necessary. They were not
contemplating any alternative courses of action that would have persuaded them to either induce
variation in their performance measures or collect additional information to test the business
24
model. The expectation that a statistical test would have materially influenced the managers‘
confidence in the business model was low, and such tests would have required higher statistical
power than the available data allowed.
This way of viewing the management judgment issues might also explain apparent
contradictions between previous studies regarding the usefulness of testing business models.
They might explain why testing the business model in the convenience store chain analyzed by
Campbell et al. (2008), the department stores (Sears) analyzed by Rucci et al. (1998), and the
retail bank (TD Canada Trust) described by Campbell (2008), were interpreted as beneficial
exercises. First, in all of these firms, the managers were uncertain about their business models
(i.e., their P(HA)s were relatively low). Thus, the expectation that the tests would have been
informative to the managers was high. Second, the scale of operations for all these firms
(especially Sears and TD Canada Trust) was high, suggesting high payoffs (relative to the testing
costs) for understanding the ―correct business model.‖ Third, in contrast with MTI, which
operated a single business unit and had a long business cycle, all of these firms had performance
measurement systems that collected comparable panel data across large numbers of relatively
homogeneous business units operating in short business cycles. Therefore, the data necessary to
conduct tests with high statistical power and high confidence levels were readily available. It is
possible that the expected benefits of testing the business models at these firms declined after the
managers started to pursue specific goals. For example, the managers at TD Canada Trust
introduced incentives that rewarded employees for achieving optimal levels of customer
satisfaction according to the business plan. A bonus cap was established at the point where an
increase in the level of customer satisfaction no longer yielded greater financial returns. These
25
incentives might have led to stable customer satisfaction levels, which would make them more
difficult to relate to financial performance through statistical tests.
The insights we gain by viewing this issue through a Bayesian lens might also help to
explain why the managers in the company analyzed by Malina et al. (2007) were so reluctant to
update their beliefs, despite the lack of statistical support for the distributor balanced scorecard.
According to Malina et al. (2007), the managers‘ reluctance to update their beliefs was explained
because the relations in the distributor balanced scorecard were viewed as ―finality relationships‖
(i.e., relations explained by a purpose rather than a cause), and were not meant to be validated by
using statistical tests. While we do not intend to refute Malina et al‘s interpretation, our Bayesian
framework offers an alternative explanation to that proposed by Malina et al. (2007). We
conjecture that the managers may have placed little weight on the results of a test of the business
model because (1) the managers were confident in their business model and appeared to be more
interested in implementing than in testing the model, and (2) the data available for the tests
described an unstable period where different business units merged with each other, generating a
heterogeneous dataset unlikely to produce a high powered test.
Ultimately, whether the Bayesian interpretation provides an alternative explanation for
the findings reported by Malina et al. (2007) is a philosophical question, which cannot be
resolved empirically. Whether a relationship is characterized as a ―causal relation‖ or a ―finality
relation‖ (and hence, whether it can be tested using statistical methods or not) depends on the
researcher‘s ex ante methodological viewpoint (Arbnor and Bjerke 1997, 428). The same
relationship described as a ―causal relation‖ under an analytical perspective could be described
as a ―finality relation‖ by a researcher adopting a systems perspective, and the concepts of
causality and finality can only be fully understood in the context of the methodological view to
26
which each belongs (Arbnor and Bjerke 1997, 438).14
Therefore, while Malina et al.‘s reported
findings appear to be consistent with the Bayesian framework developed above, this conclusion
need not be interpreted as a repudiation of the finality explanation these authors offer. We claim
only that the examples cited above—to say nothing of the much more extensive literature testing
relationships between nonfinancial performance measures and both future financial performance
and/or stock returns—are a rather strong refutation of a general claim that most business model
relationships cannot be tested.
Causal business models and statistical testing can provide relevant information for
management decisions. Yet, under a Bayesian framework, rational managers may sometimes
conclude that the expected benefits of statistical tests of their business models do not outweigh
the expected costs of such tests. And they may also find reasons to continue to use their models
even when statistical tests have failed to provide strong confirmatory evidence for these models.
That is, the patterns of apparent anomalies observed across the prior literature may conform to an
entirely rational explanation.
V. DISCUSSION AND CONCLUSIONS
This study was initially designed to test the assumed cause-and-effect relationships implicit
in the business model of a single business unit company. We wanted to demonstrate the power
of testing business models, which are said to be valuable but rarely done, and perhaps also to
suggest refinements in the methods for doing so.
We believed that the conditions for testing the business model at our research site were
near ideal. We had data for over eight years for a successful company with a stable management
14
According to Arbnor and Bjerke (1997, 417): ―…there are no objective and general criteria for choosing among
methodological views. There are criteria, but these are valid only within a methodological view. It is, to be sure, not
uncommon for proponents of the different views to claim that ‗ours is best‘, but this can only be supported
philosophically and speculatively."
27
team operating in a single line of business with a stable business strategy in a period of relatively
stable environmental conditions. If ever such tests could be done successfully in a single-
business-unit setting, we believed that they should have been able to be done at our research site.
We found, however, that our statistical results were weak. Our analyses provided only
partial support for the company‘s business model. Only one of four leading indicators
(instrument placements) was significantly associated with both future financial performance and
stock returns, and only one of three subsections of the structural paths in the company‘s business
model was validated with statistical significance.
We were also surprised that company managers were neither surprised nor concerned by
our general lack of validation of their business model. To explain our findings, we develop
several insights about the feasibility and value of testing business models in various settings.
Using a simplified Bayesian framework, we explain that managers are more likely to benefit
from tests of their business models when their confidence in the company‘s business model is
weak and when the power of the statistical tests conducted is high. Confidence extends to the
entire business model; i.e., the model parameters and the lags and functional forms of the various
cause-and-effect relationships. When managers‘ confidence in the validity of their business
model is high, as it was at the company we studied, it is doubtful that the statistical tests that can
be conducted in a single-business-unit firm, even over an extended longitudinal period in a
relatively stable operating environment, can be powerful enough to change the managers‘ beliefs.
The available sample sizes are too small to offset insufficient variation in the data and all of the
effects of the many sources of noise, such as variations in the length of the lead-lag relationships.
If managers want to enhance their capabilities for testing their business models, they should
conduct some natural experiments. They need to create greater variation in the performance
28
drivers to be better able to observe the effects. At our research site (and at possibly all companies
where the managers feel confident about their business models), however, the managers take
actions explicitly designed to dampen some of the causal effects. The managers fix certain
business model parameters (e.g., R&D investments) at what they consider to be optimal,
manageable levels, and they take corrective actions to reduce the longitudinal variance in some
other key parameters (e.g., gross margins) to achieve desired income levels. These actions
further diminish the potential power of the statistical tests.
In retrospect, then, we now understand that our research site was not ideal for
demonstrating the value of testing a business model. To maximize the potential for
demonstrating that value, in addition to finding the conditions that we sought—e.g., data
availability; stable strategy, management team and business conditions—researchers should seek
sites where managers‘ confidence in their model is low and where they take actions to induce
greater variation in the performance drivers.
In that we study only one firm, we recognize that the extent to which our results generalize
to other businesses might be limited. Nevertheless, we believe that this study provides new
insights and suggests new opportunities for future research.
More research is necessary to understand when and how business models are and should be
tested. Future studies should examine whether managers (including those in financially
successful firms) respond to the conditions affecting the value, power, and costs of the tests. The
managers‘ initial confidence in their business models is probably a major determinant of the
perceived value of the tests, so that variable should affect both the likelihood that the managers
will test their models and the benefits they perceive from conducting such tests. Managers‘
confidence can be measured using either survey or interview research methods. We also need to
29
learn more about how these beliefs are formed, whether they are reasonably accurate, and what
might be done if they are not accurate (e.g., if they reflect management bias or overconfidence).
The power of the tests is affected both by the setting (e.g., stability of economic conditions,
quality of data) and by the managers‘ actions (e.g., their choice to create or dampen variation in
the performance drivers). It might also be affected by choices in the level of analysis. At our
research site, for example, at least in theory, major portions of the business model could be tested
at the instrument, reagent, region, or customer level, rather than at the consolidated company
level. The direct costs of conducting business model tests are likely to be highly idiosyncratic,
but they should be considered as they affect the net benefits of conducting such tests.
30
REFERENCES
Amir, E., and B. Lev. 1996. Value-relevance of nonfinancial information: The wireless
communications industry. Journal of Accounting and Economics 22 (1-3): 3-30.
Anderson, E. W., C. Fornell, and D. R. Lehmann. 1994. Customer satisfaction, market share, and
profitability: Findings from Sweden. Journal of Marketing 58 (3): 53-66.
Arbnor, I. and Bjerke, B. 1997, Methodology for Creating Business Knowledge Second Edition,
Thousand Oaks, CA: SAGE Publications.
Banker, R. D., and R. Mashruwala. 2007. The Moderating Role of Competition in the
Relationship between Nonfinancial Measures and Future Financial Performance.
Contemporary Accounting Research 24 (3): 763–93
Banker, R. D., G. Potter, and D. Srinivasan. 2000. An empirical investigation of an incentive
plan that includes nonfinancial performance measures. The Accounting Review 75 (1): 65-92.
Baron, R. M., and D. A. Kenny. 1986. The Moderator-Mediator Variable Distinction in Social
Psychological Research: Conceptual, Strategic, and Statistical Considerations. Journal of
Personality and Social Psychology, 51 (6):1173.
Burgstahler, D., 1987. Inference from empirical research. The Accounting Review 62 (1): 203-
214.
Campbell, D. 2008. TD Canada Trust (A), (B), and (C). Harvard Business School Case N9-108-
005.
Campbell, D., S. Datar, S. L. Kulp, and V. G. Narayanan. 2008. Testing Strategy with Multiple
Performance Measures: Evidence from a Balanced Scorecard at Store24 . Working paper,
Harvard Business School.
Chandra, U., A. Procassini, and G. Waymire. 1999. The use of trade association disclosures by
investors and analyses: Evidence from the semiconductor industry. Contemporary
Accounting Research 16 (4): 643-670.
Chen, C., M. Martin, and K.A. Merchant. 2008. ―The Effects of Measurement Alternatives on
the Forward-Looking Properties of Customer Satisfaction Measures, unpublished working
paper, November.
Cohen, J. 1988. Statistical Power Analysis for the Behavioral Sciences. Second Edition.
Hillsdale, NJ: Lawrence Erlbaum Associates, Publishers.
Cross, K. F., and R. L. Lynch. 1988. The SMART way to define and sustain success. National
Productivity Review 8 (1): 23-33.

31
Deng, Z., B. Lev, and F. Narin. 1999. Science and technology as predictors of stock
performance. Financial Analysts Journal (May-June): 20-32.
Dikolli, S. S., and K. L. Sedatole. 2007. Improvements in the information content of non-
financial forward-looking performance measures: A taxonomy and application. Journal of
Management Accounting Research 19: 71-104.
Dye, R. 2004. Strategy Selection and Performance Measurement Choice When Profits Drivers
Are Uncertain, Management Science 50 (12): 1642-1637.
EFQM (2003), ―The Fundamental Concepts of Excellence‖, www.efqm.org
Eckerson, W.W. 2006. Performance dashboards: Measuring, monitoring, and managing your
business. New York: Wiley.
Epstein, M. J,. and J. F. Manzoni. 1997. The balanced scorecard and tableau de bord: translating
strategy into action. Management Accounting 79(2), 28-36.
Farrell, A., J. Luft, and M. Shields. 2007. Accuracy in judging the nonlinear effects of cost and
profit drivers. Contemporary Accounting Research 24 (4): 1139-1169.
Greene, W. H. 2003. Econometric Analysis: Prentice Hall Upper Saddle River, NJ.
Granger, C. 1980, Testing for Causality: A Personal Viewpoint. Journal of Economic Dynamics
and Control 2: 329-352
Hirschey, M., V. J. Richardson, and S. Scholz. 2001. Value relevance of nonfinancial
information: The case of patent data. Review of Quantitative Finance and Accounting. 17(3),
223-235.
Ittner, C. D., and D. F. Larcker. 1998a. Innovations in performance measurement: Trends and
research implications. Journal of Management Accounting Research 10: 205-238.
----------. 1998b. Are nonfinancial measures leading indicators of financial performance? An
analysis of customer satisfaction. Journal of Accounting Research 36(Supplement): 1-35.
----------. 2001. Assessing empirical research in managerial accounting: a value-based
management perspective. Journal of Accounting and Economics 32 (1-3): 349-410.
----------. 2003. Coming up short on nonfinancial performance measurement. Harvard Business
Review 81 (11): 88-95.
Ittner, C. D., D. F. Larcker, and T. Randall. 2003. Performance implications of strategic
performance measurement in financial services firms. Accounting, Organizations & Society
28 (7-8): 715-741.
32
Kaplan, R. S., and D. P. Norton. 1992. The balanced scorecard – measures that drive
performance. Harvard Business Review 1992 (Jan/Feb): 71-79.
----------1996. The Balanced Scorecard: Translating strategy into action. Boston, MA: Harvard
Business School Press.
----------2004. Strategy Maps. Boston, MA: Harvard Business School Press.
----------2008. The Execution Premium: Linking Strategy to Operations for Competitive
Advantage. Harvard Business School Press.
Kothari, S. P., and R G. Sloan. 1992. Information in Prices about Future Earnings. Implications
for Earnings Response Coefficients. Journal of Accounting and Economics 15 (2-3): 143-
171.
Lev, B. 2001. Intangibles: Management, Measurement and Reporting. Washington, D.C.:
Brookings Institute Press.
Magretta, J. 2002. Why business models work. Harvard Business Review, May: 3-8.
Malina, M., H.S.O. Nørreklit, and F. Selto. 2007. Relations among measures, climate of control,
and performance measurement models. Contemporary Accounting Research 24 (3), 935-982.
Malo, J. L.. 1995. Les tableaux de bord comme signe d‘une gestion et d‘une comptabilité à la
française. In Mélanges en l’honneur du professeur Claude Pérochon. Paris: Foucher, 357-
376.
Neely, A., C. Adams, and M. Kennerley. 2002. The Performance Prism: The Scorecard for
Measuring and Managing Business Success, Financial Times/Prentice Hall, London.
Nørreklit, H. 2000. The balance on the Balanced Scorecard: A Critical Analysis of Some of Its
Assumptions. Management Accounting Research 11 (1): 65-88.
----------. 2003. The balanced scorecard: What is the score? A rhetorical analysis of the balanced
scorecard. Accounting, Organizations and Society 28 (6): 591-619.
Ohlson, J. A. 1995. 'Earnings, book values, and dividends in equity valuation'. Contemporary
Accounting Research, 11 (2):661-687.
----------. 2001. Earnings, book values, and dividends in equity valuation: An empirical
perspective. Contemporary Accounting Research, 18 (1):107-120.
Roth, A. V., and W. E. Jackson III. 1995. Strategic determinants of service quality and
performance: Evidence from the banking industry. Management Science 41 (11), 1720-1733.
33
Rucci, A. J., S. P. Kirn, and R. T. Quinn. 1998. The employee-customer-profit chain at Sears.
Harvard Business Review 76 (1): 82-97.
Rust, R., V. Zeithaml, and K. Lemon. 2000. Driving Customer Equity: How Customer Lifetime
Value is Reshaping Corporate Strategy. The Free Press, New York.
Sedatole, K. L. 2003. The effect of measurement alternatives on a nonfinancial quality measure‘s
forward-looking properties. The Accounting Review 78 (2): 555-580.
Smith, R. E., and W. F. Wright. 2004. Determinants of customer loyalty and financial
performance. Journal of Management Accounting Research 16: 183-205.
Trueman, B., M.H.F. Wong, and X Zhang. 2000. The eyeballs have it: Searching for the value in
Internet stocks. Journal of Accounting Research 38 (Supplement): 137-162.
Tsikriktsis, N. 2007. The effect of operational performance and focus on profitability: A
longitudinal study of the U.S. airline industry. Manufacturing and Service Operations
Management 9 (4): 506-517.
34
Figure 1
Pictorial Illustration of the Major Elements in the Business Model for “MTI”
Reagents
released Reagent
sales
Instrument
placements
Gross
margins as
% of sales
Revenues
+
(1 qtr)
+
Financial
Performance +
(3 qtrs)
+
R&D
expenditures +
(9-12 qtrs)
+
(1-4 qtrs R&D,
2-3 qtrs FDA) +
+
(1 qtr)
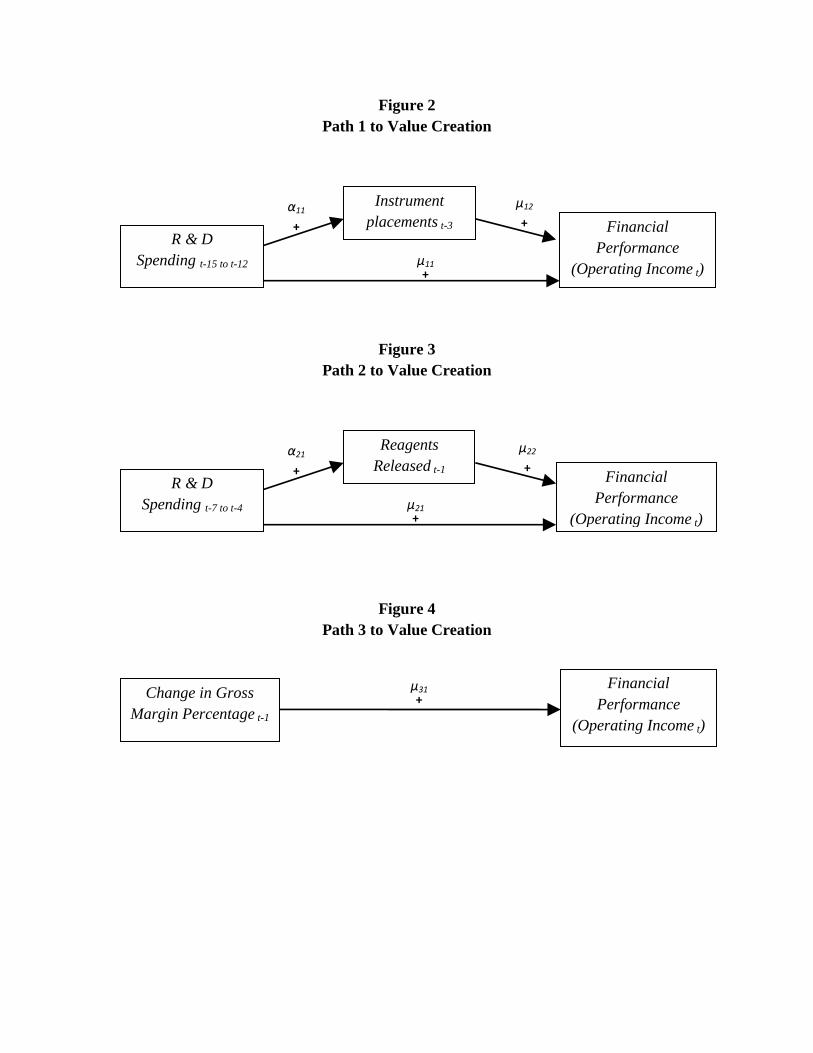
Figure 2
Path 1 to Value Creation
Figure 3
Path 2 to Value Creation
Figure 4
Path 3 to Value Creation
Financial
Performance
(Operating Income t)
Change in Gross
Margin Percentage t-1
µ31 +
Financial
Performance
(Operating Income t)
R & D
Spending t-7 to t-4
Reagents
Released t-1
α21
+
µ22
+
µ21 +
Financial
Performance
(Operating Income t)
R & D
Spending t-15 to t-12
Instrument
placements t-3
α11
+
µ12
+
µ11 +
36
Figure 5: Tests of the Assumptions Implicit in MTI’s Business Model
Main Tests Variables
1. Tests of
MTI’s
business
model using
operating
income as
the
dependent
variable
Univariate Analyses: Correlations between Operating Income and 15 lags of R&D
Spending, Instrument Placements, Reagents Released and Gross Margin Percentage
Multivariate Analyses
Operating Incomet = γ0 + γ1×
15
12
&k
ktSpendingDR + γ2×
7
4
&k
ktSpendingDR
+ γ3× Instrument Placementst-3 + γ4× Reagents Releasedt-1
+ γ5× Gross Margin Percentaget-1 + γn × Controlst+ t
(1)
Operating income: Quarterly operating income in thousands
of dollars.
R&D spending: Research and development expenditures in
thousands of dollars.
Instrument placements: Number of instrument units installed
during the quarter.
Reagents released: number of releases in the quarter.
Gross margin percentage: quarterly gross margin divided by
total sales, multiplied by 100.
Controls include three indicator variables:
FDA indicator is equal to one from the first quarter of
2004 to the third quarter of 2005 when the firm was
subject to a suspension of FDA reviews of its new and
pending applications, and zero otherwise.
DOJ indicator is equal to one from the first quarter of
2003 through the second quarter of 2005 when the firm
was the subject of a Department of Justice investigation
for possible violation of the Foreign Corrupt Practices
Act in one of its foreign subsidiaries, and equal to zero
otherwise.
Summer indicator is an indicator equal to one in the
summer (third) quarter of the year when financial
performance is said to decline due to seasonality, zero
otherwise.
2. Tests of
MTI’s
business
model using
path analysis
Test of Path 1
Instrument Placements t-3 = α10 + α11 ×
15
12
&k
ktSpendingDR + t
Operating Income t = β10 + β11×
15
12
&k
ktSpendingDR + β1n ×Controls t+ t
Operating Income t = µ10 + µ11×
15
12
&k
ktSpendingDR + µ12× Instrument Placements t-3
+ µ1n × Controls t+ t Test of Path 2
Reagents Released t-1 = α20 + α21 ×
7
4
&k
ktSpendingDR + α22 × FDA indicator t-1 + t
Operating Incomet = β20 + β21×
7
4
&k
ktSpendingDR + β2n × Controls t + t
Operating Incomet = µ20 + µ21×
7
4
&k
ktSpendingDR + µ22× Reagents Releasedt-1
+ µ2n × Controlst+ t
Test of Path 3
Operating Incomet = µ30 + µ31 × ∆Gross Margin Percentaget-1 + µ3n × Controlst+ t
(2)
(3)
(4)
(5)
(6)
(7)
(8)
3. Tests of
MTI’s
business
model using
stock returns
as the
dependent
variable
Univariate Analyses: Correlations between Stock Returns and ∆R&D Spending,
Instrument placements, Reagents Released and ∆Gross Margin Percentage
Multivariate Analyses
Stock Returnst = β0 + β1 × Net Incomet + β2 × ∆ Net Incomet + β7 × ∆ Expected Growtht
+ β3 × ∆Gross Margin Percentaget + β4 × Instrument placementst
+β5 × Reagents Releasedt + β6 × ∆R&D Spendingt+ + βn × Controlst+ t
(9)
In addition to the variables above: Stock Returns: Quarterly stock price returns Net Income & ∆Net Income: Net income at time t and
change in net income from time t-1 to time t, by market value of equity.
Expected Growth: Annual expected growth up to quarter t-1 ∆ Expected Growth (∆ R&D Spending): Expected growth
(R&D spending) in time t minus expected growth (R&D spending) in time t-1 deflated by market value of equity.
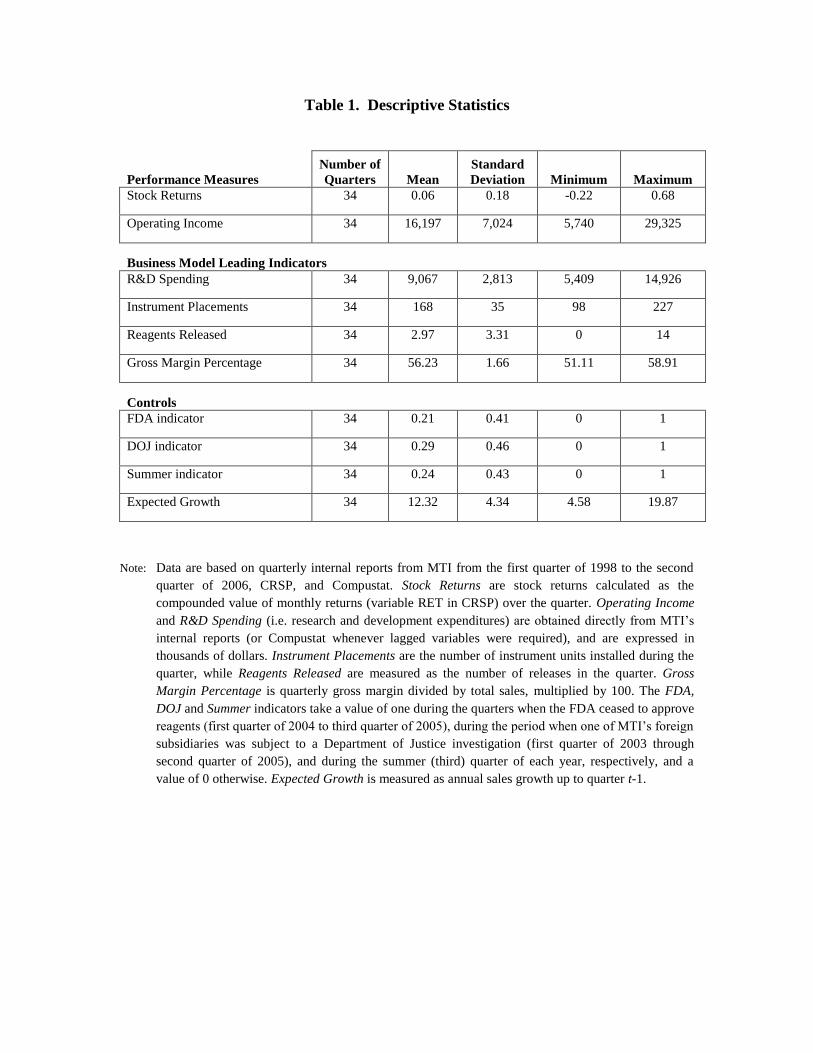
Table 1. Descriptive Statistics
Performance Measures
Number of
Quarters Mean
Standard
Deviation Minimum Maximum
Stock Returns 34 0.06 0.18 -0.22 0.68
Operating Income 34 16,197 7,024 5,740 29,325
Business Model Leading Indicators
R&D Spending 34 9,067 2,813 5,409 14,926
Instrument Placements 34 168 35 98 227
Reagents Released 34 2.97 3.31 0 14
Gross Margin Percentage 34 56.23 1.66 51.11 58.91
Controls
FDA indicator 34 0.21 0.41 0 1
DOJ indicator 34 0.29 0.46 0 1
Summer indicator 34 0.24 0.43 0 1
Expected Growth 34 12.32 4.34 4.58 19.87
Note: Data are based on quarterly internal reports from MTI from the first quarter of 1998 to the second
quarter of 2006, CRSP, and Compustat. Stock Returns are stock returns calculated as the
compounded value of monthly returns (variable RET in CRSP) over the quarter. Operating Income
and R&D Spending (i.e. research and development expenditures) are obtained directly from MTI‘s
internal reports (or Compustat whenever lagged variables were required), and are expressed in
thousands of dollars. Instrument Placements are the number of instrument units installed during the
quarter, while Reagents Released are measured as the number of releases in the quarter. Gross
Margin Percentage is quarterly gross margin divided by total sales, multiplied by 100. The FDA,
DOJ and Summer indicators take a value of one during the quarters when the FDA ceased to approve
reagents (first quarter of 2004 to third quarter of 2005), during the period when one of MTI‘s foreign
subsidiaries was subject to a Department of Justice investigation (first quarter of 2003 through
second quarter of 2005), and during the summer (third) quarter of each year, respectively, and a
value of 0 otherwise. Expected Growth is measured as annual sales growth up to quarter t-1.
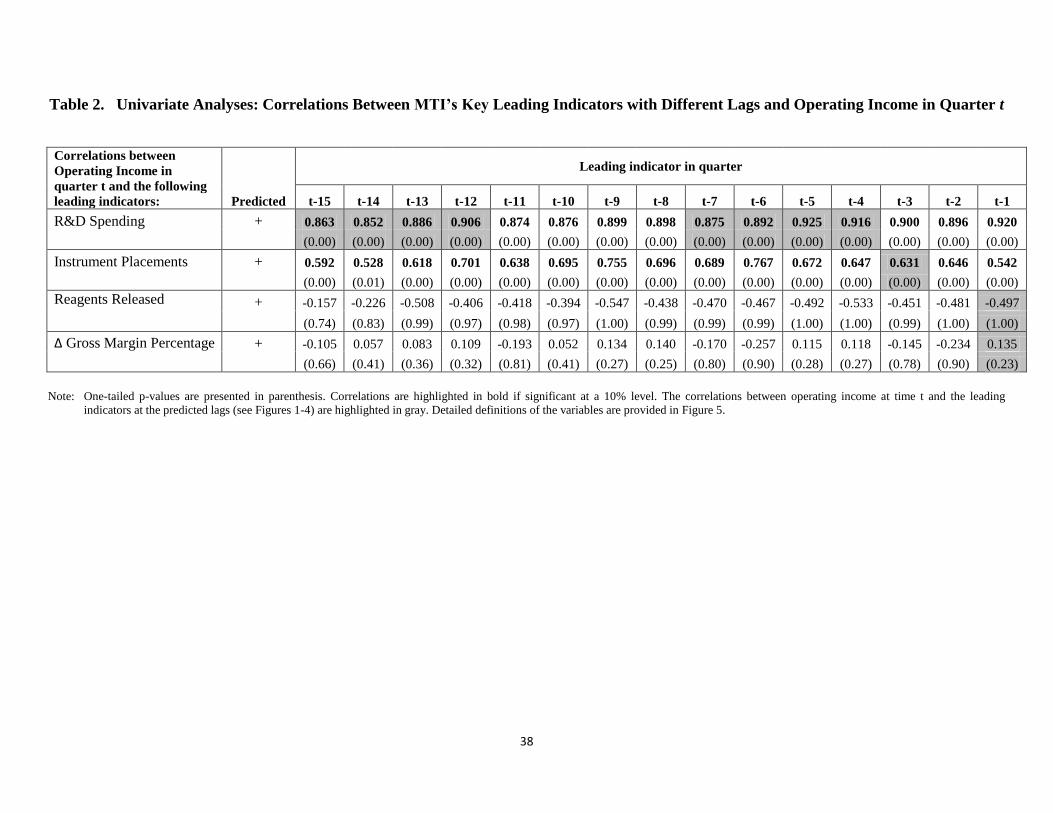
38
Table 2. Univariate Analyses: Correlations Between MTI’s Key Leading Indicators with Different Lags and Operating Income in Quarter t
Correlations between
Operating Income in
quarter t and the following
leading indicators: Predicted
Leading indicator in quarter
t-15 t-14 t-13 t-12 t-11 t-10 t-9 t-8 t-7 t-6 t-5 t-4 t-3 t-2 t-1
R&D Spending + 0.863 0.852 0.886 0.906 0.874 0.876 0.899 0.898 0.875 0.892 0.925 0.916 0.900 0.896 0.920
(0.00) (0.00) (0.00) (0.00) (0.00) (0.00) (0.00) (0.00) (0.00) (0.00) (0.00) (0.00) (0.00) (0.00) (0.00)
Instrument Placements + 0.592 0.528 0.618 0.701 0.638 0.695 0.755 0.696 0.689 0.767 0.672 0.647 0.631 0.646 0.542
(0.00) (0.01) (0.00) (0.00) (0.00) (0.00) (0.00) (0.00) (0.00) (0.00) (0.00) (0.00) (0.00) (0.00) (0.00)
Reagents Released + -0.157 -0.226 -0.508 -0.406 -0.418 -0.394 -0.547 -0.438 -0.470 -0.467 -0.492 -0.533 -0.451 -0.481 -0.497
(0.74) (0.83) (0.99) (0.97) (0.98) (0.97) (1.00) (0.99) (0.99) (0.99) (1.00) (1.00) (0.99) (1.00) (1.00)
∆ Gross Margin Percentage + -0.105 0.057 0.083 0.109 -0.193 0.052 0.134 0.140 -0.170 -0.257 0.115 0.118 -0.145 -0.234 0.135
(0.66) (0.41) (0.36) (0.32) (0.81) (0.41) (0.27) (0.25) (0.80) (0.90) (0.28) (0.27) (0.78) (0.90) (0.23)
Note: One-tailed p-values are presented in parenthesis. Correlations are highlighted in bold if significant at a 10% level. The correlations between operating income at time t and the leading
indicators at the predicted lags (see Figures 1-4) are highlighted in gray. Detailed definitions of the variables are provided in Figure 5.
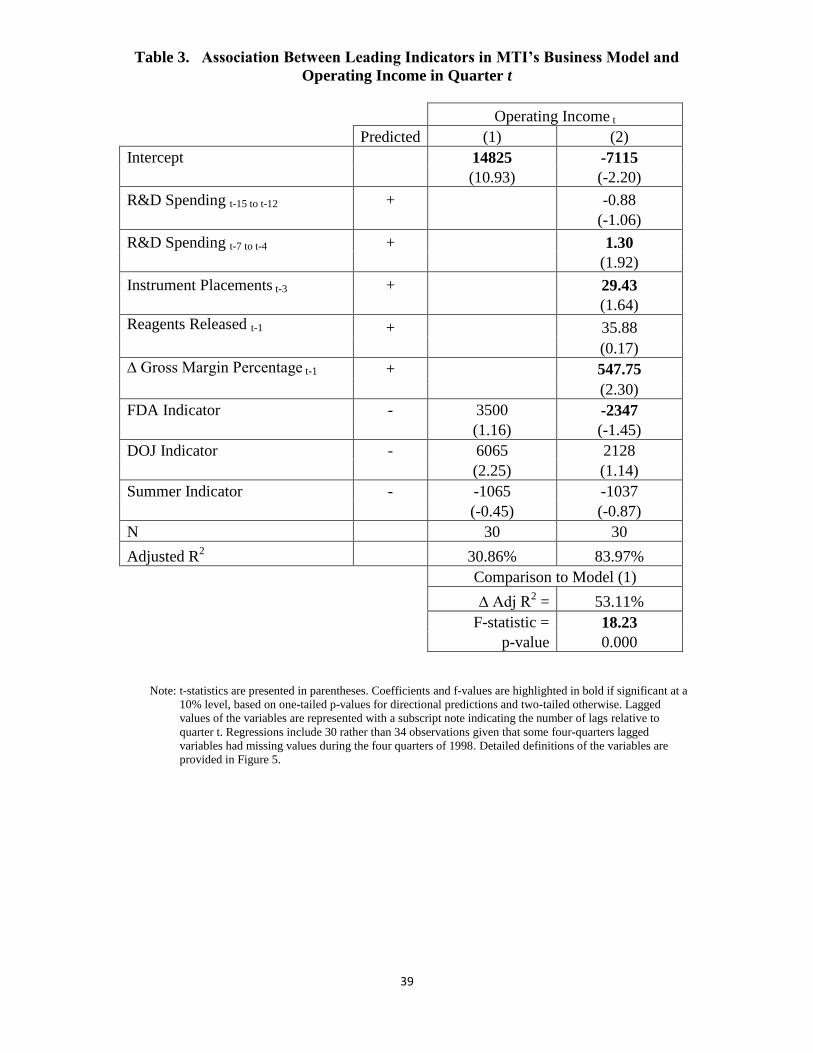
39
Table 3. Association Between Leading Indicators in MTI’s Business Model and
Operating Income in Quarter t
Operating Income t
Predicted (1) (2)
Intercept 14825 -7115
(10.93) (-2.20)
R&D Spending t-15 to t-12 + -0.88
(-1.06)
R&D Spending t-7 to t-4 + 1.30
(1.92)
Instrument Placements t-3 + 29.43
(1.64)
Reagents Released t-1 + 35.88
(0.17)
∆ Gross Margin Percentage t-1 + 547.75
(2.30)
FDA Indicator - 3500 -2347
(1.16) (-1.45)
DOJ Indicator - 6065 2128
(2.25) (1.14)
Summer Indicator - -1065 -1037
(-0.45) (-0.87)
N 30 30
Adjusted R2 30.86% 83.97%
Comparison to Model (1)
∆ Adj R2 = 53.11%
F-statistic = 18.23
p-value 0.000
Note: t-statistics are presented in parentheses. Coefficients and f-values are highlighted in bold if significant at a
10% level, based on one-tailed p-values for directional predictions and two-tailed otherwise. Lagged
values of the variables are represented with a subscript note indicating the number of lags relative to
quarter t. Regressions include 30 rather than 34 observations given that some four-quarters lagged
variables had missing values during the four quarters of 1998. Detailed definitions of the variables are
provided in Figure 5.
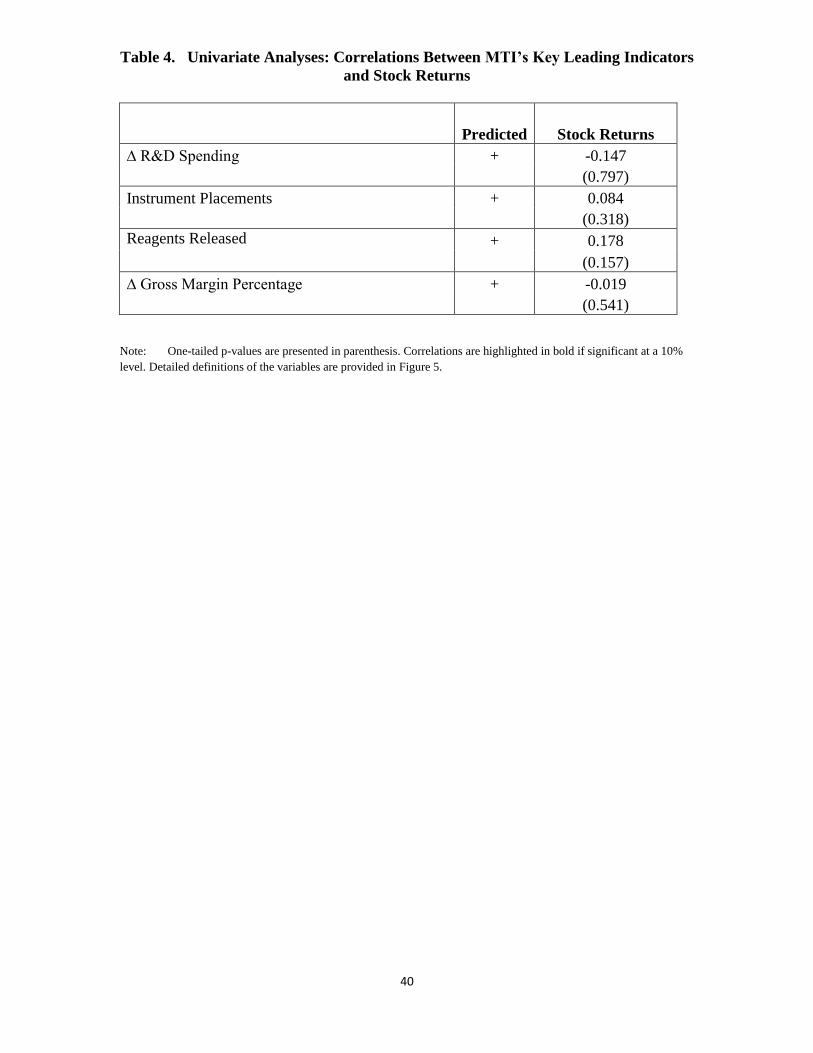
40
Table 4. Univariate Analyses: Correlations Between MTI’s Key Leading Indicators
and Stock Returns
Predicted Stock Returns
∆ R&D Spending + -0.147
(0.797)
Instrument Placements + 0.084
(0.318)
Reagents Released + 0.178
(0.157)
∆ Gross Margin Percentage + -0.019
(0.541)
Note: One-tailed p-values are presented in parenthesis. Correlations are highlighted in bold if significant at a 10%
level. Detailed definitions of the variables are provided in Figure 5.
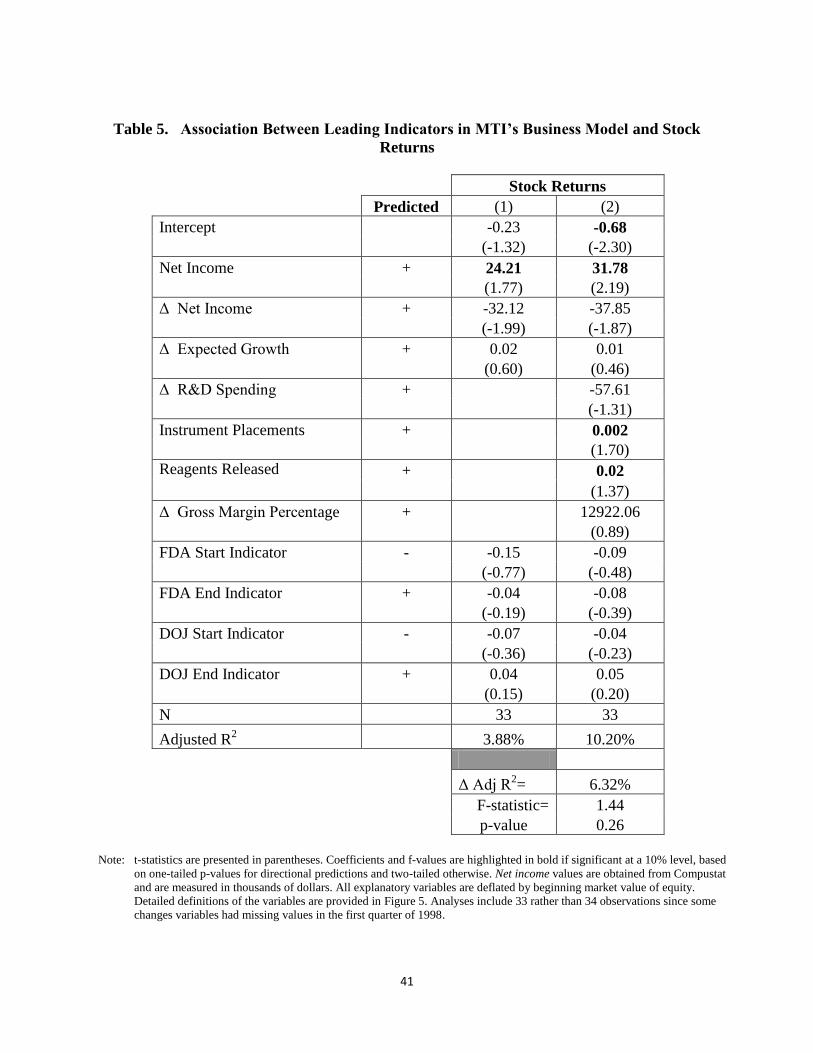
41
Table 5. Association Between Leading Indicators in MTI’s Business Model and Stock
Returns
Stock Returns
Predicted (1) (2)
Intercept -0.23 -0.68
(-1.32) (-2.30)
Net Income + 24.21 31.78
(1.77) (2.19)
Δ Net Income + -32.12 -37.85
(-1.99) (-1.87)
Δ Expected Growth + 0.02 0.01
(0.60) (0.46)
Δ R&D Spending + -57.61
(-1.31)
Instrument Placements + 0.002
(1.70)
Reagents Released + 0.02
(1.37)
Δ Gross Margin Percentage + 12922.06
(0.89)
FDA Start Indicator - -0.15 -0.09
(-0.77) (-0.48)
FDA End Indicator + -0.04 -0.08
(-0.19) (-0.39)
DOJ Start Indicator - -0.07 -0.04
(-0.36) (-0.23)
DOJ End Indicator + 0.04 0.05
(0.15) (0.20)
N 33 33
Adjusted R2 3.88% 10.20%
Δ Adj R2= 6.32%
F-statistic= 1.44
p-value 0.26
Note: t-statistics are presented in parentheses. Coefficients and f-values are highlighted in bold if significant at a 10% level, based
on one-tailed p-values for directional predictions and two-tailed otherwise. Net income values are obtained from Compustat
and are measured in thousands of dollars. All explanatory variables are deflated by beginning market value of equity.
Detailed definitions of the variables are provided in Figure 5. Analyses include 33 rather than 34 observations since some
changes variables had missing values in the first quarter of 1998.
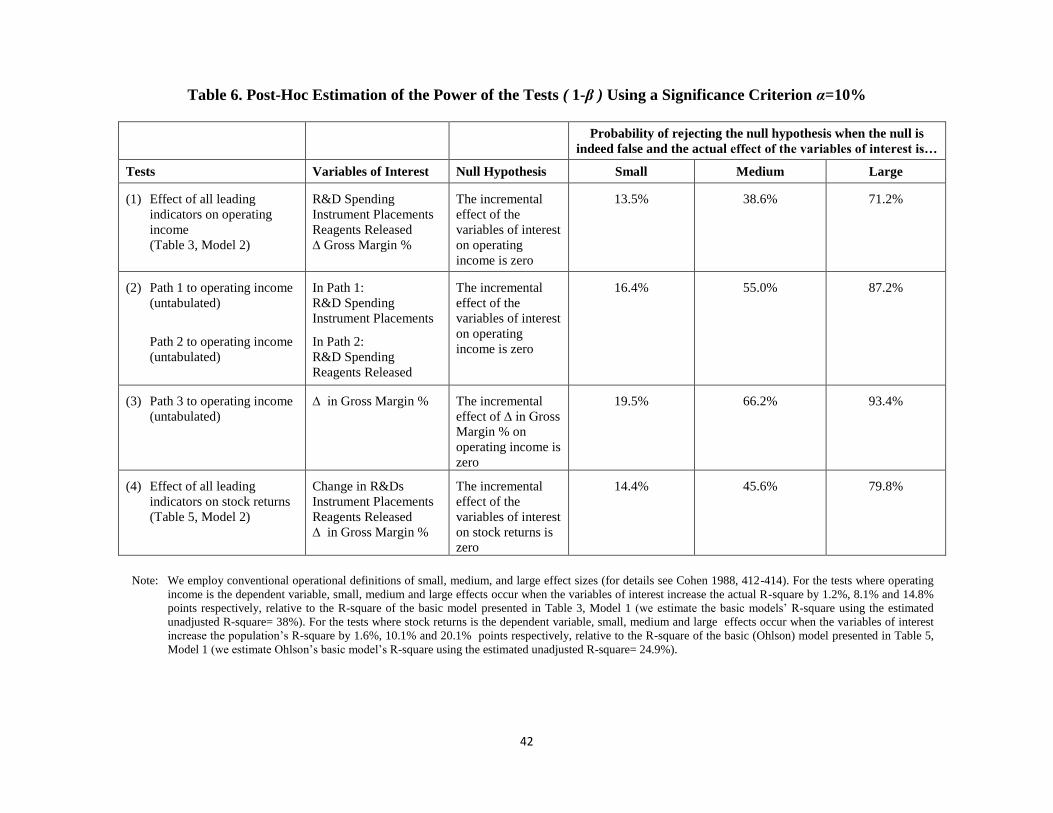
42
Table 6. Post-Hoc Estimation of the Power of the Tests ( 1-β ) Using a Significance Criterion α=10%
Probability of rejecting the null hypothesis when the null is
indeed false and the actual effect of the variables of interest is…
Tests Variables of Interest Null Hypothesis Small Medium Large
(1) Effect of all leading
indicators on operating
income
(Table 3, Model 2)
R&D Spending
Instrument Placements
Reagents Released
∆ Gross Margin %
The incremental
effect of the
variables of interest
on operating
income is zero
13.5% 38.6% 71.2%
(2) Path 1 to operating income
(untabulated)
Path 2 to operating income
(untabulated)
In Path 1:
R&D Spending
Instrument Placements
In Path 2:
R&D Spending
Reagents Released
The incremental
effect of the
variables of interest
on operating
income is zero
16.4% 55.0% 87.2%
(3) Path 3 to operating income
(untabulated)
∆ in Gross Margin % The incremental
effect of ∆ in Gross
Margin % on
operating income is
zero
19.5% 66.2% 93.4%
(4) Effect of all leading
indicators on stock returns
(Table 5, Model 2)
Change in R&Ds
Instrument Placements
Reagents Released
∆ in Gross Margin %
The incremental
effect of the
variables of interest
on stock returns is
zero
14.4% 45.6% 79.8%
Note: We employ conventional operational definitions of small, medium, and large effect sizes (for details see Cohen 1988, 412-414). For the tests where operating
income is the dependent variable, small, medium and large effects occur when the variables of interest increase the actual R-square by 1.2%, 8.1% and 14.8%
points respectively, relative to the R-square of the basic model presented in Table 3, Model 1 (we estimate the basic models‘ R-square using the estimated
unadjusted R-square= 38%). For the tests where stock returns is the dependent variable, small, medium and large effects occur when the variables of interest
increase the population‘s R-square by 1.6%, 10.1% and 20.1% points respectively, relative to the R-square of the basic (Ohlson) model presented in Table 5,
Model 1 (we estimate Ohlson‘s basic model‘s R-square using the estimated unadjusted R-square= 24.9%).


![Models negoci - Business Models [català]](https://img.pdfslide.net/doc/110x75/54935b67b47959474d8b4813/models-negoci-business-models-catala.jpg)