Embed Size (px)
Citation preview
www.elsevier.com/locate/wasman
Waste Management 26 (2006) 110–122
On the effect of demographic characteristics on the formulationof solid waste charging policy
A. Karagiannidis *, A. Xirogiannopoulou, N. Moussiopoulos
Laboratory of Heat Transfer and Environmental Engineering, Department of Mechanical Engineering, Box 483,
Aristotle University, 54124 Thessaloniki, Greece
Accepted 6 January 2005
Available online 11 March 2005
Abstract
This paper presents the results from an analysis of municipal charges in Greece, as the fees paid by municipal waste producers to
the municipal authorities are included in these charges and constitute a major part of them. The aim is to determine whether and
how some of the demographic characteristics of a municipality influence the formulation of municipal waste charges and specifically
the level of the charge. The study included 339 Hellenic municipalities, which comprised approximately 62% of the overall popula-
tion in the country.
� 2005 Elsevier Ltd. All rights reserved.
1. Trends in municipal solid waste charging policies
Municipal waste services constitute a very important
component in the waste management chain. The contin-
uously growing waste production – and the increasedhazardousness of waste fractions as well – renders waste
management among the larger industries in the world.
The increasing waste production which raises the waste
management cost to high levels, as well as the (a) Pol-
luter-Pays Principle (PPP) (Commission of the Euro-
pean Communities, 2003; Official Journal of the
European Communities, 2001); Organization of Eco-
nomic Co-operation and Development (OECD,2001a), (b) Precautionary Principle (Commission of
the European Communities, 2000) and (c) Producer
0956-053X/$ - see front matter � 2005 Elsevier Ltd. All rights reserved.
doi:10.1016/j.wasman.2005.01.013
Abbreviations: HD, Household Density; HOG, Hellenic Official
Gazette; LCL, Lower Control Limit; OECD, Organisation for Eco-
nomic Co-Operation and Development; PAYT, Pay As You Throw;
PD, Population Density; PPC, Public Power Corporation of Greece;
PPP, Polluter Pays Principles; UCL, Upper Control Limit; WM,
Waste Management.* Corresponding author. Tel.: +30 231 099 4165; fax: +30 231 099
6012.
E-mail address: [email protected] (A. Karagiannidis).
Responsibility Principle (OECD, 2001b) are leading
the current management towards incorporating in its
procedures and pricing, mechanisms for reducing the
impact to the environment and for establishing equity
and fairness towards citizens as well.The aforementioned three principles constitute a sig-
nificant part of the global policy for environmental
protection. In particular, the PPP is the basis for the
Pay-As-You-Throw (PAYT) – system for variable waste
charging, according to the amount produced by each
household (Skumatz et al., 1997; Canterbury, 1997,
1998; Miranda and Aldy, 1996; Karagiannidis et al.,
2002; Aravossis, 2002; Intecus, 1998; www.payt.net,2004). These principles impose that related systems
should be adopted in both waste management levels,
i.e., collection and disposal (treatment and final dis-
posal). It should be noted that the incorporation of
PPP in the last stage of waste management (tipping fees
at landfills) is more feasible to be implemented because
of the available weighing system at the entrance of the
landfills, which facilitates the cost accounting of thewastes disposed.
Until recently, causing pollution either remained
‘‘unpunished’’ or the charging of the related activities
A. Karagiannidis et al. / Waste Management 26 (2006) 110–122 111
was not proportional to the damage caused. PPP allo-
cates the economic obligations concerning environmen-
tal pollution. PAYT, as a representative of PPP in the
waste management chain, aims at the identification of
the polluter and his/her enforcement to pay the cost of
waste collection and treatment according to the amountof the pollution that he/she produces (OECD, 1992;
www.payt.net, 2004). In this way, the financial return
of waste services is becoming an instrument for stimulat-
ing polluters (waste producers) towards reduction of
pollution (waste).
Another trend in waste management is the evaluation
of the performance either of each waste service sepa-
rately or of the overall procedure. Benchmarking iswidely spread in the evaluation of business performance
and recently appears to be promoted also in the evalua-
tion of public/municipal services (Her Majesty�s Gov-
ernment, 2003; Bolli and Tarcq, 2001; Accounts
Commission, 2000; Department for Environment, Food
and Rural Affairs Defra, 2000; Nilsson et al., 2001; Sme-
ets and Weterings, 1999). Benchmarking of waste ser-
vices is a tool for evaluating and comparing wasteservices of a specific municipality over time, as well as
comparing different municipalities for the same refer-
ence year. Waste charges and the resulting waste reduc-
tion can be a measure for the performance evaluation of
waste services, especially in a PAYT scheme.
2. Waste charges in Greece
Traditionally in Greece, waste collection and disposal
are the responsibility of the Local self-Government
Organizations (Hellenic Official Gazette HOG, 1958).
The involvement of the private sector in this field, espe-
cially in waste treatment, disposal and recycling services,
is increasing. This fact affects also the Hellenic waste
management process towards the global policy for sus-tainable development (OECD, 2000, 2001a,b), since
the involvement of the private sector expands the mar-
ket-based environmental policy, thus providing incen-
tives for developing and disseminating technologies, as
well as promoting local, national or/and international
collaboration.
The pricing model for waste services applied in
Greece is a flat-rate system (estimation of waste chargesaccording to the surface-area of the served property)
and waste charges are collected through the electricity
bill (HOG, 1975, 1976, 1980 and HOG, 1989). This bill-
ing and collection method of waste charges induces crit-
icism about its fairness towards citizens and certainly
does not introduce incentives for waste prevention
and/or reduction. This billing method remains in force
in Greece, due to the Hellenic Legislation which pre-determines this method, allowing only one more alterna-
tive solution-through the water bill (HOG, 1976).
Furthermore, concerning recycling, the recent financ-
ing of a cooperation scheme between industry (67%) and
Local Authorities (33%) (approved by the Ministry for
the Environment, Physical Planning and Public Works
– based on the Law 2939/2001 (HOG, 2001), harmoniza-
tion of the EC Directive 94/62/EC) constitutes a meansfor the recovery of the cost of recycling, which will addi-
tionally burden citizens through the raising of prices of
consumer goods. Concerning treatment and final dis-
posal of wastes, the responsible authority for these ac-
tions relieves the municipal authority from the waste
collected, in the same way that the municipal authority
relieves citizens from the wastes produced by them.
The financial return for treatment and final disposal iscalculated under the same concept with the correspond-
ing charging against the waste producers, in this case the
municipalities.
Waste charges in Greece are part of the municipal
charges, which also include street lighting (HOG,
1980). These municipal charges are calculated for each
real-estate property through the multiplication of the
real estates surface area by a certain coefficient (flat-ratesystem). This coefficient is the final result of an account-
ing procedure, which begins from the division of the
waste-management and street-lighting cost (forecast
each year for the following year by the municipal coun-
cil) by the total surface area of the served real estate par-
cels. This coefficient is finally specified for each property
after adjustments according to the charging policy of
each municipality (e.g., different charge among resi-dences, stores, etc.). Specifically, each municipality is
authorized to classify its real estate parcels into catego-
ries and to determine and attribute a different coefficient
to each category. The municipal charge (M) for each real
estate is calculated on an annual basis by the formula:
M ¼ C � A;
where C is the calculation coefficient (€/m2year), appli-
cable to the particular real estate, A is the surface of
the real estate (m2).
The statistical analysis of municipal charges that is
presented next in this paper focused on the calculation
coefficients and their correlations with the population
and the number of households in the correspondingmunicipality. Data on the calculation coefficients re-
ferred to the year 2002 and were provided by the Public
Power Corporation of Greece (PPC), which manages the
collection of municipal charges through the electricity
bill. Data on the number of citizens and households orig-
inated from the National Statistical Service of Greece
(1991, 2001). Each municipality informs the PPC on an
annual basis, on two charging coefficients that will beused by the PPC for the billing of the municipal charges
to its customers. These coefficients are determined every
year by the municipal council (as discussed above) and
refer to residences (Cr) and stores (Cs).
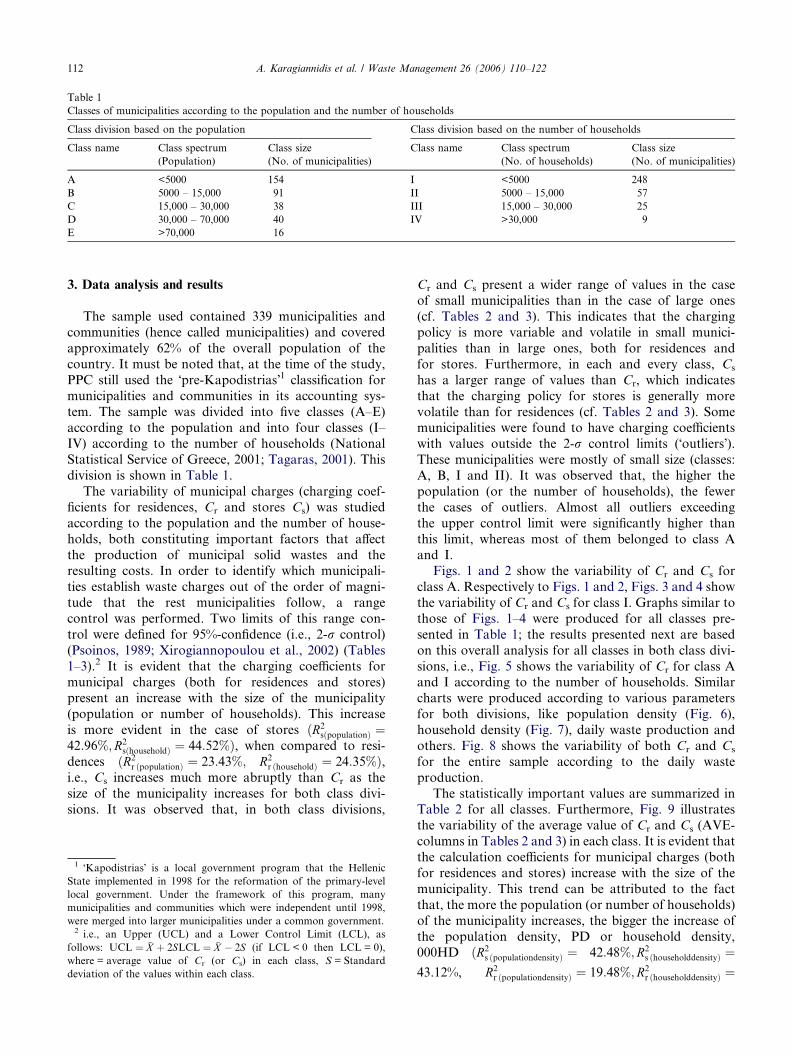
Table 1
Classes of municipalities according to the population and the number of households
Class division based on the population Class division based on the number of households
Class name Class spectrum
(Population)
Class size
(No. of municipalities)
Class name Class spectrum
(No. of households)
Class size
(No. of municipalities)
A <5000 154 I <5000 248
B 5000 – 15,000 91 II 5000 – 15,000 57
C 15,000 – 30,000 38 III 15,000 – 30,000 25
D 30,000 – 70,000 40 IV >30,000 9
E >70,000 16
112 A. Karagiannidis et al. / Waste Management 26 (2006) 110–122
3. Data analysis and results
The sample used contained 339 municipalities and
communities (hence called municipalities) and covered
approximately 62% of the overall population of the
country. It must be noted that, at the time of the study,
PPC still used the �pre-Kapodistrias�1 classification for
municipalities and communities in its accounting sys-
tem. The sample was divided into five classes (A–E)
according to the population and into four classes (I–IV) according to the number of households (National
Statistical Service of Greece, 2001; Tagaras, 2001). This
division is shown in Table 1.
The variability of municipal charges (charging coef-
ficients for residences, Cr and stores Cs) was studied
according to the population and the number of house-
holds, both constituting important factors that affect
the production of municipal solid wastes and theresulting costs. In order to identify which municipali-
ties establish waste charges out of the order of magni-
tude that the rest municipalities follow, a range
control was performed. Two limits of this range con-
trol were defined for 95%-confidence (i.e., 2-r control)
(Psoinos, 1989; Xirogiannopoulou et al., 2002) (Tables
1–3).2 It is evident that the charging coefficients for
municipal charges (both for residences and stores)present an increase with the size of the municipality
(population or number of households). This increase
is more evident in the case of stores ðR2sðpopulationÞ ¼
42:96%;R2sðhouseholdÞ ¼ 44:52%Þ, when compared to resi-
dences ðR2r ðpopulationÞ ¼ 23:43%; R2
r ðhouseholdÞ ¼ 24:35%Þ,i.e., Cs increases much more abruptly than Cr as the
size of the municipality increases for both class divi-
sions. It was observed that, in both class divisions,
1 �Kapodistrias� is a local government program that the Hellenic
State implemented in 1998 for the reformation of the primary-level
local government. Under the framework of this program, many
municipalities and communities which were independent until 1998,
were merged into larger municipalities under a common government.2 i.e., an Upper (UCL) and a Lower Control Limit (LCL), as
follows: UCL ¼ �X þ 2SLCL ¼ �X � 2S (if LCL < 0 then LCL = 0),
where = average value of Cr (or Cs) in each class, S = Standard
deviation of the values within each class.
Cr and Cs present a wider range of values in the caseof small municipalities than in the case of large ones
(cf. Tables 2 and 3). This indicates that the charging
policy is more variable and volatile in small munici-
palities than in large ones, both for residences and
for stores. Furthermore, in each and every class, Cs
has a larger range of values than Cr, which indicates
that the charging policy for stores is generally more
volatile than for residences (cf. Tables 2 and 3). Somemunicipalities were found to have charging coefficients
with values outside the 2-r control limits (�outliers�).These municipalities were mostly of small size (classes:
A, B, I and II). It was observed that, the higher the
population (or the number of households), the fewer
the cases of outliers. Almost all outliers exceeding
the upper control limit were significantly higher than
this limit, whereas most of them belonged to class Aand I.
Figs. 1 and 2 show the variability of Cr and Cs for
class A. Respectively to Figs. 1 and 2, Figs. 3 and 4 show
the variability of Cr and Cs for class I. Graphs similar to
those of Figs. 1–4 were produced for all classes pre-
sented in Table 1; the results presented next are based
on this overall analysis for all classes in both class divi-
sions, i.e., Fig. 5 shows the variability of Cr for class Aand I according to the number of households. Similar
charts were produced according to various parameters
for both divisions, like population density (Fig. 6),
household density (Fig. 7), daily waste production and
others. Fig. 8 shows the variability of both Cr and Cs
for the entire sample according to the daily waste
production.
The statistically important values are summarized inTable 2 for all classes. Furthermore, Fig. 9 illustrates
the variability of the average value of Cr and Cs (AVE-
columns in Tables 2 and 3) in each class. It is evident that
the calculation coefficients for municipal charges (both
for residences and stores) increase with the size of the
municipality. This trend can be attributed to the fact
that, the more the population (or number of households)
of the municipality increases, the bigger the increase ofthe population density, PD or household density,
000HD ðR2s ðpopulationdensityÞ ¼ 42:48%;R2
s ðhouseholddensityÞ ¼43.12%, R2
r ðpopulationdensityÞ ¼ 19:48%;R2r ðhouseholddensityÞ ¼
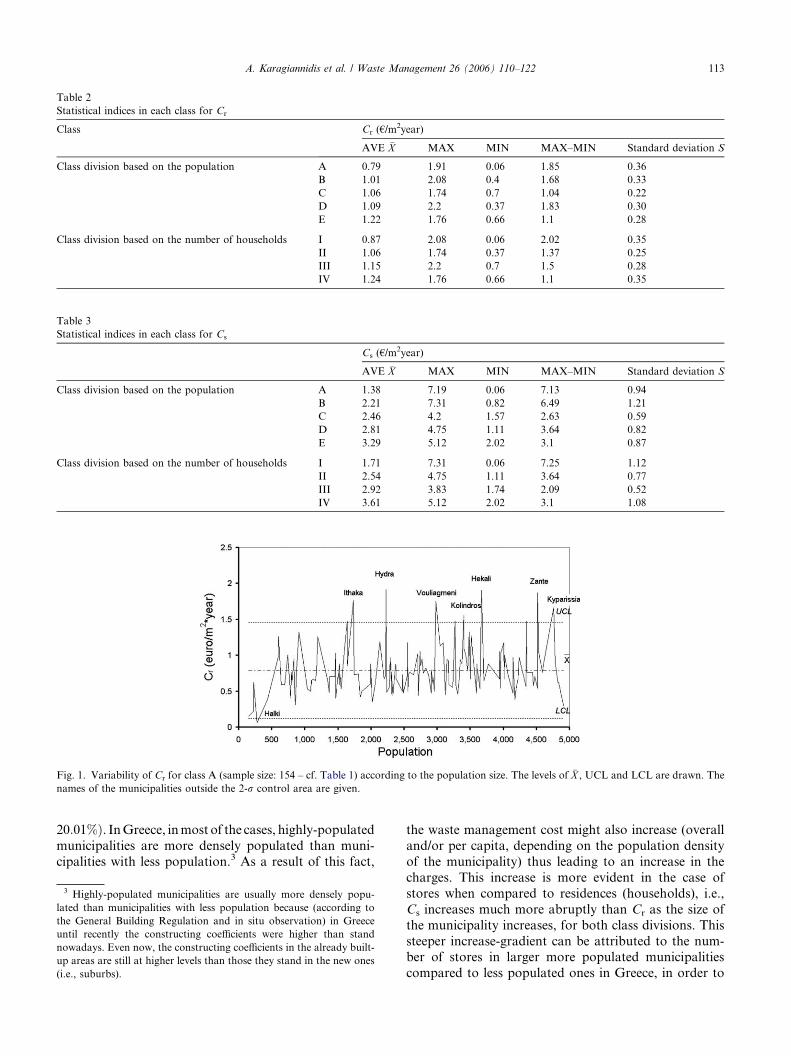
Table 3
Statistical indices in each class for Cs
Cs (€/m2year)
AVE �X MAX MIN MAX–MIN Standard deviation S
Class division based on the population A 1.38 7.19 0.06 7.13 0.94
B 2.21 7.31 0.82 6.49 1.21
C 2.46 4.2 1.57 2.63 0.59
D 2.81 4.75 1.11 3.64 0.82
E 3.29 5.12 2.02 3.1 0.87
Class division based on the number of households I 1.71 7.31 0.06 7.25 1.12
II 2.54 4.75 1.11 3.64 0.77
III 2.92 3.83 1.74 2.09 0.52
IV 3.61 5.12 2.02 3.1 1.08
Table 2
Statistical indices in each class for Cr
Class Cr (€/m2year)
AVE �X MAX MIN MAX–MIN Standard deviation S
Class division based on the population A 0.79 1.91 0.06 1.85 0.36
B 1.01 2.08 0.4 1.68 0.33
C 1.06 1.74 0.7 1.04 0.22
D 1.09 2.2 0.37 1.83 0.30
E 1.22 1.76 0.66 1.1 0.28
Class division based on the number of households I 0.87 2.08 0.06 2.02 0.35
II 1.06 1.74 0.37 1.37 0.25
III 1.15 2.2 0.7 1.5 0.28
IV 1.24 1.76 0.66 1.1 0.35
Fig. 1. Variability of Cr for class A (sample size: 154 – cf. Table 1) according to the population size. The levels of �X , UCL and LCL are drawn. The
names of the municipalities outside the 2-r control area are given.
A. Karagiannidis et al. / Waste Management 26 (2006) 110–122 113
20:01%Þ. InGreece, inmost of the cases, highly-populated
municipalities are more densely populated than muni-
cipalities with less population.3 As a result of this fact,
3 Highly-populated municipalities are usually more densely popu-
lated than municipalities with less population because (according to
the General Building Regulation and in situ observation) in Greece
until recently the constructing coefficients were higher than stand
nowadays. Even now, the constructing coefficients in the already built-
up areas are still at higher levels than those they stand in the new ones
(i.e., suburbs).
the waste management cost might also increase (overall
and/or per capita, depending on the population density
of the municipality) thus leading to an increase in the
charges. This increase is more evident in the case of
stores when compared to residences (households), i.e.,
Cs increases much more abruptly than Cr as the size of
the municipality increases, for both class divisions. This
steeper increase-gradient can be attributed to the num-ber of stores in larger more populated municipalities
compared to less populated ones in Greece, in order to
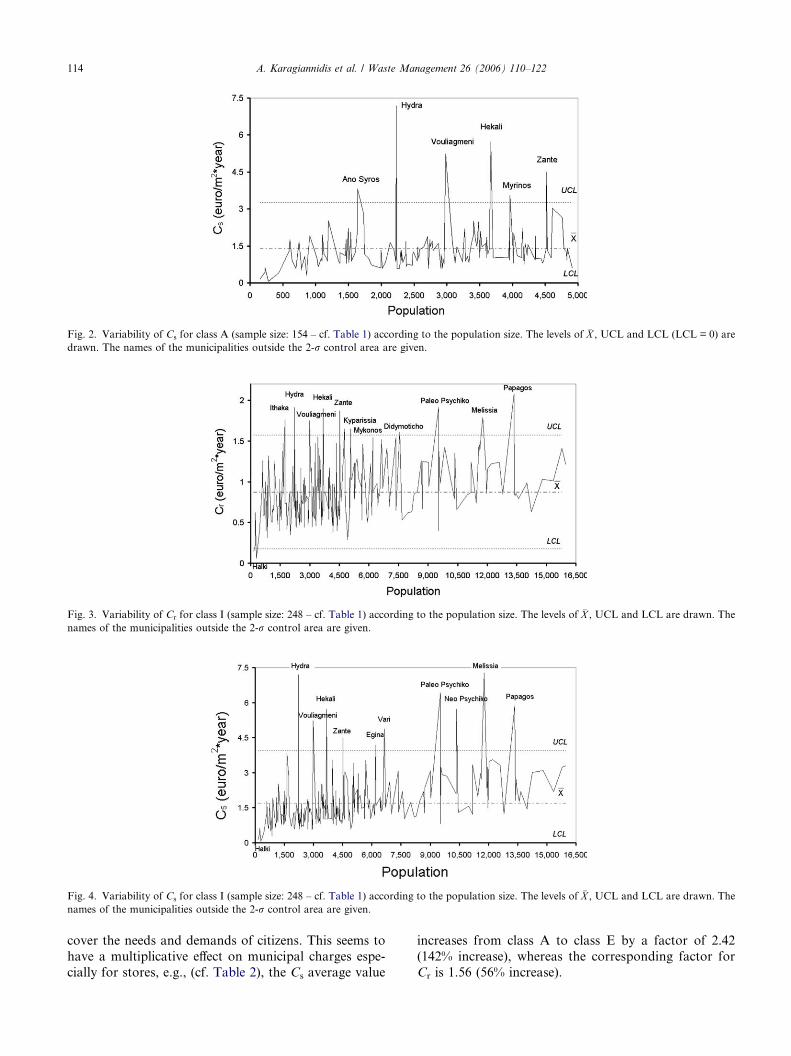
Fig. 2. Variability of Cs for class A (sample size: 154 – cf. Table 1) according to the population size. The levels of �X , UCL and LCL (LCL = 0) are
drawn. The names of the municipalities outside the 2-r control area are given.
Fig. 3. Variability of Cr for class I (sample size: 248 – cf. Table 1) according to the population size. The levels of �X , UCL and LCL are drawn. The
names of the municipalities outside the 2-r control area are given.
Fig. 4. Variability of Cs for class I (sample size: 248 – cf. Table 1) according to the population size. The levels of �X , UCL and LCL are drawn. The
names of the municipalities outside the 2-r control area are given.
114 A. Karagiannidis et al. / Waste Management 26 (2006) 110–122
cover the needs and demands of citizens. This seems to
have a multiplicative effect on municipal charges espe-
cially for stores, e.g., (cf. Table 2), the Cs average value
increases from class A to class E by a factor of 2.42
(142% increase), whereas the corresponding factor for
Cr is 1.56 (56% increase).
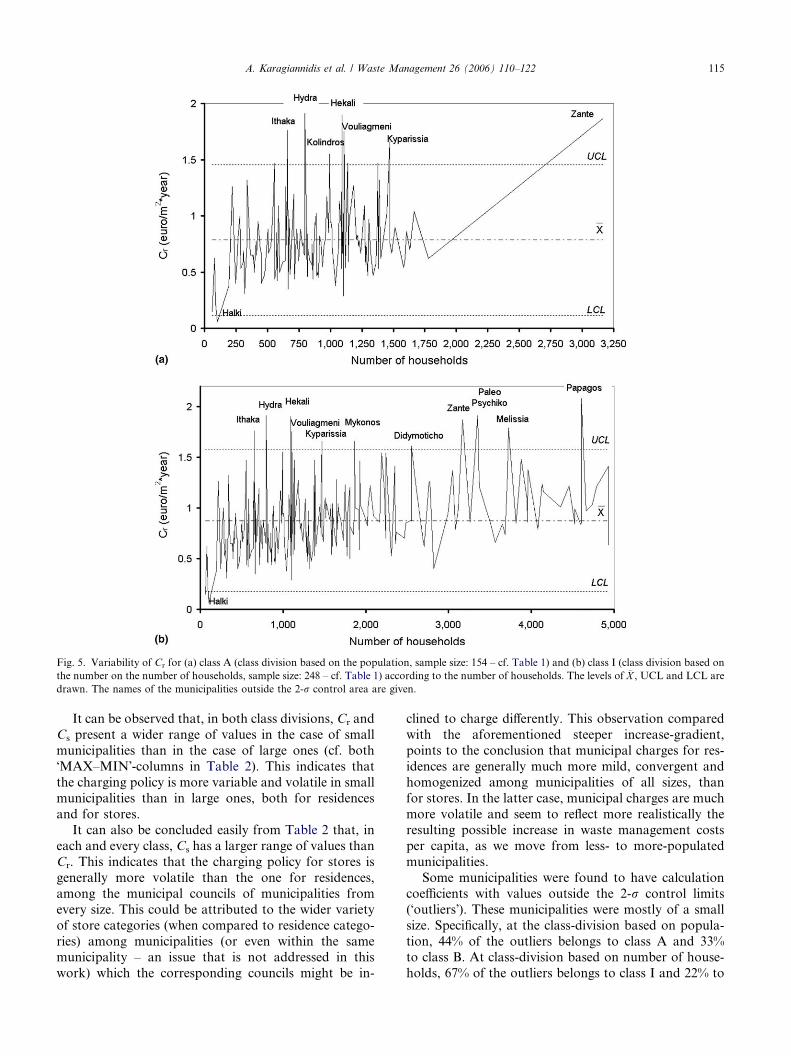
Fig. 5. Variability of Cr for (a) class A (class division based on the population, sample size: 154 – cf. Table 1) and (b) class I (class division based on
the number on the number of households, sample size: 248 – cf. Table 1) according to the number of households. The levels of �X , UCL and LCL are
drawn. The names of the municipalities outside the 2-r control area are given.
A. Karagiannidis et al. / Waste Management 26 (2006) 110–122 115
It can be observed that, in both class divisions, Cr and
Cs present a wider range of values in the case of small
municipalities than in the case of large ones (cf. both
�MAX–MIN�-columns in Table 2). This indicates that
the charging policy is more variable and volatile in small
municipalities than in large ones, both for residences
and for stores.It can also be concluded easily from Table 2 that, in
each and every class, Cs has a larger range of values than
Cr. This indicates that the charging policy for stores is
generally more volatile than the one for residences,
among the municipal councils of municipalities from
every size. This could be attributed to the wider variety
of store categories (when compared to residence catego-
ries) among municipalities (or even within the samemunicipality – an issue that is not addressed in this
work) which the corresponding councils might be in-
clined to charge differently. This observation compared
with the aforementioned steeper increase-gradient,
points to the conclusion that municipal charges for res-
idences are generally much more mild, convergent and
homogenized among municipalities of all sizes, than
for stores. In the latter case, municipal charges are much
more volatile and seem to reflect more realistically theresulting possible increase in waste management costs
per capita, as we move from less- to more-populated
municipalities.
Some municipalities were found to have calculation
coefficients with values outside the 2-r control limits
(�outliers�). These municipalities were mostly of a small
size. Specifically, at the class-division based on popula-
tion, 44% of the outliers belongs to class A and 33%to class B. At class-division based on number of house-
holds, 67% of the outliers belongs to class I and 22% to
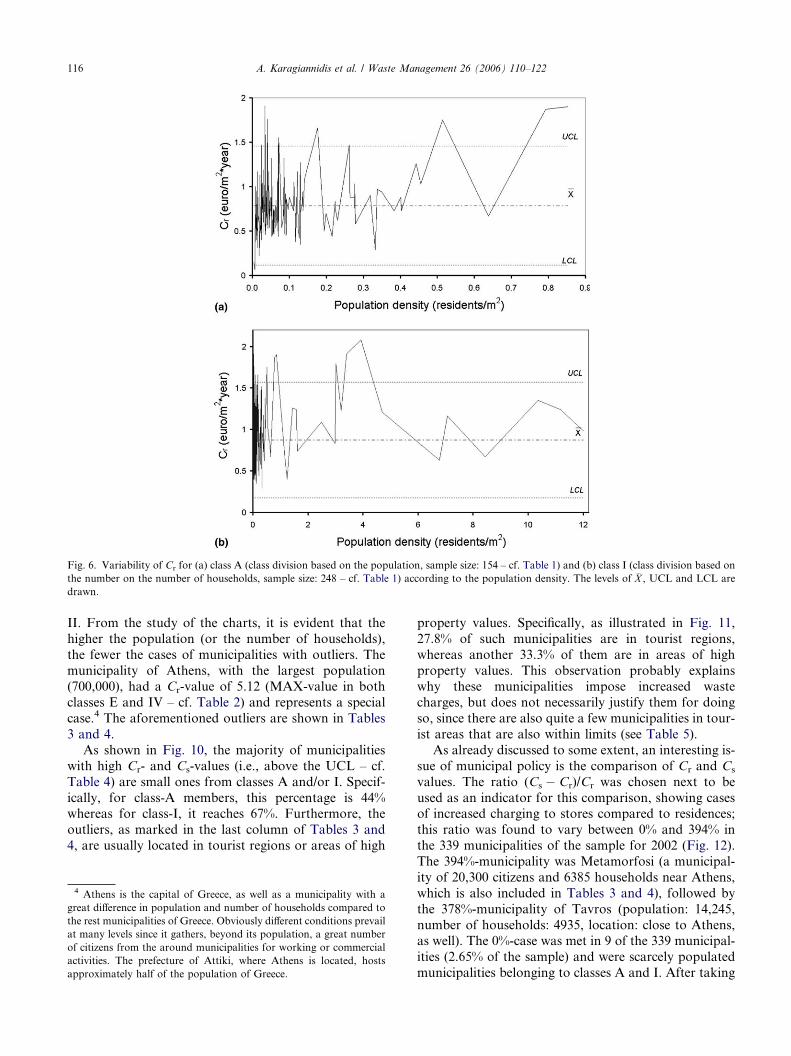
Fig. 6. Variability of Cr for (a) class A (class division based on the population, sample size: 154 – cf. Table 1) and (b) class I (class division based on
the number on the number of households, sample size: 248 – cf. Table 1) according to the population density. The levels of �X , UCL and LCL are
drawn.
116 A. Karagiannidis et al. / Waste Management 26 (2006) 110–122
II. From the study of the charts, it is evident that the
higher the population (or the number of households),
the fewer the cases of municipalities with outliers. The
municipality of Athens, with the largest population(700,000), had a Cr-value of 5.12 (MAX-value in both
classes E and IV – cf. Table 2) and represents a special
case.4 The aforementioned outliers are shown in Tables
3 and 4.
As shown in Fig. 10, the majority of municipalities
with high Cr- and Cs-values (i.e., above the UCL – cf.
Table 4) are small ones from classes A and/or I. Specif-
ically, for class-A members, this percentage is 44%whereas for class-I, it reaches 67%. Furthermore, the
outliers, as marked in the last column of Tables 3 and
4, are usually located in tourist regions or areas of high
4 Athens is the capital of Greece, as well as a municipality with a
great difference in population and number of households compared to
the rest municipalities of Greece. Obviously different conditions prevail
at many levels since it gathers, beyond its population, a great number
of citizens from the around municipalities for working or commercial
activities. The prefecture of Attiki, where Athens is located, hosts
approximately half of the population of Greece.
property values. Specifically, as illustrated in Fig. 11,
27.8% of such municipalities are in tourist regions,
whereas another 33.3% of them are in areas of high
property values. This observation probably explainswhy these municipalities impose increased waste
charges, but does not necessarily justify them for doing
so, since there are also quite a few municipalities in tour-
ist areas that are also within limits (see Table 5).
As already discussed to some extent, an interesting is-
sue of municipal policy is the comparison of Cr and Cs
values. The ratio (Cs � Cr)/Cr was chosen next to be
used as an indicator for this comparison, showing casesof increased charging to stores compared to residences;
this ratio was found to vary between 0% and 394% in
the 339 municipalities of the sample for 2002 (Fig. 12).
The 394%-municipality was Metamorfosi (a municipal-
ity of 20,300 citizens and 6385 households near Athens,
which is also included in Tables 3 and 4), followed by
the 378%-municipality of Tavros (population: 14,245,
number of households: 4935, location: close to Athens,as well). The 0%-case was met in 9 of the 339 municipal-
ities (2.65% of the sample) and were scarcely populated
municipalities belonging to classes A and I. After taking
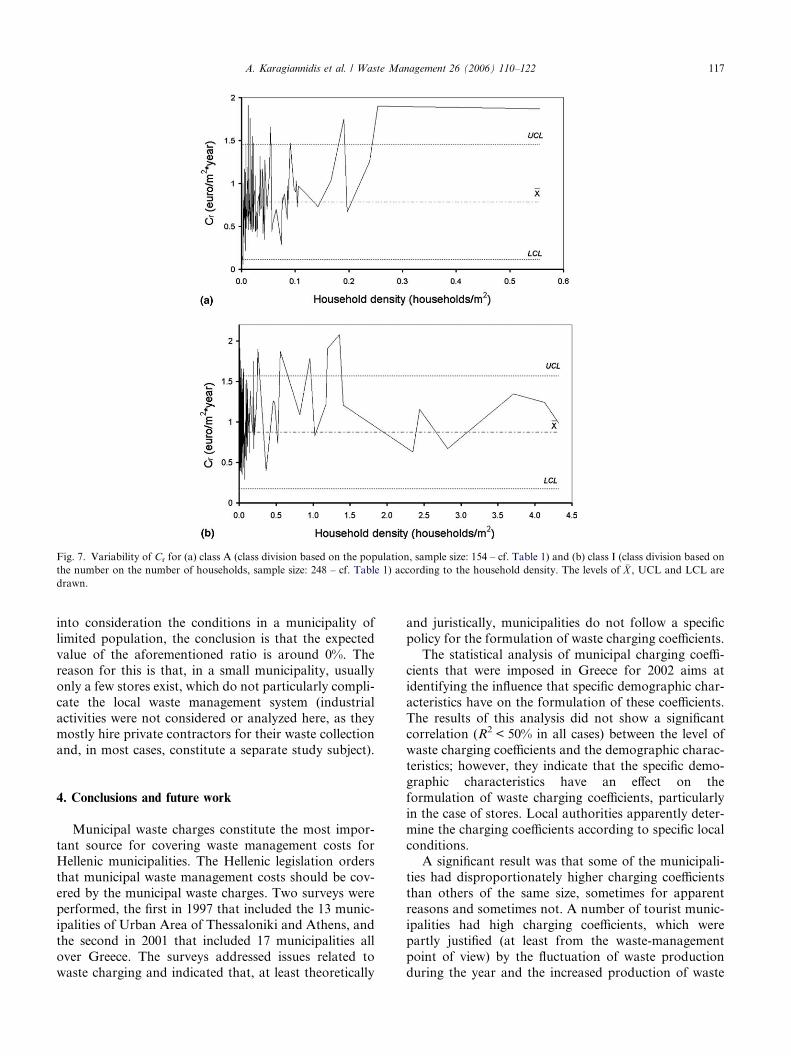
Fig. 7. Variability of Cr for (a) class A (class division based on the population, sample size: 154 – cf. Table 1) and (b) class I (class division based on
the number on the number of households, sample size: 248 – cf. Table 1) according to the household density. The levels of �X , UCL and LCL are
drawn.
A. Karagiannidis et al. / Waste Management 26 (2006) 110–122 117
into consideration the conditions in a municipality of
limited population, the conclusion is that the expected
value of the aforementioned ratio is around 0%. The
reason for this is that, in a small municipality, usually
only a few stores exist, which do not particularly compli-
cate the local waste management system (industrial
activities were not considered or analyzed here, as theymostly hire private contractors for their waste collection
and, in most cases, constitute a separate study subject).
4. Conclusions and future work
Municipal waste charges constitute the most impor-
tant source for covering waste management costs forHellenic municipalities. The Hellenic legislation orders
that municipal waste management costs should be cov-
ered by the municipal waste charges. Two surveys were
performed, the first in 1997 that included the 13 munic-
ipalities of Urban Area of Thessaloniki and Athens, and
the second in 2001 that included 17 municipalities all
over Greece. The surveys addressed issues related to
waste charging and indicated that, at least theoretically
and juristically, municipalities do not follow a specific
policy for the formulation of waste charging coefficients.
The statistical analysis of municipal charging coeffi-
cients that were imposed in Greece for 2002 aims at
identifying the influence that specific demographic char-
acteristics have on the formulation of these coefficients.
The results of this analysis did not show a significantcorrelation (R2 < 50% in all cases) between the level of
waste charging coefficients and the demographic charac-
teristics; however, they indicate that the specific demo-
graphic characteristics have an effect on the
formulation of waste charging coefficients, particularly
in the case of stores. Local authorities apparently deter-
mine the charging coefficients according to specific local
conditions.A significant result was that some of the municipali-
ties had disproportionately higher charging coefficients
than others of the same size, sometimes for apparent
reasons and sometimes not. A number of tourist munic-
ipalities had high charging coefficients, which were
partly justified (at least from the waste-management
point of view) by the fluctuation of waste production
during the year and the increased production of waste
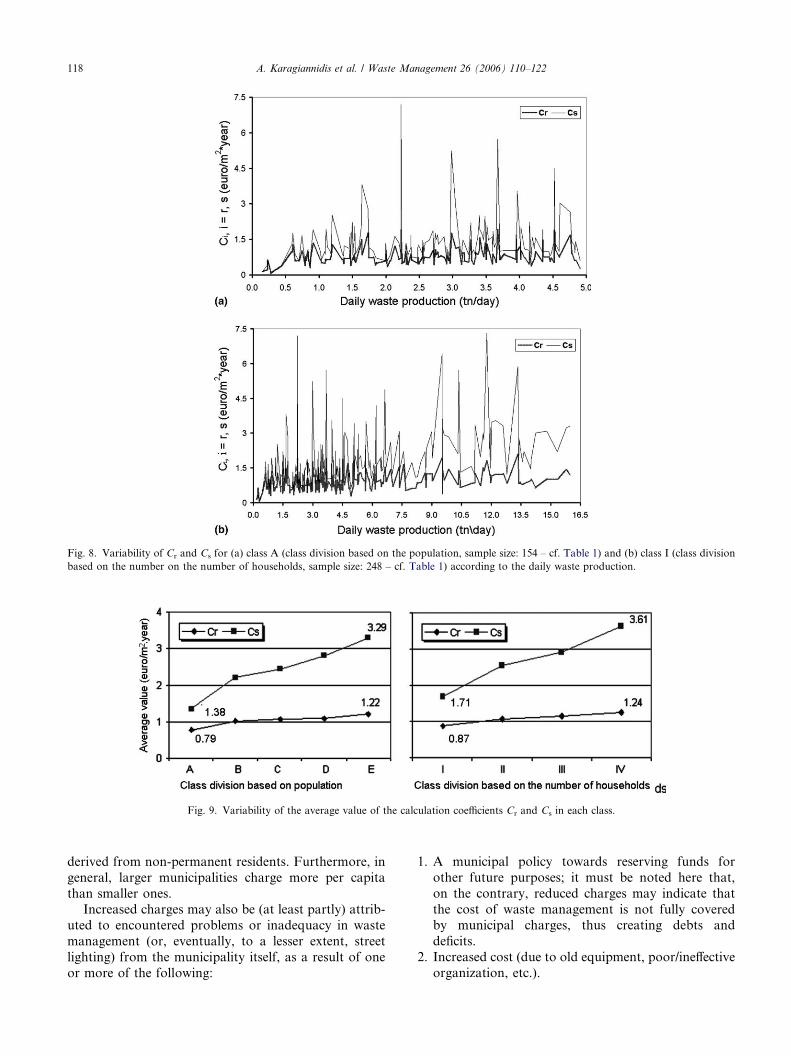
Fig. 8. Variability of Cr and Cs for (a) class A (class division based on the population, sample size: 154 – cf. Table 1) and (b) class I (class division
based on the number on the number of households, sample size: 248 – cf. Table 1) according to the daily waste production.
Fig. 9. Variability of the average value of the calculation coefficients Cr and Cs in each class.
118 A. Karagiannidis et al. / Waste Management 26 (2006) 110–122
derived from non-permanent residents. Furthermore, in
general, larger municipalities charge more per capita
than smaller ones.Increased charges may also be (at least partly) attrib-
uted to encountered problems or inadequacy in waste
management (or, eventually, to a lesser extent, street
lighting) from the municipality itself, as a result of one
or more of the following:
1. A municipal policy towards reserving funds for
other future purposes; it must be noted here that,
on the contrary, reduced charges may indicate that
the cost of waste management is not fully coveredby municipal charges, thus creating debts and
deficits.
2. Increased cost (due to old equipment, poor/ineffective
organization, etc.).
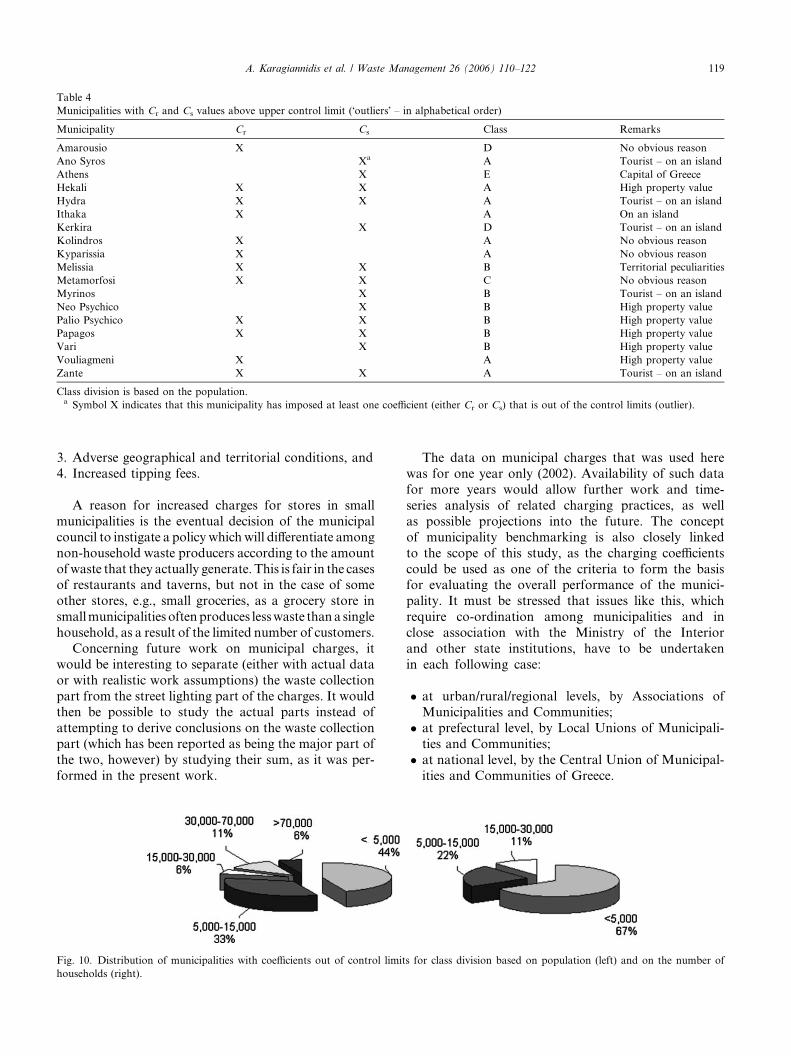
Table 4
Municipalities with Cr and Cs values above upper control limit (�outliers� – in alphabetical order)
Municipality Cr Cs Class Remarks
Amarousio X D No obvious reason
Ano Syros Xa A Tourist – on an island
Athens X E Capital of Greece
Hekali X X A High property value
Hydra X X A Tourist – on an island
Ithaka X A On an island
Kerkira X D Tourist – on an island
Kolindros X A No obvious reason
Kyparissia X A No obvious reason
Melissia X X B Territorial peculiarities
Metamorfosi X X C No obvious reason
Myrinos X B Tourist – on an island
Neo Psychico X B High property value
Palio Psychico X X B High property value
Papagos X X B High property value
Vari X B High property value
Vouliagmeni X A High property value
Zante X X A Tourist – on an island
Class division is based on the population.a Symbol X indicates that this municipality has imposed at least one coefficient (either Cr or Cs) that is out of the control limits (outlier).
A. Karagiannidis et al. / Waste Management 26 (2006) 110–122 119
3. Adverse geographical and territorial conditions, and
4. Increased tipping fees.
A reason for increased charges for stores in small
municipalities is the eventual decision of the municipal
council to instigate a policy which will differentiate among
non-household waste producers according to the amount
ofwaste that they actually generate. This is fair in the casesof restaurants and taverns, but not in the case of some
other stores, e.g., small groceries, as a grocery store in
smallmunicipalities oftenproduces lesswaste than a single
household, as a result of the limited number of customers.
Concerning future work on municipal charges, it
would be interesting to separate (either with actual data
or with realistic work assumptions) the waste collection
part from the street lighting part of the charges. It wouldthen be possible to study the actual parts instead of
attempting to derive conclusions on the waste collection
part (which has been reported as being the major part of
the two, however) by studying their sum, as it was per-
formed in the present work.
Fig. 10. Distribution of municipalities with coefficients out of control limit
households (right).
The data on municipal charges that was used here
was for one year only (2002). Availability of such data
for more years would allow further work and time-
series analysis of related charging practices, as well
as possible projections into the future. The concept
of municipality benchmarking is also closely linked
to the scope of this study, as the charging coefficients
could be used as one of the criteria to form the basisfor evaluating the overall performance of the munici-
pality. It must be stressed that issues like this, which
require co-ordination among municipalities and in
close association with the Ministry of the Interior
and other state institutions, have to be undertaken
in each following case:
� at urban/rural/regional levels, by Associations ofMunicipalities and Communities;
� at prefectural level, by Local Unions of Municipali-
ties and Communities;
� at national level, by the Central Union of Municipal-
ities and Communities of Greece.
s for class division based on population (left) and on the number of
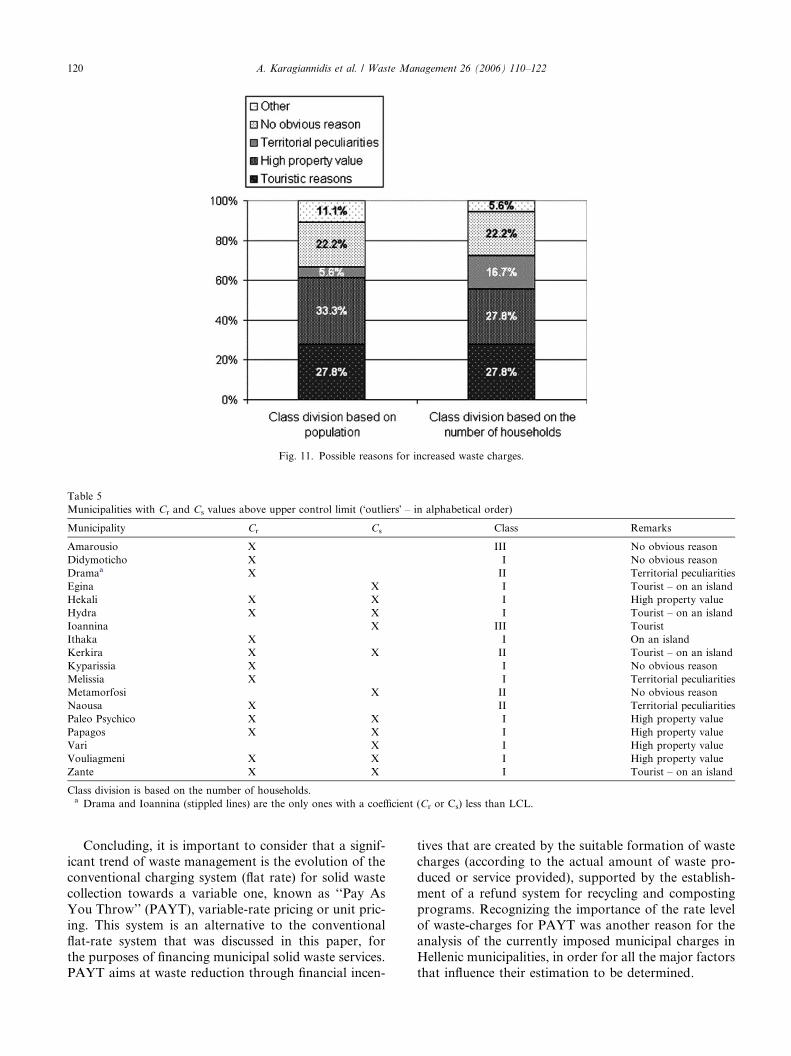
Fig. 11. Possible reasons for increased waste charges.
Table 5
Municipalities with Cr and Cs values above upper control limit (�outliers� – in alphabetical order)
Municipality Cr Cs Class Remarks
Amarousio X III No obvious reason
Didymoticho X I No obvious reason
Dramaa X II Territorial peculiarities
Egina X I Tourist – on an island
Hekali X X I High property value
Hydra X X I Tourist – on an island
Ioannina X III Tourist
Ithaka X I On an island
Kerkira X X II Tourist – on an island
Kyparissia X I No obvious reason
Melissia X I Territorial peculiarities
Metamorfosi X II No obvious reason
Naousa X II Territorial peculiarities
Paleo Psychico X X I High property value
Papagos X X I High property value
Vari X I High property value
Vouliagmeni X X I High property value
Zante X X I Tourist – on an island
Class division is based on the number of households.a Drama and Ioannina (stippled lines) are the only ones with a coefficient (Cr or Cs) less than LCL.
120 A. Karagiannidis et al. / Waste Management 26 (2006) 110–122
Concluding, it is important to consider that a signif-
icant trend of waste management is the evolution of the
conventional charging system (flat rate) for solid waste
collection towards a variable one, known as ‘‘Pay As
You Throw’’ (PAYT), variable-rate pricing or unit pric-
ing. This system is an alternative to the conventionalflat-rate system that was discussed in this paper, for
the purposes of financing municipal solid waste services.
PAYT aims at waste reduction through financial incen-
tives that are created by the suitable formation of waste
charges (according to the actual amount of waste pro-
duced or service provided), supported by the establish-
ment of a refund system for recycling and composting
programs. Recognizing the importance of the rate level
of waste-charges for PAYT was another reason for theanalysis of the currently imposed municipal charges in
Hellenic municipalities, in order for all the major factors
that influence their estimation to be determined.
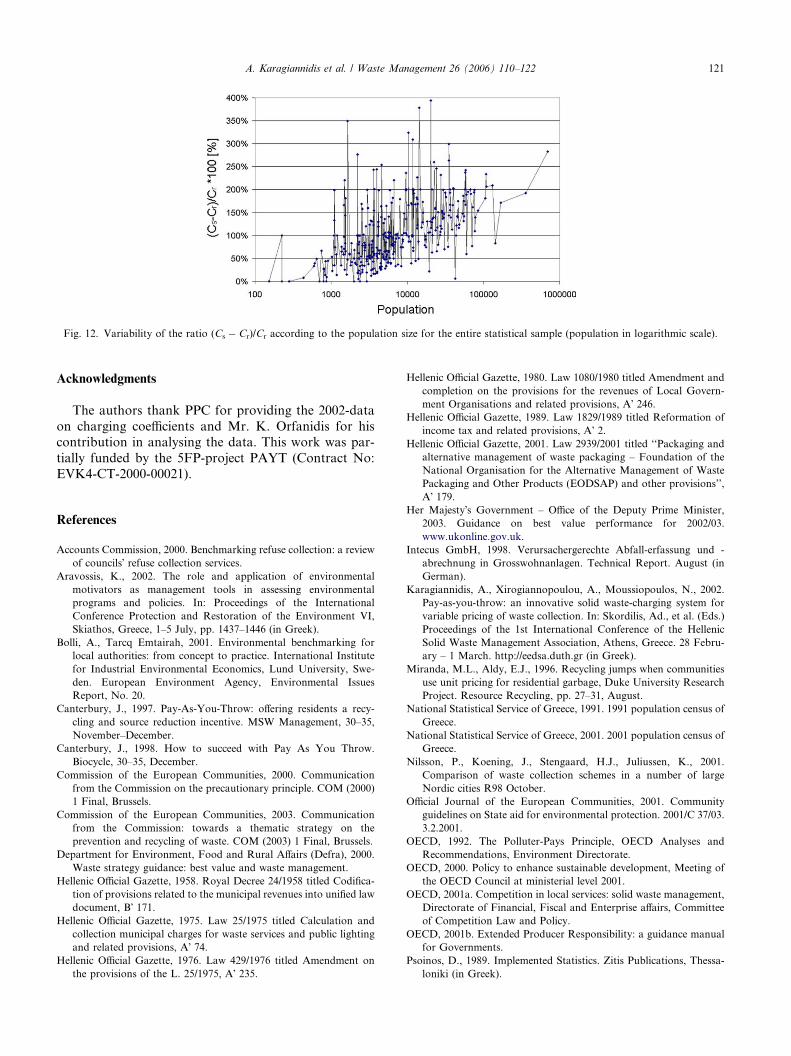
Fig. 12. Variability of the ratio (Cs � Cr)/Cr according to the population size for the entire statistical sample (population in logarithmic scale).
A. Karagiannidis et al. / Waste Management 26 (2006) 110–122 121
Acknowledgments
The authors thank PPC for providing the 2002-data
on charging coefficients and Mr. K. Orfanidis for hiscontribution in analysing the data. This work was par-
tially funded by the 5FP-project PAYT (Contract No:
EVK4-CT-2000-00021).
References
Accounts Commission, 2000. Benchmarking refuse collection: a review
of councils� refuse collection services.
Aravossis, K., 2002. The role and application of environmental
motivators as management tools in assessing environmental
programs and policies. In: Proceedings of the International
Conference Protection and Restoration of the Environment VI,
Skiathos, Greece, 1–5 July, pp. 1437–1446 (in Greek).
Bolli, A., Tarcq Emtairah, 2001. Environmental benchmarking for
local authorities: from concept to practice. International Institute
for Industrial Environmental Economics, Lund University, Swe-
den. European Environment Agency, Environmental Issues
Report, No. 20.
Canterbury, J., 1997. Pay-As-You-Throw: offering residents a recy-
cling and source reduction incentive. MSW Management, 30–35,
November–December.
Canterbury, J., 1998. How to succeed with Pay As You Throw.
Biocycle, 30–35, December.
Commission of the European Communities, 2000. Communication
from the Commission on the precautionary principle. COM (2000)
1 Final, Brussels.
Commission of the European Communities, 2003. Communication
from the Commission: towards a thematic strategy on the
prevention and recycling of waste. COM (2003) 1 Final, Brussels.
Department for Environment, Food and Rural Affairs (Defra), 2000.
Waste strategy guidance: best value and waste management.
Hellenic Official Gazette, 1958. Royal Decree 24/1958 titled Codifica-
tion of provisions related to the municipal revenues into unified law
document, B� 171.Hellenic Official Gazette, 1975. Law 25/1975 titled Calculation and
collection municipal charges for waste services and public lighting
and related provisions, A� 74.Hellenic Official Gazette, 1976. Law 429/1976 titled Amendment on
the provisions of the L. 25/1975, A� 235.
Hellenic Official Gazette, 1980. Law 1080/1980 titled Amendment and
completion on the provisions for the revenues of Local Govern-
ment Organisations and related provisions, A� 246.Hellenic Official Gazette, 1989. Law 1829/1989 titled Reformation of
income tax and related provisions, A� 2.Hellenic Official Gazette, 2001. Law 2939/2001 titled ‘‘Packaging and
alternative management of waste packaging – Foundation of the
National Organisation for the Alternative Management of Waste
Packaging and Other Products (EODSAP) and other provisions’’,
A� 179.Her Majesty�s Government – Office of the Deputy Prime Minister,
2003. Guidance on best value performance for 2002/03.
www.ukonline.gov.uk.
Intecus GmbH, 1998. Verursachergerechte Abfall-erfassung und -
abrechnung in Grosswohnanlagen. Technical Report. August (in
German).
Karagiannidis, A., Xirogiannopoulou, A., Moussiopoulos, N., 2002.
Pay-as-you-throw: an innovative solid waste-charging system for
variable pricing of waste collection. In: Skordilis, Ad., et al. (Eds.)
Proceedings of the 1st International Conference of the Hellenic
Solid Waste Management Association, Athens, Greece. 28 Febru-
ary – 1 March. http://eedsa.duth.gr (in Greek).
Miranda, M.L., Aldy, E.J., 1996. Recycling jumps when communities
use unit pricing for residential garbage, Duke University Research
Project. Resource Recycling, pp. 27–31, August.
National Statistical Service of Greece, 1991. 1991 population census of
Greece.
National Statistical Service of Greece, 2001. 2001 population census of
Greece.
Nilsson, P., Koening, J., Stengaard, H.J., Juliussen, K., 2001.
Comparison of waste collection schemes in a number of large
Nordic cities R98 October.
Official Journal of the European Communities, 2001. Community
guidelines on State aid for environmental protection. 2001/C 37/03.
3.2.2001.
OECD, 1992. The Polluter-Pays Principle, OECD Analyses and
Recommendations, Environment Directorate.
OECD, 2000. Policy to enhance sustainable development, Meeting of
the OECD Council at ministerial level 2001.
OECD, 2001a. Competition in local services: solid waste management,
Directorate of Financial, Fiscal and Enterprise affairs, Committee
of Competition Law and Policy.
OECD, 2001b. Extended Producer Responsibility: a guidance manual
for Governments.
Psoinos, D., 1989. Implemented Statistics. Zitis Publications, Thessa-
loniki (in Greek).

122 A. Karagiannidis et al. / Waste Management 26 (2006) 110–122
Skumatz, L.A., Truitt, E., Green, J., 1997. The state of variable rates:
economic signals move into the mainstream. Resource Recycling,
29–35, August.
Smeets, E., Weterings, R., 1999. Environmental Indicators: typology
and overview. European Environment Agency. Technical Report,
No. 25.
Tagaras, G., 2001. Statistical Quality Control. Zitis Publications,
Thessaloniki (in Greek).
www.payt.net, Official website of the PAYT Project, A Joint
Research Project funded by the European Commission under
the environmental component Energy, Environment and Sus-
tainable Development, within the Fifth Framework
Programme.
Xirogiannopoulou, A., Karagiannidis, A., Moussiopoulos, N., 2002.
AUTh Consolidated Report. DG Research, 5FP-Project PAYT.
In: 4th Working Meeting: Dresden. 7–9 November.