Embed Size (px)
Citation preview
EN EN
EUROPEAN COMMISSION
Brussels, 11.10.2021
SWD(2021) 1001 final
PART 8/38
COMMISSION STAFF WORKING DOCUMENT
Accompanying the document
REPORT FROM THE COMMISSION TO THE COUNCIL AND THE EUROPEAN
PARLIAMENT
on the implementation of Council Directive 91/676/EEC concerning the protection of
waters against pollution caused by nitrates from agricultural sources based on Member
State reports for the period 2016–2019
{COM(2021) 1000 final}

111
4. COUNTRY FICHES
112
AUSTRIA FICHE
Pressure from Agriculture
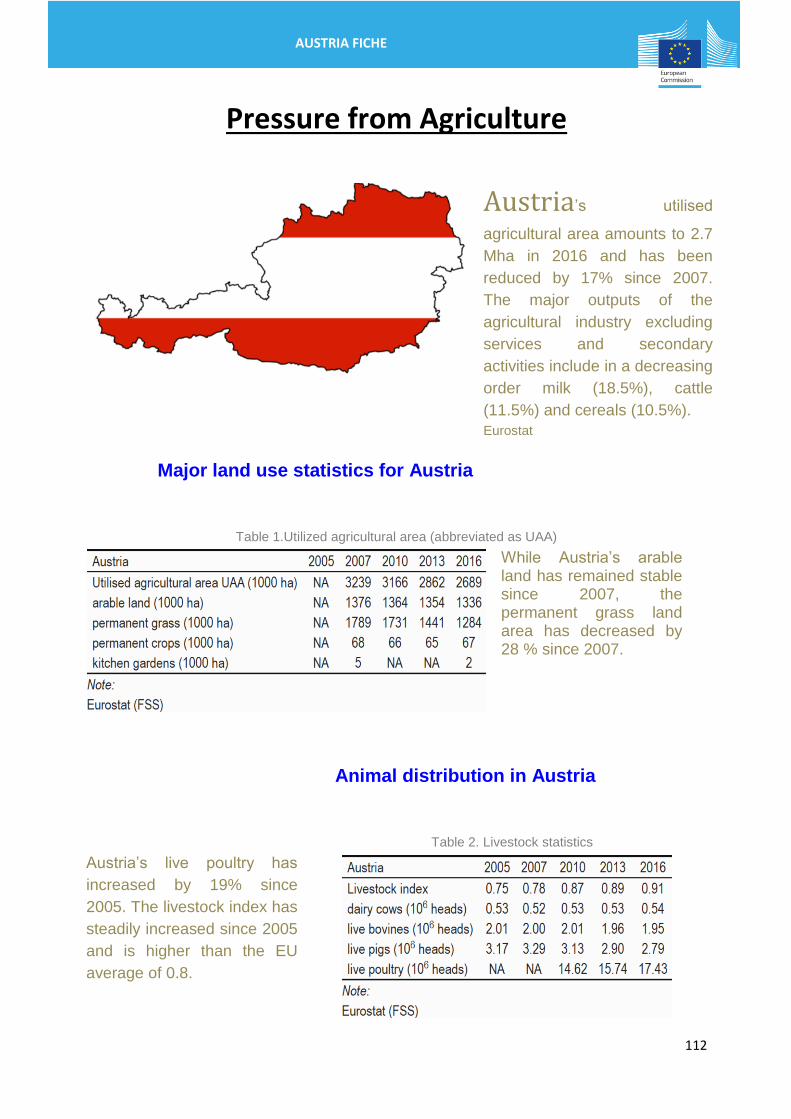
Austria’s utilised
agricultural area amounts to 2.7
Mha in 2016 and has been
reduced by 17% since 2007.
The major outputs of the
agricultural industry excluding
services and secondary
activities include in a decreasing
order milk (18.5%), cattle
(11.5%) and cereals (10.5%).
Eurostat
Major land use statistics for Austria
Table 1.Utilized agricultural area (abbreviated as UAA)
While Austria’s arable land has remained stable since 2007, the permanent grass land area has decreased by 28 % since 2007.
Animal distribution in Austria
Austria’s live poultry has
increased by 19% since
2005. The livestock index has
steadily increased since 2005
and is higher than the EU
average of 0.8.
Table 2. Livestock statistics
113
AUSTRIA FICHE
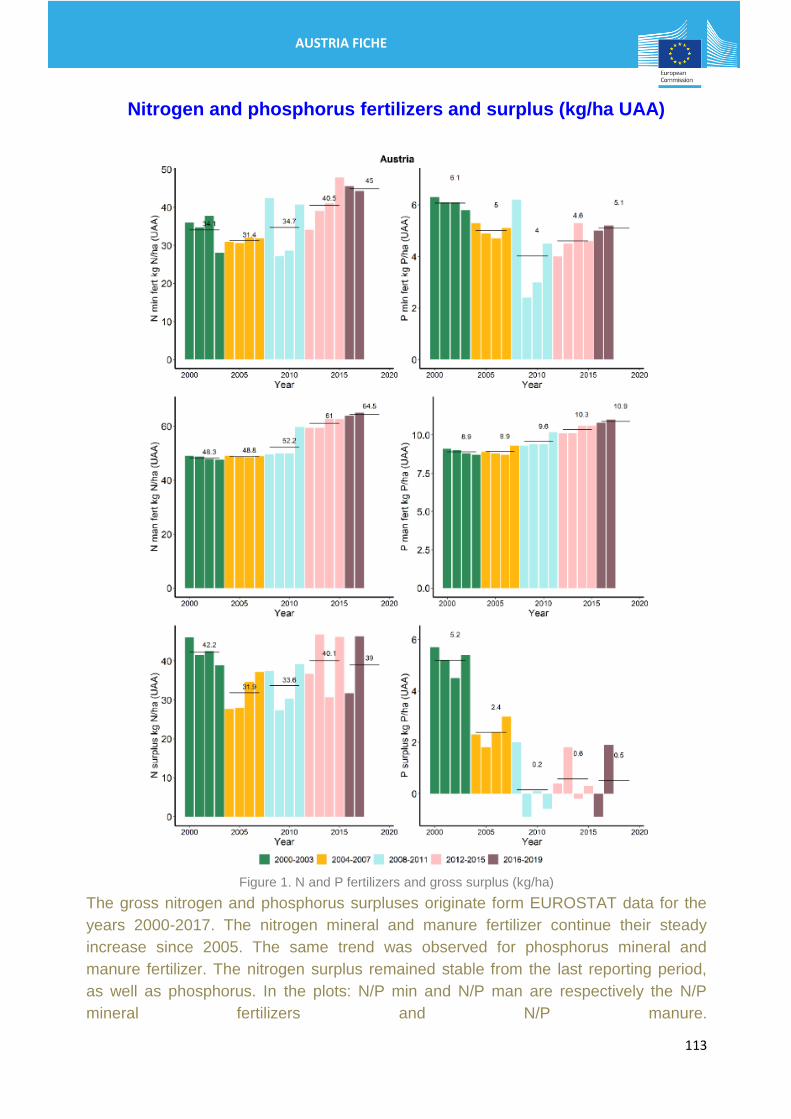
Nitrogen and phosphorus fertilizers and surplus (kg/ha UAA)
Figure 1. N and P fertilizers and gross surplus (kg/ha)
The gross nitrogen and phosphorus surpluses originate form EUROSTAT data for the
years 2000-2017. The nitrogen mineral and manure fertilizer continue their steady
increase since 2005. The same trend was observed for phosphorus mineral and
manure fertilizer. The nitrogen surplus remained stable from the last reporting period,
as well as phosphorus. In the plots: N/P min and N/P man are respectively the N/P
mineral fertilizers and N/P manure.
114
AUSTRIA FICHE
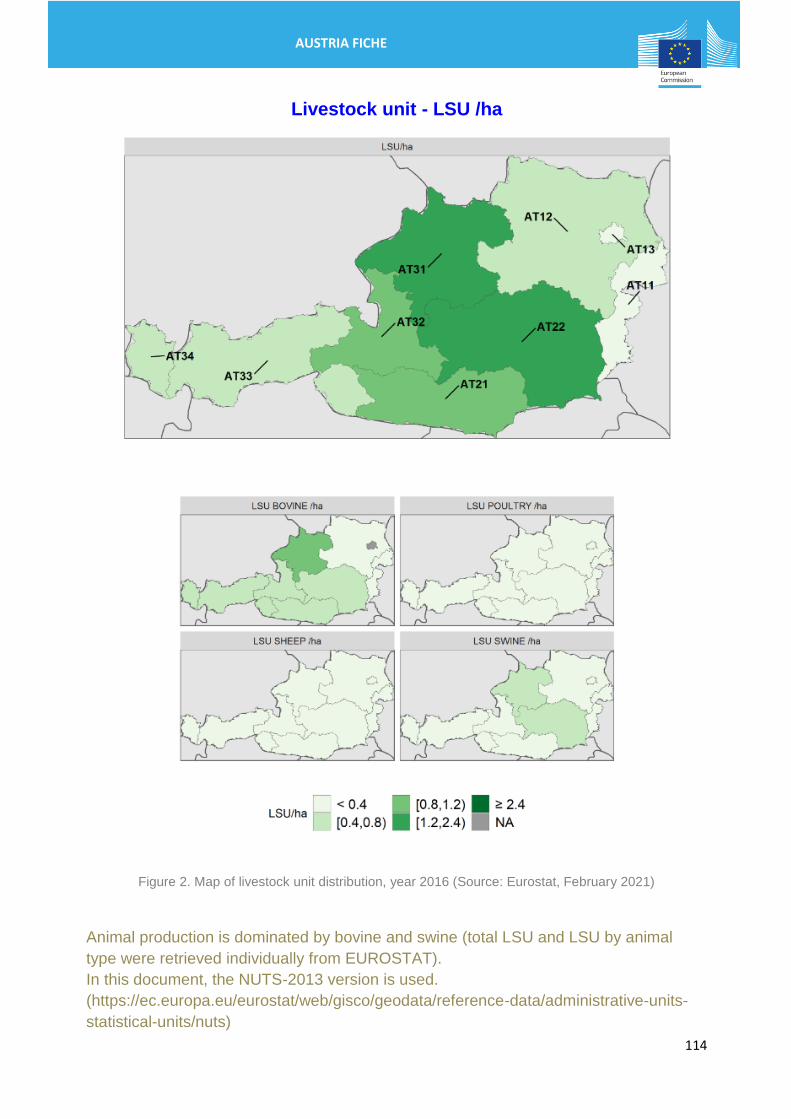
Livestock unit - LSU /ha
Figure 2. Map of livestock unit distribution, year 2016 (Source: Eurostat, February 2021)
Animal production is dominated by bovine and swine (total LSU and LSU by animal
type were retrieved individually from EUROSTAT).
In this document, the NUTS-2013 version is used.
(https://ec.europa.eu/eurostat/web/gisco/geodata/reference-data/administrative-units-
statistical-units/nuts)
115
AUSTRIA FICHE
Water Quality Monitoring
Austria maintains three types of monitoring stations including Surveillance, Operative
and Investigative monitoring, all with a different aim. As from 2016, new surveillance
sampling sites are being monitored to better cover smaller catchment areas and
bioregions/types not sufficiently covered previously. Surveillance and operative
monitoring are implemented nationwide while investigative monitoring is carried out on
an ad hoc basis under the provincial governor’s water supervisory responsibility. At the
surveillance sampling sites, the entire available range of parameters, general physical
and chemical parameters, are measured continuously on a monthly basis. For the
operative monitoring quality elements with highest sensitivity in terms of respective
pressure are measured. General physical and chemical parameters are measured on a
monthly basis over a 1-year period, whereas biological parameters are examined only
once a year. The chemical status of groundwater is measured in all groundwater
bodies. Sampling is carried out with comprehensive set of parameters at regular
intervals up to four times a year. For groundwater bodies not in a good chemical status
an operative monitoring is conducted after the first year of surveillance monitoring
including a set of parameters indicative for the respective pressure until the
groundwater body achieves a good chemical status.
For groundwater measurements, some stations have same coordinates due to different
depths. In this case, the average values cover different measurements in time, but also
location. In maps providing the spatial distribution of monitoring points, it is not possible
to distinguish stations with the same coordinates: for NO3 concentration, the average
value is shown; for trends and trophic status the worst case was considered.
It is noteworthy that in some cases in the bar charts the total value can differ from 100%
due to rounding errors.
116
AUSTRIA FICHE
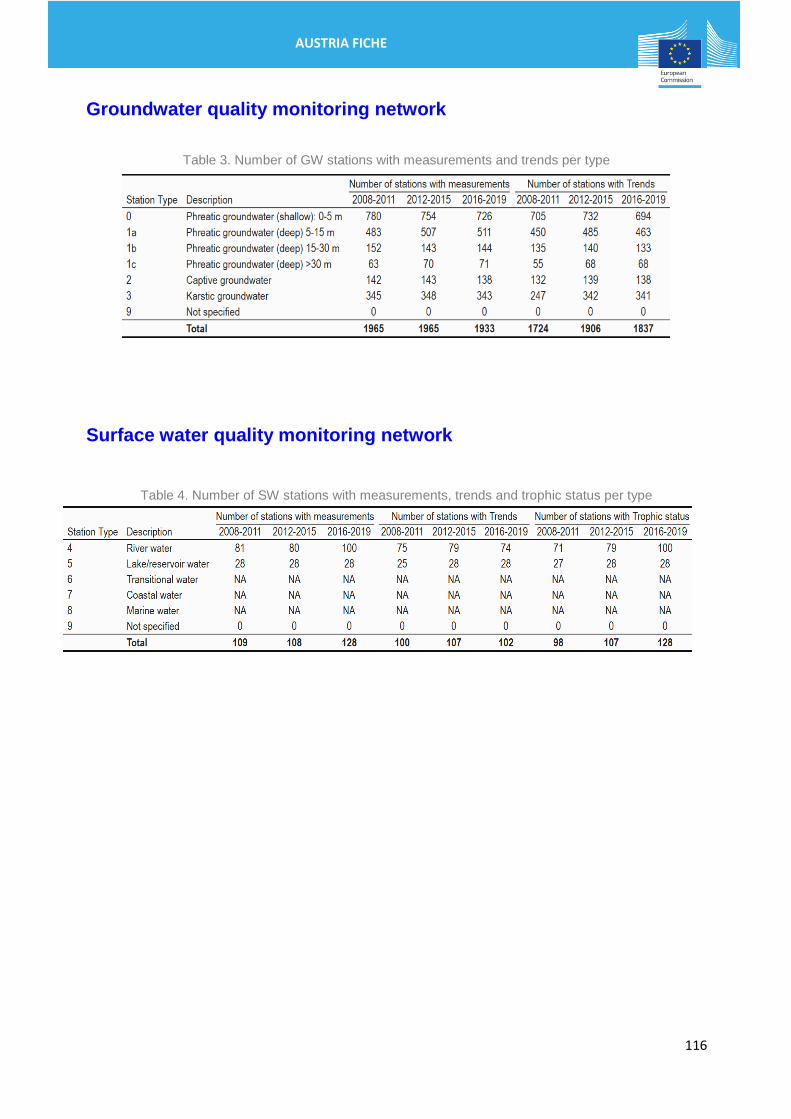
Groundwater quality monitoring network
Table 3. Number of GW stations with measurements and trends per type
Surface water quality monitoring network
Table 4. Number of SW stations with measurements, trends and trophic status per type
117
AUSTRIA FICHE
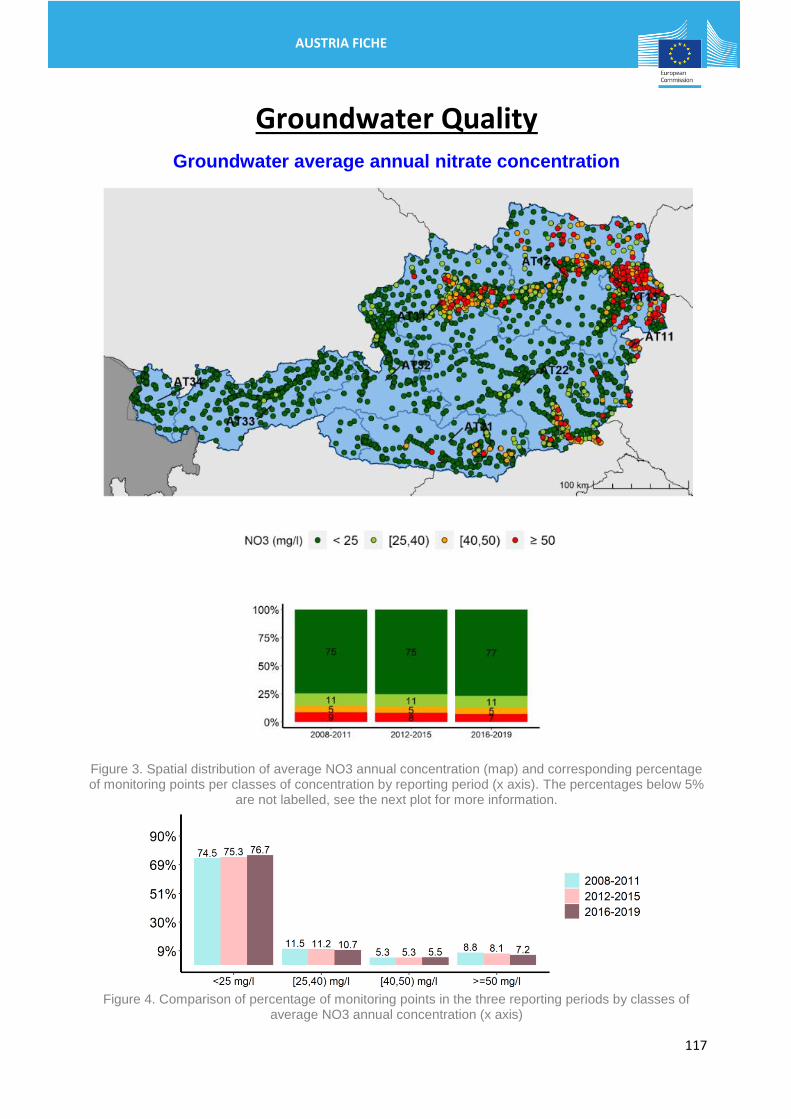
Groundwater Quality Groundwater average annual nitrate concentration
Figure 3. Spatial distribution of average NO3 annual concentration (map) and corresponding percentage of monitoring points per classes of concentration by reporting period (x axis). The percentages below 5%
are not labelled, see the next plot for more information.
Figure 4. Comparison of percentage of monitoring points in the three reporting periods by classes of
average NO3 annual concentration (x axis)
118
AUSTRIA FICHE
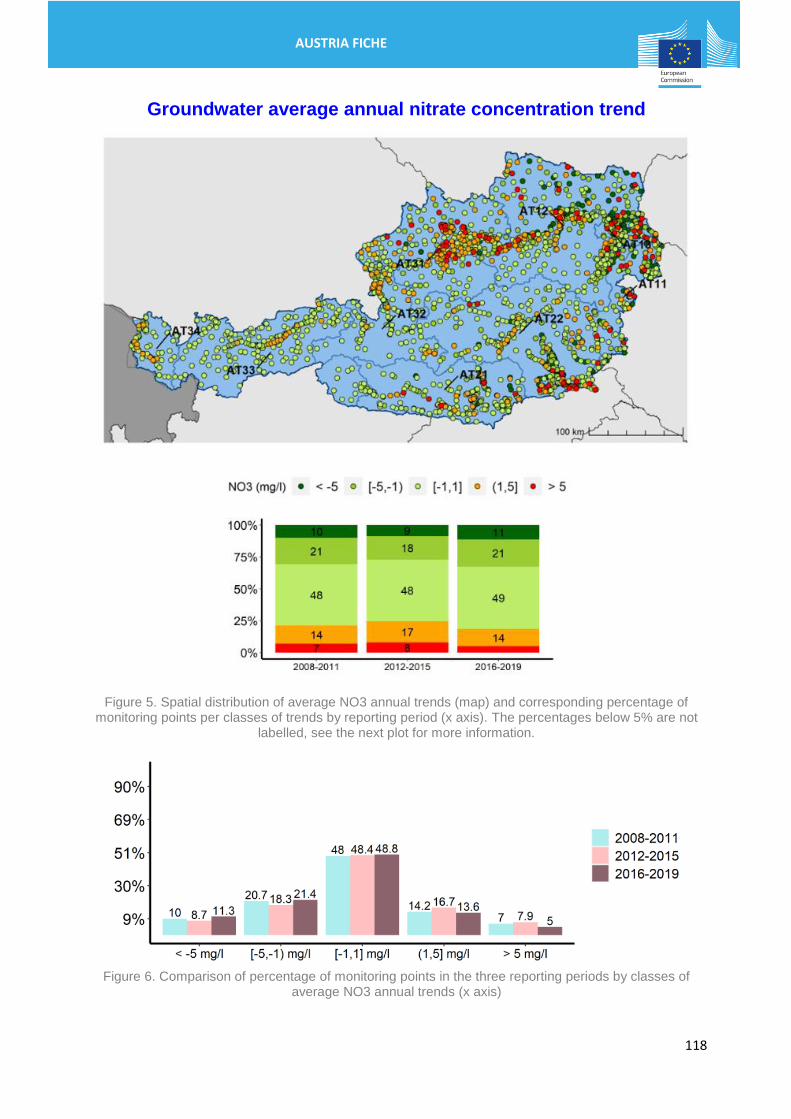
Groundwater average annual nitrate concentration trend
Figure 5. Spatial distribution of average NO3 annual trends (map) and corresponding percentage of monitoring points per classes of trends by reporting period (x axis). The percentages below 5% are not
labelled, see the next plot for more information.
Figure 6. Comparison of percentage of monitoring points in the three reporting periods by classes of
average NO3 annual trends (x axis)
119
AUSTRIA FICHE
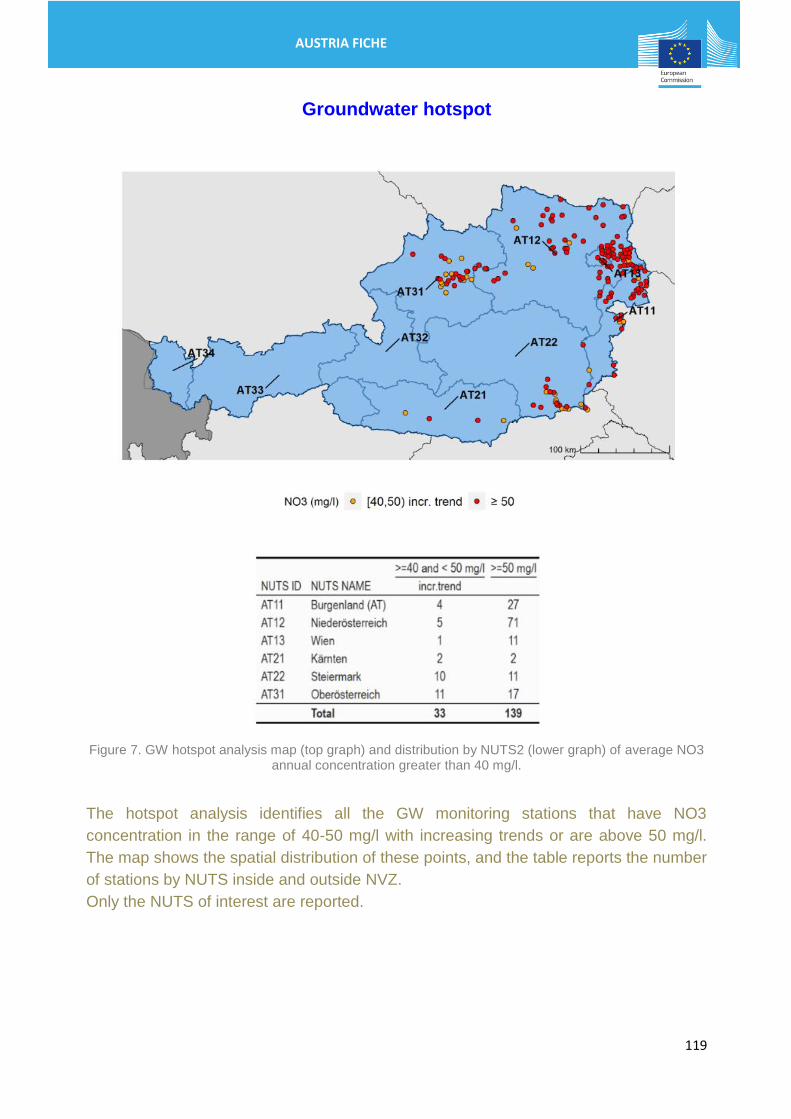
Groundwater hotspot
Figure 7. GW hotspot analysis map (top graph) and distribution by NUTS2 (lower graph) of average NO3 annual concentration greater than 40 mg/l.
The hotspot analysis identifies all the GW monitoring stations that have NO3
concentration in the range of 40-50 mg/l with increasing trends or are above 50 mg/l.
The map shows the spatial distribution of these points, and the table reports the number
of stations by NUTS inside and outside NVZ.
Only the NUTS of interest are reported.
120
AUSTRIA FICHE
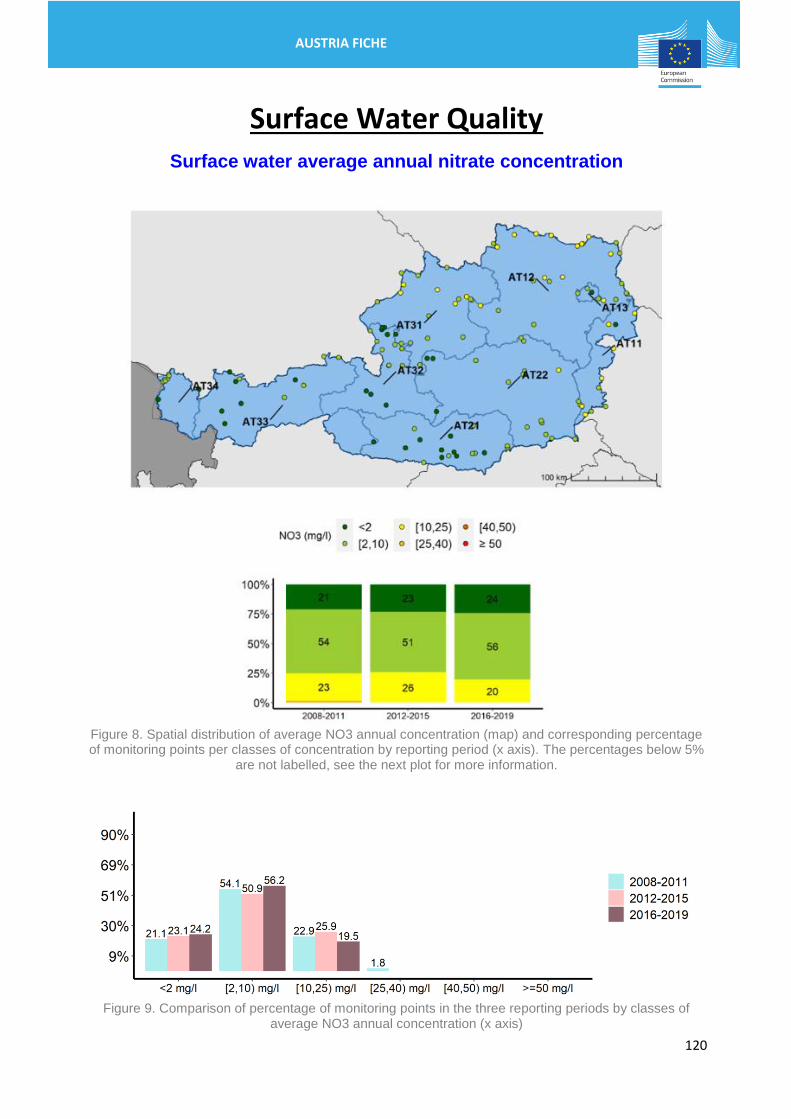
Surface Water Quality Surface water average annual nitrate concentration
Figure 8. Spatial distribution of average NO3 annual concentration (map) and corresponding percentage of monitoring points per classes of concentration by reporting period (x axis). The percentages below 5%
are not labelled, see the next plot for more information.
Figure 9. Comparison of percentage of monitoring points in the three reporting periods by classes of
average NO3 annual concentration (x axis)
121
AUSTRIA FICHE
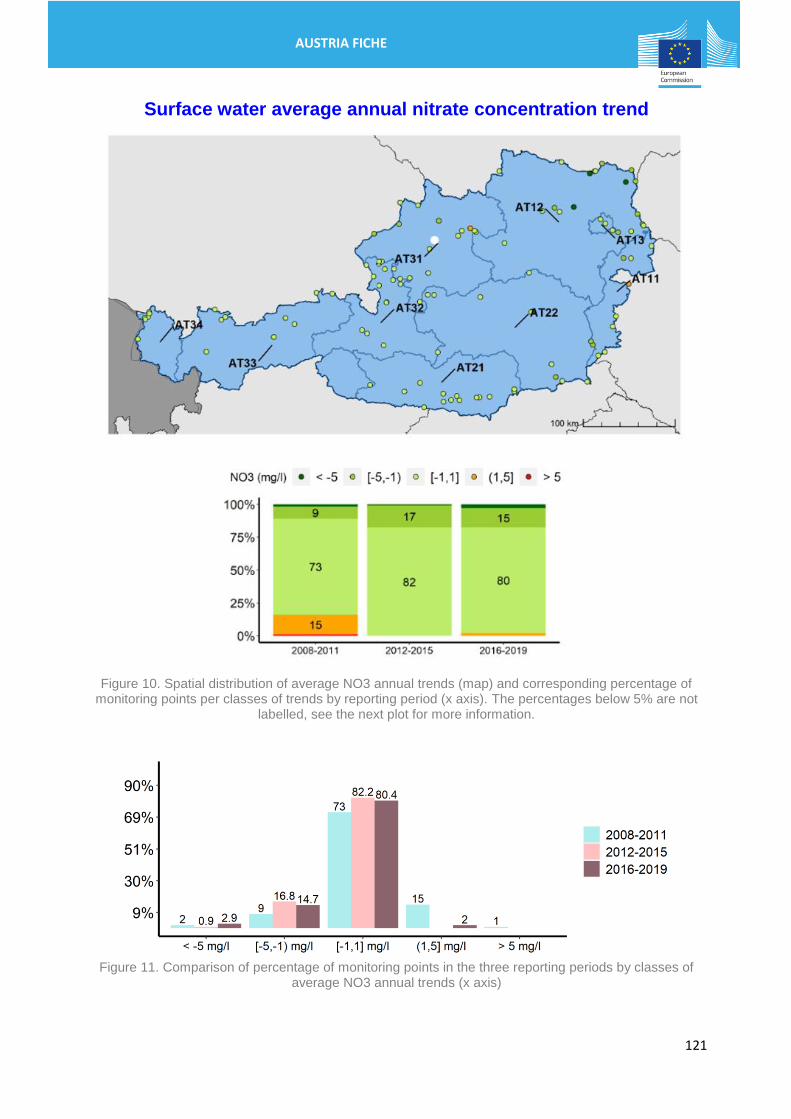
Surface water average annual nitrate concentration trend
Figure 10. Spatial distribution of average NO3 annual trends (map) and corresponding percentage of monitoring points per classes of trends by reporting period (x axis). The percentages below 5% are not
labelled, see the next plot for more information.
Figure 11. Comparison of percentage of monitoring points in the three reporting periods by classes of
average NO3 annual trends (x axis)
122
AUSTRIA FICHE
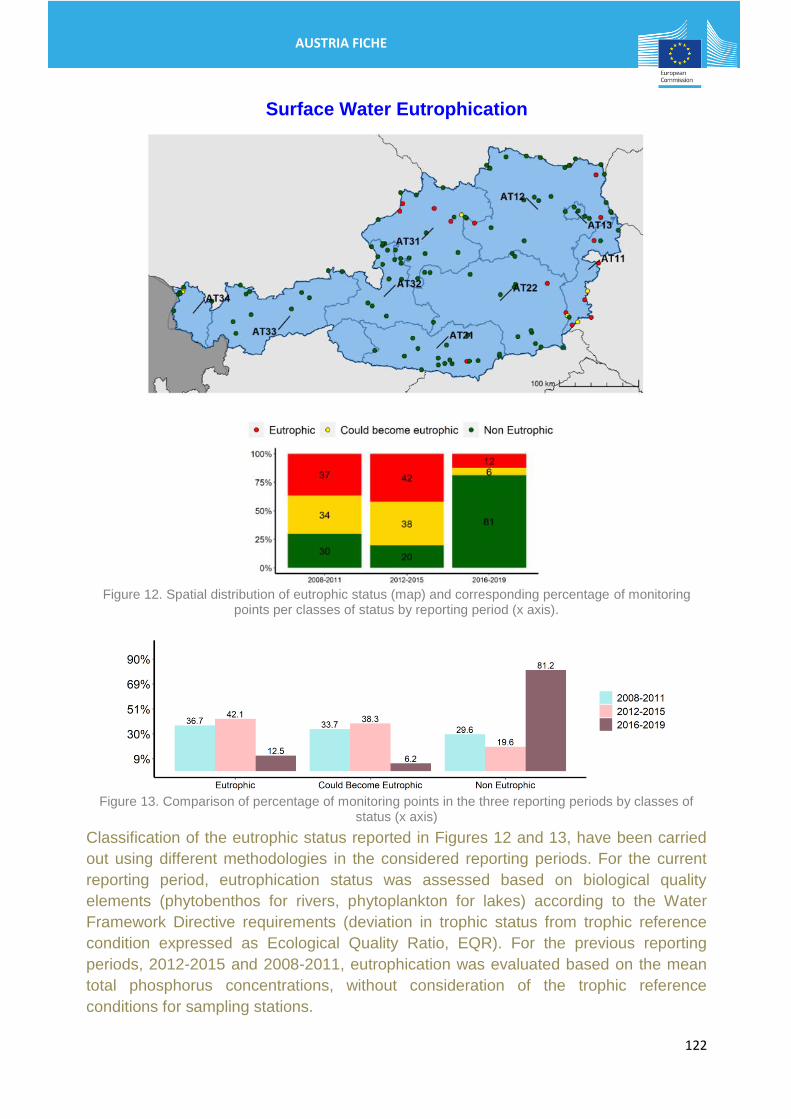
Surface Water Eutrophication
Figure 12. Spatial distribution of eutrophic status (map) and corresponding percentage of monitoring
points per classes of status by reporting period (x axis).
Figure 13. Comparison of percentage of monitoring points in the three reporting periods by classes of
status (x axis)
Classification of the eutrophic status reported in Figures 12 and 13, have been carried
out using different methodologies in the considered reporting periods. For the current
reporting period, eutrophication status was assessed based on biological quality
elements (phytobenthos for rivers, phytoplankton for lakes) according to the Water
Framework Directive requirements (deviation in trophic status from trophic reference
condition expressed as Ecological Quality Ratio, EQR). For the previous reporting
periods, 2012-2015 and 2008-2011, eutrophication was evaluated based on the mean
total phosphorus concentrations, without consideration of the trophic reference
conditions for sampling stations.
123
AUSTRIA FICHE
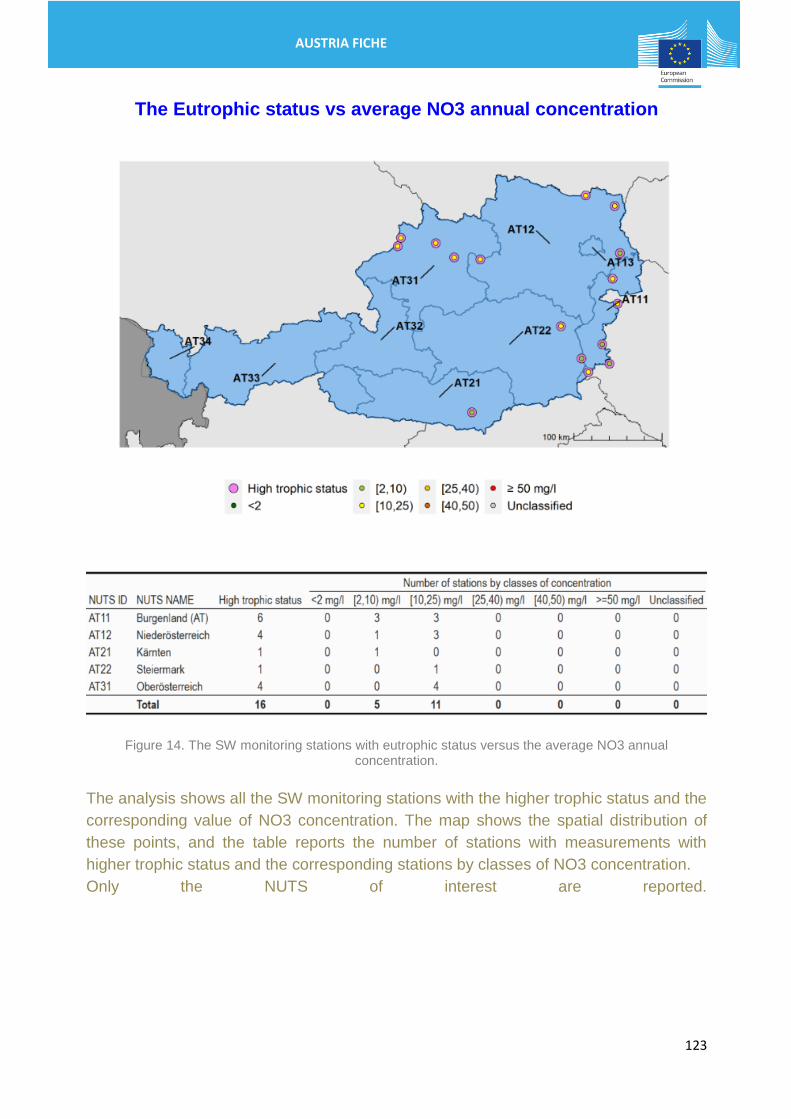
The Eutrophic status vs average NO3 annual concentration
Figure 14. The SW monitoring stations with eutrophic status versus the average NO3 annual concentration.
The analysis shows all the SW monitoring stations with the higher trophic status and the
corresponding value of NO3 concentration. The map shows the spatial distribution of
these points, and the table reports the number of stations with measurements with
higher trophic status and the corresponding stations by classes of NO3 concentration.
Only the NUTS of interest are reported.
124
AUSTRIA FICHE
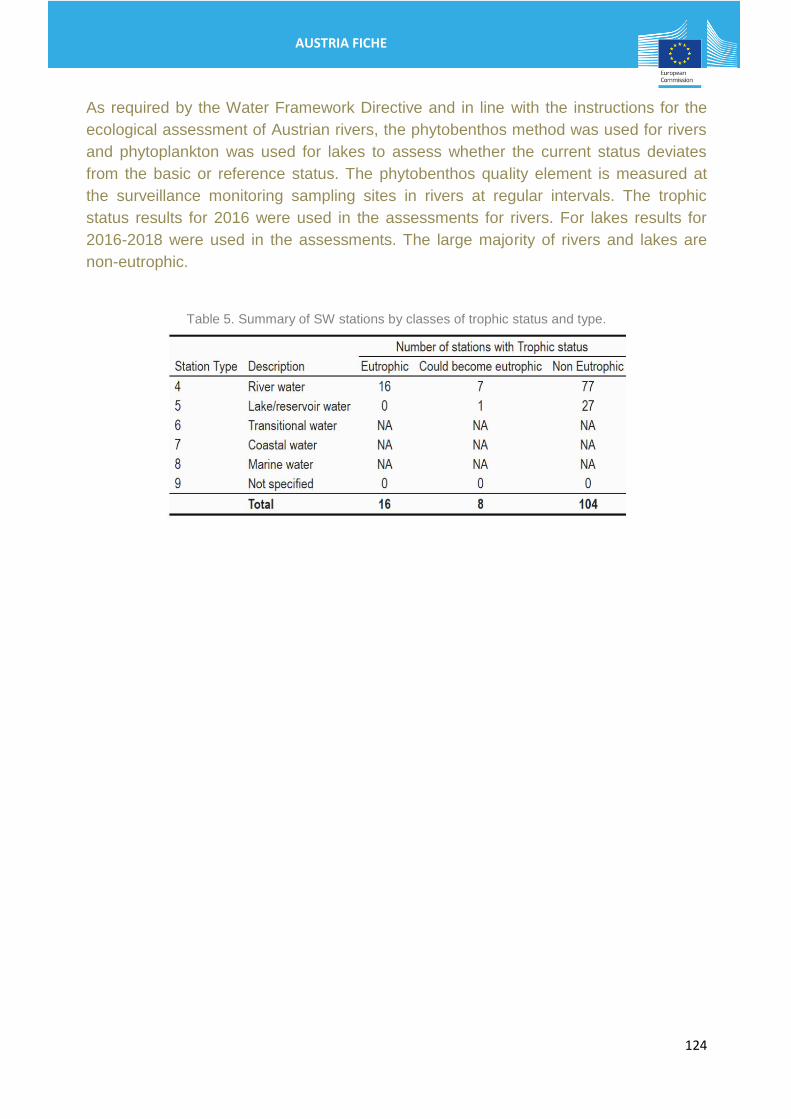
As required by the Water Framework Directive and in line with the instructions for the
ecological assessment of Austrian rivers, the phytobenthos method was used for rivers
and phytoplankton was used for lakes to assess whether the current status deviates
from the basic or reference status. The phytobenthos quality element is measured at
the surveillance monitoring sampling sites in rivers at regular intervals. The trophic
status results for 2016 were used in the assessments for rivers. For lakes results for
2016-2018 were used in the assessments. The large majority of rivers and lakes are
non-eutrophic.
Table 5. Summary of SW stations by classes of trophic status and type.
125
AUSTRIA FICHE
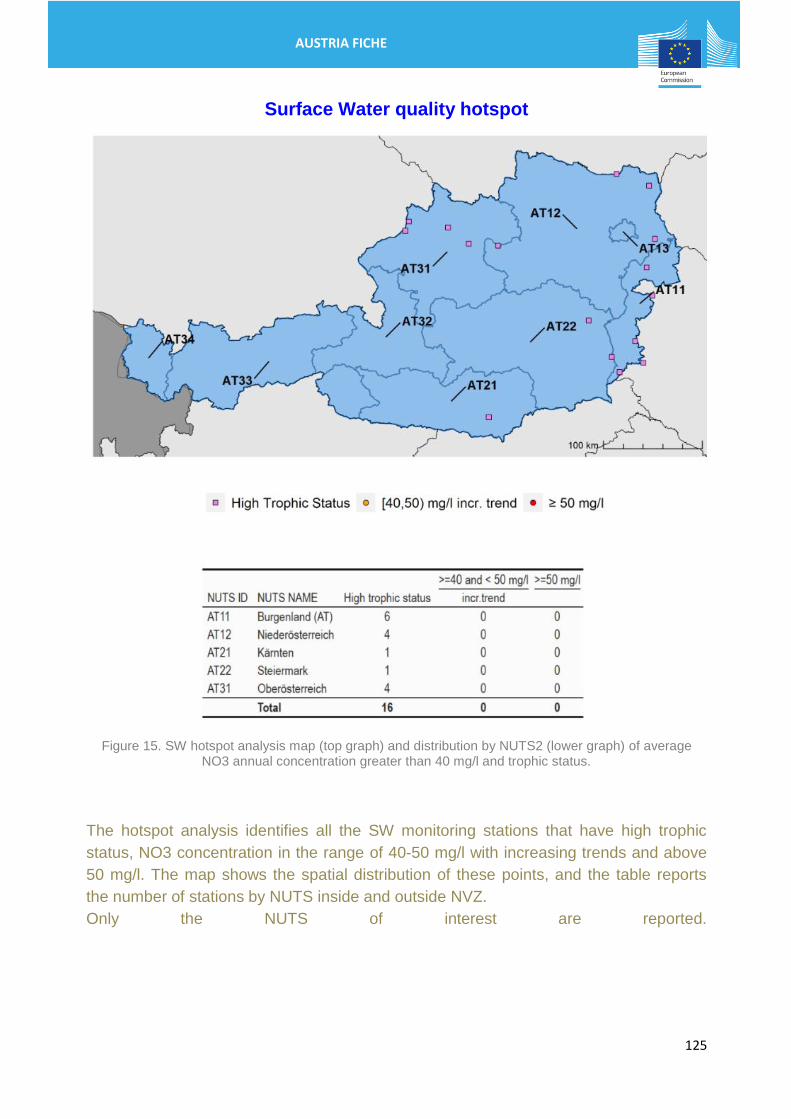
Surface Water quality hotspot
Figure 15. SW hotspot analysis map (top graph) and distribution by NUTS2 (lower graph) of average NO3 annual concentration greater than 40 mg/l and trophic status.
The hotspot analysis identifies all the SW monitoring stations that have high trophic
status, NO3 concentration in the range of 40-50 mg/l with increasing trends and above
50 mg/l. The map shows the spatial distribution of these points, and the table reports
the number of stations by NUTS inside and outside NVZ.
Only the NUTS of interest are reported.
126
AUSTRIA FICHE
Measures in the Action Programme The Code of Good Agricultural Practice (CAGP) has been incorporated into the
Austrian Action Programme, which applies throughout the national territory. The Action
Programme was last revised in 2016/2017, and the current programme entered into
force on 1 January 2018 as the Nitrates Action Programme Regulation (NAPV). This is
implemented throughout the country and the revision mainly puts in place regionally
differentiated requirements, allowing stricter measures to be taken in areas with a
higher nitrate concentration in groundwater or increased load risk to groundwater due to
agricultural land use. In particular, for the first time areas where stricter measures are
required in terms of necessary storage capacity and record-keeping obligations have
been identified. The key measures are summarised in the table below, however
additional measures can be taken on a voluntary basis to promote environmentally
friendly and extensive agriculture that protects natural habitats. The AP is available
online: Nitrat-Aktionsprogramm-Verordnung, bmlrt.gv.at. Cost effectiveness analysis was
not reported.
127
AUSTRIA FICHE
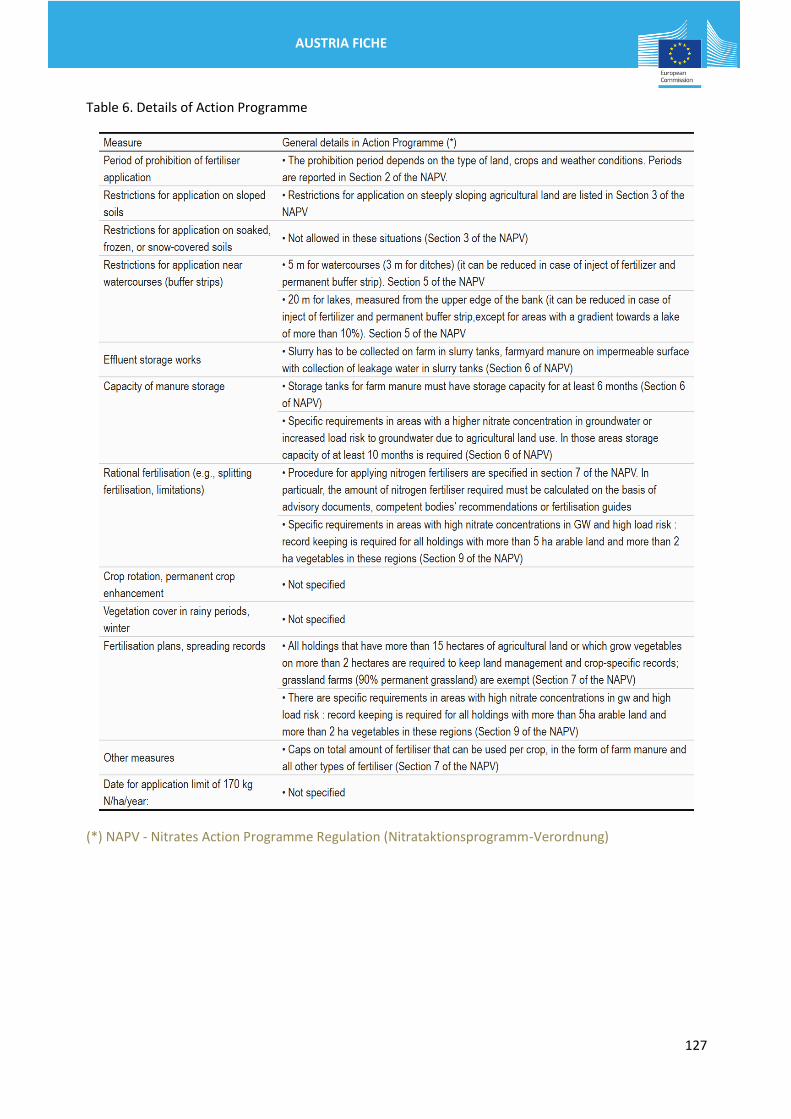
Table 6. Details of Action Programme
(*) NAPV - Nitrates Action Programme Regulation (Nitrataktionsprogramm-Verordnung)
128
AUSTRIA FICHE
Controls
Compliance with the Action Programme’s requirements is monitored by the Water
Inspectorate, as well as by Agrarmarkt Austria, the agency managing payments under
the common agricultural policy pursuant to Regulation (EU) No 1306/2013. The
implementation of the provisions of the nitrate Action Programme is monitored both
through administrative controls and through on-site checks. The average annual
number of holdings subject to on-site cross-compliance checks is 1391 in average in
the period 2016-2019.
Designation of NVZ
Austria has adopted a whole territory approach.
Forecast of Water Quality
It is expected that nitrate loads can fall further, in particular in areas that currently have
high nitrate concentrations, thanks to the measures taken. In most porous aquifers,
however, it will take some time for the expected decline to become apparent due to the
sometimes long retention times in groundwater. The favourable conditions reported so
far in large parts of Austria, where nitrate concentrations have been comparatively low
and stable for years, are expected to continue.

129
AUSTRIA FICHE
Summary
Figure 16. The summary plot for the period 2016-2019
This plot provides in the first row the percentage of stations exceeding 50 mg/l with
respect to the total stations with measures and the percentage of eutrophic SW stations
with respect to the total for which the trophic status is reported. In the second row, the
percentage of stations exceeding 50 mg/l that are outside NVZ with respect to the total
of stations exceeding 50 mg/, and the percentage of SW eutrophic stations that are
outside NVZ with respect to the total that are eutrophic.
130
AUSTRIA FICHE
Long term analysis
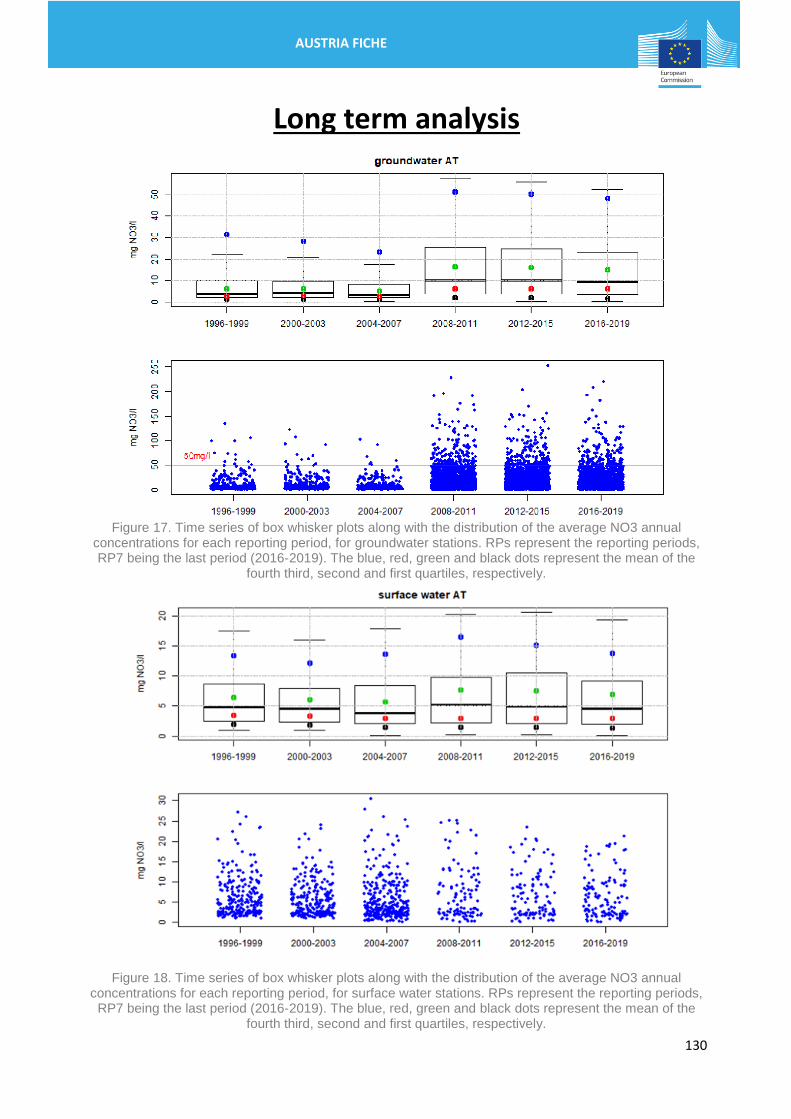
Figure 17. Time series of box whisker plots along with the distribution of the average NO3 annual
concentrations for each reporting period, for groundwater stations. RPs represent the reporting periods, RP7 being the last period (2016-2019). The blue, red, green and black dots represent the mean of the
fourth third, second and first quartiles, respectively.
Figure 18. Time series of box whisker plots along with the distribution of the average NO3 annual concentrations for each reporting period, for surface water stations. RPs represent the reporting periods, RP7 being the last period (2016-2019). The blue, red, green and black dots represent the mean of the
fourth third, second and first quartiles, respectively.
131
AUSTRIA FICHE
Conclusions and recommendations
Austria has an average livestock pressure, the phosphorus surplus is below the
average for the EU.
There is a well-elaborated network of monitoring stations. The groundwater quality is
good in most of the regions; however, hotspots remain in certain regions. All surface
waters comply with the maximum nitrate level set in the Nitrates Directive and most of
these waters have a good trophic status.
The Nitrate Action Programme was reviewed in 2018 and includes stricter measures for
hotspots.
The Commission encourages Austria to continue to follow-up these hotspots and to
take appropriate actions if it appears necessary.