Embed Size (px)
Citation preview
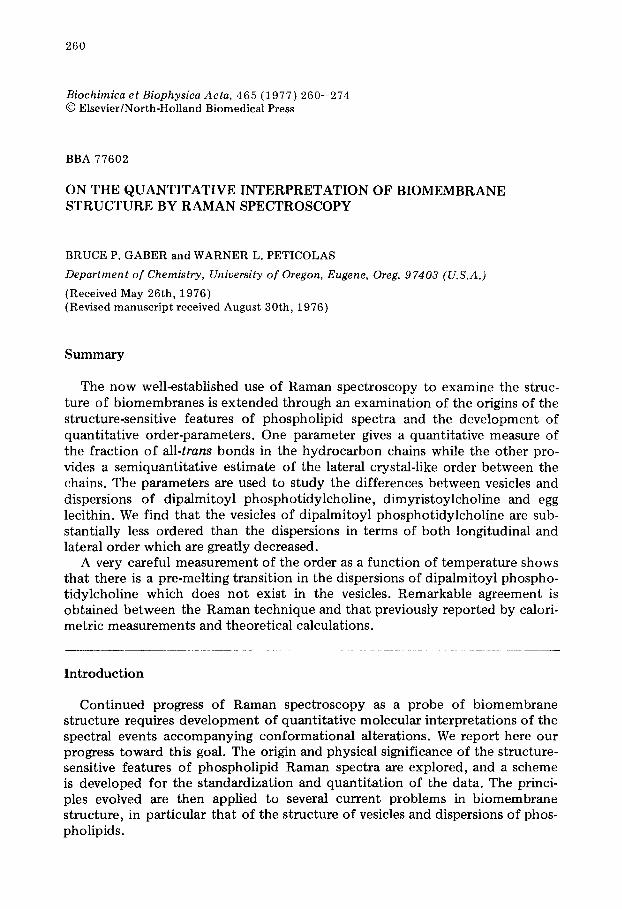
260
Biochimica et Biophysica Acta, 465 (1977) 260--274 Q Elsevier/North-Holland Biomedical Press
BBA 77602
ON THE QUANTITATIVE INTERPRETATION OF BIOMEMBRANE STRUCTURE BY RAMAN SPECTROSCOPY
BRUCE P. GABER and WARNER L. PETICOLAS
Department of Chemistry, University of Oregon, Eugene, Oreg. 97403 (U.S.A.)
(Received May 26th, 1976) (Revised manuscript received August 30th, 1976)
Summary
The now well-established use of Raman spectroscopy to examine the struc- ture of biomembranes is extended through an examination of the origins of the structure-sensitive features of phospholipid spectra and the development of quantitative order-parameters. One parameter gives a quantitative measure of the fraction of all-trans bonds in the hydrocarbon chains while the other pro- vides a semiquantitative estimate of the lateral crystal-like order between the chains. The parameters are used to study the differences between vesicles and dispersions of dipalmitoyl phosphotidylcholine, dimyristoylcholine and egg lecithin. We find that the vesicles of dipalmitoyl phosphotidylcholine are sub- stantially less ordered than the dispersions in terms of both longitudinal and lateral order which are greatly decreased.
A very careful measurement of the order as a function of temperature shows that there is a pre-melting transition in the dispersions of dipalmitoyl phospho- tidylcholine which does not exist in the vesicles. Remarkable agreement is obtained between the Raman technique and that previously reported by calori- metric measurements and theoretical calculations.
Introduction
Continued progress of Raman spectroscopy as a probe of biomembrane structure requires development of quantitative molecular interpretations of the spectral events accompanying conformational alterations. We report here our progress toward this goal. The origin and physical significance of the structure- sensitive features of phospholipid Raman spectra are explored, and a scheme is developed for the standardization and quantitation of the data. The princi- ples evolved are then applied to several current problems in biomembrane structure, in particular that of the structure of vesicles and dispersions of phos- pholipids.
261
Experimental
Materials L-a-Dipalmitoyl phosphatidylcholine (Calbiochem) was freed of possible
heavy metal contamination by extraction against a solution of EDTA [1]. A single spot was obtained when 2 pmol were chromatographed on silica gel G in CHC13/CH3CH/H20 (65 : 25 : 4). 1-2-Dimyristoyl phosphatidylcholine (Cal- biochem) was used wi thout further purification. Egg lecithin was prepared by a modification of the procedure of Pangborn [2]. The material yielded a single spot on silica gel G with an R F identical to a known sample of egg lecithin. Perdeuterohexadecane was supplied by Merck, Sharpe and Dohme, Canada, Ltd. and hexadecane by Applied Sciences Laboratories.
Methods Phospholipid dispersions were prepared at 60°C by repeatedly homogenizing
100 mg phospholipid in 1 ml of buffer (0.1 M KC1, 0.01 M Tris, pH 8), through a 6" 20-gauge hypodermic needle [ 3].
Phospholipid vesicles were made and separated by the procedure of Huang [4]. Phospholipid concentration was 150 mg/ml buffer (0.1 M KC1, 0.01 M Tris, pH 8). Sonication was effected using a Branson sonifier model W-185. The sonifier was equipped with a standard probe and operated at an ou tpu t power of about 50 watts. To avoid overheating the sample, sonication was conducted in cycles of 1 min on, 15 s off, with a total of 18--20 minutes required for solu- tion clarity. A water bath maintained the sample temperature above 45°C throughout the sonication. Samples were filtered through a 0.45 pm Millipore filter after sonication and immediately applied to the 1.8 × 20 cm column of Sepharose 4-B. The water-jacketed column was run at 45°C. Elution profiles were similar to those reported by Huang [4]. The trailing portion of the broad, slow-moving vesicle fraction was collected, and the perfectly clear solution transferred directly to melting point capillaries for Raman examination. Vesicle melting curves were run from high temperature to low.
Hexadecane-perdeuterohexadecane mixtures were prepared by volume with the assumption that the weight density of the perdeuterohexadecane is 1.15- times that of hexadecane.
The Raman spectrometer and constant temperature holder have been described previously [5]. The temperature within the sample was measured with a thermistor probe inserted into the capillary. A correction for laser heat- ing (~2.6°C) was determined by observing the melting of octadecane in the laser beam.
Band intensities were taken as peak heights measured from a baseline deter- mined individually for each spectrum. Considerable care was taken to assure spectra with high signal/noise ratios and consistent, stable baseline characteris- tics.
Results and Discussion
Qualitative features o f the Rarnan spectra o f phospholipids. As depicted in the spectrum of solid dipalmitoyl phosphatidylcholine (Fig. 1), the Raman
262
c:~ STRETCHING
c c:2.
/ I DIPALMITOYL PHOSPHATIDYL CHOLINE
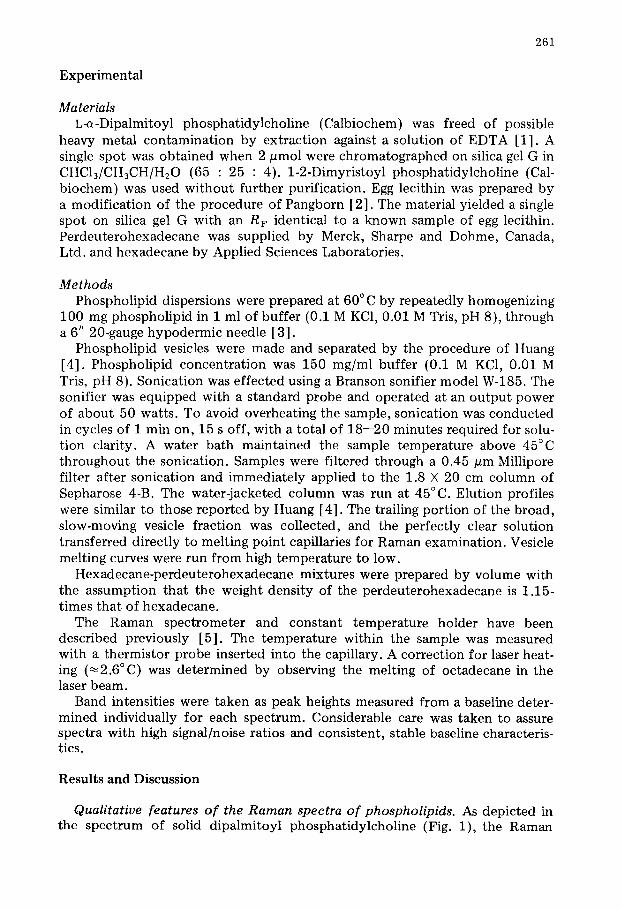
Fig. 1. R a m a n s p e c t r u m of sol id d i p a l m i t o y l p h o s p h a t i d y l c h o l i n e . R e c o r d e d a t 50 c m - l / i n c h pe r ra in ; t ime c o n s t a n t , 1 s, ga in 105 c o u n t ] s ; slits 2 5 0 p ro ; p o w e r a t laser h e a d , 9 0 0 MW; e x c i t a t i o n w a v e l e n g t h ,
5 1 4 5 A.
spectrum of a phospholipid is dominated by vibrations of the fat ty acyl chains, with superposition of a few bands from the head group. They are here briefly described in terms of their origin and relative conformation-sensitivity.
At very low frequency (154 cm -1) the longitudinal acoustical mode is observed as a weak shoulder. This mode results from an accordian-like motion of the entire hydrocarbon chain; its frequency is inversely related to the num- ber (N) of all-trans bonds [6--7]. For a frequency of 154 cm -1, as in solid dipalmitoyl phosphatidylcholine, N = 15, just as expected for a C-16 chain with a terminal ester linkage.
The most intense head group vibration in dipalmitoyl phosphatidylcholine is the C-N stretching mode at 722 cm -1. The frequency and intensity of this band appears to be insensitive to any conformational change associated with melting. The mean intensity of the band is constant within -+6% from 20-- 50°C. The skeletal optical modes between 1000--1150 cm -1 are particularly sensitive to the conformational state of the hydrocarbon chains [5]. Of the three bands comprising this region, two (1064 cm -~ and 1133 cm -1) may be as- signed [9-11] to the Big and Ag vibrational modes of all-trans chain segments while the third (~1100 cm -~ ) results from structures containinggauche rotations.
The assignments of the complex of bands in the C-H stretching (2800--2900 cm -~) region have been clarified recently [12]. The principal bands are the methylene symmetric C-H stretch (2850 cm -1) and asymmetric stretch (2890 cm-~). Disruption of regular chain packing either by melting or dissolution [8,9] results in a decrease in the intensity of the 2890 cm -~ band relative to the band at 2850 cm -1.
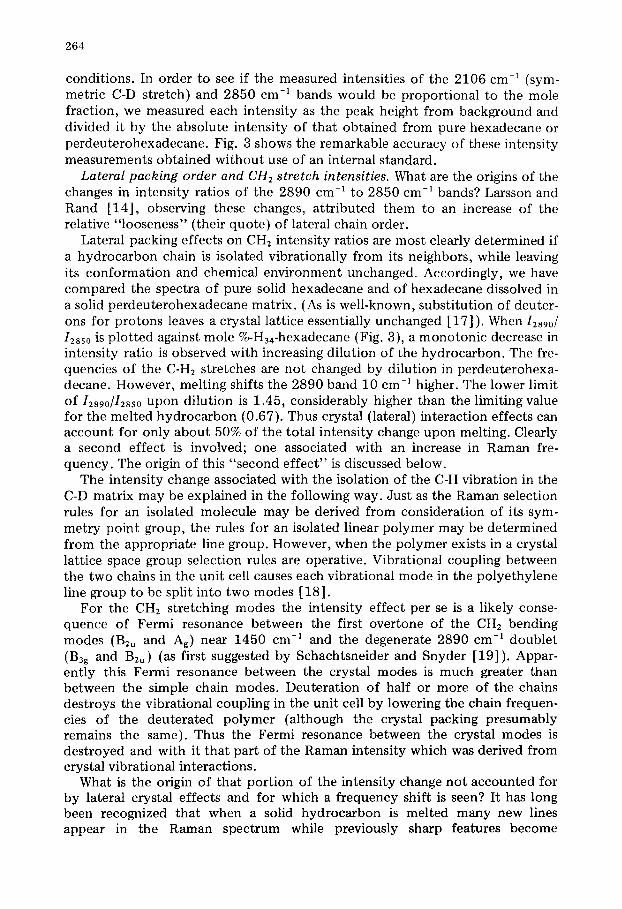
Order/disorder relations in phospholipid Raman spectra. Solid dipaimitoyl phosphatidylcholine exhibits highly ordered hydrocarbon chains as evidenced by the appearance of the longitudinal acoustical mode (Fig. 1). As an example of highly disordered chain we take dipalmitoyl phosphatidylcholine in CHC13. The result (bottom spectrum, Fig. 4) is a spectrum of radically different character than that of the solid. The gauche band in the skeletal optical region has broadened and shifted to lower frequency, while the trans band at 1133 cm -~ has lost considerable intensity (but is still present). The trans band at 1063 cm -1 becomes a shoulder on the broadened gauche band.
Chain disorder is seen as well in the C-H stretch region {for which dipal-
263
I -MOLE % D34- HEXADECANE 2 4 .6 8 _
0 1.08.6 1 [ I I I 1 (D
_o l--,I 0 ~ .4
2
L L L J 0 .2 .4 .6 .8 1,0
MOLE % H34- HEXADECANE
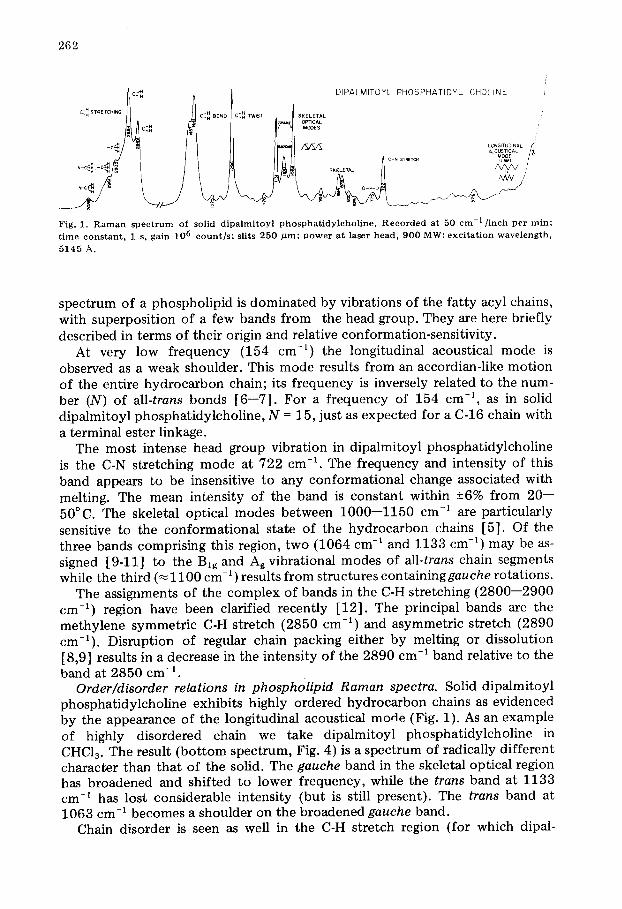
Fig . 2. I n t e n s i t i e s o f t h e C H 2 s y m m e t r i c a l s t r e t c h ( 2 8 5 0 c m -1 ) a n d C D 2 s y m m e t r i c a l s t r e t c h ( 2 1 0 6 c m -1 ) in s o l i d m i x t u r e s o f h e x a d e c a n e / p e r d e u t e r o h e x a d e c a n e . V a l u e s are t a k e n r e l a t i v e t o i n t e n s i t i e s f o r p u r e h e x a d e c a n e a n d p u r e p e r d e u t e r o h e x a d e c a n e .
mitoyl phosphatidylcholine was dissolved in CDCI3). The asymmetric CH2 stretch has broadened, lost intensity, and shifted to higher frequency (10 cm-1). The symmetric stretch remains sharp and is the most intense feature of the spectrum. The intensity ratio of 2890 cm-1/2850 cm -I drops from ~ 2 . 0 in solid dipalmitoyl phosphatidylcholine to 0.77 in solution.
One question in this study is that of the use of the 2850 cm -1 peak intensity as an internal standard by which to reference the 2890 cm -1 band. In this series of experiments mixtures of varying proportions of liquid hexadecane/per- deuterohexadecane in identical capillary tubes were run under exactly the same
~° 1 .~-~ ]-L ATEIRAL
~ I 5 e ~ e ~ e
-.=..
J
i
ROTA!ER i
i
i Q o o o I o I LI~IJID
5 ~ I L ~ I J 20 40 60 80 IO0
MOLE% H34-HEXADECANE
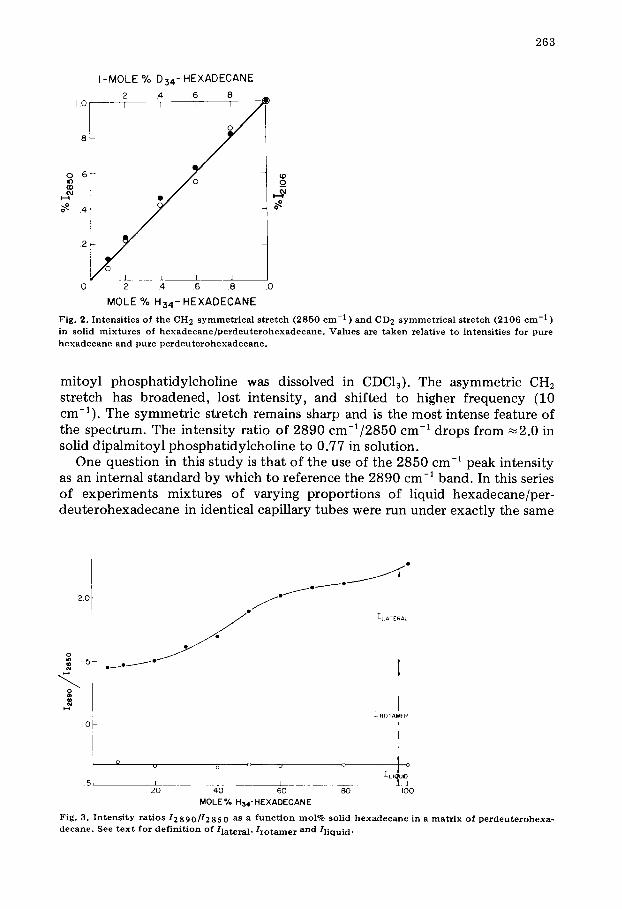
F i g . 3 . I n t e n s i t y r a t i o s 12 8 9 0/12 8 5 0 as a f u n c t i o n t o o l % s o l i d h e x a d e c a n e in a m a t r i x o f p e r d e u t e r o h e x a - d e c a n e . S e e t e x t f o r d e f i n i t i o n o f / l a t e r a l , l r o t a m e r a n d / l i q u i d "
264
conditions. In order to see if the measured intensities of the 2106 cm -1 (sym- metric C-D stretch) and 2850 cm -1 bands would be proportional to the mole fraction, we measured each intensity as the peak height from background and divided it by the absolute intensity of that obtained from pure hexadecane or perdeuterohexadecane. Fig. 3 shows the remarkable accuracy of these intensity measurements obtained without use of an internal standard.
Lateral packing order and CH2 stretch intensities. What are the origins of the changes in intensity ratios of the 2890 cm -1 to 2850 cm -1 bands? Larsson and Rand [14], observing these changes, attributed them to an increase of the relative "looseness" (their quote) of lateral chain order.
Lateral packing effects on CH2 intensity ratios are most clearly determined if a hydrocarbon chain is isolated vibrationally from its neighbors, while leaving its conformation and chemical environment unchanged. Accordingly, we have compared the spectra of pure solid hexadecane and of hexadecane dissolved in a solid perdeuterohexadecane matrix. (As is well-known, substitution of deuter- ons for protons leaves a crystal lattice essentially unchanged [17]). When I2890/ I28s0 is plotted against mole %-H34-hexadecane (Fig. 3), a monotonic decrease in intensity ratio is observed with increasing dilution of the hydrocarbon. The fre- quencies of the C-H2 stretches are not changed by dilution in perdeuterohexa- decane. However, melting shifts the 2890 band 10 cm -1 higher. The lower limit of I289o/I28so upon dilution is 1.45, considerably higher than the limiting value for the melted hydrocarbon (0.67). Thus crystal (lateral) interaction effects can account for only about 50% of the total intensity change upon melting. Clearly a second effect is involved; one associated with an increase in Raman fre- quency. The origin of this "second effect" is discussed below.
The intensity change associated with the isolation of the C-H vibration in the C-D matrix may be explained in the following way. Just as the Raman selection rules for an isolated molecule may be derived from consideration of its sym- metry point group, the rules for an isolated linear polymer may be determined from the appropriate line group. However, when the polymer exists in a crystal lattice space group selection rules are operative. Vibrational coupling between the two chains in the unit cell causes each vibrational mode in the polyethylene line group to be split into two modes [18].
For the CH2 stretching modes the intensity effect per se is a likely conse- quence of Fermi resonance between the first overtone of the CH2 bending modes (B2u and Ag) near 1450 cm -1 and the degenerate 2890 cm -1 doublet (B3g and B2u) (as first suggested by Schachtsneider and Snyder [19]). Appar- ently this Fermi resonance between the crystal modes is much greater than between the simple chain modes. Deuteration of half or more of the chains destroys the vibrational coupling in the unit cell by lowering the chain frequen- cies of the deuterated polymer (although the crystal packing presumably remains the same). Thus the Fermi resonance between the crystal modes is destroyed and with it that part of the Raman intensity which was derived from crystal vibrational interactions.
What is the origin of that portion of the intensity change not accounted for by lateral crystal effects and for which a frequency shift is seen? It has long been recognized that when a solid hydrocarbon is melted many new lines appear in the Raman spectrum while previously sharp features become
265
broadened [20 ,21] . Many years ago, Mizushima [21] explained the effect by the simple assumption that in a solid hydrocarbon only one (presumably trans) conformation exists while for the liquid several conformations (and thus several Raman lines) are possible. This effect might be called "rotomer broadening".
The total relative intensity (/tot = I2s90//2ss0) of a highly ordered crystalline hydrocarbon lattice can be broken into three parts: •liquid = 0 . 7 , the residual intensity in the liquid; I~ot~me~, the difference between the intensity of a liquid and that of an isolated all-trans chain; and / lateral, that due to vibrational cou- pling between the adjacent chains in the hydrocarbon crystal. These intensity contributions are shown in Fig. 4. Thus/tot = •liquid + Irotamer + /lateral" Experi- mentally the two contributions t o / t o t may be differentiated by the associated frequency change. /lateral does not involve a frequency change while there is an increase of ~ 1 0 cm -1 to 2894 cm -1 in going from the isolated chain to the melt.
Intrachain order and skeletal optical mode intensities. Properly interpreted, the relative intensity and qualitative behavior of the skeletal optical mode near
DIPALMITOYL PHOSPHATIDYL CHOLINE
J J
; /
/ i'1
]
\
DISPERSION / ~11
/
/
/
I
i ~ ' ~ ~I,
VESICLES 4 ; ~,
/ \
SOLUTION
* 2~X) ' • I I 2 8 0 0 1140 I100 I ( ~
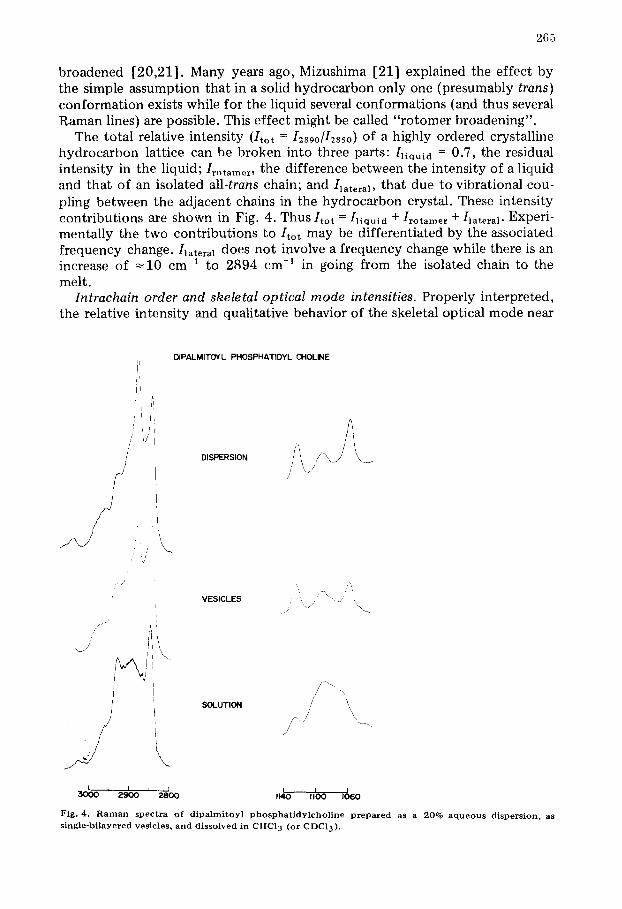
Fig. 4. R a m a n spectra o f dipalrnitoyl p h o s p h a t i d y l c h o l i n e prepared as a 20% a queo us dispersion, as s ingle-bi layered ves ic les , and disso lved in CHC13 (or CDCI 3).
266
1133 cm -1 provides quantitative insight into the structure of the phospholipid chains. Assuming that the intensity of this C-C stretching vibration is the sum of intensities from individual all-trans segments, the Raman intensity is given in terms of the probabil i ty of occurrence of a trans bond Pt by
N
IR = Io ~ nC.P~ (1) n=3
where n is the number of bonds in an all-trans sequence within a molecule of N bonds and Cn is the number of times the nth segment reoccurs. IR is the total Raman intensity and I o is the intensity per "trans-unit". The formalism is approximate in assuming I o a constant wi thout regard to neighbor and end group effects. However, as we shall see, the Raman intensity at 1133 cm -1, properly normalized, leads to an order-parameter which gives a quantitative measure of the average number of trans bonds. Marsh [23] has also discussed a somewhat similar quantitative approach.
Order parameters. Stran~ and Sla t e ra 1. We wish to develop order parameters which will distinguish as much as possible between the order due to intrachain structure and that due to lateral crystalline interactions. These parameters are normalized so that S = 1 indicates the highest possible order and S = 0 no order (not necessarily the lowest possible).
The trans parameter is defined as
( 1 1 1 3 3 / I r e f )observed (2) Strans = ( I 1 1 3 3 / i r e f ) dipalmitoyl phosphatidylcholine solid
The choice of an all-trans standard with which to define St~an~ fixes n = N and EP't' = 1. Thus reducing Eqn. 1 to IR = IoN.
Ire* is taken as I1090em-~ when a number of different phospholipids are being discussed. However, for very precise work on phosphatidycholines we have used I~72em-~ as the reference. For diaplmitoyl phosphatidylcholine solid I1~33/ 1722 ~ I i 1 3 3 / I 1 0 9 0 = 1.77. Observe that St~ns = 0 for (It~s/Iref) = 0; a condit ion never observed experimentally.
To obtain an order parameter for the lateral interaction presents a more dif- ficult problem since the change in the intensity of the 2890 cm -1 band is due both to the decrease in interchain vibrational coupling and phonon dispersion broadening due to chain shortening. As a starting point we assume that about half of the observed decrease is due to each of the two effects (since both have the same magnitude in hexadecane).
Since the difference in intensity between the solid hexadecane and solid hexadecane diluted with perdeuterohexadecane is half the intensity difference between crystal and liquid, Slatera 1 may be defined as
Slateral --_ Ic-H2(sample) - - IC-H2 (liq hexadecane) (4)
Ic-H2(crystal l ine hexadecane) - - 1C-H2 (liq hexadecane)
o r
Sla tera l = I o n 2 (sample) - - 0 . 7 1.5 (5)
267
where IC-H2 = I2890/I2850. This parameter is only approximate and must be con- sidered semi-quantitative, bu t it will give some insight into the amount of lateral interaction. The contr ibution due to rotamer broadening can be esti- mated qualitatively from the amount of frequency shift. If the equation is applied in the domain for which the frequency of the asymmetric CH2 stretch remains constant, S l a t e r a 1 should provide a good qualitative estimate of the degree of lateral interaction.
P h o s p h o l i p i d d i spers ions and vesicles c o m p a r e d . It has been suggested [3] that differences might exist between the molecular structure of large multi- lamellar phospholipid dispersions and small (radius 125 A) single-bilayered vesicles. The proposed structural difference is postulated to arise from disrup- tion of orderly hydrocarbon chain packing induced by the small radius of cur- vature of the vesicles. Vesicles would therefore exhibit a less ordered hydro- carbon interior than would a dispersion of the same phospholipid.
That vesicles are in fact more disordered than dispersions is demonstrated by the spectra in Fig. 4. The dispersion shares skeletal optical mode features in common with solid diaplmitoyl phosphatidylchotine, i.e. well-resolved bands with peak ratios near (but lower than) those for the solid. Vesicles, however, are clearly different from dispersions in this spectral region. The pattern is con- firmed in the C-H stretching region where the asymmetric stretch has lost inten- sity and is lower than the symmetric stretch. The frequency of the asymmetric CH2 stretch in the vesicles is unchanged, suggesting a loss of lateral packing, wi thout the onset of liquid-like quality seen for dipalmitoyl phosphatidyl- choline in CHC13.
Quantitatively, at 30°C *, vesicles are characterized by Strans = 0.54 and S l a t e r a 1 - - 0.23; dispersions by Strans = 0.76 and S l a t e r a 1 = 0.44. As will be shown in the melting data (below) this structural difference is evident even at 20 °C. Thus dispersions, below To, reveal both chain order and lateral interaction intermediate between that of solid dipalmitoyl phosphatidylcholine and the lipid dissolved in CHC13, while vesicles are found to be consistently more dis- ordered than the dispersions in both senses. This conclusion is in agreement with the experiments of Suurkuusk et al. [1] which show unequivocal calori- metric and fluorescence probe differences between dipalmitoyl phosphatidyl- choline vesicles and dispersions.
We have also examined the particles of intermediate size (~400--1000 A) which elute first on the gel filtration column and find Strans = 0.85 and Slatera~ = 0.18.
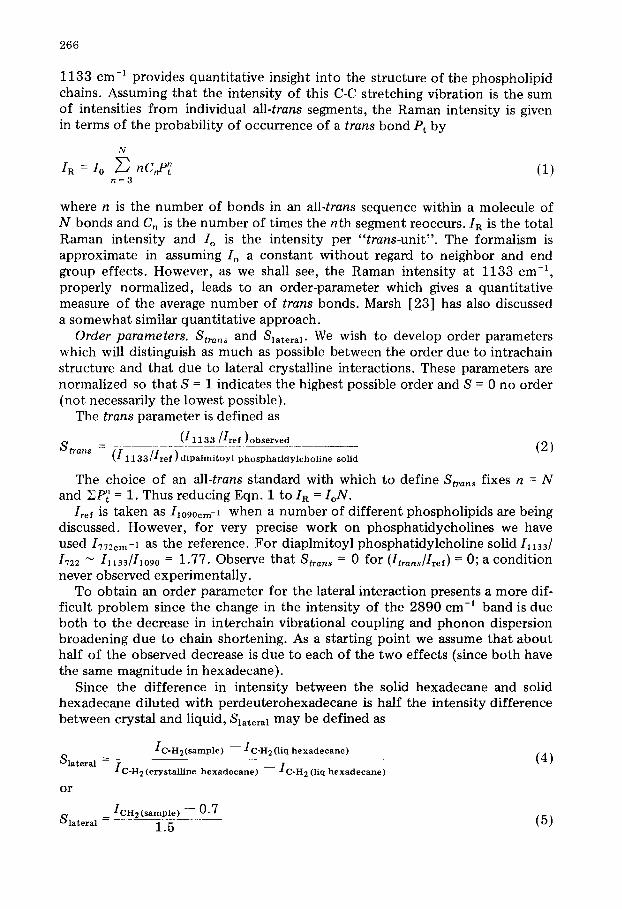
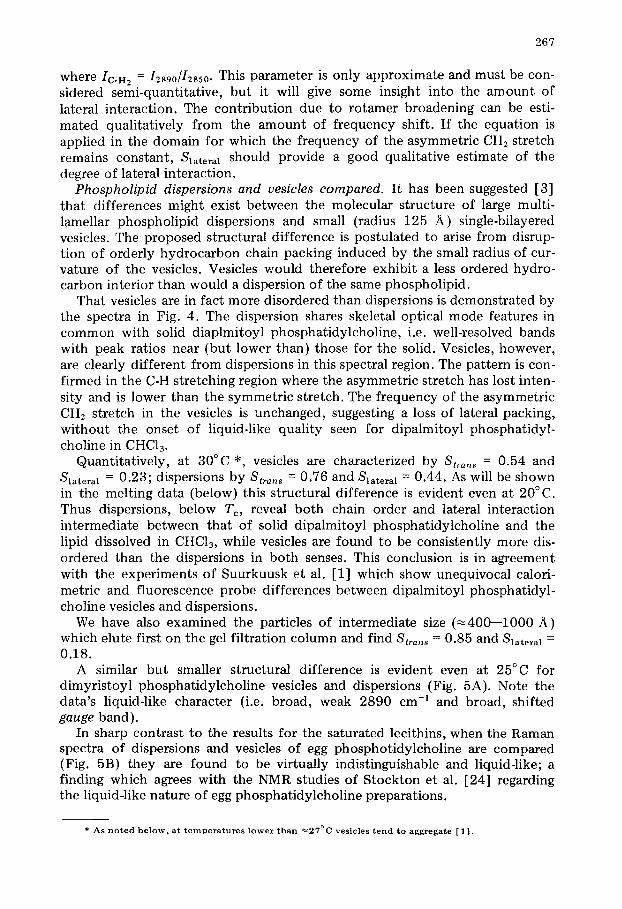
A similar but smaller structural difference is evident even at 25°C for dimyristoyl phosphatidylcholine vesicles and dispersions (Fig. 5A). Note the data's liquid-like character (i.e. broad, weak 2890 cm -1 and broad, shifted gauge band).
In sharp contrast to the results for the saturated lecithins, when the Raman spectra of dispersions and vesicles of egg phosphotidylcholine are compared (Fig. 5B) they are found to be virtually indistinguishable and liquid-like; a finding which agrees with the NMR studies of Stockton et al. [24] regarding the liquid-like nature of egg phosphatidylcholine preparations.
* A s n o t e d b e l o w , a t t e m p e r a t u r e s l o w e r t h a n " ~ 2 7 ° C ves i c l e s t e n d t o a g g r e g a t e [ 1 ] .
268
OIMYRISTOYL PHOSPHATIIDYL CHOLINE
' J
F, , / " , /
I L I l I I i I i I 2900 2000 1150 1100
~.cm-I z~cm-i
EGG ~ T I O Y L C H O L I N E
r
e~' ;~'\#'" t
~, ~ D I S P E R S I O N
~, /6 L ,'~
,j /
VESICLES
!
4 ,,j /
'k~,' t ! i \
I
/
/
I ~ I i I I i 1 i 3 0 0 0 2 9 0 0 2 8 0 0 1140 I100
A cm -~
I 1060
I 1040
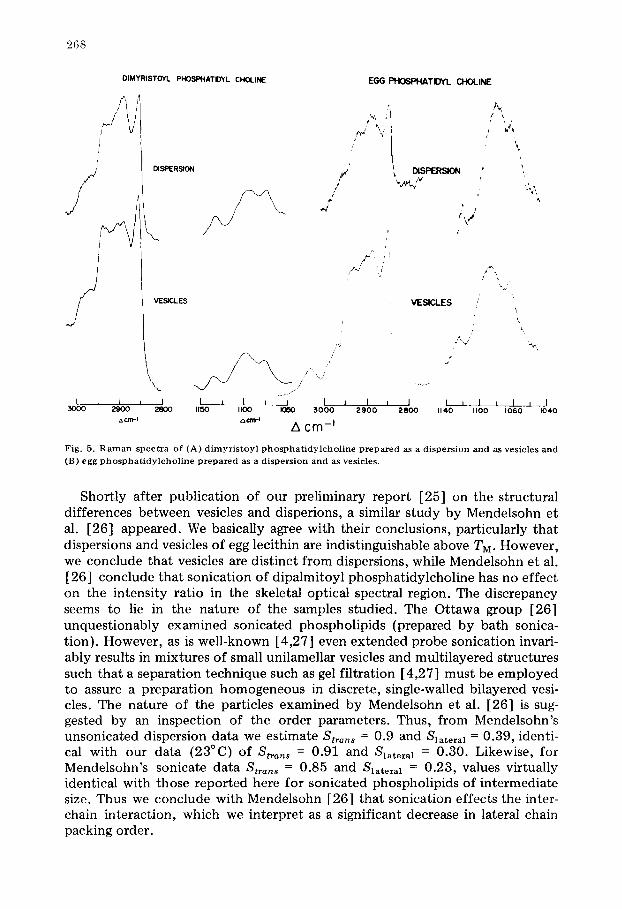
F i g . 5 . R a m a n s p e c t r a o f ( A ) d i m y r i s t o y l p h o s p h a t i d y l c h o l i n e prepeuced as a d i s p e r s i o n a n d as v e s i c l e s a n d
( B ) e g g p h o s p h a t i d y l c h o l i n e p r e p a r e d as a d i s p e r s i o n a n d as v e s i c l e s .
Shortly after publication of our preliminary report [25] on the structural differences between vesicles and disperions, a similar study by Mendelsohn et al. [26] appeared. We basically agree with their conclusions, particularly that dispersions and vesicles of egg lecithin are indistinguishable above TM. However, we conclude that vesicles are distinct from dispersions, while Mendelsohn et al. [26] conclude that sonication of dipalmitoyl phosphatidylcholine has no effect on the intensity ratio in the skeletal optical spectral region. The discrepancy seems to lie in the nature of the samples studied. The Ottawa group [26] unquestionably examined sonicated phospholipids (prepared by bath sonica- tion). However, as is well-known [4,27] even extended probe sonication invari- ably results in mixtures of small unilamellar vesicles and multilayered structures such that a separation technique such as gel filtration [4,27] must be employed to assure a preparation homogeneous in discrete, single-walled bilayered vesi- cles. The nature of the particles examined by Mendelsohn et al. [26] is sug- gested by an inspection of the order parameters. Thus, from Mendelsohn's unsonicated dispersion data we estimate S t ~ o , s = 0.9 and S l a t e r a 1 -- 0.39, identi- cal with our data (23°C) of S t r a n s = 0.91 and S l a t e r a 1 = 0.30. Likewise, for Mendelsohn's sonicate data S t ~ , , , = 0.85 and S l a t e r a I = 0.23, values virtually identical with those reported here for sonicated phospholipids of intermediate size. Thus we conclude with Mendelsohn [26] that sonication effects the inter- chain interaction, which we interpret as a significant decrease in lateral chain packing order.
269
SLATERAL
HEXADECANE, SOLID --
S TRANS
DPPC, SOLID
.8
DPPC, SOLID ---
.6
.4 DPPC, DISPERSION, 30eC
DPPC, VESICLES, 30°C ~ .~ DMPC, DISPERSION
EGG PC DISPERSION AND VESICLES =-~ DMPC, VESICLES DPPC, CDCX 3
HEXADECANE, LIQUID ~ 0
DPPC, DISPERSION, 300C
-~ DPPC, VESICLES, 30=C
DPPC, DISPERSION T m, 41.5°C
DPPC, VESICLES, Ta= 37%
-, DMPC, DISPERSION, 25=C
,i DMPC, VESICLES, 25=C = DPPC, CHC). 3 --- EGG PC DISPERSION 25°C
AND VESICLES
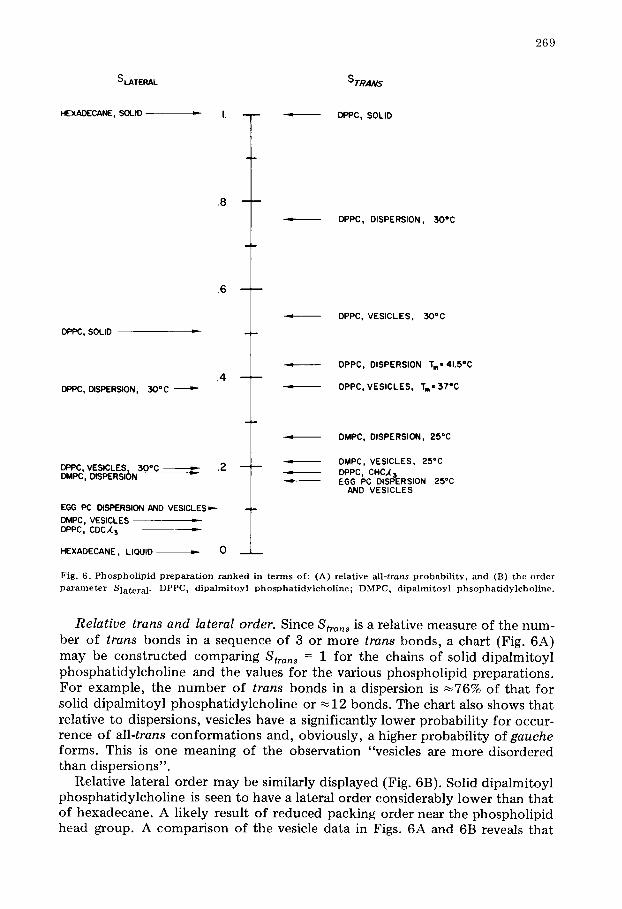
Fig. 6. P h o s p h o l i p i d p r e p a r a t i o n r a n k e d in t e r m s of: (A) re la t ive all-trans p r o b a b i l i t y , a n d (B) the o r d e r p a r a m e t e r S l a t e r a 1. DPPC, d i p a l m i t o y l p h o s p h a t i d y l c h o l i n e ; DMPC, d i p a l m i t o y l p h s o p h a t i d y l c h o l i n e .
Rela t ive trans and lateral order. Since S~ans is a relative measure of the num- ber of trans bonds in a sequence of 3 or more trans bonds, a chart (Fig. 6A) may be constructed comparing St~ans = 1 for the chains of solid dipalmitoyl phosphatidylcholine and the values for the various phospholipid preparations. For example, the number of trans bonds in a dispersion is ~76% of that for solid dipalmitoyl phosphat idylcholine or ~12 bonds. The chart also shows that relative to dispersions, vesicles have a significantly lower probabili ty for occur- rence of all-trans conformat ions and, obviously, a higher probabili ty of gauche forms. This is one meaning of the observation "vesicles are more disordered than dispersions".
Relative lateral order may be similarly displayed (Fig. 6B). Solid dipalmitoyl phosphatidylcholine is seen to have a lateral order considerably lower than that of hexadecane. A likely result of reduced packing order near the phospholipid head group. A comparison of the vesicle data in Figs. 6A and 6B reveals that
270
,25 '" ;¢'~,'-" I a
IOi " ~ o ",o
) ° ~ = .75 o t,
i.-i
• 50 i , ~.~ ,
25~
01:/2z~0 J 310 I __ ~ _ _ l 40
TEMPERATURE °C
• 9 _ -- @0 • • -- •
5 0 6 0
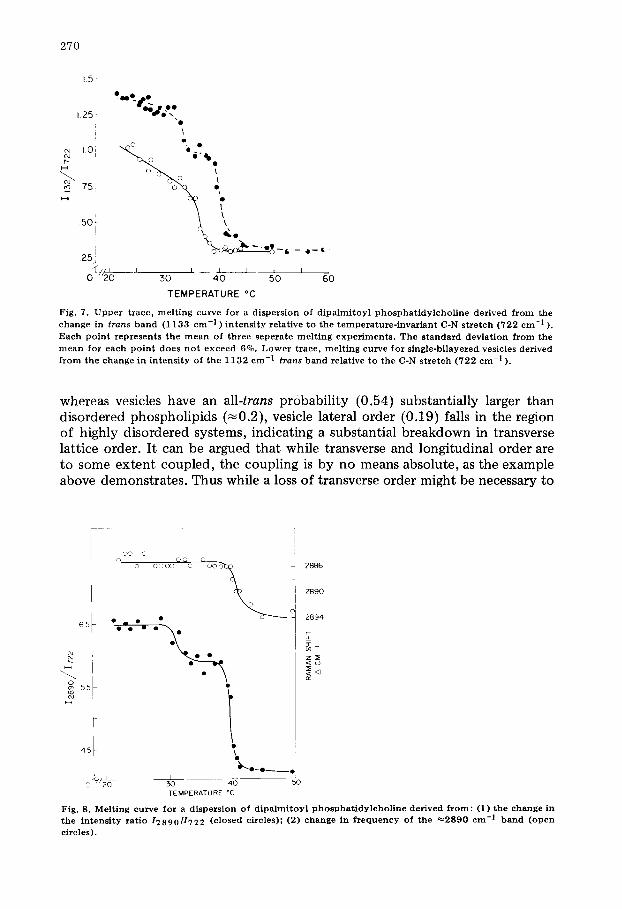
Fig. 7. U p p e r t race , m e l t i n g curve fo r a d i spe r s ion of d i p a l m i t o y l p h o s p h a t i d y l c h o U n e der ived f r o m the change in t rans b a n d (1133 cm -1 ) i n t e n s i t y re la t ive to the t e m p e r a t u r e - i n v a r i a n t C-N s t r e t c h (722 c m -1 ).
Each p o i n t r e p r e s e n t s t he m e a n of th ree sepe ra t e m e l t i n g e x p e r i m e n t s . The s t a n d a r d d e v i a t i o n f r o m the m e a n for each p o i n t does n o t e x c e e d 6%. L o w e r t race , m e l t i n g curve fo r s ing le -b i l ayered vesicles der ived
f r o m the change in i n t e n s i t y of t he 1 1 3 2 c m -1 t rans b a n d re la t ive to t he C-N s t r e t c h (722 c m -1 ).
whereas vesicles have an all-trans probability (0.54) substantially larger than disordered phospholipids (~0.2) , vesicle lateral order (0.19) falls in the region of highly disordered systems, indicating a substantial breakdown in transverse lattice order. It can be argued that while transverse and longitudinal order are to some extent coupled, the coupling is by no means absolute, as the example above demonstrates. Thus while a loss of transverse order might be necessary to
o o
I I
~ g 55 I H ,
r
° o I o ° u • go° O ~ o O
TEMPERATURE °C
i 40 50
2886
2890
2894.
2 <
Fig. 8. Melting curve for a dispersion of dipalmitoyl phosphatidylcholine derived from: (i) the change in
the intensity ratio 12890/1.122 (closed circles); (2) change in frequency of the ~2890 cm -I band (open
circles).
2 7 1
provide the defect space required for an increase in gauche rotations, the actual gauche probabili ty is likely to be thermodynamically controlled.
Melting behavior of phospholipid dispersions. Further evidence for confor- mational differences between dispersions and vesicles comes from the behavior of their respective Raman spectra with temperature. The Raman-derived melt- ing data shown here represents the highest resolution (I°C intervals) reported to date and provide melting curves containing considerable detail.
Dispersions of dipalmitoyl phosphatidylcholine, examined in the skeletal optical mode region (Fig. 7, upper trace) show two melting phenomena: the well-documented main melting transition at 41.5°C and a pre-melting event at 34.2 ° C. These values are in excellent agreement with the calorimetric and fluo- rimetric measurements of Suurkuusk et al. (ref. 1, Table I). Approximately 75% of the total change in trans band intensity is accounted for by the main melt; 25% by the premelt.
The pre-melting event is also seen in the C-H2 stretch data, Fig. 8. Note that whereas the intensity ratio changes at 33 and 41°C, the Raman shift inflects sharply in frequency only at the temperature of the main phase transition. Thus the pre-melt and main transition are distinct molecular events. The pre- melting transition is characterized by a decrease in S l a t e r a 1 without the onset of pronounced rotamer broadening. Neart 34°C the lattice must expand some- what, but does not go over to the almost liquid-like state typical of the liquid crystal. Since a frequency shift in the 2890 cm -1 band is observed only with the main melt, this liquid-like state is clearly only associated with the higher temperature transition. The distinguishing characteristic of the pre-melt is the abrupt and complete loss of lateral chain interaction. Vesicles, as will be shown below, do not display a pre-melting transition since the lateral interaction, even at 20 ° C, is essentially zero.
In the pre-melt region intrachain order decreases by about 20%. In terms of Stra,s this roughly corresponds to a loss of ~2 trans bonds. While it has been suggested that the pre-melting transition is related somehow to the packing of the choline head group [28,29] no such effect is evident in the Raman spec- trum. Similarly, neither 31p nor 2D magnetic resonance indicates involvement of the head group [30]. Thus the pre-transition may be visualized as a highly cooperative event in which a decrease in overall lateral packing order is accom- panied by a small change in chain order.
Melting behavior of vesicles. Vesicles of dipalmitoyl phosphatidylcholine
T A B L E I
T R A N S I T I O N T E M P E R A T U R E S F O R D I S P E R S I O N S A N D V E S I C L E S O F D I P A L M I T O Y L P H O S P H A - T I D Y L C H O L I N E
R a I n a n C a l o r i m e t r y * F l u o r e s c e n c e * (°C) (°C) (°C)
Dispersion P r e - t r a n s i t i o n 3 4 . 2 3 5 . 4 2 5 . 2 - - 3 3 . 9 M a i n t r a n s i t i o n 4 1 . 5 4 1 . 2 4 1 . 1
V e s i c l e s 37 3 7 37
• D a t a f r o m r e f . 1.
2 7 2
651 - ~ \ I
55~ 'i I
i eo cu : ': t-- 4 5 [ :~, H
1) .o " \ _ _
2
3 5 -
zs p
~vf ] l L [ ~L 0 20 50 4 0 50
T E M P E R A T U R E ° C
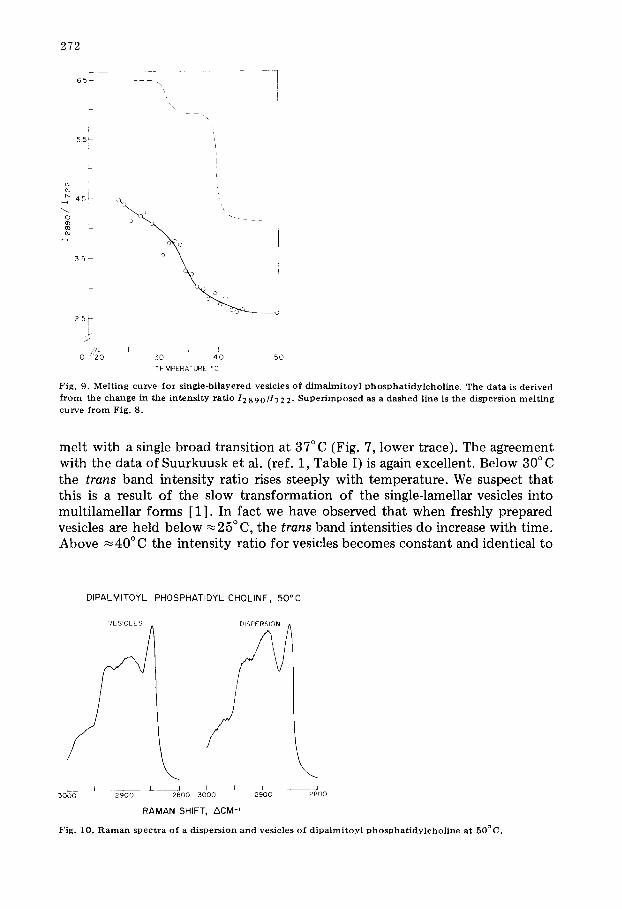
Fig. 9. M e l t i n g c u r v e for s i n g l e - b i l a y e r e d v e s i c l e s o f d i m a l m i t o y l p h o s p h a t i d y l c h o l i n e . T h e d a t a is d e r i v e d
f r o m the c h a n g e in the i n t e n s i t y ra t io 12890/1722. S u p e r i m p o s e d as a d a s h e d l ine is t h e d i s p e r s i o n m e l t i n g c u r v e f r o m Fig. 8.
melt with a single broad transition at 37°C (Fig. 7, lower trace). The agreement with the data of Suurkuusk et al. (ref. 1, Table I) is again excellent. Below 30°C the t rans band intensity ratio rises steeply with temperature. We suspect that this is a result of the slow transformation of the single-lamellar vesicles into multilamellar forms [1] . In fact we have observed that when freshly prepared vesicles are held below ~ 2 5 ° C, the t rans band intensities do increase with time. Above ~ 4 0 ° C the intensity ratio for vesicles becomes constant and identical to
D I P A L M I T O Y L P H O S P H A T I D Y L C H O L I N E , 5 0 ° C
dESICLES
i i . I • _ 3000 2900
\ I 30100 2800 2900 2800
RAMAN SHIFT, ACM-P
Fig. 10. R a m a n s p e c t r a o f a d i s p e r s i o n a n d v e s i c l e s o f d i p a l r n i t o y l p h o s p h a t i d y l c h o l i n e at 50°C.
273
that for dispersions. The trans order parameter, Stra,s = 0.18, has in each case a value similar to egg phosphatidylcholine or dipalmitoyl phosphatidylcholine in chloroform. Therefore at high temperatures the aliphatic chains in both vesicles and dispersions are highly (and comparably) disordered.
At their respective transition temperatures St~a,~ for vesicles (0.38 -+ 0.09) and dispersions (0.43 -+ 0.07) are very nearly the same. On the basis of the Raman data, we estimate, that as a lower limit, ~8 bonds of a palmitoyl chain will be in a trans conformation. This corresponds well with the theoretically determined value of 9.7 bonds [30]. Note that as a consequence of end effects, Raman data may tend to underestimate slightly the actual value.
The vesicle melting curve (Fig. 9) constructed from the CH2 intensity change is similar to that seen in the skeletal optical region. However, at all tempera- tures the curve falls significantly below that for dispersions. Even well above TM the difference persists. This is qualitatively depicted in spectra of a dipalmitoyl phosphatidylcholine dispersions and vesicles at 50°C (Fig. 10). The dispersion retains structure in the 2890 cm -1 band while the vesicles show the broad fea- tureless band characteristic of a liquid-like chain. At 50°C, Sl~te~al = 0.16 for the dispersion and 0.05 for vesicles. Since for dispersions we have determined that the lateral contribution to ICH2 is zero above 40°C we can estimate the contribution of Irot~me~ to the total CH2 intensity for dispersions and vesicles. Thus despite their identical S~a,~, dispersions seem to retain some type of chain order (Irotamer = 0 .25 ) when compared to vesicles (I~otam~ ~0). Though the quantitative significance of I r o t ~ is not fully understood, empirically it seems to relate to the degree of "liquid-likeness" of the chains; i.e. their dynamic state rather than their static or average conformation as reported by Str~,~. If this is true we may speculate that although chains in a vesicle and dispersions have, on the average, the same proportion of trans and gauche forms, in disper- sions the interconversion of these forms is somewhat restricted while in vesicles the isomerization is quite rapid; a model consistent with that proposed by Hor- witz [ 31] on the basis of proton TI measurements. Thus as originally predicted by Seiter and Chan [32], at higher temperatures, the vesicle bilayer may be characterized as essentially liquid-like.
Note added in proof (Received December 22rid, 1976)
In a recent discussion of the motional state of lipid bilayers Petersen and Chan [34], recognize, as we have, the importance of interpreting bilayer dynamics in terms of both chain orientation and chain isomerization. It is ger- mane to our interpretation of the Raman spectra of bilayers to mention the following. To account for NMR linewidth data in sonicated bilayers, Petersen and Chart predict a decrease in the value of Pt by a factor of 2--3, or an increase of 30--40% ih the limiting angle of chain reorientation (or corresponding changes in both parameters). This prediction appears to be confirmed by the data in Fig. 6, wherein it is seen that Stra,s for vesicles (30°C) is 1.5-times smaller than for dispersions and Slatera~ {which may be taken as a measure chain dislocation is significantly decreased in vesicles. We thank Professor Chan for communicating these results to us prior to publication.
274
Acknowledgements
Sincere thanks to Professor J. Seelig for his valuable comments on the manu- script. Our thanks also to Mr. Paul Yager for many thoughtful discussions and to Mr. Nick Calley for expert technical assistance. This work was supported in part by grants from Research Corporation to B.P.G., the National Science Foundation (GB 29709) and the U.S. Public Health Service (GM 15547) to W.L.P.
References
1 Suurkuusk, J., Lentz, B.R., Barenholz, Y., Biltonen, B,L. and Thompson, T,E. (1976) Biochemistry 15, 1393--1401
2 Pangborn, P.C. (1941) J. Biol. Chem. 137, 545--548 3 Sheetz, M.P. and Chan, S.I. (1972) Biochemistry 11, 4573--4581 4 Huang, C. (1969) Biochemistry 8 ,344- -351 5 Lippert, J.L. and Peticolas, W.L. (1971)Proc . Natl. Acad. Sci. U.S. 68, 1572--1576 6 Schaufele, R.G. and Shimanouchi, T. (1967) J. Chem. Phys. 47, 3605--3610 7 Schaufele, R.G. (1968) J. Chem. Phys. 49, 4168--4175 8 Brown, K.G., Peticolas, W.L. and Brown, E. (1973) Biochem. Biophys. Res. Commun. 54, 358--368 9 Tasumi, M., Shimanouchi, T. and Miyazawa, T. (1962) J. Mol. Spectros. 9, 261--287
10 Snyder, R.G. and Schachtschneider, J.H. (1963) Spectrochim. Acta 19, 85--116 11 Snyder, R.G. (1967) J. Chem. Phys. 47, 1316--1360 12 Spiker, R.C. and Levin, I.W. (1975) Biochim. Biophys. Acta 388 ,361- -373 13 Mizushima, S.-I. and Okazaki, H. (1949) J. Am. Chem. Soc. 71 ,411- -412 14 Laxsson, K. and Rand, P. (1973) Biochim. Biophys. Acta 326, 245--255 15 Fawcett , V. and Long, D.A. (1975) J. Raman Specros. 3 ,263- -275 16 Nafie, L.A. (1973) Ph.D. dissertation, University of Oregon 17 Kixshenbaum, I. (1951) Physical Properties and Analysis of Heavy Water, pp. 17--18, McGraw-Hill,
New York 18 Tobin, M. (1955) J. Chem. Phys. 23 ,891- -896 19 Schachtschneider, J.H. and Snyder, R.D. (1963) Spectrochim. Acta 19 ,117- -168 20 Shcppard, N. and Szasz, G.J. (1949) J. Chem. Phys. 17, 86--92 21 Mizushima, S.-I. and Shimanouchi, T. (1949) J. Am. Chem. Soc. 71, 1320--1324 22 Lippert, J.L. and Peticolas, W.L. (1972) Biochim. Biophys. Acta 282, 8--17 23 Marsh, D. (1974) J. Membrane Biol. 18 ,145 - -162 24 Stockton, G.W., Polnaszek, C.F., Tunoch, A.P., Hasan, F. and Smith I.C.P. (1976) Biochemistry 15,
9 5 4 - 9 6 6 25 Gaber, B.P. and Peticolas, W.L. (1976) Biophys. J. 1 6 , 1 9 3 a 26 Mendelsohn, 1~., Sunder, S. and Bernstein, H.J. (1976) Biochim. Biophys. Acta 419, 563--569 27 Andrews, S.B., Hoffman, R.M. and Borison, H. (1975) Biochim. Biophys. Res. Commun. 65, 913--
92O 28 Chapman, D., Williams, R.M. and Ladbrooke, B.D. (1967) Chem. Phys. Lip. 1 ,445- -475 29 Hinz, H.T. and Sturtevant, J.H. (1972) J. Biol. Chem. 247, 6071---6075 30 Schindler, H. and Seelig, J. (1975) Biochemistry 14, 2283--2287 31 Gaily, H.-U., Niederberger, W. and Seelig, J. (1975) Biochemistry 14, 3547--3552 32 Horwitz, A.F., Michaelson, D. and Klein, M.P. (1973) Biochim. Biophys. Acta 69, 590--593 33 Seiter, C.H.A. and Chart. S.I. (1973) J. Am. Chem. Soc. 95, 7541--7553 34 Petersen. and Chan, S.I. (1977) Biochemistry, in the press