Embed Size (px)
Citation preview
1
On the relationship between class structure and social stratification By Kazimierz M. Słomczyński, Krystyna Janicka, Irina Tomescu-Dubrow
ISBN 978-83-64835-12-4
The political and economic dimension of social change The 1988–2013 POLPAN study was conducted during the period of intensive change in the Polish society. When assessing the current condition of social structure in the light of the outcomes of that transformation, it is important to consider a number of factors that finally contributed to the systemic change and its various consequences. In the course of the last twenty five years we have seen a unique series of processes of historical importance for the Polish society. Those were, above all:
the ‘proper’ transformation, initiated with a systemic breakthrough which—in brief—meant that the state and the economy would operate in accordance with different rules,
the exchange of administrative and ruling elites as well as managerial groups in strategic governmental institutions that accompanied the political and economic transformations,
Poland’s accession to the European Union in 2004, preceded by a few years of preparations,
the inclusion of Poland into the network of global financial and economic relations arising from the new geopolitical situation and the spread of new communication technologies.
In view of the importance and the scope of change entailed by the systemic breakthrough, it is quite understandable why transformation has been a dominant issue in sociological research and reflection in the last quarter of a century. Many significant works were written and their common denominator was that they attempted to answer the following question: What kind of Poland do we actually have? Is it one Poland, diversified in many dimensions, or subdivided into relatively dynamic classes and segments of the social structure (growing further and further apart)? Or perhaps the multidimensional conditions forming life opportunities have given rise to two Polands, or maybe we should even talk about ‘multi-Poland’?1
Of crucial importance for the analysis of social structure are the parameters illustrating the direction of the country’s socio-economic evolution. The most important ones of them relate to the rate of building new economic potential under the new system. This potential is
1 The aforementioned problems represent the main fabric of many interesting publications prepared by eminent sociologists. Even the titles of some works direct readers’ attention to the consequences of systemic transition. See, for instance: Jedna Polska? Dawne i nowe zróżnicowania społeczne [One Poland? Old and New Social Differentiations](Kojder 2007); Polska. Ale jaka? [Poland. But What Kind of Poland?] (Jarosz 2005); Polska jedna czy wiele? [Poland: One or Many?] (Domański, Śpiewak, Rychard 2006). Publications which offer a comprehensive picture of social change after the systemic transition also include those with less emphatic titles, such as Wymiary życia społecznego [Dimensions of Social Life] (Marody 2002). An important contribution to what can be termed as the summa sociologica of the Polish transformation comes is made by publications from the most recent conventions of the Polish Sociological Society (PTS) in: Poznań (2004), Zielona Góra (2007), Cracow (2010) and Szczecin (2013).
2
visible in spheres such as the level of national income, the size and quality of labour resources (employment structure, qualifications of personnel), Poland’s position versus European countries in aspects that are important for social and economic growth. Documentation of trends observed in those areas is contained in the overview data provided by the Central Statistical Office of Poland for the period of 1990–2013, in a national and international cross-section.
If we exclude the problem of unemployment, enforced by market-based rationalisation of production and labour market, we can say that the image of Poland emerging from those data as a country ‘which has been through a lot’ is definitely positive.
Of course, this does not mean that there are no visible constraints to growth. They are quite noticeable, especially in comparison with other European Union member states. Those constraints have varied character and manifest themselves mostly through:
a lower population growth,
a lower occupational activity rate,
an unfavourable structure of the economy in terms of employment sectors,
a lower degree of affluence in the households,
a considerable spread of income levels across various population groups.
The material stratification in Poland, which prevails despite favourable trends in the country’s economic situation, creates a plane of tension and social conflicts and gives rise to the question about the condition of social structure and the consequences of individual positions in that structure for people’s individual attitudes and behaviours. Quite obviously, both dimensions—macroeconomic and macrosocial—are closely interrelated and co-create the landscape of systemic transition.
Representative empirical studies on social structure lay the foundation for a diagnosis of the society which ‘has been through a lot’. However, it is the social structure—understood as a system of interrelated, relevant and relatively stable large social groups—that defines the main framework where fundamental social processes occur. One reflection of that change is the pattern of that structure, its dynamics being reflected in the changing network of obstacles and distances in interpersonal relations. Therefore, it is obvious that scholarly inquiry focussing on particularly significant microscopic change in attitudes and behaviour calls for macroscopic analysis.
From the sociological perspective, the class structure as the basis of social inequalities is, and has been the key to analysing the social structure. By social classes we mean groups which control social resources that are important for the functioning of the capital market, the labour market and the consumption market and they control them in various aspects and to a differing extent. The control over means of production and services through ownership, the control of labour processes through managerial and occupational qualifications, as well as the presence of financial resources which can be used to acquire the required goods are important criteria of class subdivisions. If particular forms of markets are underdeveloped—such as the capital market in the communist system—other institutions (including political ones) act as surrogates. In any event, ownership relations, control over labour and dominance over consumption are the ground where social classes evolve, and within this process individuals feel that they are separate entities and can acquire a social and cultural identification.
3
Tensions in social structure
The social structure is a system of categories and groups in the population as well as the institutional framework where they exist. Radical economic and political change in social structure give rise to various tensions. Rapid changes and evolutionary discontinuities may mean that the system of population categories and groups becomes maladapted to the surrounding world, i.e. to the external conditions. With reference to some earlier publications, we use the language of metaphors to describe this condition and speak about ‘cracks in the social structure’ that reflect ‘polarisation processes’.2
In this document we argue in favour of the claim about the importance of social classes. However, we also realise that it contradicts the hypothesis (quite popular in the past) about the ‘death of social classes’, promoted for instance by Jan Pakulski and Malcolm Waters in their book Death of Class (1996). Similar hypotheses, which announce, for instance, the liberation of the individual from class circumstances, can be found in the work by Ulrich Beck The Risk Society (2004).3
In the POLPAN survey we assume that the class structure during the period of the so-called ‘real socialism’ economy differed significantly from the class structure of the fledgling capitalism. The conceptualisation of the class structure in the communist society is based on the assumption that the control of economic life by the party and the state apparatus reduced the importance of the criterion which had been traditionally used to identify social classes, i.e. ownership of means of production. However, the societies of ‘real socialism’ had well-defined structural characteristics, such as the system of nomenclature, which allowed them to exercise command-based control over economic resources. Those societies also had the industrial working class, initially only as a symbol of industrialisation, and later also as a real political force.
Starting from 1989, changes in the social structure manifested themselves not only in transformations of its former elements but also in the emergence of new ones, mostly as a result of democratisation processes and the introduction of market economy. When we analyse the old elements of the class structure, we should realise the enormity of changes which occurred after the collapse of communism. For instance, the peasant class—based on the criterion of land ownership—continues to be the same class. However, the linkage with the free market of agricultural produce means that it has turned into a different class: a class of farmers. New classes include entrepreneurs (business owners who employ workforce) and ‘captains of capitalism’ (managers on the free market). Those are examples of how the system of classes in communism transformed into a class system under capitalism.
2 We would like to invoke the following works here: Polarized social-class structure: On the Matthew effect and
increasing inequality (Słomczyński, Janicka 2008); Changes in class structure in Poland, 1988–2003: Crystallization of the winners-losers’ divide (Słomczyński, Janicka, Shabad, Tomescu-Dubrow 2007); Struktura społeczeństwa polskiego: zmiany w latach 1978–2008 [The structure of the Polish society: Changes in 1978–2008] (Słomczyński, Janicka, Tomescu-Dubrow 2010); Zmiany w strukturze społecznej w wyniku transformacji ustrojowej w Polsce. Historyczno-polityczne tło przemian społecznych [Changes in the social structure as a result of systemic transition in Poland. Historical and political background of social change](Janicka 2010). 3 From the statistical perspective, hypotheses such as the one on the disappearance of social classes are zero hypotheses since they relate to the lack of impact of social class on a variety of phenomena. Supporters of those hypotheses confirm them only when they operationalise social classes in a simplified way, which is not very adequate for the social circumstances they analyse. As a rule, they commit the so-called ‘type II error’, i.e. adopting a zero hypothesis when it is false.
4
The widening gap between the winners of the transformation—primarily entrepreneurs, managers and experts—and those who are relatively unsuccessful, represents a fundamental fissure in the social structure, not only because of its absolute and relative size, but also because of its dysfunctionality. It manifests itself via ‘social withdrawal’ of significant segments of the social structure and, as a consequence, via insufficient adaptation to the changing conditions of the development of the capitalist economy and the democratisation of the political system. The present study offers documentation to support this claim.
An evolutionary perspective on the class structure At POLPAN we assume that the class structure in Poland should be presented dynamically and should reflect the singularities of the social and economic situation of the period concerned. When developing the class pattern for late communism, we invoked the theoretical considerations which were, and still are, present in sociologists’ discussions on the structure of the Polish society before 1989.4
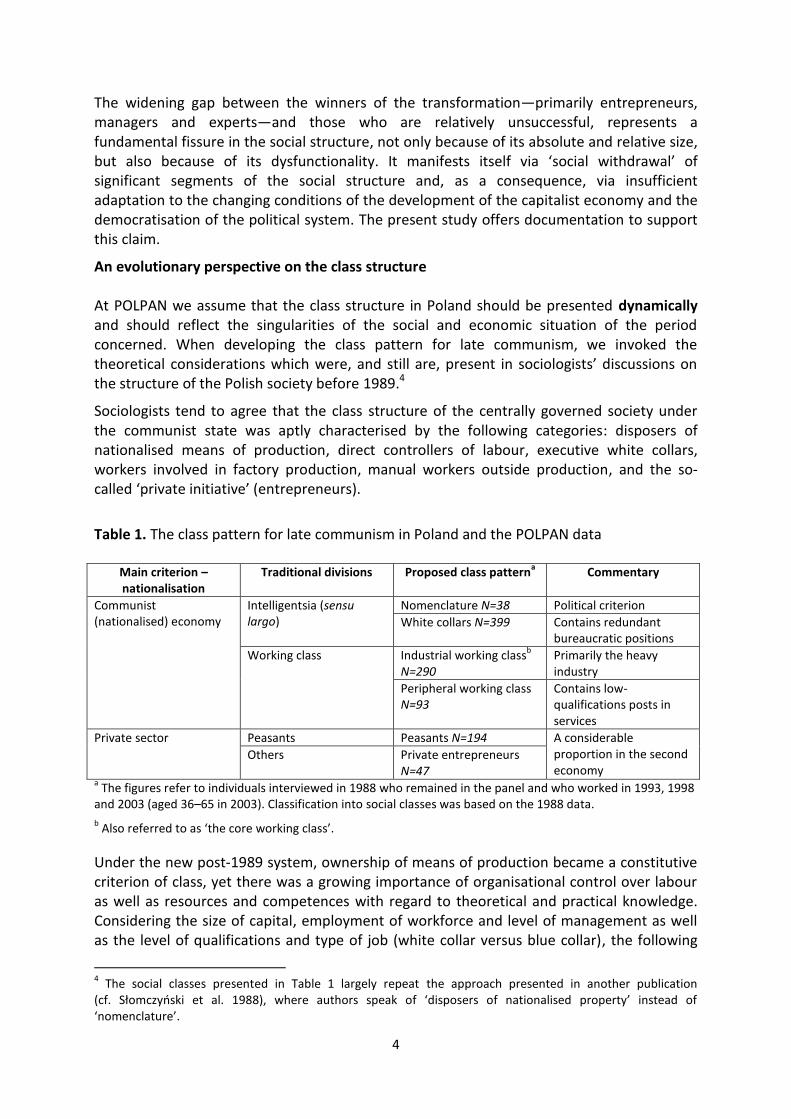
Sociologists tend to agree that the class structure of the centrally governed society under the communist state was aptly characterised by the following categories: disposers of nationalised means of production, direct controllers of labour, executive white collars, workers involved in factory production, manual workers outside production, and the so-called ‘private initiative’ (entrepreneurs).
Table 1. The class pattern for late communism in Poland and the POLPAN data
Main criterion – nationalisation
Traditional divisions Proposed class patterna Commentary
Communist (nationalised) economy
Intelligentsia (sensu largo)
Nomenclature N=38 Political criterion
White collars N=399 Contains redundant bureaucratic positions
Working class Industrial working classb
N=290 Primarily the heavy industry
Peripheral working class N=93
Contains low-qualifications posts in services
Private sector Peasants Peasants N=194 A considerable proportion in the second economy
Others Private entrepreneurs N=47
a The figures refer to individuals interviewed in 1988 who remained in the panel and who worked in 1993, 1998
and 2003 (aged 36–65 in 2003). Classification into social classes was based on the 1988 data.
b Also referred to as ‘the core working class’.
Under the new post-1989 system, ownership of means of production became a constitutive criterion of class, yet there was a growing importance of organisational control over labour as well as resources and competences with regard to theoretical and practical knowledge. Considering the size of capital, employment of workforce and level of management as well as the level of qualifications and type of job (white collar versus blue collar), the following
4 The social classes presented in Table 1 largely repeat the approach presented in another publication
(cf. Słomczyński et al. 1988), where authors speak of ‘disposers of nationalised property’ instead of ‘nomenclature’.
5
categories were identified in the class structure of the post-communist society: entrepreneurs (different from self-employed individuals), executives (those who govern companies enjoying considerable autonomy) and experts (specialists who perform other functions in the new system than in the communist system). Other categories which were identified included technicians and clerical staff as an equivalent of a category which fits the capitalist economy and is termed as ‘semi-professionals’. Workers (regardless of their sector of employment) were presented jointly because the division into production-related and production-unrelated workers dwindled due to departure from central planning. However, the role of qualifications increased, and this is why we have included the subdivision into skilled and unskilled workers.
From the theoretical perspective, it is worth assuming that the role of the same class categories changes over time. With those changes in mind, we use the following pattern of class categories for the period of post-communist transformation and early capitalism:
1. Entrepreneurs include only individuals who have their own business and employ workforce other than their relatives. This category, indeed, emerged in the process of post-communist transformation. In the communist era the relatively few entrepreneurs who employed workforce were classified (together with independent workers) as the so-called ‘private initiative’.
2. Executives are equivalent to senior managerial staff in production facilities and services as well as senior administrative personnel. This category corresponds to the disposers of nationalised property under communism, i.e. until 1989. During the post-communist transformation these were the elites who managed state-owned and private institutions.
3. Experts are a category which includes all those who work in jobs requiring tertiary education. Traditionally, those are the upper layers of intelligentsia. While the role of this class changed during the Velvet Revolution of 1989 and during the evolution of the economic and political system, it has a distinguishing characteristic, namely qualifications.
4. Managers are direct supervisors of work processes. Those are managers of the smallest working teams, usually supervising the work of two to twenty-five people. What distinguishes them from executives is that their power is limited to one sphere only: work processes.
5. Self-employed – those who are sole traders. This group includes owners of workshops who do not employ workforce, apart from their relatives. Under communism, they formed the core of ‘private initiative’ and were a relatively homogeneous group of craftsmen as well as small producers and traders. As a result of post-communist transformation, this group became internally diversified and it also gave rise to the class of entrepreneurs.
6. Executive white collars. The need to put considerable mental effort into work is a criterion which distinguishes executive white collars from manual workers. In this understanding, executive white collars do not include experts, as the latter represent a separate category.
7. Skilled manual workers. Those are primarily factory workers. In communist times they used to be called the ‘avant-garde of working class’ but their role during the post-communist transformation changed radically, particularly in the heavy industry.
6
8. Unskilled manual workers are those who can be trained to perform various work-related activities in a relatively short time, usually no longer than six months. A considerable proportion of this group work in services, doing simple tasks.
9. Farmers. This category is highly varied in terms of qualifications and affluence but they all share the ownership and cultivation of land. In the communist period farmers were largely dependent on the state when it came to buying machinery and other means of production, as well as contracts for their agricultural production. During the post-communist transformation, competition from Western agricultural production became an important problem for Polish farmers.
In our view, the aforementioned conceptualisation of social classes is optimal to analyse the Polish society between 1993 and 2008. Later on, significant changes occurred in the social structure among the broadly defined category of ‘white collars’. Above all, we should identify the category of specialised workers in finance as well as financial and banking dealings, non-governmental organisations, new information technologies and various public services. This is a category of specialists. While the qualification criteria for the category of experts require at least a master’s degree (magister), this category has a criterion of a minimum of a bachelor’s degree (licencjat).
Another category which has been identified are workers of the services sector, sometimes also called ‘manual-and-clerical staff’. This category has been identified not only because of the increasing number of sales personnel in hypermarkets and department stores, people working in hair and beauty parlours, or in the catering and restaurant industry, but also because this sector of the economy is particularly affected by unstable employment.
In recent years differences within the category of workers aggravated: the subdivision into highly skilled workers and the rest has become more clear-cut. We consider this when we identify highly skilled workers and workers performing simple tasks, regardless of their actual professional titles. What counts most in this subdivision are the current requirements as to qualifications. If a job requires training of no more than a few weeks, the person performing such a job will be classified among workers performing simple tasks even though this person may hold a diploma confirming his/her qualifications at the level of a skilled worker.
Social classes as a nominal variable
Considering the multidimensionality of interests and their qualitative differentiation we should assume that social classes are beings (objects) which are, at most, partially structured. For instance, in terms of power, managers are obviously located much higher than clerical workers and technicians but it is difficult to determine their position vis-à-vis entrepreneurs or self-employed individuals. Similar difficulties with the hierarchisation of classes occur when we take other defining criteria on board, such as the nature of work. It is, therefore, safer to view social classes as a nominal variable rather than an ordinal variable.
In order to determine the hierarchisation of social classes, from the ones on top to the ones at the bottom of the social ladder, we need to invoke external criteria: characteristics of the social position. Primarily, this involves access to education (in the form of educational qualifications obtained), the type of work (especially its complexity) and the material situation (for instance, the household income).
7
Formal education, occupational status and actual income are three indicators of individuals’ position in the social structure. In the statistical sense, the facts that individuals belong to social classes (expressed as a nominal variable) and that they have a stratification position (usually expressed as an interval variable) are interrelated. The strength of this relation, however, depends on the place and time, and is affected by long-term trends and occasional fluctuations. The question about the difference between social classes in terms of stratification variables at different stages of social transformations is a valid question in both theoretical and practical terms.
In our attempt to answer this question here, we have considered the the end of the communist system (1988), and then the post-communist transformation, both at its initial stage (1989–1993), and the advanced stage (1994–1998). We also include what we call the ‘pre-integration period’ since it was focused on adapting various conditions in Poland to the EU requirements (1999–2003). Moreover, we identify the EU integration period (2004–2008) and the globalisation period (2009–2013). Some of our analyses were performed on a panel sample with a booster of subsamples of younger people, aged 21 to 30 in 1998 and aged 21 to 25 in 2003 and 2008. The weighted sample of 2013 is representative for the adult population of Poland.
Social classes and essential stratification dimensions
In the POLPAN survey we apply the standard method of expressing the stratification position as a linear combination of formal education, occupational status and earnings. Education is measured with the approximate number of years of schooling based on the assumption that incomplete primary education is treated as five years of schooling, completed primary education as eight years, basic vocational education or incomplete secondary education as ten years, comprehensive secondary or vocational education as twelve years, incomplete tertiary education as fourteen years, and completed tertiary education as seventeen years. Occupational status is measured on the Socio-Economic Scale which associates specific values with each of the essential occupational units in the Social Classification of Occupations.5 Earnings comprise the respondent’s total income (or, for some editions, the household income) in permanent zlotys, converted at the index of real average income and gross monthly earnings.
In measurement models that we developed for 1988–2013, the position in the hierarchy of social stratification is understood as a complex structure where formal education, occupational status and earnings are basic indicators. In the measurement procedure, it is always a good idea to assess the degree of compatibility and incompatibility between the components of the overall stratification position.
The relationship between components which express compatibility corresponds with the first dimension of the factor analysis of formal education, occupational status and earnings. Since the correlations between those variables are positive, the weighting factors must also be positive. In consequence, the relationship between indicators and the identified factor is interpreted unambiguously: the higher the formal education, occupational status and earnings of an individual, the higher his/her overall stratification position. This correlation corresponds with the notion of ‘vertical dimension’ in social stratification.
5 The Social Classification of Occupations and the pertaining occupation scales are discussed in another
publication (cf. Domański, Sawiński, Słomczyński 2007).
8
Empirical data indicate that in 1988, in the late years of the Polish People’s Republic, the correlation between formal education and occupational status was certainly not weak. At that time, the allocation of individuals to occupational positions imitated market mechanisms thanks to the application of top-down instructions on ‘who should work where’. Central planning was supposed to optimise the compatibility of education with qualifications required for various occupational roles. For this reason, the correlation between education and occupational status (r = 0.754) did not deviate from that recorded in Western European countries. In 1988, however, the correlation between education and earnings was low (r = 0.209), much like the correlation between occupational status and earnings (r = 0.210). In consequence, formal education and occupational status explained, in the statistical sense, only approx. 5% of differentiation of earnings.
During the transition period, i.e. in 1993–1998, one may notice slight fluctuation of all correlations between variables determining the position in social stratification. The correlations between education and earnings and between occupational status and earnings were relatively weak at that time (0.211< r < 0.297). The correlation between the number of years of schooling and monthly earnings increased in 1993 but declined again five years later. As regards the correlation between the indicators of occupational status and earnings in 1988–1998, it is not statistically significant. Those results indicate a minor shift of the Polish labour market towards meritocracy during that period. The situation changed, however, in the pre-integration period, i.e. in 1998–2003. The correlation between education and earnings rose significantly at that time (up to r = 0.365), whereas the correlation between the occupational position and earnings remained virtually unchanged (r = 0.220). Likewise, pro-meritocratic trends were maintained in 2004–2008. At that time, as a result of rapid changes on the labour market, the relationship between education and occupational status weakened, with a slight upward trend towards the end of the period. In 2013, the correlations looked as follows:
education to occupational status, r = 0.612
education to earnings, r = 0.363
occupational status to earnings, r = 0.265. Overall, we can say that during the ‘globalisation’ period meritocratic trends remained at the level achieved during the ‘post-integration period’.
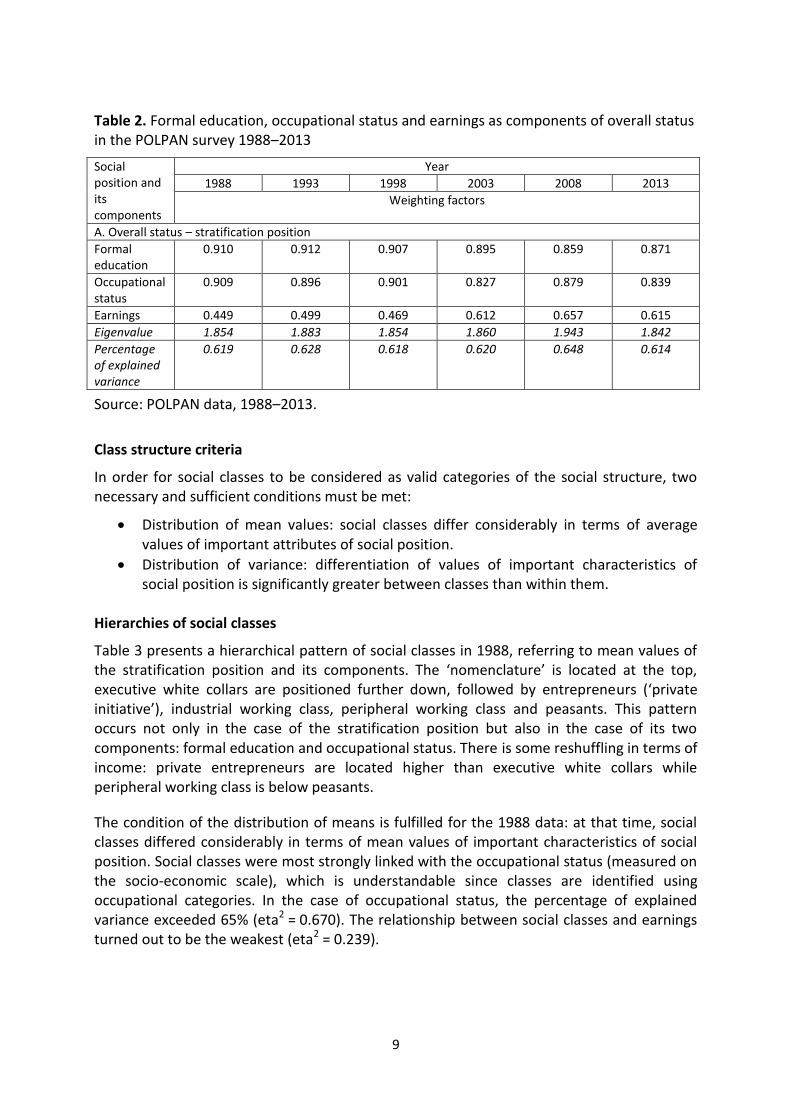
The correlation analysis has its extension in factor analysis, where we identify the factor which corresponds with the stratification position (Table 2). Also in this case we notice that significant changes occurred during the ‘integration period’, i.e. between 1998 and 2003. As regards the overall status (the stratification position), those changes concern primarily the role of earnings. In 1988 the earnings from work represented a slightly lower proportion in that factor (with a factor loading of 0.449) than in 1988–1998 (loadings from 0.449 to 0.499). At the same time, factor loadings for formal education and occupational position went up. A slight decline in the percentage of explained variance indicates, however, that the strength of the relationship between all three variables, i.e. formal education, occupational status and earnings from work, weakened only slightly.
9
Table 2. Formal education, occupational status and earnings as components of overall status in the POLPAN survey 1988–2013
Social position and its components
Year
1988 1993 1998 2003 2008 2013
Weighting factors
A. Overall status – stratification position
Formal education
0.910 0.912 0.907 0.895 0.859 0.871
Occupational status
0.909 0.896 0.901 0.827 0.879 0.839
Earnings 0.449 0.499 0.469 0.612 0.657 0.615
Eigenvalue 1.854 1.883 1.854 1.860 1.943 1.842
Percentage of explained variance
0.619 0.628 0.618 0.620 0.648 0.614
Source: POLPAN data, 1988–2013.
Class structure criteria
In order for social classes to be considered as valid categories of the social structure, two necessary and sufficient conditions must be met:
Distribution of mean values: social classes differ considerably in terms of average values of important attributes of social position.
Distribution of variance: differentiation of values of important characteristics of social position is significantly greater between classes than within them.
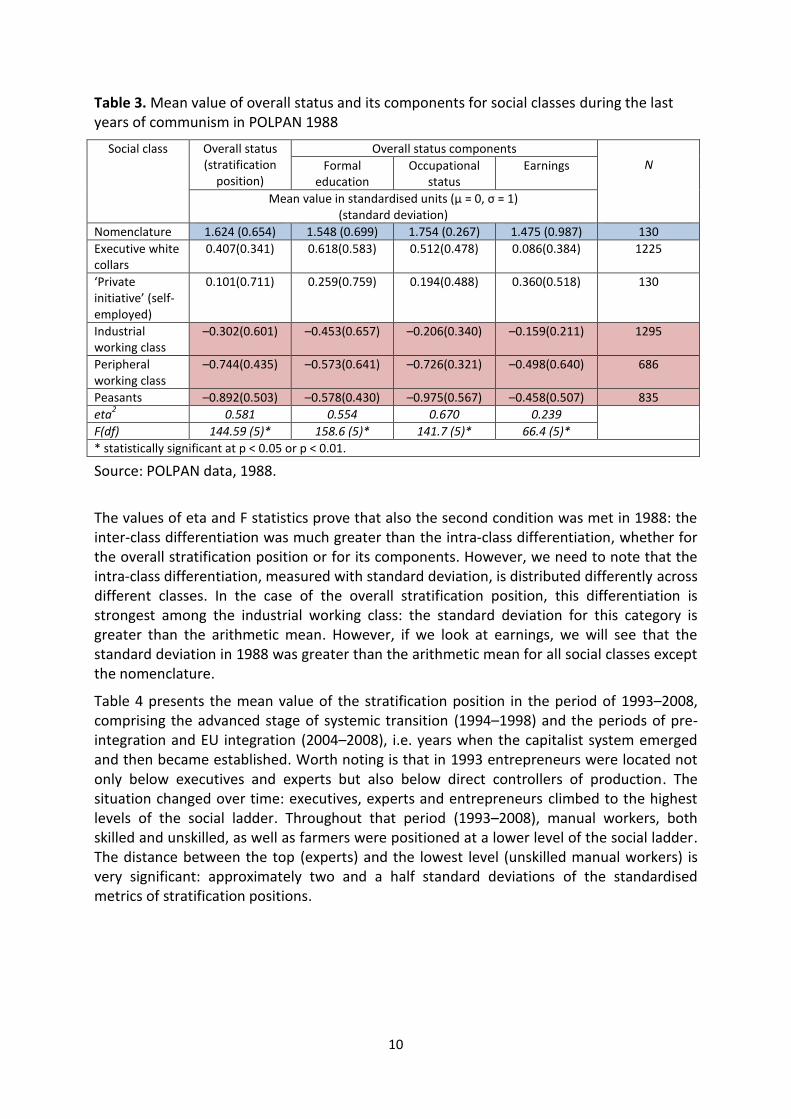
Hierarchies of social classes
Table 3 presents a hierarchical pattern of social classes in 1988, referring to mean values of the stratification position and its components. The ‘nomenclature’ is located at the top, executive white collars are positioned further down, followed by entrepreneurs (‘private initiative’), industrial working class, peripheral working class and peasants. This pattern occurs not only in the case of the stratification position but also in the case of its two components: formal education and occupational status. There is some reshuffling in terms of income: private entrepreneurs are located higher than executive white collars while peripheral working class is below peasants.
The condition of the distribution of means is fulfilled for the 1988 data: at that time, social classes differed considerably in terms of mean values of important characteristics of social position. Social classes were most strongly linked with the occupational status (measured on the socio-economic scale), which is understandable since classes are identified using occupational categories. In the case of occupational status, the percentage of explained variance exceeded 65% (eta2 = 0.670). The relationship between social classes and earnings turned out to be the weakest (eta2 = 0.239).
10
Table 3. Mean value of overall status and its components for social classes during the last years of communism in POLPAN 1988
Social class Overall status (stratification
position)
Overall status components N Formal
education Occupational
status Earnings
Mean value in standardised units (µ = 0, σ = 1) (standard deviation)
Nomenclature 1.624 (0.654) 1.548 (0.699) 1.754 (0.267) 1.475 (0.987) 130
Executive white collars
0.407(0.341) 0.618(0.583) 0.512(0.478) 0.086(0.384) 1225
‘Private initiative’ (self-employed)
0.101(0.711) 0.259(0.759) 0.194(0.488) 0.360(0.518) 130
Industrial working class
–0.302(0.601) –0.453(0.657) –0.206(0.340) –0.159(0.211) 1295
Peripheral working class
–0.744(0.435) –0.573(0.641) –0.726(0.321) –0.498(0.640) 686
Peasants –0.892(0.503) –0.578(0.430) –0.975(0.567) –0.458(0.507) 835
eta2 0.581 0.554 0.670 0.239
F(df) 144.59 (5)* 158.6 (5)* 141.7 (5)* 66.4 (5)*
* statistically significant at p < 0.05 or p < 0.01.
Source: POLPAN data, 1988.
The values of eta and F statistics prove that also the second condition was met in 1988: the inter-class differentiation was much greater than the intra-class differentiation, whether for the overall stratification position or for its components. However, we need to note that the intra-class differentiation, measured with standard deviation, is distributed differently across different classes. In the case of the overall stratification position, this differentiation is strongest among the industrial working class: the standard deviation for this category is greater than the arithmetic mean. However, if we look at earnings, we will see that the standard deviation in 1988 was greater than the arithmetic mean for all social classes except the nomenclature.
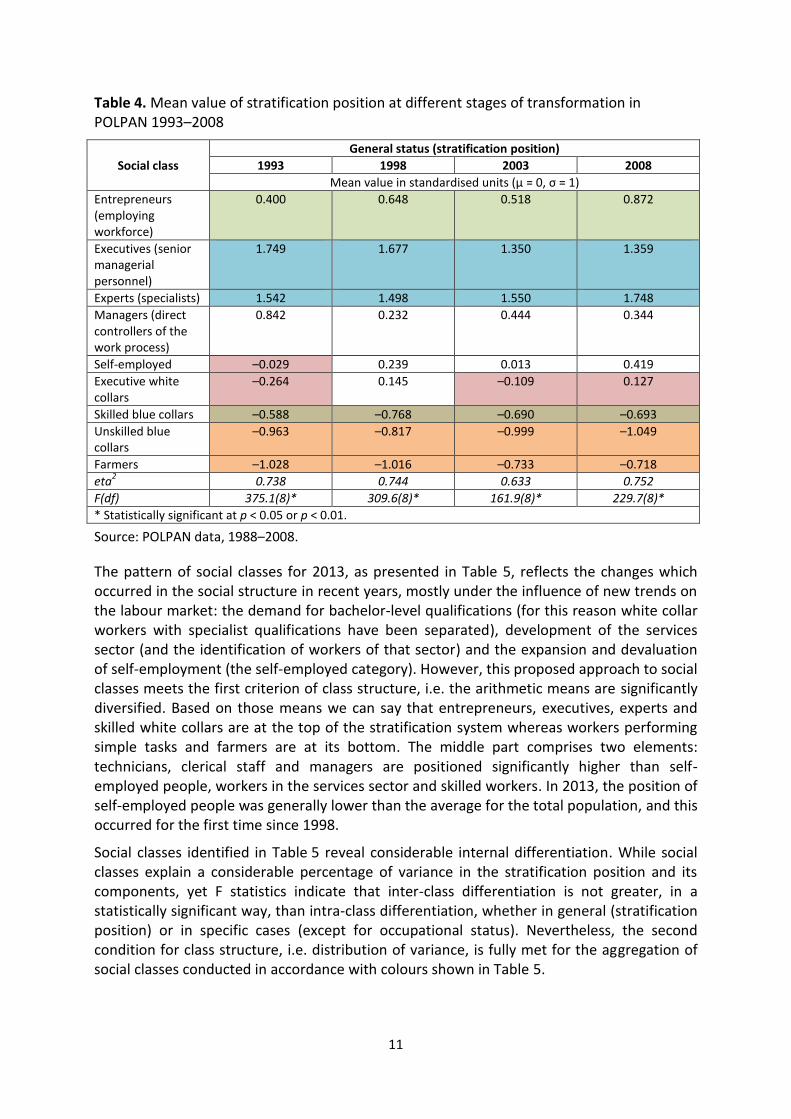
Table 4 presents the mean value of the stratification position in the period of 1993–2008, comprising the advanced stage of systemic transition (1994–1998) and the periods of pre-integration and EU integration (2004–2008), i.e. years when the capitalist system emerged and then became established. Worth noting is that in 1993 entrepreneurs were located not only below executives and experts but also below direct controllers of production. The situation changed over time: executives, experts and entrepreneurs climbed to the highest levels of the social ladder. Throughout that period (1993–2008), manual workers, both skilled and unskilled, as well as farmers were positioned at a lower level of the social ladder. The distance between the top (experts) and the lowest level (unskilled manual workers) is very significant: approximately two and a half standard deviations of the standardised metrics of stratification positions.
11
Table 4. Mean value of stratification position at different stages of transformation in POLPAN 1993–2008
Social class
General status (stratification position)
1993 1998 2003 2008
Mean value in standardised units (µ = 0, σ = 1)
Entrepreneurs (employing workforce)
0.400 0.648 0.518 0.872
Executives (senior managerial personnel)
1.749 1.677 1.350 1.359
Experts (specialists) 1.542 1.498 1.550 1.748
Managers (direct controllers of the work process)
0.842 0.232 0.444 0.344
Self-employed –0.029 0.239 0.013 0.419
Executive white collars
–0.264 0.145 –0.109 0.127
Skilled blue collars –0.588 –0.768 –0.690 –0.693
Unskilled blue collars
–0.963 –0.817 –0.999 –1.049
Farmers –1.028 –1.016 –0.733 –0.718
eta2 0.738 0.744 0.633 0.752
F(df) 375.1(8)* 309.6(8)* 161.9(8)* 229.7(8)*
* Statistically significant at p < 0.05 or p < 0.01. Source: POLPAN data, 1988–2008.
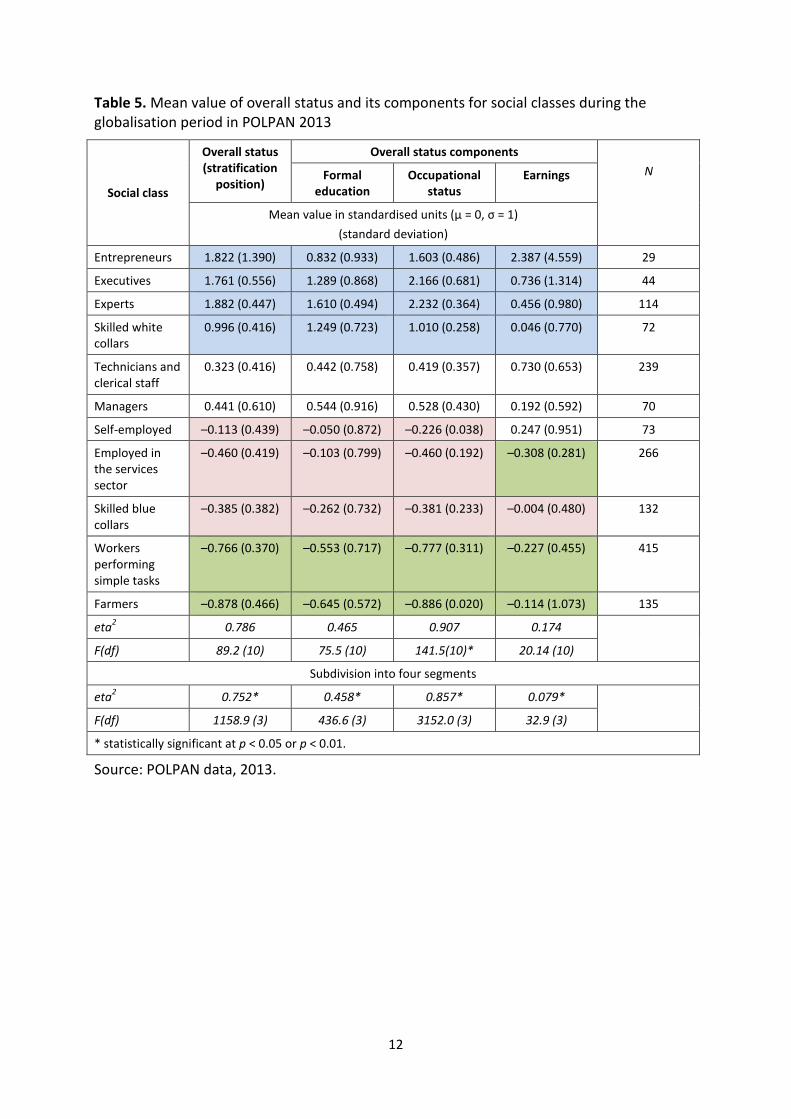
The pattern of social classes for 2013, as presented in Table 5, reflects the changes which occurred in the social structure in recent years, mostly under the influence of new trends on the labour market: the demand for bachelor-level qualifications (for this reason white collar workers with specialist qualifications have been separated), development of the services sector (and the identification of workers of that sector) and the expansion and devaluation of self-employment (the self-employed category). However, this proposed approach to social classes meets the first criterion of class structure, i.e. the arithmetic means are significantly diversified. Based on those means we can say that entrepreneurs, executives, experts and skilled white collars are at the top of the stratification system whereas workers performing simple tasks and farmers are at its bottom. The middle part comprises two elements: technicians, clerical staff and managers are positioned significantly higher than self-employed people, workers in the services sector and skilled workers. In 2013, the position of self-employed people was generally lower than the average for the total population, and this occurred for the first time since 1998.
Social classes identified in Table 5 reveal considerable internal differentiation. While social classes explain a considerable percentage of variance in the stratification position and its components, yet F statistics indicate that inter-class differentiation is not greater, in a statistically significant way, than intra-class differentiation, whether in general (stratification position) or in specific cases (except for occupational status). Nevertheless, the second condition for class structure, i.e. distribution of variance, is fully met for the aggregation of social classes conducted in accordance with colours shown in Table 5.
12
Table 5. Mean value of overall status and its components for social classes during the globalisation period in POLPAN 2013
Social class
Overall status (stratification
position)
Overall status components
N Formal education
Occupational status
Earnings
Mean value in standardised units (µ = 0, σ = 1)
(standard deviation)
Entrepreneurs 1.822 (1.390) 0.832 (0.933) 1.603 (0.486) 2.387 (4.559) 29
Executives 1.761 (0.556) 1.289 (0.868) 2.166 (0.681) 0.736 (1.314) 44
Experts 1.882 (0.447) 1.610 (0.494) 2.232 (0.364) 0.456 (0.980) 114
Skilled white collars
0.996 (0.416) 1.249 (0.723) 1.010 (0.258) 0.046 (0.770) 72
Technicians and clerical staff
0.323 (0.416) 0.442 (0.758) 0.419 (0.357) 0.730 (0.653) 239
Managers 0.441 (0.610) 0.544 (0.916) 0.528 (0.430) 0.192 (0.592) 70
Self-employed –0.113 (0.439) –0.050 (0.872) –0.226 (0.038) 0.247 (0.951) 73
Employed in the services sector
–0.460 (0.419) –0.103 (0.799) –0.460 (0.192) –0.308 (0.281) 266
Skilled blue collars
–0.385 (0.382) –0.262 (0.732) –0.381 (0.233) –0.004 (0.480) 132
Workers performing simple tasks
–0.766 (0.370) –0.553 (0.717) –0.777 (0.311) –0.227 (0.455) 415
Farmers –0.878 (0.466) –0.645 (0.572) –0.886 (0.020) –0.114 (1.073) 135
eta2 0.786 0.465 0.907 0.174
F(df) 89.2 (10) 75.5 (10) 141.5(10)* 20.14 (10)
Subdivision into four segments
eta2 0.752* 0.458* 0.857* 0.079*
F(df) 1158.9 (3) 436.6 (3) 3152.0 (3) 32.9 (3)
* statistically significant at p < 0.05 or p < 0.01.
Source: POLPAN data, 2013.
13
Table 6. Social classes and pro-market attitudes in POLPAN 2013 Social class
Pro-market attitudes (opposite to state interventionism)
Aggregate index
(standardised values)**
N A Privatisation of state property has gone too
far - disagree*
B The state
should ensure a job to anyone who wants to
work – disagree*
C Prices on
essential food products should
be controlled by the
government – disagree*
Percentage of responses (%)
Entrepreneurs 35.7 37.9 48.2 1.105 29
Executives 27.3 31.8 52.3 0.818 44
Experts 32.7 27.2 46.8 0.876 114
Skilled white collars
26.5 15.3 21.4 0.199 72
Technicians and clerical staff
13.6 12.6 30.9 0.099 239
Managers 19.7 14.3 28.3 0.242 70
Self-employed 19.4 19.5 37.0 0.368 73
Employed in the services sector
13.3 3.4 30.0 0.026 266
Skilled blue collars
11.6 2.3 30.3 –0.087 132
Workers performing simple tasks
9.2 5.8 25.3 –0.212 415
Farmers 2.7 5.3 12.2 –0.505 135
* Strongly disagree and tend to disagree ** Weighting factors for five-point scales corresponding to questions A, B, C = 0.561, 0.573, 0.510. Eigenvalue: 1.644. Percentage of explained variance: 54.8%.
Source: POLPAN data, 2013.
Social classes and adaptation to market economy
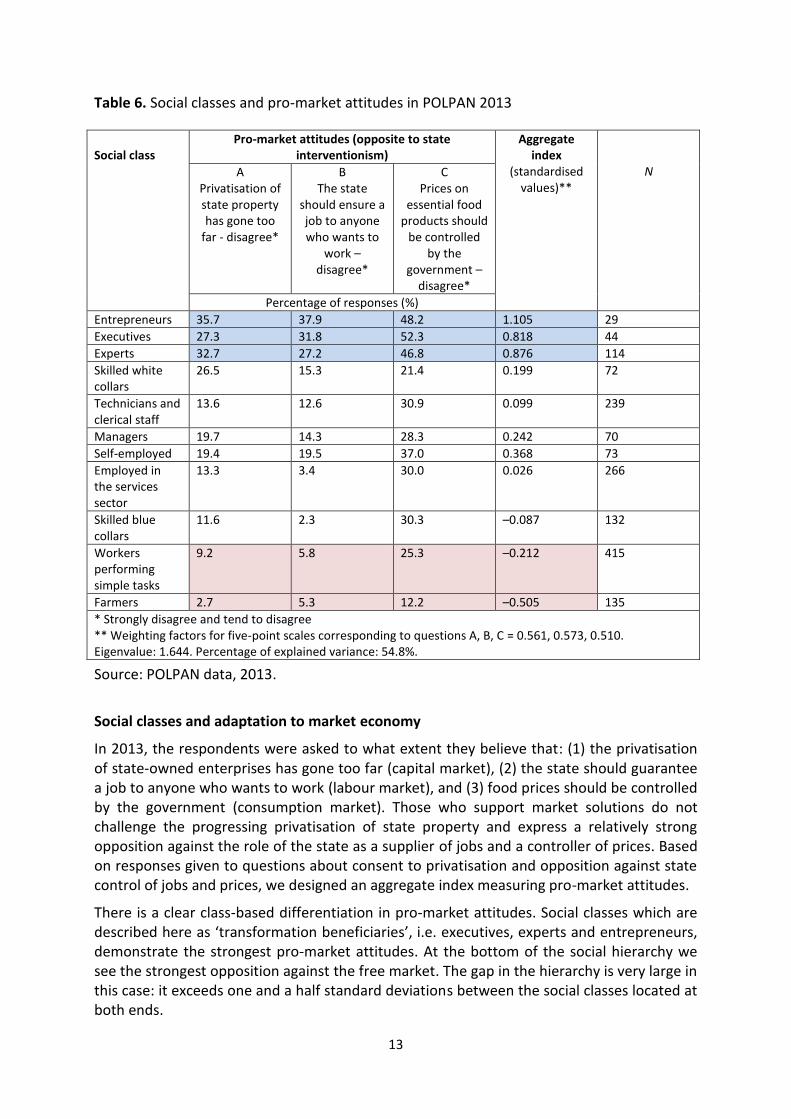
In 2013, the respondents were asked to what extent they believe that: (1) the privatisation of state-owned enterprises has gone too far (capital market), (2) the state should guarantee a job to anyone who wants to work (labour market), and (3) food prices should be controlled by the government (consumption market). Those who support market solutions do not challenge the progressing privatisation of state property and express a relatively strong opposition against the role of the state as a supplier of jobs and a controller of prices. Based on responses given to questions about consent to privatisation and opposition against state control of jobs and prices, we designed an aggregate index measuring pro-market attitudes.
There is a clear class-based differentiation in pro-market attitudes. Social classes which are described here as ‘transformation beneficiaries’, i.e. executives, experts and entrepreneurs, demonstrate the strongest pro-market attitudes. At the bottom of the social hierarchy we see the strongest opposition against the free market. The gap in the hierarchy is very large in this case: it exceeds one and a half standard deviations between the social classes located at both ends.
14
Summary
The criticism of the notion of social class and of its use in the analysis of modern societies dates back to mid-20th century. In 1998, David B. Grusky and Jesper B. Sorensen wrote: ‘the present round of anticlass rhetoric is unprecedented in its popularity, especially in Europe, where class analysis has historically enjoyed a privileged position’ (Grusky, Sorensen 1998, p. 1188). The anticlass rhetoric has expanded onto Central Europe. The data presented in this document convincingly show that this rhetoric is deprived of empirical foundations.
When we analyse the essential dimensions of social stratification, such as formal education, occupational status and earnings, we find out that class differences are considerable and do not justify the anticlass rhetoric. If we consider the vertical dimension of social stratification, it clearly shows that social classes cannot be reduced to a simple hierarchical pattern. The relations between social classes are complex and change over time. We have presented, therefore, various class patterns designed in a way that the first one of them corresponds to the main characteristics of the communist system, the second one reflects the main characteristics of the system during the post-communist transformation, and the third one – the situation in 2013. We have demonstrated that during the post-communist period entrepreneurs, executives and experts enjoy the highest level of material welfare and control of various resources, whereas groups such as managers, self-employed and technicians (clerical staff) are in the middle part of the hierarchy, with skilled and unskilled manual workers being positioned at the very bottom.
Incidentally, class differences manifest themselves not only via objective measures of social position such as formal education, occupational status and earnings. They also come to the surface in the psychological dimension. Not surprisingly, those who are located at the top of the social hierarchy and who fare well in the market system largely support that system. In contrast, those who are less successful oppose the free market.
Tension in the social structure—with the class structure being its emanation—may arise because some social groups are more successful than others in adapting to the changing circumstances. Using a metaphor, we can say that significant differences between classes in terms of their views on the functioning of essential capitalist institutions are a token of fissures in the social structure. Since the cracks run along one line of division, we can talk about a cracked structure of the Polish society. Therefore, we support the claim formulated a few years ago as empirical data continue to confirm it.
As regards the cross-national comparative perspective, it is obvious that the class structure of the Polish society has undergone a thorough modernisation in the sense that its pattern has come close to that prevailing in Western Europe. However, the rate at which social inequalities grow and inter-class distances expand brings the class structure of the Polish society closer, in many respects, to that observed in less advanced countries. The claim about the social structure cracked as a result of polarisation could be applied there as well, the difference being that the inter-class distances in Poland are not embedded in ethnic conflicts.
15
Bibliography
Beck U. (2004), Risk Society: Towards a New Modernity, translated into Polish by B. Baran, Wydawnictwo Naukowe ‘Scholar’, Warsaw.
Domański H., Sawiński Z., Słomczyński K.M. (2007), Nowa klasyfikacja i skale zawodów [A New Classification and Scales of Occupations], Wydawnictwo Instytutu Filozofii i Socjologii Polskiej Akademii Nauk, Warsaw.
Domański H., Śpiewak P., Rychard A. [ed.] (2006), Polska jedna czy wiele? [Poland: One or many?], Wydawnictwo ‘Trio’, Warsaw.
Grusky D.B., Sorensen J.B. (1998), Can class analysis be salvaged? American Journal of Sociology, Vol. 103, pp. 1187–1234.
Janicka K. (2010), Zmiany w strukturze społecznej w wyniku transformacji ustrojowej w Polsce. Historyczno-polityczne tło przemian społecznych [Changes in the social structure as a result of systemic transition in Poland. Historical and political background of social change], Rocznik Lubuski , Vol. 36, No. 2, pp. 33–51.
Jarosz M. [ed.] (2005), Polska. Ale jaka? [Poland. But What Kind of Poland?], Wydawnictwo Instytutu Studiów Politycznych Polskiej Akademii Nauk, Warsaw.
Kojder A. [ed.] (2007), Jedna Polska? Dawne i nowe zróżnicowania społeczne [One Poland? Old and New Social Differentiations], Wydawnictwo WAM, Warsaw.
Marody M. [ed.] (2002), Wymiary życia społecznego [Dimensions of Social Life], Wydawnictwo Naukowe ‘Scholar’, Warsaw.
Pakulski J., Waters M. (1996), Death of Class, SAGE Publications Ltd., London. Słomczyński K.M., Kohn M.L., Janicka K., Koralewicz J., Miller J., Schoenbach C., Schoenberg
R., Zawadzka A. (1988), Sytuacja pracy i jej psychologiczne konsekwencje: polsko-amerykanskie analizy porownawcze [The Labour Situation and its Psychological Consequences: Polish-American Comparative Analysis], Ossolineum, Wrocław.
Słomczyński K.M., Janicka K. (2008), Polarized social-class structure: On the Matthew effect and increasing inequality, Polish Sociological Review, No. 164, pp. 341–357.
Słomczyński K.M., Janicka K., Shabad G., Tomescu- Dubrow I. (2007), Changes in class structure in Poland, 1988–2003: Crystallization of the winners-losers’ divide, Polish Sociological Review, No. 157, pp. 45–64.
Słomczyński K.M., Janicka K., Tomescu-Dubrow I. (2010), Struktura społeczeństwa polskiego: zmiany w latach 1978–2008 [The structure of the Polish society: change in 1978–2008], [in:] Modernizacja Polski [Modernisation of Poland], ed. W. Morawski, Wydawnictwa Akademickie i Profesjonalne, Warsaw, pp. 552–583.
The publication has been prepared within the framework of the project
„Polish Panel Survey POLPAN 1988-2013: Social Structure and Mobility”,
financed by the [Polish] National Science Centre
(grant no. 2011/02/A/HS6/00238).
Publisher:
Research Group on Comparative Analysis of Social Inequality,
Institute of Philosophy and Sociology of the Polish Academy of Sciences
Warsaw 2014
***
Publikację przygotowano w ramach projektu
„Polski Survey Panelowy, POLPAN 1988-2013: Struktura i Ruchliwość Społeczna”,
finansowanego przez Narodowe Centrum Nauki
(grant nr 2011/02/A/HS6/00238).
Wydawca:
Zespół Porównawczych Analiz Nierówności Społecznych,
Instytut Filozofii i Socjologii Polskiej Akademii Nauk
Warszawa 2014